Page 1
1
Phase stability of lanthanum orthovanadate at high-pressure
D. Errandonea1,†, J. Pellicer-Porres1, D. Martínez-García1, J. Ruiz-Fuertes1,2, A. Friedrich2,††,
W. Morgenroth2, C. Popescu3, P. Rodríguez-Hernández4, A. Muñoz4, M. Bettinelli5
1 Departamento de Física Aplicada-ICMUV, MALTA Consolider Team, Universidad de
Valencia, Edificio de Investigación, C/Dr. Moliner 50, Burjassot, 46100 Valencia, Spain 2 Institut für Geowissenschaften, Goethe-Universität Frankfurt, Altenhöferallee 1, 60438
Frankfurt am Main, Germany 3CELLS-ALBA Synchrotron Light Facility, 08290 Cerdanyola, Barcelona, Spain
4Departamento de Física, Instituto de Materiales y Nanotecnología, MALTA Consolider Team,
Universidad de La Laguna, 38205 La Laguna, Tenerife, Spain 5Laboratory of Solid State Chemistry, DB and INSTM, Università di Verona, Strada Le Grazie
15, 37134, Verona, Italy
Abstract: When monoclinic monazite-type LaVO4 (space group P21/n) is squeezed up
to ∼12 GPa at room temperature, a phase transition to another monoclinic phase has
been found. The structure of the high-pressure phase of LaVO4 is indexed with the same
space group (P21/n), but with a larger unit-cell in which the number of atoms is
doubled. The transition leads to an 8% increase in the density of LaVO4. The occurrence
of such a transition has been determined by x-ray diffraction, Raman spectroscopy, and
ab initio calculations. The combination of the three techniques allows us to also
characterize accurately the pressure evolution of unit-cell parameters and the Raman
(and IR)-active phonons of the low- and high-pressure phase. In particular, room-
temperature equations of state have been determined. The changes driven by pressure in
the crystal structure induce sharp modifications in the color of LaVO4 crystals,
suggesting that behind the monoclinic-to-monoclinic transition there are important
changes of the electronic properties of LaVO4.
† Corresponding author, email: [email protected] †† Present address: Institut für Anorganische Chemie, Julius-Maximilians-Universität Würzburg,
Am Hubland, 97074 Würzburg, Germany
Page 2
2
I. Introduction
Rare-earth orthovanadates are important materials for existing and future
technologies. Recently, they have attracted considerable attention because of their
potential application in alternative green technologies [1]. Orthovanadates are also
suitable candidates for laser-host materials [2]. On top of that, they exhibit properties
like luminescence, chemical stability, and non-toxicity, which make them, as
nanoparticles, promising materials for biomedical applications as controlled drug
delivery into the human body [3]. LaVO4 is one of the members of this family of
compounds. Typically, it adopts the monazite-type structure (space group P21/n, Z = 4)
shown in Fig. 1 [4]. However, it can also be obtained by the hydrothermal method in the
tetragonal zircon-type structure (space group I41/amd, Z = 4) as a metastable phase at
ambient conditions [5].
The study of rare-earth orthovanadates under compression has become the subject
of a large interest in the last decade [5 - 28]. Several pressure-induced structural
transitions have been discovered, which have consequences on the physical properties
of orthovanadates. These consequences include an electronic band-gap collapse [14]
and pressure-induced metallization [10]. Among orthovanadates, one of the compounds
whose properties have been less explored under compression is LaVO4. Three high-
pressure (HP) powder x-ray diffraction (XRD) experiments have been reported in the
literature. These experiments were performed using either a 16:3:1 methanol–ethanol–
water mixture or a 4:1 methanol-ethanol mixture as pressure-transmitting medium
(PTM). In one of them the compressibility of the monazite structure has been explored
up to 8 GPa [18]. In the other, pressure was extended up to 12 GPa [9], and possible
evidences of an isosymmetric structural phase transition at 8.6 GPa were described. In
the third experiment, zircon-type LaVO4 was found to transform to monazite-type
LaVO4 at 5 GPa [5]. A post-monazite phase appeared at 12.9 GPa; however, the quality
Page 3
3
of the XRD patterns obtained under non-hydrostatic conditions did not allow the
identification of the crystal structure of the HP phase. Raman spectroscopy
measurements have been carried out at ambient conditions for monazite-type LaVO4
[29 – 32]. High-pressure Raman measurements have been recently carried out for
zircon-type and monazite-type LaVO4 using a non-hydrostatic PTM (silicone oil) up to
18 GPa [5, 25]. In monazite-type LaVO4 approximately half of the Raman-active modes
have been measured, and only some of them have been measured under compression
[25]. Additionally, there are many issues on the mode assignment that need to be
clarified yet. On top of that, some contradictions can be found among the different
experiments. Regarding theoretical studies, only the physical properties of LaVO4 at
ambient pressure and the effect of pressure on the unit-cell parameters up to 8 GPa have
been studied by means of ab initio calculations [18, 33].
The combination of XRD, Raman spectroscopy, and ab initio calculations have
been shown to be a powerful tool to study the HP behavior of orthovanadates and
related oxides [34, 35]. Here we combine the three techniques to study LaVO4 up to 22
GPa. All our experiments were carried out under quasi-hydrostatic conditions. We
report the occurrence of the onset of a phase transition at 12 GPa, coexisting the low-
and high-pressure phases up to 15.5 GPa. The HP phase remains stable up to 22 GPa. A
crystal structure is proposed for the HP phase and the effect of pressure on the
vibrational and structural properties of the two phases is discussed. The reported results
will contribute to the better understanding of the HP behavior of orthovanadates and
related AXO4 ternary oxides.
II. Experimental Details
LaVO4 crystals were prepared by the flux growth method using Pb2V2O7 as the
solvent. Pure La2O3, V2O5, PbO and Na2B4O7 were used as starting materials (99.99 %
Aldrich). The composition of the growth mixtures was (in molar percent ratio):
Page 4
4
La2O3:V2O5:PbO:Na2B4O7 = 2.3:31.5:62.9:3.3. After careful mixing the starting
mixtures were put in Pt crucibles and heated to 1270 °C in a horizontal programmable
furnace. They were maintained at this temperature for 12 h (soaking time), then cooled
to 800 °C at a rate of 1.8 °C/h and finally to room temperature at a rate of 15 °C/min.
Transparent crystals in the form of platelets having an average size 0.5 × 2 × 2 mm3
were separated from the flux by dissolving it in hot diluted HNO3.The obtained crystals
were confirmed to have a monazite-type structure by powder XRD (PXRD)
measurements. Neither minority phases nor impurities were detected in the crystals. The
lattice parameters are a = 7.021(2) Å, b = 7.242(2) Å, c = 6.704(2) Å, and β =
104.875(5)º, which are in good agreement with the literature [4, 9, 18]. Single-crystal
XRD (SXRD) measurements were also used to determine the orientation of the crystals.
These SXRD measurements were carried out using a Nonius Kappa CCD
diffractometer, employing Mo Kα (λ = 0.71073 Å) radiation.
Ambient pressure and HP Raman experiments were performed with LaVO4 single
crystals. The sample dimensions were 3 x 3 x 0.5 mm3 for the first set of experiments
and 50 x 50 x 10 µm3 for the HP experiments. Raman spectra were excited using a He-
Ne laser (λ = 632.8 nm). The incident power on the sample was 10 mW. The Raman
set-up consists of a confocal microscope, an edge filter, a 1 m focal-length spectrometer
equipped with a 600 groves/mm grating (TRH 1000, JobinYvon), and a thermoelectric-
cooled multichannel CCD detector. The spectral resolution is below 2 cm-1.
Wavenumbers were systematically calibrated in the whole spectral range using the laser
plasma lines. For the polarized Raman spectroscopy experiments at ambient pressure
we used crystals with two different orientations with respect to the incident laser
radiation. In the first orientation the incidence direction was chosen along the b-axis,
which we label y. The principal axis perpendicular to the b-axis was optically
determined placing the sample between two crossed linear polarizers. The polarization
Page 5
5
labeled z corresponds to the sample orientation which did not rotate the polarization of
the He-Ne laser. The polarization denoted by x is perpendicular to y and z. In the second
orientation the incidence was along the [ 101� ] direction (labelled x′). Now the
polarization was set either parallel to b (y) or in the perpendicular direction z′.
Under compression, two independent sets of non-polarized Raman measurements
were performed up to 20.8 GPa using the same Raman set up as for the ambient
pressure measurements. In one set of experiments the LaVO4 crystal was loaded inside a
membrane diamond-anvil cell (DAC) equipped with 350 µm diamond culets. 16:3:1
methanol−ethanol−water was used as PTM and the pressure chamber was a 100 µm
hole drilled in a pre-indented (40 µm) Inconel gasket. The second set of experiments
was performed using a Boehler-Almax DAC equipped with 350 µm diamond culets. In
this case, we employed a powder sample and Ne as PTM and a tungsten gasket with a
100 µm hole (30 µm thickness).
HP SXRD and PXRD experiments were carried out using the Boehler-Almax
DAC employed for Raman experiments. For SXRD, LaVO4 crystals were loaded
together with a ruby chip and Ne as PTM in 120 µm-diameter holes drilled in a tungsten
gasket pre-indented to a thickness of 40 µm. The same procedure was used in the DAC
preparation for PXRD measurements. For these experiments, we loaded in the DAC a
pellet made from a finely ground powder obtained from single crystals of LaVO4.
SXRD experiments were performed at 3.9 and 11.5 GPa in the low-pressure
phase. They were carried out at the Extreme Conditions Beam-line P02.2 at PETRA III.
We used a monochromatic x-ray beam (λ = 0.28968 Å) focused down to 2.4
(horizontal) × 2.1 (vertical) µm2 (FWHM) by a pair of Kirkpatrick-Baez mirrors. The
diffraction images were collected with a Perkin-Elmer XRD 1621 detector located at
399.82 mm from the sample. The measurements were performed using an increment of
Page 6
6
1 º/step in ω using the complete opening angle of the DAC (85º). The image format was
converted according to the procedure described by Rothkirch et al. [36]. The indexing
of the Bragg reflections and the intensity data reduction were done with the CrysAlis
software [37]. The crystal structure was refined with SHELX97-2 [38] with anisotropic
displacement parameters for all the atoms and starting parameters taken from Ref. 4.
PXRD experiments were carried out with the aim of solving the crystal structure
of the HP phase of LaVO4 and to study its HP behavior. Therefore, the starting pressure
was 11.5 GPa, a pressure at which the low-pressure phase was confirmed by single-
crystal experiments. The maximum pressure reached in these experiments was 22 GPa.
PXRD experiments were performed at the MSPD beam-line at ALBA synchrotron
facility [39]. The beam-line is equipped with Kirkpatrick-Baez mirrors to focus the
monochromatic beam to 20 μm × 20 μm and a Rayonix CCD detector with an active
area of 165 mm diameter. We used a wavelength of 0.534 Å, and the sample−detector
distance was set to 280 mm. The two-dimensional diffraction images were integrated
with FIT2D software [40]. Structural analysis was performed with PowderCell [41] and
Fullprof [42]. For Rietveld refinements first the background was fitted with a
Chebyshev polynomial function of first kind with eight coefficients and then subtracted.
In addition, since the occupancy and the atomic displacement factors are correlated and
sensitive to background subtraction, they were constrained to 1 and B = 0.5 Å2, where B
is the overall displacement factor [43]. On top of that, since the number of reflections is
not enough for the reliable refinement of all the atomic coordinates and other structural
parameters, we assumed for the monazite-type phase the atomic positions obtained from
SXRD. For the HP phase the atomic positions of the calculated model structure
obtained from our numerical simulations were used and fixed during the refinement.
In all the HP experiments pressure was determined using the ruby fluorescence
method [44]. In HP PXRD experiments performed at ALBA we confirmed the pressure
Page 7
7
determined with the ruby using the Ne Bragg reflections that can be observed after the
solidification of Ne and the equation of state of Ne [45].
III. Ab initio calculations
Total energy ab initio simulations have been performed within the framework of
density-functional theory (DFT) [46]. We used the Vienna Ab Initio Simulations
Package, VASP [47], to carry out calculations with the pseudopotential method. The
projector augmented wave scheme (PAW) [48] was employed to take into account the
full nodal character of the all-electron charge density distribution in the core region. In
order to obtain accurate converged results a set of plane waves up to a kinetic energy
cutoff of 520 eV was used. The exchange-correlation energy was described in the
generalized-gradient approximation (GGA) with the PBE for solids [49] (PBESol)
prescription. A dense grid of Monkhorst-Pack [50] k-special points was used to perform
integrations in the Brillouin zone (BZ) in order to obtain very well converged results for
the energies and forces. At a selected volume we fully relaxed the structures through the
calculation of the forces on atoms and the stress tensor. In the optimized structures the
forces on the atoms are less than 0.005 eV/Å and deviations of the stress tensor from a
diagonal hydrostatic form are less than 0.1 GPa. It is important to note that from the
simulation we obtain total energy (E) as a function of volume (V), and the
corresponding pressure (P), from which we determined the enthalpy (H). The
thermodynamically stable phase at different pressures is obtained from the P-H curves
of the analyzed candidate crystal structures. This methodology has been applied
successfully to the study of several orthovanadates [8, 12, 14, 15, 18, 22, 27, 51].
Phonon calculations were performed at the zone centre (Γ point) of the Brillouin
zone (BZ). We used the direct method [52] where we need highly converged results on
forces for the calculation of the dynamical matrix. The construction of the dynamical
matrix at the Γ point of the BZ involves separate calculations of the forces in which a
Page 8
8
fixed displacement from the equilibrium configuration of the atoms is considered. The
number of such independent displacements is reduced due to the crystal symmetry.
Diagonalization of the dynamical matrix provides the frequencies of the normal modes.
Moreover, these calculations provide the symmetry and eigenvectors of the vibrational
modes in each structure at the Γ point.
IV. Results and discussion
Single-crystal XRD experiments
Previous PXRD experiments on LaVO4 [5, 9] found that the PXRD patterns can
be assigned to the monazite structure up to 11.6 GPa. However, a discontinuity in the
unit-cell volume was detected at 8.6 GPa [9]. As a possible explanation of this volume
collapse the occurrence of an isomorphic phase transition was proposed. More recent
PXRD experiments reported the transition to a post-monazite phase in LaVO4 nanorods
[5]. However, the crystal structure of this HP phase remains unsolved. SXRD
experiments are more accurate than powder XRD experiments to determine crystal
structures. We performed SXRD at 3.9 and 11.5 GPa to compare the crystal structures
of the two isomorphic phases previously reported [9]. However, our experiments
showed that the crystal structure of LaVO4 remains in the low-pressure monazite-type at
both pressures, contradicting previous PXRD experiments [9]. The lattice parameters
and the atomic positions extracted from the HP SXRD experiments are provided in
Table 1. They are compared with those we obtained from PXRD at ambient pressure
and with calculations. Fig. 2 also shows the unit-cell parameters at different pressures
obtained from both PXRD and SXRD experiments. We found that unit-cell parameters
and atomic coordinates gradually change with pressure. In particular, the unit-cell
parameters determined at 3.9 GPa from SXRD agree very well with those previously
determined from PXRD experiments [9, 18]. The agreement with calculations is also
good between experiments and calculations (Table 1). The unit-cell parameters
Page 9
9
determined at 11.5 GPa agree with our theoretical calculations showing a gradual
change with pressure and not showing the discontinuity previously reported [9]. This
fact suggests that the previously proposed isostructural transition at 8.6 GPa [9] is not of
intrinsic origin but likely originates from stress between grains in the HP PXRD
experiments [53, 54], which in turn underlines the importance of the SXRD
experiments.
Raman spectroscopy at ambient pressure
Ambient-pressure polarized Raman spectra of LaVO4 single crystals are shown
in Fig. 3. According to group theory, monazite-type LaVO4 has 72 vibrational modes.
All the atoms occupy general 4e Wyckoff position. Using the correlation method, the
symmetry decomposition of zone center phonons is then dictated by the factor group
2/m:
Γ = 18 𝐴𝑔 + 18𝐵𝑔 + 18𝐴𝑢 + 18𝐵𝑢
Three modes (Au + 2Bu) correspond to acoustic vibrations. There are 33
infrared-active modes (17Au + 16Bu) and 36 Raman-active modes (18Ag +18Bg). In this
work we consider the unique axis as the b-axis. The Raman tensors are then:
𝐴𝑔 = �𝑏 0 𝑑0 𝑐 0𝑑 0 𝑎
� 𝐵𝑔 = �0 𝑓 0𝑓 0 𝑒0 𝑒 0
�
The Raman spectra corresponding to different backscattering configurations are
plotted in Fig. 3. We have used selection rules to identify the symmetry of modes. In all
the configurations used, except for x'(y,z')x' and x'(z',y)x', Ag are allowed and Bg are
forbidden. In the x'(y,z')x' and x'(z',y)x' scattering geometries, the situation is inversed,
being the Bg modes the only ones which are allowed. In Fig. 3, the Bg modes are
observed in the spectra labelled x'(y,z')x' and x'(z',y)x'. There are traces of the most
intense Ag peaks where we expect only Bg modes. This is evident with the most intense
Ag peak at 859 cm-1. The polarization leakage is related to the focussing objectives used
Page 10
10
in our microscopic system, which establish a propagation direction not exactly parallel
to the optical axis. There are two weak Bg modes in the spectra labelled x′(y,z′)�̅�′and
x′(z′,y)�̅�′, at 440 and 855 cm-1, which are observed as shoulders of more intense Ag
peaks. Finally, the Ag mode at 102 cm-1 is so weak that its identification should be
considered as tentative. All the Raman modes measured here are given in Table 2.
There have been a few works [25, 29 - 32] on the Raman spectra of monazite-
type LaVO4. Good agreement is observed between our data and those of Refs. 29, 31,
and 32. A comparison of our frequencies with those by Jia et al. [29], who reported the
non-polarized Raman spectra of Eu-doped LaVO4 nanocrystals, is shown in Table 2.
Most of the modes given in Ref. 29 correspond to Ag modes. In contrast, the results
reported in Ref. 25 (Table 2) show Raman frequencies that differ up to 10 cm-1 from
those reported by us and other authors [29, 31, 32]. The Raman spectrum of Er-doped
LaVO4 seems to be quite different at all [30]. In particular, in Er-doped LaVO4 the most
intense mode is located at 912 cm-1, clearly higher than in our work (859 cm-1) or in the
rest of the literature (861 cm-1 to 855 cm-1) [29, 31, 32]. This seems to be attributed to
the substitution of La by Er. The highest phonon in tetragonal ErVO4, however, it is
situated at 890 cm-1 [55] well below 900 cm-1. If considering a hypothetical local
formation of ErVO4, the highest frequency phonon in the monoclinic monazite-type
phase is expected at a wavenumber even smaller than that of tetragonal ErVO4, as was
found in PrVO4 [16]. All these points raise doubts about the influence of substitutional
Er in the Raman spectrum of LaVO4.
The strong V-O bond in the VO4-3 tetrahedron has provided the depart point in
the usual classification of the vibrational spectrum of orthovanadates [56]. The normal
modes of the VO4-3 tetrahedron have been measured [57] in an aqueous solution of
Na3VO4. They are ν1(A1) = 870 cm-1, ν2(E) = 345 cm-1, ν3(F2) = 825 cm-1, and ν4(F2) =
480 cm-1. The symbols in parentheses denote the irreducible representations of the Td
Page 11
11
group. In LaVO4 the tetrahedral symmetry is lost and most of the modes display
complex vibration patterns. However, there are some modes which are clearly related to
the tetrahedral symmetry; as shown by our ab initio calculations (Table 2). This is the
case for the most intense Ag mode at 859 cm-1, which is related to the ν1 breathing
mode. On the same line, in the intense Ag mode at 374 cm-1, the opposed O-V-O bonds
in the VO4 tetrahedron bend in phase, as in the ν2 vibrations. Additionally, the 440 cm-1
mode retains the ν4 essence, as the O atoms oscillate along the tetrahedron edges in this
mode. An additional comment to make is that there is not any mode showing a pure ν3
characteristic. There is always a mixing between the ν1 and ν3 features.
The vibrations in LaVO4 can also be classified in terms of stretching modes,
bending modes, and rotational-translational modes of the VO4 tetrahedron. We observe
an isolated group of phonons in the wavelength range from 768 to 862 cm-1 which
correspond to stretching modes. As an example, the ab initio calculations show that the
highest mode corresponds basically to the stretching of the shortest V-O bond. The
bending modes are observed in the 309-440 cm-1 range. A typical example is the above
mentioned Ag mode at 374 cm-1. To end, the rotational-translational lattice modes
display wavenumbers from 64 to 252 cm-1. Here, the most remarkable fact is the clear
increase in the La vibrational amplitude as the wavenumber of the phonon decreases.
Raman spectroscopy at high-pressure
Out of the 36 Raman modes observed in monazite-type LaVO4 when the sample
was loaded in the DAC, only the strongest 17 modes could be followed under
compression. Fig. 4 shows a selection of non-polarized Raman spectra measured during
the upstroke. The spectra measured from ambient pressure up to 11.2 GPa are
qualitatively similar to the Raman spectra measured at ambient conditions. All of them
can be assigned to the monazite-type phase of LaVO4. The pressure evolution of these
modes is represented in Fig. 5. The frequencies (ω) and pressure coefficients (dω/dP) of
Page 12
12
the different modes are summarized in Table 2, where they are compared with our
calculations and with the experimental results obtained under non-hydrostatic
conditions [25]. As expected, calculations show a better agreement with our quasi-
hydrostatic experiments than with previous non-hydrostatic experiments. In the
experiments we have found that most modes harden under compression except for one
of the low-frequency Ag modes which has a negative pressure coefficient. The highest
pressure coefficients are some of the internal modes of the VO4 tetrahedron (see Table
2). In general, the pressure behavior of Raman modes of monazite-type LaVO4 is
qualitatively similar to that of isomorphic PbCrO4 [58] and CePO4 [59]. In particular, in
all of them the internal stretching modes have pressure coefficients of the same order. In
addition, in lead chromate there is also a lattice mode that slightly softens under
compression as found by us in LaVO4. To close this part of the discussion, we would
like to add that not surprisingly the internal modes of the VO4 tetrahedron have similar
frequencies and pressure-coefficients in monazite-type and zircon-type LaVO4 [24].
Changes in the Raman spectrum, including the appearance of additional peaks
are clearly detected at 12.2 GPa, suggesting the onset of a phase transition (Fig. 4). The
main changes are the increase of the number of Raman modes, the small drop in the
wavenumber of the highest frequency mode and the appearance of extra bands from 500
cm-1 to 700 cm-1 (Fig. 5) in the phonon gap of the low-pressure phase. Changes with
pressure are gradual since both phases coexist from 12 GPa to 14.2 GPa, with the HP
phase appearing as a single phase at 15.4 GPa. There is no evidence of a second
pressure-induced phase transition up to 20.8 GPa. Upon decompression the changes are
reversible but a large hysteresis is detected. In particular, the bands of the HP phase can
be observed down to 5 GPa upon decompression. At ambient pressure, the Raman
spectrum of the monazite-type phase is recovered as can be seen in Fig. 4.
Consequently, the observed phase transition is reversible. From our experiments we
Page 13
13
identified 31 Raman phonons of the HP phase and their pressure dependence. Their
frequencies and pressure coefficients are summarized in Table 3. Due to the large
number of modes and their broadening under compression, we are cautious about the
mode assignments and accuracy of the pressure coefficients reported in the table. In
comparison with the low-pressure phase, the pressure coefficients of the high-pressure
phase tend to be larger. In addition, they are all positive in our experiment. In the high-
frequency region there are seven modes, which are the most intense modes and could be
probably related to the internal modes of the coordination polyhedron of the V atom.
The fact that these modes are distributed in a larger frequency region than the internal
stretching modes of the monazite-type phase is related to a coordination increase of V
(see next section). The possible mode assignment will be discussed when presenting the
results of ab initio calculations.
When measuring the Raman spectra we have observed color changes in the
LaVO4 single crystal at the onset of the phase transition and at higher pressures. Up to
11.2 GPa, the crystal of LaVO4 is colorless and transparent, which is consistent with the
fact that LaVO4 has a band gap of 3.5 eV [14]. At 12.2 GPa, after the transition onset,
the sample becomes yellowish, which indicates that the phase transition induces a band
gap collapse, which is consistent with the HP behavior of the band gap in other
monazite-type oxides [60]. Finally, as pressure keeps increasing, LaVO4 becomes
orange, suggesting a red-shift of the band gap with pressure in the HP phase. Clearly,
the observed phase transition involves important changes of the electronic properties of
LaVO4, which might be interesting issues for future studies.
Powder XRD experiments: The crystal structure of the high-pressure phase
In contrast to previous powder-XRD experiments we did not find evidences of
structural changes in LaVO4 up to 12.2 GPa in both our present single-crystal XRD
experiments and Raman experiments. Therefore, in order to better determine the
Page 14
14
transition pressure and the crystal structure of the HP phase, we have carried out PXRD
experiments at higher pressures. Fig. 6 shows the results of the Rietveld refinement of
the measured PXRD pattern at 11.5 GPa for the monazite-type phase of LaVO4 and at
16 GPa for the high-pressure phase. Also Bragg peaks of Ne are detected due to its
solidification. The goodness-of-fit parameters obtained from the refinement are Rp =
3.92 %, Rwp = 4.49 % and the reduced χ2 = 1.25 at 11.5 GPa. The unit-cell parameters of
monazite-type LaVO4 at 11.5 GPa are a = 6.786(2) Å, b = 7.041(3) Å, c = 6.545 (2) Å,
and β = 103.75º, which agree well with the results of the SXRD experiments (Table 1).
At 12 GPa we detected the appearance of extra weak reflections, which suggest
the onset of a phase transition, in good agreement with Raman experiments. The
coexistence of the low- and high-pressure phases was observed up to 15.5 GPa, while
from 16 to 22 GPa only the HP phase was observed. Fig. 6 illustrates the differences
between the diffraction patterns of the low- and high-pressure phases. In particular, the
appearance of Bragg reflections at low angles suggests an increase of the size of the
unit-cell (Fig. 6). The DICVOL routine included in Fullprof [42] was used to index the
Bragg reflections of the HP phase of LaVO4 found below 2θ = 15º to avoid the
overlapping of LaVO4 and Ne reflections. The highest figure of merit was obtained for a
monoclinic unit cell with a = 12.288(9) Å, b = 6.491(5) Å, c = 6.836(5) Å, and β =
95.62(9)º. The analysis of the systematic absences (0k0, k = 2n and h0l, h + l = 2n)
indicated P21/n as the possible space group for the HP phase. While this space group is
the same as for the low-pressure phase, the unit-cell volume is doubled in the high-
pressure phase. The same space group is observed in the AgMnO4-type structure, which
is known for being a HP post-monazite structure in CaSO4 and CaSeO4 [61, 62], and in
the BaWO4-II structure, which has been found in BaWO4 and related oxides [43]. In our
case, the determined unit-cell parameters resemble those of the BaWO4-II structure. A
LeBail fit confirmed that the proposed unit-cell and space group are sufficient to
Page 15
15
reproduce the measured PXRD pattern (RP = 4.12 %, RWP = 4.75 %, χ2 = 1.36). Our ab
initio calculations support the assignment of the BaWO4-II -type structure as the crystal
structure of the HP phase of LaVO4, and also show that the BaWO4-II -type phase is the
most stable phase of LaVO4 beyond 10.5 GPa (see next section). A Rietveld refinement
resulted in small residuals (Fig. 6). The refined unit-cell parameters are a = 12.289(9)
Å, b = 6.492(5) Å, c = 6.836(5) Å, and β = 95.6(1)º. The goodness-of-fit parameters are
RP = 4.98 %, RWP = 5.97 %, χ2 = 1.65. In summary, the Rietveld refinements of the
XRD patterns measured for both phases clearly demonstrate the occurrence of a
monoclinic-to-monoclinic transition.
To conclude this section we will comment on the compressibility of the low- and
high-pressure phase. In Fig. 2 we show the unit-cell parameters obtained at different
pressures (open symbols are from this work). It can be seen that for the low-pressure
phase our results agree well with those obtained in Refs. 9 and 18. In addition, our study
shows that up to 15.5 GPa the unit-cell parameters change gradually, the compression
being slightly anisotropic. We also obtain that the unit-cell volumes we measure here at
11.5, 12, and 15.5 GPa agree well will the extrapolation of the previously determined
EOS [9, 18]. Regarding the HP phase, we found that the phase transition implies a
collapse of around 8 % for the normalized volume (taking into account Z = 4 in the low-
pressure phase and Z = 8 in the HP phase). The volume difference between the two
phases, when they coexist at the same pressure, indicates a first-order phase transition.
In particular, according with our structural refinements and calculations the phase
transition implies an increase of the coordination number of V from [4] to [5+1] and of
the coordination number of La from [9] to [10] (see Fig. 1). The transition also involves
a drastic change of the unit-cell parameters as can be seen in Figs. 1 and 2. Based upon
the above described facts, we can conclude that the transition involves substantial
atomic rearrangements. This means that LaVO4 undergoes a reconstructive transition in
Page 16
16
spite of the fact that the parent and daughter phases share the same space group.
Regarding compressibility, the HP phase appears to be less compressible than the low-
pressure phase (see Fig. 2). However, we do not have enough data points to determine
properly the EOS of the HP phase. Finally, the compression of the HP phase is nearly
isotropic, being the β angle only slightly affected by compression.
Theoretical results
We compare now the experimental data presented in the previous sections with
the results from our ab initio calculations. Figure 7 shows the pressure dependence of
the enthalpy difference between the two candidate HP phases of LaVO4 (AgMnO4-type,
and BaWO4-II-type) and the low-pressure monazite-type phase. Other structures like
zircon-type, scheelite-type, barite-type, and other that appear as HP phases in related
compounds [63] have been considered, but they are not energetically competitive with
the three structures represented in Fig. 7. This figure shows the monazite-type phase as
being stable at zero and low pressure, with V0 = 328.2 Å3, B0 = 105.2 GPa, and B0’= 4.3.
The structural parameters of the equilibrium structure at ambient pressure are given in
Table 1. The agreement with the experiments is very good for the structure and the P-V
equation of state (See Table 1 and Refs. 9 and 18). As pressure increases, the monazite-
type structure becomes unstable against both AgMnO4-type and BaWO4-II-type.
However, the second structure has always a lower enthalpy than the first one. This
structure, which has been also found as a HP phase in BaWO4 [43] and SrMoO4 [64],
only emerges as a structurally different and thermodynamically stable phase above a
compression threshold of about 10.5 GPa. This is consistent with the phase transition
found in the experiments. Structural information on the HP phase is given in Table 4.
The calculated unit-cell parameters agree well with those determined from our
experiments. From the calculations we also obtained the EOS of the HP phase being V0
= 609.2 Å3, B0 = 154 GPa, and B0’= 4.2. The transition involves a density increase of
Page 17
17
approximately 8 %. The high-pressure phase has a larger bulk modulus than the low-
pressure phase, which is consistent with our experimental observations.
We have also calculated the Raman-active phonons for the low- and high-
pressure structure. Results are shown in Tables 2 and 3 and compared with experiments
and previous calculations. The mismatch between the calculated and observed
frequencies of the Raman modes is below 7% in both low-pressure and HP phases. The
HP phase has considerably more phonons than the low-pressure phase as a consequence
of the doubling of the unit-cell. For the BaWO4-II type structure, the vibrational modes
have the following mechanical representation Γ = 36Ag + 36Au + 36Bg + 36Bu, with 72
Raman-active (g) modes, 69 IR-active (u) modes, and three acoustic modes (1 Au + 2
Bu). Out of the 72 Raman modes, in the experiments we observed only 31 modes
(approximately the same proportion of modes observed under HP for the low-pressure
phase). A similar number of Raman modes have been measured for the same phase in
other compounds [43, 64]. Possible reasons for observing fewer modes than expected
could be the broadening and overlaping of Raman modes and the presence of low-
intensity modes which go below the noise threshold and are consequently not visible.
The experimental assignment of the modes symmetry in the BaWO4-II phase is difficult
because of the lack of information on polarization inside the DAC, and because the
number of modes that can be clearly resolved in the Raman spectra is around 31. We
have made a tentative analysis by matching theoretical and experimental frequencies
(see Table 3).
Regarding the pressure coefficients, they agree well for the low-pressure phase,
while for the HP phase the agreement is not so good. A possible reason for it is the fact
that due to the broadening of the Raman bands the accuracy of the experimental
determination of the pressure coefficients of some modes may be affected. As can be
observed in Table 3, according to theory two modes have negative pressure coefficients.
Page 18
18
Unfortunately these modes are not observed in the experiments and therefore this
conclusion cannot be confirmed by our measurements.
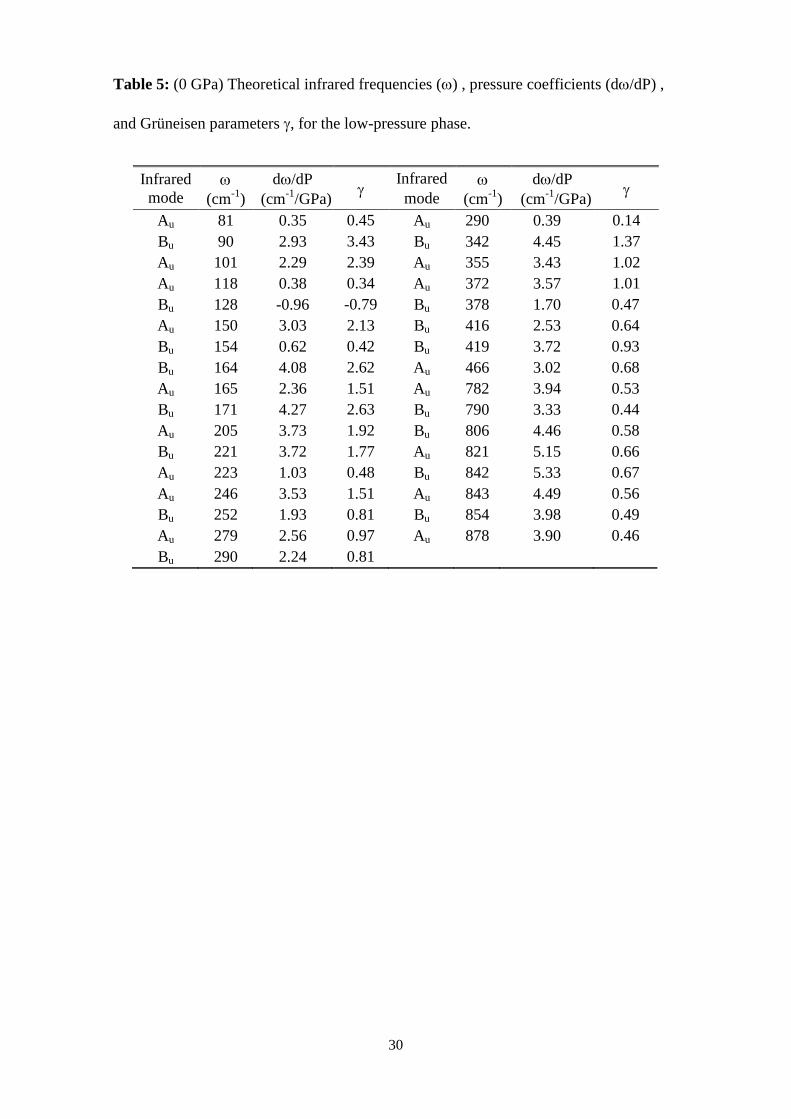
From the calculations we also obtained the IR-active modes (Tables 5 and 6),
which are reported for completeness. In both phases the IR modes show a similar
frequency distribution to the Raman modes. In particular, the modes calculated for the
low-pressure phase agree rather well with those calculated by Sun et al. [33]. In
addition, three of our stretching modes agree within 1.5% with the three modes
experimentally measured. The experimental wavenumbers are 835, 850, and 881 cm-1
and the calculated wavenumbers are 837, 861, and 869 cm-1, which correspond to Au,
Bu, and Au modes respectively. Calculations also show that IR and Raman modes have
comparable pressure coefficients. Several modes existing in both the low- and high-
pressure phases show a weak softening under compression (Table 5 and 6).
V. Concluding Remarks
We reported a combined experimental and theoretical study of the high-pressure
structural and vibrational properties of LaVO4. Polarized single-crystal Raman
experiments were carried out for the first time identifying the 36 Raman-active modes
of the low-pressure monazite phase. HP Raman measurements provide evidence that the
previously reported phase transition (8.6 GPa) does not occur up to 12.2 GPa. They also
provide information on the pressure dependence of the Raman modes of the low- and
high-pressure phases. Single-crystal XRD measurements confirm that the low-pressure
phase is stable up to 11.5 GPa and provide information on the evolution of the unit-cell
parameters and atomic positions under compression. A pressure-induced phase
transition is found to occur at 12 GPa by powder XRD measurements, the HP phase
remaining stable up to 22 GPa. From these experiments we solved the crystal structure
of the HP phase and obtained the pressure dependence of its lattice parameters. This
phase can be described with the same monoclinic space group as the low-pressure
Page 19
19
phase, but with doubled unit-cell volume. It is isomorphic to BaWO4–II. Ab initio
calculations are in full agreement with the experiments. They have been an extremely
good help for Raman mode assignment and for the identification of the crystal structure
of the HP phase. They also provide information on IR-active modes for the low- and
high-pressure phases as well as on their pressure dependences. No experimental results
are available for these modes yet, therefore our calculations can be a good guide for
mode identification in future experiments. Additionally, calculations provide the
pressure evolution of lattice parameters and the P-V EOS for the low- and high-pressure
phase. These results describe quite well the experimental results from this and previous
works. Finally, in our experiments we observed a sharp color change in LaVO4 at the
monoclinic-to-monoclinic phase transition. This suggests that important changes of the
electronic structure of LaVO4 are associated to the structural phase transition. The
changes induced in the electronic properties might be an interesting issue for future
studies.
ACKNOWLEDGEMENTS
This work has been done under financial support from Spanish MINECO under
projects MAT2013-46649-C4-1/3-P and MAT2015-71070-REDC. Supercomputer time
has been provided by the Red Española de Supercomputación (RES) and the MALTA
cluster. The authors thank the SCSIE from Universitat de Valencia the technical support
in ambient pressure XRD measurements and ALBA and PETRA III synchrotrons for
providing beam-time for the XRD high-pressure experiments. DESY Photon Science is
gratefully acknowledged. PETRA III at DESY is a member of the Helmholtz
Association (HGF). J. R.-F. thanks the Alexander von Humboldt Foundation for a
postdoctoral fellowship and the Spanish MINECO for the support through the Juan de la
Cierva program (IJCI-2014-20513). W. M. thanks the support by BMBF through
project 05K13RF1.
Page 20
20
References
[1] Y. Zhang, G. Li, X. Yang, H. Yang, Z. Lu, R. Chen, J. Alloys Compd. 551, 544
(2013).
[2] S. Tang, M. Huang, J. Wang, F. Yu, G. Shang, J. Wu, J. Alloys Compd. 513, 474
(2012).
[3] Y. Liang, P. Chui, X. Sun, Y. Zhao, F. Cheng, Ka. Sun, J. Alloys Compd. 552, 289
(2013).
[4] C.E. Rice, W.R. Robinson, Acta Crystallogr. B 32, 2232 (1976).
[5] H. Yuan, K. Wang, C. Wang, B. Zhou, K. Yang, J. Liu, and B. Zou, J. Phys. Chem.
C 119, 8364 (2015).
[6] D. Errandonea, R. Lacomba-Perales, J. Ruiz-Fuertes, A. Segura, S. N. Achary, and
A. K. Tyagi, Phys. Rev. B 79 84104 (2009).
[7] D. Errandonea, O. Gomis, B. Garcia-Domene, J. Pellicer-Porres, V. Katari, S. N.
Achary, A. K. Tyagi, and C. Popescu, Inorg. Chem. 52, 12709 (2013).
[8] W. Paszkowicz, O. Ermakova, J. López-Solano, A. Mujica, A. Muñoz, R.
Minikayev, C. Lathe, S. Gierlotka, I. Nikolaenko, and H. Dabkowska, J. Phys.:
Condens. Matter 26, 025401 (2014).
[9] D. Errandonea, C. Popescu, S. N. Achary, A. K.Tyagi, and M. Bettinelli, Mater.
Res. Bull. 50, 279 (2014).
[10] A. B. Garg, K. V. Shanavas, B. N. Wani, and S. M. Sharma, J. Solid State Chem.
203, 273 (2013).
[11] D. Errandonea, R. S. Kumar, S. N. Achary, and A. K. Tyagi, Phys. Rev. B 84,
214121 (2011).
[12] A. B. Garg, D. Errandonea, P. Rodriguez-Hernandez, S. Lopez-Moreno, A. Muñoz,
and C. Popescu, J. Phys.: Condens. Matter 26, 265402 (2014).
Page 21
21
[13] W. Paszkowicz, P. Piszora, Y. Cerenius, S. Carlson, B. Bojanowski, and H.
Dabkowska, Synchrotron Radiat. Nat. Sci. 1-2, 137 (2010).
[14] V. Panchal, D. Errandonea, A. Segura, P. Rodriguez-Hernandez, A. Muñoz, S.
Lopez-Moreno, and M. Bettinelli, J. Appl. Phys. 110, 043723 (2011).
[15] D. Errandonea, F. J. Manjon, A. Muñoz, P. Rodriguez-Hernandez, V. Panchal, S.
N. Achary, and A. K.Tyagi, J. Alloys Compd. 577, 327 (2013).
[16] D. Errandonea, S. N. Achary, J. Pellicer-Porres, and A. K. Tyagi, Inorg. Chem. 52,
5464 (2013).
[17] A. B. Garg and D. Errandonea, J. Solid State Chem. 226, 147 (2015).
[18] O. Ermakova, J. Lopez-Solano, R. Minikayev, S. Carlson, A. Kaminska, M.
Glowacki, M. Berkowski, A. Mujica, A. Muñoz, and W. Paszkowicz, Acta Crystallogr.
B 70, 533 (2014).
[19] Z. C. Huang, L. Zhang, and W. Pan, J. Solid State Chem. 205, 97 (2013).
[20] R. Rao, A. B. Garg, and B. N. Wani, J. Phys. Conf. Series 377, 012010 (2012).
[21] N. N. Patel, A. B. Garg, S. Meenakshi, B. N. Wani, and S. M. Sharma, AIP Conf.
Proc. 1349, 99 (2011).
[22] J. Lopez-Solano, P. Rodriguez-Hernandez, and A. Muñoz, High Pres. Res. 29, 582
(2009).
[23] N. N. Patel, A. B. Garg, S. Meenakshi, K. K. Pandey, B. N. Wani, and S. M.
Sharma, AIP Conf. Proc. 1313, 281 (2010).
[24] V. Panchal, D. Errandonea, F.J. Manjon, A. Muñoz, P. Rodriguez-Hernandez, M.
Bettinelli, S .N. Achary, and A. K. Tyagi, AIP Conf. Proc. 1665, 030006 (2015).
[25] X. Cheng, D. Guo, S. Feng, K. Yang, Y. Wang, Y. Ren, amd Y. Son, Opt. Mater.
49, 32 (2015).
[26] A. B. Garg and D. Errandonea, J. Solid State Chem. 226, 147 (2015).
Page 22
22
[27] C. Popescu, A. B. Garg, D. Errandonea, J. A. Sans, P. Rodriguez-Hernández, S.
Radescu, A. Muñoz, S. N. Achary, and A. K. Tyagi, J. Phys.: Condens. Matter 28,
035402 (2016).
[28] W. Paszkowicz, J. Lopez-Solano, P. Piszora, B. Bojanowski, A. Mujica, A. Muñoz,
Y. Cerenius, S. Carlson, and H. Dabkowska, J. Alloys Compd. 648, 1005 (2015).
[29] C.-J. Jia, L.-D. Sun, Z.-G. Yan, Y.-C. Pang, S.-Z. L, and C.-H. Yan, Eur. J. Inorg.
Chem. 2010, 2626 (2010).
[30] R. Lisiecki, W. Ryba-Romanowski, E. Cavalli, and M. Bettinelli, J. Lumin. 130,
131 (2010).
[31] B. Xie, G. Lu, Y. Wang, Y. Guo, and Y. Guo, J. Alloys Compd. 544, 173 (2012).
[32] P. Gangwar, M. Pandey, S. Sivakumar, R. G. S. Pala, and G. Parthasarathy, Cryst.
Growth Design 13, 2344 (2013).
[33] L. Sun, X. Zhao, Y. Li, P. Li, H. Sun, X. Cheng, and W. Fan, J. Appl. Phys. 108,
093519 (2010).
[34] D. Errandonea, Cryst. Res. Techn. 50, 729 (2015).
[35] D. Errandonea, C. Popescu, A. B. Garg, P. Botella, D. Martinez-García, J. Pellicer-
Porres, P. Rodríguez-Hernández, A. Muñoz, V. Cuenca-Gotor, and J. A. Sans, Phys.
Rev. B 93 (2016).
[36] A. Rothkirch, G. D. Gatta, M. Meyer, S. Merkel, M. Merlini, and H.-P. Liermann,
J. Synchrotron Rad. 20, 711 (2013).
[37] Agilent, CrysalisPro software system, version 1.171.36.28, Agilent Technologies
UK Ltd., Oxford, UK (2013).
[38] G. M. Sheldrick, Acta Crystallogr. A 64, 112 (2008).
[39] F. Fauth, I. Peral, C. Popescu, and M. Knapp, Powder Diffraction 28, S360 (2013).
[40] A P Hammersley, S O Svensson, M Hanfland, A N Fitch, and D Häusermann,
High Pressure Research 14, 235 (1996).
Page 23
23
[41] W. Kraus and G. Nolze, J. Appl. Cryst. 29, 301 (1996).
[42] J. Rodriguez-Carvajal, Physica B 192, 1 (1993).
[43] O. Gomis, J. A. Sans, R. Lacomba-Perales, D. Errandonea, Y. Meng, J. C. Chervin,
and A. Polian, Phys. Rev. B 86, 054121 (2012).
[44] H. K. Mao, J. Xu, and P. M. Bell, J. Geophys. Res. 91, 4673 (1986).
[45] A. Dewaele, F. Datchi, P. Loubeyre, and M. Mezouar, Phys. Rev. B 77, 094106
(2008).
[46] P. Hohenberg and W. Kohn. Phys. Rev. 136, 3864 (1964).
[47] G. Kresse and J. Hafner, Phys. Rev. B 47, 558 (1993); G. Kresse and J.
Furthmüller, J. Comput. Mater. Sci. 6, 15 (1996).
[48] P. E. Blöchl. Phys. Rev. B. 50, 17953 (1994); G. Kresse and D. Joubert, Phys. Rev.
B 59, 1758 (1999).
[49] J. P. Perdew, A. Ruzsinszky, G. I. Csonka, O. A. Vydrow, G. E. Scuseria, L. A.
Constantin, X. Zhou, and K. Burke. Phys. Rev. Lett. 100, 136406 (2008).
[50] H. J. Monkhorst and J. D. Pack, Phys. Rev. B 13, 5188 (1976).
[51] Y. Z. Chen, S. Li, L. Z. W. Men, Z. L. C. L. Sun, Z. W. Li, and M. Zhou, Acta
Phys. Sinica 62, 246101 (2013).
[52] K. Parlinski, Computer Code PHONON. See: http://wolf.ifj.edu.pl/phonon.
[53] D. Errandonea, A. Muñoz, and J. Gonzalez-Platas, J. Appl. Phys. 115, 216101
(2014).
[54] M. Guennou, P. Bouvier, P. Toulemonde, C. Darie, C. Goulon, P. Bordet, M.
Hanfland, and J. Kreisel, Phys. Rev. Lett. 112, 075501 (2014).
[55] I. Guedes, Y. Hirano, M. Grimsditch, N. Wakabayashi, C.-K. Loong, and L. A.
Boatner, J. Appl. Phys. 90, 1843 (2001).
[56] S. A. Miller, H. H. Caspers, and H. E. Rast, Phys. Rev. 168, 964 (1968).
[57] H. Siebert, Zeitschrift für Anorganische und Allgemeine Chemie 275, 210 (1954).
Page 24
24
[58] E. Bandiello, D. Errandonea, D. Martinez-Garcia, D. Santamaria-Perez, and F. J.
Manjon, Phys. Rev. B 85, 024108 (2012).
[59] T. Huang, J.-S. Lee, J. Kung, and C.-M. Lin, Solid State Commun. 150, 1845
(2010).
[60] D. Errandonea, E. Bandiello, A. Segura, J.J. Hamlin, M.B. Maple, P. Rodriguez-
Hernandez, A. Muñoz, J. Alloys Compd. 587, 14 (2014).
[61] S. López-Moreno, D. Errandonea, P. Rodríguez-Hernández, and A. Muñoz, Inorg.
Chem. 54, 54 (2015).
[62] W. A. Crichton, J. B. Parise, S. M. Antao, and A. Grzechnik, A. Mineral. Mag. 90,
27 (2005).
[63] D. Errandonea and F.J. Manjon, Progress in Materials Science 53, 711 (2008).
[64] D. Errandonea, L. Gracia, R. Lacomba-Perales, A. Polian, and J. C. Chervin, J.
Appl. Phys. 113, 123510 (2013).
Page 25
25
Table 1. Crystal structure of monazite-type LaVO4 (space group P21/n) at different
pressures as obtained from experiments (top) and calculations (bottom).
Experiments
Pressure Ambient (powder XRD) 3.9(1) GPa (single-cystal XRD) 11.5(1) GPa (single-cystal XRD)
a 7.044(2) Å 6.9410(9) Å 6.7890(9) Å
b 7.283(2) Å 7.1951(9) Å 7.0406(9) Å
c 6.724(2) Å 6.6591(9) Å 6.5448(9) Å
β 104.86(5)º 104.70(5)º 103.72(5)º
La (4e) (0.2771(4), 0.1570(2), 0.1038(2)) (0.2743(2), 0.1588(1), 0.1076(1)) (0.2713(2), 0.1609(1), 0.1141(1))
V (4e) (0.2995(4), 0.1648(2), 0.6145(6)) (0.2997(2), 0.1665(1), 0.6173(3)) (0.2973(2), 0.1688(1), 0.6219(3))
O1 (4e) (0.2425(5), -0.0009(5), 0.4253(8) (0.2423(2), -0.0009(1), 0.4287(2)) (0.2313(2), 0.0001(1), 0.4307(2))
O2 (4e) (0.3866(7), 0.3434(7), 0.4944(8)) (0.3854(2), 0.3454(2), 0.4951(2)) (0.3856(2), 0.3486(2), 0.4954(2))
O3 (4e) (0.4815(9), 0.1056(5), 0.8247(9)) (0.4863(2), 0.1093(1), 0.8261(3)) (0.4898(2), 0.1155(1), 0.8275(3))
O4 (4e) (0.1190(5), 0.2206(6), 0.7305(9)) (0.1180(1), 0.2252(2), 0.7338(3)) (0.1165(1), 0.2314(1), 0.7440(3))
Calculations
Pressure Ambient 3.89 GPa 11.71 GPa
a 7.0401 Å 6.9392 Å 6.7688 Å
b 7.2774 Å 7.1931 Å 7.0432 Å
c 6.6890 Å 6.6286 Å 6.5245 Å
β 105.014 104.723º 103.851º
La (4e) (0.27764, 0.15702, 0.10405) (0.27554, 0.15893, 0.10841) (0.27168, 0.16229, 0.11588)
V (4e) (0.30012, 0.16594, 0.6159) (0.30046, 0.16820, 0.61779) (0.29766, 0.17136, 0.62219)
O1 (4e) (0.24415, -0.00218, 0.42623) (0.23938, -0.00017, 0.42846) (0.22528, 0.00061, 0.43145)
O2 (4e) (0.38660, 0.34492, 0.49444) (0.38679, 0.34708, 0.49345) (0.38589, 0.35046, 0.49237)
O3 (4e) (0.48404), 0.10651, 0.82689) (0.48851, 0.11077, 0.82818) (0.49449, 0.11609, 0.82851)
O4 (4e) (0.11791, 0.22261, 0.73008) (0.11748, 0.22688, 0.73612) (0.11709, 0.23723, 0.74787)
Page 26
26
Table 2: Raman frequencies (ω) and pressure coefficients (dω/dP) for the low-pressure
monazite-type structure determined from theory (theo) and experiments (exp). Previous
results are included for comparison [aRef. 33, bRef. 29, and cRef. 25]. The Grüneisen
parameter was calculated according to 𝛾 = 𝐵0𝜔0
𝜕𝜔𝜕𝜕
using B0 = 105 GPa.
Raman mode
ωtheo (cm-1)
dω/dPtheo (cm-1/GPa) γ
ωtheoa
(cm-1) ωexp
(cm-1) dω/dPexp
(cm-1/GPa) γ ωexp
b (cm-1)
ωexpc
(cm-1) dω/dPexp
c (cm-1/GPa)
Bg 70 -0.46 -0.69 66 64 Ag 72 0.42 0.61 65 61 Ag 91 0.04 0.05 84 88 -0.1 -0.12 Bg 92 -0.75 -0.86 91 102 Ag 102 0.17 0.18 97 102 0.2 0.21 Bg 115 1.60 1.46 108 115 Bg 127 1.02 0.84 120 127 127 124.2 Ag 134 0.15 0.12 126 137 0.0 0.0 138.4 Ag 143 1.66 1.22 136 146 1.4 1.00 147 143.8 Ag 154 1.80 1.23 142 160 2.3 1.51 158 156.6 Bg 158 2.17 1.44 143 158 Bg 183 2.80 1.61 170 189 189 187.3 Ag 188 3.13 1.75 173 193 Bg 204 2.60 1.34 178 209 208 204.7 Bg 224 3.40 1.59 210 232 Ag 230 2.70 1.23 203 235 3.1 1.38 238 242.1 Bg 242 3.36 1.46 218 241 Ag 252 3.28 1.37 232 252 3.7 1.54 251 260.4 Bg 297 0.90 0.32 292 309 309 306.2 0.39 Bg 316 2.14 0.71 315 331 Ag 317 0.70 0.23 310 326 0.8 0.26 329 326.3 2.60 Ag 336 2.41 0.75 324 349 2.5 0.75 349 345.8 2.97 Ag 355 3.19 0.94 334 373 2.8 0.79 374 370.7 3.15 Ag 380 3.51 0.97 367 397 3.2 0.85 398 394.8 3.73 Bg 389 2.44 0.66 378 400 Bg 410 2.10 0.54 394 426 420.7 Ag 423 2.28 0.57 405 439 2.0 0.48 440 436.4 2.44 Bg 427 3.80 0.93 406 440 463.4 Ag 784 3.83 0.51 865 768 4.1 0.56 770 766.5 4.50 Bg 799 3.93 0.52 877 790 782.9 Ag 806 4.49 0.58 883 794 4.9 0.65 794 792.1 3.73 Ag 836 2.60 0.33 916 819 2.5 0.32 819 817.5 2.30 Bg 850 4.78 0.59 911 843 826.0 Bg 861 3.93 0.48 934 855 840.9 3.90 Ag 870 3.23 0.39 925 859 3.6 0.44 859 856.5 4.05 Bg 892 2.21 0.26 965 882 4.8 0.57
Page 27
27
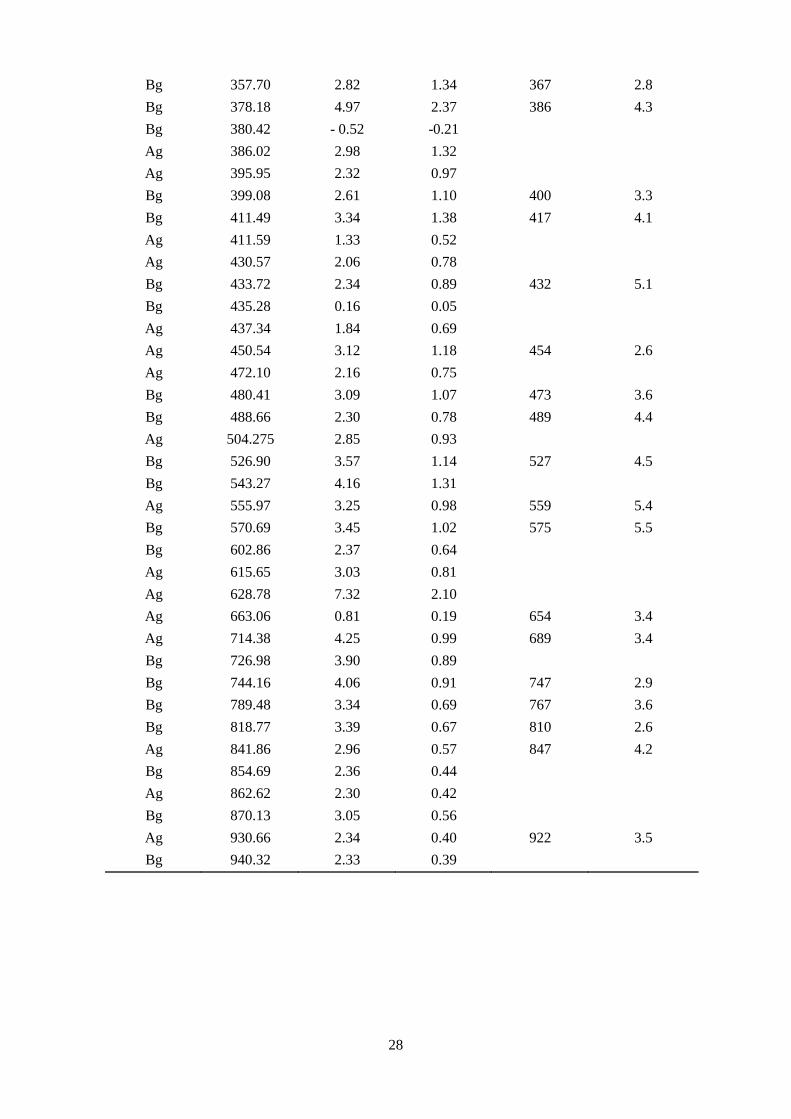
Table 3: Raman frequencies (ω) and pressure coefficients (dω/dP) for the high-pressure
phase determined from theory (16.4 GPa) and experiments (15.4 GPa). The Grüneisen
parameter was calculated according to 𝛾 = 𝐵0𝜔0
𝜕𝜔𝜕𝜕
using B0 = 154 GPa.
Raman mode ωtheo (cm-1)
dω/dPtheo (cm-1/GPa)
γ ωexp (cm-1)
dω/dPexp (cm-1/GPa)
Ag 75.90 0.33 0.70 Bg 80.90 0.82 1.67 Bg 83.25 - 0.72 -1.24 Ag 95.80 0.09 0.14 Bg 104.10 0.32 0.49 Ag 108.68 0.56 0.85 114 1.3 Ag 133.62 1.47 1.95 129 1.5 Bg 135.58 1.68 2.17 Ag 139.47 1.86 2.45 Bg 138.17 0.71 0.86 Ag 152.78 0.90 0.98 153 2.2 Bg 157.82 2.49 2.93 159 3.0 Ag 162.91 1.32 1.39 Bg 174.10 1.32 1.30 Ag 183.99 2.12 2.09 181 3.4 Bg 194.54 2.47 2.34 197 4.1 Bg 212.27 3.28 2.88 Ag 217.73 3.22 2.75 Bg 220.36 0.05 0.03 Ag 231.13 3.42 2.75 227 3.2 Bg 235.87 3.36 2.61 Ag 242.14 3.75 2.95 Ag 254.50 3.71 2.77 Bg 259.40 5.33 4.18 258 4.9 Bg 265.35 2.99 2.07 Ag 268.39 3.35 2.30 Ag 276.84 3.02 1.99 277 2.9 Bg 276.32 2.49 1.59 Bg 279.59 3.12 2.05 Ag 289.49 4.46 2.95 286 3.3 Ag 305.20 2.54 1.47 302 4.1 Ag 317.00 2.13 1.13 318 5.0 Ag 329.92 4.54 2.57 327 6.2 Ag 338.66 2.75 1.41 Bg 341.75 3.28 1.67 Ag 351.43 3.24 1.63
Page 28
28
Bg 357.70 2.82 1.34 367 2.8 Bg 378.18 4.97 2.37 386 4.3 Bg 380.42 - 0.52 -0.21 Ag 386.02 2.98 1.32 Ag 395.95 2.32 0.97 Bg 399.08 2.61 1.10 400 3.3 Bg 411.49 3.34 1.38 417 4.1 Ag 411.59 1.33 0.52 Ag 430.57 2.06 0.78 Bg 433.72 2.34 0.89 432 5.1 Bg 435.28 0.16 0.05 Ag 437.34 1.84 0.69 Ag 450.54 3.12 1.18 454 2.6 Ag 472.10 2.16 0.75 Bg 480.41 3.09 1.07 473 3.6 Bg 488.66 2.30 0.78 489 4.4 Ag 504.275 2.85 0.93 Bg 526.90 3.57 1.14 527 4.5 Bg 543.27 4.16 1.31 Ag 555.97 3.25 0.98 559 5.4 Bg 570.69 3.45 1.02 575 5.5 Bg 602.86 2.37 0.64 Ag 615.65 3.03 0.81 Ag 628.78 7.32 2.10 Ag 663.06 0.81 0.19 654 3.4 Ag 714.38 4.25 0.99 689 3.4 Bg 726.98 3.90 0.89 Bg 744.16 4.06 0.91 747 2.9 Bg 789.48 3.34 0.69 767 3.6 Bg 818.77 3.39 0.67 810 2.6 Ag 841.86 2.96 0.57 847 4.2 Bg 854.69 2.36 0.44 Ag 862.62 2.30 0.42 Bg 870.13 3.05 0.56 Ag 930.66 2.34 0.40 922 3.5 Bg 940.32 2.33 0.39
Page 29
29
Table 4: Calculated structure of BaWO4 II-type LaVO4 at 16.4 GPa (a = 12.319 Å, b =
6.443 Å, c = 6.775 Å, and β = 95.80º). Wyckoff positions are indicated. To facilitate
comparison we include here the unit-cell parameters determined from the experiments
at 16.0(1) GPa: a = 12.289(9) Å, b = 6.492(5) Å, c = 6.836(5) Å, and β = 95.6(1)º.
Atom x y z
La1 (4e) 0.89138 0.34364 0.11856
La2 (4e) 0.87725 0.05433 0.63987
V1 (4e) 0.86896 0.83095 0.17888
V2 (4e) 0.83191 0.55824 0.60671
O1 (4e) 0.93820 0.04308 0.31838
O2 (4e) 0.79212 0.35971 0.77788
O3 (4e) 0.90611 0.40060 0.47845
O4 (4e) 0.77509 0.63949 0.09695
O5 (4e) 0.91628 0.69045 0.87024
O6 (4e) 0.81457 0.77366 0.42413
O7 (4e) 0.99659 0.70000 0.15006
O8 (4e) 0.82884 0.01541 0.98855
Page 30
30
Table 5: (0 GPa) Theoretical infrared frequencies (ω) , pressure coefficients (dω/dP) ,
and Grüneisen parameters γ, for the low-pressure phase.
Infrared mode
ω (cm-1)
dω/dP (cm-1/GPa) γ
Infrared mode
ω (cm-1)
dω/dP (cm-1/GPa) γ
Au 81 0.35 0.45 Au 290 0.39 0.14 Bu 90 2.93 3.43 Bu 342 4.45 1.37 Au 101 2.29 2.39 Au 355 3.43 1.02 Au 118 0.38 0.34 Au 372 3.57 1.01 Bu 128 -0.96 -0.79 Bu 378 1.70 0.47 Au 150 3.03 2.13 Bu 416 2.53 0.64 Bu 154 0.62 0.42 Bu 419 3.72 0.93 Bu 164 4.08 2.62 Au 466 3.02 0.68 Au 165 2.36 1.51 Au 782 3.94 0.53 Bu 171 4.27 2.63 Bu 790 3.33 0.44 Au 205 3.73 1.92 Bu 806 4.46 0.58 Bu 221 3.72 1.77 Au 821 5.15 0.66 Au 223 1.03 0.48 Bu 842 5.33 0.67 Au 246 3.53 1.51 Au 843 4.49 0.56 Bu 252 1.93 0.81 Bu 854 3.98 0.49 Au 279 2.56 0.97 Au 878 3.90 0.46 Bu 290 2.24 0.81
Page 31
31
Table 6: (16.4 GPa) Theoretical infrared frequencies (ω), pressure coefficients (dω/dP),
and Grüneisen parameters γ, for the high-pressure phase.
Raman mode
ω (cm-1)
dω/dP (cm-1/GPa)
γ Raman mode
ω (cm-1)
dω/dP (cm-1/GPa)
Raman mode
Au 63.36 - 0.58 -1.31 Bu 375.48 4.98 2.38 Bu 72.00 - 0.52 -1.03 Bu 376.99 - 0.11 -0.04 Bu 99.15 0.46 0.75 Au 392.93 1.89 0.80 Au 118.76 1.67 2.56 Bu 397.81 3.42 1.49 Au 128.66 1.08 1.45 Bu 400.16 2.34 0.99 Bu 134.27 0.64 0.77 Au 426.03 2.81 1.10 Bu 141.24 1.45 1.81 Bu 435.46 2.11 0.79 Au 142.19 1.58 1.97 Au 436.00 2.62 0.99 Au 165.66 3.10 3.60 Au 445.36 1.81 0.67 Au 166.75 0.31 0.30 Bu 454.15 2.19 0.79 Bu 175.25 2.05 2.10 Au 455.12 2.24 0.81 Au 179.88 1.02 0.96 Bu 463.45 2.55 0.92 Bu 191.21 1.97 1.84 Au 482.96 2.89 1.01 Au 212.11 2.84 2.38 Bu 487.81 1.87 0.62 Bu 213.72 2.39 1.98 Au 502.11 3.04 1.01 Bu 222.79 3.63 3.11 Bu 529.77 3.58 1.13 Au 227.83 2.88 2.30 Bu 540.93 3.87 1.22 Bu 231.49 2.87 2.23 Au 542.91 2.91 0.89 Au 234.93 3.33 2.67 Bu 565.89 3.46 1.03 Bu 234.93 1.11 0.79 Bu 598.62 2.82 0.78 Au 250.69 4.63 3.61 Au 612.54 4.07 1.12 Au 254.83 0.95 0.62 Au 629.77 6.56 1.86 Bu 265.45 4.25 3.08 Au 663.42 0.93 0.22 Bu 272.63 2.84 1.89 Bu 698.85 4.39 1.05 Au 278.73 3.26 2.11 Au 712.96 4.56 1.07 Au 294.95 4.12 2.61 Bu 738.07 4.24 0.96 Bu 299.34 - 0.22 2.31 Bu 793.26 3.37 0.69 Au 299.70 2.71 1.59 Au 810.51 3.08 0.61 Bu 318.25 3.27 1.84 Au 841.29 2.29 0.43 Au 324.15 5.86 3.43 Bu 850.11 2.49 0.47 Au 328.21 - 0.54 -0.26 Bu 873.24 2.67 0.49 Bu 338.31 3.65 1.92 Au 898.44 2.56 0.45 Au 343.47 2.54 1.26 Bu 929.30 - 0.22 0.37 Bu 348.40 2.61 1.27 Au 929.98 2.23 0.38 Au 369.87 3.12 1.44
Page 32
32
Figure Captions
Figure 1: (color online) Schematic structure of the crystal structure of the low-pressure
(left) and high-pressure phase of LaVO4. The coordination polyhedra of V and La are
shown in red and green, respectively.
Figure 2: (color online) Unit-cell parameters and volume versus pressure. Solid
squares and circles are from Refs. 18 and 9, respectively. Empty circles and diamonds
represent the results obtained in this work from PXRD measurements for the low-
pressure and high-pressure phase, respectively. Empty squares show the results obtained
in this work from SXRD measurements for the low-pressure. The dashed lines represent
the theoretical results. Solid lines are just a guide to the eye. For the HP phase we
plotted a/2 instead of a, and V/2 instead of V for the sake of comparison.
Figure 3: Ambient pressure Raman spectra for different polarizations together with
mode positions indicated by ticks. See the text for a description of the different
polarizations.
Figure 4: Pressure-dependent sequence of selected high-pressure Raman spectra. “r”
indicates sample recovered after decompression.
Figure 5: Pressure evolution of Raman modes. Circles: low-pressure phase. Squares:
high-pressure phase. Solid (empty) symbols correspond to pressure increase (release).
The lines show linear fits to the experimental data. The vertical lines labeled as upstroke
(downstroke) indicated the lowest pressure where the high-pressure phase is identified
under compression (decompression).
Figure 6: Powder XRD patterns measured for the low-pressure phase at 11.5 GPa and
the high-pressure phase at 16 GPa. Symbols: experiments. Solid lines: Rietveld
refinements and residuals. Ticks indicate the positions of Bragg reflections. Ne peaks
are indicated.
Figure 7: Calculated enthalpy difference per formula unit versus pressure.
Page 36
36
Figure 4
Figure 5