Chapter 2: Literature Review Page 5 5 2. Literature Review and Background 2.1 Historical Foundations The foundations of microdosimetry grew out of the study of radiation effects on living cells. Early attempts at understanding cellular radiation effects recognized that knowledge of the energy distribution at a scale comparable to the structures affected by irradiation was essential. Dessauer [5] and Crowther [6] in the 1920s developed the earliest forms of target theory which identified discrete energy transfers denoted as hits with individual ionization. The neglect of the spatial distribution of these events severely limited the predictive capability of this early work. The late 1940s saw the development of several important concepts, in particular the development of the concept of linear energy transfer (LET). Zirkle [7] in 1952 provided the first definition of LET although his work was closely linked to similar ideas introduced by Gray [8] and Lea [9]. ICRU report no 16 [10] defines LET as a measure of the loss of energy per unit distance along the path of a charged particle. This report also discusses some of the serious limitations of the LET concept in explaining relative biological effectiveness and the differences between radiation types. Kellerer and Chmelevsky [10], have investigated the effect of these limitations and the ranges and energies over which they are important. There are several reasons for the limitations in the LET concept [11]. Firstly, delta ray energy distribution and its relationship to spatial dose distribution are not adequately considered. Particles with different velocities and charges can have the same LET but it is the particle velocity that largely determines the energy distribution of delta rays. In microscopic volumes, the delta ray distribution may be a significant factor in the spatial distribution of energy, particularly at higher ion energies and small site sizes. Secondly, the limited range of charged particles relative to the finite target structure influences the energy deposition by two possible mechanisms; a change in LET through the site or the possibility of the track beginning or ending within the volume. Such effects are more predominant at lower ion energies and in sites with larger dimensions. Finally, LET, being a non- stochastic average quantity, does not account for the random fluctuations in energy deposition which manifest as clustering of energy deposition and range straggling. The variance due to straggling may exceed the path length variations at high ion energies and small site sizes.
Transcript
Chapter 2: Literature Review Page 5
5
2. Literature Review and Background
2.1 Historical FoundationsThe foundations of microdosimetry grew out of the study of radiation effects on living
cells. Early attempts at understanding cellular radiation effects recognized that
knowledge of the energy distribution at a scale comparable to the structures affected by
irradiation was essential. Dessauer [5] and Crowther [6] in the 1920s developed the
earliest forms of target theory which identified discrete energy transfers denoted as hits
with individual ionization. The neglect of the spatial distribution of these events
severely limited the predictive capability of this early work. The late 1940s saw the
development of several important concepts, in particular the development of the concept
of linear energy transfer (LET). Zirkle [7] in 1952 provided the first definition of LET
although his work was closely linked to similar ideas introduced by Gray [8] and Lea
[9]. ICRU report no 16 [10] defines LET as a measure of the loss of energy per unit
distance along the path of a charged particle. This report also discusses some of the
serious limitations of the LET concept in explaining relative biological effectiveness
and the differences between radiation types.
Kellerer and Chmelevsky [10], have investigated the effect of these limitations and the
ranges and energies over which they are important. There are several reasons for the
limitations in the LET concept [11]. Firstly, delta ray energy distribution and its
relationship to spatial dose distribution are not adequately considered. Particles with
different velocities and charges can have the same LET but it is the particle velocity that
largely determines the energy distribution of delta rays. In microscopic volumes, the
delta ray distribution may be a significant factor in the spatial distribution of energy,
particularly at higher ion energies and small site sizes. Secondly, the limited range of
charged particles relative to the finite target structure influences the energy deposition
by two possible mechanisms; a change in LET through the site or the possibility of the
track beginning or ending within the volume. Such effects are more predominant at
lower ion energies and in sites with larger dimensions. Finally, LET, being a non-
stochastic average quantity, does not account for the random fluctuations in energy
deposition which manifest as clustering of energy deposition and range straggling. The
variance due to straggling may exceed the path length variations at high ion energies
and small site sizes.
Chapter 2: Literature Review Page 6
6
These limitations in LET lead to the formulation of a set of measurable stochastic
quantities that provide the fundamental basis for the field of microdosimetry. The two
principle quantities are specific energy and lineal energy. These quantities will be
defined and discussed in section 2.2. It is the goal of experimental microdosimetry to
measure these quantities in well-defined volumes.
Parallel to the theoretical development of radiation interaction with tissue were two
main experimental developments [12]. The first main experimental development
included studies of visible chromosome aberrations in cells which observed that
ionizing radiation could induce exchanges of material between different radiation
damaged chromosomes. This work was pioneered by Sax [13] and Lea and Catcheside
[14] in the 1940s working on Tradescantia plant cells followed by Wolff [15] in the late
1950s and Neary [16] and coworkers in the 1960s. Analysis of the size of the affected
chromosome structures under different types of ionizing radiation suggested an
interaction distance between pairs of damaged chromosomes of between 0.1-1 µm. This
compares with a typical cell diameter of 10 µm and a DNA molecule diameter of 0.002
µm.
Clearly, the measurement of radiation quantities in sites of comparable size to the cell or
even the chromosome interaction distance are required. Of utility in such measurements
was the development in the early 1950s of the low-pressure proportional counter,
commonly called the Rossi counter after its pioneer [17]. This was the second main
experimental development in microdosimetry and permits measurement of
microdosimetric quantities at scales of the order of 1 µm. The operation and limitations
of proportional counters will be described in section 2.3.1.
The site concept involves the definition of volumes of interest called sites in which the
energy absorbed by ionizing radiation is considered without regard to the microscopic
distribution of energy within the site. Regional microdosimetry is concerned with the
measurement of energy deposition in sites and it is the principal objective of
experimental microdosimetry [1]. Intuitively, it would seem likely that a link exists
between microdosimetric experimental quantities and the observed effects of radiation
on biological cells. The theory of dual radiation action, first proposed by Kellerer and
Rossi in 1972 [18], seeks to establish the link between experimental radiation physics
and cellular radiobiology. This theory and the applicability of experimental
Chapter 2: Literature Review Page 7
7
microdosimetry to radiobiology, radiotherapy, radiation protection, and other
applications is discussed briefly in section 2.3.3. Prior to the discussion on applications,
the following sections will describe the important concepts of microdosimetry with
particular emphasis on experimental microdosimetry. Current experimental methods
will be reviewed to facilitate a comparison with silicon based microdosimetry. Past
attempts at silicon microdosimetry are thoroughly examined. The main problems
associated with silicon based microdosimetry are identified based on this review and the
rationale behind utilizing silicon based microdosimetry in medical radiotherapy
applications is presented.
2.2 Basic Principles and Microdosimetric QuantitiesThe formal definitions for the principal microdosimetric quantities are given by the
International Commission on Radiation Units and Measurements [11]. Of primary
importance is the concept of lineal energy, y, which is defined as the quotient of ε by l ,
where ε is the energy imparted to matter in a volume by a single energy deposition
event and l is the mean chord length in that volume:
yl
=ε
(2.1)
Lineal energy is commonly presented in units of keV µm-1. The mean chord length in a
volume is the mean length of randomly orientated chords in that volume. Various types
of randomness exist and the definition of l typically refers to µ-randomness in which
the body is exposed to a uniform isotropic field of infinite straight lines. Chord length
distributions and randomness types are further discussed in section 3.3.1 and subsequent
sections. According to a theorem by Cauchy, the mean chord length in a convex
volume under µ-randomness is given by
lV
S=
4(2.2)
where V is the volume and S is the surface area of the body.
The measured lineal energy is subject to random fluctuations and hence is a stochastic
quantity. The random fluctuations are due to all of the previously mentioned limitations
in LET, that is, delta ray effects, variations in LET through the volume, and energy and
range straggling as well as variations in the chord length through the sensitive volume.
Chapter 2: Literature Review Page 8
8
The sources of variation that contribute to the distribution of lineal energy are discussed
extensively in section 3.2.
The probability distribution of lineal energy (f(y)) is a fundamental function in
microdosimetry. An example is shown in Figure 2.1 where a single set of measurements
can be displayed as a frequency distribution (f(y) probability of event versus event size)
or as a dose distribution (d(y), fraction of energy versus event size). The relationship
between f(y) and d(y) is given by:
d yyf y
yF
( )( )
= (2.3)
The dose distribution relationship simply reflects the fact that higher lineal energies
deposit a higher dose.
0 2. 4. 6. 8. 10.Lineal Energy H y, keVêm mL0
0.2
0.4
0.6
0.8
1.
fy
yf
(a) Frequency (event) distribution
0 2. 4. 6. 8. 10.Lineal Energy H y, keVêm mL0
0.050.1
0.150.2
0.250.3
0.35
dy
=y y f
fy
yd
(b) Dose distribution
The lineal energy was assumed to be exponentially distributed, i.e. f y Exp y( ) ( )= − , with mean yF = 1
keV/µm. This is not too dissimilar to the measured distributions of single events in a spherical counter of2 µm simulated tissue diameter irradiated with 60Co γ rays [12]. The lineal energy distributions may berepresented as frequency distributions as given by the left-hand diagram or as dose weighted distributionsgiven by the right hand side.
Figure 2.1. Example Single Event Microdosimetric Distributions
The distributions displayed in Figure 2.1, have the following averages defined as
y yf y yF =∞z ( ) d
0(2.4)
y yd y y
yy f y y
D
F
=
=
∞
∞
zz
( )
( )
d
d
0
2
0
1 (2.5)
Chapter 2: Literature Review Page 9
9
The first moment of f(y) is the frequency mean lineal energy, yF , whilst the second
moment divided by the first is the dose mean lineal energy, yD .
Although not used in this work, another important microdosimetric quantity is specific
energy, z, which is the quotient of ε by the volume mass m. Similar microdosimetric
distributions and averages also apply for this quantity.
Thus, from the single event lineal energy distribution and the site geometry one may
calculate all microdosimetric distributions of interest. The representation of these
fundamental microdosimetric spectra is traditionally displayed as a log-linear plot with
the ordinate multiplied by y such that the area under the curve delimited by two values
of y is proportional to the fraction of events (for f(y)) or the fraction of dose(for d(y))
delivered by events in this range of lineal energy values. This representation
accommodates the wide lineal energy range often observed in microdosimetric spectra
(from 0.1 keV/µm to several hundred keV/µm) but requires further scaling to preserve
the dose to area correspondence. Specifically, the ordinate is displayed as yf(y) and
yd(y) on a linear-log plot since
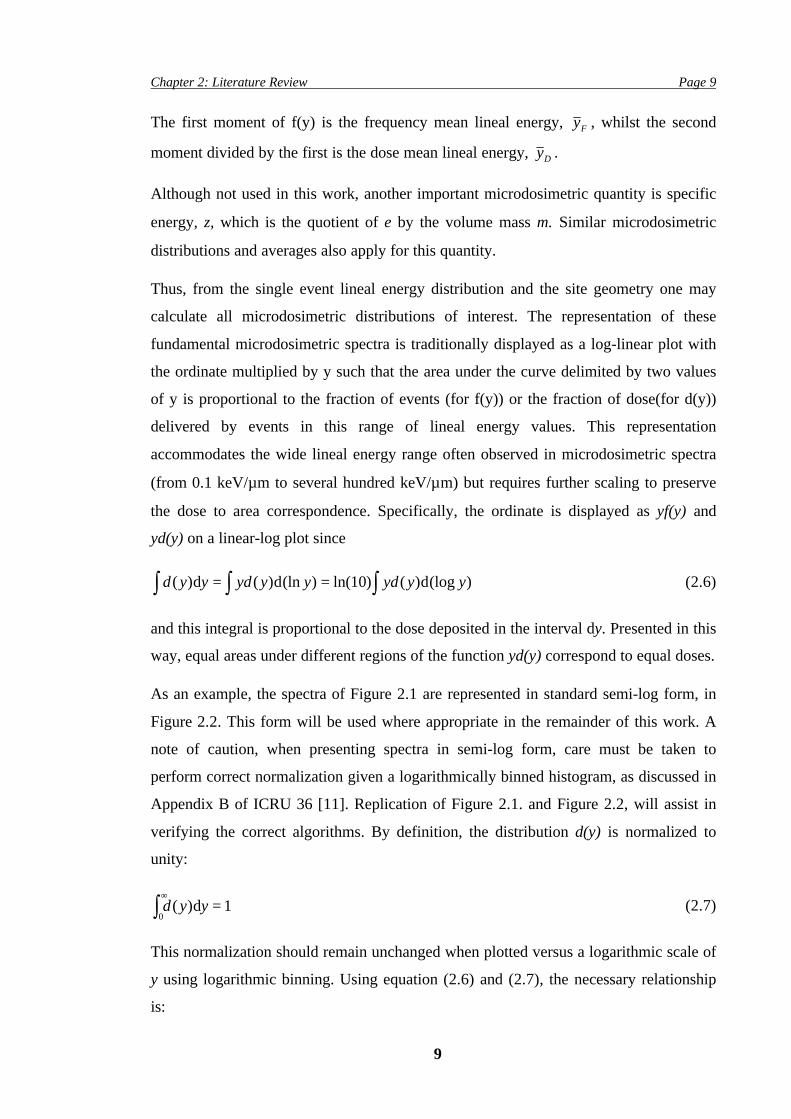
d y y yd y y yd y y( ) ( ) (ln ) ln( ) ( ) (log )d d d= =z zz 10 (2.6)
and this integral is proportional to the dose deposited in the interval dy. Presented in this
way, equal areas under different regions of the function yd(y) correspond to equal doses.
As an example, the spectra of Figure 2.1 are represented in standard semi-log form, in
Figure 2.2. This form will be used where appropriate in the remainder of this work. A
note of caution, when presenting spectra in semi-log form, care must be taken to
perform correct normalization given a logarithmically binned histogram, as discussed in
Appendix B of ICRU 36 [11]. Replication of Figure 2.1. and Figure 2.2, will assist in
verifying the correct algorithms. By definition, the distribution d(y) is normalized to
unity:
d y y( )d =∞z 10
(2.7)
This normalization should remain unchanged when plotted versus a logarithmic scale of
y using logarithmic binning. Using equation (2.6) and (2.7), the necessary relationship
is:
Chapter 2: Literature Review Page 10
10
yd y yB
y d yi ii
( ) (ln )ln
( )d ≈ ==
∞∞
∑z 101
00
(2.8)
where the logarithmic scale of y is subdivided into B increments per decade such that
the ith value of y is:
y yii B= 010 / (2.9)
The approximation in equation (2.8) arises from the use of the relationship:
d(log ) (log )y yB
≈ =∆1
(2.10)
where the difference between d(log y) and ∆(log y) is negligible provided B is large
enough. In all the plots used in this work B = 40 which was found to provide sufficient
smoothing of the data, adequate display resolution and correct normalization.
0.1 1. 10. 100.LinealEnergy Hy, keVêm mL
0.05
0.10.150.2
0.250.3
0.350.4
yfy
(a) Frequency (event) distribution
0.1 1. 10. 100.LinealEnergyHy, keVêm mL
0.1
0.2
0.3
0.4
0.5
yd
yµ
y2 fy
(b) Dose weighted distribution
Semi-log representations of the spectrum of Figure 2.1. The ordinates have been multiplied by y such thatarea under the curve is proportional to the fraction of events (or dose) in the areas range.
Figure 2.2. Standard Representation of Microdosimetric Spectrums
2.3 Experimental Methods in Regional MicrodosimetryThe following section summarizes current experimental methods in microdosimetry
with particular emphasis on their performance capabilities and limitations. The methods
discussed include proportional counters, autoradiography, and cloud chambers. The
theoretical treatment of proportional counters is complex with limited experimental
predictive capability. This review seeks only to elucidate in a largely qualitative
manner, the principles of operation and limitations. Note that the use of semiconductor
based dosimeters is discussed at length in section 2.3.2.
Chapter 2: Literature Review Page 11
11
2.3.1 Proportional Counter Microdosimetry
2.3.1.1 Basic Principles of Proportional Counters
Historically, there have been several difficulties associated with measuring ionization in
small micron sized solid devices. These include tissue equivalence problems, small
device sizes, and construction difficulties. An alternative approach is to simulate a small
tissue volume using a larger gas volume with the requirement that the energy loss of
charged particles is identical in both tissue and gas volumes for equivalent trajectories.
For a tissue sphere of diameter dt, density ρt, and mass stopping power (S/ρ)t and a gas
sphere with parameters dg, ρg, and (S/ρ)g, the required condition of equivalent energy
loss is[11]:
∆ ∆E S d S d Et t t t g g g g= = =( ) ( )ρ ρ ρ ρ (2.11)
where ∆Et and ∆Eg are the mean energy losses from the charged particle in tissue and
gas. Given a gas with an identical atomic composition to that of tissue and if the mass
stopping powers are independent of density then the design criterion becomes:
ρ ρt t g gd d= (2.12)
Thus if the ratio of gas to tissue diameter is kgt, then the density of the gas must be
reduced from that of tissue by the same factor. The density of the gas may simply be
adjusted by changing the gas pressure. As an example, a 2.5 cm diameter sphere filled
with propane based tissue equivalent (TE) gas at 17 Torr is equivalent to a 1 µm
diameter sphere of unit density material [19]. The absorbed dose is the same in both
spheres but the number of charged particles per unit absorbed dose is multiplied by kgt2,
the increase in the area cross section.
An important principle in the simulation of microscopic volumes is Fano’s theorem
[20]. In a medium of constant atomic composition, the fluence of secondary particles is
constant if the fluence of primary particles is constant and that under this condition the
fluence is independent of the density variations provided the interaction cross-section
and stopping powers of the particles are independent of density. The conditions of this
theorem must be fulfilled for a counter to correctly simulate tissue. In practice, the
counter materials are made tissue equivalent with essentially identical atomic
compositions. However, it should be noted that the requirement that mass stopping
Chapter 2: Literature Review Page 12
12
powers are independent of density is not always met due to polarization effects in solids
[21].
These principles are exploited in the low pressure proportional counter, the most
common microdosimetric device. It consists of a spherical or cylindrical gas chamber
with a central anode wire traversing the diameter and electrically isolated from the
surrounding chamber wall. A voltage is applied between the anode and the conductive
wall of the counter such that radiation induced ionization within the chamber results in
the drift of ions along the electric field lines. The amount of charge collected is a
measure of the number of ion pairs produced. If the average energy (W) required for
producing an ion pair is known then the energy deposited within the counter volume
may be calculated.
The size of the pulse produced at the anode depends on the applied voltage. At low
voltages (a few volts), the ions move relatively slowly and recombination is a
significant process. As the voltage increases, the so-called ion chamber region is
reached in which almost all ions are collected. At still higher voltages, gas amplification
(or avalanche production) occurs in which each ion or electron acquires enough energy
to produce secondary and higher generation ions through collisions with gas molecules.
In this region of operation, the charge collected is proportional to the energy deposited
and the detector is termed a proportional counter.
The amplification or gas gain is a function, among other factors, of the reduced field E/p
(where E is the field strength normally expressed in volts/cm and p is the gas pressure
expressed in Torr); at sufficiently large values of E/p ionization by electrons can occur
[1, 11, 22]. For the simple case of a cylindrical counter the reduced field at a radius r is
given by (p163 [23]):
E
p
V
p r r r=
ln( )2 1
where V is the applied voltage and r1 and r2 are the radii of the central wire and
collection volume respectively . Thus, E/p decreases rapidly with r2 and gas
amplification typically only occurs in a very small proportion of the detector within a
few wire diameters of the central anode. Consequently, the amount of charge collected
is almost independent of the position of the incident ion and the resulting pulse is
proportional to the number of primary ions. The shape of the outer wall results in a field
Chapter 2: Literature Review Page 13
13
that is more intense at the ends of the collecting wire than in the center. In order to
generate a uniform field in the multiplication region, the central anode wire is typically
surrounded by an additional electrode shaped as a helix at a potential 80% of the shell
voltage (p 89 [1, 11, 22]). A 12.5 mm radius counter at 28 Torr of TE gas simulating a 1
µm radius will typically have an anode radius of 0.0125 mm (1 mil wire) with a helix
electrode radius of 1.5mm (p93 [1]).
As the gas pressure decreases (in an attempt to simulate smaller tissue volumes) the
amplification region increases such that the counter output ceases to be independent of
the spatial distribution of primary ion pairs in the sensitive volume. In order to maintain
the amplification region within the confines of the helix electrode, the voltage must be
reduced which has the effect of decreasing gain. Conflicting with the requirement of
lower gain is that at lower pressures charged particles lose less energy in the counter.
Thus, at low pressures the electronic gain must be significantly increased to provide an
equal signal to the pulse height analysis system. Rossi (p94 [1]) states a factor of 10
increase in electronic gain from 1 µm simulated diameter down to 0.5 µm. Noise and
stability considerations limit the possible electronic gain increases. The generally
accepted limit on the simulated diameter due to expansion of the gas multiplication
region is around 0.3 µm, although a well defined limit does not exist because it depends
on the criterion used for the maximum tolerable spectrum deterioration as well as the
applied electric field and gas pressure [11].
Aside from gas pressure decreases, the simulated volume may also be reduced by using
smaller electrode diameters. Kliauga [22] has reported reasonable spectra measurements
obtained from an ultra-miniature cylindrical counter 0.5 mm in length × 0.5 mm in
diameter operating at 4.2 Torr and simulating a 5 nm diameter unit density volume. The
successful operation of such a counter is not well predicted by current theories of
electron multiplication in gases that may be more due to the inadequacies of theory as
opposed to experimental limitations. More research is required to understand the
behavior and possible spectrum quality issues associated with such a counter.
Note, that apart from these design restrictions a more fundamental limit [24, 25] on the
minimum site size also exists due to the fact that the unit of measurement is ionizations
and that excitations are not detectable. Single ionizations in tissue equivalent gas are
equivalent to a mean energy deposition of 30 eV. At site diameters less than about 0.3
Chapter 2: Literature Review Page 14
14
µm, errors in the conversion to energy may be quite large due to the small number of
ionizations produced by individual low LET tracks with average energy below 30 eV.
2.3.1.2 Performance of Proportional Counters: Uncertainties and Limitations
The following discusses the important effects that create errors in the experimental
measurements performed by proportional counters. Many of the significant sources of
error have been listed in ICRU 36 [11] with a notable systematic study also given by
Lindborg [26].
Wall Effects: Even if the wall and TE gas have the same atomic composition
distortions in the microdosimetric spectra may occur due to density differences and the
effect of the non-rectilinear particle traversals. The so-called wall effects are due to the
scattering of particles and the production of secondary and tertiary particles. This leads
to an increase in energy imparted by superposition of energy deposition events that
would not simultaneously occur in a medium of uniform density. Rossi [27] was the
first to suggest such effects with a detailed theoretical treatment subsequently given by
Kellerer [2, 28]. Wall effects are classified into four types as depicted in Figure 2.3 and
described as follows:
1. Delta-Ray Effect: A primary particle enters the cavity along with one of its delta
rays. However, the distance between the particles is such that only one particle
would enter the real tissue volume in the case of uniform density. This effect is most
significant for high energy heavy charged particles (significant delta ray production)
or for high energy electrons (delta ray and electron may have comparable energies).
For heavy charge particles, the energy deposited by the delta ray is much less than
the primary particle and hence yD is much less affected than yF . Kellerer [2]
estimated that for protons of energies above 5 MeV the frequency of double events
is about 15% in 1 µm site sizes. For electron energies less than 1 MeV this
frequency is less than 6% but the proportion increases at higher energies.
2. Re-entry Effect: An electron may re-enter the cavity after it has traversed it due to
its tortuous path. The points of entry and re-entry may be far enough apart that the
electron would not re-enter the high density microscopic volume. Only low energy
electrons (<1 MeV) have sufficient curvature to create this effect. For such
electrons, Kellerer [2] estimates about 20% of all energy deposition events will be
double events due to the re-entry of the primary electrons.
Chapter 2: Literature Review Page 15
15
3. V-Effect: The V-effect is similar to the delta ray effect except that the tracks are
formed from two heavy charged particles from a non-elastic nuclear interaction. The
two tracks make similar contributions and hence unlike the delta ray effect yD as
well as yF are substantially overestimated. Oldenburg [29] has performed Monte-
Carlo calculations which indicate that the V-effect is insignificant for neutrons up to
6 MeV but increases in importance above 10 MeV.
4. Scattering Effect: An uncharged primary particle produces two closely spaced
charged particles which both enter the cavity. In the real microscopic region, the two
particles may be sufficiently spaced that only one of the particles would enter the
sensitive volume. This effect is not well investigated although it may be considered
important for neutrons and photons that undergo multiple scattering.
a) Delta Ray Effect
c) V Effect
b) Re-entry Effect
d) Scattering EffectNotes: The meandering tracks represent electron traversal, straight lines are heavier particles. and dashedlines represent uncharged(neutron or photon) primary particles. High-density material is represented bythe shaded regions. Each type of wall effect has two diagrams: the left indicates behavior with a walledproportional gas counter and the right diagram illustrates the behavior in equivalent real tissue. In allcases the wall effect leads to an increase in energy imparted by superposition of energy deposition events(left diagrams) which would not occur simultaneously in a volume of uniform density (right diagrams).
Figure 2.3. Diagrams of the four types of wall effect in low pressure proportional counters
The wall-effect has motivated the development of “wall-less” counters of which two
different approaches have been taken [11, 30, 31]. The first approach uses electric field
lines, circumscribed by small field shaping electrodes, to define the collecting boundary.
The main disadvantages of the field defined counter are poor boundary definition due to
slight variations in the field and the extreme care required in set up adjustment. A
second approach is to delineate the boundary using a fine material grid such that the
amount of solid at the boundary is small. Although such a counter has a well defined
Chapter 2: Literature Review Page 16
16
boundary and is relatively easy to use it has the disadvantage of not being truly wall-
less. Finally, for all wall-less counters particular care should be taken to ensure that the
container in which the counter is placed does not disturb radiation equilibrium [2].
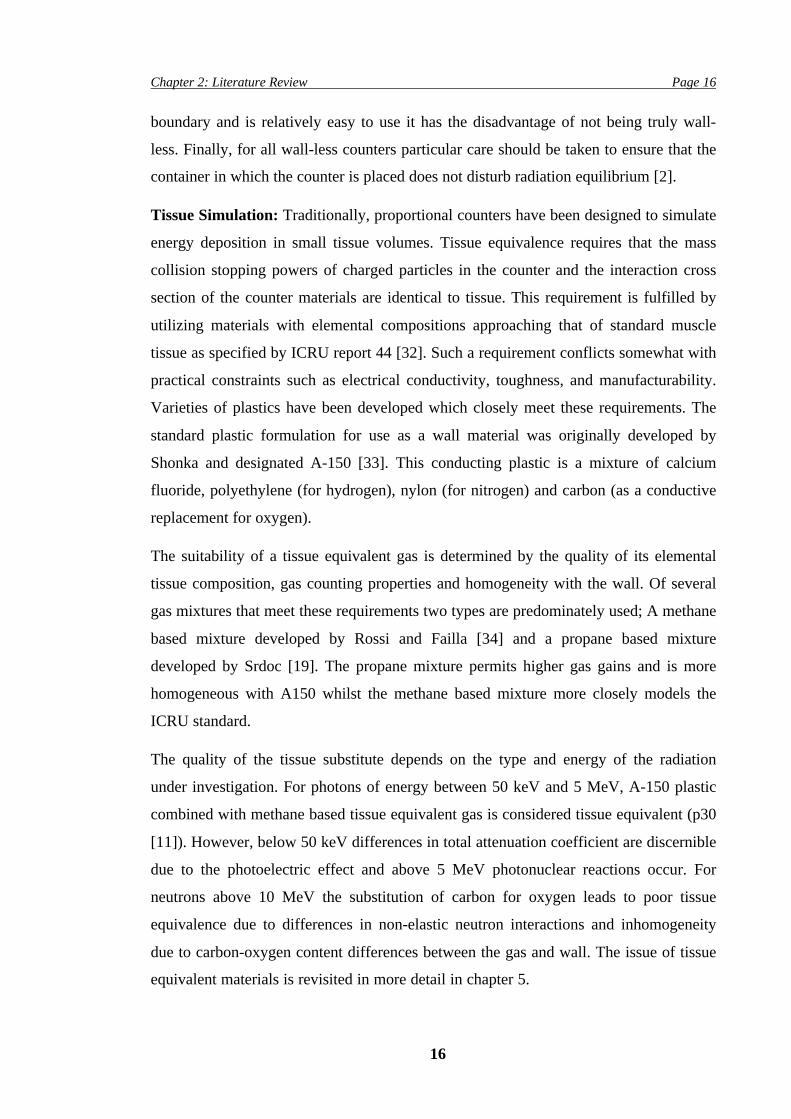
Tissue Simulation: Traditionally, proportional counters have been designed to simulate
energy deposition in small tissue volumes. Tissue equivalence requires that the mass
collision stopping powers of charged particles in the counter and the interaction cross
section of the counter materials are identical to tissue. This requirement is fulfilled by
utilizing materials with elemental compositions approaching that of standard muscle
tissue as specified by ICRU report 44 [32]. Such a requirement conflicts somewhat with
practical constraints such as electrical conductivity, toughness, and manufacturability.
Varieties of plastics have been developed which closely meet these requirements. The
standard plastic formulation for use as a wall material was originally developed by
Shonka and designated A-150 [33]. This conducting plastic is a mixture of calcium
fluoride, polyethylene (for hydrogen), nylon (for nitrogen) and carbon (as a conductive
replacement for oxygen).
The suitability of a tissue equivalent gas is determined by the quality of its elemental
tissue composition, gas counting properties and homogeneity with the wall. Of several
gas mixtures that meet these requirements two types are predominately used; A methane
based mixture developed by Rossi and Failla [34] and a propane based mixture
developed by Srdoc [19]. The propane mixture permits higher gas gains and is more
homogeneous with A150 whilst the methane based mixture more closely models the
ICRU standard.
The quality of the tissue substitute depends on the type and energy of the radiation
under investigation. For photons of energy between 50 keV and 5 MeV, A-150 plastic
combined with methane based tissue equivalent gas is considered tissue equivalent (p30
[11]). However, below 50 keV differences in total attenuation coefficient are discernible
due to the photoelectric effect and above 5 MeV photonuclear reactions occur. For
neutrons above 10 MeV the substitution of carbon for oxygen leads to poor tissue
equivalence due to differences in non-elastic neutron interactions and inhomogeneity
due to carbon-oxygen content differences between the gas and wall. The issue of tissue
equivalent materials is revisited in more detail in chapter 5.
Chapter 2: Literature Review Page 17
17
Calibration: Generally, the proportional counter is calibrated by irradiating the detector
with a source of particles of known energy located near the inside surface of the counter
[1, 35]. For high LET radiation, an α-source (e.g. 244Cm, 210Po) is used whilst for low
energies, x-ray sources may be employed that emit accurately known Kα radiation that
is totally absorbed in the gas by photoelectric absorption. The source spectrum should
be fully characterized using a surface barrier detector since thick α sources may exhibit
significant spectral spread. For a spherical counter, the maximum of the gaussian pulse-
height distribution corresponds to the traversal of a particle across the diameter of the
sphere. One may then use the known range-energy relationship for the calibration ion to
determine the expected energy deposited. Calibration using an alpha particle source has
several sources of uncertainty including source alignment errors, energy degradation of
the alpha particle in the source and gain shifts frequently observed between calibration
and actual measurements [36, 37].
In the case of neutron or proton irradiation, another convenient method, which does not
involve calibration irradiation and removes many of the sources of uncertainty, is based
on the phenomenon known as the proton and alpha edge [1, 35]. Microdosimetric
spectra under neutron or proton irradiation generally exhibit a step in the spectrum
corresponding to the maximum energy deposited by a proton near the end of its range,
in the Bragg peak LET region. Specifically, the lineal energy position of the edge, yedge,
is given by:
y E l
E d
edge =
=
δ
δmax
max
/
/ ( / )2 3 for spherical sensitive volume(2.13)
where δEmax denotes the maximum energy loss of particles traversing the diameter d.
The quantity δEmax is obtained by solving the implicit relation
R E R E E di i( ) ( )− − =δ and determining the maximum of δE by varying the initial
energy Ei where R(E) is the particle range-energy relationship. The maximum LET of
protons in tissue is around 95 keV/µm (as seen in the Bragg curve) peaking at about 100
keV. Schrewe [37] calculates a proton edge yp-edge = 136 keV/µm and alpha edge yα-edge
= 395 keV/µm for a typical 2 µm spherical TEPC. Pihet et.al. [36] have estimated an
uncertainty of 2% each for the estimation of the proton edge position and the stopping
power of protons at the edge. In practice, the proton and alpha edges are spread
Chapter 2: Literature Review Page 18
18
somewhat due to energy and range straggling and the presence of heavier recoil
products that produce events at a lineal energy above and around the edges.
Mean Energy Required per Ion Pair (W): W is the average energy required to
generate an electron-ion pair and is frequently needed for calculations related to dose,
noise, resolution and sensitivity. For most tissue equivalent gases, W is between 33 and
30 eV (p 88 [1] and [38, 39]). W is known to vary weakly with particle type and energy.
For example, Goodman and Coyne [40] have shown that the W in a tissue equivalent
methane gas mixture decreases from 32.8 to 31 eV as the energy of the neutrons
increases from 0.l1 to 20 MeV. W is largely constant for high particle velocities but
increases when the particle velocity becomes comparable to the orbital atomic electrons
of the gas. Thus, W increases with particle mass (for a given energy) and decreases with
particle energy (for a given mass). The uncertainty in W limits the accuracy of the
proportional counter in measuring the energy absorbed to around 5% (p 88 [1]).
However, one should note that the number of ions generated may well be a better metric
for radiobiological efficacy.
Electronics and Sensitivity: The systems required for experimental microdosimetry
measurements are shown in the spectroscopy setup of Figure 2.4. The most important
component in terms of system noise is the preamplifier. The preamplifier noise is
usually specified as the RMS (Root Mean Square) of the number of electrons referred to
the preamplifier input. Modern preamplifiers typically have an RMS noise of 400
electrons although by integrating the preamplifier input FET into the counter design,
preamplifier noise levels of 100 electrons RMS are achievable [41].
The minimum detection threshold (or Lower Level Discriminator (LLD) setting) of the
multi-channel analyzer should generally be set to about 5 times the RMS noise to
eliminate the recording of noise counts (p113 [1]). This "rule of thumb" is applicable to
both proportional counters and semiconductor detectors. However, an LLD up to 10
times the RMS noise may be required if a low count rate is expected near the LLD
energy.
Thus, for a proportional counter the minimum detectable energy Em is given by:
Ee W
gmrms≈ 5 (2.14)
Chapter 2: Literature Review Page 19
19
where W is the average energy required to generate an electron-ion pair ~ 30 eV, g is the
gas avalanche gain and erms is the system electronic noise referred to the preamplifier
input. Typical values are W = 30 eV, g = 104, and erms = 400 giving an Em = 6 eV which
is less than the ionization energy for a single ion pair.
However, in order to measure single ions at the anode consideration must also be given
to the distribution in charge collected from individual avalanches due to the distances
covered between the ionizing collisions of electrons [42]. The spectrum for single
electrons is well approximated by a Polya distribution. To ensure all counts are
registered the average signal for a single ion-pair should be about 10 times as large as
Em [19]. That is, 10 Em = W, which using equation (2.14) means that the gas gain must
be 50 times the electronic noise erms or around 20000 using typical preamplifiers. Such a
gas gain is not always achievable, depending on the counter design, and it is desirable to
use methods mentioned previously to reduce preamplifier noise. For a given design, gas
gain is varied by adjusting the high voltage (500-5000 V) supply. In summary, in order
to measure the collection of single ions at the anode, the preamplifier noise should be as
low as possible and the gas gain should be high.
Multi-Channel Analyzer
ADCandLLD
PulseHeight
Analyser
ShapingAmplifier
f(y)
y
AccumulatedPulse HeightSpectrum
HighVoltageSupply
Preamplifier
Detector
GasSupplySystem
Oscilloscope
Pulse Height
Figure 2.4. Setup required for experimental microdosimetry. With a proportional counter the gassystem and high voltage supply are used. For a semiconductor microdosimeter detector the supplymay often be low voltage and the gas system is not required. (LLD = lower level discriminator,ADC = Analog to Digital converter)
Chapter 2: Literature Review Page 20
20
To optimize noise, a shaping amplifier is included in the spectroscopy experimental
setup of Figure 2.4. A time constant of 0.1 µs is often employed for proportional
counters which imposes a maximum count rate of 104-105 cps for most applications [1].
Noise optimization and shaping amplifier considerations are discussed in detail in
chapter 4. The output of the shaping amplifier should be monitored with an oscilloscope
to ensure correct pulse shaping (pole-zero adjustment) and no evidence of signal pile-
up. The acquisition of the entire lineal energy spectra using the multi-channel analyzer
may require two separate acquisitions with different amplifier gain settings due to the
large dynamic range of the energy deposited. The two spectra may then simply be
merged.
Energy Resolution: Given microdosimetric events of equal magnitude, the proportional
counter will measure a range of energies deposited due to various statistical
fluctuations. The resolution of a detector is defined as:
REFWHM
E(%) .= 2 35 100σ
(2.15)
where σ E E/ is the relative standard deviation of the distribution of energy collected.
Two classes of fluctuations contribute to the distribution:
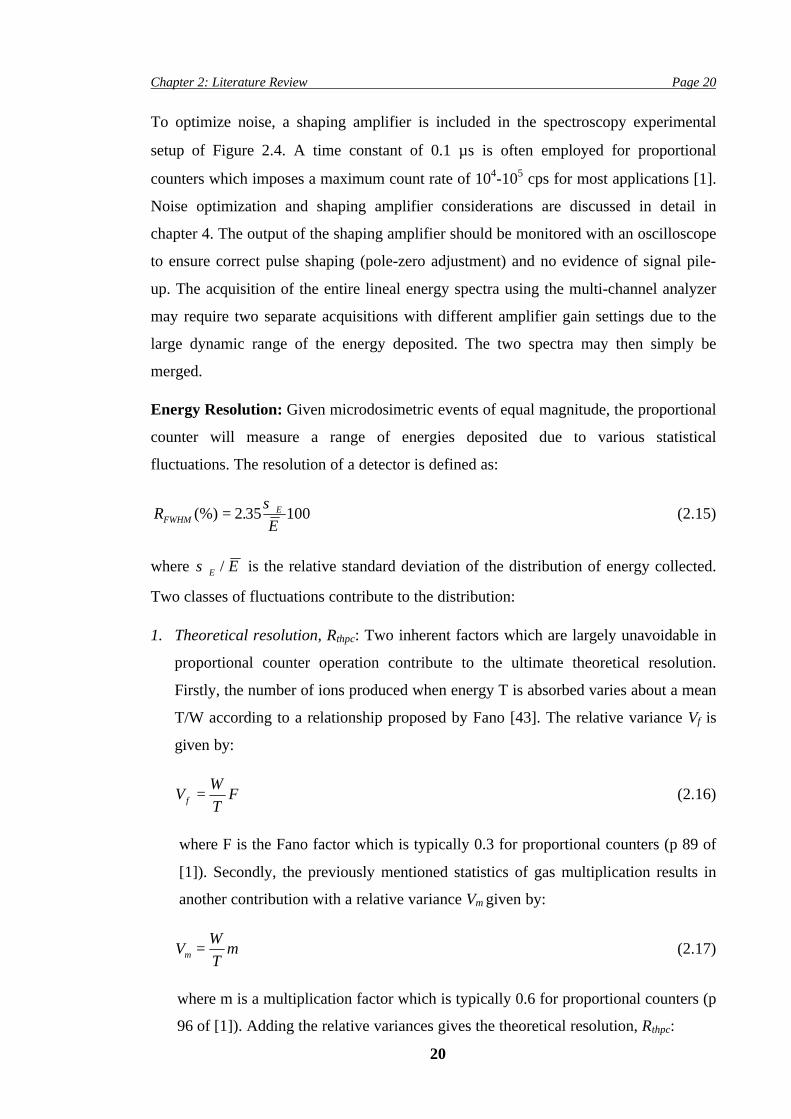
1. Theoretical resolution, Rthpc: Two inherent factors which are largely unavoidable in
proportional counter operation contribute to the ultimate theoretical resolution.
Firstly, the number of ions produced when energy T is absorbed varies about a mean
T/W according to a relationship proposed by Fano [43]. The relative variance Vf is
given by:
VW
TFf = (2.16)
where F is the Fano factor which is typically 0.3 for proportional counters (p 89 of
[1]). Secondly, the previously mentioned statistics of gas multiplication results in
another contribution with a relative variance Vm given by:
VW
Tmm = (2.17)
where m is a multiplication factor which is typically 0.6 for proportional counters (p
96 of [1]). Adding the relative variances gives the theoretical resolution, Rthpc:
Chapter 2: Literature Review Page 21
21
RW
TF mthpc (%) .= +2 35 100 (2.18)
2. Instrumentation Resolution, Rinstpc: Resolution is affected by imperfections in the
counter design including preamplifier noise and variations in counter voltage, gas
pressure and electric field uniformity. These contributions are typically less than
10% of the theoretical resolution. Note that the preamplifier noise, erms, must be
corrected for the gas gain, g, to determine the contribution to resolution. Denoting
non-preamplifier instrument resolution as Rrest, the instrumentation resolution may
be expressed as:
RW
T
e
gRinstpc
rmsrest(%) .=
FHG
IKJ +2 35 100
2
2 (2.19)
Combining equations (2.18) and (2.19) gives the estimated resolution Rpc:
R R R
W
TF m
W
T
e
gR
pc thpc instpc
rmsrest
= +
= + +FHG
IKJ +
2 2
2
22 35 100.(2.20)
In summary, the dominant factor in the resolution is the gas multiplication variation.
The instrumentation resolution is a minor contribution.
2.3.2 Semiconductor (Silicon) Microdosimetry
2.3.2.1 Basic Principles of Semiconductor Detectors
There are many references devoted to the physics of semiconductors. The following
section is based on books by Sze [44], and Knoll [23] with the specific goal of
providing a brief and basic framework for understanding the operation, capabilities and
characteristics of silicon based radiation detectors. Note that the most common
semiconductor material for room temperature radiation detection is silicon so the
ensuing discussion will use silicon in all examples.
The usefulness of semiconductors as circuit elements and for radiation measurement
stems from the special properties created at a junction where n and p type
semiconductors are brought into good thermodynamic contact. To ensure excellent
contact, the junction is created by ion-implantation or diffusion of appropriate dopants
in a single crystal. These techniques and subsequent processing can create a variety of
Chapter 2: Literature Review Page 22
22
doping profiles that affect the device characteristics. A useful approximation in many
applications is the abrupt junction, which will be reviewed briefly.
Consider the n+-p junction shown in Figure 2.5 where the type change at the junction is
taken to be a step function from a heavily doped n region to a lightly doped p region.
The Fermi level (EF) in the energy band diagram reflects the high concentration of
electrons in the n+ region and the high concentration of holes in the p region. When the
junction is first formed large carrier concentration gradients at the junction cause carrier
diffusion. Holes from the p-side diffuse into the n-side leaving behind uncompensated
negative acceptor ions (NA-) and similarly electrons from the n-side diffuse into the p-
side leaving behind uncompensated positive donor ions (ND+). Note that the acceptors
and donors are fixed in the semiconductor lattice while the holes and electrons are
mobile. The result of this movement is the formation of a negative space charge on the
p-side and a positive space charge on the n-side. The space charge region creates an
electric field directed from the n to the p-side that results in a carrier drift current
opposing the diffusion currents. Thus, at thermal equilibrium (i.e. no bias applied,
steady state condition with no external excitation) the net current flow across the
junction is zero.
The space charge region is also called the depletion region due to the very low mobile
carrier density. This region acts, like a high resistivity parallel-plate ionization chamber
making it feasible to use for radiation detection. The electric field separates electron-
hole pairs formed by ionizing radiation and collects the carriers via drift. The rapid
movement of carriers in the electric field generates a current pulse at the device
electrodes. By applying, a reverse bias to the n+-p junction, the charge collection
capabilities of the device may be improved. The presence of an external electric field in
the same direction as the depletion region field (i.e. reverse bias) will cause additional
majority carriers to vacate the junction region leaving more uncompensated impurities
and thus expanding the depletion region. This effect is seen in Figure 2.5 where the
space charge distribution, electric field distribution, potential distribution and band
diagram are depicted for zero and 10 V reverse bias. The device selected has parameters
similar to the prototype silicon microdosimeter used in this work and described in
chapter 4.
Chapter 2: Literature Review Page 23
23
pn+depletionregion
Vbias=0V
pn+depletionregion
Vbias=10V
-1 1 2 3 4x HmmL
SpaceChargeHND -NAL
-NA =1.5x1015 cm-3
ND =1019 cm-3
= -ed2 Vdx2
-1 1 2 3 4x HmmL
SpaceChargeHND -NAL
-1 1 2 3 4x HmmL
SpaceChargeHND -NA L
-NA =1.5x1015 cm-3
ND =1019 cm-3
= -ed2 Vdx2
-1 1 2 3 4x HmmL
SpaceChargeHND -NA L
-1 1 2 3 4x HmmL
Electric Field=-dVdx
∂m =20700.Vêcm
-1 1 2 3 4x HmmL
Electric Field=-dVdx
-1 1 2 3 4x HmmL
Electric Field=-dVdx
∂m =70700.Vêcm
-1 1 2 3 4x HmmL
Electric Field=-dVdx
-1 1 2 3 4x H mmL
0.2
0.4
0.6
0.8
ElectrostaticPotential HVL
Vbi
-1 1 2 3 4x H mmL
0.2
0.4
0.6
0.8
ElectrostaticPotential HVL
-1 1 2 3 4x HmmL2
4
6
8
10
ElectrostaticPotential HVL
Vbi+Vbias
-1 1 2 3 4x HmmL2
4
6
8
10
ElectrostaticPotential HVL
-1 1 2 3 4x HmmL
-0.5
0.5
1
1.5
2
Electron PotentialBarrier HeVL
EC
EV
EF
-1 1 2 3 4x HmmL
-0.5
0.5
1
1.5
2
Electron PotentialBarrier HeVL
-1 1 2 3 4x HmmL2
4
6
8
10
12
Electron PotentialBarrier HeVL
EC
EV
EF
-1 1 2 3 4x HmmL2
4
6
8
10
12
Electron PotentialBarrier HeVL
Figure 2.5. A schematic diagram of an abrupt p-n junction including the space charge density,electric field intensity, electrostatic potential and band diagram. The familiar band diagram(showing Fermi energy EF, conduction EC and valence bands EV) may be thought of as the electronpotential barrier. The left side shows plots for thermal equilibrium conditions with no bias voltageapplied whilst the right hand side shows the same plots for a bias voltage of 10 V. The valuesselected to construct these graphs correspond to the silicon microdosimeter prototype (p dopingNa=1.5 ×× 1015/cm3, n doping Nd=2 ×× 1020/cm3, effective density of states in valence band NV =1.04 ××1019/cm3, effective density of states in conduction band NC =2.8 ×× 1019/cm3, T = 300 K).
Chapter 2: Literature Review Page 24
24
The equations used in the figures apply to a one-sided abrupt junction and are readily
available in many texts such as Sze [44]. The key starting equation is Poisson's equation
defined for the one-dimensional case as:
d V
dx s
2
2 = −ρε
(2.21)
where V is the electrostatic potential, εs is the semiconductor dielectric permittivity and
the ρ is the space charge density given by the sum of the charge carrier densities and the
ionized impurity concentrations. That is,
ρ = − + −+ −q p n N ND A( ) (2.22)
In the depletion region, ρ = −+ −q N ND A( ) since there are no free carriers. Equation
(2.21) may be solved for the electric field intensity and electrostatic potential given
appropriate boundary conditions. Some useful results are now presented for the
depletion region width, built in potential and maximum electric field intensity.
The depletion region width W [44] for a one sided abrupt junction is:
WV V
qNs bi
B
=−2ε ( )
(2.23)
where V is the reverse bias, Vbi is the built-in potential, q is the electron charge and NB
is the substrate doping concentration (= NA in our example).
The built-in potential Vbi is given by [44]:
VkT
q
N N
nbiA D
i
=FHG
IKJln
2(2.24)
where k is Boltzmann's constant (=1.38066 × 10⁻²³ J/K), T = temperature (K), q =
electron charge, NA is the acceptor (p) doping concentration and ND is the donor (n)
doping concentration.
The maximum electric field strength εmax is given by [44]:
εεmax =
qN WB
s
(2.25)
Chapter 2: Literature Review Page 25
25
Equations (2.21) through to (2.25) were applied in the construction of Figure 2.5 and
will prove useful at various junctures in this work.
2.3.2.2 Performance of Silicon Microdosimeter
Many performance issues are discussed throughout this work. Given these detailed
discussions, this section will summarize the performance to facilitate a comparison with
the proportional counter provided in section 2.3.4.
Sensitive Volume Definition: In most attempts at silicon microdosimetry, particularly
using existing commercial memory devices, the sensitive volume is poorly defined. This
is an important problem in silicon microdosimetry that will be addressed in this work.
Charge collection does not simply occur via drift in the depletion region. Diffusion from
outside of the depletion region may be a significant contribution to charge collection.
Further complicating matters is the funneling phenomenon associated with depletion
region collapse following the injection of high carrier concentrations in the device.
Clearly, the generation of ion tracks and evolution of the charge collection process are
complex phenomenon and will be described in detail in section 6.1.
Radiation Hardness: High-energy radiation produces defect complexes in
semiconductor materials which reduce minority carrier lifetime, change majority carrier
density and reduce mobility. All of these effects reduce charge collection efficiency
effectively altering the sensitive volume size. Radiation damage effects on silicon
devices is discussed in detail in section 6.3.
Tissue Equivalence: The difficult issue of tissue equivalence in silicon
microdosimeters is the subject of chapter 5. Silicon microdosimeters require a tissue
equivalent converter on top of the device. Ideally, detected interactions should arise
exclusively from events originating in the medium surrounding the detector (referred to
for the remainder of this work as the converter). Therefore, the device should have a
small overlayer thickness and the sensitive volume should be as small as possible to
enhance crosser type particles and reduce direct nuclear interactions with silicon. In
chapter 5 it will be shown that, assuming identical secondary charged particle spectra,
the microdosimetric spectrum will be closely equivalent in a silicon volume and a tissue
volume if the dimensions of the silicon volume are scaled by a factor of 0.63. The
reader is referred to chapter 5 for more detailed analysis of tissue equivalence issues.
Chapter 2: Literature Review Page 26
26
Mean Energy Required per Electron-Hole Pair (W): At room temperature the mean
energy per electron-hole pair is 3.62 eV based on alpha particle measurements (p 348
[23]). This is about 10 times lower than for the proportional counter with positive
implications for resolution as will be discussed below. The value of W varies with
particle type and energy in a similar manner to TE gases. Differences as large as 2.2%
have been observed between proton and alpha particles with smaller differences for
other light ions and electrons [45]. The value of W is significantly higher for heavy ions
and fission fragments than for alpha particle excitation leading to a lower than
anticipated energy collected. This effect arises because as the velocity of heavy ions
decreases the probability of losing energy via nuclear collisions rather than electronic
collisions becomes significant. Wilkins (p 374 [23] from [46]) demonstrates, by
irradiating a silicon surface barrier detector with (He, C, S, Ni, Ag, Au and U) ions, that
pulse height versus ion energy does not deviate from linearity when using the He, C and
S ions and pulse height deficits are seen for the remaining heavier ions. In this study we
will mostly be concerned with ions of atomic weight less than S and W = 3.62 eV is a
reasonable assumption.
Electronics, Calibration and Sensitivity: The system required for silicon
microdosimetry measurements is similar to the proportional gas counter as shown in
Figure 2.4. Important exceptions are the removal of the gas system and the need for
only a low voltage supply (e.g. battery operated) in low resistivity silicon
microdosimeters. System calibration using known energy sources is easy and similar to
the proportional counter.
Again, the most important component in terms of system noise is the preamplifier. In
fact, the influence of the preamplifier noise is more significant in the silicon
microdosimeter because the device does not have any internal (or gas) gain. Thus, for a
silicon microdosimeter the minimum detectable energy Em is given by equation (2.14)
with g=1:
E e Wm rms≈ 5 (2.26)
For the silicon prototype microdosimeter used in this work erms ~ 600 electrons giving
Em = 10.8 keV.
All other electronic considerations discussed previously for the proportional counter
apply to the silicon microdosimeter since they share the same amplifier and MCA
Chapter 2: Literature Review Page 27
27
components. Noise optimization and shaping amplifier considerations for the silicon
microdosimeter will be discussed in detail in chapter 4.
Energy Resolution: The energy resolution of the silicon microdosimeter, like the
proportional counter, may be divided into two classes of fluctuations:
1. Theoretical resolution, Rthpc: The ultimate theoretical resolution for the silicon
device is better than the proportional counter for two reasons. Firstly, there is only
one component given by the Fano relationship (equation (2.16)) and secondly the
Fano factor is smaller for the silicon detector with a typical value of 0.1 employed
(p340 [23]). Thus the theoretical resolution, Rthis, is given by:
RW
TFthsi (%) .= 2 35 100 (2.27)
2. Instrumentation Resolution, Rinstpc: The primary component defining instrumentation
resolution is preamplifier noise. This is a more significant contribution to overall
resolution than for the proportional counter since erms, is not divided by a gas gain
factor in the expression for resolution. Thus, the instrumentation resolution may be
expressed as:
RW
Teinstsi rms(%) .= 2 35 100 (2.28)
Combining equations (2.27) and (2.28) gives the estimated resolution Rsi:
R R R
W
TF
W
Te
si thsi instsi
rms
= +
= + FHG
IKJ
2 2
2
2 35 100.(2.29)
At low energies (T) the preamplifier noise dominants whilst at high energies the Fano
factor defines the resolution. The sensitivity and resolution of the silicon detector will
be compared further in section 2.3.4.
2.3.2.3 Review of Semiconductors in Microdosimetry
Research on the development of semiconductor based microdosimetry may be classified
into two general device types; single p-n junction diodes and p-n junction arrays based
on commercial memory or charge coupled devices:
Chapter 2: Literature Review Page 28
28
1) Single Diode Devices: The first (and most detailed to date) comparison of
microdosimetric measurements between a spherical proportional counter and a single
junction solid-state detector was made by Dicello [47] in 1980. Microdosimetric
spectra for range-modulated negative pion beams (momentum=167 MeV/c) were made
using a 1.3 cm spherical proportional counter with a simulated diameter of 2 µm and a 7
µm thick, 0.1 cm radius lithium drifted silicon detector.
Pions, as heavy charged particles, exhibit a Bragg-type depth dose distribution which is
enhanced around the Bragg peak by the process of star formation arising from nuclear
absorption of the pions and subsequent nuclear fragmentation. The secondary products
from pion star formation consist of an isotropic emission of light and heavy ions from
the fragmented nucleus along with neutrons and γ-rays. Experimental microdosimetry is
a useful tool for analyzing the complex secondary particle distribution in pion beams.
For this type of beam, Dicello [47] found significant differences between the
microdosimetric spectra obtained by the two detectors. Monte Carlo calculations
demonstrated that the differences were largely attributable to the relatively large
sensitive thickness of the silicon detector, that permitted a significant fraction of heavy
ion stoppers, and the large diameter that permits large chord lengths. Events at large
chord lengths although improbable deposit a high energy and may contribute
substantially to the total dose. Moreover, low LET particles such as protons may
erroneously produce events that contribute to the high lineal energy component of dose.
Despite these difficulties, Dicello [47] acknowledged the potential for silicon
microdosimetry due to its high spatial resolution, in-vivo capability and pile-up
robustness.
The silicon device is advantageous in beams with high instantaneous count rates since
the small area of the silicon detector and the higher noise cut-off reduce pile-up
problems. The primary proton beam had a time structure of 120 pulses per second and a
duty factor of 7.5%. Dicello [47] found the silicon detector was capable of
measurements at full therapeutic beam intensity whilst the proportional counter
measurements were complicated by a need to reduce beam intensity.
Later work by Dicello in 1986 [48, 49] focussed on the application of experimental
microdosimetry to single event upset studies in silicon. Dicello designed a silicon
walled proportional counter to study the energy deposition of pions and muons in
Chapter 2: Literature Review Page 29
29
simulated 1 µm silicon site sizes. This work was directed towards the study of cosmic
radiation induced single event upset since pions and muons are present in the
atmospheric cosmic radiation spectrum
Other attempts at creating silicon microdosimeters using single diodes include the work
of Orlic in 1989 [50] and later Kadachi in 1994 and onwards [51, 52]. Both efforts were
directed towards radiation protection applications that may benefit from the silicon
microdosimeters simplicity and portability. Orlic [50] used a silicon photodiode biased
at zero voltage, to give an estimated sensitive thickness of 5 µm, and with a thick
polyethylene converter mounted in front of the detector. A spectrum using a 252Cf
neutron-gamma source was obtained that distinguished the gamma and neutron
microdosimetric spectrum. Kadachi [51] extended this work by comparing the response
of a silicon PIN photodiode (sensitive depth ~ 8 µm at zero voltage, 13 mm2 area) and a
tissue equivalent proportional counter (TEPC) of 1 µm simulated diameter. The
converter for the PIN diode was made by melting wax onto the diode surface.
Measurements on both devices were performed during irradiation by an americium-
beryllium neutron source. The dose mean lineal energy, yD , was found to be 52.1
keV/µm using the PIN diode and 67.5 keV/µm for the TEPC with the large difference
attributable to the different sensitive volume size and the large path length of recoil
protons in the PIN diode. These differences were also evident in the microdosimetric
spectra for similar reasons.
Additional comparisons were later made by Kadachi [52] using a variety of silicon
photodiodes (p-n, PIN and pnn) and sensitive depths (1,3,5 and 8 µm). The photodiodes
were assembled with polyethylene and A-150 TE plastic converters. The effective
quality factor, Q , for irradiation using an Am-Be source was determined from the
lineal energy spectra. For a TEPC, Q is given by:
Q Q L d L dL= z 60 ( ) ( ) (2.30)
where Q60(L) is the quality factor function given in ICRP report 60 [53] and d(L) is the
normalized dose distribution. Kadachi assumes that the linear energy transfer L is equal
to lineal energy y. For the silicon photodiodes, the computation of Q required two
types of correction:
Chapter 2: Literature Review Page 30
30
Q Q L C L d L C L dLs Q s s d s s= z 60 ( ) ( ) ( ) ( ) (2.31)
where L is the LET of silicon and CQ(Ls) is a correction factor for the quality factor due
to the difference in LET of water and silicon and CQ(Ls) is the ratio of the fractional
relative dose of the converter and silicon. CQ(Ls) was taken by Kadachi to be
approximately given by the ratio of the converter to silicon density. The effective
quality factor was calculated as 7.9 for the Am-Be source using the TEPC and 8.1 using
the 1 µm photodiode (p-n) which is quite a good comparison despite the significant
spectral differences previously noted. For other applications such as yD determination,
the large area photodiode suffers from the problems identified by Dicello [47], namely,
a chord length distribution which differs greatly from the proportional counter due to its
large area. Furthermore, the sensitive volume of the device is not accurately defined due
to the complexity of the charge collection process that includes diffusion and funnel
assisted phenomenon (see section 6.1).
2) Arrayed Diode Devices: In 1983, Bradford [4] had clearly recognized the close
correlation between radiation effects on microelectronics and radiobiological
microdosimetry in a paper entitled "Microelectronic analogues to radiobiological
microdosimetry". Single event upset phenomenon resulting from charge collection at a
reverse biased node in the memory cell is analogous to biological cell death. Based on
the detection ability of memory devices, due to the single event upset phenomenon,
several researchers have pursued the idea of using dynamic random access memory
(DRAM) circuits as neutron radiation dosimeters. Davis [54] experimented with the
thermal neutron response of 16 Kbit DRAMs covered with 6Li and 10B converters.
Similar experiments were also performed by other researchers using different DRAM
devices [55-57]. In all these detection systems, a digital output is read from the DRAM
and events are simply counted.
However, Abdel-Kader and McNulty [58] in 1987 proposed that the power supply lines
of commercial memory devices may be connected to spectroscopic acquisition systems
to record the energy deposited by events in reverse biased junctions within the device.
Simplistically, a memory cell consists of two transistors in an on (conducting) state and
two in a off state (non-conducting). A non-conducting transistor has a reverse-biased p-
n junction which is connected via a conducting transistor to the power or ground line of
the memory device. When configured with a spectroscopic system connected to the
Chapter 2: Literature Review Page 31
31
power line, the device is essentially a radiation detector having a large array of p-n
junction cells.
Irradiation with known energy sources is useful for characterizing the sensitive volume
dimensions and charge collection regions [58-60]. This technique was further refined by
the development of ion beam induced charge collection (IBICC) first performed on
microcircuits by Breese [61] in 1992. Sexton [62] provides an excellent review of this
subject. Briefly, a narrow (<1 µm) ion beam is magnetically scanned across the device
and the charge collected is recorded along with the spatial position of the beam. The
location, area and charge collection efficiency of the sensitive volume may then be
determined more accurately then by using the broadbeam spectroscopy method (see
section 6.2.3).
Roth and McNulty [63, 64] developed a silicon microdosimeter based on memory
devices (993L422, 1 KByte) using the principle of power line spectroscopy. The system
was intended for biological and electronic radiation monitoring in spacecraft and
avionics. An important difference from previous systems is that it used an array of
micro-volumes rather than one large detector. Unfortunately, the system was never
flight-tested. Stassinopoulos [65] has recently developed a similar system that is
undergoing flight-testing. The system uses a 32K × 8 SRAM with no applied bias and
an estimated sensitive volume depth of 14 µm.
In 1994, Schroder [66-69] applied commercial memory devices to radiation protection
applications such as personal neutron dosimetry. Schroder mainly selected radiation
hardened memory devices (such as Harris HS6504RH, 4 Kbit) for two important
reasons. Firstly, these devices provide designs that are more resistant to radiation
damage such as oxide charge build-up (see section 6.3). Secondly, the sensitive volume
depth is limited by a high p-doped region below the p-n junction that provides a
potential barrier for minority carriers and limits the charge collection from deeper in the
substrate. Schroder [68] tested a 4 Kbit radiation hard device with a 2 mm A150 TE
converter separated from the device by a 2 mm air-gap and a 64 Kbit non-radiation hard
device with a 100 µm thick polyamide layer directly coating the device. The sensitive
depth and overlayer thickness were estimated using spectroscopy methods as (1.9 µm,
3.5 µm) for the 4 Kbit device [66] and (3.4 µm, 2 µm) for the 64 Kbit device [68].
Comparisons with a 1 µm simulated diameter TEPC in a 5.3 MeV mean energy neutron
Chapter 2: Literature Review Page 32
32
field (cyclotron) were poor due to deficiencies in the memory device including an ill-
defined sensitive volume, large overlayers that prevented heavy ion recoils from
reaching the sensitive volume and little consideration to tissue equivalence corrections.
The non-radiation hardened device exhibited spectral shifts during irradiation attributed
to radiation damage effects.
Schroder [66] along with Pace [70] recognized the possibility of using charge coupled
devices (CCD) for radiation protection microdosimetry. The disadvantages of this
device are the need for readout control circuitry, the possibility of multiple hits in a
single cell before cell readout, and the poor sensitive volume definition. For radiation
protection applications, these problems are not as severe as for other applications such
as radiotherapy.
Clearly, the recurring major problem in applying commercial memory devices and
photodiodes to microdosimetry is the poorly defined sensitive volume compounded by
the unwillingness of manufacturers to provide important device construction
information. Buried wells are not completely effective at preventing charge collection
from outside of the depletion region particularly for high LET particles due to the high
charge density exceeding the doping density of such wells. As mentioned earlier,
diffusion and funneling severely complicate the charge collection process. Schroder
[67] attempted to reduce the effect of diffusion by adding a coupling capacitor
following the detector that removed the slower time profile associated with diffusive
charge collection. This idea is helpful but nevertheless very imprecise.
Schroder [68] concluded his work with a set of design rules for an optimized
semiconductor chip to be used for personal neutron dosimetry. The rules are shown
below in Table 2.1. These rules are not exhaustive and not thoroughly justified in the
Schroder's paper [68]. This work intends to address the issue of formulating design rules
and requirements for silicon microdosimetry.
Table 2.1. Design rules for radiation protection microdosimetry as given by Schroder [68]
Optimization of Design Criterion
Small diode with l lmax / ≤ 3
where lmax = maximum chord length and l = MCL
Fundamentalmicrodosimetric requirement
Array of diodes with area of a few cm2, radiationhardened SiO2 passivation layer
Efficiency
Minimized SiO2 thickness, simplified electronics ThresholdTE converter on top of the chip Tissue Equivalence
Chapter 2: Literature Review Page 33
33
Finally, the concept of simultaneous macro and microdosimetry using a MOSFET was
introduced by Rosenfeld in 1996 [71]. For macrodosimetry, the total dose was measured
using threshold voltage changes arising from radiation-induced buildup of gate oxide
charge. Simultaneously, the reverse-biased drain junction may be used for
microdosimetry. Thus, silicon microdosimetry offers the possibility of integrating
multiple detector types along with preamplifiers and processing circuitry onto a single
small device.
2.3.3 Other methodsFor completeness, a few less commonly used experimental microdosimetry methods are
briefly described in the following. All the methods, except for microstrip gas counters,
are directed at providing more detailed track information than is available using site
based detectors such as the TEPC and silicon diode detectors. Recent useful reviews of
detector developments are provided by Bartlett [72] and Barthe [73]. These reviews
concentrate on neutron personal dosemeters which often use microdosimeter type
detectors.
2.3.3.1 Microstrip Gas Counters (MSGC)
MSGCs are similar to multiwire proportional chambers except that the wires have been
replaced by alternating anode and cathode strips formed on a supporting substrate. A
drift electrode ~1-4 mm above the substrate (maintained at the same potential as the
cathode) defines the gas volume. These devices are in the early stages of development
for microdosimetry having been invented in 1988 by Oed [74]. The principle features of
MSGCs of value to experimental microdosimetry are high count rate capability and high
spatial resolution [75, 76]. Like the silicon microdosimeter, the tissue equivalence of
the device materials (such as substrate) and the effect of the RPP device geometry on
microdosimetric spectra need to be evaluated. Thus, some of the work presented in this
thesis may have value in the development of MSGCs.
2.3.3.2 Cloud Chambers
Low-pressure cloud chambers have been employed in the study of track structures [77-
79]. A three dimensional pattern of droplets created by individual ionizations may be
resolved and stereoscopically photographed [79]. Cloud chamber dosimetry provides
rich detail on the location of individual ionizations within the gas. However, it is a
difficult process generally restricted to the research domain.
Chapter 2: Literature Review Page 34
34
2.3.3.3 Optical Ionization Chamber
The three dimensional distribution of individual ionizations with a gas may also be
determined using an optical ionization chamber proposed by Turner [80]. The electrons
in the particle track are made to oscillate rapidly by the application of an external, short
duration, high-voltage electric field. The excited electrons produce additional ionization
and electronic excitation of the gas molecules in their immediate vicinity leading to
copious light emission (fluorescence) from the gas allowing the location of the electrons
to be determined. Two digital cameras perpendicular to one another record the light
emission. Turner [80] predicts a resolution capability of ~10 nm, based on a position
uncertainty of ~1mm at a gas pressure of 5 torr. This may prove a useful tool in the
emerging field of nanodosimetry as well as for track structure analysis.
2.3.3.4 Autoradiography
Experimental microdosimetry has been criticized for using detector shapes which may
not be representative of the real tissue. This problem is particularly manifest in boron
neutron capture therapy where traditional microdosimetry fails to represent realistic
tissue architecture and boron distribution. Zamenhof and Solares [81] addressed the
issue in the development of high resolution quantitative autoradiography (HRQAR)
combined with a novel 2D Monte Carlo simulation. HRQAR uses a 0.8 µm thick film of
Lexan as the track detection medium placed in intimate contact with an equally thin
tissue sample. Image processing techniques applied to the track detector film following
exposure to thermal neutrons identify the boron atoms. Their hypothesis is that a full 3D
characterization of the cellular architecture and the corresponding B-10 distribution can
be mimicked by sectioning a single plane through many cells in the tumor matrix,
deriving the boron distribution within this single plane by HRQAR, and performing a
2D Monte Carlo calculation within this plane over many cell sections to obtain the
desired microdosimetric parameters. A spatial resolution of 1-2 µm and a sensitivity of
1 ppm boron may be achieved, although the process is very time consuming, taking 8
days for the HRQAR. In summary, autoradiography is a specialized time-consuming
technique with excellent results for specific applications.
2.3.3.5 Three Dimensional Optical Random Access Memories (3D ORAM)
Three dimensional optical random access memories (3D ORAM) are bistable
photochromic materials that can be converted from the stable non-fluorescent form to
the quasi-stable fluorescent form (and vice versa) via two photon absorption using
Chapter 2: Literature Review Page 35
35
intersecting laser beams. The use of this material for real-time dosimetry was first
proposed by Moscovitch [82]. Theoretical calculations by Moscovitch and
Emfietzoglou [83, 84] indicated that the energy deposited along a track due to passage
of a charged particle through this material results in a local de-excitation of the less
stable isomer. The track characteristics depend on the particle type and energy and thus
dosimeters based on these materials could provide detailed information on particle type
and energy distribution for neutrons and heavy charged particles [84, 85].
Readshaw [86] and Phillips [85] used a photochromic molecule spirobenzopyran (SB)
embedded in polymethyl methacrylate (PMMA) to construct track detector films 60 µm
thick. The material was read using a confocal laser scanning microscope. Successive
two dimensional images formed by scanning across the focal planned (depth profiles)
are layered to provide a three dimensional image. Image resolution of the track is
approximately 1 µm in the scanning plane and several µm in the depth. Phillips [85]
confirmed a fluorescent intensity that is proportional to dose over several orders of
magnitude. In the range of energies investigated, the energy per nucleon can be
determined from the width of the depth profile. Furthermore, the fluorescent intensity at
a fixed dose varies with particle type and energy, a property that may prove useful for
particle identification.
3D ORAM is in the early stages of development but promises to be a useful tool for
microdosimetry studies of solid-state particle tracks.
2.3.4 Summary of Experimental Microdosimetry MethodsParticle track detection methods such as 3D ORAM, autoradiography, cloud chambers
and optical ionization chambers are generally difficult and expensive experimental tools
that are operationally time consuming. Site based devices such as the TEPC and the
silicon microdosimeter are easier to use, generally applicable and quickly provide
microdosimetric spectra and parameters. In this work, we are primarily focussed on
developing a silicon based microdosimeter with performance characteristics that are
competitive with the TEPC. The ultimate goal is to develop a device that exceeds the
usefulness and performance of the TEPC for regional microdosimetry.
Chapter 2: Literature Review Page 36
36
Table 2.2. Comparison of proportional counter to silicon microdosimeter
Excellent, Single Ionizations,Minimum y = 0.05 keV/µm
Moderate,Minimum y = 0.4 keV/µm
Sensitive volumedefinition
Good Moderate
Tissue Equivalence Good ModerateRadiation Hardness Excellent ModerateSpatial Resolution Poor, 2.5 cm. 0.5 mm best
case [22]Excellent, 1 µm.
Wall effect Immunity Poor ExcellentModel cell array No YesShape designflexibility
Moderate Moderate
Ease of Use Calibration Simple SimpleCost High LowPortability Moderate ExcellentSystem Complexity Poor: Requires HV supply and
gas supply.Good: only requires low voltagesupply.
In-vivo use No YesIntegration Poor Excellent
Notes:i) The shaded areas identify the best performance of the two devices for each parameter.ii) See Figure 2.6 for energy and preamplifier noise dependence. The silicon microdosimeter has
potentially better energy resolution (lower W=3.62 eVc.f. 30 eV, better Fano factor and no gasmultiplication but needs low preamplifier noise)
iii) Assuming 2.5 cm spherical TEPC with simulated diameter d = 1µm capable of detecting singleionizations and 1 µm3 cubic silicon microdosimeter with ultra low preamplifier noise ~15 erms.See section 4.5.6 for discussion of ultimate noise performance of silicon microdosimeter.
A comparison of the typical performance of the TEPC and the silicon microdosimeter is
shown in Table 2.2 based on the previous sections discussion. Parameters for
comparison are subdivided into "detector performance" criteria and "ease of use"
criteria. The best performance for each criterion is shaded gray.
Energy resolution is dependent on preamplifier noise and energy deposited as indicated
by equations (2.20) and (2.29). Figure 2.6 shows a resolution comparison of the TEPC
and silicon microdosimeter as a function of energy deposited (T) for several
preamplifier noise levels. For the TEPC, resolution is dominated by Fano and gas
multiplication effects which vary according to T-0.5 whilst for the silicon microdosimeter
preamplifier noise is the dominant factor which varies according to T-1. This accounts
for the differing slopes in Figure 2.6.
Chapter 2: Literature Review Page 37
37
0.1 1. 10. 100. 1000.Energy DepositedHkeVL
1.
10.
100.
1000.
noituloseR
H% LEm Em Em
Si MicrodosimeterHerms=600PrototypeLSi MicrodosimeterHerms=15,Ultra low noiseLSi MicrodosimeterHerms=100LProportionalCounter Herms=100 L
Figure 2.6. Resolution of proportional counter and silicon microdosimeter as a function of energydeposited for several preamplifier noise levels. Calculated using equations (2.20) and (2.29) withg=104 ,M=0.6, F=0.3,W=30 eV, Rrest=0 (TEPC), F=0.3, W=3.62 eV (Si microdosimeter) Also shownis the minimum energy measurable (Em lower noise cutoff from equations (2.14) and (2.26)). The Em
for the proportional counter is not shown since it is very low (single ionization).
At higher energies the preamplifier noise is a less significant component of resolution
and the theoretical contributions such as the Fano factor and gas multiplication are more
significant. Therefore, the silicon microdosimeter has better resolution at higher
energies since its theoretical resolution contributions (lower Fano, no gas
multiplication) are smaller than the TEPC. The silicon detector's higher preamplifier
noise component creates poor resolution at low energies. The minimum energy
measurable, Em, as provided by equations (2.14) and (2.26) is shown in Figure 2.6. The
worst case resolution for the silicon detector at Em is given by substituting equation
(2.26) into (2.29). Noting that the Fano contribution is negligible at low energies, we
obtain a resolution of 47% at Em. For an equal preamplifier noise of erms equal to 100
eV, the silicon microdosimeter resolution is better for deposited energies greater than
4.9 keV. Thus, if a sufficiently low erms is obtained in the silicon microdosimeter design
then the resolution will be better than the proportional counter over most of the
measurable energy range. Furthermore, reducing erms is essential for obtaining an
adequate low energy cutoff. Although the potential of the silicon microdosimeter in
terms of resolution exceeds the proportional counter we classify both as moderate in
Table 2.2 based on current performance as given by the prototype microdosimeter
described in this work (erms=600).
The TEPC offers better performance in terms of low energy sensitivity since it is
capable of single ionization detection. Sensitive volume definition is good (ignoring the
wall effect) and tissue equivalence and radiation hardness are better than the silicon
Chapter 2: Literature Review Page 38
38
microdosimeter. For both detectors, the ability to shape the sensitive volume is limited
by construction methods. Silicon technology is capable of manufacturing most shapes
except for the spherical shape. In all other categories, particularly those relating to ease
of use, the silicon detector offers benefits. A higher spatial resolution is especially
beneficial in many radiotherapy applications such as proton and heavy ion therapy.
Measurement in the solid phase offers the advantages of removing the wall effect,
improving spatial resolution, reducing system size, and portability and offering the
ability to model an array of cells. Kliauga [22] in an analysis of the limitations of
experimental microdosimetry, recognized the restriction of measurements to the gas
phase. He wrote, “Although there is a wide range of opinion as to how serious this
constraint is in practice, there is no question that this is a valid issue for development in
future research".
Theoretical calculations by Zaider [87, 88] have shown significant phase effects in the
estimation of microdosimetric parameters. Calculations of the energy deposition from
30 keV electrons in water vapor and condensed water sites (d=1 µm) gave a 50% higher
mean specific energy in condensed water relative to water vapor with commensurately
large differences in the lineal energy spectra. Zaider's recent paper [88] stresses the need
for development of a solid state microdosimeter suggesting a TE polymer solid state
spectrometer as a possible device. To improve signal to noise internal gain could be
achieved by operating at a high bias voltage in proportional counter mode rather than as
an ionization chamber. Stoner [89] obtained gains of more than 1000 using 7.5 µm thick
Kapton foil sheets although recombination is high so that only a maximum of 10% of
carriers produced by an ion beam are collected. In this work, we contend that a silicon
microdosimeter is a viable alternative (in which close to 100% of carriers produced by
an ion beam may be collected), provided very low energy measurements are not
required for the applications considered.
The rapidly improving integration capability of silicon technology offers the possibility
of reduced system cost, increased reliability and improved performance. Such small
systems are capable of in-vivo operation. Moreover, macrodosimetric detectors such as
MOSFETs [71] and track structure analysis detectors [90] may be integrated onto the
same device to provide high-resolution multi-function capability. However, as a first
step towards acceptance a silicon microdosimeter must be developed.
Chapter 2: Literature Review Page 39
39
2.4 Applications of Experimental MicrodosimetryThe aim of this work is primarily focussed on technology development. Therefore, this
section on applications will be a brief introduction. Note that high LET radiotherapy is
the primary application pursued in this work. Aside from the discussion below, the
various high LET therapy modalities are also discussed in more detail in later chapters.
2.4.1 RadiobiologyThe link between experimental microdosimetry, based on regional or site
measurements, and radiobiology was forged by Kellerer and Rossi in 1972 with the
publication of the Theory of Dual Radiation Action (TDRA) [18]. The theory is based
on a number of assumptions, including (from Goodhead [12]):
1. When a biological cell is exposed to ionizing radiation, the radiation produces
sublesions within the cell and the number of sublesions is directly proportional to
the energy imparted by the radiation.
2. A biological lesion is formed when two sublesions combine with one another,
possibly over relatively long distances on a subcellular scale.
3. Each lesion has a fixed probability of leading to a given biological effect.
Most importantly, the original theory was developed in a site model form compatible
with TEPC measurements in simple spherical or cylindrical shapes. This leads to the
final simplifying assumption:
4. All pairs of sublesions within a sensitive site have an equal probability of combining
and a zero probability outside the site.
Based on these assumptions the TDRA proposes that the mean number of lesions ε after
an absorbed dose D is:
ε ζ( ) ( )D k D D= + 2 (2.32)
where k is a constant for a given biological system and ζ is the dose average of the
specific energy (also written as zD). The first term accounts for lesions formed by two
sublesions that are produced in the same event (intra-track action) and the second term
pertains to the case of sublesions combining from two separate events (inter-track
action).
Chapter 2: Literature Review Page 40
40
The relative biological effectiveness (RBE or R) of a high LET radiation H, relative to a
low LET radiation L, is defined by:
RD
DL
H
= (2.33)
where DL and DH are the absorbed doses of the two radiations causing equal effect.
Utilizing equation (2.32) and equality of effect yields:
k D D k D DH H H L L L( ) ( )ζ ζ+ = +2 2 (2.34)
Substituting (2.34) into (2.33) gives:
RD
D DH
L H H H L= + + −1
242ζ ζ ζ( ) (2.35)
The site model formulation of TDRA correctly predicts the inverse square root variation
of RBE with dose (i.e. ζL<<DH<<ζH, R DH H≈ ζ / ). The domain in which the specific
energy should be considered depends upon the average distance over which sublesions
combine. Microdosimetric measurements of the neutron beams employed in biological
experiments indicate that the sites typically have diameters of 0.2-2 µm [12, 18].
In the late seventies, it was recognized that the site model formulation of TDRA could
not account for the effects of certain radiations such as soft X-rays [91, 92] or correlated
pairs of charged particles [93, 94]. For instance, in the molecular ion beam experiment,
it was found that if pairs of deuterons are separated by 90 nm the effect on the
reproductive capability of V79 cells was significantly different then for a single particle
with twice the LET. Yet the microdosimetric spectra for the two kinds of radiation are
identical in volumes of the order of a few microns.
The TDRA was generalized by Kellerer and Rossi in 1978 with the introduction of the
distance model formulation [95]. The generalized TDRA relaxed the site model
assumption (4 above) and replaced it with:
4a. The probability g(x) of sublesions combining is a function of their distance apart x.
According to the distance model ζ in equation (2.32) becomes (p 242 Rossi [1]):
ζ γ=∞z t x x dx( ) ( )
0(2.36)
Chapter 2: Literature Review Page 41
41
where t(x) is the proximity function (chapter V Rossi [1]) specifying the spatial
properties of the deposition of radiation energy and γ(x) is the probability that two
energy transfers separated by a distance x combine to form a lesion. The proximity
function is a measure of the probability that the energy transfer points are separated by a
distance x. On the other hand, the dose averaged specific energy is given by:
z t xf x
xdxD
p=LNM
OQP
∞z ( )( )
4 20 π ρ(2.37)
where fp(x) is the point pair distance distribution (ppdd) of the site where specific energy
is measured. Comparing the above two equations indicates that a measurement of zD
yields the parameter ζ only if the microdosimeter and cell sensitive site have the same
ppdd. That is;
γπ ρ
( )( )
xf x
xp=
4 2(2.38)
Comparisons of experimentally determined γ(x) with the function given by the right-
hand side of the above equation indicate that the spherical TEPC is a poor
representation of the sensitive site geometry [94]. Finding a practically realizable
detector structure that satisfies equation (2.38) may be difficult. However, Zaider and
Rossi [96] have shown that that any function γ(x) may be represented as the algebraic
superposition of ppdd's corresponding to spherical objects. Thus, the quantity ζ may be
predicted from microdosimetric spectra measured in a series of spherical sites of
different diameters. Implementations of these ideas suggest that 2-3 sites are sufficient.
The site size required is very small of the order of tens of nanometres, which has
consequently driven a demand for nanodosimetric detectors. Variance-covariance
techniques (see section IV.5.2 Rossi [1]) may be used for measurements of yD and zD
in such small volumes.
Further improvements to the TDRA include the compound dual radiation action theory
(CRDA) developed in an attempt to correlate sublesions and lesions with biological
entities such as chromosome breaks and chromosome exchange aberrations (p237,
Rossi and Zaider [1]). Note that the validity of the TDRA and CDRA are open to much
debate with research actively being pursued in alternative radiobiological models such
as Goodhead's repair models [12] and work by Zaider and Katz on track structure theory
Chapter 2: Literature Review Page 42
42
[97]. Thus, the application of regional experimental microdosimetry as a predictive tool
in radiobiology is questionable and requires further research. Silicon based detectors
with their flexible geometrical structures and greater design scope may offer new
detectors capable of testing track structure theory as well as providing more traditional
site based measurements.
2.4.2 Radiotherapy ApplicationsMicrodosimetric methods are especially useful for high LET radiation therapy due to
the requirement of quantitative specification of radiation quality. The high LET
modalities in which microdosimetric methods have been applied include fast neutron