23
2 Methodology
2 Methodology

13
2 Methodology
2.1 Introduction
This Chapter has three main sections that separately contain descriptions of:
the approach: the common inter-modal and the differential modal approaches;
data sources; and
software tools, which have largely been confined to assessments of the road network:
– because the road network has largely deteriorated to a point beyond which it is maintainable, the first priority has been to determine a programme of rehabilitation. A specialized tool, the World Bank’s Roads Economic Decision (RED) model, has been used to prioritise investment within the limits of anticipated budgetary constraints.
– Only when the roads have been returned to a maintainable condition, can the second level of modelling, a Road Maintenance Management System be properly applied – the model now be-ing prepared for this purpose is ROMAPS.
– The third level of modelling comprises a GIS that has the ability to relate different information in a spatial context and to reach a conclusion about this relationship. This is done by using a location reference system, such as longitude and latitude, and if necessary elevation. This capability can reveal important information, in this case about transport data, such as spatial patterns and relationships, and supports modelling and analysis in terms of:
– Location: Where is X?
– Condition: How is X?
– Trends: What has changed since?
– Patterns: What spatial patterns exist?
– Modelling: What if?
The GIS is particularly useful as a tool for displaying the effects of various budgetary constraints on the rehabilitation and other programmes as prepared with the help of the RED model.
2.2 Approach
2.2.1 Intermodal and general
The methodology adopted is summarised on Figure 2-1.
The methodology was necessarily flexible6, as from time-to-time during the course of the project, it was necessary to adjusted it to take account of: (i) findings to date – for example, it was discovered after the first economic analyses for road rehabilitation that budgetary constraint problems were more likely to influence investment programmes than economic viability; (ii) data availability – there was substantial difficulty in obtaining reliable data/information and particular difficulty in obtaining information relevant to the air transport sector; and (iii) the non-mobilisation of some originally intended experts – for example, in regard to trade facilitation. The areas most affected by these problems are highlighted in dark green in Figure 2-1.
6 The figure summarises the finally adopted approach after these modifications.
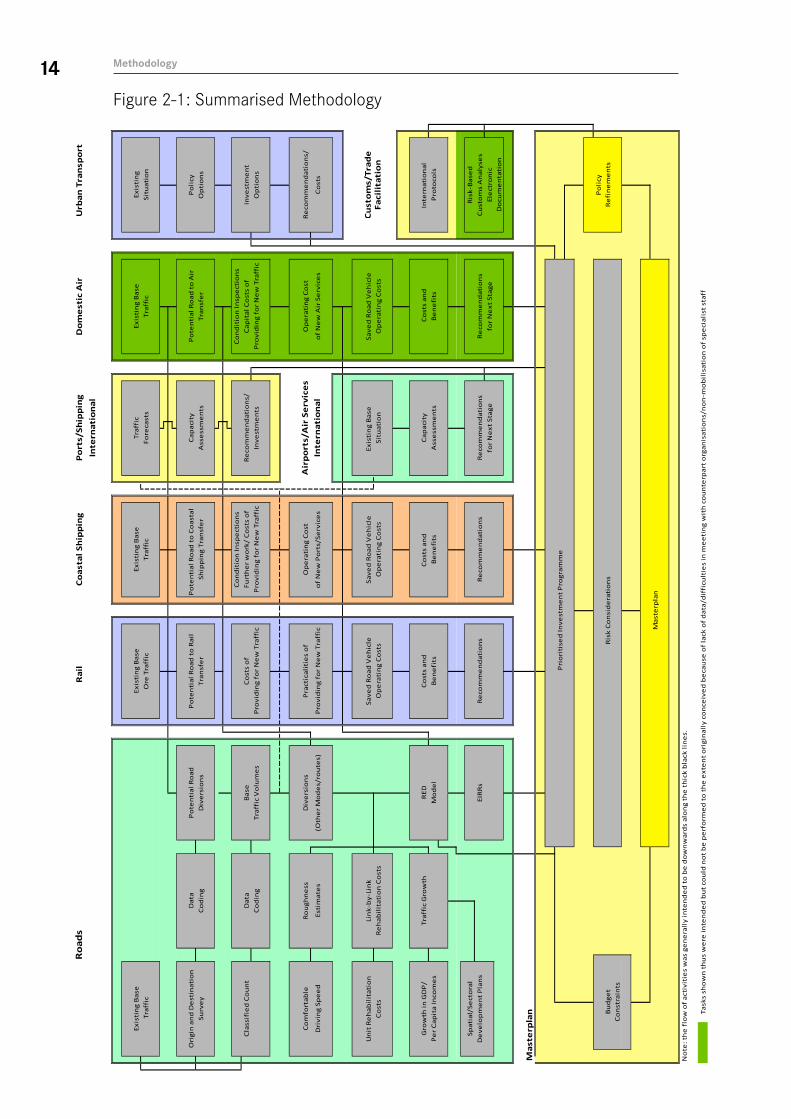
14Figure 2-1: Summarised Methodology
MethodologyR
oad
sR
ail
Urb
an T
ran
spo
rt
Po
ten
tial
Ro
ad t
o C
oas
tal
Mas
terp
lan
No
te: t
he
flo
w o
f ac
tivi
tie
s w
as g
en
era
lly
inte
nd
ed
to
be
do
wn
war
ds
alo
ng
the
th
ick
bla
ck li
ne
s.
Task
s sh
ow
n t
hu
s w
ere
inte
nd
ed
bu
t co
uld
no
t b
e p
erf
orm
ed
to
th
e e
xte
nt
ori
gin
ally
co
nce
ive
d b
eca
use
of
lack
of
dat
a/d
iffi
cult
ies
in m
ee
tin
g w
ith
co
un
terp
art
org
anis
atio
ns/
no
n-m
ob
ilis
atio
n o
f sp
eci
alis
t st
aff
Exis
tin
g B
ase
Tra
ffic
Exis
tin
g B
ase
Traf
fic
Traf
fic
Fore
cast
s
Ship
pin
g Tr
ansf
er
Po
ten
tial
Ro
ad t
o A
irTr
ansf
er
Po
ten
tial
Ro
ad t
o R
ail
Dat
aC
od
ing
Cap
acit
yA
sse
ssm
en
ts
Cla
ssif
ied
Co
un
t
Co
mfo
rtab
le
Dri
vin
g Sp
ee
d
Ori
gin
an
d D
est
inat
ion
Surv
ey
Po
ten
tial
Ro
adD
ive
rsio
ns
Bas
eTr
affi
c V
olu
me
s
Gro
wth
in G
DP
/P
er
Cap
ita
Inco
me
s
Div
ers
ion
s
(Oth
er
Mo
de
s/ro
ute
s)
Un
it R
eh
abil
itat
ion
Co
sts
Traf
fic
Gro
wth
Dat
aC
od
ing
RED
Mo
de
l
Ro
ugh
ne
ss
Esti
mat
es
Lin
k-b
y-Li
nk
Re
hab
ilit
atio
n C
ost
s
EIR
Rs
Co
asta
l Sh
ipp
ing
Do
me
stic
Air
Exis
tin
g B
ase
Ore
Tra
ffic
Exis
tin
g B
ase
Traf
fic
Tran
sfe
r
Co
sts
of
Op
era
tin
g C
ost
s
Co
sts
and
Be
ne
fits
Pra
ctic
alit
ies
of
Re
com
me
nd
atio
ns
Pro
vid
ing
for
Ne
w T
raff
ic
Pro
vid
ing
for
Ne
w T
raff
ic
Save
d R
oad
Ve
hic
le
Cap
acit
yA
sse
ssm
en
tsC
ost
s an
d
Be
ne
fits
Re
com
me
nd
atio
ns
Furt
he
r w
ork
/ C
ost
s o
fP
rovi
din
g fo
r N
ew
Tra
ffic
Op
era
tin
g C
ost
of
Ne
w P
ort
s/Se
rvic
es
Co
sts
and
Be
ne
fits
Bu
dge
tC
on
stra
ints
Save
d R
oad
Ve
hic
leO
pe
rati
ng
Co
sts
Cap
ital
Co
sts
of
Pro
vid
ing
for
Ne
w T
raff
ic
Op
era
tin
g C
ost
of
Ne
w A
ir S
erv
ice
s
Save
d R
oad
Ve
hic
leO
pe
rati
ng
Co
sts
Op
tio
ns
Re
com
me
nd
atio
ns/
Co
sts
Pri
ori
tise
d In
vest
me
nt
Pro
gram
me
Ris
k C
on
sid
era
tio
ns
Mas
terp
lan
Situ
atio
n
Re
com
me
nd
atio
ns
for
Ne
xt S
tage
Inte
rnat
ion
al
Pro
toco
ls
Ris
k-B
ase
dSp
atia
l/Se
cto
ral
De
velo
pm
en
t P
lan
s
Exis
tin
gSi
tuat
ion
Po
licy
Op
tio
ns
Inve
stm
en
tC
on
dit
ion
Insp
ect
ion
s
Do
cum
en
tati
on
Po
licy
Po
rts/
Ship
pin
g
Inte
rnat
ion
al
Air
po
rts/
Air
Se
rvic
es
Inte
rnat
ion
al
Re
com
me
nd
atio
ns/
Inve
stm
en
ts
Re
fin
em
en
ts
Co
nd
itio
n In
spe
ctio
ns
Re
com
me
nd
atio
ns
for
Ne
xt S
tage
Exis
tin
g B
ase
C
ust
om
s/Tr
ade
Faci
lita
tio
n
Cu
sto
ms
An
alys
es
Ele
ctro
nic
15The methodology has centred on the rehabilitation of infrastructure. It focused on:
the practicalities of increasing capacity - a particular constraint on the rail sector;
the lack of finance for capital and recurrent expenditure - a constraint relevant to all sectors;
economic returns, and therefore the projects, over and above those centred on maintenance management, that are needed to prioritise rehabilitation. Central to the process is the generation of estimated Economic Internal Rates of Return (EIRRs) which compare year-on-year life-cycle costs, “with” and “without” rehabilitation - these are:
– year-on-year expected capital and maintenance expenditure; and
– transport operating and travel time costs.
The EIRR is, thus, the measure that would most properly7 be used to prioritise projects both within, and between, sub-sectors.
the limited amounts of data available and data processing logistics: these were major factor im-pinging on the methodology.
Described in the sub-sections below are the basic approaches taken:
in regard to the assessment of projects in the road, rail, coastal shipping and air transport sec-tors: the different approaches to each sub-sector is highlighted; and
when developments in one sub-sector impinge on developments in the other sub-sectors.
2.2.2 Assessment and prioritisation process: road projects
The methodology has focused on the road sector in particular. Five basic modelling inputs were required:
base traffic volumes: determined by classified traffic counts;
expected traffic growth rates: determined from the expected economic and spatial pattern of growth in the country;
road condition information in the “with” and “without” project situations: this was expressed in terms of the roughness of the road and hence the effect that the road-condition has on vehicle operating costs and journey times – algorithms were used to translate “comfortable driving speeds8” into roughness estimates – in the absence of machine-made Roughness Survey Mea-surements, this is the process that had to be applied;
construction/rehabilitation costs and maintenance costs: determined from engineers’ estimates; and
base price information on the costs of owning and operating vehicles and the values of time of travellers: determined from surveys9.
The information, when combined into RED10, generated estimates of the Economic Rate of Return by assessing investment for the rehabilitation of specific road sections against benefits generated through rehabilitation such as reductions in vehicle operating cost.
In this exercise, all links on the primary road network were separately appraised.
7 A paucity of data and difficulties with meeting people outside the road sector led to difficulties in generating EIRRs for projects outside the roads sector – the Master Plan conclusions for the rail and coastal shipping sectors nonetheless remain clear.
8 As the goal was a priority ordering of projects, consistency in the assessments was deemed more important than an accurate assessment of Roughness.
9 Data was required on vehicle, fuel, tyre and unit maintenance parts/labour and driver costs, average vehicle lives and average vehicle utilisation rates.
10 The World Bank’s Roads Economic Decision Model (RED) was preferred to HDM-4 – RED is free software provided and uses identical algorithms to HDM-4 for estimating vehicle operating costs – it however assumes constant life-cycle Roughness values in the “with” and “without” project scenarios. Most usefully inputs can be processed via Excel spreadsheets and large numbers of road sections can be analysed simultaneously.
Methodology

16
2.2.3 Assessment and prioritisation process: rail projects
Liberia’s railways were constructed for carrying mineral ore. Consequently, the economic and finan-cial viability of rehabilitation projects are, almost completely, linked to the economic and financial viability of the mining operations themselves.
With this in mind, a number of points relevant also to transport policy and which informed the ap-praisal process need to be noted:
the base projects will have to be private sector/industry driven: and therefore, financial viability is as important as economic viability ;
in the roads sector, the annual licence fees/other charges on the use of heavy road trucks must reflect the annual likely damage they cause to the road structure: if this is not the case, the Mining Companies may find it cheaper to operate trucks than to invest in, economically-more-sensible, rail rehabilitation – and Government would effectively end up subsidising the mining operation and would be encouraging the inefficient use of scarce resources11;
it may be possible to “bolt” onto a basic industry-driven rehabilitation project, the infrastructure and other needs for carrying other types of freight and for carrying passengers: the approach to the assessment of these bolt-on projects has been based on assessments of capacities, the practi-calities of, and the marginal costs and likely benefits of providing additional capacity.
2.2.4 Assessment and prioritisation process: coastal shipping/fast launches and domestic air services
In previous times it has been noted that coastal towns were often accessed by coastal shipping/fast launch and that towns in the interior were accessed by domestic air services. The viability of rein-stated/improved services will in this case be conditional on:
the availability of ports/jetties/airfields: financial viability will be important as port/jetty/airfield operators will have to recover from users the costs of provision/rehabilitation and operation – the jetty/port/airfield operators could, of course, be either Government or the private-sector;
the costs of providing and operating the candidate ferry/launch/domestic air services: viability will depend on the “generalised cost” (this is a term combining price, time and other qualities-of-service) associated with the ferry/fast launch/air service being lower than “generalised cost” associated with alternative road transport.
The private sector can, and clearly it will be appropriate that they should, take responsibility for any proposed coastal shipping services. A public-private partnership could also be appropriate - but only if Government believed the services were a social necessity.
2.2.5 Ports and airports as international gateways
Projects for rehabilitating international/gateway ports and airports would normally be appraised from the perspective of minimising total transport costs, viz:
facilities must have the capacity to cater for the projected demand;
in the case of sea ports: the cost of providing and operating facilities when divided amongst the projected traffic must lead to lower overall (economic) transport costs than were the new facili-ties not to be provided;
in the case of airports: the cost of providing and operating facilities when divided amongst the projected traffic must be lower than the economic benefits from increased visitor numbers.
11 For example, for road maintenance.
Methodology

17Given that the World Bank has been looking in more detail at the international ports/airports, the intention was not to undertake detailed new analyses, but rather to incorporate the findings of these other studies, as appropriate, into the Master Plan.
2.2.6 Modal competition
It is clear that
the upgrading of one route in preference to another might cause traffic to divert from the latter to the former; or
the rehabilitation/introduction of a competing mode/service might cause traffic to divert between modes.
The scope for such interaction has however been determined to be very limited and only four in-stances when such interactions would occur have been identified:
when upgrading/completing a road or link that runs parallel to an existing route and which of-fers shorter travel distances or times between two points:
with railway rehabilitation/new services on existing rail lines: which improvements might have caused freight and passenger traffic to divert from roads12;
re-established domestic air services: which may cause small numbers of road passengers and road freight to divert to air13; and
coastal shipping/fast launch services: which might cause passengers and freight with origins and destinations along the coast to divert from a road alternative – this particularly while/where the coastal road remains in poor condition and during the wet season.
In circumstances when these are likely to occur, manual adjustments have been applied to the road-link traffic forecasts – sophisticated assignment models were deemed inappropriate and would have required a more detailed assessment. Such models may, however, be introduced at a later stage.
12 In fact no services of this type were identified – the practicalities of providing the additional rail capacity were considered too expensive – there would also be concessionaire legal difficulties
13 In this case there was insufficient data provided to establish the viability or not of such developments. Such movements even if reinstated would, however, be small and have little effect on road services.
Methodology

182.3 Data sources
2.3.1 Road traffic data bases
Organisation and implementation
In order to address the lack of information concerning present movements by road, two traffic cen-suses were carried out with the support of twenty staff from the Ministry of Transport.
According to an agreement with the Ministry of Transport, a working group with senior staff of the Ministry and staff from the GIZ office was established. Practicalities, schedules and logistics were determined during a series of weekly meetings.
The survey staff were selected by the MoT working group members. Initially they were organized as two teams - with five groups of two persons in each team. This allowed the flexibility required in order to distribute the groups in different numbers, depending on expected traffic volumes, to all counting stations. The location of counting stations is shown on the map below. Team 1 was de-ployed along the coast - team 2 covered the north and south-east. Two of the most suitable staff were later taken on for coding and analysis work.
The questionnaires and survey methodologies, the selection of staff for counting,/surveying and cod-ing, the training of this staff, the selection of roads and the appropriate survey station locations, and the logistics/practicalities of the traffic census itself followed schedules and deployments agreed by the working group. The intention was to cover all primary roads and important secondary roads.
Two training courses, theory and practice, of each for two days were carried out before the first traf-fic census.
Methodology

19Figu re 2-2: Counting stations for traffi c censuses 1 and 2
Methodology
20An MS-Access driver-interview and classified traffic count databank was developed following the first surveys. Since January 2010, two staff from the Ministry of Transport have been engaged in entering the data from the classified counts and the 4,700 driver-interview questionnaires. This clas-sified count and driver interview databank will usefully complement the other databanks now being developed for a road inventory and for storing information from road condition surveys and will be included into the Geographical Information System (GIS) for the spatial analysis of all transport sector data (MoT & MoPW) which will include the RED analysis input and output data and, at a later stage, ROMAPS input and output data. It is recommended that these data-banks be made available to all with interests in developing the Liberian transport sector.
Survey methodology
The first traffic survey was conducted during the dry season in November/December 2009 and the second during the Wet Season in April/May 2010. Both surveys consisted of classified counts of all vehicles (06:00 to 18:00) and random road side driver interviews.
Classified count data recording forms and a driver-questionnaire were developed by the working group.
The classified count data recording form was intended to capture the total number of vehicles pass-ing by each counting point in each direction between 6.00 hrs and 18:00 hrs on an hourly basis. Vehicles were divided into eight categories: trailers, trucks, pick-ups/jeeps, buses, minibuses, taxis, private cars and motor-cycles. Surveys were generally conducted on two consecutive week-days. There were no surveys on Saturdays, Sundays or public holidays.
The driver-interviews recorded, amongst other data, origins and destinations, journey times and lengths, passenger numbers per vehicle, trip purposes, fares paid and, for freight vehicles, the average load and nature of the goods carried and the tariff paid for the carriage of the goods (survey forms are shown in Appendix A and Appendix C).
All the surveys were initially programmed for two days14. The surveys were intended to reveal the volumes and nature of inter-urban traffic by vehicle category and any differences in dry and wet season volumes. This latter information was considered particularly important for the appraisal of coastal shipping. Demand was suspected to be higher during the wet season when travel by road was most difficult
Wherever possible, the surveys were conducted at major road junctions, though care was taken to ensure that the stations were sufficiently beyond the influence of any local short-distance traf-fic which might bias the counts of long-distance, inter-urban trips that the survey was intended to capture.
Matrices of inter-county movements by (i) vehicle categories, (ii) passenger numbers and (iii) freight tonnages were derived after the application of: (a) expansion factors based for each vehicle category on the ratio of “interviewees” to “measured total traffic volumes” and (b) a matrix to correct for the likely extent of double counting when vehicles would have passed through more than one survey station were used to determine.
The extent of the survey work is summarised below.
14 The actual surveys were for a number of logistical/practical reasons less than originally intended. The surveys intended and the surveys undertaken are shown catalogued in appendix E on CD.
Methodology
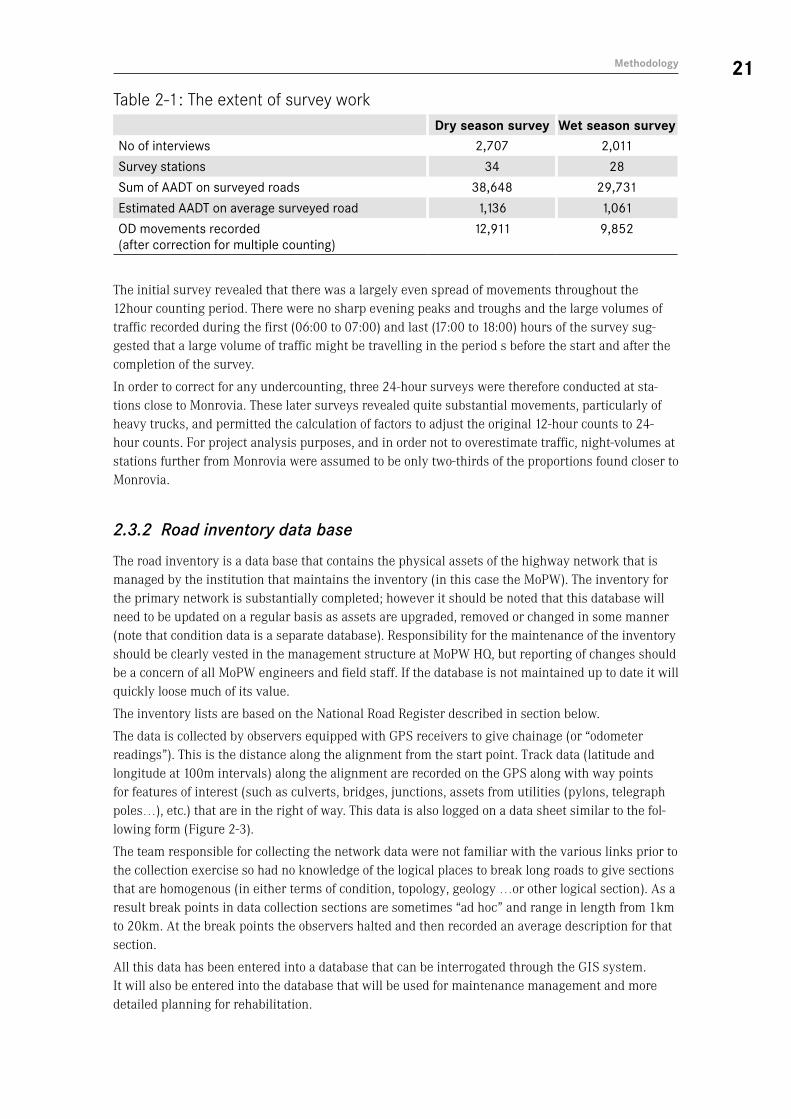
21Table 2-1: The extent of survey work
Dry season survey Wet season surveyNo of interviews 2,707 2,011
Survey stations 34 28
Sum of AADT on surveyed roads 38,648 29,731
Estimated AADT on average surveyed road 1,136 1,061
OD movements recorded (after correction for multiple counting)
12,911 9,852
The initial survey revealed that there was a largely even spread of movements throughout the 12hour counting period. There were no sharp evening peaks and troughs and the large volumes of traffic recorded during the first (06:00 to 07:00) and last (17:00 to 18:00) hours of the survey sug-gested that a large volume of traffic might be travelling in the period s before the start and after the completion of the survey.
In order to correct for any undercounting, three 24-hour surveys were therefore conducted at sta-tions close to Monrovia. These later surveys revealed quite substantial movements, particularly of heavy trucks, and permitted the calculation of factors to adjust the original 12-hour counts to 24-hour counts. For project analysis purposes, and in order not to overestimate traffic, night-volumes at stations further from Monrovia were assumed to be only two-thirds of the proportions found closer to Monrovia.
2.3.2 Road inventory data base
The road inventory is a data base that contains the physical assets of the highway network that is managed by the institution that maintains the inventory (in this case the MoPW). The inventory for the primary network is substantially completed; however it should be noted that this database will need to be updated on a regular basis as assets are upgraded, removed or changed in some manner (note that condition data is a separate database). Responsibility for the maintenance of the inventory should be clearly vested in the management structure at MoPW HQ, but reporting of changes should be a concern of all MoPW engineers and field staff. If the database is not maintained up to date it will quickly loose much of its value.
The inventory lists are based on the National Road Register described in section below.
The data is collected by observers equipped with GPS receivers to give chainage (or “odometer readings”). This is the distance along the alignment from the start point. Track data (latitude and longitude at 100m intervals) along the alignment are recorded on the GPS along with way points for features of interest (such as culverts, bridges, junctions, assets from utilities (pylons, telegraph poles…), etc.) that are in the right of way. This data is also logged on a data sheet similar to the fol-lowing form (Figure 2-3).
The team responsible for collecting the network data were not familiar with the various links prior to the collection exercise so had no knowledge of the logical places to break long roads to give sections that are homogenous (in either terms of condition, topology, geology …or other logical section). As a result break points in data collection sections are sometimes “ad hoc” and range in length from 1km to 20km. At the break points the observers halted and then recorded an average description for that section.
All this data has been entered into a database that can be interrogated through the GIS system. It will also be entered into the database that will be used for maintenance management and more detailed planning for rehabilitation.
Methodology
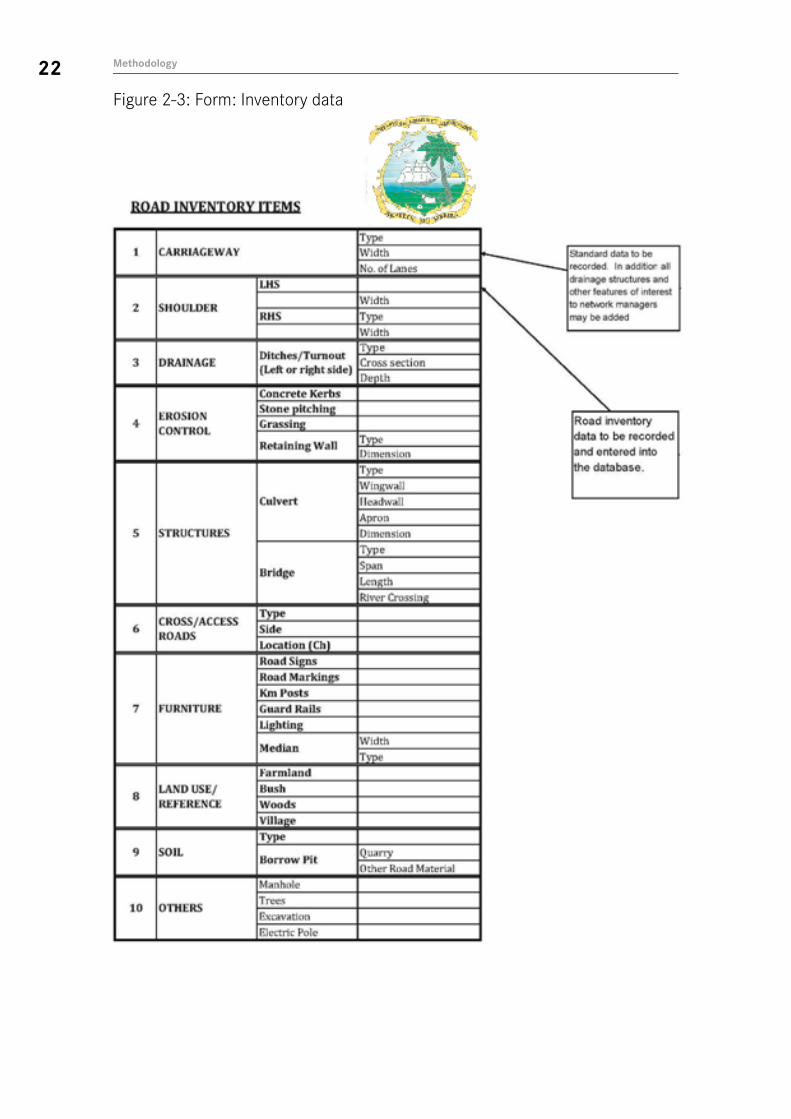
22 Figure 2-3: Form: Inventory data
Methodology

23The form above shows the nature of the information that is recorded for each link/section of a road. This information allows the network managers to have a fair measure of assets of each type. When this information is also geo-referenced within a Geographic Information System it makes it possible to better manage the network.
It should be relatively easy to identify some of the potential weak spots that are likely to fail and esti-mate the cost of upgrading particular sections. A series of fi eld visits could then be used to confi rm/discount the hypothesis leading to proposals for future investment. The following scenario gives an indication of how this inventory and GIS might be used (for a gravel road).
One of the environments that is likely to give rise to pavement failures is in areas of weak sub grades subject to fl ooding. In addition, areas with slopes in excess of 6% are more prone to lose of wearing course than fl atter areas. The areas with greater rain fall are more likely to suffer failures than drier areas.
A set of database queries can be posed that will produce a table of data and a map for any regions that is selected that will identify roads in areas of weak subgrades with rainfall exceeding 3000mm per annum with longitudinal slopes of more than 6% and the fl ood plane of any water courses.
Investment in paving these areas identifi ed by this process would probably show a good internal rate of return. The inventory and GIS would generate a lot of the information needed to prepare an outline feasibility/cost study for the upgrade.
The previous form identifi ed the data that has been collected with respect to the assets. In addition to this other information of interest that intersects with the right of way is recorded. The form on the following page (Figure 2-4) shows the record sheet that was used by observers for this project. This allows for the location on a particular road section of point objects (junctions, lamps posts, telegraph/power poles, bridges, gravel pits, culverts, etc.); line features (shoulders, drains, and pave-ment. There is scope to record the start and end chainage for linear features.
Methodology
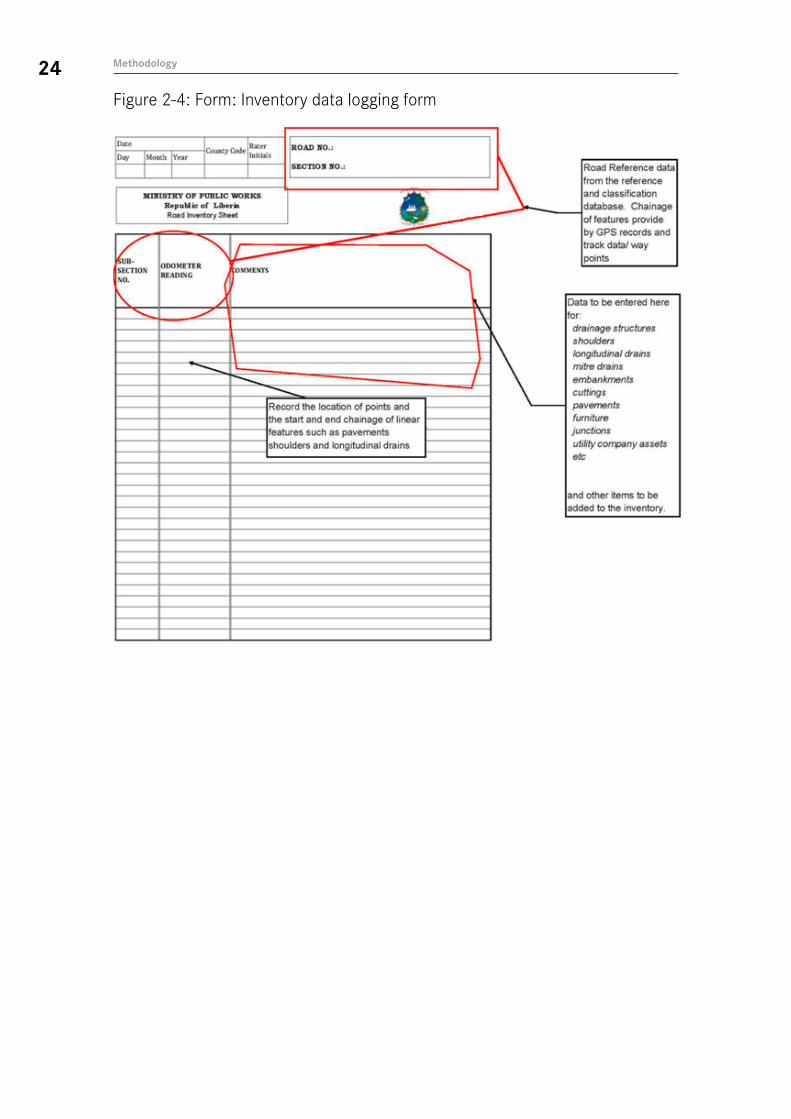
24Figure 2-4: Form: Inventory data logging form
Methodology

25
2.3.3 Road condition data base
The Road Condition Survey (RCS) was intended to populate a database related to the road inventory with information that can be used to determine the volume and cost of works to maintain the road network at a satisfactory level of serviceability.
An initial RCS has been undertaken on the primary roads to give a baseline survey for the re-launch-ing of planned maintenance and also to provide information for the evaluation of the investments needed for the rehabilitation exercise to bring roads back to a level of serviceability where they can be maintained15. Where a network has been allowed to deteriorate so that roads are no longer serviceable (at a satisfactory level-that allows economic transport operations), rehabilitation must precede maintenance.
The data that has been collected for the base line RCS refers to 2,943km of the primary network and a few secondary roads. Defects are identified for all parts of the inventory so that estimates can be made for the cost/effort required to reinstate the assets.
The following forms (Figure 2-5 and Figure 2-6) show the format of the data. Note that the defects are “measured” and expressed in numerical format with the aim of being as “accurate” as possible. In this context precision or accuracy is however relative. As an example, the condition surveyor will drive along a link and record an estimated figure of say 27m2 of potholes in the section. This figure will subsequently be used to estimate the repairs to be included in a works programme to be carried out in the next maintenance campaign which will take place several months later. The extent of potholes at this time will no longer be 27m2.
The data (“measured”) is information quality level 3 (IQL3). This type of data was a requirement of the software that was initially envisaged by the project for maintenance management purposes. It became clear that this software and the data requirements to “feed” it each year was inappropriate for the type of network (principally of a quality of rural gravel roads) and the level of experience of the network administration in Liberia. As a result, an alternative software solution was identified that uses IQL4 data (i.e. fuzzy data). This software (ROMAPS) is simpler to use, gives management reports that will prove more useful and is less data hungry.
Generally, conditions are expressed as:
excellent;
very good;
good;
fair; and
bad.
At calibration (for Liberia) a range of values will be attributed to each of these descriptions that are used in the calculation process when determinating work volumes. Prior to the annual “measure-ment” (or recording) of the road conditions, a workshop will be held when the terminology will be standardised so that different surveyors will have the same understanding of what “excellent” means for each condition described. Slight variations will arise but these are not significant and this process does produce reliable results.
The RCS must be updated each year to reflect the improvements/deterioration that has occurred since the previous exercise.
When ROMAPS is installed, training will be provided in the collection and maintenance of the condi-tion data in a format that is compatible with the database.
15 The distinction between maintenance and rehabilitation is made in chapter 7.1
Methodology

26Figure 2-5: Form: Data recording sheet for surfaced roads condition survey
Methodology
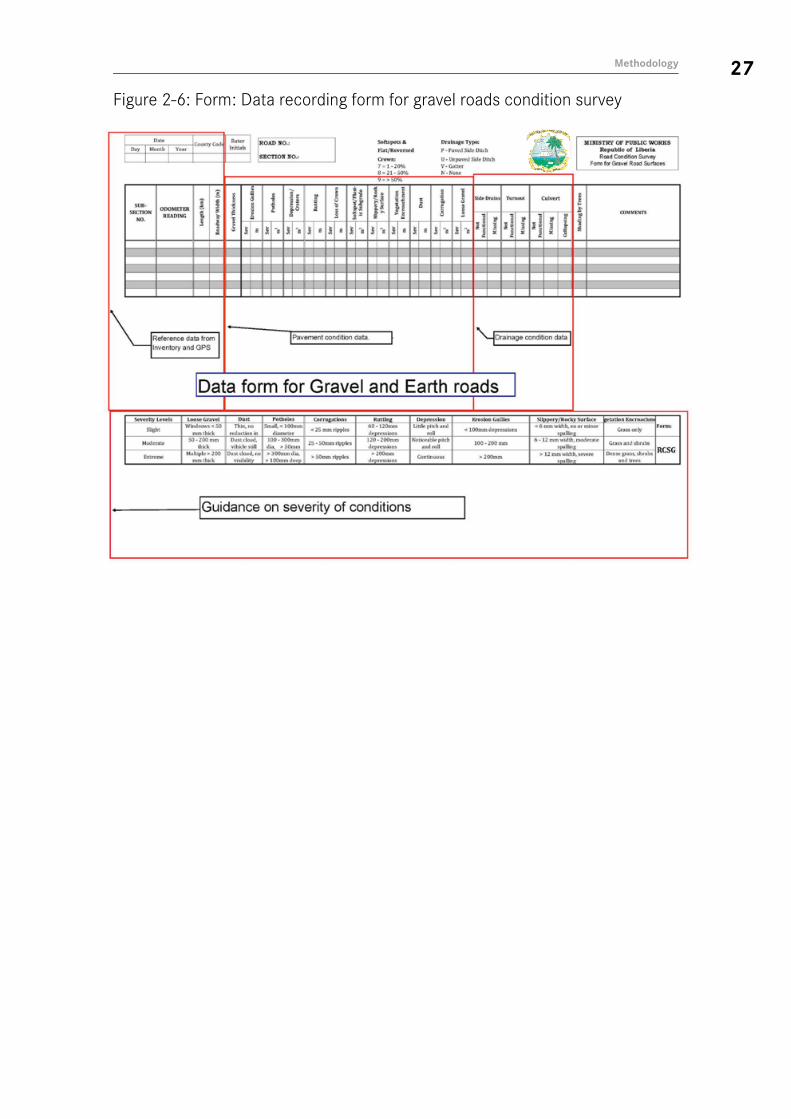
27Figure 2-6: Form: Data recording form for gravel roads condition survey
Methodology

28Note is possible to convert IQL3 data to IQL4. Thus the data collected to date will not be wasted pro-vided that there is not a signifi cant delay in establishing planned maintenance procedures.
The following table shows how the IQL3/IQL4 data sets would be related for surface condition on a paved road.
Tabl e 2-2: Surface condition assessment criteria and categories (paved roads)
Methodology
Source: TRL Overseas Road Note 5: A Guide to Road Project Appraisal
As part of the RCS the “Comfortable driving speed” (CDS) was determined on nearly all primary road links. The CDS is a surrogate value for the International Roughness Index (IRI) that is used in the economic analysis performed by RED to measure the cost/benefi ts of rehabilitation. High IRI equates to high vehicle operating costs.
2.3.4 Other data sources
There is a general lack of data and therefore reference was made to 1981 GIZ data. Information of the average growth in traffi c volumes between 1981 and 2010 on other roads was used provide fi rst-order estimates of the likely traffi c on these roads. It is advised that as soon as more up-to-date information becomes available, this data is replaced.
IMF forecasts of GDP were used to establish short-term growth trends – these were extrapolated to provide more long-term forecasts. Forecasts of population growth came from the “2008 Final National Population and Housing Census - Consolidated“, LISGIS”. Elasticities of demand for travel against growth in income derived from a limited amount of data on vehicle registrations held by the MoT and comparisons with the development in other West African countries.
Apart from publications of international organisations like WB, EC, UNDP, UNMIL, FAO etc. and appointments with representatives of them, short-term experts, engaged in the Master Plan for their different sub-sectors, met with high level representatives of the ministries and other authorities to collect information otherwise not available.
29Further important data have been collected from following Liberian authorities/institutions:
LISGIS Population Census 2008 data on county & district level also containing household data, Questionnaire of Population Census 2008 GIS Layers – systematic, segmentation and classification of roads
MoPEA Development Corridor Desk Study 2010, Economic Development Plan for Liberia from 1983, produced by GIZ
MoT The working group at the MoT was able to collect statistical data and documents as follows: data about freight movements of Freeport Monrovia, air movements, import of vehicles, vehicle registration/licenses, Driver Licenses, Sources of Revenue by MoT
MoPW Policy papers and statistics
JICA Urban Transport Master Plan for Monrovia 2010
2.4 Software tools
2.4.1 Roads Economic Decision Model – RED
The Highway Development and Management Model (HDM-4) is the tool of first choice developed by the World Bank to compare and rank projects. Although HDM-4 is the most widely applied frame-work for the economic analysis of road investments, “it (…) does not capture all the benefits associ-ated with low-volume roads investments. Most importantly, it requires inputs which are impractical to collect for vast networks with low traffic levels, such as surface layer materials’ properties and refined traffic data.”16 A simplified version of this product, appropriate for present conditions in Liberia, is the World Bank’s Roads Economic Decision Model (RED). RED is also a much simpler tool to use than HDM-4.
The RED User Manual17 states that the model was developed “to improve the decision-making pro-cess for the development ...of low-volume rural roads. The model performs an economic evaluation of road investment options18 using the consumer surplus approach and is customized to the char-acteristics and needs of low-volume roads such as the high uncertainty of the assessment of model inputs, particularly the traffic on and condition of unpaved roads, the importance of vehicle speeds for model validation, the need for a comprehensive analysis of generated and induced traffic.... RED computes benefits for normal, generated, induced and diverted traffic and takes into account changes in road length, condition, geometry, type accidents and days per year when the passage of vehicles is further disrupted by a highly deteriorated road condition (wet season).... The model is presented on a series of Excel 2000 Workbooks that collects all user inputs, presents the results in an efficient manner and performs sensitivity, switching value and risk analyses.”
RED uses an identical approach to HDM-4 for the determination of vehicle operating costs, but as-sumes no deterioration in road surface conditions with time. Given that maintenance costs are only small when compared to vehicle operating costs, this is reasonable. The user does, however, have to use engineering judgement in order to determine likely maintenance costs for both the “with” and “without” project options. Usefully, RED will also determine optimum rehabilitation expenditures if budgets are constrained.
16 The Roads Economic Decision Model (RED) for the Economic Evaluation of Low Volume Roads. Software User Guide & Case Studies.17 Sub-Saharan African Transport Policy Program (SSATP) Working Paper 78, “The Roads Economic Decision Model (RED) for the Economic
Evaluation of Low Volume Roads – Software User Guide and Case Studies”; Rodrigo Archondo-Callao.18 In the Liberian context, this should be seen as Road Rehabilitation Options.
Methodology
30In simple terms, RED assesses and compares the costs and economic benefits of rehabilitation or upgrading all of the links/sections in a network. The costs are based on the discounted whole life costs (rehabilitation/upgrading and subsequent maintenance for the effective life of the road), and the benefits are the savings to be made in reduced vehicle operating costs, shorter journey time, and any stimulus to economic activity. The costs/benefits are ranked for each project (link to be improved) in terms of the likely Economic Internal Rate of Return (EIRR) on the investment. All projects that pass a minimum threshold19 may be included.
If the volumes of diverted traffic and road distance savings can be assessed, RED vehicle operating costs can usefully also be applied to appraise missing network links.
When budgets are constrained RED seeks to maximise the Net Present Value of the investment.
As RED requires as inputs estimates of the costs for annual routine and periodic maintenance budgets, it is not a maintenance management tool - though both RED and HDM-4 do carry inventory data which can be used with average unit rates for maintenance for the different classes of road to give aggregated network budgets.
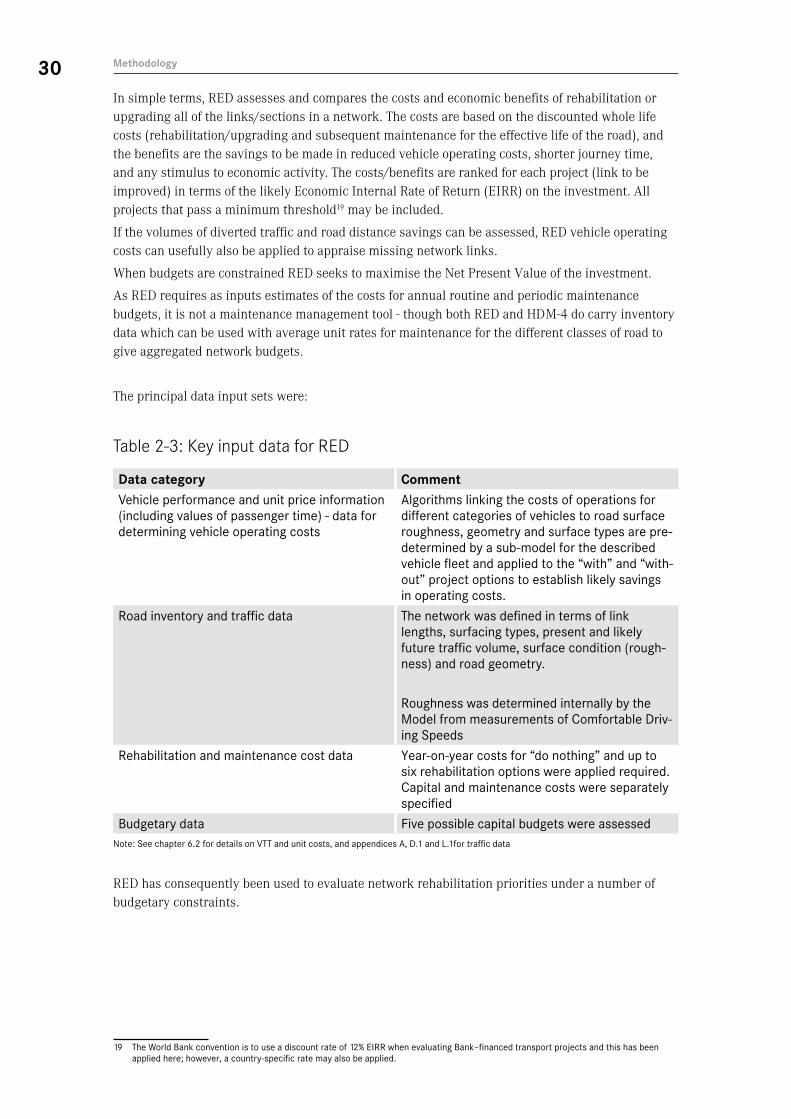
The principal data input sets were:
Table 2-3: Key input data for RED
Data category CommentVehicle performance and unit price information (including values of passenger time) - data for determining vehicle operating costs
Algorithms linking the costs of operations for different categories of vehicles to road surface roughness, geometry and surface types are pre-determined by a sub-model for the described vehicle fleet and applied to the “with” and “with-out” project options to establish likely savings in operating costs.
Road inventory and traffic data The network was defined in terms of link lengths, surfacing types, present and likely future traffic volume, surface condition (rough-ness) and road geometry.
Roughness was determined internally by the Model from measurements of Comfortable Driv-ing Speeds
Rehabilitation and maintenance cost data Year-on-year costs for “do nothing” and up to six rehabilitation options were applied required. Capital and maintenance costs were separately specified
Budgetary data Five possible capital budgets were assessedNote: See chapter 6.2 for details on VTT and unit costs, and appendices A, D.1 and L.1for traffic data
RED has consequently been used to evaluate network rehabilitation priorities under a number of budgetary constraints.
19 The World Bank convention is to use a discount rate of 12% EIRR when evaluating Bank–financed transport projects and this has been applied here; however, a country-specific rate may also be applied.
Methodology
31
2.4.2 Roughton International’s Maintenance Planning System – ROMAPS
ROMAPS is a system that has been designed (since 1980’s) for the management of gravel and paved roads to provide works programmes based on unconstrained budgets and available funds. Bill of Quantities, resources schedules and works programmes (based on task volumes, productivity and unit rates) are prepared for each link in a network. The system was conceived for developing countries and is currently being used in Albania, Belize, Botswana, Cambodia, Mauritius, India, and Uganda. Currently 90,000 km of roads are managed using ROMAPS in the developing world.
ROMAPS has a simple method of entering condition data (fuzzy data which is provided by the county staff). This form of data is readily understood and does not require a large investment in data acquisition on a regular basis; it does not require a readily understood large staff to prepare manage-ment reports and plans; it gives ownership of maintenance plans to the staff who are responsible for their implementation (who were involved in their production); and it imposes a methodical approach to the planning and implementation of maintenance taking account of national priorities, network hierarchy and available funds.
ROMAPS is simple enough to ensure that once installed it will assist in delivering national main-tenance objectives with a small but capable maintenance division set up in the Counties and the HQ of MoPW. Note that the staff to administer the works programmes will not be able to implement planned network maintenance if they do not have adequate levels of funding for works. The result will be neglect and the eventual (after a fairly short period) destruction of the highway assets.
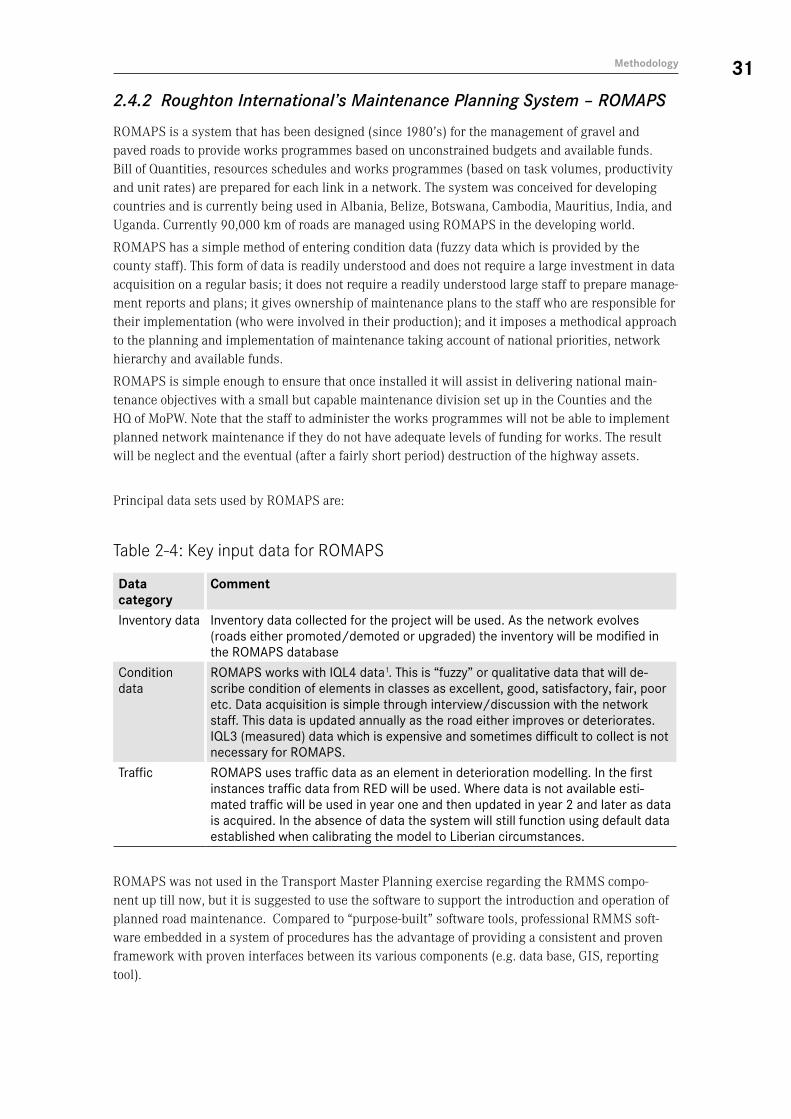
Principal data sets used by ROMAPS are:
Table 2-4: Key input data for ROMAPS
Data category
Comment
Inventory data Inventory data collected for the project will be used. As the network evolves (roads either promoted/demoted or upgraded) the inventory will be modified in the ROMAPS database
Condition data
ROMAPS works with IQL4 data1. This is “fuzzy” or qualitative data that will de-scribe condition of elements in classes as excellent, good, satisfactory, fair, poor etc. Data acquisition is simple through interview/discussion with the network staff. This data is updated annually as the road either improves or deteriorates. IQL3 (measured) data which is expensive and sometimes difficult to collect is not necessary for ROMAPS.
Traffic ROMAPS uses traffic data as an element in deterioration modelling. In the first instances traffic data from RED will be used. Where data is not available esti-mated traffic will be used in year one and then updated in year 2 and later as data is acquired. In the absence of data the system will still function using default data established when calibrating the model to Liberian circumstances.
ROMAPS was not used in the Transport Master Planning exercise regarding the RMMS compo-nent up till now, but it is suggested to use the software to support the introduction and operation of planned road maintenance. Compared to “purpose-built” software tools, professional RMMS soft-ware embedded in a system of procedures has the advantage of providing a consistent and proven framework with proven interfaces between its various components (e.g. data base, GIS, reporting tool).
Methodology

32
2.4.3 Geographical Information System – GIS
A GIS has the ability to relate different information in a spatial context and to reach a conclusion about this relationship. This is done by using a location reference system, such as longitude and latitude, and if necessary elevation.
For the spatial processing of the collected traffic census, road inventory and road condition survey data as well as of some other available statistical sources, e.g. the LISGIS Population Census data from 2008, ArcGIS was used.
LISGIS also provided a data file and GIS layer concerning the classification of the major road system in Liberia. Apart from road categories, the file contains information about road IDs, segments, length of segments, surface, etc. The road segmentation is shown on the GIS screen below.
Table 2-5: LISGIS Data – Classification of road system
Methodology
Figure 2-7: GIS Layer – systematic, segmentation and classification of roads
This data file was also used for the RED analysis (and can be used in future for analysed data from the ROMAPS software). ArcGIS is the spatial/digital interface between the different software compo-nents.
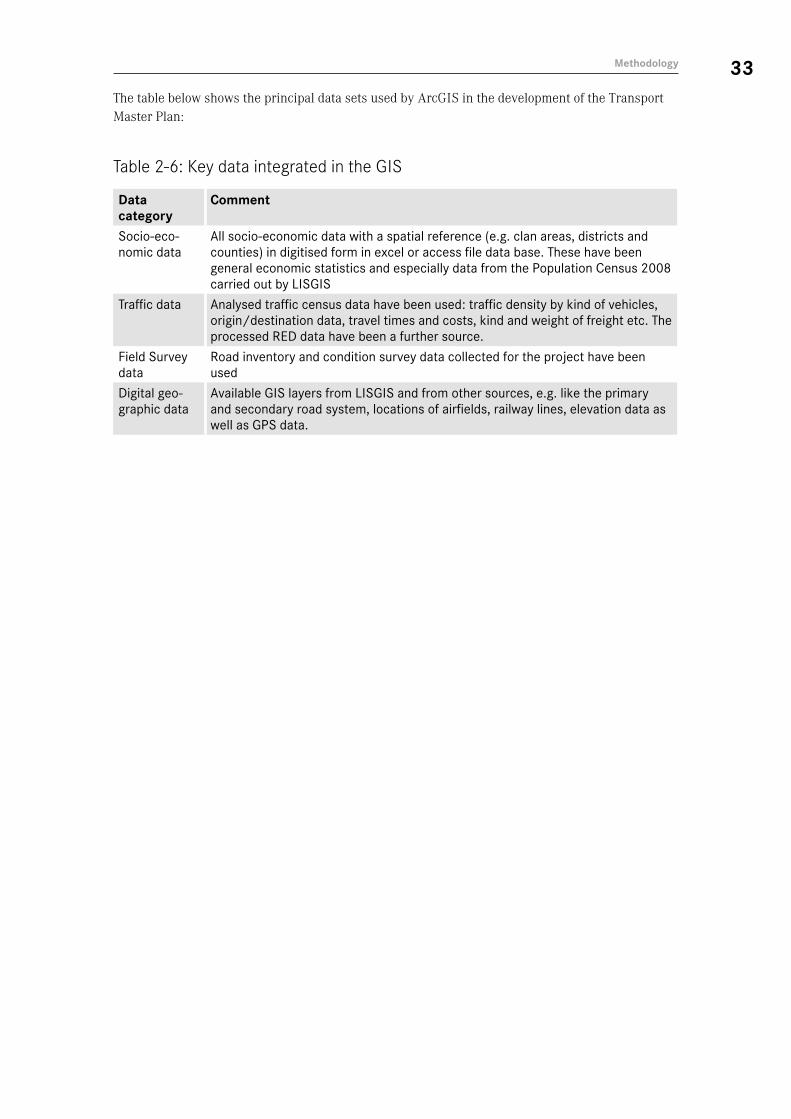
33The table below shows the principal data sets used by ArcGIS in the development of the Transport Master Plan:
Table 2-6: Key data integrated in the GIS
Data category
Comment
Socio-eco-nomic data
All socio-economic data with a spatial reference (e.g. clan areas, districts and counties) in digitised form in excel or access file data base. These have been general economic statistics and especially data from the Population Census 2008 carried out by LISGIS
Traffic data Analysed traffic census data have been used: traffic density by kind of vehicles, origin/destination data, travel times and costs, kind and weight of freight etc. The processed RED data have been a further source.
Field Survey data
Road inventory and condition survey data collected for the project have been used
Digital geo-graphic data
Available GIS layers from LISGIS and from other sources, e.g. like the primary and secondary road system, locations of airfields, railway lines, elevation data as well as GPS data.
Methodology
Ministry of Transport Parker House / Broad Street Monrovia, Liberia
Ministry of Public Works Lynch Street Monrovia, Liberia


