EVLA Project Book, Chapter 2: Science EVLA Project Book, Chapter 2 2 SCIENCE GOALS AND TECHNICAL REQUIREMENTS Rick Perley Michael Rupen Last changed: 20 April 2006 Revision History 2001-July-25: Initial release 2001-Nov-12: Added Experiments 2002-Jan-21: Added System Specifications 2002-Feb-07: Improved Polarization Specs. 2002-Mar-07: Continued improvement 2002-Mar-19: Added RFI section 2003-Sep-04: Reviewed and revamped requirements. 2004-Nov-30: Added Software Requirements, and updated. 2004-Dec-07: Reworded phase stability requirements, plus other minor corrections 2005-Aug-29: Correction of gain slope and ripple requirements 2006-Mar-29: Minor corrections 2006-Apr-20: Corrected headroom and gain ripple requirements. 2.0 Summary The scientific capability of the Very Large Array is severely limited by its 20-year-old technology. Virtually every experiment now scheduled on the VLA achieves far less than that which would be attained were the array outfitted with the instrumentation available today with current technologies. The primary goal of Phase I of the VLA Expansion Project is to enable the array to achieve its full potential through implementation of modern technologies. The basic plan is to retain the antennas, array design, and infrastructure, and to replace the electronics (which in nearly all areas date to the late 1970s) with modern systems. This strategy is exceedingly cost-effective, since the cost of new interferometric facilities is dominated by the antenna and supporting infrastructure costs. For the VLA Expansion Project, this major cost is avoided -- it is already paid for and is part of the investment. The implementation of modern technology on the VLA will increase its technical capabilities by at least an order of magnitude in every key observational area. This factor of improvement will enable new science which not only is currently unavailable on any existing telescope, but will enable areas of inquiry which could not have been anticipated when the telescope was first designed, nearly 30 years ago. This chapter describes a number of key scientific experiments, along with the technical capabilities that are required to enable them. The top-level technical requirements are combined and summarized in Section 2.2. A key component of the EVLA is the correlator. Top-level requirements for this are in Section 2.3. The sensitivity and wide-bandwidth characteristics of the EVLA electronics system will make the array especially vulnerable to radio-frequency interference. An overview of the plan to handle this is given in Section 2.4. Along with all new telescopes, the EVLA will make extensive use of, and be dependent upon, computing software. Section 2.5 gives the top-level software requirements.
Last changed: 20 April 2006 Revision History 2001-July-25: Initial release 2001-Nov-12: Added Experiments 2002-Jan-21: Added System Specifications 2002-Feb-07: Improved Polarization Specs. 2002-Mar-07: Continued improvement 2002-Mar-19: Added RFI section 2003-Sep-04: Reviewed and revamped requirements. 2004-Nov-30: Added Software Requirements, and updated. 2004-Dec-07: Reworded phase stability requirements, plus other minor corrections 2005-Aug-29: Correction of gain slope and ripple requirements 2006-Mar-29: Minor corrections 2006-Apr-20: Corrected headroom and gain ripple requirements. 2.0 Summary The scientific capability of the Very Large Array is severely limited by its 20-year-old technology. Virtually every experiment now scheduled on the VLA achieves far less than that which would be attained were the array outfitted with the instrumentation available today with current technologies. The primary goal of Phase I of the VLA Expansion Project is to enable the array to achieve its full potential through implementation of modern technologies. The basic plan is to retain the antennas, array design, and infrastructure, and to replace the electronics (which in nearly all areas date to the late 1970s) with modern systems. This strategy is exceedingly cost-effective, since the cost of new interferometric facilities is dominated by the antenna and supporting infrastructure costs. For the VLA Expansion Project, this major cost is avoided -- it is already paid for and is part of the investment. The implementation of modern technology on the VLA will increase its technical capabilities by at least an order of magnitude in every key observational area. This factor of improvement will enable new science which not only is currently unavailable on any existing telescope, but will enable areas of inquiry which could not have been anticipated when the telescope was first designed, nearly 30 years ago. This chapter describes a number of key scientific experiments, along with the technical capabilities that are required to enable them. The top-level technical requirements are combined and summarized in Section 2.2. A key component of the EVLA is the correlator. Top-level requirements for this are in Section 2.3. The sensitivity and wide-bandwidth characteristics of the EVLA electronics system will make the array especially vulnerable to radio-frequency interference. An overview of the plan to handle this is given in Section 2.4. Along with all new telescopes, the EVLA will make extensive use of, and be dependent upon, computing software. Section 2.5 gives the top-level software requirements.
EVLA Project Book, Chapter 2: Science 2.1 Illustrative Key Scientific Experiments The order-of-magnitude improvement of the VLA's capabilities brought by the EVLA Project will enable a broad spectrum of original science. In the following sections, I briefly describe some examples of demanding experiments, while reminding the reader that long experience has shown that the most exciting new science from any order-of-magnitude improvement in scientific capability is rarely anticipated. Thus, the areas of most exciting scientific impact of the project will likely not be known until after the project is completed! The reader should also keep in mind that the Very Large Array is fundamentally an extraordinarily flexible telescope, and was designed to enable research over a maximally broad range of astronomy. It is not a facility designed for a specific science goal, but is a facility intended to encourage research throughout all of astronomy. The EVLA Project will follow this same, successful, design philosophy.
2.1.1 Radio Observations of Gamma Ray Bursts Long an enigma, GRBs are now known to be extremely distant and powerful explosions (1052 - 1054 ergs) probably announcing the birth of distant black holes. The study of this phenomenon has undergone a renaissance since the launch of the Italian-Dutch satellite BeppoSAX, and the subsequent discovery of long-lived X-ray, optical and radio 'afterglows' of these explosions. Radio observations are key to understanding the physics on these objects. The current VLA enables detection of a few GRBs per year. This detection rate will rise to about 100 per year with the improved sensitivity of the EVLA. Observations of GRBs with the EVLA will permit:
• Determination of the complete spectral energy distribution. Combining EVLA data with that from the optical, submillimeter, infrared and X-ray portions of the spectrum will permit determination of the shape and evolution of the complete SED over ten orders of magnitude in frequency. This will be used to derive the total energy and ambient density of the surroundings, and to probe the physics of the particle acceleration in the expanding blast wave. As the radio portion of the SED is accessible throughout the expansion lifetime, it is particularly valuable in constraining theories. The sensitivity of the EVLA is expected to permit detailed study of dozens of GRBs per year.
• Determination of GRB sizes and expansion rates. The phenomenon of refractive interstellar scintillation (RISS) enables a size determination with a 'resolution' of a few microarcseconds, provided highly sensitive receivers are available at the appropriate radio frequency (which will be a function of the galactic latitude). With well-sampled, high SNR data, constraints on the geometry of the expanded emission region can also be placed. Polarization observations will also permit further constraints. The existing VLA can do this work on only one or two sources per year (and cannot detect their polarization). The EVLA should permit study of dozens of objects per year, with polarization information for most.
• The Geometry and Energetics of the Central Engines. Radio observations are needed on timescale of months to a year after a burst to discern the geometry of the outflow and to undertake unambiguous calorimetry of the afterglows. This will enable discrimination between wide-angle and narrow-angle jets. The long-lived nature of the radio afterglow will
EVLA Project Book, Chapter 2: Science
also allow an accurate measure of the total energy after the blast wave has transitioned to a non-relativistic velocity.
• Unbiased Tracer of Star Formation. Fewer than half of all GRBs exhibit optical afterglows, despite deep searches, and many others show clear signs of reddening. Dust extinction, originating within the circumburst environment or along the line-of-sight to the GRB host galaxy is the most likely cause of these 'dark bursts'. If so, then we can use the dust penetrating ability of radio afterglows to detect ahd localize dark bursts and use them to probe obscured star formation in the early universe.
Technical capabilities needed for these studies: • Maximum sensitivity within all EVLA bands. • Wide frequency coverage -- needed both for the determination of the spectral distribution,
and because observations of RISS will be made at the frequency where these refractive scintillations are strongest.
• Good polarization characteristics. Noise-limited polarization maps in the presence of a strong confusing background object are necessary.
• Rapid scheduling capability. The time and position of a GRB cannot be predicted. The array must be able to change programs and sources within a minute of the announcement of a new target of opportunity.
2.1.2. Separating starbursts from black holes in the early universe. To be added
2.1.3 Observations of Magnetic Fields in Galaxy Clusters Clusters of galaxies are filled with turbulent hot gas, relativistic particles, and magnetic fields. The hot gas is best observed by its thermal X-ray emission, but the relativistic components (fields and particles) are most readily observed at radio wavelengths. The role of the magnetic fields is potentially very important, as they affect energy transport, and may influence cluster evolution and dynamics. The only direct means of observing these fields is through radio polarimetric observations. Radio synchrotron emission and Faraday rotation measurements both indicate the presence of widely distributed magnetic fields within clusters. However, current instruments permit sufficiently sensitive observations on only a few, unusual, clusters -- those with unusually bright cluster synchrotron emission, and those with strong, extended, embedded radio sources. Are these known fields due to these embedded sources, or are they a general property of all clusters? Such questions can be answered only by an instrument of much greater sensitivity than those now available. The EVLA will vastly expand the number of clusters in which measures of the magnetic fields can be made, due to its order-of-magnitude improvement in sensitivity, and its outstanding polarimetric capabilities. These improvements will allow detailed imaging of the synchrotron cluster emission from hundreds of clusters, and will enable Faraday rotation studies using background sources seen through the clusters. The current VLA can achieve useful polarimetry on only one or two objects per cluster -- the EVLA will enable polarimetry on dozens of objects per cluster, thus allowing analysis on individual clusters. Technical capabilities needed for these studies:
• ~1µJy sensitivity at the lowest four frequency bands (1.5, 3.0, 6.0, and 10 GHz bands). • Noise-limited polarization imaging in the presence of a strong background object.
EVLA Project Book, Chapter 2: Science
2.1.4 Imaging the Formation of High-Redshift Galaxies behind Dusty Screens.
To be added.
2.1.5 Observing Ambipolar Diffusion and Thermal Jet Structures in Galactic Young Stellar Objects.
To be added.
2.1.6 Measuring the three-dimensional motion of ionized gas and stars in the center of our Galaxy.
To be added.
2.1.7 Unbiased Searches for Star-Forming Regions in Nascent Galaxies Dust obscuration prevents optical studies of QSO absorption line systems with HI column densities > 1022 cm-2. These high column density systems provide the most detailed information on the dense, (pre-) star-forming ISM in nascent galaxies. The major difficulty in studying these high column density systems is finding them, since optical selection cannot be used. To date, only four such redshifted molecular absorption line systems are known, all seen toward 'red quasars', -- flat spectrum radio sources with faint, or absent, optical counterparts. Searches for molecular absorption line systems with the current VLA are essentially precluded due to the limited bandwidth (100 MHz) and number of spectral channels (16 at that bandwidth). The EVLA will provide the capability for such searches through very wide band spectroscopy with many channels – a capability enabled by the unique design of the WIDAR correlator. For example, in 24 hours with a single frequency the EVLA could survey the frequency range of 30 to 38 GHz with 16384 channels, corresponding to a velocity resolution of 5 km/s (characteristic of molecular absorption line systems), to an rms sensitivity of 0.16 mJy/channel. This corresponds to a 5-sigma detection of 30% absorption (again, characteristic of molecular absorption systems) towards 2.5 mJy sources, of which there are about 7 per square degree. Possible lines include the first order transitions of CO, HCN, and HCO+ at redshifts between 1.3 and 2.8. The wide bandwidths of the EVLA's receiver bands, combined with the WIDAR correlator, will also enable searches for CO emission from high redshift galaxies, (corresponding to z > 1.3 for 1-0, and z > 3.7 for 2-1), and for water megamaser emission.
Technical capabilities needed for these studies:
• Addition of the 28 - 40 GHz band. • LO/IF and receivers providing 8 GHz contiguous bandwidth in each polarization in the 18-
26, 26-40 and 40-50 GHz bands.. • A correlator providing ~10 km/sec velocity resolution, over the 8 GHz bandwidth, for both
parallel-hand correlations. This corresponds to 16384 channels.
2.1.8 Coronal Magnetography in Solar Active Regions Solar active regions are localized areas on the Sun where magnetic flux has erupted through the photosphere into the chromosphere and corona. As their name implies, solar active regions are the sites of various kinds of solar activity: solar flares, radio bursts, enhanced coronal heating, and mass ejections. A key goal in solar physics is to understand their birth, evolution, and decay, the role of
EVLA Project Book, Chapter 2: Science electric currents, and the origin of transient, energetic activity. Addressing this goal requires detailed measurements of the coronal magnetic field. The EVLA will offer the unique capability of obtaining such detailed measurements, through rapid imaging observations over a wide range of frequencies. When the magnetic field is sufficiently large (> ~100 Gauss), gyroresonance opacity is the dominant source of opacity in solar active regions. Radio waves with frequencies which are low integer multiples of the electron gyrofrequency may be resonantly absorbed and emitted by electrons gyrating in the local magnetic field. For example, the electron gyrofrequency in a 600 Gauss magnetic field is 1.7 GHz, the third harmonic of which lies in the 5 GHz band. Given sufficient spectral and spatial resolution, one can exploit gyroresonance absorption to place unique constraints on the magnetic field at the base of the corona; that is, to perform coronal magnetography. There are no other techniques available to measure strong fields in the Sun's corona. Coronal magnetography works because solar images made at a given frequency show the brightness at the level and temperature where the emission process becomes optically thick (due to gyroresonance absorption). The emission is typically at a brightness temperature which is similar to the effective temperature of the corona -- ~3 million degrees. At a higher frequency, the resonance condition is matched at higher magnetic field strength, which occurs at a lower height in the corona. At some critical frequency, this resonance condition is matched at the base of the corona. For frequencies above this, the brightness temperature drops precipitously as the resonance layer moves into the transition region and chromosphere where the effective temperature is much lower. High-resolution images made over a wide range of frequencies may therefore be converted into a map of the magnetic field at the base of the corona. With care, the field vector may also be constrained. Coronal magnetography provides the most direct means available of estimating the magnetic field at these heights. It would provide an invaluable tool for assessing departures of the field from potential configurations in active regions, and for assessing the role of electric currents. A more ambitious goal is to infer the three-dimensional distribution of magnetic fields (and currents). At a given frequency, the gyroresonance emission originates from an isogauss surface. Tuning across a broad range of frequencies ``peels the magnetic onion'', and provides a three-dimensional map of the brightness temperature as a function of magnetic field strength. Such measurements, when coupled with vector magnetic field measurements at photospheric and chromospheric heights, will impose powerful new constraints on field extrapolations. High-resolution imaging observations at many frequencies over a broad bandwidth are needed to exploit the techniques outlined above. While the VLA currently provides sufficient angular resolution, the continuous frequency coverage and the large bandwidth ratios of the EVLA are essential to mapping out the detailed magnetic field structure of the corona. Use of the EVLA to image solar phenomena presents is very challenging technically. The antennas, when pointing at the sun, will see their system temperatures rise from typically 30K to as high as 105 K (at 1.5 GHz). The active sun, which is of considerable scientific interest, will raise these temperatures to as high as 3 x 10⁵ K. And powerful flares can raise the temperature to over 108 K – requiring a calibrated attenuation of over 60 dB, if good imaging is to be enabled.
Technical capabilities needed for these studies: • Full frequency coverage between 1 and 20 GHz. • Full polarimetry within these bands.
EVLA Project Book, Chapter 2: Science
• The ability to reduce the system gain sufficiently (by more than 40 dB, and up to 60 dB) and accurately (so the true flux density of the solar activity can be recovered) to keep the solar emission from saturating the receivers.
• The ability to rapidly change antenna gain in response to solar flares.
2.1.9 Mapping the Changing Structure of the Dynamic Heliosphere The heliosphere is a cavity, extending to perhaps 100 AU, which is inflated by the solar wind, and which is filled with a tenuous magnetized plasma called the interplanetary medium (IPM). Radio interferometers can deduce the solar wind speed and acceleration profile, measure properties of the turbulence and magnetic fields, and map large-scale structures by measuring the angular broadening, intensity scintillations and rotation measure fluctuations of background sources viewed through the IPM. Currently, such studies are limited by the VLA's sensitivity – few background sources are strong enough to permit detailed study. The greatly increased sensitivity of the EVLA will provide access to large numbers of background sources strong enough to enable determination of the properties of the solar wind turbulence along many lines of sight over the course of a single observing run. More exciting still is the prospect of mapping the large-scale transient disturbances (coronal mass ejections -- CMEs) in the IPM. With the EVLA, a 10-minute observation would give on average five to twenty sources at 100 times the rms noise per primary beam in the 2 - 4 GHz band, while greater numbers will be available at lower frequencies.
Technical Capabilities Needed for This Work:• Maximum sensitivity in the 1-2 and 2-4 GHz bands (1 microJy rms in 12 hours). • A wide-band correlator, to provide full polarimetry over the entire bandwidths. • Accurate noise-limited polarization imaging in the presence of strong background sources.
2.1.10 Bistatic Planetary Radar Observations Bistatic radar observations offer a unique probe of material beneath the solid surfaces of planets, moons, and asteroids. The EVLA will offer two major advances for these studies: the ability to observe at 13 cm (2.3 GHz), allowing the VLA to take advantage of powerful 13 cm transmitters at Arecibo and Goldstone; and high enough frequency resolution to make Doppler images of even the smallest bodies in the solar system. Radar observations of planetary surfaces yield important and unique information on their surface and near-surface structure and composition. Currently the VLA, in combination with the Goldstone 70m antenna, is one of the two most powerful 3.6 cm (8.4 GHz) radar instruments in the world (the other being Arecibo). With the combined Goldstone-VLA instrument, it is possible to unambiguously image the surfaces of Venus, Mercury, and Mars with resolutions as good as 100 km, and to probe the surfaces of the Galilean satellites and Titan. Such observations have led to some of the most exciting results in planetary science in recent years, including the discovery of ice deposits in the polar regions of Mercury, the discovery that significant differences between the ice caps of Mars extend to large depths, the discovery of a huge region near the equator of Mars which reflects no detectable energy (dubbed “Stealth''), and the discovery that Titan has no deep global ethane/methane ocean, contrary to theoretical predictions. The EVLA will extend these impressive results to the other major planetary radar frequency (2.3 GHz) and will allow Doppler imaging of sources as small as the asteroids.
EVLA Project Book, Chapter 2: Science
2.1.10.1 13 cm Radar: Surface Textures
When an electromagnetic wave is transmitted toward a surface, the amount of energy scattered toward the transmitter is most heavily dependent upon the ``roughness'' (or ``texture'') of the surface on size scales of the order of the wavelength of the electromagnetic wave. Measurement of the reflected power yields information about the radar reflectivity, and therefore the composition, of the surface. Comparison of the scattering seen in the sense of circular polarization opposite to that transmitted (due to flat-facet reflections from a dielectric interface) to that seen in the same sense (caused by multiple reflections or by certain types of ices) yields additional information about surface roughness on scales comparable to the wavelength. So, at 3.6 cm (8.4 GHz), surface structures from slightly sub-cm to some tens of cm are most important, and dictate the amount of received flux. Going to longer wavelengths (such as 13 cm) provides information on surface roughness at larger scales, approaching 1 m. This is very important additional information regarding the state of the surface. Both the Goldstone 70m and the Arecibo antennas are equipped with very powerful 13 cm (2.3 GHz) transmitters, and could be used in combination with the VLA. While the upgraded Arecibo system will have more power (on the order of 1 MW through a 300m dish), the Goldstone transmitter (420 KW) is still very important due to its full-sky coverage, which is particularly important for comets and asteroids. The lack of a 13 cm (2.3 GHz) system at the VLA is the only bottleneck preventing very fruitful collaborations with both Arecibo and Goldstone in this area. From 13 cm radar observations, in combination with 3.6 cm measurements already made, constraints on the depth of the very peculiar “Stealth'' region of Mars and on the thickness of polar ices on Mars and Mercury could be obtained. Such observations would also provide the first good polarization measurements of Venus, greatly enhancing the usefulness of radar data from the Magellan mission (which provided only single-polarization radar); 3.6 cm observations are severely compromised by attenuation by the Venusian atmosphere.
2.1.10.2 High-resolution Doppler Imaging Because different portions of a rotating planetary surface are approaching the radar line-of-sight at different velocities, the received radar power is spread in frequency by some amount. At 8.4 GHz, this spread varies from about 27 kHz for Mars to about 50 Hz for Venus. Typical bandwidths for asteroids are on the order of 100 Hz. The frequency spread scales linearly with frequency, so 2.3 GHz widths are about a factor of four smaller. With the current VLA correlator, the smallest channel width available is 380 Hz for a single IF: only the largest of the asteroids are resolved in frequency, and only if data from only one polarization is recorded. For a typical Goldstone-VLA radar observation, unless one is willing to give up the polarization information, the minimum channel width is 760 Hz. Unfortunately, this is wider than all of the returned signals except for Mars and barely comparable to those from the icy satellites. Because of inadequate resolution, Doppler information is lost; in addition, a penalty is paid in signal-to-noise ratio, since in those frequencies where there is no radar echo power, there is still noise power. In fact, in order to maximize the signal-to-noise on a particular surface feature, a channel width equal to the equivalent frequency spread of that feature is desirable. Again, this is currently obtainable for Mars, but not for any other body. The new correlator provided by the EVLA will remove these restrictions, giving frequency resolutions of a few Hz over bandwidths of many kHz. In the case of Titan, such data could be used to calculate
EVLA Project Book, Chapter 2: Science the position of the rotational pole, about which almost nothing is known. Determination of the rotational parameters of asteroids could also be done throughout the main belt, in association with the upgraded Arecibo telescope at 13 cm (2.3 GHz).
Key Capabilities Needed for this Science: • The 2-4 GHz band with maximum sensitivity. • A correlator providing:
o 1024 channels with resolution as fine as 1 Hz in all four polarization correlations, and o The capability of simultaneously providing the high-resolution spectra and a broadband
'continuum'.
2.1.11 Structure and Orientation of the Galactic Center's Magnetic Field A strong and highly ordered magnetic field pervades the central region of the Galaxy. This field is oriented vertically to the Galactic plane and is two to three orders of magnitude stronger than the field in the Galactic disk. The primary evidence for the vertical magnetic field comes from VLA observations which reveal a system of long (tens of parsecs) and narrow (<0.5 pc) non-thermal filaments and thread-like structures oriented perpendicular to the Galactic plane. These synchrotron-emitting filaments are strongly linearly polarized with their intrinsic magnetic fields remarkably well aligned along their length. However, their generation remains an enigma. The Expanded Very Large Array will make a number of major contributions to our understanding of the role of magnetic fields in the Galactic center region, and hence near the nuclei of other spiral galaxies as well. Spectral indices and linear polarizations will be obtained easily for even the faintest known filaments; rotation measure studies will reveal the magnetic field configuration within individual filaments and within in the entire central region -- several degrees across. Zeeman measurements will be extended to many more masers and absorption lines, and even to the radio recombination lines that trace the ionized gas as a whole. Sensitive imaging of the broadening of OH masers near the galactic center will give direct information on the magnetic field structure and the nature of the scattering material. The result will be a far clearer and more complete picture, on both large and small scales, of the strength and topology of the magnetic fields in the Galactic center region. The increased sensitivity of the EVLA will allow a factor of >4 more sensitive imaging with complete polarization and spectral information of the filaments over the entire region. This will provide a far superior characterization of the distribution, structure, spectral index, and polarization properties of the filaments on sub-arcsecond scales, and may confirm the ubiquity of these features, as well as revealing the overall field configuration in the central regions of the Galaxy. Such measurements are essential to study the details of the interactions between magnetic filaments and associated ionized gas, which are currently thought to provide a mechanism for acceleration of particles and the subsequent synchrotron radiation. Sensitive polarimetric studies of the filament emission within the 1.5 GHz band will allow determination of the rotation measure (RM) of the gas between us and the filaments, giving information on the longitudinal component of the magnetic fields and thermal gas density in the intervening material. Current studies are limited by the high rotation measure to the 5 GHz band, which limits the field of view to nine arcminutes. The EVLA will allow these studies to be undertaken
EVLA Project Book, Chapter 2: Science at the 1.5 GHz and, for which the field of view is 0.5 degrees -- encompassing the entire region of interest. Recent VLA observations of the Zeeman splitting in spectral lines of H1 and OH in absorption have given direct measurements of very strong magnetic fields (1 – 5 milliG) in the Galactic center region. Fields this strong may dominate the dynamics, and thus control the fueling of the central engine; the conversion of the substantial magnetic field energy may also dominate cloud heating near the Galactic center. These measurements are at the limit of the current VLA's sensitivity. The EVLA will improve the current measurements and increase the number of detections substantially. The much-increased bandwidth will also allow simultaneous searches for, and measurement of Zeeman splitting in a large number of masers. Finally, the EVLA will for the first time allow the detection of the Zeeman effect in radio recombination lines -- giving critical information on the magnetic fields within the HII regions located in this region. This is a difficult observation, requiring multiple transitions to be averaged together to increase the sensitivity, while retaining high spectral resolution; high spatial resolution is also critical, to avoid kinematic broadening of the lines. The EVLA will give a factor of 5 - 10 improvement by allowing simultaneous observations of all or most of the RRLs within one band. Preliminary estimates indicate that the 3 GHz band, within which there are approximately 30 RRLs, is optimal for this study. Point-like radio sources (generally, OH masers) observed through the turbulent medium near the Galactic center are scatter-broadened, with measured sizes of more than an arcsecond at 1.6 GHz; the scattering region covers at least 25 arcminutes. The scattering disks themselves are elongated due to anisotropies in the ionized scattering medium, which in turn presumably reflect the orientation of an ordered magnetic field. Previous VLA work observed five masers per day, each requiring a separate frequency tuning of the array. The new correlator of the EVLA will allow the entire inner 30~arcminutes to be searched simultaneously for OH masers, with sub-km/sec channels, over a huge velocity range (3000 km/sec). This would map the sizes and orientations of the scattering disks across the entire region in a single observation, yielding direct information both on the magnetic field structure, and on the scattering material itself.
Technical capabilities needed to achieve these goals: • Maximized sensitivity in all bands – noise limited in the presence of a strong
background object. • Accurate polarimetry across the full bandwidth in all bands. • Correlator resolution sufficient to resolve H and OH maser lines. • Correlator flexibility capable of simultaneous observation of at least 16 recombination
lines within one frequency band, in both parallel-hand correlations. • Addition of the 2-4 GHz band.
2.1.12 Large-Scale Mapping of Star-Forming Molecular Clouds Submillimeter cameras on single-dish telescopes such as the JCMT are now being used to survey large areas of individual star-forming molecular clouds in order to provide a complete census of different phases of early protostellar evolution. Such studies are vital for understanding the formation of stars in molecular clouds, and rely on the thermal emission from dust as a tracer of protostars so deeply embedded in their natal cloud cores that they are often not detected in the infrared. However, the resolution provided by these telescopes, while representing a huge improvement over other survey
EVLA Project Book, Chapter 2: Science instruments sensitive to similar emission processes such as IRAS, is still 1000 AU or worse for even the nearest molecular clouds. This is many times the size of the Solar System, and is insufficient for investigating the formation of multiple protostellar systems, or for separating the emission from a forming proto-planetary disk from the more extended cloud core. Thus, the sub-arcsecond resolution provided by the submillimeter interferometers SMA and ALMA currently under development will be essential for investigations of stars and planetary systems. However, dust emission at submillimeter wavelengths can be optically thick -- particularly in the inner regions of circumstellar disks. Furthermore, submillimeter wavelengths are not useful for tracing the ionized gas in hyper- and ultra-compact HII regions associated with the earliest phases of massive star formation. Without measurements at lower frequencies, the picture of star formation available to submillimeter instruments will be incomplete. In particular, surveys of star-forming molecular clouds at 8 GHz and at 45 GHz will be needed for establishing the relative contributions from ionized gas (both in HII regions and in jets and winds) and optically-thick dust. The EVLA will therefore be essential for providing the resolution and the sensitivity to the thermal emission processes associated with star formation. As star-forming molecular clouds are often very large, the ability to mosaic these regions is vital. As an example, the Orion Molecular Cloud harbors the nearest region of massive star formation (D ~ 450 pc), and as such provides the highest spatial resolution for understanding the formation of stars of all masses in a cluster environment. The 10’ x 50’ section of Orion A cloud recently mapped by Johnstone and Bally in 850 and 450 µm dust continuum emission contains IRc2, the BN object, many dense cores and embedded low-mass protostars, and also lies behind the Orion Nebula. The same area can be covered by the EVLA with a 3σ sensitivity to dust emission at 45 GHz of 0.1 MÁ/beam in 80 hours of on-source integration incorporating ~ 2000 separate pointings. Observations at 8 GHz will also be needed to separate the contributions from ionized gas associated with the embedded protostars and the foreground HII region. A similar amount of time is sufficient to survey 1 square degree of the more nearby (D ~ 140 pc) low-mass, star-forming Taurus Molecular Cloud, to a sensitivity of 0.015 MÁ/beam. Such a survey would be complete for all embedded protostars in the cloud. The Orion B region, on the other hand, is several arc minutes in extent and contains young stars at all stages of evolution, including a ridge of dense molecular cores some of which contain deeply-embedded protostars, and an infrared cluster associated with a spectacular HII region. The possibility that the molecular cores are protostellar or pre-protostellar in nature is extremely exciting: massive protostars evolve so quickly that they are usually observed only after they have already reached the main sequence. It has been suggested that the formation of the protostars in the dense molecular ridge may have been triggered by the expansion of the HII region into the surrounding cloud, an idea that has important implications for sequential star formation in stellar clusters and associations, and could also provide insight into star formation in starburst and interacting galaxies. The details of this process can only be tested through high-angular resolution (~ 1"), high sensitivity (~ 1K) observations of the molecular and ionized gas. The kinematics of the latter component can be studied using radio recombination lines in the 6 GHz band -- these observations would be used to look for evidence of expansion. The dynamics of the dense molecular gas associated with the protostars can be traced by the J=1--0 transitions of CS (49 GHz) and SiO (43 GHz) to search for evidence of cloud collapse or energetic outflow. However, as the VLA’s primary beam at these frequencies is approximately 60", these observations must be done in mosaicing mode, which will require extremely good antenna pointing.
EVLA Project Book, Chapter 2: Science Often the EVLA’s sensitivity will be such that scientifically productive work can be accomplished with integration times of a few seconds or less. At the same time, the angular sizes of target sources can be many times the angular size of the VLA’s primary beam. This will especially be so for the high frequency bands, and invites the use of a rapid mosaicing mode – the capability of taking interferometric visibility data while the antennas are in constant motion. This technique, well known in single-dish work, is termed ‘On the Fly Mapping’. Estimates are that the VLA’s antennas will be able to track accurately (meaning both that they can move smoothly, and that the position of the antennas will be known) at a rate of up to ten times the sidereal rate – or 150 arcseconds/second of time. The scientific payoff of this is very valuable. If the antennas can move at ten times the sidereal rate using the ‘On the Fly Mapping’ technique in mosaicing mode, then the whole of the Taurus Molecular Cloud -- an area of approximately 25 square degrees -- could be covered in only 12 hours to a 3σ sensitivity limit of 2 mJy/beam at 45 GHz, corresponding to 0.2 M /beam.
Technical Capabilities Needed for this Work: • Antenna pointing (via referenced pointing) with an r.m.s. accuracy of 3" • An antenna tracking capability to permit interferometric observations while the
antennas are moving (‘On-The-Fly Imaging’) at rates of up to ten times sidereal. • 43 GHz point-source sensitivity of 0.4 mJy (1 K in a 1" beam) in a 1km/s channel in 12
hours.
2.1.13 Pulsar Science with the EVLA
2.1.13.1 Astrometry -- Proper Motions For most pulsars, astrometry will move from 1.5 GHz to the 4 - 8 GHz band. This has many benefits, including reduced dispersion smearing and a narrower pulse which improves the gain from pulsar gating, less ionospheric distortion, a beam size reduced by a factor of four, reduced artifacts due to pulsar scintillation, and a larger available bandwidth. Even after considering that the typical pulsar has only 6% the flux density at 6 GHz that it does at 1.5 GHz, the EVLA positional sensitivity in the 4 to 8 GHz band will be a factor of about 80 greater than the VLA's current sensitivity at 1.5 GHz. To date, only about 100 of the 1200+ known pulsars have reliably measured proper motions, and most of these are the bright, nearby pulsars. By increasing the number of pulsar proper motions, especially those of distant pulsars, systematic studies of pulsar velocities become possible. With the EVLA, proper motions of 100 distant pulsars could be measured over a period of five years in three 50-hour observations with typical uncertainties of 0.5 mas/year. These data will allow questions of pulsar birth velocity distribution and the pulsar dipole magnetic field decay timescales to be addressed.
Key Technical Requirements for this project: • Maximum sensitivity in the 4 - 8 GHz band. • Correlator with 1024 phase bins with < 100 microsec resolution. • Ability to phase the array with > 256 MHz bandwidth.
2.1.13.2 Pulsar Emission Mechanisms
One of the open questions in pulsar astronomy is the nature of the plasma processes giving rise to the observed radio radiation. Simultaneous monitoring of the pulsar magnetosphere at multiple frequencies provides a detailed look at the processes. Co-ordinated observing from multiple observatories is difficult, due in large part to instrumental differences. The unique capability of the VLA to observe
EVLA Project Book, Chapter 2: Science simultaneously multiple frequencies has provided unique information about the emission region. But the limited bandwidth (50 MHz) of the current VLA has constrained observations to time resolutions of 20ns. The wide bandwidth of the EVLA will allow both higher time resolution observations, and will enable single pulse detection at higher frequencies. The ability of the EVLA to be divided into simultaneous multiple phased subarrays will provide for true multifrequency observation.
Key Technical Capabilities required for this project: • Up to 5 simultaneous subarrays • Wide-band (1 GHz) phased array capability for each subarray. • Continuous data acquisition (no periodic data interrupts).
2.1.13.3 Pulsar Timing Experiments The timing of pulse arrival times from millisecond pulsars (MSP) provides a unique method to prove general relativity in the strong field regime. Measurements of Shapiro delay, perihelion shift and now spin-orbit coupling have been observed in a few binary MSPs, providing some of the best evidence that the theory of general relativity is correct. To date, the pulsar with the most stable timing is J0437-4715, with timing uncertainties of 100 nsec. With large bandwidths being opened to radio astronomy in this decade, the probability of discovering even stabler pulsars increases. In order for the EVLA to remain competitive in this science, the absolutely timing precision must be significantly better than 100 nsec. Ken Technical Capabilities required for this project:
• Correlator capable or providing ~ 1nsec internal timing in phased array mode. • Knowledge of absolute time accurate to 10 nsec.
2.1.14 The Structure of a Cluster of Galaxies, plus an HI Pencil Beam Survey At a redshift of about 0.1, an entire cluster of galaxies can be observed with a single pointing of the VLA. A single 36-hour integration can then give the spatial and kinematic distribution of all the gas-rich objects in and around the cluster. Such an integration, using the C-configuration to provide some spatial resolution, would (at z = 0.1) allow a 6-sigma detection of 700 million solar masses of HI with a 100-km/sec line width. Half of the EVLA correlator would then provide 3.2-km/sec resolution in both parallel-hand polarizations, providing detailed kinematic information. This spatial and velocity distribution of the gas rich galaxies will provide information on the dynamical state of the cluster -- whether it is relaxed or still collapsing. This resolution will also enable absorption studies on the bright continuum background objects, as well as reveal subtle kinematics of the interaction between the IGM and ISM. The velocity coverage of 13,000 km/sec is twice that needed to cover a typical cluster rich cluster, so many foreground and background spirals will be detected. The 3km/sec resolution will make it possible to derive useful Tully-Fisher distances to the galaxies, and thus to probe deviations from the Hubble flow out to many Mpc from the cluster. These observations will also provide a useful database to compare with cluster studies at higher redshifts aimed at determining the evolution of the gas content in clusters.
EVLA Project Book, Chapter 2: Science As the 1-2 GHz band should provide good sensitivity to frequencies below 1 GHz, and the entire band is always available to the correlator, the 'unused' half of the correlator from the observation described in the previous paragraph can be employed in analyzing the entire spectrum from 900 to 1400 MHz -- corresponding to redshifts out to ~0.6. This will provide a resolution of ~ 40 km/sec, and with the same 36-hour integration, HI masses of 4 x 10^9 solar masses can be detected at z = 0.2, implying that galaxies with modest HI content can easily be detected. Each such integration should give detections of a few hundred galaxies in HI. However, this part of the spectrum is heavily used by aeronautical systems, and very strong RFI is common. These strong signals (whose peak power exceeds that of the entire 1 GHz bandwidth noise by more than an order of magnitude) require a signal transmission system and a correlator with very high linearity, plus the ability to 'tune around' signals which drive the system outside its linear region.
Technical Requirements for this science: • High sensitivity between 1 and 1.4 GHz. • Instantaneous bandwidths > 512 MHz. • 16000 channel correlator that can process 512 MHz of spectrum in two simultaneous
modes. • Very highly linear signal transmission system and correlator. • A correlator that can avoid extremely strong spectral features.
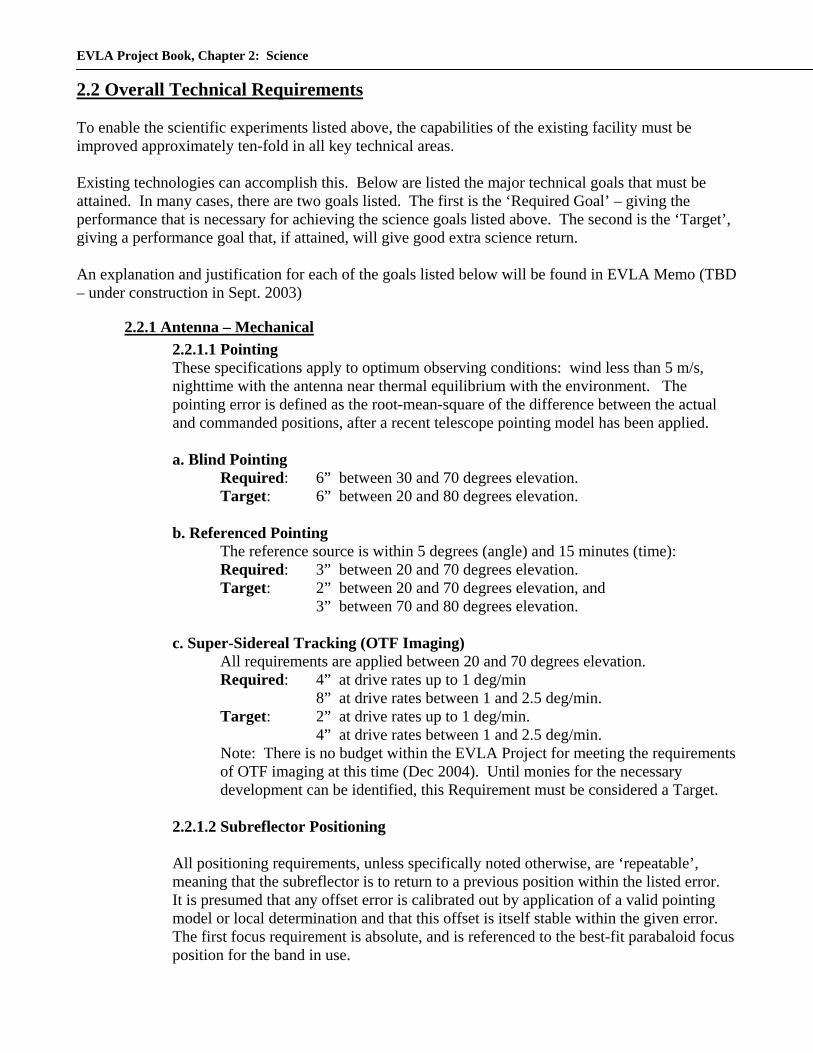
EVLA Project Book, Chapter 2: Science 2.2 Overall Technical Requirements To enable the scientific experiments listed above, the capabilities of the existing facility must be improved approximately ten-fold in all key technical areas. Existing technologies can accomplish this. Below are listed the major technical goals that must be attained. In many cases, there are two goals listed. The first is the ‘Required Goal’ – giving the performance that is necessary for achieving the science goals listed above. The second is the ‘Target’, giving a performance goal that, if attained, will give good extra science return. An explanation and justification for each of the goals listed below will be found in EVLA Memo (TBD – under construction in Sept. 2003)
2.2.1 Antenna – Mechanical 2.2.1.1 Pointing These specifications apply to optimum observing conditions: wind less than 5 m/s, nighttime with the antenna near thermal equilibrium with the environment. The pointing error is defined as the root-mean-square of the difference between the actual and commanded positions, after a recent telescope pointing model has been applied. a. Blind Pointing Required: 6” between 30 and 70 degrees elevation. Target: 6” between 20 and 80 degrees elevation. b. Referenced Pointing
The reference source is within 5 degrees (angle) and 15 minutes (time): Required: 3” between 20 and 70 degrees elevation. Target: 2” between 20 and 70 degrees elevation, and 3” between 70 and 80 degrees elevation. c. Super-Sidereal Tracking (OTF Imaging) All requirements are applied between 20 and 70 degrees elevation.
Required: 4” at drive rates up to 1 deg/min 8” at drive rates between 1 and 2.5 deg/min. Target: 2” at drive rates up to 1 deg/min. 4” at drive rates between 1 and 2.5 deg/min.
Note: There is no budget within the EVLA Project for meeting the requirements of OTF imaging at this time (Dec 2004). Until monies for the necessary development can be identified, this Requirement must be considered a Target.
2.2.1.2 Subreflector Positioning
All positioning requirements, unless specifically noted otherwise, are ‘repeatable’, meaning that the subreflector is to return to a previous position within the listed error. It is presumed that any offset error is calibrated out by application of a valid pointing model or local determination and that this offset is itself stable within the given error. The first focus requirement is absolute, and is referenced to the best-fit parabaloid focus position for the band in use.
EVLA Project Book, Chapter 2: Science
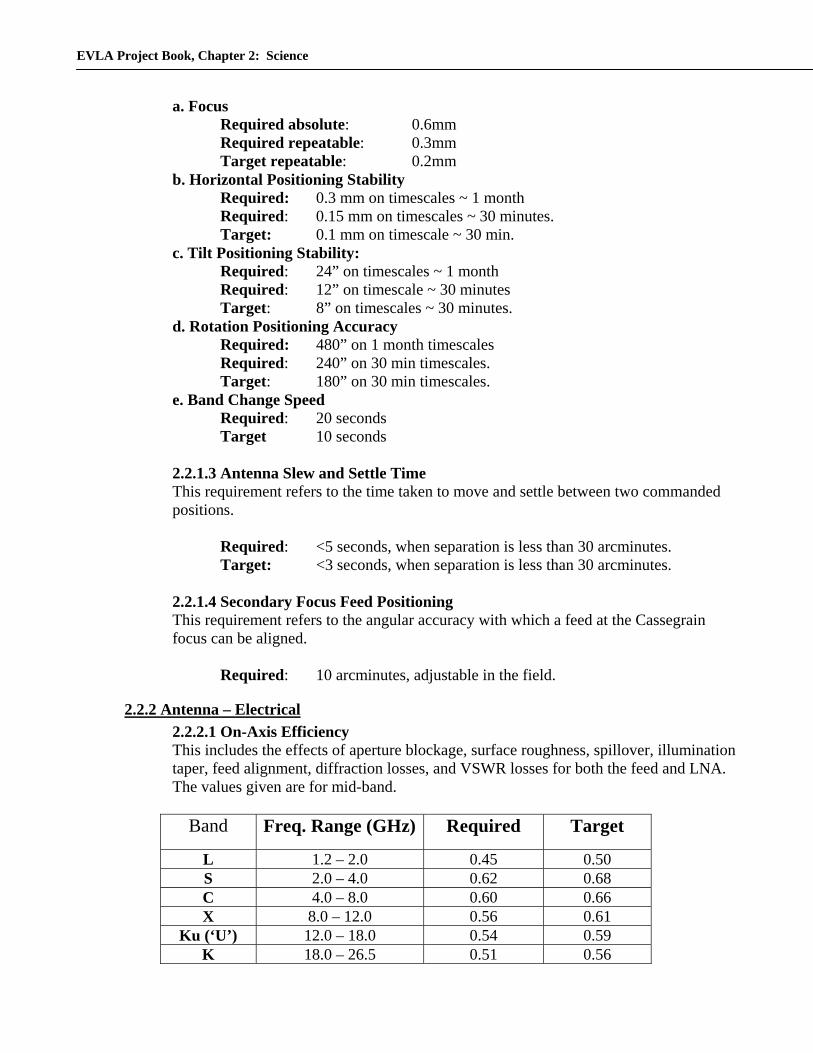
a. Focus Required absolute: 0.6mm Required repeatable: 0.3mm Target repeatable: 0.2mm b. Horizontal Positioning Stability Required: 0.3 mm on timescales ~ 1 month Required: 0.15 mm on timescales ~ 30 minutes. Target: 0.1 mm on timescale ~ 30 min. c. Tilt Positioning Stability: Required: 24” on timescales ~ 1 month Required: 12” on timescale ~ 30 minutes Target: 8” on timescales ~ 30 minutes. d. Rotation Positioning Accuracy Required: 480” on 1 month timescales Required: 240” on 30 min timescales. Target: 180” on 30 min timescales. e. Band Change Speed Required: 20 seconds Target 10 seconds 2.2.1.3 Antenna Slew and Settle Time This requirement refers to the time taken to move and settle between two commanded positions.
Required: <5 seconds, when separation is less than 30 arcminutes. Target: <3 seconds, when separation is less than 30 arcminutes.
2.2.1.4 Secondary Focus Feed Positioning This requirement refers to the angular accuracy with which a feed at the Cassegrain focus can be aligned.
Required: 10 arcminutes, adjustable in the field.
2.2.2 Antenna – Electrical 2.2.2.1 On-Axis Efficiency This includes the effects of aperture blockage, surface roughness, spillover, illumination taper, feed alignment, diffraction losses, and VSWR losses for both the feed and LNA. The values given are for mid-band.
Band Freq. Range (GHz) Required Target
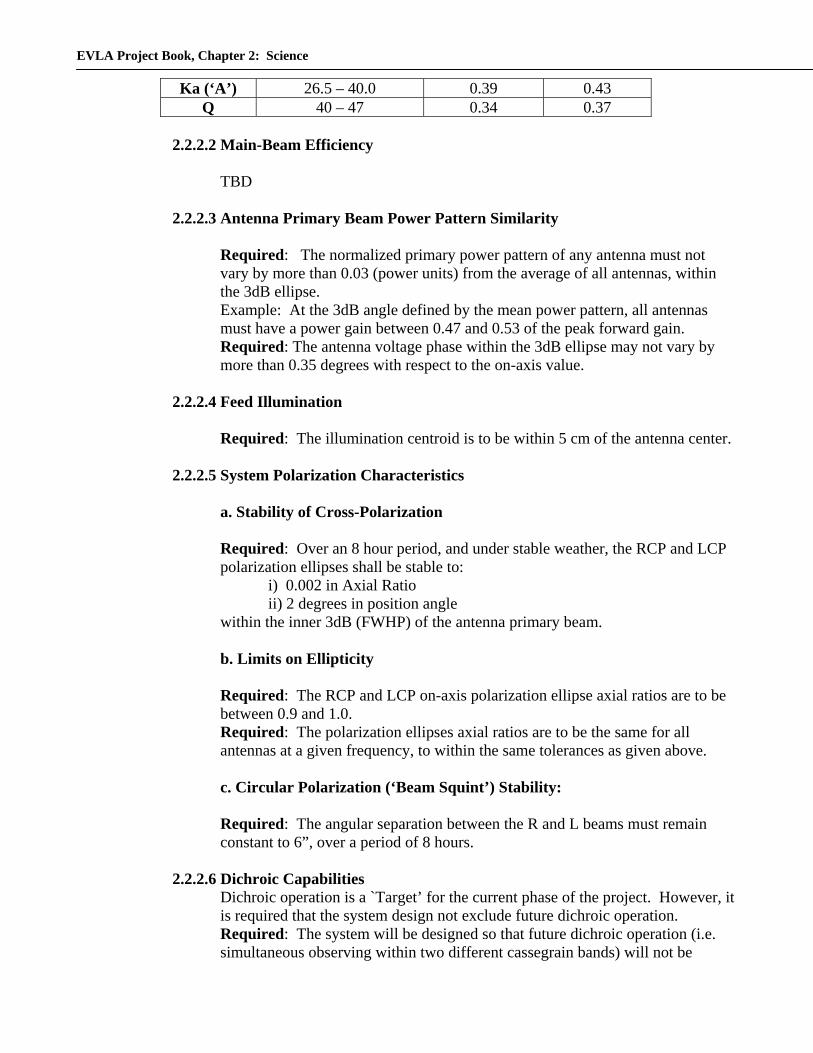
L 1.2 – 2.0 0.45 0.50 S 2.0 – 4.0 0.62 0.68 C 4.0 – 8.0 0.60 0.66 X 8.0 – 12.0 0.56 0.61
Ku (‘U’) 12.0 – 18.0 0.54 0.59 K 18.0 – 26.5 0.51 0.56
2.2.2.3 Antenna Primary Beam Power Pattern Similarity
Required: The normalized primary power pattern of any antenna must not vary by more than 0.03 (power units) from the average of all antennas, within the 3dB ellipse. Example: At the 3dB angle defined by the mean power pattern, all antennas must have a power gain between 0.47 and 0.53 of the peak forward gain. Required: The antenna voltage phase within the 3dB ellipse may not vary by more than 0.35 degrees with respect to the on-axis value.
2.2.2.4 Feed Illumination
Required: The illumination centroid is to be within 5 cm of the antenna center.
2.2.2.5 System Polarization Characteristics
a. Stability of Cross-Polarization Required: Over an 8 hour period, and under stable weather, the RCP and LCP polarization ellipses shall be stable to:
i) 0.002 in Axial Ratio ii) 2 degrees in position angle
within the inner 3dB (FWHP) of the antenna primary beam.
b. Limits on Ellipticity
Required: The RCP and LCP on-axis polarization ellipse axial ratios are to be between 0.9 and 1.0. Required: The polarization ellipses axial ratios are to be the same for all antennas at a given frequency, to within the same tolerances as given above.
c. Circular Polarization (‘Beam Squint’) Stability:
Required: The angular separation between the R and L beams must remain constant to 6”, over a period of 8 hours.
2.2.2.6 Dichroic Capabilities Dichroic operation is a `Target’ for the current phase of the project. However, it is required that the system design not exclude future dichroic operation. Required: The system will be designed so that future dichroic operation (i.e. simultaneous observing within two different cassegrain bands) will not be
EVLA Project Book, Chapter 2: Science
excluded. The feeds will be mounted to permit possible dichroic operation between a high frequency band (i.e., K, Ka, or Q) and a lower frequency band (i.e., C or X).
2.2.3 Receivers
2.2.3.1 System Temperature and Sensitivity
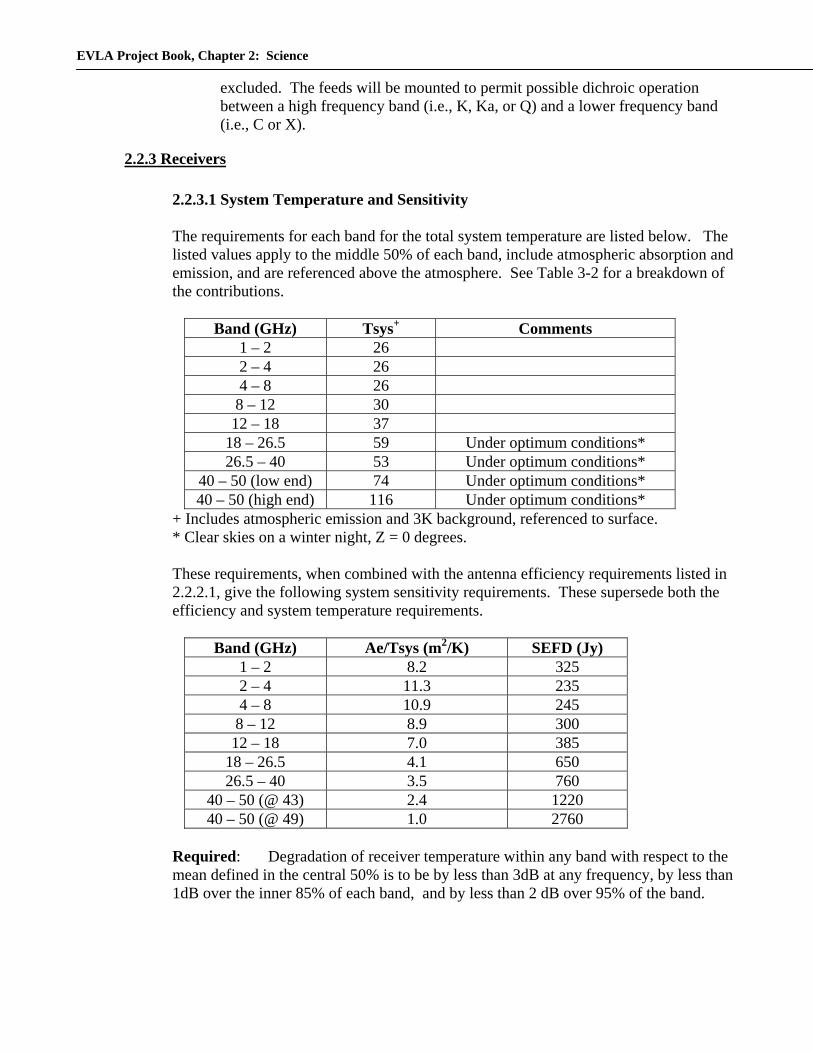
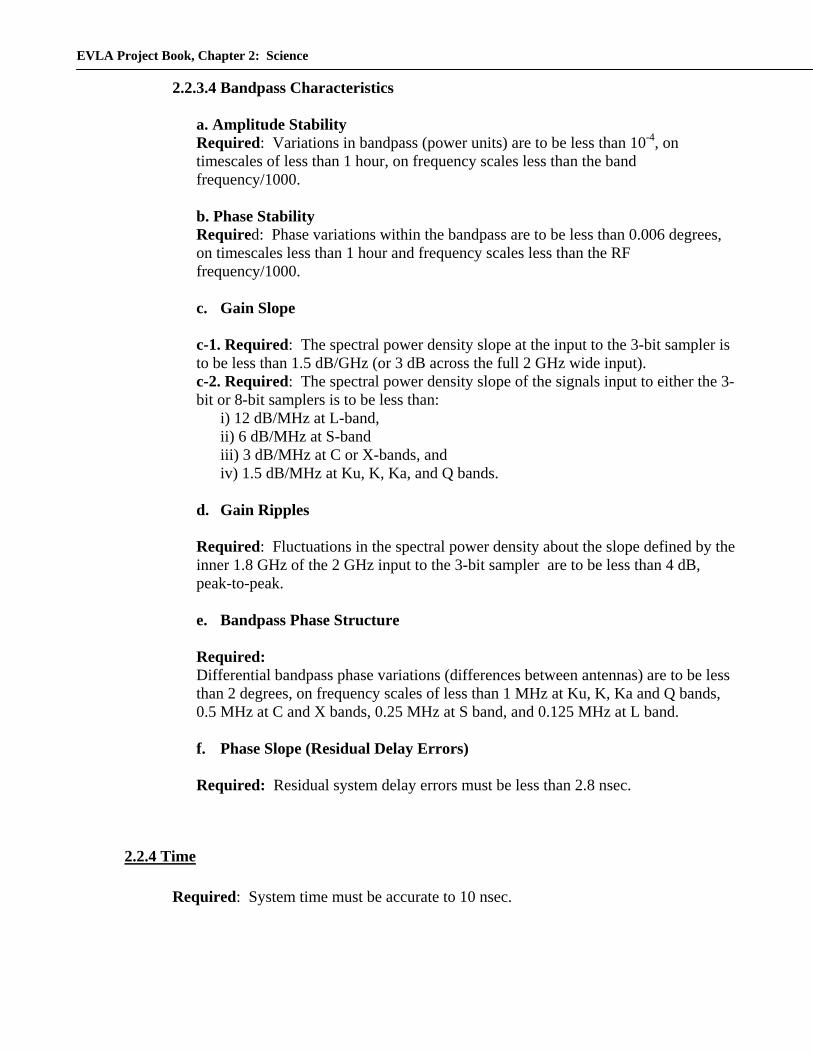
The requirements for each band for the total system temperature are listed below. The listed values apply to the middle 50% of each band, include atmospheric absorption and emission, and are referenced above the atmosphere. See Table 3-2 for a breakdown of the contributions.
Band (GHz) Tsys+ Comments
1 – 2 26 2 – 4 26 4 – 8 26 8 – 12 30 12 – 18 37
18 – 26.5 59 Under optimum conditions* 26.5 – 40 53 Under optimum conditions*
40 – 50 (low end) 74 Under optimum conditions* 40 – 50 (high end) 116 Under optimum conditions*
+ Includes atmospheric emission and 3K background, referenced to surface. * Clear skies on a winter night, Z = 0 degrees.
These requirements, when combined with the antenna efficiency requirements listed in 2.2.2.1, give the following system sensitivity requirements. These supersede both the efficiency and system temperature requirements.
Required: Degradation of receiver temperature within any band with respect to the mean defined in the central 50% is to be by less than 3dB at any frequency, by less than 1dB over the inner 85% of each band, and by less than 2 dB over 95% of the band.
EVLA Project Book, Chapter 2: Science
2.2.3.2 Linearity of Power Gain Measurement to System Power Variations
This refers to the accuracy with which the flux density scale will be preserved when the total system power is increased by some factor. This total power must be accurately monitored to allow accurate corrections to be made to the correlator output. Required: Changes in total system power monitored with an accuracy of better than 0.5% over an input power increase of up to15 dB over quiescent cold sky values.
Required: Changes in total system power monitored with an accuracy of better than 2% over an input power range between 15 and 50 dB above quiescent cold sky values. This applies only to receivers with the coupler-fed solar observing scheme.
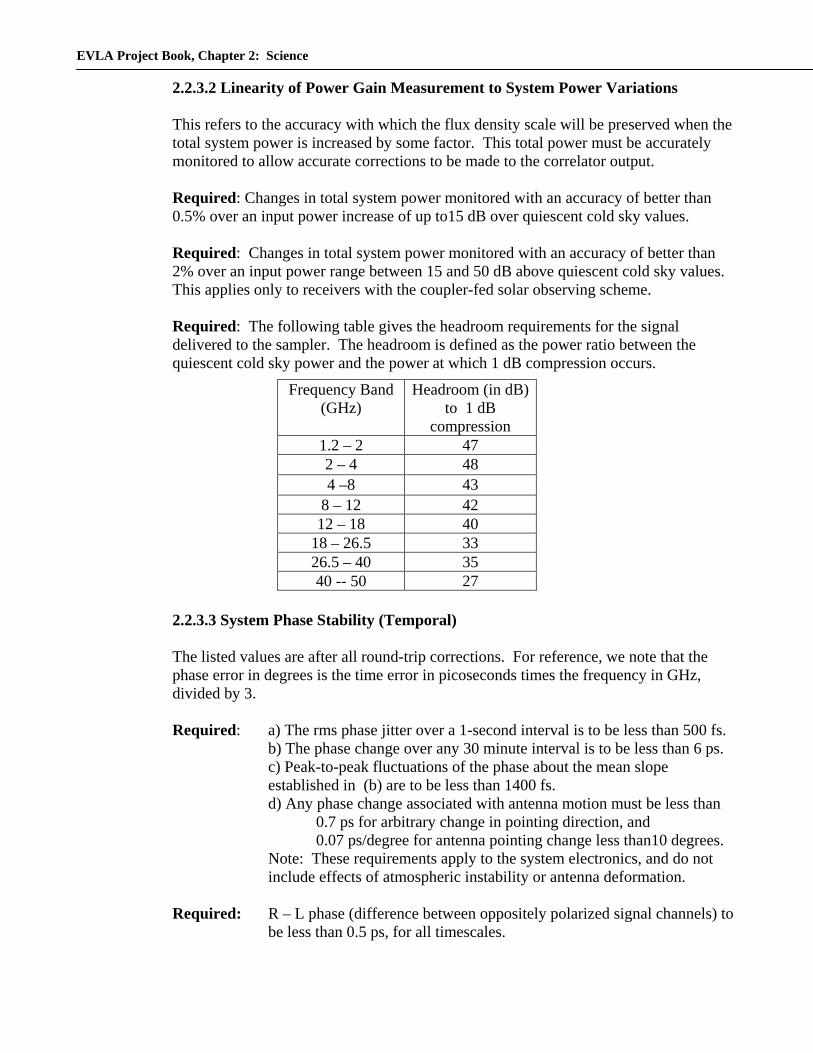
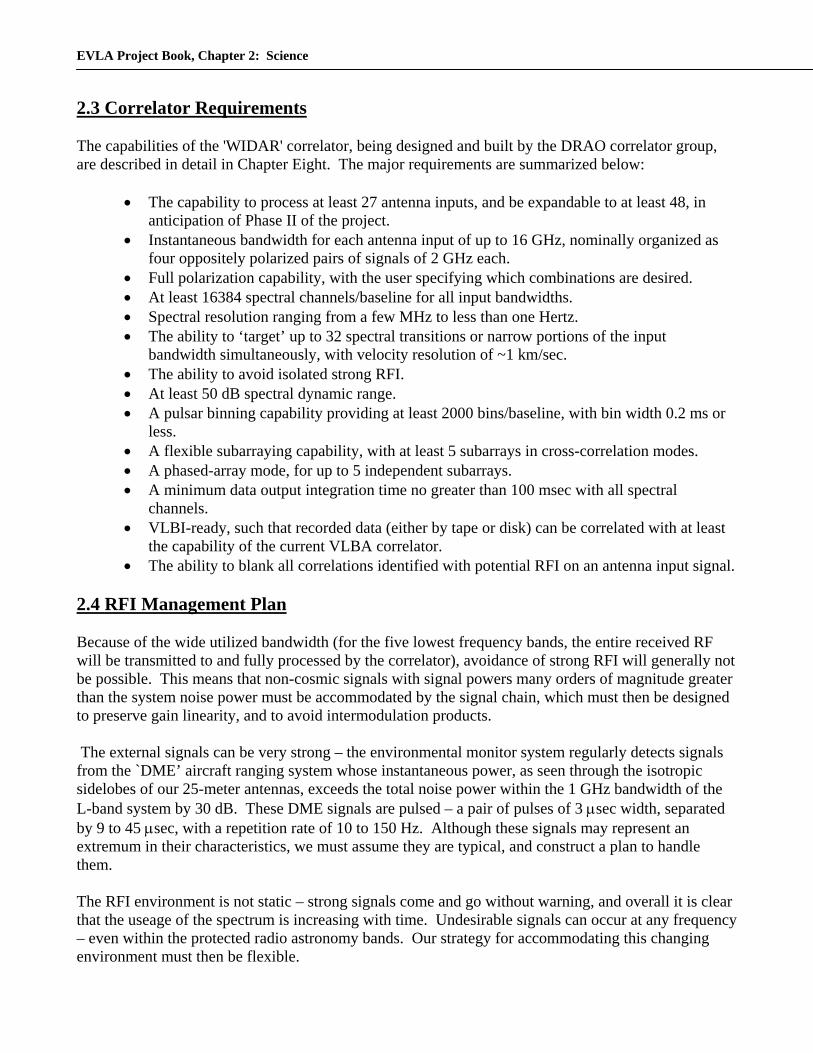
Required: The following table gives the headroom requirements for the signal delivered to the sampler. The headroom is defined as the power ratio between the quiescent cold sky power and the power at which 1 dB compression occurs. Frequency Band
(GHz) Headroom (in dB)
to 1 dB compression
1.2 – 2 47 2 – 4 48 4 –8 43
8 – 12 42 12 – 18 40
18 – 26.5 33 26.5 – 40 35 40 -- 50 27
2.2.3.3 System Phase Stability (Temporal)
The listed values are after all round-trip corrections. For reference, we note that the phase error in degrees is the time error in picoseconds times the frequency in GHz, divided by 3.
Required: a) The rms phase jitter over a 1-second interval is to be less than 500 fs.
b) The phase change over any 30 minute interval is to be less than 6 ps. c) Peak-to-peak fluctuations of the phase about the mean slope established in (b) are to be less than 1400 fs. d) Any phase change associated with antenna motion must be less than
0.7 ps for arbitrary change in pointing direction, and 0.07 ps/degree for antenna pointing change less than10 degrees.
Note: These requirements apply to the system electronics, and do not include effects of atmospheric instability or antenna deformation.
Required: R – L phase (difference between oppositely polarized signal channels) to
be less than 0.5 ps, for all timescales.
EVLA Project Book, Chapter 2: Science
2.2.3.4 Bandpass Characteristics
a. Amplitude Stability Required: Variations in bandpass (power units) are to be less than 10-4, on timescales of less than 1 hour, on frequency scales less than the band frequency/1000. b. Phase Stability Required: Phase variations within the bandpass are to be less than 0.006 degrees, on timescales less than 1 hour and frequency scales less than the RF frequency/1000.
c. Gain Slope
c-1. Required: The spectral power density slope at the input to the 3-bit sampler is to be less than 1.5 dB/GHz (or 3 dB across the full 2 GHz wide input). c-2. Required: The spectral power density slope of the signals input to either the 3-bit or 8-bit samplers is to be less than:
i) 12 dB/MHz at L-band, ii) 6 dB/MHz at S-band iii) 3 dB/MHz at C or X-bands, and iv) 1.5 dB/MHz at Ku, K, Ka, and Q bands.
d. Gain Ripples
Required: Fluctuations in the spectral power density about the slope defined by the inner 1.8 GHz of the 2 GHz input to the 3-bit sampler are to be less than 4 dB, peak-to-peak. e. Bandpass Phase Structure
Required: Differential bandpass phase variations (differences between antennas) are to be less than 2 degrees, on frequency scales of less than 1 MHz at Ku, K, Ka and Q bands, 0.5 MHz at C and X bands, 0.25 MHz at S band, and 0.125 MHz at L band.
f. Phase Slope (Residual Delay Errors)
Required: Residual system delay errors must be less than 2.8 nsec.
2.2.4 Time Required: System time must be accurate to 10 nsec.
EVLA Project Book, Chapter 2: Science 2.3 Correlator Requirements The capabilities of the 'WIDAR' correlator, being designed and built by the DRAO correlator group, are described in detail in Chapter Eight. The major requirements are summarized below:
• The capability to process at least 27 antenna inputs, and be expandable to at least 48, in anticipation of Phase II of the project.
• Instantaneous bandwidth for each antenna input of up to 16 GHz, nominally organized as four oppositely polarized pairs of signals of 2 GHz each.
• Full polarization capability, with the user specifying which combinations are desired. • At least 16384 spectral channels/baseline for all input bandwidths. • Spectral resolution ranging from a few MHz to less than one Hertz. • The ability to ‘target’ up to 32 spectral transitions or narrow portions of the input
bandwidth simultaneously, with velocity resolution of ~1 km/sec. • The ability to avoid isolated strong RFI. • At least 50 dB spectral dynamic range. • A pulsar binning capability providing at least 2000 bins/baseline, with bin width 0.2 ms or
less. • A flexible subarraying capability, with at least 5 subarrays in cross-correlation modes. • A phased-array mode, for up to 5 independent subarrays. • A minimum data output integration time no greater than 100 msec with all spectral
channels. • VLBI-ready, such that recorded data (either by tape or disk) can be correlated with at least
the capability of the current VLBA correlator. • The ability to blank all correlations identified with potential RFI on an antenna input signal.
2.4 RFI Management Plan Because of the wide utilized bandwidth (for the five lowest frequency bands, the entire received RF will be transmitted to and fully processed by the correlator), avoidance of strong RFI will generally not be possible. This means that non-cosmic signals with signal powers many orders of magnitude greater than the system noise power must be accommodated by the signal chain, which must then be designed to preserve gain linearity, and to avoid intermodulation products. The external signals can be very strong – the environmental monitor system regularly detects signals from the `DME’ aircraft ranging system whose instantaneous power, as seen through the isotropic sidelobes of our 25-meter antennas, exceeds the total noise power within the 1 GHz bandwidth of the L-band system by 30 dB. These DME signals are pulsed – a pair of pulses of 3 µsec width, separated by 9 to 45 µsec, with a repetition rate of 10 to 150 Hz. Although these signals may represent an extremum in their characteristics, we must assume they are typical, and construct a plan to handle them. The RFI environment is not static – strong signals come and go without warning, and overall it is clear that the useage of the spectrum is increasing with time. Undesirable signals can occur at any frequency – even within the protected radio astronomy bands. Our strategy for accommodating this changing environment must then be flexible.
EVLA Project Book, Chapter 2: Science The EVLA RFI Management Plan is based on the following foundations:
a) Measurement and Monitoring of man-made signals. Management must begin with knowledge of the dynamic RFI environment, and measurement of the strengths, characteristics, and origins of the RFI, both internal and external. b) Linear and Flexible Design. Maximum linearity of all components in the signal-processing path is necessary to prevent saturation and intermodulation products. With input signal powers exceeding the total system noise power by 30 dB or more, we have established a `headroom’ requirement of at least this much for those bands where such signals strengths are anticipated. High bit-level quantization (up to 8 bits) must be used for bands with high RFI environment. Flexible design means the ability to tune the IF frequency around strong, isolated RFI, and to configure the correlator to avoid such RFI, either through tuning of its sub-bands, or by implementation of blanking, based on detection of strong input power. Finally, provision to insert stop-band filters is required for blocking signals strong enough to saturate secondary stages of amplification. c) Suppression of man-made signals. It is obviously undesirable for the EVLA electronics to pollute the astronomical signals of interest. Thus, locally generated signals must be eliminated through design or suppressed through containment. Permitted maximum signal emission levels, based on the ITU standards and incorporating expected space attenuation and shielding capabilities must be set and followed by a rigorous testing procedure. These requirements have been established for the EVLA in Memo # 46, at http://www.aoc.nrao.edu/evla/memolist.shtml Non-local signals should be minimized through identification and interaction with the agencies responsible for their generation. d) Excision through flagging of affected channels, and post-correlation processing. The simplest means of post-correlation removal of RFI is by identifying and flagging (deleting) affected spectral channels. The EVLA data volumes will be far too great for this process to be accomplished `by hand’ through visual inspection. Automated flagging algorithms will be required to accomplish this task. Even more desirable is the ability to not just identify the affected channels, but to remove the interfering signal while preserving the astronomical information. To the correlator, a source of RFI is just another radio source, which can be distinguished from an astronomical source by its differing phase and phase rate. Provided the correlator can resolve the RFI in frequency and time, and that linearity in the signal chain (including the correlator) is maintained, post-processing will be able in principle to effectively remove much or most RFI from the data, using methods similar to those employed now in removing unwanted background radio sources. Methods are being developed at many observatories to allow such removal, and the EVLA Project must ensure that the correlator and subsequent data processing not prohibit future effective methodologies. Although we are certain that the foundations of this method are sound, it is equally certain that such processing will be computationally intensive and expensive.
EVLA Project Book, Chapter 2: Science 2.5 Overall Software Requirements Because of the increased capability of the EVLA, including the greatly expanded capacity of the correlator, we foresee a number of new software developments that will need to be in place when the EVLA comes online. Necessary inputs to proceed in these developments are descriptive use cases and a set of complete scientific requirements on the software. This chapter describes these developments in general terms, and contains references to much more detailed descriptions of these software requirements. The overall design of the EVLA software (see EVLA Computing Memo 33) splits the software into three general areas:
• Offline subsystems: proposal, observation preparation, archive, and data reduction; • Online subsystems: scheduler, data capture and format (DCAF), and the quick-look
pipeline; • Real-time subsystems: executor, M&C (including both antenna and correlator M&C) and
several independent modules such as CALC and telescope calibration (TelCal). We have written a number of use cases which describe how the astronomer will interact with the EVLA - including descriptions of general continuum experiments, spectral line experiments, and polarization experiments. These can be found on the web at: http://www.aoc.nrao.edu/~bbutler/work/evla/usecases/. As the software development continues, these will continue to be extended and more detail added. We have written three requirements documents which cover those parts of the software system which impact the science and astronomers directly: {EVLA e2e Science Software Requirements; EVLA Offline Data Processing Requirements,} and {EVLA Real-Time Science Software Requirements}. These documents are all contained in the EVLA computing memo series (numbers 26, 28, and 38), located at http://www.aoc.nrao.edu/evla/techdocs/computer/workdocs/index.shtml. They contain very detailed requirements, along with priorities and timelines, for all of these areas. For details those documents should be consulted. We summarize the key points here. The general user will need more user-friendly graphic interfaces to many components of the system (the subsystems, which are represented by the concept of software ``tools''). They will propose several templates, corresponding to the available observing modes, and provide a simple way to pass parameters to the basic observing process, and to the corresponding data reduction procedures of the pipeline. Input parameters will preferably be expressed in terms of astronomical quantities, which will be translated into technical parameters by sophisticated configuration tools. At all stages, the quantities passed between the tools must be editable by the knowledgeable user. A Tool could be a stand-alone program or set of scripts, or might be an integrated part of a larger software package. This is a question of implementation such is up to the software developers. We do require in many instances, however, that different Tools be able to ``speak'' to each other, i.e., can pass information back and forth. We also strongly recommend that if they are separate implementations that they at least have a common look-and-feel.
EVLA Project Book, Chapter 2: Science The expert user/developer will need to be able to send direct commands to the instrument through a simple, easily editable command language. Atomic commands in a script language will directly send orders to the basic software elements controlling the hardware: antenna motion, instrument setup, or transmitting parameters to the data processing (pipeline). The script language will support loops, structured conditional tests, parameterized procedures, global variables and arrays. These scripts, once fully developed and tested, will evolve into the basic observing procedures of the instrument. Whatever software is delivered in the end, it should be straightforward to modify that software, changing or adding functionality. It should be possible to hire a programmer from outside the project (who has not been intimately involved with the history of the software development) to do this in a timely fashion (not taking years for that programmer to learn the ``system'').