65
Structure & Synthesis of Process Flow Diagram Chapter 2 1
| Date post: | 23-Jan-2016 |
| Category: |
Documents |
| Upload: | melissa-huynh |
| View: | 68 times |
| Download: | 2 times |

1
Structure & Synthesis of Process Flow Diagram
Chapter 2

2
The Structure & Synthesis of Process Flow
Diagram
2.1 Hierarchy of process Design
2.2 Step 1 : Batch process vs. Continuous
process
2.3 Step 2 : Input / output structure of the process
2.3.1 Process concept diagram
2.3.2 I/O structure of PFD
2.3.3 I/O structure & other features of generic BFD
2.3.4 Other consideration for I/O structure of PFD
2.3.5 Information determined using I/O diagram:

3
2.4 Step 3 The recycle structure of the
process
2.4.1 Efficiency of raw materials usage
2.4.2 Identification & definition of recycle
structure of process
2.4.3 Other issues affecting recycle structure

4
2.1 Hierarchy of process Design
• Choose between alternatives according to
( raw material, complexity, environment,
byproducts…..etc.)
• New process decide whether :
1.Batch or continuous ?
2.Identify I/O structure of process
3.Identify recycle structure of process
4.Identify & design structure of separation
system
5.Identify & design heat exchangers & heat
recovery system
• Old process to simplify PFD start from 5 to
1 .

5
6
2.2 Step 1 : Batch process vs. Continuous process
1. Batch process finite quantity of product
( batch ) is produced during a time period
• Different products are made from the same
facility
2. Continuous process raw materials are fed
continuously & products , wastes , by products
are removed continuously.
• There is a batch process and batch unit
operation
3. semi-batch process both batch & continuous

7
Batch vs Continuous
1.Size or economy of scale favors continuous
Batch < 500 t / y , Continuous > 5000 t /y
2. Product Quality: Batch is better for
verification of each batch of products ( as
required by FDA regulation)
3. If off quality product can be dumped , stored or
reprocessed then continuous is preferred
4. Flexibility : Batch can use same equipment
for many operations , while continuous is built for
a fixed product.

8
5. Process efficiency : batch requires
scheduling , not optimized & utility usage is
higher
6. Maintenance / Labor : Cost of labor for
batch is higher
7. Feedstock availability : Batch favors
seasonal products such as wineries. Continuous
for those which require massive storage

9
8. Rate of reaction : Batch favors reactions with
long reaction rate e.g. fermentation , aerobic ,
anaerobic
9.Fouling : Batch is favored for big fouling since
cleaning is easy . for continuous Process use
two units in parallel
10. Safety : batch safety is less , less
automation , training of workers is essential
11.Controllibility : less for batch

10
2.3 Step 2 - Input /output structure of the process
2.3.1 Process concept diagram
• Balanced chemical reaction forms basis for
process concept diagram as in Fig 2.1
• Steps to create diagram are :
1. Cloud around chemical reaction with
stoichiometry
2. Reactants Streams with names entering cloud
from left
3. Products Streams leaving cloud to right
4. Side reactions are represented & by-products
are drawn

11

12
2.3.2 I/O structure of PFD
• Inputs enters from left & products leaves at
right
• PFD contains stream No , utilities , recycle
streams
• Fig 2.1 & Fig 2.2 have same I/O structure
• Inert with feed and other chemicals are fed
from left

13
• Products either enter with feed or produced
by reaction
• Utility streams rarely interact with process
stream Fig 2.3 .
• Utilities to add or remove thermal energy or
work
• Other utilities :
fuel gas , air , instrument air , nitrogen ,
electricity ,plant air , process water

14

15

16
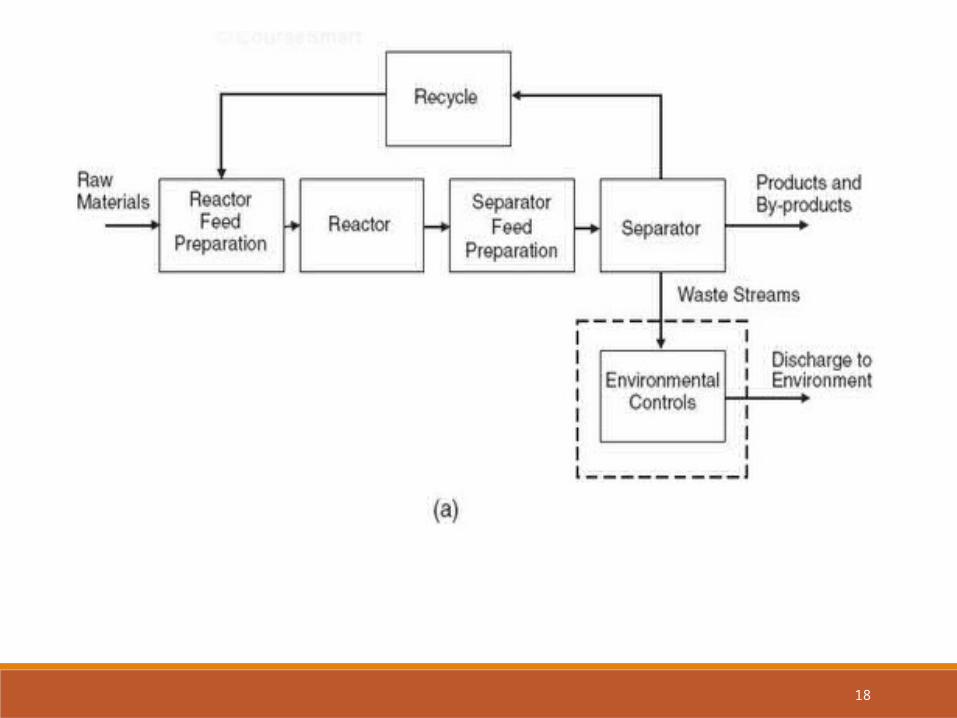
2.3.3 I/O structure & other features of generic BFD
• Generic BFD is intermediate between
concept diagram & BFD
• BFD contains I/O & all logical building blocks
of process
• Generic BFD in Fig 2.4a shows process broken
to 6 blocks:
1. Reactor feed preparation : change feed
from storage to reaction conditions (T , P,
concentration ..)
2. Reactor

17
3. Separation feed preparation ( T , P , Conc )
for separation
4. Separator ( unit operation for separation )
5. Recycle ( unreacted inert , pump or heat
exchanger )
6. Environmental control (dispose of gas ,
liquid ,solid waste)
Environmental treatment is not included in
BFD even though they are there & important
18

19
1.Reactor feed Preparation block :
Prepare feed from storage to reactor conditions
2. Reactor Block:
Reaction to give products , by-products ,
unreacted raw materials , inert
3. Separation Feed preparation Block:
Prepare for conditions required in effective
separation

20
4. Separator Block:
Separation of products , by-products , unreacted
Raw materials , inert
5. Recycle Block:
recycle unreacted raw materials after separation
back to reactor
Environmental Control Block:
Gas , liquid , solid wastes treated before
discharge

21
2.3.4 Other consideration for I/O structure of PFD
1. Feed purity and trace components :
a. If in small quantities & “ inert ” – do not
separate
e.g. H2 feed contains 5% CH4 ( inert) so do not
remove CH4
b. If separation of impurities is difficult – Do not
separate
Liquids form Azeotrope which are difficult to
separate
e.g. (water / ethanol)
• Gases require high P & low T to separate .
Both are expensive e.g. separation of CH4 from
H2

22
c. If impurities foul or poison catalyst then
separate
e.g. Sulfur poison Group VIII Metals (Pt , Pd ,
Ru , Rh)
d. If impurity reacts to form difficult-to-
separate material or hazardous product then
separate
• E.g. Phosgene COCl2 : H2 in CO produce HCl
which is corrosive & affects isocyanate product
• If impurity is in large quantities then purify.
This reduce cost of oversized equipment .

23
2- Addition of feeds to stabilize product or enable separation
• Product quality often met by single train of
operations
• If product reactive or unstable chemicals are
added to stabilize it.
• The same for feeding solvents & catalyst to
process.
• Feed Water to absorb gases is another feed
• These feeds are included in mass balance &
cost

24
4- Inert feed material to control exothermic reaction
• High exothermic reactions such as partial
oxidation of H/C
• Steam is fed to absorb heat, dilute H/C &
prevent explosion in partial oxidation of
propylene
• Steam is regarded as a feed and leaves as a
product , a by-product or waste stream

25
3- Inert feed to control equilibrium reaction
• e.g. ethyl benzene to styrene
C6H5CH2CH3 C6H5CH = CH2 + H2
• Reaction at equilibrium, T = 600-750 0C,
endothermic & at P < 1 bar .
• Super heated Steam is added to provide
heat , dilute feed
• It shifts equilibrium to the right by Le
Chatelier’s principle

2.3.5 Information determined from using I/O
diagram
1. Carry Basic economic analysis based on profit
margin
2. What chemicals enter with feed & what leave
with product
3. All reactions desired & undesired
Profit margin = value of products – cost of
raw materials

27
• Profit margin should be averaged over many
years
• Profit margin for HDA process is negative
• Disproportionation reaction to produce
benzene & mix of xylenes from toluene is
unprofitable but better than HAD
• So cost of raw material decides which
process to use
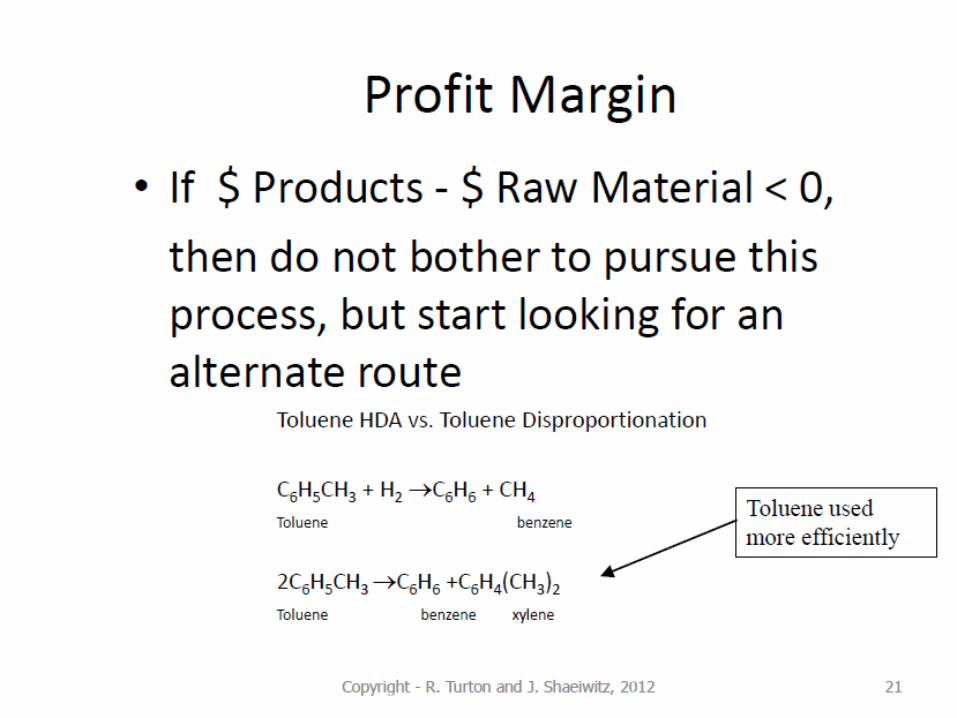
28

29
Example 2.1
Evaluate profit margin for HDA process. From
Tab 8.3 & 8.4, the following prices for raw
materials & products are found:
• Benzene = $ 0.919/ kg
• Toluene = $ 1.033/ kg ,
• Natural gas ( methane and ethane, MW = (18)
= $ 11.10/ GJ = $ 11.89/ 1000 std. ft3 = $
0.302/ kg,
• Hydrogen = $ 1.000/ kg ( based on the same
equivalent energy cost as natural gas)

30
• 1 kmol of toluene feed as a basis Cost of Raw
Materials
• 92 kg of Toluene = ( 92 kg)($ 1.033/ kg) = $
95.04
• 2kg of Hydrogen = ( 2 kg)($ 1.000/ kg) = $
2.00
• Value of Products
• Benzene = ( 78 kg)($ 0.919/ kg) = $ 71.68
• Methane = ( 16 kg)($ 0.302/ kg) = $ 4.83
• So
Profit Margin = (71.68 + 4.83) – (95.04
+ .00)= –$ 20.53
Or = –$ 0.223/ kg toluene

31
• Based on this result, it is concluded that further
investigation of this process is definitely not
warranted.
• Despite the results illustrated in Example 2.1,
benzene has been produced for the last 50
years and is a viable starting material for a
host of petrochemical products.
• So try another route by dispropotionation

32
Example 2.2
Evaluate profit margin for toluene
disproportionation process2C7H8 = C6H6 + C8H10
Toluene Benzene Xylene
From Table 8.4: Price Mixed Xylenes = 0.820 $/kg
Using 2 kmols of toluene feed as a basis:
184 kg of Toluene = (184 kg)($1.033/kg)=
$190.07
78 kg of Benzene = (78 kg)($0.919/kg) = $71.68
106 kg of Xylene = (106 kg)($0.820/kg) = $86.92
Profit Margin = 86.92 +71.68 – 190.07=–
$31.47
= –$0.171/kg T

33
• Benzene via disproportionation of toluene
unprofitable but better than by HDA process
• purified xylenes more valuable than mixed
xylene
• Addition of purification to disproportionation is
profitable
• Toluene disproportionation is the preferred
process for benzene production over the last
two decades

34
2.4 Step 3 The recycle structure of the process
1 Efficiency of raw materials usage
• Cost of raw materials constitute 20-75% of
operating cost, so unreacted materials are
recovered and recycled
• Recycle if recovery & recycle is easy &
economic
1. Single pass conversion = reactant
consumed in reactor / reactant fed to reactor
2. Overall conversion = reactant consumed in
process/ reactant fed to process
3. Yield = mole of desired product / moles of
limiting reactant

35
HDA : single pass=75% , overall= 99.3%, yield
= 99.95%

36
1. High single pass conversion reduces recycle
and cost of equipment
2. Overall conversion is usually high in
chemical processes because of recycle
3. Yield is high if no side reactions exist
4. H2 conversion = 11.3% which is low because
Excess H2 is needed to prevent deposits of
coke on catalyst

37
2. Identification & definition of recycle structure of process
3 possibilities of recycle structure :
1. Separate & purify unreacted raw materials
from product
2. Recycle feed & product together and use a
purge system
3.Recycle feed & product together but
without a purge

38

39
1. Separate products & purify :
• Choice of Unit Operation to separate depends
on conditions such as T , P
• Also it depends on differing physical or
chemical properties of materials to be
separated
• E.g. benzene from toluene Economic to
choose distillation
• H2 from CH4 can be separated by distillation ,
absorption , adsorption & membrane
separation
• Economic consideration favors adsorption &
membrane
•

40
Example 2.3
Separation of methane and hydrogen
1-distillation:
• Normal boiling point of CH4 = - 161° C , H2 = -
252° C Separation by distillation easy due to
large difference in boiling points of two
components
• However, in order to obtain a liquid phase, a
combination of high pressure & low
temperature must be used
• This is costly so distillation is not best for this
separation

41
2- Absorption :
• Possible to absorb or scrub methane from
Streams 8 &17 into a hydrocarbon liquid
• In order to determine which liquids are
suitable for this process, solubility parameters
for CH4 & H2 in different liquids must be
determined
• Because of the low boiling point of CH4 it would
require a low temperature & high pressure
for effective absorption.

42
3-Pressure Swing Adsorption :
• Adsorption affinity of mole to adhere to a solid
material
• In pressure- swing adsorption, preferential
adsorption of one species from gas phase at
given P & desorption is facilitated by reducing P
& allowing the solid to “ de- gas.”
• 2 beds operate in parallel, one adsorbing ,
other desorbing
• H2 in gaseous H/C separated by P- swing
adsorption
• CH4 is preferentially adsorbed while H2 leaves
• This separation could be applied to the
HDA process.
43
4- Membrane Separation :
• Commercial membrane processes are available
to purify H2 from H/C
• H2 pass more readily through certain
membranes than CH4
• Process occurs at moderate P, consistent with
HDA process
• However, H2 recovered is at low P & it have to
be recompressed prior to recycling
• This separation could be applied to the
HDA process

44
Example 2.4
• What process should be used in the separation
of toluene and benzene?
• Distillation Normal boiling point of benzene =
79.8° C Normal boiling point of toluene = 110°
C
• Separation should be easy using distillation,
and neither excessive temperatures nor
pressures will be needed
• This is a viable operation for this separation of
benzene & toluene in the HDA process.

45
2. Recycle feed & product together with purge system
• Separation not easy: recycle product &
unreacted raw material
• Purge when product does not react to avoid
accumulation
• Recycles in HDA : CH4 product & unused H2
• There is a purge in this system
• This is represented by Fig 2.5

46
47
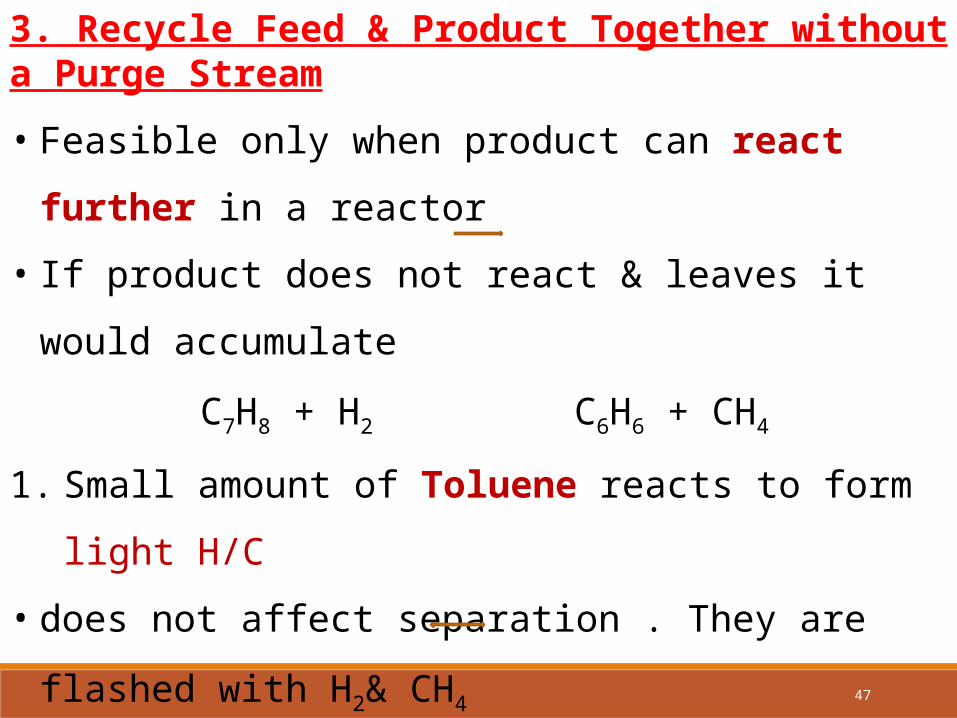
3. Recycle Feed & Product Together without a Purge Stream
• Feasible only when product can react further in
a reactor
• If product does not react & leaves it would
accumulate
C7H8 + H2 C6H6 + CH4
1. Small amount of Toluene reacts to form light
H/C
• does not affect separation . They are flashed
with H2& CH4
2. Also small amount of diphenyl is formed as by
product
• If recycled without separation it builds up to
equilibrium then decompose to benzene by
equilibrium reaction
2C6H6 C12H10 + H2

48

49

50
How does excess reactant affect recycle
structure ?
• Decide which reactant in excess in reaction for
recycle .
• In HAD : H2/ Toluene is 5:1 to prevent coking
• so H2 recycle is large requiring large circuit &
large turbine

How many reactors are required ?
1. Equilibrium :
Many reactors are required for the reaction
N2 + H2 NH3
• Stage packed bed with feed of reactants
• This lower T & increase concentration thus shift
equilibrium to right
2. Temperature control :
• Mild exothermic or endothermic
• Add cold or hot shots between stages to
control Temp 38

52
3. Concentration control :
• If one reactant forms a by-products , keep its
concentration low by using multiple feeds
/reactants.
4. Optimization for multi-reactions:
• Series reactions A R S T
• If T is desired product use multi-stage
reactor

53
Do unreacted RM need to be purified prior to recycling ?
• If in distillation relative volatilities are each
near to each other there is no need to separate
Is recycling of an inert warranted ?
1. Depends on process .
2. May be worth to recycle
3. E.g. water to absorber in acetone production
4. Water was purified and recycled to prevent
pollution
54
2.4.3 Other issues affecting recycle
structure
1- How many potential recycle stream are
there ?
• All processes with single pass conversion < 90
- 99% are potential for recycling
This Depends on :
1. cost of raw materials
2. cost to separate & recycle
3. cost of disposal as waste

55
2. Can recycle shift equilibrium to produce
less unwanted product ?
• Recycle unwanted product or inert to change
conversion or selectivity of equilibrium
reaction
• Recycle CO2 in water gas shift reaction to
produce synthesis gas ( CO + H2) shifts
equilibrium to left & produce more CO

56
3. Recycle of unwanted product or inert to control reactor operation
• Inert added in partial oxidation of H/C to
absorb heat & move mixture outside explosive
limit .
• Steam is most often used material, so any
available inert
• Steam is added to moderate T in coal
gasification
• Recycle CO2 in partial oxidation of coal to
absorb heat & reduce steam

57
4. What is the phase of the recycle stream ?
• Phase of recycle determine separation &
recycle
1. For liquids problem of azeotropic mixtures
2. For gas problem of high P or low T for
separation , both options are expensive
• Avoid gas separation unless necessary
because of cost & difficulty .

58
Summary
• First choice is whether to use batch or continuous• Continuous chemical processes have a
general structure:1. Input-output2. Recycle3. Separation
• I/O structure of a continuous chemical process consists of:4. Reactor feed preparation5. Reactor6. Separation feed preparation7. Separation8. Recycle9. Environmental control

59
SHORT ANSWER QUESTIONS
1. What are the five elements of the hierarchy of process design?
2. What are the three types of recycle structures possible in a chemical
process ? Explain when each is used.
3. Give three criteria for choosing a batch process as opposed to a
continuous process.
4. When would one purposely add an inert material to a feed stream?
Illustrate this strategy with an example, and explain the advantages (and
disadvantages) of doing this.
5. In general, when would one purify a material prior to feeding it to a
process unit ? Give at least one example for each case you state.

60
Example 2.5
• Consider the following two process alternatives
for the HDA process when side reaction of
benzene to form diphenyl occurs.
Alternative B shown in Figure E2.5( b)
• Additional separator is required, as a second
distillation column T- 102 along with associated
equipment (not shown) & extra utilities to carry
out separation

61

62
Alternative A Fig E2.5( a)
• Cost of additional equipment is avoided
• but recycle stream ( S 11) will be larger
because it now contains toluene & diphenyl &
utilities and equipment through which this
stream passes ( H- 101, E- 101, R- 101, E- 102,
V- 102, V- 103, T- 101, E- 106) will all be larger
• Which is the economically preferable
alternative?

63

64
• Answer depends upon value of equilibrium
constant for benzene- diphenyl reaction
• If equilibrium conversion of benzene is high,
then there will be a large amount of diphenyl
in recycle & costs to recycle will be high & vice
versa
• Equilibrium constant :

65
• Exit conditions of reactor estimated by
assuming that benzene - diphenyl reaction has
reached equilibrium
• Using this assumption & data from Table 1.5
for Stream 9, if x kmol/ h of diphenyl is present
in reactor effluent, then:
• Solving for the only unknown gives x = 1.36
kmol/ h
• Thus, toluene recycle, Stream 11, will be
increased from 35.7 to 37.06 kmol/ h, an
increase of 4%, while increases in S4 & S6 will
be approximately 0.1%
• Based on this result, A < expensive than B.


