+ All Categories
Home > Documents > pasteur.epa.gov 2 three... · Web viewTest material aerosols of either Libby Amphibole (LA) fiber...

pasteur.epa.gov 2 three... · Web viewTest material aerosols of either Libby Amphibole (LA) fiber...

Date post: 04-May-2018
Category:
Upload: vankhue
View: 213 times
Download: 0 times
Share this document with a friend
67
Report Title Inhalation Exposure Summary Report: Subchronic Inhalation Exposure of Rats to Libby Amphibole. Study Title EPA Fiber Project: Subchronic Inhalation Exposure of Rats to Amphibole Asbestos Study Protocol 10026 Authors Earl W. Tewksbury, The Hamner Institutes for Heath Sciences Carl U. Parkinson, The Hamner Institutes for Health Sciences Performing Laboratory The Hamner Institutes for Health Sciences 6 Davis Drive P.O. Box 12137 Research Triangle Park, NC 27709-2137 Study Sponsor U.S Environmental Protection Agency (US EPA) Contract No. EP-W-08-051 Dr. Stephen Gavett Contracting Officer Representative US EPA Pulmonary Toxicology Branch, MD B143 01 Research Triangle Park, NC 27711 Page 1 of 67
Transcript

Report Title

Inhalation Exposure Summary Report: Subchronic Inhalation Exposure of Rats to Libby Amphibole.

Study Title

EPA Fiber Project: Subchronic Inhalation Exposure of Rats to Amphibole Asbestos

Study Protocol

10026

Authors

Earl W. Tewksbury, The Hamner Institutes for Heath SciencesCarl U. Parkinson, The Hamner Institutes for Health Sciences

Performing Laboratory

The Hamner Institutes for Health Sciences6 Davis DriveP.O. Box 12137Research Triangle Park, NC 27709-2137

Study Sponsor

U.S Environmental Protection Agency (US EPA)Contract No. EP-W-08-051

Dr. Stephen GavettContracting Officer RepresentativeUS EPAPulmonary Toxicology Branch, MD B143 01Research Triangle Park, NC 27711

Page 1 of 43

The Hamner Institutes for Health Sciences Protocol 10026Inhalation Summary ReportEPA Fiber Project 90-Day Study Page 2 of 43

Signatures

Prepared by: Date: Carl U. ParkinsonResearch Associate

Reviewed by: Date: Darol E. Dodd, Ph. D., DABTSenior Research Toxicologist

The Hamner Institutes for Health Sciences Protocol 10026Inhalation Summary ReportEPA Fiber Project 90-Day Study Page 3 of 43

Table of Contents

Report Title.............................................................................................................................................. 1

Signatures............................................................................................................................................... 2

Table of Contents.................................................................................................................................... 3

Summary................................................................................................................................................. 5

Introduction.............................................................................................................................................. 5

Materials and Methods............................................................................................................................ 6

Chemical............................................................................................................................................. 6Exposure System................................................................................................................................ 6Generation System............................................................................................................................. 7Analytical System................................................................................................................................ 7Particle Size Distribution Measurements.............................................................................................7Tower Distribution............................................................................................................................... 8Study Design and Study Day Numbering............................................................................................8Environmental Parameters.................................................................................................................. 8Domiciliary Housing............................................................................................................................ 8

Project Personnel.................................................................................................................................... 8

Results.................................................................................................................................................... 9

Chemical............................................................................................................................................. 9Tower Distribution of LA or AA Test Material......................................................................................9Generation and Nose Only Exposure Concentrations.........................................................................9

Deviations.............................................................................................................................................. 10

Conclusions........................................................................................................................................... 10

References............................................................................................................................................ 11

The Hamner Institutes for Health Sciences Protocol 10026Inhalation Summary ReportEPA Fiber Project 90-Day Study Page 4 of 43

Table 1. Physical and Chemical Properties of UICC Amosite..........................................................12

Table 2. Study Design......................................................................................................................13

Table 3. Critical Endpoints...............................................................................................................14

Table 4. Necropsy Group Identification............................................................................................15

Table 5a. Fiber Distribution Uniformity in Exposure Towers - Filter Data.......................................16

Table 5b. Fiber Distribution Uniformity in Exposure Towers - APS Particle Size Distribution......17

Table 5c. Fiber Distribution Uniformity in Exposure Towers - SEM Fiber Size Distribution..........18

Table 6a. APS Summary Fiber Size Distributions During Exposures [1].........................................19

Table 6b. APS Fiber Size Distribution: 3.3 mg/m3 Amosite Amphibole Tower 292.......................20

Table 6c. APS Fiber Size Distributions: 1.0 mg/m3 Libby Amphibole Tower 293..........................21

Table 6d. APS Fiber Size Distributions: 3.3 mg/m3 Libby Amphibole Tower 294..........................22

Table 6e. APS Fiber Size Distributions: 10 mg/m3 Libby Amphibole Tower 295...........................23

Table 6f. APS Fiber Size Distributions: 0 mg/m3 Control Tower 296............................................24

Table 7a. SEM Fiber Size Distribution– 3.3 mg/m3 Amosite Amphibole Tower 292.......................25

Table 7b. SEM Fiber Size Distribution – 1.0 mg/m3 Libby Amphibole Tower 293..........................26

Table 7c. SEM Fiber Size Distribution – 3.3 mg/m3 Libby Amphibole Tower 294..........................27

Table 7d. SEM Fiber Size Distribution – 10 mg/m3 Libby Amphibole Tower 295...........................28

Table 7e. SEM Fiber Size Distribution – Summary of Weekly Values[1].........................................29

Table 8a. Inhalation Data for Amosite Amphibole 3.3 mg/m3 Exposure Dose................................30

Table 8b. Inhalation Data for Libby Amphibole 1.0 mg/m3 Exposure Dose....................................32

Table 8c. Inhalation Data for Libby Amphibole 3.3 mg/m3 Exposure Dose....................................34

Table 8d. Inhalation Data for Libby Amphibole 10.0 mg/m3 Exposure Dose..................................36

Table 8e. Inhalation Data for Control 0.0 mg/m3 Exposure Dose...................................................38

Figure 1. Diagram of Fiber Exposure System...............................................................................40

The Hamner Institutes for Health Sciences Protocol 10026Inhalation Summary ReportEPA Fiber Project 90-Day Study Page 5 of 43

SummaryTest material aerosols of either Libby Amphibole (LA) fiber or Amosite Amphibole (AA) fiber were generated by the lofting of test materials into the breathing air of F344 rats and administered by nose-only inhalation. Control (air-only), LA, and AA exposures were conducted for 6 hours per day, 5 days per week, for 13 consecutive weeks, for a total of 67 days. During animal exposure, the concentrations of the test materials were monitored using a light scatter aerosol instrument and measured by gravimetric filter. The aerosol concentration grand averages (± standard deviations) of the daily means were 0.0 (± 0.2) mg/m3, 1.01 (± 0.45) mg/m3 LA, 3.34 (± 0.83) mg/m3 LA, 10.04 (± 2.04) mg/m3 LA, and 3.32 (± 1.48) mg/m3 AA for the target exposure concentrations of 0.0 mg/m3 (control), 1.0 mg/m3 LA, 3.3 mg/m3 LA, 10 mg/m3 LA, and 3.3 mg/m3 AA, respectively.

The grand averages of count median aerodynamic diameter (CMAD) were 1.05 μm, 1.02 μm, 1.13 μm and 0.93 μm, for the 1.0 mg/m3 LA, 3.3 mg/m3 LA, 10 mg/m3 LA, and 3.3 mg/m3 AA exposures, respectively. For scanning electron microscopy aerosol samples, the grand average fiber diameter and fiber length ranges for all LA and AA exposure groups were between 0.329 and 0.421 µm and 3.049 and 4.625 µm, respectively. The APS and SEM data indicated that fiber size distributions were relatively stable during the 67 days of exposure.

The nose-only inhalation exposure systems were placed in 8m3 exposure chambers for personnel safety and the monitoring of external environmental conditions. The environmental parameters for temperature and relative humidity in the 8m3 chambers were maintained at or near 70oF and 50%, respectively, throughout the exposure period. The nose-only exposure atmosphere temperature and relative humidity were maintained at or near 76oF and 7% relative humidity, respectively, throughout the exposure period.

The inhalation exposures were conducted from February 16th, 2011 through May 20th, 2011.

IntroductionThe vermiculite mine near Libby, Montana was the world’s leading source of vermiculite for 70 years until its closure in 1990. Vermiculite is used for insulation, as an absorbent material, and as a soil conditioner, and has applications in the construction, agricultural, horticultural and industrial markets. However, the Libby vermiculite ore coexists with a complex array of amphibole mineral types, primarily winchite, richterite, tremolite, and magnesioriebeckite with crystal forms (habits) ranging from asbestiform to acicular/prismatic.

Occupational exposure to Libby vermiculite has been (and continues to be) associated with significant increases in asbestosis, lung cancer, and pleural cancer compared to the rest of the U.S. population. For example, in addition to elevated rates of lung cancer and mesothelioma among Libby residents, 17.8% of 6,668 persons who lived or worked in the Libby area for at least 6 months before 1991 show (upon medical testing) pleural abnormalities (calcifications, thickenings, or plaques). Furthermore, exposures to individuals outside of Libby have occurred, and are likely continuing; as asbestos-contaminated vermiculite ore from Libby was shipped to hundreds of locations around the nation for processing, and used as attic insulation in millions of homes throughout the United States. The health effects associated with former and current exposures from the asbestos contaminated vermiculite from the Libby mine continues to be a subject of intensive study and public health concern.

The overall goal of this research is to improve the scientific basis for the risk assessment of asbestos-contaminated communities by conducting toxicology studies to help define key determinants of internal dose and provide critical insight on additional key health or pathologic endpoints. These types of toxicology studies can only be done in animals and to date, rodent inhalation studies have not been conducted with the amphibole asbestos that contaminates vermiculite from Libby, Montana (Libby amphibole or LA).

This report describes the inhalation exposure methods and results for Libby Amphibole and Amosite Amphibole test material generation, analysis, and inhalation exposure environmental conditions.

The Hamner Institutes for Health Sciences Protocol 10026Inhalation Summary ReportEPA Fiber Project 90-Day Study Page 6 of 43

Materials and Methods

Chemical Libby Amphibole and UICC (Union for International Cancer Control) Amosite Amphibole test materials were obtained from the United States Geological Survey (USGS) by the Sponsor. All identity, purity, composition, stability, method of synthesis, fabrication and/or derivation information for the test materials used in this study was documented by the Sponsor. This documentation is maintained by the Sponsor at the address indicated on the title page of this report. An MSDS or CAS number was not available for the Libby Amphibole test material. The physical properties of Amosite (CAS# 12172-73-5) are listed in Table 1.

The Libby Amphibole test material was hand delivered by the Sponsor to The Hamner Institutes in a one-gallon plastic container. The plastic container was stored under ambient room temperature and humidity conditions in a glove box located in the inhalation monitoring corridor 200U. The contents of the container were used for the pilot study (Protocol 09003), the 2-week study (Protocol 10002) and this study (Protocol 10026).

The UICC Amosite Amphibole test material was shipped directly from the USGS (Denver, CO) by courier in an insulated cooler. The Amosite Amphibole test material was placed into a plastic bag within a metal container and stored under ambient room temperature and humidity conditions in the Amosite generation hood. Test material from this container was used for the 2-week study (Protocol 10002) and this study (Protocol 10026).

An archival sample was taken from each of the test materials and stored under ambient conditions. All study data, including archived samples, will be submitted to the Sponsor for permanent storage at the conclusion of the study.

Exposure SystemAnimals (F344 rats) were exposed in five direct flow nose-only exposure systems (RCC, Geneva, Switzerland). The exposure systems consisted of modular 16-port tiers and were each configured into 7-tier towers, except for the control (air-only) tower which consisted of only 6 tiers. Three towers were used for the LA target exposure concentrations, one for the AA target concentration, and one tower for the control group. Animals were placed in open nose-only exposure tubes (Battelle Memorial, WA) and attached to the towers via the tier ports. Open tubes were used to allow built up heat and humidity to escape. An adjustable back restraint on the tubes prevented animals from backing out. At each port the exposure atmosphere from the towers inner manifold was directed at the head of the animals. The exhaled air from the animals was then carried away with the excess exposure airflow through the port into the towers exhaust plenum.

Each tower was located in a separate 8m3 chamber for exposure containment and personnel safety. Air flows moving through the 8m3 chambers were controlled by supply and exhaust fans and were hepa-filtered and conditioned. The exhaust from each chamber was hepa-filtered.

An air and vacuum rotameter with an exhaust fan controlled airflow through the exposure towers. The ball setting on the air supply rotameter was used to monitor the airflow. The rotameter was calibrated with a mass flow meter (MFM, Model 4040, TSI, Inc., Shoreview, MN). A 3-way valve was used to control hepa-filtered air passing through either the generator or a bypass line directly to the exposure towers. The hepa-filtered air for all towers was obtained from the same house air compressor. Pressure was monitored with a magnehelic (Dwyer Instruments Inc., Michigan City, IN) and a baratron differential pressure gauge (MKS Instruments Inc, Andover, MA) at a tower inlet.

Temperature and relative humidity were measured near the top of each 8m 3 chamber and at a port on each exposure tower by a Rotronic Humidity / Temperature Sensor (Series 200, Rotronic Instruments

The Hamner Institutes for Health Sciences Protocol 10026Inhalation Summary ReportEPA Fiber Project 90-Day Study Page 7 of 43

Corp., Huntington, NY) connected to the Continuum Building Automation System (Andover Controls Corporation, TAC, Carrollton, TX). Temperature was calibrated by comparing the ambient air temperature recorded by the probe to a certified mercury thermometer. The relative humidity sensor was calibrated by immersing the sensor probe in an atmosphere of known humidity generated from saturated salt solutions.

The 8m3 chamber temperature and humidity readings represented the animal environment under which the exposures were conducted while the nose-only exposure tower readings represented the conditions of the atmosphere being inhaled.

Generation System The Libby and Amosite Amphibole exposure atmospheres were generated using rotating brush generators (Aerosol Generator, Model CR-3000 & CR-3020, CR Equipements SA, CH-1295 Tannay, Switzerland) to aerosolize the fiber test material. A piston pushed a column of the test material into a rotating brush, which swept material off the top of the column into the generator air stream. The test material was packed into a generator piston using a piston-packing tool. The material was gently packed so as to not to jam the piston. The air delivery pressure at the air supply rotameters for each tower was maintained at approximately 20 psi. The fibers were carried from a rotating brush generator into hepa-filtered house air at 57 liters per minute for the Libby and Amosite towers and at 50 liters per minute for the control tower. The fibers leaving a generator were delivered past a krypton-85 source (Kr 85, 10mCi, Isotopes Products Inc., Valencia, CA) to reduce charges on the particles at the exposure tower. The generator brush and piston speeds were adjusted to produce the required particle concentrations. A diagrammatic representation of the exposure system setup is provided in Figure 1.

Analytical SystemExposure atmosphere concentrations on each nose-only tower were measured daily using mass weight (gravimetric) filters at an exposure port on the tower. Filters used for daily measurements were glass fiber filters (Pall Life Sciences, Ann Arbor, MI) and were sampled at approximately 0.4 L/min. A microbalance (Model C31, ATI CAHN Instruments, Boston, MA) was used to weigh filter samples twice before and after each sampling. Aerosol concentrations on each tower were continuously monitored during exposures using a light scatter aerosol monitor (Real-Time Aerosol Monitor (RAM), MIE Inc., Billerica, MA) from a sampling port at the tower inlet. RAM voltages were recorded on the chart tracings and concentration stability visually monitored.

Particle Size Distribution Measurements Once per week particle size distributions were conducted using an optical particle sizing spectrometer (Aerodynamic Particle Sizer (APS), Model 3321, TSI, Inc. St. Paul, MN). The instrument was connected to a sampling port at the tower inlet and hepa-filtered air was added in order to keep the aerosol concentration below overload conditions. Overload conditions are reached at approximately 1000 particles / cubic centimeter and indicated by a light on the front panel of the instrument. The APS calibration was verified with polystyrene latex beads. The reported results from each week were the average of data gathered from 5 one-minute samples.

Aerosol samples were collected on polycarbonate filters once a week from each of the towers during the exposures. Following collection, filters were transferred to a 25 mm aluminum pin mounts, adhered with conductive lubricant (Neolube No.20, Huron, IN) and coated with gold using a sputter coater (Sputter Coater, SPI-Module, Model No. 12151, West Chester, PA). Samples were imaged using the scanning electron microscopy (JEOL, Model JSM-840A, Tokyo, Japan) and the images analyzed with Image-Pro Plus (V5.0.1.11 for Windows/XP, Media Cybernetics Inc., Bethesda, MD) to obtain fiber diameter, fiber length and the number of fibers from the captured images.

The gold coating, 210-280 angstroms thick, was used to stop fiber loss during electron microscopy analysis by reducing electrostatic charge on the fibers

The Hamner Institutes for Health Sciences Protocol 10026Inhalation Summary ReportEPA Fiber Project 90-Day Study Page 8 of 43

The APS samples and filter analysis were used to establish the particle size distribution and that the distribution was consistent at the start and end of the exposures.

Tower Distribution Each LA and AA exposure tower was checked for uniformity of distribution of the test material by measuring the aerosol mass concentration, APS size distributions, and SEM size distributions at top, middle, and bottom ports for each tower. Tower distribution measurements for these exposures were performed prior to the start of animal exposures. Test material concentrations used for uniformity of distribution evaluations were not intended to match target exposure concentrations selected for the study.

Study Design and Study Day Numbering The study consisted of a 90-day inhalation exposure, 6 hours a day, 5 days a week, for 13 consecutive weeks. Due to the large number of animals, exposure start dates were staggered and a total of 67 exposures were conducted. Of the 67 exposure days, animals received a total of 65 exposures. Exposures were conducted in nose-only tubes, to the LA test material, spanning a 10-fold concentration range, at low, medium, and high concentrations (1.0, 3.3, 10.0 mg/m3), or to AA test material as a positive control fiber at 3.3 mg/m3. Rats exposed to filtered air served as negative controls (Table 2).

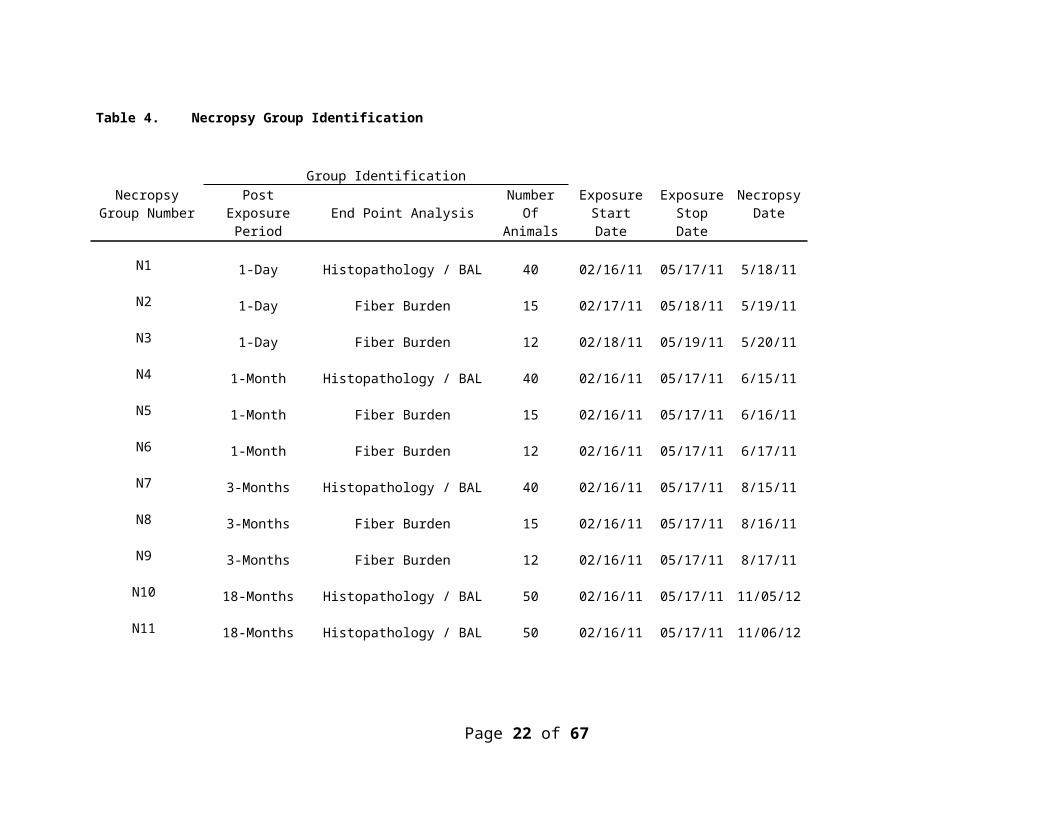
Animals were assigned to pathological response (bronchoalveolar lavage (BAL) fluid analysis and histopathology evaluation) or to dosimetry modeling (fiber burden analysis) critical endpoints (Table 3). Necropsies were scheduled at 1-day, 1-month, 3-month, and 18-month time points after the last exposure. To facilitate exposure and necropsy scheduling animals were assigned to necropsy groups (Table 4).

Study day numbering started from the first day of exposure and continued sequentially up to and including the day when the last animal was necropsied.

An exposure day was defined as a 6-hour exposure period. The daily start and finish times for exposures slightly varied though all exposures occurred between 7 am – 3 pm. Each exposure was followed by at least a 15-minute clearance period for all concentrations prior to the opening of the 8m3 chambers for animal care procedures. The continued animal exposure during the 15 minute period can be considered to be the reciprocal equivalent of the “under exposure” experienced during the chamber equilibration (concentration build up) period.

Environmental Parameters The temperature, relative humidity, and static pressure from each of the 8m3 chambers and exposure towers were collected by the Continuum Building Automation System for each exposure period. The exposure tower air flow rotameter ball setting was hand recorded three times daily for each exposure period.

Domiciliary Housing Animals were housed during non-exposure periods in individual wire mesh cages. After the exposure and clearance period, animals were transferred from nose-only tubes on the exposure towers to the housing cages located in each 8m3 chamber anteroom. Animals were provided with food and water ad libitum during non-exposure periods only. The lighting cycle for the animals was 12 hours of light followed by 12 hours of darkness and was controlled by the Continuum Building Automation System.

Project Personnel

Inhalation Facility

Lead Research Associate Earl W. Tewksbury, B. A.Research Associate Carl U. Parkinson, LATg

The Hamner Institutes for Health Sciences Protocol 10026Inhalation Summary ReportEPA Fiber Project 90-Day Study Page 9 of 43

Research Associate Kay C. Roberts, A. S.

The Hamner Institutes for Health Sciences Protocol 10026Inhalation Summary ReportEPA Fiber Project 90-Day Study Page 10 of 43

Results

ChemicalThere were no additional chemical analyses of the LA or AA test materials performed by The Hamner.

Tower Distribution of LA or AA Test MaterialThe results from the tower distribution measurements are in Tables 5a – 5c. [Note: Test material concentrations used for uniformity of distribution evaluations were not intended to match target exposure concentrations selected for the study.] The coefficient of variation calculated from mass weight filters (Table 5a) for the top, middle and bottom tier was less than or equal to 10.8% for each exposure tower. The coefficient of variation obtained from the size distribution data of APS samples (Table 5b) was less than or equal to 2.3% between tiers for each of the exposure towers. Both coefficients indicate that the test materials were uniformly distributed throughout the exposure towers.

The fiber diameter and length measurements obtained from SEM filter samples were similar for each exposure tower. For all AA and LA samples evaluated, the average fiber diameter and fiber length ranges were 0.302 μm to 0.349 μm and 4.732 μm to 5.706 μm, respectively (Table 5c).

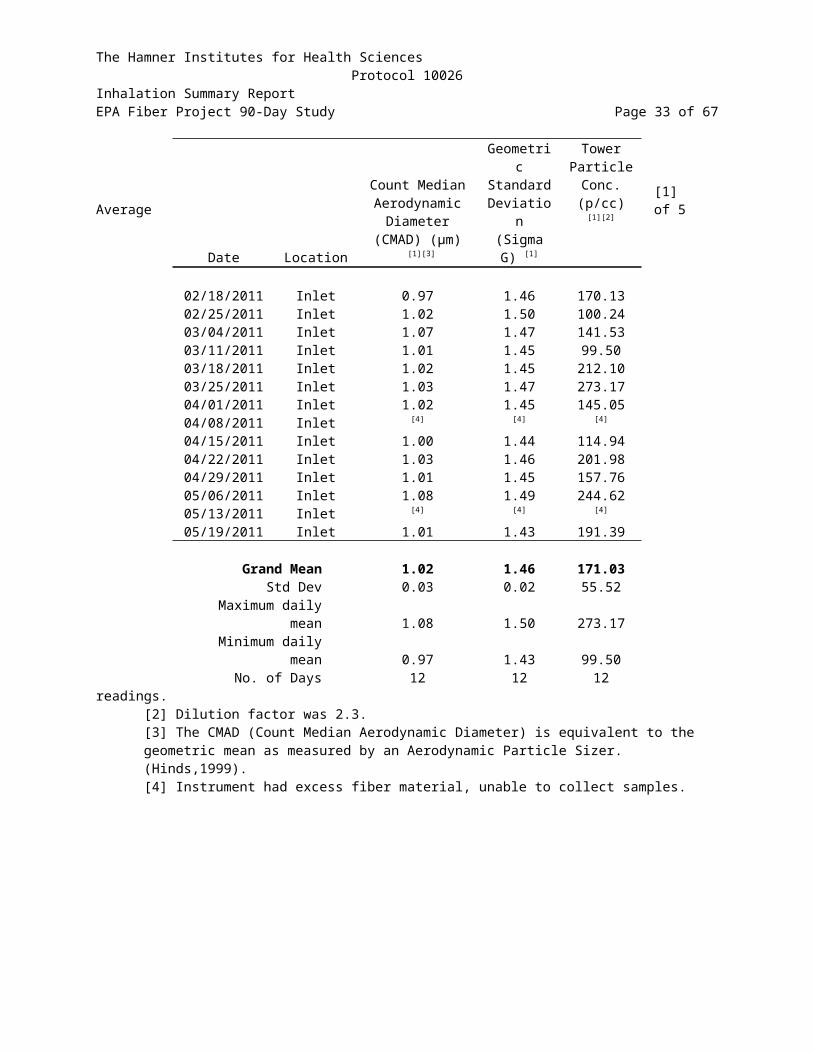
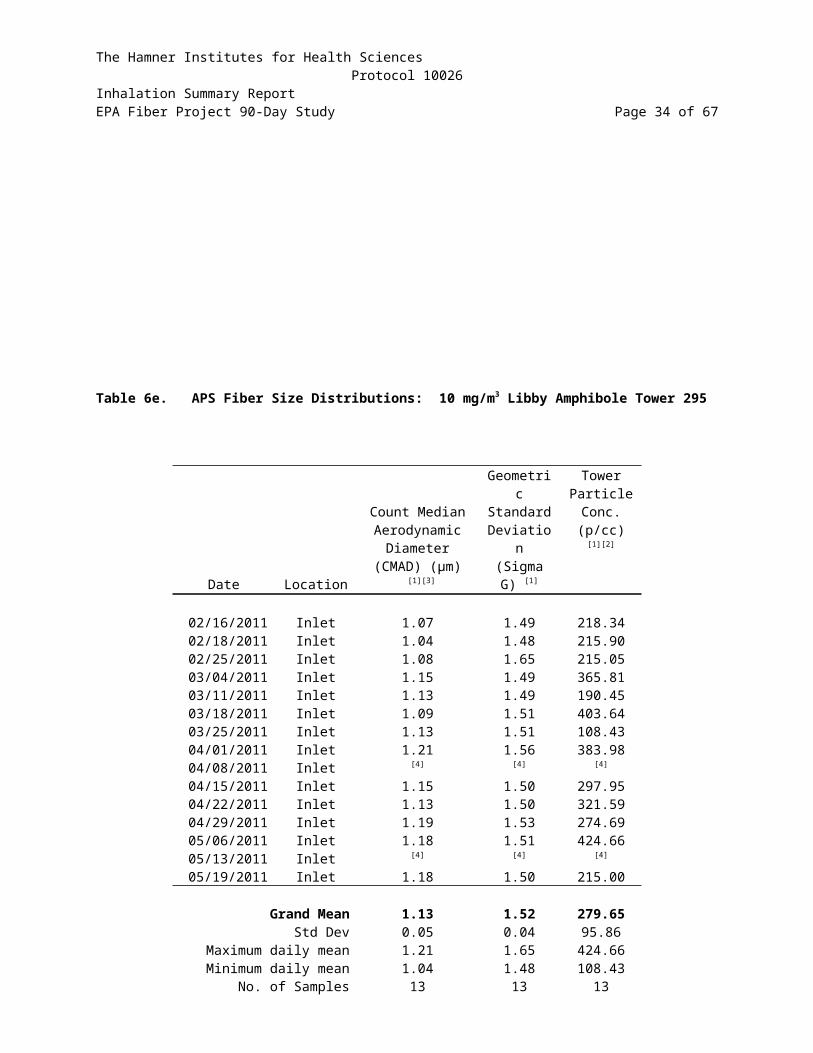
Generation and Nose Only Exposure Concentration s Fiber size distribution was sampled once a week during the exposure period and analyzed by APS (Tables 6a – 6f) and by SEM (Tables 7a – 7e). The APS count median aerodynamic diameter (CMAD) grand averages were 0.93 μm, 1.05 μm, 1.02 μm, 1.13 μm, and 1.41 μm for the 3.3 mg/m 3 AA, 1.0 mg/m3

LA, 3.3 mg/m3 LA, 10 mg/m3 LA, and air-only (control) exposures, respectively (Table 6a). The control exposure size distribution was based on an average particle concentration of 1.2 particles/cc. Samples for the AA and LA exposure groups were based on average particle concentrations between 43 and 404 particles/cc (Table 6a). For SEM filter samples, the grand average fiber diameter and length of all LA exposure groups ranged between 0.387 and 0.421 µm and 3.942 and 4.625 µm, respectively (Table 7e). For the AA exposure group, the grand average fiber diameter and length were 0.329 and 3.049 µm, respectively. The grand average fiber/cc concentrations were 159, 693, 1522, and 230 for the 1.0 mg/m 3

LA, 3.3 mg/m3 LA, 10 mg/m3 LA, and 3.3 mg/m3 AA exposures, respectively (Table 7e). The APS and SEM data indicated that fiber size distributions were relatively stable during the 67 days of exposure.

Tables 8a – 8e show the summary and individual daily inhalation exposure data for each exposure group. The grand mean and standard deviation of the daily mean values for mass weight filter concentration, 8m3

chamber temperature, 8m3 chamber humidity, 8m3 chamber static pressure, exposure tower temperature, exposure tower humidity, tower static pressure, and tower airflow ball settings are shown below. The smallest minimum daily mean and the largest maximum daily mean are also shown. The grand mean is the mean for all daily (n=67) exposures. The exposure data are extremely similar for all exposures groups as seen in the individual daily summaries.

Fiber Concentrations:The grand means (± standard deviations) for fiber concentration based on mass weight filter data for all groups were 0.0 (± 0.2), 3.32 (± 1.48), 1.01 (± 0.45), 3.34 (± 0.83), and 10.04 (± 2.04) mg/m3 for the target concentrations of 0.0 mg/m3 (control), 3.3 mg/m3 of AA, 1.0 mg/m3 of LA, 3.3 mg/m3 of LA and 10 mg/m3 of LA, respectively (Tables 8a – 8e). The exposure concentration values reported for the control chamber are of background particles in air (e.g., animal dander) and not of LA or AA test chemical, since no test chemical was generated into the air stream of the control chamber.

8m3 Chamber Temperatures:The grand means (± standard deviations) for 8m3 chamber temperature for all groups were 67.6 (± 0.5), 71.3 (± 0.5), 69.2 (± 0.7), 69.4 (± 0.9), and 70.7 (± 0.9) oF for the target concentrations of 0.0 mg/m3

(control), 3.3 mg/m3 of AA, 1.0 mg/m3 of LA, 3.3 mg/m3 of LA and 10 mg/m3 of LA, respectively.

The Hamner Institutes for Health Sciences Protocol 10026Inhalation Summary ReportEPA Fiber Project 90-Day Study Page 11 of 43

8m3 Chamber Relative Humidity:The grand means (± standard deviations) for 8m3 chamber relative humidity for all groups were 49.3 (± 1.5), 48.4 (± 1.5), 52.0 (± 1.4), 47.8 (± 3.2), and 48.5 (± 0.8) %RH for the target concentrations of 0.0 mg/m3 (control), 3.3 mg/m3 of AA, 1.0 mg/m3 of LA, 3.3 mg/m3 of LA and 10 mg/m3 of LA, respectively.

8m3 Chamber Static Pressures:The grand means (± standard deviations) for 8m3 chamber static pressure for all groups were -0.022 (± 0.031), -0.042 (± 0.002), -0.067 (± 0.058), -0.032 (± 0.033), and -0.022 (± 0.031) inches of water for the target concentrations of 0.0 mg/m3 (control), 3.3 mg/m3 of AA, 1.0 mg/m3 of LA, 3.3 mg/m3 of LA and 10 mg/m3 of LA, respectively.

Exposure Tower Temperatures:The grand means (± standard deviations) for exposure tower temperature for all groups were 73.4 (±1.1), 77.4 (± 1.4), 78.7 (± 2.1), 71.5 (± 1.5), and 78.5 (± 1.9) oF for the target concentrations of 0.0 mg/m3

(control), 3.3 mg/m3 of AA, 1.0 mg/m3 of LA, 3.3 mg/m3 of LA and 10 mg/m3 of LA, respectively.

Exposure Tower Relative Humidity:The grand means (± standard deviations) for exposure tower relative humidity for all groups were 5.2 (± 2.2), 7.5 (± 10.3), 8.6 (± 13.5), 4.5 (± 2.7), and 6.7 (± 3.6) %RH for the target concentrations of 0.0 mg/m 3

(control), 3.3 mg/m3 of AA, 1.0 mg/m3 of LA, 3.3 mg/m3 of LA and 10 mg/m3 of LA, respectively.

Exposure Tower Static Pressure:The grand means (± standard deviations) for exposure tower static pressure for all groups were -0.035 (± 0.002), -0.019 (± 0.003), -0.079 (± 0.029), -0.110 (± 0.019), and -0.117 (± 0.033) inches of water for the target concentrations of 0.0 mg/m3 (control), 3.3 mg/m3 of AA, 1.0 mg/m3 of LA, 3.3 mg/m3 of LA and 10 mg/m3 of LA, respectively.

Exposure Tower Air Flow Ball Setting:Air rotameters used to control the exposure tower air flow were calibrated during pre-study setup. A rotameter ball setting of 122 was equivalent to an approximate air flow rate of 50.0 L/min for the control tower. Rotameter ball settings of 133, 97, 91, and 88 were equivalent to an approximate air flow of 57.0 L/min for the target concentrations of 3.3 mg/m3 of AA, 1.0 mg/m3 of LA, 3.3 mg/m3 of LA and 10 mg/m3 of LA, respectively.

The grand means (± standard deviations) for exposure tower airflow ball setting for all groups were 122 (± 0), 134 (± 0), 97 (± 0), 91 (± 0), and 89 (± 0) for the target concentrations of 0.0 mg/m 3 (control), 3.3 mg/m3 of AA, 1.0 mg/m3 of LA, 3.3 mg/m3 of LA and 10 mg/m3 of LA, respectively.

DeviationsAPS samples were not collected on two occasions, Study Day 52 and 87, from the towers as specified in the protocol. On both days the instrument samples indicated they were heavily contaminated with excess fibers and samples were not reliable. SEM samples collected from tower 292 on Study Day 8 and tower 295 on Study Day 87 could not be analyzed due to test chemical overload. There was no impact to the exposures as a result of these deviations. Each deviation was documented and reported to the Principal Investigator as a Protocol Deviation.

ConclusionsAA and LA exposures were conducted by nose-only inhalation for 6 hours a day, 5 days a week, for 13 consecutive weeks for a total of 67 exposures. During animal exposure, the concentrations of the test materials were monitored using a light scatter aerosol instrument and measured by gravimetric filter. The aerosol concentration grand averages (± standard deviations) of the daily means were 0.0 (± 0.2) mg/m3, 1.01 (± 0.45) mg/m3 LA, 3.34 (± 0.83) mg/m3 LA, 10.04 (± 2.04) mg/m3 LA, and 3.32 (± 1.48)

The Hamner Institutes for Health Sciences Protocol 10026Inhalation Summary ReportEPA Fiber Project 90-Day Study Page 12 of 43

mg/m3 AA for the target exposure concentrations of 0.0 mg/m3 (control), 1.0 mg/m3 LA, 3.3 mg/m3 LA, 10 mg/m3 LA, and 3.3 mg/m3 AA, respectively.

The grand averages of count median aerodynamic diameter (CMAD) were 1.05 μm, 1.02 μm, 1.13 μm and 0.93 μm, for the 1.0 mg/m3 LA, 3.3 mg/m3 LA, 10 mg/m3 LA, and 3.3 mg/m3 AA exposures, respectively. For scanning electron microscopy aerosol samples, the grand average fiber diameter and fiber length ranges for all LA and AA exposure groups were between 0.329 and 0.421 µm and 3.049 and 4.625 µm, respectively. The APS and SEM data indicated that fiber size distributions were relatively stable during the 67 days of exposure.

The nose-only inhalation exposure systems were placed in 8m3 exposure chambers for personnel safety and the monitoring of external environmental conditions. The environmental parameters for temperature and relative humidity in the 8m3 chambers were maintained at or near 70oF and 50%, respectively, throughout the exposure period. The nose-only exposure atmosphere temperature and relative humidity were maintained at or near 76oF and 7% relative humidity, respectively, throughout the exposure period.

The exposures were conducted from Feb 16th, 2011 through May 20th, 2011.

ReferencesHinds WC. Aerosol Technology – Properties, Behavior, and Measurements of Airborne Particles. New York: Wiley, 1999, p.92.

The Hamner Institutes for Health Sciences Protocol 10026Inhalation Summary ReportEPA Fiber Project 90-Day Study Page 13 of 43

Table 1. Physical and Chemical Properties of UICC Amosite

Name: Amosite

Synonyms: Amosite, UICC Amosite,

CAS No.: 12172-73-51

Molecular Formula: (Mg,Fe)7Si8O22(OH)21

Molecular Weight: 1171.511

Specific Gravity: 3.43 g/cc1

Flash Point: No Data

Vapor Pressure: No Data

Stability: Stable under ordinary conditions of use and storage1

Lot/Batch Number: No Data

Appearance: Fibrous Solid, Color – Brown, Gray or Green1

Melting Point/Range: Decomposes below melting point of 950°C1

Identity and Purity: Documentation maintained by Sponsor

Storage Conditions: Ambient conditions, in hood

Container: Plastic Bag, inside metal container

Manufacturer: International Union Against Cancer (UICC)

Supplied by: Sponsor

1Source: MSDS from Structure Probe Inc (SPI) for Product# 02703AB - UICC Amosite Asbestos Standard

The Hamner Institutes for Health Sciences Protocol 10026Inhalation Summary ReportEPA Fiber Project 90-Day Study Page 14 of 43

Table 2. Study Design

Test Material

Number of rats necropsied at each time point Total inConcentration Post-Exposure Period Each Exp.

(mg/m3)1

day1

month3

months18

months*Group

Air Control 0.0 11 11 11 53 86Amosite 3.3 14 14 14 56 98

LA 1.0 14 14 14 56 98LA 3.3 14 14 14 56 98LA 10.0 14 14 14 56 98

Total in Each Post-Exp Period 67 67 67 277Total Animals in Study 478

* Post-Inhalation Exposure Period.

The Hamner Institutes for Health Sciences Protocol 10026Inhalation Summary ReportEPA Fiber Project 90-Day Study Page 15 of 43

Table 3. Critical Endpoints

Test Material

Number of rats necropsied for each endpoint type

Concentration Endpoint Post-Exposure Period

(mg/m3)1

day1

month3

months18

months*Air

Control0.0 Fiber #** 3 3 3 3

BAL*** 8 8 8 8Histopath 8 8 8 50

Amosite 3.3 Fiber #** 6 6 6 6BAL*** 8 8 8 8

Histopath 8 8 8 50LA 1.0 Fiber #** 6 6 6 6

BAL*** 8 8 8 8Histopath 8 8 8 50

LA 3.3 Fiber #** 6 6 6 6BAL*** 8 8 8 8

Histopath 8 8 8 50LA 10.0 Fiber #** 6 6 6 6

BAL*** 8 8 8 8Histopath 8 8 8 50

Fiber #:BAL/Histopath:

2740

2740

Totals: 2740

27250

* Post-Inhalation Exposure Period

** Only fiber analysis is conducted on animals listed in "Fiber #" rows.

***BAL (Bronchoalveolar Lavage) is conducted on same set of animals as histopath; but only on 8 from

each group of 50 animals at the final necropsy.

Table 4. Necropsy Group Identification

Group IdentificationNecropsy

Group NumberPost

Exposure Period End Point AnalysisNumber

Of AnimalsExposureStart Date

ExposureStop Date

NecropsyDate

N1 1-Day Histopathology / BAL 40 02/16/11 05/17/11 5/18/11

N2 1-Day Fiber Burden 15 02/17/11 05/18/11 5/19/11

N3 1-Day Fiber Burden 12 02/18/11 05/19/11 5/20/11

N4 1-Month Histopathology / BAL 40 02/16/11 05/17/11 6/15/11

N5 1-Month Fiber Burden 15 02/16/11 05/17/11 6/16/11

N6 1-Month Fiber Burden 12 02/16/11 05/17/11 6/17/11

N7 3-Months Histopathology / BAL 40 02/16/11 05/17/11 8/15/11

N8 3-Months Fiber Burden 15 02/16/11 05/17/11 8/16/11

N9 3-Months Fiber Burden 12 02/16/11 05/17/11 8/17/11

N10 18-Months Histopathology / BAL 50 02/16/11 05/17/11 11/05/12

N11 18-Months Histopathology / BAL 50 02/16/11 05/17/11 11/06/12

N12 18-Months Histopathology / BAL 50 02/16/11 05/17/11 11/07/12

N13 18-Months Histopathology / BAL 50 02/16/11 05/17/11 11/08/12

N14 18-Months Histopathology / BAL 50 02/16/11 05/17/11 11/09/12

N15 18-Months Fiber Burden 15 02/16/11 05/17/11 11/12/12

N16 18-Months Fiber Burden 12 02/16/11 05/17/11 11/13/12

Page 16 of 43

Table 5a. Fiber Distribution Uniformity in Exposure Towers - Filter Data

Tower1 DateSampleLocation

MassConcentration

(mg/m3)Average(mg/m3)

StandardDeviation

Coefficientof Variance

292 12/15/2010Top Tier

Middle TierBottom Tier

8.2387.8046.658

7.567 0.816 10.8

293 12/14/2010Top Tier

Middle TierBottom Tier

0.6780.6040.717

0.666 0.057 8.6

294 12/14/2010Top Tier

Middle TierBottom Tier

7.3298.6388.976

8.315 0.870 10.5

295 12/15/2010Top Tier

Middle TierBottom Tier

4.3704.5894.816

4.592 0.233 4.9

[1] Tower 292 – 3.3 mg/m3 AA, Tower 293 – 1.0 mg/m3 LA, Tower 294 – 3.3 mg/m3 LA, Tower 295 – 10.0 mg/m3 LA

Page 17 of 43

The Hamner Institutes for Health Sciences Protocol 10026Inhalation Summary ReportEPA Fiber Project 90-Day Study Page 18 of 43

Table 5b. Fiber Distribution Uniformity in Exposure Towers - APS Particle Size Distribution

Tower[5] DateSampleLocation

Count Median Aerodynamic Diameter

µm (standard deviation) [1][4]

GeometricStandard Deviation

Sigma G (standard deviation) [1]

292 02/08/11Inlet

Top TierMiddle TierBottom Tier

MeanStd. Dev.[2]

CV.[3]

0.88 (0.02)0.87 (0.03)0.87 (0.01)0.86 (0.01)

0.870.010.9

1.38 (0.02)1.38 (0.02)1.37 (0.01)1.37 (0.01)

1.380.010.4

293 02/07/11Inlet

Top TierMiddle TierBottom Tier

MeanStd. Dev.[2]

CV. [3]

1.10 (0.04)1.08 (0.03)1.10 (0.02)1.10 (0.03)

1.100.010.9

1.55 (0.01)1.54 (0.02)1.54 (0.01)1.54 (0.01)

1.540.010.3

294 02/07/11Inlet

Top TierMiddle TierBottom Tier

MeanStd. Dev. [2]

CV.[3]

1.04 (0.02)1.01 (0.01)0.99 (0.01)0.99 (0.01)

1.010.022.3

1.48 (0.01)1.48 (0.01)1.47 (0.00)1.47 (0.01)

1.480.010.4

295 02/07/11Inlet

Top TierMiddle TierBottom Tier

MeanStd. Dev. [2]

CV.[3]

1.01 (0.01)1.00 (0.01)1.02 (0.01)1.01 (0.02)

1.010.010.8

1.47 (0.01)1.45 (0.01)1.47 (0.01)1.47 (0.01)

1.470.010.7

[1] Each aerosol diameter and geometric standard deviation reading is the mean of 5 APS samples taken from each location for each tower. The standard deviation is for each of these means within each port.[2] Std. Dev. - Standard Deviation of the Mean between ports.[3] CV. - Coefficient of Variation = (Std. Dev. / Average) x 100[4] The CMAD (Count Median Aerodynamic Diameter) is equivalent to the geometric mean as measured by an Aerodynamic Particle Sizer. (Hinds, 1999).[5] Tower 292 – 3.3 mg/m3 AA, Tower 293 – 1.0 mg/m3 LA, Tower 294 – 3.3 mg/m3 LA, Tower 295 – 10.0 mg/m3

The Hamner Institutes for Health Sciences Protocol 10026Inhalation Summary ReportEPA Fiber Project 90-Day Study Page 19 of 43

Table 5c. Fiber Distribution Uniformity in Exposure Towers - SEM Fiber Size Distribution

Tower 292 – 02/08/113.3 mg/m3 Amosite

Top Tier

MiddleTier

BottomTier

Total Number of Objects Sized: 327 334 332Objects with L/D Ratio < 3 110 95 87Objects with L/D Ratio ≥ 3 217 239 245Objects with L/D Ratio ≥ 5 131 145 156

Objects with L/D Ratio ≥ 20 46 65 69Number of Fibers (L/D ≥ 3): 217 239 245 Mean Std. Dev. [1] CV[2]

Average Fiber Diameter (µm): 0.328 0.336 0.314 0.326 0.011 3.3Average Fiber Length (µm): 5.259 5.079 4.732 5.023 0.268 5.3

Tower 293 - 02/07/111.0 mg/m3 Libby Amphibole

TopTier

MiddleTier

BottomTier

Total Number of Objects Sized: 333 335 293Objects with L/D Ratio < 3 80 100 98Objects with L/D Ratio ≥ 3 253 235 195Objects with L/D Ratio ≥ 5 201 191 150

Objects with L/D Ratio ≥ 20 55 50 52Number of Fibers (L/D ≥ 3): 253 235 195 Mean Std. Dev. [1] CV[2]

Average Fiber Diameter (µm): 0.302 0.340 0.309 0.317 0.020 6.4Average Fiber Length (µm): 5.104 5.543 5.484 5.377 0.238 4.4

Tower 294 - 02/07/113.3 mg/m3 Libby Amphibole

Top Tier

Middle Tier

BottomTier

Total Number of Objects Sized: 373 343 351Objects with L/D Ratio < 3 113 120 101Objects with L/D Ratio ≥ 3 260 223 250Objects with L/D Ratio ≥ 5 110 105 99

Objects with L/D Ratio ≥ 20 71 60 59Number of Fibers (L/D ≥ 3): 260 223 250 Mean Std. Dev. [1] CV[2]

Average Fiber Diameter (µm): 0.312 0.349 0.331 0.331 0.018 5.5Average Fiber Length (µm): 5.390 4.832 5.706 5.310 0.443 8.3

Tower 295 - 02/07/1110 mg/m3 Libby Amphibole

Top Tier

MiddleTier

BottomTier

Total Number of Objects Sized: 398 366 309Objects with L/D Ratio < 3 95 88 93Objects with L/D Ratio ≥ 3 303 278 216Objects with L/D Ratio ≥ 5 251 220 172

Objects with L/D Ratio ≥ 20 77 62 51Number of Fibers (L/D ≥ 3): 303 278 216 Mean Std. Dev. [1] CV[2]

The Hamner Institutes for Health Sciences Protocol 10026Inhalation Summary ReportEPA Fiber Project 90-Day Study Page 20 of 43

Average Fiber Diameter (µm): 0.341 0.309 0.307 0.319 0.019 6.0Average Fiber Length (µm): 5.028 5.346 4.862 5.079 0.246 4.8

[1] Std. Dev. - Standard Deviation of the Mean between ports.[2] CV. - Coefficient of Variation = (Std. Dev. / Average) x 100

Table 6a. APS Summary Fiber Size Distributions During Exposures [1]

Tower

Count MedianAerodynamic

Diameter(CMAD)(µm)[2]

GeometricStandardDeviation(Sigma G)

ParticleConc.(p/cc)[3]

292Amosite

3.3 mg/m3

Grand MeanStd Dev

Maximum daily meanMinimum daily mean

No. of Days

0.930.041.040.8812

1.400.081.651.3412

404.13132.00650.74222.96

12

293Libby Amphibole

1.0 mg/m3

Grand MeanStd Dev

Maximum daily meanMinimum daily mean

No. of Days

1.050.061.170.9812

1.510.031.561.4512

42.9222.9895.8021.44

12

294Libby Amphibole

3.3 mg/m3

Grand MeanStd Dev

Maximum daily meanMinimum daily mean

No. of Days

1.020.031.080.9712

1.460.021.501.4312

171.0355.52273.1799.50

12

295Libby Amphibole

10 mg/m3

Grand MeanStd Dev

Maximum daily meanMinimum daily mean

No. of Days

1.130.051.211.0413

1.520.041.651.4813

279.6595.86424.66108.43

13

296Control

0.0 mg/m3

Grand MeanStd Dev

Maximum daily meanMinimum daily mean

No. of Days

1.410.983.450.6812

2.010.582.901.3312

1.203.20

11.230.0312

[1] See Tables 6b – 6f for individual daily values.[2] The CMAD (Count Median Aerodynamic Diameter) is equivalent to the geometric mean as measured by an Aerodynamic Particle Sizer. (Hinds, 1999).

The Hamner Institutes for Health Sciences Protocol 10026Inhalation Summary ReportEPA Fiber Project 90-Day Study Page 21 of 43

[3] APS samples diluted, see Tables 6b – 6f for dilution factor.

Table 6b. APS Fiber Size Distribution: 3.3 mg/m3 Amosite Amphibole Tower 292

[1] Average of 5 readings.[2] Dilution factor was 2.3.[3] The CMAD (Count Median Aerodynamic Diameter) is equivalent to the geometric mean as measured by an Aerodynamic Particle Sizer. (Hinds, 1999).[4] Instrument had excess fiber material, unable to collect samples.

Date Location

Count Median Aerodynamic

Diameter(CMAD) (µm)

[1][3]

Geometric StandardDeviation(Sigma G)

[1]

TowerParticleConc.(p/cc)

[1][2]

02/18/2011 Inlet 0.88 1.41 561.1702/25/2011 Inlet 0.94 1.65 569.6203/4/2011 Inlet 0.93 1.38 323.84

03/11/2011 Inlet 0.93 1.39 650.7403/18/2011 Inlet 0.88 1.34 371.4303/25/2011 Inlet 0.96 1.39 396.7704/1/2011 Inlet 1.04 1.46 417.8504/8/2011 Inlet [4] [4] [4]

04/15/2011 Inlet 0.93 1.37 222.9604/22/2011 Inlet 0.92 1.36 380.1704/29/2011 Inlet 0.94 1.38 301.7105/6/2011 Inlet 0.92 1.38 413.66

05/13/2011 Inlet [4] [4] [4]

05/19/2011 Inlet 0.91 1.34 239.59

Grand Mean 0.93 1.40 404.13Std Dev 0.04 0.08 132.00

Maximum daily mean 1.04 1.65 650.74Minimum daily mean 0.88 1.34 222.96

No. of Days 12 12 12

The Hamner Institutes for Health Sciences Protocol 10026Inhalation Summary ReportEPA Fiber Project 90-Day Study Page 22 of 43

Table 6c. APS Fiber Size Distributions: 1.0 mg/m3 Libby Amphibole Tower 293

[1] Average of 5 readings.[2] Dilution factor was 2.3.[3] The CMAD (Count Median Aerodynamic Diameter) is equivalent to the geometric mean as measured by an Aerodynamic Particle Sizer. (Hinds, 1999).[4] Instrument had excess fiber material, unable to collect samples.

Date Location

Count Median Aerodynamic

Diameter(CMAD) (µm)

[1][3]

Geometric StandardDeviation(Sigma G)

[1]

TowerParticleConc.(p/cc)

[1][2]

02/18/2011 Inlet 1.01 1.52 52.3902/25/2011 Inlet 1.02 1.54 40.1803/4/2011 Inlet 1.12 1.52 24.33

03/11/2011 Inlet 1.09 1.52 37.7903/18/2011 Inlet 1.09 1.51 21.6203/25/2011 Inlet 1.17 1.56 41.9904/1/2011 Inlet 1.12 1.53 21.4404/8/2011 Inlet [4] [4] [4]

04/15/2011 Inlet 0.99 1.45 95.8004/22/2011 Inlet 1.02 1.49 33.2304/29/2011 Inlet 1.03 1.51 24.2505/6/2011 Inlet 0.98 1.48 44.79

05/13/2011 Inlet [4] [4] [4]

05/19/2011 Inlet 1.02 1.49 77.29

Grand Mean 1.05 1.51 42.92Std Dev 0.06 0.03 22.98

Maximum daily mean 1.17 1.56 95.80Minimum daily mean 0.98 1.45 21.44

No. of Days 12 12 12

The Hamner Institutes for Health Sciences Protocol 10026Inhalation Summary ReportEPA Fiber Project 90-Day Study Page 23 of 43

Table 6d. APS Fiber Size Distributions: 3.3 mg/m3 Libby Amphibole Tower 294

[1] Average of 5 readings.[2] Dilution factor was 2.3. [3] The CMAD (Count Median Aerodynamic Diameter) is equivalent to the geometric mean as measured by an Aerodynamic Particle Sizer. (Hinds,1999).[4] Instrument had excess fiber material, unable to collect samples.

Date Location

Count Median Aerodynamic

Diameter(CMAD) (µm)

[1][3]

Geometric StandardDeviation(Sigma G)

[1]

TowerParticleConc.(p/cc)

[1][2]

02/18/2011 Inlet 0.97 1.46 170.1302/25/2011 Inlet 1.02 1.50 100.2403/04/2011 Inlet 1.07 1.47 141.5303/11/2011 Inlet 1.01 1.45 99.5003/18/2011 Inlet 1.02 1.45 212.1003/25/2011 Inlet 1.03 1.47 273.1704/01/2011 Inlet 1.02 1.45 145.0504/08/2011 Inlet [4] [4] [4]

04/15/2011 Inlet 1.00 1.44 114.9404/22/2011 Inlet 1.03 1.46 201.9804/29/2011 Inlet 1.01 1.45 157.7605/06/2011 Inlet 1.08 1.49 244.6205/13/2011 Inlet [4] [4] [4]

05/19/2011 Inlet 1.01 1.43 191.39

Grand Mean 1.02 1.46 171.03Std Dev 0.03 0.02 55.52

Maximum daily mean 1.08 1.50 273.17Minimum daily mean 0.97 1.43 99.50

No. of Days 12 12 12

The Hamner Institutes for Health Sciences Protocol 10026Inhalation Summary ReportEPA Fiber Project 90-Day Study Page 24 of 43

Table 6e. APS Fiber Size Distributions: 10 mg/m3 Libby Amphibole Tower 295

[1] Average of 5 readings.[2] Dilution factor was 2.5.[3] The CMAD (Count Median Aerodynamic Diameter) is equivalent to the geometric mean as measured by an Aerodynamic Particle Sizer. (Hinds,1999).

Date Location

Count Median Aerodynamic

Diameter(CMAD) (µm)

[1][3]

Geometric StandardDeviation(Sigma G)

[1]

TowerParticleConc.(p/cc)

[1][2]

02/16/2011 Inlet 1.07 1.49 218.3402/18/2011 Inlet 1.04 1.48 215.9002/25/2011 Inlet 1.08 1.65 215.0503/04/2011 Inlet 1.15 1.49 365.8103/11/2011 Inlet 1.13 1.49 190.4503/18/2011 Inlet 1.09 1.51 403.6403/25/2011 Inlet 1.13 1.51 108.4304/01/2011 Inlet 1.21 1.56 383.9804/08/2011 Inlet [4] [4] [4]

04/15/2011 Inlet 1.15 1.50 297.9504/22/2011 Inlet 1.13 1.50 321.5904/29/2011 Inlet 1.19 1.53 274.6905/06/2011 Inlet 1.18 1.51 424.6605/13/2011 Inlet [4] [4] [4]

05/19/2011 Inlet 1.18 1.50 215.00

Grand Mean 1.13 1.52 279.65Std Dev 0.05 0.04 95.86

Maximum daily mean 1.21 1.65 424.66Minimum daily mean 1.04 1.48 108.43

No. of Samples 13 13 13

The Hamner Institutes for Health Sciences Protocol 10026Inhalation Summary ReportEPA Fiber Project 90-Day Study Page 25 of 43

[4] Instrument had excess fiber material, unable to collect samples.

Table 6f. APS Fiber Size Distributions: 0 mg/m3 Control Tower 296

[1] Average of 5 readings.[2] Dilution factor was 1.7.[3] The CMAD (Count Median Aerodynamic Diameter) is equivalent to the geometric mean as measured by an Aerodynamic Particle Sizer. (Hinds,1999).[4] Instrument had excess fiber material, unable to collect samples.

Date Location

Count Median Aerodynamic

Diameter(CMAD) (µm)

[1][3]

Geometric StandardDeviation(Sigma G)

[1]

TowerParticleConc.(p/cc)

[1][2]

02/18/2011 Inlet 2.20 1.70 0.6502/25/2011 Inlet 0.87 1.65 11.2303/04/2011 Inlet 0.85 1.64 1.7103/11/2011 Inlet 0.74 1.55 0.0303/18/2011 Inlet 0.68 1.33 0.1003/25/2011 Inlet 0.69 1.40 0.0504/01/2011 Inlet 0.90 2.03 0.0404/08/2011 Inlet [4] [4] [4]

04/15/2011 Inlet 0.73 1.87 0.0604/22/2011 Inlet 0.73 1.87 0.0604/29/2011 Inlet 1.68 2.89 0.0805/06/2011 Inlet 3.45 2.57 0.1305/13/2011 Inlet [4] [4] [4]

05/19/2011 Inlet 3.06 2.90 0.18

Grand Mean 1.41 2.01 1.20Std Dev 0.98 0.58 3.20

Maximum daily mean 3.45 2.90 11.23Minimum daily mean 0.68 1.33 0.03

No. of Samples 12 12 12

The Hamner Institutes for Health Sciences Protocol 10026Inhalation Summary ReportEPA Fiber Project 90-Day Study Page 26 of 43

Table 7a. SEM Fiber Size Distribution– 3.3 mg/m3 Amosite Amphibole Tower 292

Tower 292 SamplesSample:

Study Day:Date:

18

02/23/11

210

02/25/11

317

03/04/11

424

03/11/11

531

03/18/11

638

03/25/11

743

03/30/11Total Number of Objects Sized: 209 235 269 265 238 170

Objects with L/D Ratio < 3 101 115 135 124 115 87Objects with L/D Ratio ≥ 3 [1] 108 120 134 141 123 83Objects with L/D Ratio ≥ 5 60 73 88 96 78 53

Objects with L/D Ratio ≥ 20Objects with L/D Ratio ≥ 3 & L > 5

1217

713

1926

1319

1521

413

Fibers/cc (L/D ≥ 3 & L > 5): 257 166 362 188 275 176Average Fiber Diameter (µm): 0.329 0.314 0.329 0.316 0.324 0.335

Average Fiber Length (µm): 3.124 2.845 3.617 2.882 3.246 2.923

Tower 292 SamplesSample:

Study Day:Date:

852

04/08/11

959

04/15/11

1066

04/22/11

1173

04/29/11

1280

05/06/11

1387

05/13/11

1494

05/20/11Total Number of Objects Sized: 283 192 273 385 275 192 232

Objects with L/D Ratio < 3 140 108 122 144 137 87 109Objects with L/D Ratio ≥ 3 143 84 151 241 138 105 123Objects with L/D Ratio ≥ 5 93 55 94 158 82 62 80

Objects with L/D Ratio ≥ 20Objects with L/D Ratio ≥ 3 & L > 5

1521

513

1421

1323

1318

917

915

Fibers/cc (L/D ≥ 3 & L > 5): 240 178 266 267 225 210 178Average Fiber Diameter (µm): 0.317 0.361 0.315 0.320 0.339 0.329 0.345

Average Fiber Length (µm): 3.258 3.177 2.933 2.683 2.907 3.073 2.975

The Hamner Institutes for Health Sciences Protocol 10026Inhalation Summary ReportEPA Fiber Project 90-Day Study Page 27 of 43

[1] Sample unavailable for analysis; reported as overloaded with fibers.

Table 7b. SEM Fiber Size Distribution – 1.0 mg/m3 Libby Amphibole Tower 293

Tower 293 SamplesSample:

Study Day:Date:

18

02/23/11

210

02/25/11

317

03/04/11

424

03/11/11

531

03/18/11

638

03/25/11

743

03/30/11

Total Number of Objects Sized: 194 187 223 187 139 200 168Objects with L/D Ratio < 3 69 85 113 88 66 91 62Objects with L/D Ratio ≥ 3 125 102 110 99 73 109 106Objects with L/D Ratio ≥ 5 88 77 78 67 49 88 75

Objects with L/D Ratio ≥ 20Objects with L/D Ratio ≥ 3 & L > 5

1637

1324

1624

919

812

1433

1525

Fibers/cc (L/D ≥ 3 & L > 5): 300 166 155 139 86 204 148Average Fiber Diameter (µm): 0.410 0.371 0.374 0.346 0.348 0.408 0.345

Average Fiber Length (µm): 4.475 3.766 3.928 3.384 3.091 4.485 3.810

Tower 293 SamplesSample:

Study Day:Date:

852

04/08/11

959

04/15/11

1066

04/22/11

1173

04/29/11

1280

05/06/11

1387

05/13/11

1494

05/20/11Total Number of Objects Sized: 194 197 171 190 197 165 145

Objects with L/D Ratio < 3 74 76 68 99 65 81 57Objects with L/D Ratio ≥ 3 120 121 103 91 132 84 88Objects with L/D Ratio ≥ 5 88 94 80 59 96 65 52

Objects with L/D Ratio ≥ 20Objects with L/D Ratio ≥ 3 & L > 5

1635

1226

1225

718

1338

1220

813

Fibers/cc (L/D ≥ 3 & L > 5): 220 145 145 102 236 107 73Average Fiber Diameter (µm): 0.409 0.422 0.440 0.400 0.423 0.364 0.353

Average Fiber Length (µm): 4.527 4.140 4.255 3.731 4.485 3.970 3.146

The Hamner Institutes for Health Sciences Protocol 10026Inhalation Summary ReportEPA Fiber Project 90-Day Study Page 28 of 43

Table 7c. SEM Fiber Size Distribution – 3.3 mg/m3 Libby Amphibole Tower 294

Tower 294 SamplesSample:

Study Day:Date:

18

02/23/11

210

02/25/11

317

03/04/11

424

03/11/11

531

03/18/11

638

03/25/11

743

03/30/11Total Number of Objects Sized: 212 319 383 359 283 273 318

Objects with L/D Ratio < 3 102 88 109 94 57 85 72Objects with L/D Ratio ≥ 3 110 231 274 265 226 188 246Objects with L/D Ratio ≥ 5 80 166 201 198 172 128 182

Objects with L/D Ratio ≥ 20Objects with L/D Ratio ≥ 3 & L > 5

1128

2953

4171

3160

2654

1837

2660

Fibers/cc (L/D ≥ 3 & L > 5): 254 646 927 746 639 468 754Average Fiber Diameter (µm): 0.401 0.398 0.381 0.422 0.408 0.414 0.376

Average Fiber Length (µm): 4.073 4.112 4.108 4.000 3.999 3.701 3.962

Tower 294 SamplesSample:

Study Day:Date:

852

04/08/11

959

04/15/11

1066

04/22/11

1173

04/29/11

1280

05/06/11

1387

05/13/11

1494

05/20/11Total Number of Objects Sized: 276 289 380 350 367 305 403

Objects with L/D Ratio < 3 66 75 90 94 88 76 93Objects with L/D Ratio ≥ 3 210 214 290 256 279 229 310Objects with L/D Ratio ≥ 5 168 165 208 193 221 182 226

Objects with L/D Ratio ≥ 20Objects with L/D Ratio ≥ 3 & L > 5

2262

2957

3169

3159

3373

3063

4492

The Hamner Institutes for Health Sciences Protocol 10026Inhalation Summary ReportEPA Fiber Project 90-Day Study Page 29 of 43

Fibers/cc (L/D ≥ 3 & L > 5): 755 634 721 573 775 700 1112Average Fiber Diameter (µm): 0.418 0.424 0.399 0.402 0.396 0.412 0.420

Average Fiber Length (µm): 4.281 4.847 3.881 4.116 4.378 4.239 4.504

Table 7d. SEM Fiber Size Distribution – 10 mg/m3 Libby Amphibole Tower 295

Tower 295 SamplesSample:

Study Day:Date:

18

02/23/11

210

02/25/11

317

03/04/11

424

03/11/11

531

03/18/11

638

03/25/11

743

03/30/11Total Number of Objects Sized: 142 282 375 236 191 165 170

Objects with L/D Ratio < 3 41 60 97 51 33 55 38Objects with L/D Ratio ≥ 3 101 222 278 185 158 110 132Objects with L/D Ratio ≥ 5 74 159 209 150 130 86 99

Objects with L/D Ratio ≥ 20Objects with L/D Ratio ≥ 3 & L > 5

1434

3152

4179

2847

2645

1333

1632

Fibers/cc (L/D ≥ 3 & L > 5): 1052 1470 1656 1310 1515 1274 1277Average Fiber Diameter (µm): 0.418 0.412 0.401 0.372 0.416 0.438 0.396

Average Fiber Length (µm): 4.556 4.220 4.298 4.452 4.747 4.688 3.958

Tower 295 SamplesSample:

Study Day:Date:

852

04/08/11

959

04/15/11

1066

04/22/11

1173

04/29/11

1280

05/06/11

1387

05/13/11

1494

05/20/11Total Number of Objects Sized: 194 211 163 183 174 188

Objects with L/D Ratio < 3 158 41 45 55 24 48Objects with L/D Ratio ≥ 3 136 170 118 128 150 [1] 140Objects with L/D Ratio ≥ 5 108 135 88 102 115 115

Objects with L/D Ratio ≥ 20Objects with L/D Ratio ≥ 3 & L > 5

2149

2260

1633

1743

1849

1945

Fibers/cc (L/D ≥ 3 & L > 5): 1604 2273 1341 1529 1730 1753

The Hamner Institutes for Health Sciences Protocol 10026Inhalation Summary ReportEPA Fiber Project 90-Day Study Page 30 of 43

Average Fiber Diameter (µm): 0.453 0.467 0.375 0.445 0.450 0.429Average Fiber Length (µm): 5.377 4.940 4.017 4.784 4.883 5.201

[1] Sample unavailable for analysis; reported as overloaded with fibers.

The Hamner Institutes for Health Sciences Protocol 10026Inhalation Summary ReportEPA Fiber Project 90-Day Study Page 31 of 43

Table 7e. SEM Fiber Size Distribution – Summary of Weekly Values[1]

Tower GroupConcentration

Fibers/cc(L/D ≥ 3 andL > 5 µm)[2]

FiberDiameter

(µm)

FiberLength

(µm)

292Amosite

3.3 mg/m3

Grand MeanStd Dev

MaximumMinimum

No.

23056

36216613

0.3290.0140.3610.314

13

3.0490.2393.6172.683

13

293Libby Amphibole

1.0 mg/m3

Grand MeanStd Dev

MaximumMinimum

No.

15963

3007314

0.3870.0330.4400.345

14

3.9420.4904.5273.091

14

294Libby Amphibole

3.3 mg/m3

Grand MeanStd Dev

MaximumMinimum

No.

693199

111225414

0.4050.0150.4240.376

14

4.1570.2854.8473.701

14

295Libby Amphibole

10 mg/m3

Grand MeanStd Dev

MaximumMinimum

No.

1522304

22731052

13

0.4210.0300.4670.372

13

4.6250.4315.3773.958

13

[1] See Tables 7a – 7d for individual weekly values.[2] L/D = length/diameter

The Hamner Institutes for Health Sciences Protocol 10026Inhalation Summary ReportEPA Fiber Project 90-Day Study Page 32 of 43

Table 8a. Inhalation Data for Amosite Amphibole 3.3 mg/m3 Exposure Dose

8m3

Chamber

8m3

Chamber

8m3

ChamberTower Tower Tower Tower

Aerosol

Study Temp Humidity Pressure Temp Humidity Pressure Air Flow Conc.Date Day (oF) (%) (in of H20) (oF) (%) (in of H20) Ball Setting (mg/m3)

02/16/11 1 70.5 49.6 -0.035 77.4 6.3 -0.013 134 0.43102/17/11 2 71.0 49.6 -0.046 77.0 9.7 -0.026 134 3.48402/18/11 3 71.3 49.7 -0.047 75.5 51.2 -0.024 134 3.91602/21/11 6 71.1 50.8 -0.046 76.2 5.5 -0.024 134 2.74102/22/11 7 71.0 49.2 -0.045 76.6 5.1 -0.024 135 2.40202/23/11 8 71.1 49.2 -0.047 74.9 70.9 -0.024 134 1.65602/24/11 9 71.1 49.8 -0.045 76.1 6.6 -0.018 134 5.82002/25/11 10 71.4 49.9 -0.045 75.7 6.0 -0.020 134 6.41502/28/11 13 71.7 50.4 -0.045 75.4 5.5 -0.018 134 3.58403/01/11 14 71.0 49.5 -0.042 76.0 5.6 -0.021 134 4.76103/02/11 15 71.5 50.2 -0.041 76.2 5.9 -0.021 134 1.79603/03/11 16 71.6 50.1 -0.043 76.2 6.0 -0.023 134 3.47003/04/11 17 71.0 49.7 -0.042 77.1 5.6 -0.019 134 1.76503/07/11 20 71.2 49.7 -0.042 77.1 5.2 -0.020 134 1.90503/08/11 21 71.1 49.5 -0.040 76.6 5.4 -0.018 134 2.04803/09/11 22 71.6 50.2 -0.043 77.8 5.0 -0.022 134 4.78803/10/11 23 71.9 50.3 -0.043 76.8 5.8 -0.023 134 5.37003/11/11 24 71.3 49.4 -0.043 77.3 4.7 -0.020 134 2.78903/14/11 27 71.2 49.6 -0.041 77.8 5.0 -0.020 134 1.84203/15/11 28 71.3 49.4 -0.041 78.1 4.7 -0.020 134 3.48503/16/11 29 71.3 49.5 -0.042 78.3 5.8 -0.020 134 3.68703/17/11 30 71.1 49.1 -0.041 77.3 5.3 -0.019 134 2.46703/18/11 31 71.2 49.5 -0.042 76.7 8.7 -0.021 134 1.74603/21/11 34 71.4 49.4 -0.041 76.3 10.6 -0.022 134 0.80603/22/11 35 71.4 47.9 -0.043 75.5 11.2 -0.020 134 5.74703/23/11 36 71.2 47.7 -0.040 78.6 9.3 -0.018 134 5.24003/24/11 37 71.1 46.1 -0.040 77.5 4.9 -0.016 134 6.58103/25/11 38 71.3 47.3 -0.041 76.8 4.8 -0.020 135 6.27303/28/11 41 70.9 47.6 -0.040 79.2 5.1 -0.018 134 3.39803/29/11 42 71.2 47.4 -0.042 77.6 4.5 -0.023 134 3.12903/30/11 43 71.0 47.1 -0.040 77.9 4.4 -0.015 134 3.85503/31/11 44 71.2 47.1 -0.052 76.2 4.5 -0.031 134 3.41404/01/11 45 71.0 46.9 -0.041 77.5 4.4 -0.019 134 3.86704/04/11 48 71.2 47.1 -0.040 77.7 2.7 -0.019 134 2.32604/05/11 49 71.3 46.2 -0.041 79.7 4.2 -0.019 134 2.31904/06/11 50 71.3 46.7 -0.040 78.6 4.1 -0.017 134 3.54404/07/11 51 71.3 47.1 -0.041 79.4 4.3 -0.017 135 3.48804/08/11 52 71.3 47.6 -0.041 78.6 6.3 -0.017 134 1.63704/11/11 55 71.6 51.4 -0.041 78.5 4.6 -0.018 134 1.92104/12/11 56 71.4 48.5 -0.041 79.8 4.1 -0.017 134 2.30704/13/11 57 71.4 46.0 -0.043 78.6 4.1 -0.016 134 4.866

The Hamner Institutes for Health Sciences Protocol 10026Inhalation Summary ReportEPA Fiber Project 90-Day Study Page 33 of 43

04/14/11 58 71.0 46.5 -0.042 78.0 4.1 -0.015 134 1.93004/15/11 59 71.3 46.5 -0.043 76.9 4.4 -0.017 134 1.61404/18/11 62 71.4 47.0 -0.041 77.6 4.0 -0.015 134 1.08704/19/11 63 71.5 47.4 -0.040 78.1 3.7 -0.016 134 1.85404/20/11 64 72.3 50.8 -0.042 77.0 4.1 -0.017 134 6.54704/21/11 65 71.1 46.4 -0.044 78.2 4.1 -0.018 134 4.28104/22/11 66 71.2 46.2 -0.043 76.6 9.3 -0.017 134 3.73104/25/11 69 71.5 49.5 -0.041 78.4 5.8 -0.018 134 3.39504/26/11 70 71.6 47.7 -0.040 78.4 5.0 -0.018 134 2.44804/27/11 71 72.0 50.2 -0.039 76.9 5.0 -0.018 134 2.60004/28/11 72 71.6 47.1 -0.042 77.2 5.7 -0.020 134 3.26204/29/11 73 71.5 46.8 -0.041 78.9 4.6 -0.016 134 4.50405/02/11 76 71.6 49.1 -0.043 77.4 5.6 -0.020 134 4.46105/03/11 77 71.9 48.7 -0.043 78.7 4.4 -0.022 134 3.01505/04/11 78 71.3 47.5 -0.045 78.6 4.7 -0.023 134 3.85005/05/11 79 71.3 47.3 -0.040 78.2 4.5 -0.016 134 1.99905/06/11 80 71.5 46.8 -0.041 78.4 4.8 -0.019 136 2.57605/09/11 83 71.7 47.6 -0.045 77.7 30.9 -0.021 136 2.35605/10/11 84 71.6 47.2 -0.042 78.2 5.7 -0.021 135 3.23005/11/11 85 71.4 47.2 -0.043 77.9 5.6 -0.022 134 3.91905/12/11 86 71.5 47.5 -0.043 77.6 5.2 -0.020 134 3.28505/13/11 87 72.0 48.6 -0.043 78.0 4.0 -0.017 134 6.12705/16/11 90 71.8 47.6 -0.041 78.2 4.9 -0.019 134 3.06805/17/11 91 71.6 46.8 -0.047 77.6 4.2 -0.024 134 4.96005/18/11 92 68.3 50.8 -0.042 70.4 4.3 -0.006 135 1.83905/19/11 93 70.5 49.6 -0.035 77.4 6.3 -0.013 134 0.43105/20/11 94 71.0 49.6 -0.046 77.0 9.7 -0.026 134 3.484

Grand Mean 71.3 48.4 -0.042 77.4 7.5 -0.019 134 3.319St. Dev. 0.5 1.5 0.002 1.4 10.3 0.003 0 1.476

Minimum 68.3 46.0 -0.052 70.4 2.7 -0.031 134 0.431Maximum 72.3 51.4 -0.035 79.8 70.9 -0.006 136 6.581

Count 66 66 66 66 66 66 66 1.476

Necropsy Group 1, 4 thru 16 (Study Day 1 to Study Day 91)

Mean 71.4 48.4 -0.042 77.5 7.5 -0.020 134 3.341St. Dev. 0.3 1.4 0.002 1.1 10.4 0.003 0 1.476

Minimum 70.5 46.0 -0.052 74.9 2.7 -0.031 134 0.431Maximum 72.3 51.4 -0.035 79.8 70.9 -0.013 136 6.581

Count 65 65 65 65 65 65 65 65

Necropsy Group 2 (Study Day 2 to Study Day 92)

Mean 71.3 48.4 -0.042 77.4 7.5 -0.019 134 3.363St. Dev. 0.5 1.5 0.002 1.4 10.4 0.003 0 1.443

Minimum 68.3 46.0 -0.052 70.4 2.7 -0.031 134 0.806Maximum 72.3 51.4 -0.039 79.8 70.9 -0.006 136 6.581

Count 65 65 65 65 65 65 65 65

The Hamner Institutes for Health Sciences Protocol 10026Inhalation Summary ReportEPA Fiber Project 90-Day Study Page 34 of 43

Table 8b. Inhalation Data for Libby Amphibole 1.0 mg/m3 Exposure Dose

8m3

Chamber

8m3

Chamber

8m3

ChamberTower Tower Tower Tower

Aerosol

Study Temp Humidity Pressure Temp Humidity Pressure Air Flow Conc.Date Day (oF) (%) (in of H20) (oF) (%) (in of H20) Ball Setting (mg/m3)

02/16/11 1 69.6 53.3 -0.104 77.1 5.7 -0.128 97 0.97302/17/11 2 69.4 53.2 -0.074 76.5 5.5 -0.120 97 0.81702/18/11 3 69.2 52.6 -0.080 70.8 54.4 -0.106 97 0.95502/21/11 6 69.5 54.8 -0.105 76.9 5.5 -0.104 97 1.29602/22/11 7 68.8 51.4 -0.081 77.6 5.6 -0.105 97 1.07202/23/11 8 70.1 49.8 -0.082 76.1 94.7 -0.108 97 1.32302/24/11 9 69.8 50.4 -0.079 77.6 6.5 -0.104 97 1.02302/25/11 10 67.5 49.6 -0.010 73.4 5.5 -0.036 98 1.20302/28/11 13 69.6 54.1 -0.094 80.5 4.7 -0.116 97 0.92603/01/11 14 69.2 50.1 -0.089 77.7 5.1 -0.106 98 1.10303/02/11 15 69.1 50.9 -0.095 78.2 5.3 -0.124 97 1.14703/03/11 16 69.4 50.6 -0.102 77.2 5.1 -0.130 97 0.98803/04/11 17 68.8 51.0 -0.077 79.4 5.7 -0.105 96 0.86503/07/11 20 69.4 50.8 -0.079 77.6 5.4 -0.107 98 1.14803/08/11 21 68.9 52.2 -0.074 77.5 5.4 -0.095 98 1.08903/09/11 22 70.4 49.0 -0.018 79.3 6.1 -0.110 98 1.17003/10/11 23 70.2 50.6 -0.070 78.8 5.2 -0.094 98 0.77803/11/11 24 69.8 50.2 -0.114 77.8 4.6 -0.111 98 1.32203/14/11 27 70.2 50.5 -0.074 78.1 4.8 -0.101 97 1.67503/15/11 28 69.3 53.0 -0.082 77.4 5.1 -0.101 97 1.27303/16/11 29 69.4 53.2 -0.069 78.0 5.9 -0.093 97 1.16403/17/11 30 69.7 52.6 -0.073 76.9 5.4 -0.108 97 0.81203/18/11 31 69.7 52.9 -0.089 77.1 8.8 -0.095 97 0.86803/21/11 34 69.5 53.6 -0.089 77.6 10.7 -0.099 97 0.59703/22/11 35 69.4 52.6 -0.067 80.2 10.5 -0.077 97 0.58403/23/11 36 68.9 53.1 -0.053 78.5 10.0 -0.062 97 0.68103/24/11 37 68.9 52.7 -0.051 78.5 5.0 -0.065 97 0.70503/25/11 38 68.8 52.3 -0.050 78.3 5.0 -0.056 97 0.77503/28/11 41 69.0 50.3 -0.050 77.7 5.0 -0.065 97 0.94103/29/11 42 68.5 51.8 -0.051 79.9 5.0 -0.069 97 0.81403/30/11 43 68.6 53.1 -0.053 79.0 5.0 -0.069 97 0.74203/31/11 44 68.5 51.2 -0.050 80.3 4.9 -0.070 97 0.59204/01/11 45 68.7 51.4 -0.052 79.5 4.9 -0.045 97 0.81104/04/11 48 68.6 51.7 -0.050 80.9 5.0 0.065 97 0.81004/05/11 49 68.7 54.4 -0.050 79.1 5.0 -0.036 97 0.70404/06/11 50 69.1 52.6 -0.052 80.0 5.0 -0.060 97 0.88404/07/11 51 68.9 52.8 -0.050 79.7 5.0 -0.070 97 1.12904/08/11 52 68.7 51.4 -0.049 80.9 6.9 -0.068 97 1.32504/11/11 55 69.7 51.2 -0.051 81.3 5.0 -0.070 97 1.109

The Hamner Institutes for Health Sciences Protocol 10026Inhalation Summary ReportEPA Fiber Project 90-Day Study Page 35 of 43

04/12/11 56 68.9 52.0 -0.050 80.1 4.6 -0.062 97 1.01704/13/11 57 68.5 51.4 -0.049 80.8 4.9 -0.068 97 3.09104/14/11 58 70.2 51.0 -0.047 77.5 5.2 -0.068 97 0.86804/15/11 59 68.6 52.0 -0.049 79.1 5.2 -0.069 97 0.96304/18/11 62 68.7 51.7 -0.050 79.7 5.2 -0.070 99 1.11904/19/11 63 68.7 54.1 -0.051 79.1 5.2 -0.064 97 1.16504/20/11 64 69.7 55.9 -0.050 79.9 45.1 -0.067 97 0.55904/21/11 65 68.7 52.5 -0.050 80.3 5.1 -0.068 97 0.80004/22/11 66 69.4 51.1 -0.050 80.3 5.2 -0.070 97 0.87704/25/11 69 68.9 53.2 -0.051 80.1 5.1 -0.070 97 0.36404/26/11 70 68.7 53.4 -0.050 80.1 5.1 -0.070 98 3.00804/27/11 71 71.8 49.6 -0.009 78.6 10.5 -0.108 97 0.06704/28/11 72 68.4 51.7 -0.051 80.2 4.9 -0.061 97 0.53104/29/11 73 69.0 52.8 -0.050 80.8 4.8 -0.065 97 0.77405/02/11 76 69.5 50.4 -0.049 80.5 5.0 -0.064 97 1.11005/03/11 77 69.3 54.2 -0.050 80.8 4.9 -0.070 97 0.93805/04/11 78 69.6 52.0 -0.050 77.9 25.4 -0.066 97 0.88405/05/11 79 68.2 50.3 -0.050 80.5 4.9 -0.067 97 1.05505/06/11 80 68.7 51.1 -0.500 80.4 5.1 -0.066 97 0.65905/09/11 83 70.2 51.8 -0.052 78.1 5.1 -0.064 97 1.16605/10/11 84 68.8 52.0 -0.050 80.9 5.0 -0.068 97 0.85705/11/11 85 68.7 51.6 -0.050 80.3 4.9 -0.067 97 1.07205/12/11 86 69.2 51.7 -0.049 80.5 4.9 -0.068 97 1.00805/13/11 87 69.3 54.3 -0.050 79.8 5.0 -0.067 97 1.14805/16/11 90 69.1 51.3 -0.052 79.6 5.2 -0.072 97 0.86305/17/11 91 69.0 50.2 -0.050 80.3 5.0 -0.067 97 1.27205/18/11 92 67.0 53.5 -0.050 69.8 5.7 -0.085 97 1.10005/19/11 93 69.6 53.3 -0.104 77.1 5.7 -0.128 97 0.97305/20/11 94 69.4 53.2 -0.074 76.5 5.5 -0.120 97 0.817

Grand Mean 69.2 52.0 -0.067 78.7 8.6 -0.079 97 1.008St. Dev. 0.7 1.4 0.058 2.1 13.5 0.029 0 0.445

Minimum 67.0 49.0 -0.500 69.8 4.6 -0.130 96 0.067Maximum 71.8 55.9 -0.009 81.3 94.7 0.065 99 3.091

Count 66 66 66 66 66 66 66 66

Necropsy Group 1, 4 thru 16 (Study Day 1 to Study Day 91)

Mean 69.2 51.9 -0.068 78.8 8.6 -0.079 97 1.007St. Dev. 0.6 1.4 0.058 1.8 13.6 0.029 0 0.449

Minimum 67.5 49.0 -0.500 70.8 4.6 -0.130 96 0.067Maximum 71.8 55.9 -0.009 81.3 94.7 0.065 99 3.091

Count 65 65 65 65 65 65 65 65

Necropsy Group 2 (Study Day 2 to Study Day 92)

Mean 69.1 51.9 -0.067 78.7 8.6 -0.078 97 1.009St. Dev. 0.7 1.4 0.058 2.1 13.6 0.028 0 0.449

Minimum 67.0 49.0 -0.500 69.8 4.6 -0.130 96 0.067Maximum 71.8 55.9 -0.009 81.3 94.7 0.065 99 3.091

The Hamner Institutes for Health Sciences Protocol 10026Inhalation Summary ReportEPA Fiber Project 90-Day Study Page 36 of 43

Count 65 65 65 65 65 65 65 65

Table 8c. Inhalation Data for Libby Amphibole 3.3 mg/m3 Exposure Dose

8m3

Chamber

8m3

Chamber

8m3

ChamberTower Tower Tower Tower

Aerosol

Study Temp Humidity Pressure Temp Humidity Pressure Air Flow Conc.Date Day (oF) (%) (in of H20) (oF) (%) (in of H20) Ball Setting (mg/m3)

02/16/11 1 67.8 49.0 -0.027 70.6 4.2 -0.126 91 3.16502/17/11 2 67.9 53.9 -0.024 70.6 14.1 -0.134 91 4.11502/18/11 3 69.2 52.6 -0.080 70.8 21.5 -0.106 91 3.92902/21/11 6 68.6 49.9 -0.022 71.1 5.3 -0.127 91 1.71002/22/11 7 68.1 49.5 -0.023 70.7 4.2 -0.130 91 3.31902/23/11 8 68.3 49.0 -0.024 71.3 4.0 -0.128 91 1.32302/24/11 9 68.4 49.7 -0.023 70.8 4.1 -0.119 91 3.64702/25/11 10 68.6 51.5 -0.021 71.2 4.1 -0.126 91 3.28502/28/11 13 68.8 52.4 -0.022 71.4 4.1 -0.128 91 4.04003/01/11 14 69.9 43.3 -0.012 73.3 4.4 -0.119 91 4.78403/02/11 15 68.3 45.5 -0.025 71.1 4.3 -0.123 92 3.76003/03/11 16 68.6 44.8 -0.023 71.5 3.3 -0.132 92 4.61003/04/11 17 68.5 43.8 -0.023 71.7 4.1 -0.131 92 3.85903/07/11 20 68.6 42.8 -0.021 71.8 3.7 -0.131 91 3.01003/08/11 21 68.5 43.0 -0.024 71.8 4.1 -0.131 92 2.87703/09/11 22 68.5 49.3 -0.027 71.8 3.7 -0.124 92 2.86503/10/11 23 68.7 51.7 -0.022 71.9 3.7 -0.130 92 2.19203/11/11 24 68.5 42.5 -0.023 71.3 3.7 -0.131 92 2.09603/14/11 27 68.6 43.3 -0.024 72.0 3.7 -0.133 89 3.87403/15/11 28 68.5 44.9 -0.022 71.8 3.7 -0.131 92 3.20403/16/11 29 68.9 52.6 -0.024 72.4 5.2 -0.125 91 3.74903/17/11 30 69.3 43.7 -0.024 71.3 4.7 -0.067 92 1.62803/18/11 31 69.7 46.7 -0.024 72.1 4.4 -0.069 92 4.53103/21/11 34 69.4 46.0 -0.024 72.1 8.9 -0.067 91 5.90403/22/11 35 69.8 48.9 -0.025 72.5 9.3 -0.067 91 3.06203/23/11 36 69.5 48.5 -0.029 71.9 8.1 -0.065 92 2.54003/24/11 37 69.7 45.6 -0.024 71.9 3.7 -0.074 91 2.94203/25/11 38 69.4 43.9 -0.031 72.6 3.5 -0.035 92 3.36503/28/11 41 68.7 43.9 -0.024 71.5 3.6 -0.114 91 2.50603/29/11 42 68.9 45.4 -0.025 71.8 3.5 -0.113 91 3.67103/30/11 43 68.8 48.7 -0.023 70.7 3.5 -0.113 91 3.12403/31/11 44 68.9 47.0 -0.021 71.2 3.6 -0.113 91 3.82304/01/11 45 68.9 43.1 -0.024 71.5 3.6 -0.102 91 3.18804/04/11 48 69.2 45.8 -0.026 72.1 3.7 -0.115 91 2.69504/05/11 49 70.3 45.8 -0.012 73.8 3.8 -0.101 91 3.90604/06/11 50 69.3 42.4 -0.022 72.0 3.5 -0.102 91 3.34304/07/11 51 69.3 44.0 -0.026 71.7 3.6 -0.114 91 2.56304/08/11 52 69.2 48.5 -0.028 71.5 5.7 -0.116 91 4.458

The Hamner Institutes for Health Sciences Protocol 10026Inhalation Summary ReportEPA Fiber Project 90-Day Study Page 37 of 43

04/11/11 55 69.5 52.3 -0.023 71.9 3.8 -0.113 91 2.92504/12/11 56 69.8 49.8 -0.023 72.1 3.7 -0.105 91 3.40304/13/11 57 69.1 47.0 -0.025 71.7 3.7 -0.112 91 3.06104/14/11 58 69.4 44.8 -0.024 71.8 3.6 -0.114 91 3.86604/15/11 59 69.6 48.3 -0.025 71.3 3.6 -0.113 91 3.19804/18/11 62 69.7 45.8 -0.024 71.6 3.6 -0.113 91 3.28004/19/11 63 70.0 48.4 -0.027 71.6 3.7 -0.115 91 2.66904/20/11 64 71.5 54.5 -0.024 71.8 3.8 -0.106 91 3.93904/21/11 65 69.7 46.6 -0.022 71.1 3.8 -0.108 91 3.28004/22/11 66 70.1 47.1 -0.014 73.2 3.7 -0.104 91 4.58504/25/11 69 70.6 49.4 -0.013 72.5 3.8 -0.098 91 3.93504/26/11 70 70.4 49.9 -0.024 71.4 3.8 -0.105 91 3.00504/27/11 71 71.8 52.1 -0.011 73.9 3.8 -0.097 91 1.27304/28/11 72 70.5 49.6 -0.024 71.5 3.8 -0.112 91 2.89804/29/11 73 70.2 46.8 -0.022 71.3 3.8 -0.110 91 3.45505/02/11 76 71.0 49.3 -0.013 73.4 3.6 -0.104 91 3.29605/03/11 77 70.8 52.1 -0.024 71.5 3.7 -0.115 91 3.64405/04/11 78 69.9 50.3 -0.025 71.2 3.7 -0.115 91 2.56105/05/11 79 69.9 44.5 -0.023 71.1 3.5 -0.112 91 3.16005/06/11 80 70.0 47.9 -0.024 70.9 3.6 -0.106 91 3.25105/09/11 83 70.1 49.0 -0.023 71.1 3.7 -0.113 91 3.06705/10/11 84 70.3 46.8 -0.023 71.1 3.7 -0.110 91 3.76605/11/11 85 70.4 48.1 -0.027 71.1 3.8 -0.108 91 4.34905/12/11 86 70.3 48.2 -0.023 70.9 3.7 -0.113 91 3.58805/13/11 87 71.2 52.1 -0.024 71..3 3.7 -0.114 91 2.84805/16/11 90 70.9 48.1 -0.014 73.6 3.8 -0.105 91 2.98405/17/11 91 70.6 48.0 -0.023 71.8 3.7 -0.113 91 3.89705/18/11 92 68.0 52.3 -0.025 64.3 4.0 -0.101 91 3.19405/19/11 93 68.2 52.1 -0.024 64.4 4.0 -0.116 91 5.01105/20/11 94 67.8 49.0 -0.027 70.6 4.2 -0.126 91 3.165

Grand Mean 69.4 47.8 -0.024 71.5 4.5 -0.110 91 3.344St. Dev. 0.9 3.2 0.008 1.5 2.7 0.019 0 0.828

Minimum 67.8 42.4 -0.080 64.3 3.3 -0.134 89 1.273Maximum 71.8 54.5 -0.011 73.9 21.5 -0.035 92 5.904

Count 67 67 67 66 67 67 67 67

Necropsy Group 1, 4 thru 16 (Study Day 1 to Study Day 91)

Mean 69.5 47.7 -0.024 71.7 4.5 -0.110 91 3.321St. Dev. 0.9 3.1 0.008 0.8 2.7 0.019 0 0.814

Minimum 67.8 42.4 -0.080 70.6 3.3 -0.134 89 1.273Maximum 71.8 54.5 -0.011 73.9 21.5 -0.035 92 5.904

Count 65 65 65 64 65 65 65 65

Necropsy Group 2 (Study Day 3 to Study Day 93)

Mean 69.5 47.7 -0.024 71.5 4.4 -0.110 91 3.335St. Dev. 0.9 3.1 0.008 1.5 2.4 0.019 0 0.835

Minimum 68.0 42.4 -0.080 64.3 3.3 -0.133 89 1.273

The Hamner Institutes for Health Sciences Protocol 10026Inhalation Summary ReportEPA Fiber Project 90-Day Study Page 38 of 43

Maximum 71.8 54.5 -0.011 73.9 21.5 -0.035 92 5.904Count 65 65 65 64 65 65 65 65

Table 8d. Inhalation Data for Libby Amphibole 10.0 mg/m3 Exposure Dose

8m3

Chamber

8m3

Chamber

8m3

ChamberTower Tower Tower Tower

Aerosol

Study Temp Humidity Pressure Temp Humidity Pressure Air Flow Conc.Date Day (oF) (%) (in of H20) (oF) (%) (in of H20) Ball Setting (mg/m3)

02/16/11 1 69.4 49.1 -0.098 76.5 6.3 -0.169 89 7.75002/17/11 2 69.1 50.5 -0.100 76.8 6.7 -0.204 89 9.44602/18/11 3 68.9 46.5 -0.121 73.4 5.4 -0.225 89 8.06202/21/11 6 69.7 49.1 -0.096 77.2 5.7 -0.164 89 10.41402/22/11 7 69.4 49.1 -0.103 76.8 5.8 -0.185 89 11.60202/23/11 8 69.7 48.8 -0.098 77.3 5.9 -0.190 89 10.90402/24/11 9 69.4 49.0 -0.103 77.0 5.7 -0.144 89 9.46702/25/11 10 69.8 49.3 -0.103 77.5 6.0 -0.189 89 9.95702/28/11 13 69.7 49.1 -0.100 77.8 6.1 -0.184 89 7.95403/01/11 14 70.8 48.9 -0.016 78.6 6.1 -0.110 89 7.87303/02/11 15 71.4 49.8 -0.041 76.3 5.8 -0.020 89 9.39303/03/11 16 70.5 48.9 -0.025 79.0 6.1 -0.119 89 9.60003/04/11 17 70.5 49.0 -0.022 79.0 6.2 -0.111 89 11.05503/07/11 20 70.8 48.9 -0.012 79.1 6.1 -0.104 89 13.46703/08/11 21 70.5 48.8 -0.016 79.1 6.2 -0.107 89 9.10103/09/11 22 70.4 49.0 -0.018 79.3 6.1 -0.110 89 3.16103/10/11 23 70.8 49.1 -0.029 79.2 6.3 -0.127 89 13.24103/11/11 24 71.0 48.9 -0.013 79.3 5.7 -0.102 88 9.55903/14/11 27 70.6 49.0 -0.057 78.0 5.9 -0.145 89 9.49603/15/11 28 70.6 49.0 -0.027 78.8 5.0 -0.116 89 16.55703/16/11 29 70.7 48.9 -0.033 78.8 6.1 -0.120 89 13.44603/17/11 30 70.5 48.9 -0.027 78.8 6.0 -0.095 90 13.19903/18/11 31 70.9 48.7 -0.095 78.6 9.3 -0.157 89 13.06903/21/11 34 70.6 47.8 -0.022 79.0 11.0 -0.099 89 11.00603/22/11 35 69.1 48.6 0.002 77.1 12.3 -0.066 89 8.38103/23/11 36 71.0 48.2 -0.015 79.3 10.1 -0.090 89 8.83103/24/11 37 70.7 47.9 -0.064 78.8 5.6 -0.127 90 9.65703/25/11 38 70.7 48.0 -0.020 79.2 5.7 -0.083 90 7.87803/28/11 41 70.3 47.9 -0.017 79.0 5.4 -0.105 90 10.95303/29/11 42 70.6 48.1 -0.020 79.2 5.4 -0.109 90 8.99803/30/11 43 70.0 48.2 -0.029 79.1 5.4 -0.129 89 10.57503/31/11 44 70.3 48.0 -0.019 79.2 5.5 -0.107 90 11.68504/01/11 45 70.6 47.8 -0.017 79.2 5.4 -0.104 89 9.84604/04/11 48 71.1 48.0 -0.027 79.9 5.7 -0.118 89 8.45304/05/11 49 71.0 47.9 -0.011 80.1 26.2 -0.103 89 10.411

The Hamner Institutes for Health Sciences Protocol 10026Inhalation Summary ReportEPA Fiber Project 90-Day Study Page 39 of 43

04/06/11 50 70.5 47.8 -0.013 79.4 5.4 -0.095 89 8.86404/07/11 51 71.0 48.0 -0.018 79.7 5.6 -0.100 89 9.12004/08/11 52 70.8 48.0 -0.080 79.6 4.7 -0.155 89 9.24804/11/11 55 71.3 51.8 -0.011 79.1 5.7 -0.108 89 9.31304/12/11 56 71.5 48.0 -0.009 79.5 5.5 -0.103 89 9.14804/13/11 57 71.0 47.9 -0.009 79.3 5.5 -0.095 89 11.37904/14/11 58 70.5 48.1 -0.025 78.9 5.1 -0.107 89 9.48704/15/11 59 70.9 48.0 -0.010 79.4 5.2 -0.098 89 7.46604/18/11 62 71.1 47.9 -0.009 79.5 5.8 -0.099 89 9.22904/19/11 63 71.4 48.0 -0.011 79.7 5.6 -0.101 89 8.18604/20/11 64 72.8 50.0 -0.013 80.0 5.5 -0.113 89 11.52604/21/11 65 70.4 47.9 -0.019 79.4 5.4 -0.103 89 12.78204/22/11 66 70.7 48.4 -0.010 79.5 5.3 -0.107 90 12.61704/25/11 69 71.5 48.2 -0.009 78.9 5.8 -0.111 89 10.89804/26/11 70 71.4 48.1 -0.009 79.7 5.5 -0.110 89 7.84604/27/11 71 72.3 48.9 -0.010 79.8 6.6 -0.108 89 8.78404/28/11 72 71.4 48.4 -0.028 79.5 14.9 -0.130 89 8.28904/29/11 73 71.1 48.0 -0.011 79.5 13.3 -0.101 89 10.75305/02/11 76 71.8 47.9 -0.011 79.7 5.2 -0.100 89 9.75705/03/11 77 72.0 49.3 -0.009 79.5 21.8 -0.108 89 11.31305/04/11 78 70.9 48.1 -0.010 79.3 5.3 -0.102 89 10.10205/05/11 79 71.2 48.0 -0.025 79.0 5.2 -0.107 89 6.08005/06/11 80 71.4 47.8 -0.011 79.2 5.2 -0.095 89 10.74805/09/11 83 71.5 48.0 -0.009 79.2 5.3 -0.088 89 12.42105/10/11 84 71.6 47.8 -0.010 79.0 5.2 -0.092 89 10.25405/11/11 85 71.3 48.0 -0.009 79.2 5.3 -0.103 89 12.01605/12/11 86 71.2 48.2 -0.068 78.3 5.3 -0.165 89 13.26305/13/11 87 72.4 48.6 -0.009 79.7 5.2 -0.110 89 10.73705/16/11 90 71.8 47.9 -0.009 79.7 5.3 -0.106 89 9.99905/17/11 91 71.5 47.9 -0.009 79.5 5.2 -0.104 89 8.11305/18/11 92 68.3 49.7 -0.010 70.0 5.8 -0.108 89 8.82905/19/11 93 68.1 48.6 -0.013 69.8 5.8 -0.103 89 9.56605/20/11 94 69.4 49.1 -0.098 76.5 6.3 -0.169 89 7.750

Grand Mean 70.7 48.5 -0.032 78.5 6.7 -0.117 89 10.039St. Dev. 0.9 0.8 0.033 1.9 3.6 0.033 0 2.035

Minimum 68.1 46.5 -0.121 69.8 4.7 -0.225 88 3.161Maximum 72.8 51.8 0.002 80.1 26.2 -0.020 90 16.557

Count 67 67 67 67 67 67 67 67

Necropsy Group 1, 4 thru 16 (Study Day 1 to Study Day 91)

Mean 70.8 48.5 -0.032 78.8 6.8 -0.118 89 10.064St. Dev. 0.8 0.8 0.033 1.1 3.7 0.034 0 2.060

Minimum 68.9 46.5 -0.121 73.4 4.7 -0.225 88 3.161Maximum 72.8 51.8 0.002 80.1 26.2 -0.020 90 16.557

Count 65 65 65 65 65 65 65 65

Necropsy Group 3 (Study Day 3 to Study Day 93)

The Hamner Institutes for Health Sciences Protocol 10026Inhalation Summary ReportEPA Fiber Project 90-Day Study Page 40 of 43

Mean 70.8 48.5 -0.030 78.6 6.7 -0.115 89 10.083St. Dev. 0.9 0.7 0.031 1.9 3.7 0.031 0 2.045

Minimum 68.1 46.5 -0.121 69.8 4.7 -0.225 88 3.161Maximum 72.8 51.8 0.002 80.1 26.2 -0.020 90 16.557

Count 65 65 65 65 65 65 65 65

Table 8e. Inhalation Data for Control 0.0 mg/m3 Exposure Dose

8m3

Chamber

8m3

Chamber

8m3

ChamberTower Tower Tower Tower

Aerosol

Study Temp Humidity Pressure Temp Humidity Pressure Air Flow Conc.Date Day (oF) (%) (in of H20) (oF) (%) (in of H20) Ball Setting (mg/m3)

02/16/11 1 67.5 49.8 -0.010 73.3 4.3 -0.034 122 -0.83702/17/11 2 67.4 49.9 -0.010 72.4 4.0 -0.033 122 -0.08102/18/11 3 67.2 50.2 -0.010 72.7 4.0 -0.031 122 0.15102/21/11 6 67.7 49.7 -0.010 73.6 4.1 -0.036 122 0.05202/22/11 7 67.4 49.0 -0.010 73.0 4.3 -0.035 122 -0.01402/23/11 8 67.6 49.6 -0.010 73.1 3.9 -0.035 122 -0.08002/24/11 9 67.5 48.8 -0.010 73.0 3.9 -0.033 122 -0.03802/25/11 10 67.5 49.6 -0.010 73.4 5.5 -0.036 122 0.01702/28/11 13 67.2 49.1 -0.010 73.1 4.5 -0.035 122 0.00403/01/11 14 67.4 48.8 -0.010 72.4 3.7 -0.035 122 -0.23403/02/11 15 67.6 47.6 -0.010 73.1 3.8 -0.035 122 -0.06603/03/11 16 67.7 48.1 -0.010 72.8 3.5 -0.034 122 -0.04803/04/11 17 67.8 50.1 -0.010 73.1 4.1 -0.033 122 -0.00403/07/11 20 67.7 48.9 -0.010 73.2 4.3 -0.035 122 0.00403/08/11 21 67.8 48.1 -0.010 73.0 3.8 -0.036 122 0.01703/09/11 22 67.7 48.5 -0.010 72.8 4.3 -0.036 122 -0.01403/10/11 23 67.6 49.9 -0.010 72.8 4.2 -0.037 122 0.38103/11/11 24 67.7 47.5 -0.010 73.1 4.4 -0.034 122 -0.18503/14/11 27 67.7 47.8 -0.010 72.5 4.2 -0.035 122 -0.02403/15/11 28 67.7 47.6 -0.010 72.6 4.3 -0.038 122 -0.03503/16/11 29 67.6 49.9 -0.100 73.1 5.8 -0.035 123 0.03603/17/11 30 67.6 49.1 -0.010 73.4 6.0 -0.035 123 -0.11203/18/11 31 67.6 49.0 -0.010 73.6 8.9 -0.035 122 0.14003/21/11 34 67.7 48.9 -0.100 73.5 10.9 -0.035 122 0.07003/22/11 35 67.6 49.5 -0.100 73.6 14.4 -0.035 123 0.02103/23/11 36 67.6 49.6 -0.010 73.8 9.1 -0.034 122 -0.04203/24/11 37 67.6 47.6 -0.010 74.0 3.1 -0.034 123 -0.13603/25/11 38 67.7 46.9 -0.011 71.3 2.6 -0.034 123 -0.01403/28/11 41 67.4 47.9 -0.010 73.7 3.2 -0.035 122 -0.28003/29/11 42 67.8 48.0 -0.010 74.0 7.0 -0.034 122 -0.07803/30/11 43 67.4 48.6 -0.100 73.8 6.6 -0.035 121 -0.02503/31/11 44 67.5 49.2 -0.010 72.8 3.6 -0.034 122 -0.064

The Hamner Institutes for Health Sciences Protocol 10026Inhalation Summary ReportEPA Fiber Project 90-Day Study Page 41 of 43

04/01/11 45 67.8 48.2 -0.010 73.9 5.5 -0.031 122 -0.01804/04/11 48 67.7 48.6 -0.010 74.6 7.8 -0.035 122 -0.03604/05/11 49 67.2 47.4 -0.010 74.5 6.1 -0.037 122 0.06404/06/11 50 67.8 48.6 -0.010 74.7 7.8 -0.032 122 -0.05604/07/11 51 67.8 49.7 -0.010 74.4 9.2 -0.033 122 0.00004/08/11 52 67.6 48.3 -0.010 74.2 9.9 -0.036 122 0.08404/11/11 55 67.9 52.6 -0.010 74.4 7.8 -0.036 123 0.15004/12/11 56 67.5 49.3 -0.010 74.6 9.9 -0.034 122 -0.09204/13/11 57 67.7 47.8 -0.010 73.6 8.9 -0.035 122 -0.06804/14/11 58 67.8 49.4 -0.010 73.4 3.2 -0.034 122 -0.13604/15/11 59 67.5 47.5 -0.010 73.2 3.7 -0.033 122 0.00004/18/11 62 68.1 49.3 -0.100 73.6 4.0 -0.034 122 -0.19604/19/11 63 67.7 48.4 -0.010 73.4 4.0 -0.037 122 -0.01704/20/11 64 69.1 54.0 -0.100 74.4 4.3 -0.037 122 -0.01404/21/11 65 67.2 47.8 -0.010 72.9 4.2 -0.033 122 -0.12304/22/11 66 67.4 47.8 -0.010 73.5 4.0 -0.034 122 -0.07604/25/11 69 67.8 52.4 -0.010 74.1 4.2 -0.037 122 0.02504/26/11 70 67.7 50.7 -0.010 73.6 4.4 -0.037 122 0.02504/27/11 71 68.5 54.1 -0.010 73.8 4.1 -0.037 122 0.03504/28/11 72 67.8 50.7 -0.010 73.8 5.0 -0.035 122 -0.10704/29/11 73 67.3 48.4 -0.100 73.7 4.2 -0.035 122 -0.07005/02/11 76 68.3 50.6 -0.010 73.9 4.4 -0.036 122 -0.01405/03/11 77 68.5 50.9 -0.100 73.9 5.2 -0.037 122 -0.01705/04/11 78 67.5 49.4 -0.010 73.6 5.6 -0.035 122 -0.10105/05/11 79 67.6 49.4 -0.100 73.8 4.6 -0.034 121 -0.14005/06/11 80 67.6 49.7 -0.010 73.5 4.5 -0.034 122 0.05605/09/11 83 67.6 48.7 -0.010 73.3 5.2 -0.035 122 -0.01405/10/11 84 67.8 48.1 -0.010 73.4 3.7 -0.037 122 -0.20705/11/11 85 67.6 48.9 -0.010 73.7 4.4 -0.035 122 -0.45605/12/11 86 67.5 49.4 -0.010 74.1 4.2 -0.036 122 -0.09905/13/11 87 68.4 53.5 -0.010 73.9 4.2 -0.037 122 -0.15505/16/11 90 68.0 49.8 -0.010 73.8 4.6 -0.037 122 -0.21605/17/11 91 67.7 48.5 -0.010 73.4 4.3 -0.037 122 -0.42205/18/11 92 65.1 52.5 -0.010 66.2 4.5 -0.037 122 -0.08405/19/11 93 67.5 49.8 -0.010 73.3 4.3 -0.034 122 -0.83705/20/11 94 67.4 49.9 -0.010 72.4 4.0 -0.033 122 -0.081

Grand Mean 67.6 49.3 -0.022 73.4 5.2 -0.035 122 -0.061St. Dev. 0.5 1.5 0.031 1.1 2.2 0.002 0 0.156

Minimum 65.1 46.9 -0.100 66.2 2.6 -0.038 121 -0.837Maximum 69.1 54.1 -0.010 74.7 14.4 -0.031 123 0.381

Count 66 66 66 66 66 66 66 66

Necropsy Group 1, 4 thru 16 (Study Day 1 to Study Day 91)

Mean 67.7 49.2 -0.022 73.5 5.3 -0.035 122 -0.060St. Dev. 0.3 1.5 0.031 0.6 2.2 0.001 0 0.157

Minimum 67.2 46.9 -0.100 71.3 2.6 -0.038 121 -0.837Maximum 69.1 54.1 -0.010 74.7 14.4 -0.031 123 0.381

Count 65 65 65 65 65 65 65 65

The Hamner Institutes for Health Sciences Protocol 10026Inhalation Summary ReportEPA Fiber Project 90-Day Study Page 42 of 43

Necropsy Group 2 (Study Day 2 to Study Day 92)

Mean 67.6 49.3 -0.022 73.4 5.3 -0.035 122 -0.049St. Dev. 0.5 1.6 0.031 1.1 2.2 0.002 0 0.123

Minimum 65.1 46.9 -0.100 66.2 2.6 -0.038 121 -0.456Maximum 69.1 54.1 -0.010 74.7 14.4 -0.031 123 0.381

Count 65 65 65 65 65 65 65 65

Figure 1. Diagram of Fiber Exposure System

The Hamner Institutes for Health Sciences Protocol 10026Inhalation Summary ReportEPA Fiber Project 90-Day Study Page 43 of 43

B ru s hGe n e ra t o r

K r-8 5 D is c h ar g e r

He pa f i lt e rHo u s eV a cu u m

H e pa fi lt e re dHo u s e A ir

To we r I n le t

A e r odyn am icP ar tic l e

S i z e r

R e a l- Tim eA e ro s o lM o n ito r M W F

an d S EMFil te r

To p Tie r 1

2

B ot t o m Tie r

3

4

5

8 m 3 C ham b e r

7 T ierN os e-O n ly

T ow er6

7

[1] The control (air-only) exposure system was similar in design however consisted of only six tiers.


Recommended