Ludden J. N., Gradstein, F. M., et al., 1990 Proceedings of the Ocean Drilling Program, Initial Reports, Vol. 123 2. UNDERWAY GEOPHYSICS 1 Richard T. Buffler 2 INTRODUCTION The term "underway geophysics" encompasses all shipboard geophysical data used for pre-cruise selection of drill sites as well as data collected during the drilling leg. These data form an important and integral part of the Ocean Drilling Programpro- cess by providing the primary data set for (1) defining the prob- lems to be addressed, (2) site selection, and (3) regional interpre- tation and extrapolation of drilling results. This chapter de- scribes only shipboard underway geophysics, that is, the equip- ment, methods, and actual data collected aboard the JOIDES Resolution during Leg 123. Details of geophysical data used in the selection, description, and interpretation of specific sites are discussed in more detail in individual site chapters (see "Seismic Stratigraphy" sections, Sites 765 and 766 chapters, this vol- ume). Discussions and interpretations of regional geophysical data in relationship to drilling results will be addressed in Pro- ceedings of the Ocean Drilling Program, Scientific Results, Leg 123. SHIPBOARD UNDERWAY GEOPHYSICS The JOIDES Resolution provides scientists the capability of collecting, displaying, and processing a variety of geophysical information, including navigation, bathymetric, magnetic, seis- mic reflection, and sonobuoy data. The equipment used for this is located in the Underway Geophysics Laboratory (UGL) and adjacent deck space located aft on the poop deck under the heli- copter platform. Each capability is discussed in the following sections. First, equipment and methods for each capability are described, then data collected during Leg 123 are discussed briefly. After the cruise, navigation, bathymetry, and magnetic data were processed further, and then edited and corrected by the Geological Data Center (GDC) at the Scripps Institution of Oceanography under contract to ODP. Data in the following formats were produced by the GDC and submitted to ODP: 1. List of navigation times and positions of course and speed changes, fixes, and drift velocity. 2. On magnetic tape: separate time series files of fixes, course and speed changes, depth and magnetics in SIO "uwts" format, navigation list file; merged file of navigation, depth, and magnetics in MGD77 Exchange format. 3. On 35-mm microfilm: index track charts, navigation list- ing; fast and slow seismic profiler records; 12- and 3.5-kHz echo-sounder records; and magnetometer records (on one or more 100-ft rolls). An informal report summarizing these data also was pro- duced. Copies of the data were provided to both the ODP Data 1 Ludden, J. N., Gradstein, F. M., et al., 1990. Proc. ODP, Init. Repts., 123: College Station, TX (Ocean Drilling Program). 2 Institute for Geophysics, University of Texas at Austin, 8701 Mopac Boule- vard, Austin, TX 78759. Bank at Lamont-Doherty Geological Observatory and to the National Geophysical Data Center in Boulder, Colorado. Navigation Equipment and Methods Navigation data were collected during Leg 123 using a Magna- vox Transit/Global Positioning System (GPS) Satellite Naviga- tor (Model MX 1107 GPS) located in the UGL. Additional backup navigational equipment is located on the bridge, includ- ing a Magnavox MX 4400 GPS receiver, a Magnavox MX 702A Transit receiver, plus Decca and Loran C positioning systems. The navigation system in the UGL receives fixes from both GPS satellites as well as standard transit satellites. GPS fixes were available continuously during an approximately 11 -hr window each day, while transit satellite fixes were available at various times throughout the day. The system calculated dead reckoning (DR) positions between satellite fixes. All fixes, along with ship's course and speed, were recorded in a special Navlog file at selected time intervals using a Masscomp 561 super micro- computer system (usually every 15 to 30 min during transit and every 2 min while shooting seismic data). These data were ex- tracted later to produce a plot of the ship's track. A paper re- cord of all transit fixes, plus GPS and DR fixes at 30-min inter- vals, also was produced. Fixes collected while at each site were averaged, and a single accurate fix was determined as the offi- cial location for that site. A generalized track for Leg 123 is shown in Figure 1. Detailed navigation was recorded only for that part of the track in the Indian Ocean (solid line). A com- plete list of all navigation data and course and speed changes used to generate the track line is presented in Table 1 (back- pocket microfiche) and Plate 1 (backpocket foldout). Transit Between Sites After leaving Singapore at 1500hr (all times are Universal Time Coordinated unless designated otherwise) on 1 September 1988, our route took us southeast across the Java Sea to just north of Bali, where we headed south through the Lombok Straits into the Indian Ocean (Fig. 1). At this point, we began recording navigation data on tape at 1901 hr on 4 September 1988 (Fig. 2). From there, we crossed the Bali forearc trough and the deep Java Trench and again headed southeast to DSDP Site 261 in the northeast Argo Abyssal Plain. Here, we began collecting seismic data during the run south to our first site (Site 765; Fig. 2, Line 1). Site 765 was approached from the north- east, following the Australian Bureau of Mineral Resources (BMR) site-survey multifold seismic Line 56/022, and a beacon was dropped at 1830 hr on 6 September 1988 at 15°58.5'S, 117°34.5'E (Fig. 3). A sonobuoy also was deployed during this run. While leaving Site 765 on 17 October 1988, a second sono- buoy was deployed and another short seismic line was shot across the site (Line 2A, Fig. 3) before we headed southwest di- rectly across the northwest Exmouth Plateau (Fig. 2). Site 766 was approached from the east, again following a BMR site-sur- vey line (55/003E; Fig. 4). Seismic data were collected during 13
Transcript
Ludden J. N., Gradstein, F. M., et al., 1990Proceedings of the Ocean Drilling Program, Initial Reports, Vol. 123
2. UNDERWAY GEOPHYSICS1
Richard T. Buffler2
INTRODUCTION
The term "underway geophysics" encompasses all shipboardgeophysical data used for pre-cruise selection of drill sites aswell as data collected during the drilling leg. These data form animportant and integral part of the Ocean Drilling Program pro-cess by providing the primary data set for (1) defining the prob-lems to be addressed, (2) site selection, and (3) regional interpre-tation and extrapolation of drilling results. This chapter de-scribes only shipboard underway geophysics, that is, the equip-ment, methods, and actual data collected aboard the JOIDESResolution during Leg 123. Details of geophysical data used inthe selection, description, and interpretation of specific sites arediscussed in more detail in individual site chapters (see "SeismicStratigraphy" sections, Sites 765 and 766 chapters, this vol-ume). Discussions and interpretations of regional geophysicaldata in relationship to drilling results will be addressed in Pro-ceedings of the Ocean Drilling Program, Scientific Results, Leg123.
SHIPBOARD UNDERWAY GEOPHYSICSThe JOIDES Resolution provides scientists the capability of
collecting, displaying, and processing a variety of geophysicalinformation, including navigation, bathymetric, magnetic, seis-mic reflection, and sonobuoy data. The equipment used for thisis located in the Underway Geophysics Laboratory (UGL) andadjacent deck space located aft on the poop deck under the heli-copter platform. Each capability is discussed in the followingsections. First, equipment and methods for each capability aredescribed, then data collected during Leg 123 are discussedbriefly.
After the cruise, navigation, bathymetry, and magnetic datawere processed further, and then edited and corrected by theGeological Data Center (GDC) at the Scripps Institution ofOceanography under contract to ODP. Data in the followingformats were produced by the GDC and submitted to ODP:
1. List of navigation times and positions of course andspeed changes, fixes, and drift velocity.
2. On magnetic tape: separate time series files of fixes,course and speed changes, depth and magnetics in SIO "uwts"format, navigation list file; merged file of navigation, depth,and magnetics in MGD77 Exchange format.
3. On 35-mm microfilm: index track charts, navigation list-ing; fast and slow seismic profiler records; 12- and 3.5-kHzecho-sounder records; and magnetometer records (on one ormore 100-ft rolls).
An informal report summarizing these data also was pro-duced. Copies of the data were provided to both the ODP Data
1 Ludden, J. N., Gradstein, F. M., et al., 1990. Proc. ODP, Init. Repts., 123:College Station, TX (Ocean Drilling Program).
2 Institute for Geophysics, University of Texas at Austin, 8701 Mopac Boule-vard, Austin, TX 78759.
Bank at Lamont-Doherty Geological Observatory and to theNational Geophysical Data Center in Boulder, Colorado.
Navigation
Equipment and MethodsNavigation data were collected during Leg 123 using a Magna-
vox Transit/Global Positioning System (GPS) Satellite Naviga-tor (Model MX 1107 GPS) located in the UGL. Additionalbackup navigational equipment is located on the bridge, includ-ing a Magnavox MX 4400 GPS receiver, a Magnavox MX 702ATransit receiver, plus Decca and Loran C positioning systems.The navigation system in the UGL receives fixes from both GPSsatellites as well as standard transit satellites. GPS fixes wereavailable continuously during an approximately 11 -hr windoweach day, while transit satellite fixes were available at varioustimes throughout the day. The system calculated dead reckoning(DR) positions between satellite fixes. All fixes, along withship's course and speed, were recorded in a special Navlog fileat selected time intervals using a Masscomp 561 super micro-computer system (usually every 15 to 30 min during transit andevery 2 min while shooting seismic data). These data were ex-tracted later to produce a plot of the ship's track. A paper re-cord of all transit fixes, plus GPS and DR fixes at 30-min inter-vals, also was produced. Fixes collected while at each site wereaveraged, and a single accurate fix was determined as the offi-cial location for that site. A generalized track for Leg 123 isshown in Figure 1. Detailed navigation was recorded only forthat part of the track in the Indian Ocean (solid line). A com-plete list of all navigation data and course and speed changesused to generate the track line is presented in Table 1 (back-pocket microfiche) and Plate 1 (backpocket foldout).
Transit Between SitesAfter leaving Singapore at 1500 hr (all times are Universal
Time Coordinated unless designated otherwise) on 1 September1988, our route took us southeast across the Java Sea to justnorth of Bali, where we headed south through the LombokStraits into the Indian Ocean (Fig. 1). At this point, we beganrecording navigation data on tape at 1901 hr on 4 September1988 (Fig. 2). From there, we crossed the Bali forearc troughand the deep Java Trench and again headed southeast to DSDPSite 261 in the northeast Argo Abyssal Plain. Here, we begancollecting seismic data during the run south to our first site (Site765; Fig. 2, Line 1). Site 765 was approached from the north-east, following the Australian Bureau of Mineral Resources(BMR) site-survey multifold seismic Line 56/022, and a beaconwas dropped at 1830 hr on 6 September 1988 at 15°58.5'S,117°34.5'E (Fig. 3). A sonobuoy also was deployed during thisrun.
While leaving Site 765 on 17 October 1988, a second sono-buoy was deployed and another short seismic line was shotacross the site (Line 2A, Fig. 3) before we headed southwest di-rectly across the northwest Exmouth Plateau (Fig. 2). Site 766was approached from the east, again following a BMR site-sur-vey line (55/003E; Fig. 4). Seismic data were collected during
13
R. T. BUFFLER
10°S
20c
AUSTRALIAl • • , • !
100°E 110° 120°
Figure 1. Generalized track of JOIDES Resolution for entire Leg 123from Singapore to Singapore. Detailed underway geophysics data re-corded on magnetic tape only in Indian Ocean (solid line).
this final run (Line 2B), and a beacon was dropped at 1241 hron 19 October 1988 at 19°55.98'S, 110°27.13'E.
Just before leaving Site 766 on 26 October 1988, a small seis-mic survey was conducted just southwest of the site (Line 3) andincluded a third sonobuoy line across the site, before we headednorth toward Singapore (Fig. 4). We then transited the GascoyneAbyssal Plain (Fig. 2) past Christmas Island, and then backacross the Java Trench and into the Sunda Straits between Javaand Sumatra. All geophysical operations were terminated late inthe afternoon of 29 October, just before experiencing an excel-lent view of the famous volcano, Rakata, on Palau Krakatau.After transiting back through the Java Sea, we returned toSingapore by 0500 hr (local time) on 1 November 1988.
Bathymetry
Equipment and MethodsBathymetry data were collected using both 3.5- and 12-kHz
precision depth recorder (PDR) systems and were displayed ontwo Raytheon LSR 1807M recorders at a sweep speed of 1 s.The 3.5-kHz system uses a Raytheon PTR105B transceiver and12 Raytheon transducers, while the 12-kHz system operateswith a PTR105B transceiver and an EDO 323B transducer.These systems normally operate with CESP-III correlators toimprove the signal-to-noise ratio (20 dB). Both systems aremounted in a new sonar dome located outside the ship's hull,forward of the moon pool at 18 m below the rig floor. The newdome was installed during the Singapore port-call in an attemptto decrease hull noise and improve records, especially duringhigh-speed transits and rough seas.
Because of its higher frequency and sharper image of theseafloor, the 12-kHz system was used to determine depths. Ba-thymetry readings were recorded every 5 min in a log for laterprocessing. The 3.5-kHz system provides some sub-bottom pen-etration, often up to 50 to 100 m when sediments are relativelysoft. These records are useful for interpreting shallow seismicstratigraphy, shallow structure, and depositional processes.
Data CollectedPDR systems began operating and data collection started at
approximately 1901 hr on 4 September 1988 (JD-Julian Day-248) as we entered the Indian Ocean on a course of 152° andspeed of 11 kt. Seas were relatively calm for the entire transit,and we obtained excellent records, even across the deep JavaTrench having depths of more than 7000 m. The 3.5-kHz re-cords showed excellent sub-bottom penetration across the cen-tral Argo Abyssal Plain, with penetration of more than 0.1 s inplaces (greater then 75 m). An example of the records taken aswe crossed Site 261 is shown in Figure 5A. Penetration at Site765 deteriorated somewhat, probably because of changing sub-bottom conditions (Fig. 5C). Even the 12-kHz records exhibitedgood penetration, as shown by the examples from Sites 261 and765 (Figs. 5B and 5D).
Bathymetry data were collected continuously during our tran-sit across the Exmouth Plateau to Site 766 and then duringmuch of our transit back to Singapore (Fig. 2). PDR systemswere terminated on 29 October at 0546 hr, just before enteringthe Sunda Straits. Profiles of bathymetry along the track are de-picted in Figure 6. A log of the records collected is presented inTable 2.
During the Argo transit, a brief test to compare records fromthe PDR systems mounted in the new sonar dome with thosefrom the old hull-mounted systems was conducted at high speeds(11 kt; Fig. 7A). Only slight improvement was seen in the 3.5-kHz records (Fig. 7A), as seas were smooth. However, dramaticimprovement was observed in the 12-kHz records (no recordfrom the hull-mounted system vs. the strong bottom reflectionfrom new system; Fig. 7B). This test of the 3.5-kHz system wasinconclusive, and further tests under higher sea states wereneeded. We had this opportunity during the 11-kt transit acrossthe Exmouth Plateau (Fig. 4), where seas were choppy and seastate was between 4 and 5. As before, the 12-kHz record disap-peared when switched to the hull-mounted system. In addition,the 3.5-kHz signal also disappeared (Fig. 8), thus documentingthe ability of the new sonar dome-mounted, 3.5-kHz system toprovide better records at high speeds under high sea states.
Magnetics
Equipment and Methods
Total intensity measurements of the Earth's magnetic fieldwere obtained using a Geometries 801 proton precession magne-tometer. A sensor was towed approximately 400 m astern. Mea-surements were performed at 3-s intervals with 1 nT sensitivity.Values were recorded digitally in the header of the seismic tapeon the Masscomp computer every 99 s during transit and onceper shot during seismic surveys. Data also were displayed graph-ically in real time on a strip chart recorder, and log readingswere recorded every 5 min. These magnetic data later were pro-cessed by GDC to remove the regional field (IGRF) and to cor-rect for any large time variations.
Data Collected
During the transit to Site 765, a magnetometer was deployedand data collection began at approximately 1901 hr on 4 Sep-tember 1988 (JD-248) as we transited the Lombok Straits into
14
UNDERWAY GEOPHYSICS
0c
5SC
10c
15C
20c
IndianOcean
88OCT27
GascoyneAbyssal
Plain88OCT20 'S i te
766
ExmouthPlateau
AUSTRALIA -
100°E 105c 110c 115C 120c
Figure 2. Detailed track chart of transit in Indian Ocean. Magnetics were collected during all of thetransit; seismic Line 1 was collected between Sites 261 and 765. Bathymetry in meters.
the Indian Ocean (Fig. 2). Data collection continued across thenorthern Argo Abyssal Plain to Site 261 and then south to Site765. Profiles of the processed data along track are shown in Fig-ure 6. Magnetic data across the Argo Abyssal Plain were espe-cially important for confirming our location with respect to sea-floor magnetic anomalies postulated for the area. Of particularimportance was the identification of Mesozoic anomalies M23through M25, around which Site 765 was planned. Details ofthe processed magnetic data collected along seismic Line 1 areplotted below the analog seismic records (Fig. 9, backpocketfoldout). These profiles show our best correlation with the mag-netic anomaly patterns that had previously been interpreted asM23 through M25 (Late Jurassic) by Heirtzler et al. (1978),Veevers et al. (1985), and Fullerton et al. (1989). On the basis of
a possible younger age (Earliest Cretaceous) for the crust inferredby drilling at Site 765, these anomalies will be re-evaluated.
A magnetometer again was deployed during the transit be-tween Sites 765 and 766 across the Exmouth Plateau (Fig. 6).The large anomaly at the northern Plateau margin correspondsto the continent/ocean boundary (COB) of Veevers et al. (1985).The field across the Plateau itself has little relief, except at thesouthwest margin, where again oceanic magnetic anomalieswere picked up during the approach to Site 766 (Fig. 6). Addi-tional magnetic data were collected during the transit northacross the Gascoyne Abyssal Plain, again showing the magneticanomalies in the area of oceanic crust (Fig. 6). As our transitwas almost at right angles to the inferred opening direction, ourdata probably will be of minimum use for identifying anoma-
15
R. T. BUFFLER
15°40'S
15°50'
16°00'
16°10'
I-
— >
I
Line
1
-1600
700
1800 115/22^^° JoBeacoriX A l>
V dropped VJ.56/0.23B j
IgT. *WQ>™ 116/0°
1 8 0 0 ^ ^
•''.. v—
X ' >N^* f • • ' • '
/ " , *116/04 . • • ' . '
. "* 'i116/06 T
V
•
I
—
—
X . '
* •\
\'×.117°30'E 117°40' 117°50'
Figure 3. Map of Site 765 area showing track of JOIDES Resolutionduring approach (Line 1) and departure (Line 2A) when seismic and so-nobuoy data were collected (solid line). Also shown is track of BMR sitesurvey data (dashed line) and other singlefold seismic data in the area(dotted lines).
lies. Collection of magnetic data also was terminated at 0546 hron 29 October 1988. A log of the records collected is presentedin Table 2.
Seismic-Reflection Profiling
Equipment and Methods
Singlefold seismic reflection data were collected aboard theJOIDES Resolution during the approach to both Sites 765 and766. The energy source used was two 80-in.3 water guns (manu-factured by Seismic Systems, Inc.) that were operated at approx-imately 2000 psi air pressure. These guns were towed 14 m apartabout 25 m behind the ship at depths ranging from 6 to 13 m,depending on ship's speed. A seismic signal was received by a100-m-long Tèledyne streamer containing 60 hydrophones, whichare summed to improve signal-to-noise ratio and to produce onechannel of data. The streamer was towed about 300 m behindthe ship at an estimated depth of about 15 to 20 m, dependingon ship's speed.
Seismic data were digitally recorded on 9-track magnetic tapeusing a Masscomp 561 super microcomputer system and thendisplayed in real time on a 15-in.-wide Printronix high-resolu-tion graphic printer (160 dots/in.). Shots were fired every 13 sand recorded at a digital sample rate of 1 ms. The signal entryinto the Masscomp was filtered at 25 to 250 Hz, and a digitalamplifier gain was set at 115 dB. Record length for each shotwas 5 s. The magnetic tape uses a SEGY format and has a den-sity of 1600 bpi. In addition to the magnetic data discussed
above, the tape header file for each shot includes informationsuch as first file ID number, shot point number, field time breakdelay, date, time, wind speed and direction, ship's speed (pitlog), ship's gyro heading, cumulative distance traveled, streamerand gun depths, and information about timing of gun firing.The Masscomp computer system also was used for preliminarypre-processing of digital data on board the ship.
The raw seismic signal from the streamer also was displayedin real time in analog format on two Raytheon LSR 1807M re-corders at different scales (4 s sweep and 1 or 2 s sweep). Re-corder speed was either 50 or 75 lines/in. The signal was passedthrough an Ithaco amplifier and a Krohn-Hite filter set at 50-120 Hz.
Transit Between Site 261 and Site 765A long regional seismic line (Line 1) was collected across the
Argo Abyssal Plain between Site 261 and Site 765 (Figs. 2 and9). The purpose of the line was to correlate seismic stratigraphybetween the two sites and to better establish regional structuraland stratigraphic relationships in the area. A copy of the analogrecord is presented in Figure 9, and a copy of the processed seis-mic line is shown in Plate 1 (back pocket).
The seismic gear was deployed at approximately 1830 hr on 6September 1988 at a position just north of Site 261. After head-ing south on a course of 184°, the first shot was recorded at1838 hr. Ship's speed was approximately 6 kt to keep noise to aminimum during this part of the line. We passed Site 261 at1924 hr (Fig. 2) with the analog records showing excellent defi-nition of seismic stratigraphy at the site (Fig. 9). At 2100 hr, weincreased our speed to 8 kt, which increased streamer noise andcaused some deterioration in data quality. The records were stillinterpretable at these higher speeds (Fig. 9), and thus, we de-cided to continue recording the line as we headed south towardSite 765 (Fig. 2).
Surveys at Site 765Our planned approach to Site 765 was to intersect the north-
east end of BMR site-survey Line 56/022 and then proceedalong this line to the site (Fig. 3). At 1701 hr, we changed to acourse of 224° to parallel the line; at 1730 hr, we decreased ourspeed to 5.5 kt to improve record quality as we approached thesite (Fig. 9). At 1737 hr, we launched a sonobuoy to supplementseismic data at the site (see below). At 1830 hr, a comparison ofanalog records with the BMR site survey line indicated that wehad reached Site 765, and a beacon was deployed. The shipmade a slow turn, with one additional pass over the site area,before securing the seismic system at 1935 hr (Figs. 3 and 9).The final location of the site was at the intersection of BMRmultifold site-survey Lines 56/022 and 56/023c at 15°58.5'S,117° 34.5'E (Fig. 3).
When leaving Site 765, a short seismic line was shot while re-cording a sonobuoy heading southwest across the site area (Line2A, Fig. 3). The survey began approximately 3 nmi northwest ofthe site at 1640 hr on 17 October 1988 and was terminated 10nmi to the southwest at 1800 hr (Fig. 3), when we lost the sono-buoy signal. The monitor record for this short line (showing theclosest point of approach to Site 765) is presented as Figure 10,and a copy of the processed line is presented in Plate 1 (backpocket).
Surveys at Site 766We deployed seismic gear again on 19 October 1988 at 1108
hr, approximately 10 nmi east of proposed Site 766 at the inter-section with BMR multifold site-survey Line 55/OO3E (Fig. 4).We then began a seismic line at 1115 hr, while steaming 6 kt par-allel to the BMR line (Line 2B; Figs. 4 and 11). The purpose ofthis survey was to guide us when selecting a site. A beacon was
16
UNDERWAY GEOPHYSICS
19°50'NEnd sonobuoy
074/2200
1050,
20°00'
110°20'E 110°30' 110°40'
Figure 4. Track of JOIDES Resolution during approach to Site 766 (Line 2B) plus seismic and sonobuoy surveys following drilling (Line 3; solidline). Also shown is track of BMR site-survey data in area (dashed line).
dropped on target at 1241 hr in the middle of the second ero-sional terrace (Fig. 11) along BMR Line 55/OO3E, near the in-tersection with Lines 55/002 and 55/OO3B (Fig. 4). The line wasterminated just past the site at 1250 hr.
Following drilling and logging at Site 766, a short seismicsurvey was conducted just southwest of the site area on 26 Octo-ber 1988 (Line 3; Fig. 4), primarily to investigate the distribu-tion of seismic sequences just drilled (Fig. 12). Of particular in-terest was the distribution and thickness of the lowermost sand-stone/siltstone unit, Lithologic Subunit IIIB. This survey consistedof four short segments along a complex faulted margin (Figs. 4and 12). We then continued the survey northwest across the site,while shooting a third sonobuoy. The survey ended when we lostthe sonobuoy signal at 0739 hr (Fig. 4), at which time we se-cured our seismic gear and began our transit to Singapore.
Copies of the processed lines collected at Site 766 are pre-sented in Plate 1 (back pocket). A log of all seismic data col-lected during Leg 123 is listed in Table 2.
Sonobuoys
Equipment and Methods
Sonobuoy data were collected at drill sites to provide addi-tional velocity vs. depth information. Sound sources were two80-in.3 water guns used for seismic surveys. Signals from sono-buoys were converted to normal FM broadcast band frequenciesand then received by a high-frequency Realistic AM/FM stereo.These data were recorded along with the seismic data on digital
tape using the Masscomp computer system. Routines for pro-cessing data are not available on board the Resolution. The datawill be analyzed post-cruise at shore-based laboratories usingTau-P methods for extracting velocity vs. depth information.An analog monitor record of the sonobuoy data was displayedon one of the Raytheon recorders. All sonobuoys were NavyModel SSQ 53B.
Site 765A sonobuoy was deployed at 1737 hr on 6 September during
our final approach to Site 765, after turning to a course of 224°and slowing to 5.5 kt (Fig. 3). We used sonobuoy channel 3, setphone depth at 90 ft, and set life for 3 hr. The buoy was locatedat approximately 15°55.15'S, 117°37.97'E. Shot repetition ratewas changed to 16 s, with a 10-s record length to accommodatethe sonobuoy data. Data were recorded until 1825 hr, at whichtime the signal was lost.
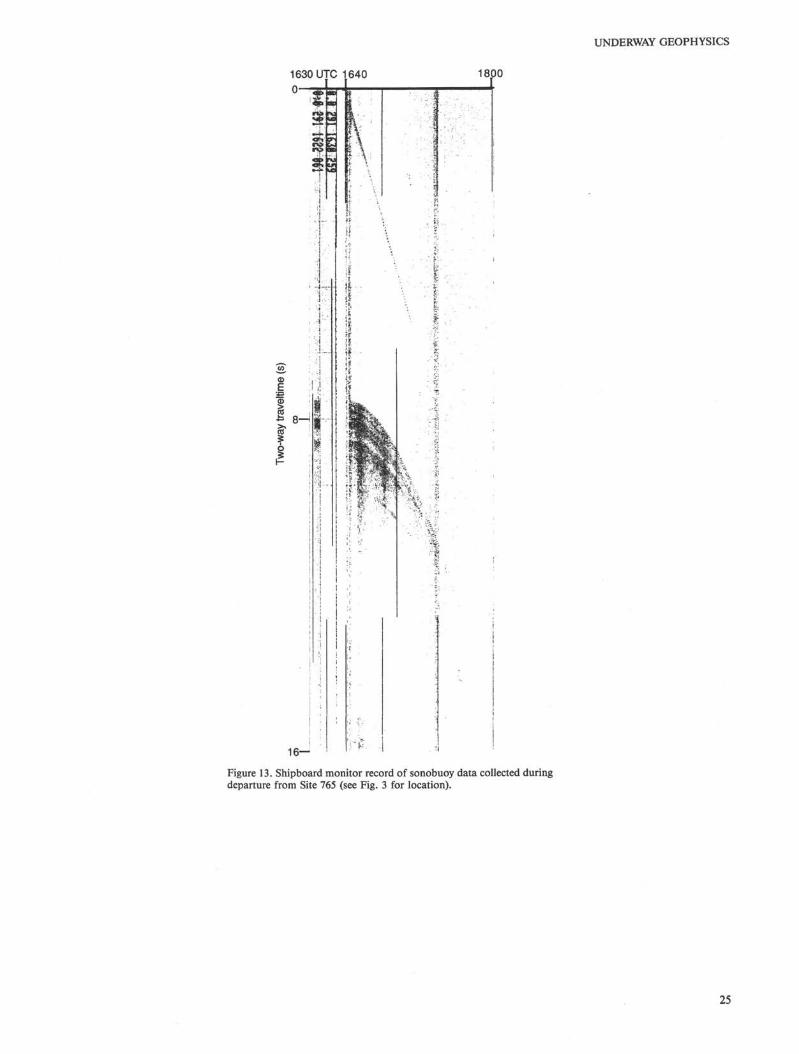
Because of a short recording time for the sonobuoy duringour approach, a second sonobuoy was deployed while we wereleaving Site 765 (Line 2A; Fig. 3). Settings on the sonobuoywere the same as before. We increased the shot repetition rate to25 s, and record length for the sonobuoy was 20 s. Data weredigitized at a sample rate of 2 ms. After we drifted about 3 nminorthwest while pulling pipe, we deployed the sonobuoy at 1640hr (17 October 1988) at a location of 15°57.18'S, 117°36.97'E.We then proceeded southwest on a course of 241° at a speed of8 kt across the site area for about 10 nmi (Fig. 3). This signal ap-peared stronger and lasted longer than that of the first buoy and
Figure 5. Examples of 3.5- (A, C) and 12-kHz (B, D) records at Sites 261 and 765, respectively. Each vertical subdivision equals approximately37.5 m in the water column.
Sts. j a v a Trench Argo Abyssal PlainExmouth Plateau Christmas Island Sunda Straits
O O • ^ O O C M C O O O ^ O O C M C D O O O • ^ • O O C V J C D O O • > t C O C M ^ J C O C M C D O O • * t ( D C M C D O O • ^ O O C M C O O O *C v j O O O T - ^ c v J O O O T - ^ = • C M C V J o C > O • ^ i - C V J O O O • t - O O T - • ^ C M O O O T - T - CVJ O O O I - T - < M O O
Site 765 Site 766Site 261
Figure 6. Profiles of magnetics (upper) and bathymetry (lower) data processed by GDC. See Figure 2 for location of tracks. Black bars at bottomrepresent location of seismic lines shot.
should give excellent results. A copy of the monitor record forthis sonobuoy is displayed in Figure 13 and indicates direct andcritical reflected waves. When this signal was lost, we termi-nated recording at 1800 hr (Figs. 3 and 13).
Site 766
A final sonobuoy was deployed at 0651 hr on 26 Octoberduring our departure from Site 766 (location of 19°57.31'S,110°27.44'E), following seismic Line 3 (discussed above) on aheading of 340° at 7.5 kt (Fig. 4). All settings were similar tothose of the second buoy at Site 765. This record also appearedto be of good quality.
REFERENCES
Fullerton, L. G., Sager, W. W., and Handschumacher, D. W., 1989.Late Jurassic-Early Cretaceous evolution of the eastern Indian Oceanadjacent to northwest Australia. J. Geophy. Res., 94:2937-2953.
Heirtzler, J. R., Cameron, P., Cook, P. J., Powell, T., Roeser, H. A.,Sukardi, S., and Veevers, J. J., 1978. The Argo Abyssal Plain. EarthPlanet. Sci. Lett., 41:21-31.
Veevers, J. J., Tayton, J. W., and Johnson, B. D., 1985. Prominent mag-netic anomaly along the continent/ocean boundary between thenorthwestern margin of Australia (Exmouth and Scott plateaus) andthe Argo Abyssal Plain. Earth Planet. Sci. Lett., 72:415-426.
20
UNDERWAY GEOPHYSICS
0145 UTC 0150 0155 0159 0205 0210 0215
5.6
5.7-
5 . 8 -
5.9-
6 . 0 -
0140 UTC 01455.5
5 . 6 -
5.7
5.8
5.9-
0150 0155
LUO
-σ1toN
OvJ
CO
"δo
tch
<J)
0200 0205 0210
6 . 0 -
Figure 7. Records of 3.5- (A) and 12-kHz (B) data showing test of systems in new sonar dome (outside) vs.old hull-mounted systems (center). Test conducted at 11 kt in calm seas. Test indicates vast difference in 12-kHz, and little difference in 3.5 kHz.
21
R. T. BUFFLER
0500 0505 0510 0515 0520 05253.4
3.9—~
Figure 8. Test of 3.5-kHz systems in sonar dome (outside) vs. hull-mounted systems (center). Seaswere choppy, sea states were 4 to 5. Note lack of record from hull-mounted system.
22
UNDERWAY GEOPHYSICS
1630164017001707 1730 1800
ri
~•'.K:~,^l X
'"£•'"'.
• s •o
< Q .CO
1130 1200
Site 766Beacon drop
I1230 1241
4—
••M%0
7—
Figure 10. Shipboard monitor record of seismic Line 2A, shot while col-lecting sonobuoy data (Fig. 13) during departure from Site 765. The linepassed approximately 1/4 mi south of Site 765 (see Fig. 3 for location).
Figure 11. Shipboard monitor record of seismic Line 2B, collected dur-ing approach to Site 766. Beacon was dropped on second erosionalbench (see Fig. 4 for location).
23
R. T. BUFFLER
0300 UTC 0320 03304.0-1 L__L_
C/C to 060°
0400 0430 0500 0510 0530
Drop sonobuoy
C/ C from 020° to'340°
Start turn to C/C to 020° f Site 766I I i
0600 0615 0630 0647 0700 0730I I I I II I
4 . 5 -
5.0—
6.0 —
6.5—
7 . 0 -
Figure 12. Shipboard monitor record of post-drilling seismic survey conducted southwest of Site 766, plus site crossing during sonobuoysurvey (see Fig. 4 for location).
24
UNDERWAY GEOPHYSICS
1630 UTC 1640 1800
16—
Figure 13. Shipboard monitor record of sonobuoy data collected duringdeparture from Site 765 (see Fig. 3 for location).