87
1 20 th & 21 st National Children’s Science Congress (2012-13) Activity Guide
1
20th & 21st National
Children’s Science
Congress
(2012-13)
Activity Guide
2
Activity Guide
This resource material compiled in this publication was developed during the Brainstorming
workshop held at Tezpur University, Tezpur, Assam during May 2 to 4, 2012. Many
suggestions given at the National Orientation workshop at Regional Education Institute
(REI), Mysore during June 11 to 13, 2012 have also been incorporated.
Group working for activity guide development
Advisors
Prof. S. P. Verma
Dr D. K. Pandey
Working group
Jayanta Kr Sarma (Coordinator)
Dr Pulin Bihari Chakravorty
Dr P. Pramod
Dr Bhim Prasad Sarmah
Dr Lalit Sharma
U.N. Ravi Kumar
E. Kunikrishnan
Sadhan Mahapatra
Jaideep Baruah
Sandip Bhattacharya
Illustrations by
Biswajit Borah, Muna Goswami, Tekendrajit Saikia
Cover design : Sandip Bhattacharya Mobile- 09868404002
Published by
NCSTC – Network E-56, First Floor, Samaspur Road Pandav Nagar, Delhi – 110091 Email – [email protected] [email protected] Telephone – 011-22799236
Catalysed and supported by National Council for Science and Technology Communication (NCSTC), Department of Science and Technology Technology Bhavan, New Mehrauli Road, New Delhi – 110016, Email ID: [email protected]; Telephone no:01126535564/26590251
3
Contents
Part I: About Children’s Science Congress
Part II: About Focal Theme and Sub-Themes
Focal theme: “Energy: Explore, Harness and Conserve”
Sub-themes:
(i) Energy Resources
(ii) Energy System
(iii) Energy and Society
(iv) Energy and Environment
(v) Energy Management and Conservation
(vi) Energy Planning and Modelling

4
Part Part Part Part –––– I I I I
About About About About
Children’s Science Children’s Science Children’s Science Children’s Science
Congress Congress Congress Congress
5
About Children’s Science Congress (CSC)
1.1. CSC – the beginning
The seeds of the programme of children’s science congress (CSC), in the way of an exercise to carry
out small research activities at micro-level were planted in Madhya Pradesh by an NGO called
Gwalior Science Center. It was later adopted by National Council for Science and Technology
Communication (NCSTC), Department of Science and Technology (DST), Government of India for
carrying out national level activities through NCSTC-Network (a network of Non-Government and
Government organizations working in the field of science popularization) as national organiser. It was
a time when many of the country’s crusaders of science communication were experienced with
massive science communication exercise of Bharat Jana Bigyan Jatha and Bharat Jana Gyan
Bigyan Jatha. It was felt that the large scale activities for developing scientific awareness among the
masses are to be continued as regular activity, so, this programme was launched nationwide in
1993, under the nomenclature of National Children’s Science Congress (NCSC), with an expectation
that it would generate scientific temperament among the teachers and students, and spread among
various stakeholders of the society. The programme of NCSC has been fruitfully conducted for the
last 19 years.
1.2. CSC – An Overview
Children’s Science Congress is targeted to spread the concept of the method of science among the
children through their project activities adopting the principle of ‘Learning through doing’. The
mandate of participation is that, the children will carry out a project on a particular topic in relation to
theme and sub-theme decided for the year. The study is to be carried out in the neighborhood of the
children where they live in. For this, the students form a group with their like-minded
friends/classmates and the study is carried out under the supervision of a guide. It is noteworthy that,
CSC programme is not only for the school going children but is also open for the children outside the
formal boundary of schools, in the age group of 10 to 17 years (where 10 to 14 years is considered
as junior group and 14 to 17 years as senior group). Further, it is not mandatory that a guide must be
a school teacher; any person with fair knowledge of dealing with children and method of science is
considered eligible to guide the children.
The exercises of project activities, as a thumb rule, encourage the children to explore, think, serve
and wonder. It is capable to imbibe the following temperament/quality/skill of the children:
• Observation,
• Making measurement,
• Making comparison and contrasts,
• Classification,
• Estimation,
• Prediction,
• Interpretation,
• Critical thinking,
• Creative thinking,
• Drawing conclusion and
• Cooperative skill
6
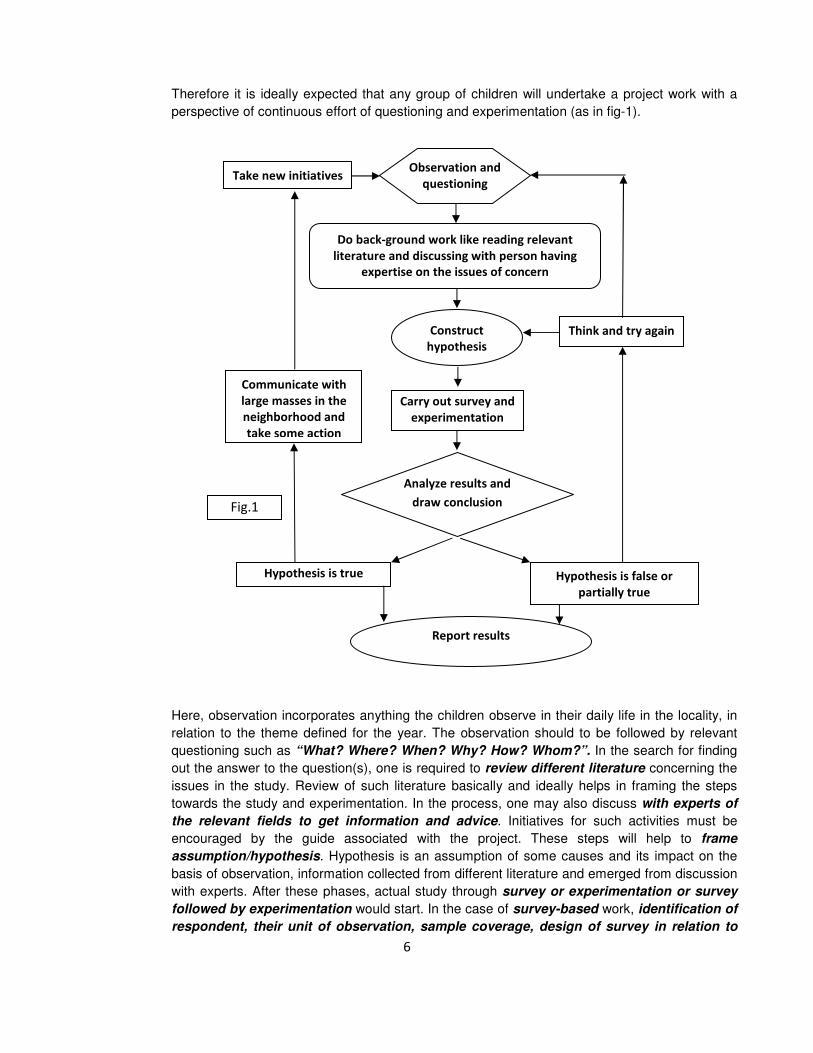
Therefore it is ideally expected that any group of children will undertake a project work with a
perspective of continuous effort of questioning and experimentation (as in fig-1).
Here, observation incorporates anything the children observe in their daily life in the locality, in
relation to the theme defined for the year. The observation should to be followed by relevant
questioning such as “What? Where? When? Why? How? Whom?”. In the search for finding
out the answer to the question(s), one is required to review different literature concerning the
issues in the study. Review of such literature basically and ideally helps in framing the steps
towards the study and experimentation. In the process, one may also discuss with experts of
the relevant fields to get information and advice. Initiatives for such activities must be
encouraged by the guide associated with the project. These steps will help to frame
assumption/hypothesis. Hypothesis is an assumption of some causes and its impact on the
basis of observation, information collected from different literature and emerged from discussion
with experts. After these phases, actual study through survey or experimentation or survey
followed by experimentation would start. In the case of survey-based work, identification of
respondent, their unit of observation, sample coverage, design of survey in relation to
Think and try again
Observation and
questioning
Do back-ground work like reading relevant
literature and discussing with person having
expertise on the issues of concern
Construct
hypothesis
Carry out survey and
experimentation
Analyze results and
draw conclusion
Hypothesis is true Hypothesis is false or
partially true
Report results
Communicate with
large masses in the
neighborhood and
take some action
Take new initiatives
Fig.1
7
designing of interview schedule or questionnaire is supposed to be the most critical steps.
Such decisions may vary with the issues of study. On the other hand, in case of
experimentation, setting the objective of experimentation, defining different parameters,
identification of ideal instruments, framing of procedures/steps and control along with
repetitive observation of the experiments are critical decisions, which will determine the path
towards the result. Again in relation to issues of study, such experiment may be either
laboratory experiments or field experiments.
It is expected that in course of time, the children’s project will bring in lots of new information
about problems and prospects of their locality along with innovative ideas to address these
issues. Moreover, in the course of project work, the children may develop different new
approaches of study along with the development of different instruments for their experiments.
Such tools/instruments may be developed with the material in their access / available to them
nearby. Another expectation was that the outcome of different studies will be communicated
among the local populace, which in turn, helps in generating scientific temperament among the
general mass.
In a nutshell, the CSC projects are simple, innovative, concerned with local issues related with
day to day life, carried out in very nominal cost, where the focus is more on logical interpretation
and analysis of issues, and finding out pragmatic solutions of generic nature to the possible
extent, and not merely confined to the study topic and corresponding model making.
1.3. Objectives
The primary objectives of the Children’s Science Congress is to make a forum available to
children of the age-group of 10-17 years, both from formal school system as well as from out of
school, to exhibit their creativity and innovativeness and more particularly their ability to solve a
societal problem experienced locally using the method of-science.
By implication, the CSC prompts children to think of some significant societal problem, ponder
over its causes and subsequently try and solve the same using the scientific process. This
involves close and keen observation, raising pertinent questions, building models, predicting
solutions on the basis of a model, trying out various possible alternatives and arriving at an
optimum solution using experimentation, field work, research and innovative ideas. The
Children’s Science Congress encourages a sense of discovery. It emboldens the participants to
question many aspects of our progress and development and express their findings in
vernacular.
1.4. Relevance of CSC in the light of contemporary educational initiatives
The basic approach of CSC on the principle of learning through doing on the issues of
children’s immediate environment significantly caries the sprit and mandate of Education for
Sustainable Development (ESD) of UNESCO, National Curriculum Framework (NCF,2005)
and Right to Education(RTE,2009).
8
The modalities and approaches of CSC cater to the five pillars of learning of Education for
Sustainable Development vividly, viz. learning to know, learning to do, learning to live
together, and learning to be, learning to transform one self and society (Declaration of ESD in
the 57th meeting of the United Nations General Assembly in December 2002, which
proclaimed the UN Decade of Education for
Sustainable Development, 2005- 2014, refer –
www.desd.org and www.unesco.org)
The mandate of CSC which encourage
Children’s to observe, explore, experiments
and wonder through a project activities and its
associated ways of participation and
evaluation rightly take care of the
guiding principles of the NCF,2005. Therefore, example of Children’s Science Congress is
rightly cited in the NCF documents under executive summery section, page ix
(http://www.teindia.nic.in/Files/NCF-2005.pdf).
Similarly CSC activities also helps in materializing the approach of learning as framed in the
Right of Children of Free and Compulsory Education (RTE) Act, 2005 (particularly in relation to
article 6.1, section C (ii, iii, iv and v)).
More over the CSC activities, since 1993, has catered to many of the approaches and priorities
of science education visualized in the National Programme of Sarba Siksha Abhijan (SSA)
(refer SSA framework, htp//ssakarnataka.gov.in/pdfs/aboutus/ ssa_framework%20.pdf) and
Rastriya Madhamik Siskha Abhijan (RMSA) (refer -
http://www.educationforallinindia.com/rastriya-madhymic-shiksha-mission-RMSM.pdf).
1.5. Eligibility of participants
• It is open for children in the age of 10 to 14 years (lower age group) and from 14+ to 17
years (upper age group) as on December 31 of the calendar year.
• A group of children not exceeding five, can do the project –study under a teacher guide.
• A child scientist, who had already presented as a Group Leader at the National Level in one
age-group, can act as a co-worker in the subsequent year, in the same age group (lower /
upper).
• Parents, whose child would participate in the Children’s Science Congress in the ensuing
year, should not hold any portfolio in the organizing committee of the CSC conducted at
any level.
“A social movement along the lines of Children’s Science Congress should be visualised in order to promote discovery learning across the nation, and eventually throughout South Asia.” - National Curriculum Framework 2005, Executive Summary, Page (ix)
9
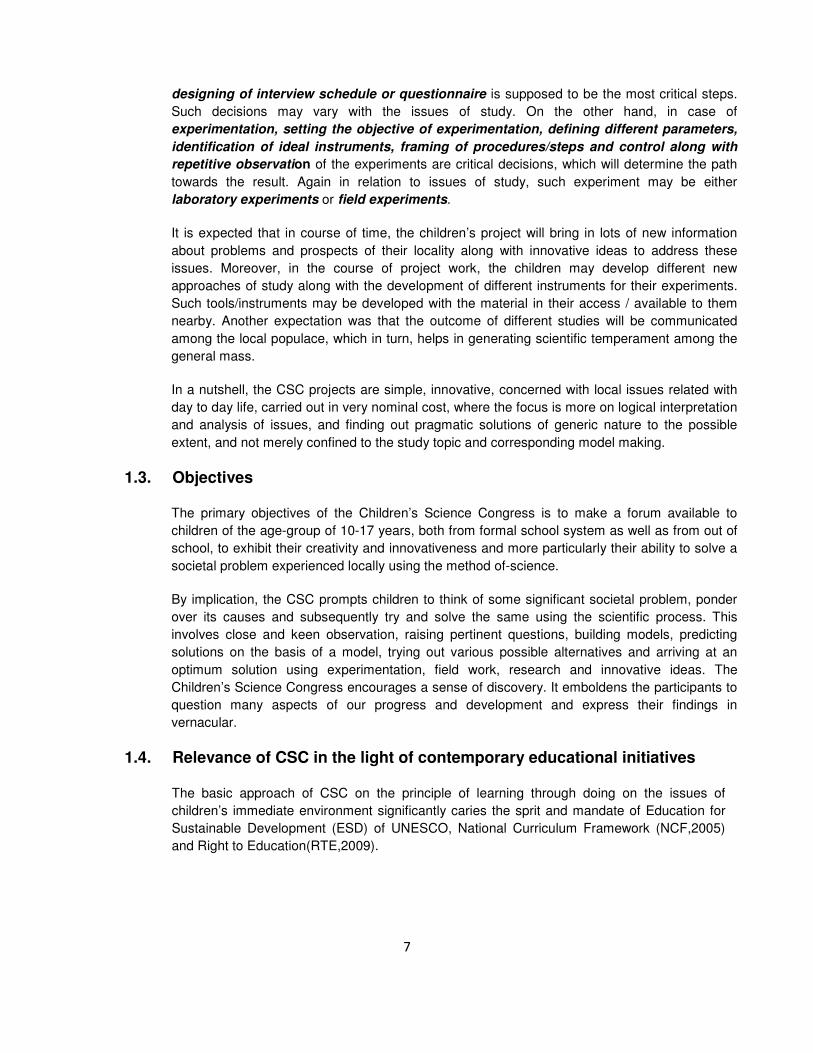
1.6. Modalities of participation
Following are major steps involved for participation in the CSC
1.7. Nature of CSC Project
The CSC projects are:
• Innovative, simple and practical;
• Representing teamwork;
• Based on exploration of everyday life-situations;
• Involving Experimentation and/or field based data collection;
• Having definite outputs, arrived through scientific methodology;
• Related directly to community work in the local geographical area;
• Having follow-up plans.
Formation of a group with like minded friends (not exceeding
five group members) and selection of group leader
Choosing a guide
Selection of topic/issues for study in relation to
Focal theme and sub-theme (through consultation
relevant literature, experts and guide teacher)
Framing design of the study, selection of field study
area (local area) and preparation work plan
Carry out the study (field observation, field study, field or
laboratory experiment or both) and collection of primary
and secondary data , compilation and validation of data,
data analysis , interpretation and framing of results
Registration for
block/district level
(by filling up the
form –A)
Writing report and preparation of
posters for presentation
Sub-mission of
report for
block/district level
Presentation at block/district level (from where selection will be there for state
level than state to national level on the basis of the merit of the project)
10
1.8. Criteria of Good Projects
As per past experience it has been found that projects which were rated very good had the
following elements while implementing and documenting the project:
• Proper understanding and definition of the problem undertaken.
• Quality and quantity of work, including team work, learning process, subject understanding
and efforts to validate the data collected.
• Relevance of the proposal to the community/school problem and impact of project on
schoolmates, neighborhood community.
• Originality, innovation and creativity shown to understand the problem and find solution i.e.
in methodology and experiment design.
1.9. Points to remember
The project work of CSC must be carried out in a systematic way so that it can rightly reflect the
method of science in the works. The issue of the study may demand experimental or survey
works or both. In case of experimental works design and principle of the experiments are very
important factor which may help to get a better result in a rational way. In such case parameters
of observation and verification through the experiment and its logical selection must be reflected
vividly along with sets of control and approaches of data validation. Similarly, in case of survey
based project universe of the study, criteria of sample selection, sample coverage, design of
questionnaire or interview schedule are very important along with approaches of data
compilation, validation, analysis and interpretation. Prototype model or functional models are
only encouraged to use in project presentation if issues and methods of study really demands
for it.
Log-Book- Proper work diary has to be maintained while carrying out the project work. The
day-to-day activity has to be neatly noted in the form of a log-book, and should be submitted
with the project report at the time of submission. All the details, such as Project title, name of the
group leader etc should be written clearly on the cover.
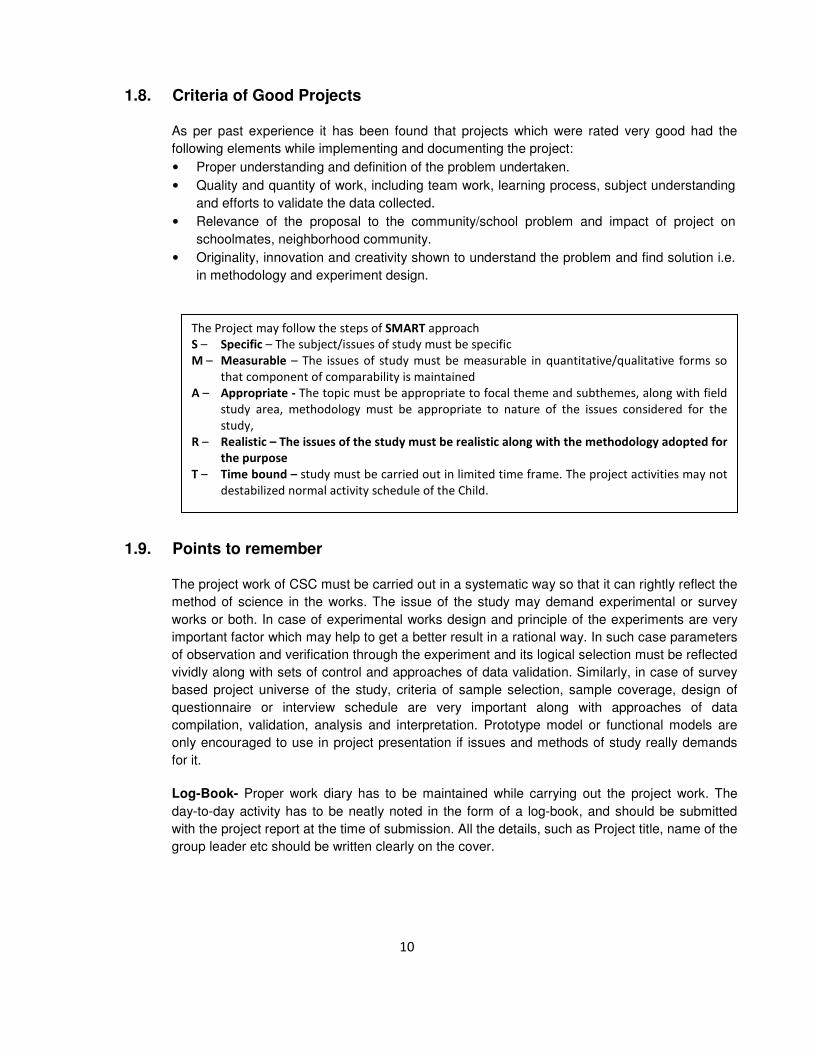
The Project may follow the steps of SMART approach
S – Specific – The subject/issues of study must be specific
M – Measurable – The issues of study must be measurable in quantitative/qualitative forms so
that component of comparability is maintained
A – Appropriate - The topic must be appropriate to focal theme and subthemes, along with field
study area, methodology must be appropriate to nature of the issues considered for the
study,
R – Realistic – The issues of the study must be realistic along with the methodology adopted for
the purpose
T – Time bound – study must be carried out in limited time frame. The project activities may not
destabilized normal activity schedule of the Child.
11
1.10. Structure of the project report
The structure project report of CSC is as follow
i. Cover page – must incorporate
• Title of the project
• Name and address of Group leader and co-workers
• Name and address of guide
ii. Form – A ( Registration form)
iii. Abstract – in 250 words for lower age group and 300 words upper age group (one copy in
English)
iv. Contents- list of chapter with detail heading and sub-heading, list of table, chart, maps, etc.
along with references against page numbers
v. Introduction- description on background of the study
vi. Aims and objectives of the study
vii. Hypothesis
viii. Need statement
ix. Work plan
x. Methodology
xi. Observations
xii. Data analysis and interpretation
xiii. Results
xiv. Conclusions
xv. Solution to the problem
xvi. Future plan
xvii. Acknowledgement
xviii. References
The word limit for the written report for the lower age group is 2500 and that for the upper age
group is 3500. The written report can be substantiated by including limited number of
photographs, sketches, illustrations and / or drawings, etc.
1.11. Oral presentation:
Oral presentation at the technical sessions of the congress is a very important component of the
entire process. Effective communication during briefing the issues of study, its objectives, and
methodology adopted for the study, important observation and findings, vital aspects on the way
and approach to solve the problem or address problems is a very critical part of the exercise.
Because only 8 minutes time is allotted for the purpose. Therefore, one has to plan
pragmatically for the purpose. Children can use 4 different posters (which is mandatory). Poster
must be prepared on 55 cm x 70 cm (21.6" x 27.5") drawing sheets (i.e. chart papers). If needed
power point presentation may be used.
Plagiarism would lead to disqualification
12
Your posters should contain information on (1) The project title, (2) Names of the group
members, (3) Objectives, (4) Map of the area, (5) Methodology, (6) Results, (7) Conclusion, (8)
Solution to the problem. Depending upon the nature of the project the poster may or may not
have a map and/or results.
1.12. Different level of Congress
Children’s Science Congress is organized in three levels where the child scientists and their
project works are screened under common evaluation criteria. The evaluation of the project is
done for its innovativeness, simplicity and practicality. On the basis of the merit of the
project is selected for the next level. The three levels are as follows:
• Block /district level
• State level
• National level.
The District/Block level Congress is the first level in which projects compete with one another
and are screened for presentation at the State level Congress, the second level. Projects as
per State-wise quota indicated at Annexure- are selected from the State level for the Grand
Finale – the National Children’s Science Congress. Seven to eight lakh child scientists
participate at various levels from the States and the Union Territories.
1.13. Screening
(i) The selection ratio at District/State Level and at State/National Level should be as follows:
State: District = 1: 15
(Out of 15 projects presented at District 1 will be screened for State Level.)
(ii) State/National = As per State quota indicated at Annexure -
(iii) The selection ratio of Lower age group (10 to 14 years of age) to Upper age group (14+ to
17 years) should be 40:60.
1.14. Tentative Activity Schedule
• Selection of subjects and activity for registration of teams : June-July
• Working on the project: Minimum two months
• District level Congress: By September -October
• State level Congress: By November
• National level Congress: 27-31 December
• ‘Kishore Vigyani Sanmmelan’ ( at Indian Science Congress ) from 3-7 January
1.15. Approaches of Evaluation
The innovative ideas and scientific methodology are the basis of a good project but one has to
prove his communication skills also to make others listen and understand his findings. For doing
this, a total cooperation in the group is a must. Accept positive criticism within the group or even
from outside and improve the work plan. This will bring award and recognition.

13
1.15.1. Evaluation Criteria
i) Originality of idea and concept: A unique or novel project idea which attempts to answer
a specific question - (a hypothesis driven by curiosity to understand any concept related to
focal theme). The idea should not be an exact replication of the model projects as in this
Activity Guide. A proper explanation of origin of the idea may be demanded by the
evaluator.
ii) Relevance of the project to the theme: This section focuses on how the project is
relevant to the focal theme/sub-theme.
iii) Scientific understanding of the issue: Refers to the extent of knowledge the child
scientist has in relation to the project idea.
iv) Data collection: Systematic collection of information using relevant
tools/interviews/questionnaire. Sample size should be sufficient to support the issues under
study.
v) Analysis: This includes tabulation, categorization/classification, and simple statistics as
applicable to the study.
vi) Experimentation/Scientific study/validation: Conducting of experiments/field study and
validation applying simple methods of science. Experiment need not be every sophisticated
or lab based, they could be simple, self developed and inexpensive too.
vii) Interpretation and Problem solving attempt: To what extent the team has addressed the
proposed hypothesis and the issue of the locality through the project.
viii) Team work: It refers to work division, cooperation and sharing among and beyond the team
members (the child scientists).
ix) Background correction (Only for District level): In this case the background of the
children is verified like geographical location of their school, village, town etc. in relation to
infrastructure, information and other input related facilities available with them. The logic is
that children from difficult geographical situation must get some weightage in comparison to
the children from advantageous geographical location. Non-school going children should
also get some weightage in this criterion.
x) Report and Presentation: Written Report and Oral Presentation are evaluated separately.
Reports are evaluated for its systematic presentation, tabulation of data in support of the
project idea and the clarity with which the study is documented and explained. A Log Book
(actually a Daily Diary) is mandatory and should be authenticated over the signature of the
guide teacher daily. The cover page of the Log Book should carry the names of the child
scientists, the district and the Sate, in English. Marks awarded for the presentation covers
question and answer with evaluators, presentation of charts/posters, illustrations and other
visuals.
xi) Follow up Action Plan (Only for State and National levels): The child scientists should
try to find out scientific solution to the bothering problem. Has the team conveyed the
message to the community? How it was communicated? Will effort continue to involve more
people till the problem is solved? Was any action plan suggested? Credit shall be given for
similar efforts.

14
xii) Improvement from the previous level (Only for State and National levels): This is to
encourage the child scientists towards their continuous involvement with the project for its
improvement. Improvements on the work from District to state level and then from State
level to the national level will be given marks separately. The evaluators shall specify the
areas of improvement on a separate sheet of paper.
xiii) Additional page(s): These must be there in the Project Report with detail description of
works of improvement done after the previous level (particularly on the basis of the
evaluators’ suggestion in the previous level).
1.15.2. Evaluators
i) Evaluators may please note that the participating children are budding scientists from the
age group of 10 to 17 years with limited access to knowledge centres and therefore require
encouragement. Having understood their capabilities and capacities, the evaluators should
provide them with constructive inputs and positive feed-back.
ii) Evaluators should appreciate and value the efforts, innovativeness and confidence of the
participating child scientists and ensure that their honest assessment work as a guiding light
for future endeavours of the child scientists and each one goes back motivated,
intellectually rich and more confident.
iii) Evaluators should evaluate the projects on the basis of subject matter and scientific content
and are not influenced by the gadgetry used or oratory skills of the participants. They
should avoid unwarranted comments and also avoid comparing the works of the child
scientists with those carried out by senior members or scientists.
iv) Evaluators should avoid being any source of distraction to the child scientists while
presentation is going on and do not take the interactions with the participants as a test what
the participating child does not know, rather, they make efforts to know what the child
scientist know about the subject area.
1.15.3. Model consolidated Evaluation Sheet For District level
Sl. No. Criteria Max. marks
Written Report
Oral Presentation
Total
1. Originality of idea and concept 10
2. Relevance of the project to the theme
10
3. Understanding of the issue 15
4. Data collection & analysis 15
5. Experimentation/validation 10
6. Interpretation and Problem solving attempt
10
7. Team work 10
8. Background correction 10

15
9. Oral presentation/ written report (as applicable)
10
Total: 100
For State Level
Sl. No. Criteria Max. marks
Written Report
Oral Presentation
Total
1. Originality of idea and concept 5
2. Relevance of the project to the theme
5
3. Understanding of the issue 15
4. Data collection & analysis 15
5. Experimentation/validation 10
6. Interpretation and Problem solving attempt
15
7. Team work 5
8. Follow up action plan 10
9. Oral presentation/ written report (as applicable)
10
10. Improvement over the previous level suggested
10
Total: 100
1.16. Organisers
NCSC is organized nationally by the National Council for Science and Technology
Communication (NCSTC), Department of Science and Technology Government of India, with
active support from NCSTC-Network as a national co-coordinating Agency. NCSTC-Network is
a registered Society, comprising of 76 organisations (Annexure-), Government and Non-
Government, spread over all the states and Union Territories of India, who are working for
science popularization. To organize CSC at the State Level, each State/Union Territory has a
coordinating body viz. State Co-coordinating Agency, which is a member of the NCSTC-
Network (see list at Annexure- ).
1.16.1. Role of District Coordinating Agency, District Coordinators and
District Academic Coordinators
i) To agree in writing, on being selected, to act as a District Coordinating Agency and abide
by rules and regulations prescribed in this Activity Guide Book and also by the State
Coordinating Agency;
ii) To constitute a District Organizing Committee (DOC) and a District Academic Committee
(DAC) , minimum 7 (seven) members can be selected from teachers, activists, ex-child
scientists, government officials, officials of the local bodies etc. and send the lists to the

16
State Coordinator by the date specified. The District Coordinators shall act as the Member-
Secretary of both the Committees;
iii) To register groups of children (2 to 5 in one group) in Form A and provide them with
necessary reference materials, kits and guidance. Number of groups registered to be
intimated to the State Coordinator by the date specified;
iv) While registering the District Co-coordinator should be assured that, the age of the child
scientist falls within the age as on 31st December of the calendar year. If need be a copy of
the age-certificate may be retained by the District Co-coordinator, to avoid any confusion at
later stages. Even while participating at the National Congress, the State Co-coordinator
may also keep a copy of the certificate.
v) To select schools from rural and urban area in an equal ratio;
vi) To organize District level Teachers’ Orientation Workshops with the help of the State
Coordinators;
vii) To interact with local scientist and arrange for their periodic interaction with the registered
group of children, if required;
viii) Try to involve at least 50 schools and 250 numbers of project in the district including those
from informal education system
ix) Organize District level Congress, Orientation of Evaluators in consultation with the State
Coordinators;
x) To submit Feed-back Reports on all activities, containing names of schools and number of
projects at district level and follow up action taken on projects likely to become part of
community action, photocopies of all Registration/Attendance Sheets for all
Workshops/Meetings, Evaluation Sheets in original, samples of certificates issued,
mementos presented to child scientists, photo-documentation etc. related to CSC at the
District level to the State Coordinator in the manner and by the date specified;
xi) To maintain a Bank Account and maintain Accounts at the District level and submit an
audited Receipts & Payment Account to the State Coordinators by the date and in the
manner specified;
xii) To maintain infrastructural facilities, including electronic communication facility such as
internet connectivity, fax etc.
xiii) To arrange review and mentoring of the projects selected for presentation at the State Level
NCSC.
1.16.2. Role of State Coordinating Agency, State Coordinators and State
Academic Coordinators
The State Coordinating Agency shall have the overall responsibility for the implementation of
NCSC at the State level. The specific responsibilities shall be –
i) Constitute a State Organizing Committee (SOC) and a State Academic Committee (SAC)
where minimum 7 (seven) members to be selected from teachers, activists, ex-child

17
scientists, government officials, officials of the local bodies, Network members in the State
and other non-Network organizations specifically active in a region in the State, where the
State Coordinating Agency does not have a reach). Submit the list of SOC, SAC, DOC and
DAC along with project proposal for districts and state. The State Coordinators shall act as
the Member-Secretary of both the Committees;
ii) To constitute Regional Coordinators, if found necessary in case of big States and to involve
SCERT, DIET, IRIS and organizations working with handicapped children/elder citizens and
media representatives. Distribution of geographical area for organizational purposes etc.
will be the prerogative of the State Coordinators;
iii) To locate individuals, schools specially interested in other curricular activities;
iv) To select District Coordinating Agencies and obtain consent letter from the respective
organization, where they have to agree to abide by the guideline of CSC and willing to
follow the guideline of NCSTC,DST; NCSTC – Network and respective State Coordinating
agency of the state.
v) Organize Orientation Workshops of District Coordinators and teachers with the help of
subject experts;
vi) To coordinate translation of the Activity Guide Book to be used by the children, in local
language and make them available to the District Coordinators;
vii) To maintain a Bank Account and maintain Accounts at the State level and submit an
audited Receipts & Payment Account to the funding agencies within three months of the
date of event with a Project Completion Report and a Utilization Certificate in the manner
prescribed;
viii) To submit Feed-back Reports on all activities, samples of certificates issued, mementos
presented to child scientists, photo-documentation etc. related to CSC at the State level to
the funding agency in the manner and by the date specified;
ix) To remit funds to District Coordinating Agencies by account payee cheques;
x) To form linkages with Testing and Monitoring facilities available in the State (with NGOs as
well as Government), Municipal Corporations and other local bodies etc. to help children in
better implementation (information collection/sample testing) of their activities( Identity
Cards may be issued to children registered for activities) through District Coordinators/State
Coordinator;
xi) To arrange review and mentoring of the projects selected for presentation at the NCSC.
xii) To ensure that Evaluation sheets, both written and oral are forwarded to the next higher
level, i.e. from district to State and from State to National level, else the district / State
contingent might not be registered during State/National level CSC.
xiii) State Academic Coordinators should work in close association with the district/State
Coordinators for arranging evaluation process and shall make an effort to send one
member from State Academic Committee as an Observer to the district level CSC. His/her
signature on the selection list is mandatory. The entire process of evaluation is to be
supervised by the Observer. Decision of the State Academic Committee shall be final word
on the selection.

18
1.16.3. Note for State Coordinators and District Coordinators
i) The age limits for participation must not be less than 10 years and more than 17 years on
December 31 of the year.
ii) Relatives of District Coordinators, District Academic Coordinators, State Coordinators and
State Academic Coordinators will not be selected for National CSC. They may leave the
post for the year if participation of the ward is desired.
iii) Any child will not participate more than twice in national CSC as Group Leader – once from
each age group.
iv) Two selected projects (one from lower age group and one from upper age group) from each
state to ‘Kishor Vigyani Sanmelayan’ of Indian Science Congress held every year during
January 3-7.
v) Technology Entrepreneurship Promotion Program selected CSC projects meeting the
following criteria may apply for support under this program –
• The idea should be new/novel,
• The idea should have potentiality for translating it into working model/ prototype/process,
• The idea should be based on known scientific principle,
• The idea should have commercial feasibility/ technical viability.
vi) Proposals from individual innovators to convert an original idea / invention / know-how into
working prototype / processes. These proposals can be made by individuals or jointly with
any sponsoring organizations.
Selected projects will be provided by financial support to undertake the above developments, patent
support and guidance, scientific / technical consultancy, fabrication assistance, market information and
networking with related research lab/ institutes as required.
For detailed information you may contact:
Techno-entrepreneur Promotion Programme,
Ministry of Science & Technology, Post Bag No. 66, Hauz Khas,
New Delhi -10016.

19
For further details one may contact:
Dr B.P. Singh
Head, NCSTC
Dr D. K. Pandey
Scientist E
and
National Programme Coordinator of NCSC
National Council for Science and Technology Communication (NCSC),
Department of Science and Technology
Technology Bhavan, New Mehrauli Road, New Delhi – 110016,
Email ID: [email protected];
Telephone no:01126535564/26590251
Prof. S.P. Verma
Chairperson, NCSTC-Network
Mobile – 09835247590
Email- [email protected]
Mr R.S. Raghuvanshi
General Secretary, NCSTC Network
NCSTC-Network , E-56, Pandav Nagar, New Delhi - 110091
Email – [email protected]
Telephone – 011-22799236
Mobile- 09868404002
Or
Dr. Neelam Gulati Sharma
Dr. Kulbir Singh Bath
Punjab State Council for Science & Technology
Sector-26
Chandigarh

20
Part Part Part Part –––– IIIIIIII
Focal theme Focal theme Focal theme Focal theme
and suband suband suband sub----theme theme theme theme
21
2.0. Focal theme and Sub-themes
2.1. Focal theme: “Energy: Explore, Harness and Conserve”
Energy is considered as a crucial input parameter for day to day work and for economic
development of a country. Per capita energy consumption is one of the key deciding factors of
the level of well-being of any society or for any country. It is also referred through the
relationship between economic growths with energy consumption.
In reality, economic development of every region or country largely depends on how its energy
requirements are satisfied. Every production process has certain amount of energy requirement.
Hence, availability of quality energy sources is crucial for overall scientific and technological
progress of any country.
Energy is central to sustainable development and poverty reduction efforts. It affects all aspects
of development - social, economic, and environmental - including livelihoods, access to water,
agricultural productivity, health, population levels, education and gender-related issues. None of
the Millennium Development Goals (MDGs) can be met without major improvement in the
quality and quantity of energy services in developing countries.
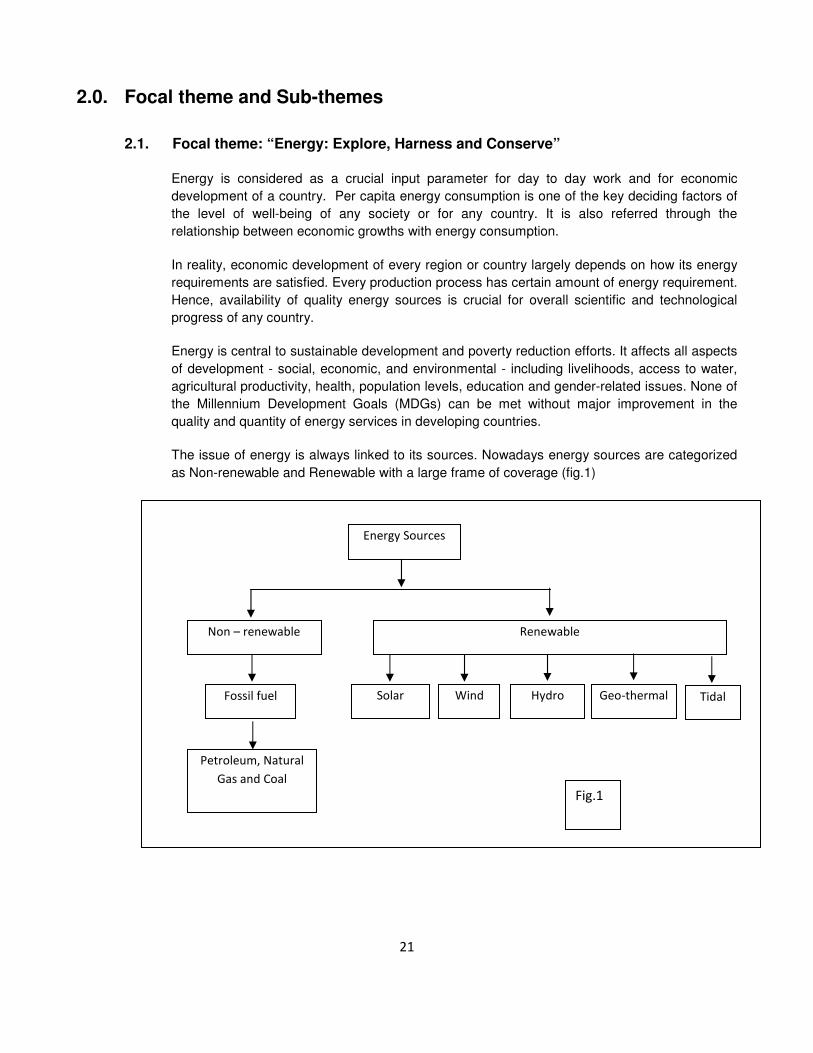
The issue of energy is always linked to its sources. Nowadays energy sources are categorized
as Non-renewable and Renewable with a large frame of coverage (fig.1)
Fig.1
Non – renewable
Fossil fuel
Petroleum, Natural
Gas and Coal
Renewable
Solar Wind Hydro Geo-thermal Tidal
Energy Sources
22
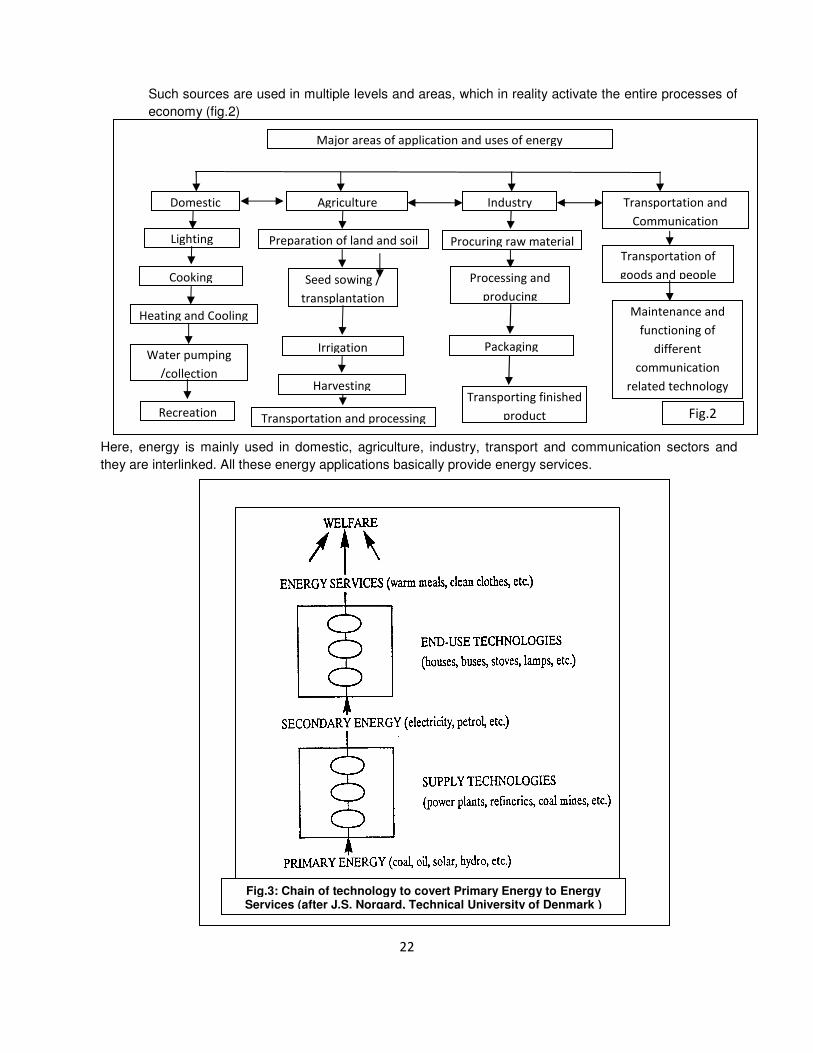
Such sources are used in multiple levels and areas, which in reality activate the entire processes of
economy (fig.2)
Here, energy is mainly used in domestic, agriculture, industry, transport and communication sectors and
they are interlinked. All these energy applications basically provide energy services.
Fig.3: Chain of technology to covert Primary Energy to Energy Services (after J.S. Norgard, Technical University of Denmark )
Fig.2
Major areas of application and uses of energy
Domestic Agriculture Industry Transportation and
Communication
Cooking
Lighting
Heating and Cooling
Recreation
Water pumping
/collection
Preparation of land and soil
Seed sowing /
transplantation
Harvesting
Irrigation
Transportation and processing
Processing and
producing
Procuring raw material
Packaging
Transporting finished
product
Transportation of
goods and people
Maintenance and
functioning of
different
communication
related technology

23
Such processes are basically effective in a way where energy is input to the technology which
produces services as outputs (fig.3). So, efficiency of the technology in use and its purposes to
produce services are important which determine the situation of energy sufficiency. In these
perspectives, to achieve energy sufficiency and efficiency for suitability each one is interlinked through
proper value setting, management principles, technological efficiency with policy measures (fig.4).
In the above perspectives Sustainable energy issues are reflected as follows:
Sustainable energy is the sustainable provision of energy that meets the needs of the present
without compromising with the ability of future generations to meet their needs. Technologies
that promote sustainable energy include renewable energy sources, such as hydroelectricity,
solar energy, wind energy, wave power, geothermal energy, and tidal power, and also
technologies designed to improve energy efficiency
(http://www.undp.org/content/undp/en/home/ourwork/environmentandenergy/focus_areas/sustai
nable-energy.html).
Energy efficiency and renewable energy are said to be the twin pillars of sustainable energy.
Some ways in which sustainable energy has been defined are:
• "Effectively, the provision of energy that meets the needs of the present without
compromising the ability of future generations to meet their own needs. Sustainable Energy
has two key components: renewable energy and energy efficiency."
• "Dynamic harmony between equitable availability of energy-intensive goods and services to
all people and the preservation of the earth for future generations." And, "the solution will lie
in finding sustainable energy sources and more efficient means of converting and utilizing
energy."
• "Any energy generation, efficiency & conservation source where resources are available to
enable significant portion of energy generation in long term.
Fig.4
Prioritization of need
Assessment of stock
and carrying capacity
Selection of sources
and its uses
Wise use
Supply sided
management
Demand side
management
Meeting present
energy needs
without disturbing
its ability to meet
the future needs
Interlink of Energy Sufficiency, Efficiency and Sustainability
Renewable Decentralize Access to all
Energy sufficiency Energy Efficiency Sustainability
24
• "Energy which is replenished within a human lifetime and causes no long-term damage to
the environment."
• Energy efficiency remains a cost effective way of improving the environmental impact of
energy use, increasing security, improving competitiveness and providing affordable
services. ("The Twin Pillars of Sustainable Energy: Synergies between Energy Efficiency
and Renewable Energy Technology and Policy". www.aceee.org.)
Energy sufficiency is some time considered as normative concept to make differences
between need and greed and prefer for the best. However, the growing concern for climate
change and energy security now means that energy sufficiency is something that warrants
serious consideration. It looks beyond technical energy efficiency measures and address the
challenging issue of curbing consumer demand for energy services in an ethically acceptable
fashion. It also implies a need to recognize limits and to establish acceptable minimum
standards for energy services. (Derby Sarah “Enough is as good as a feast- sufficiency as
policy” ECEEE-2007, Summer Study, Saving Energy- Just do it! P. 111-119).
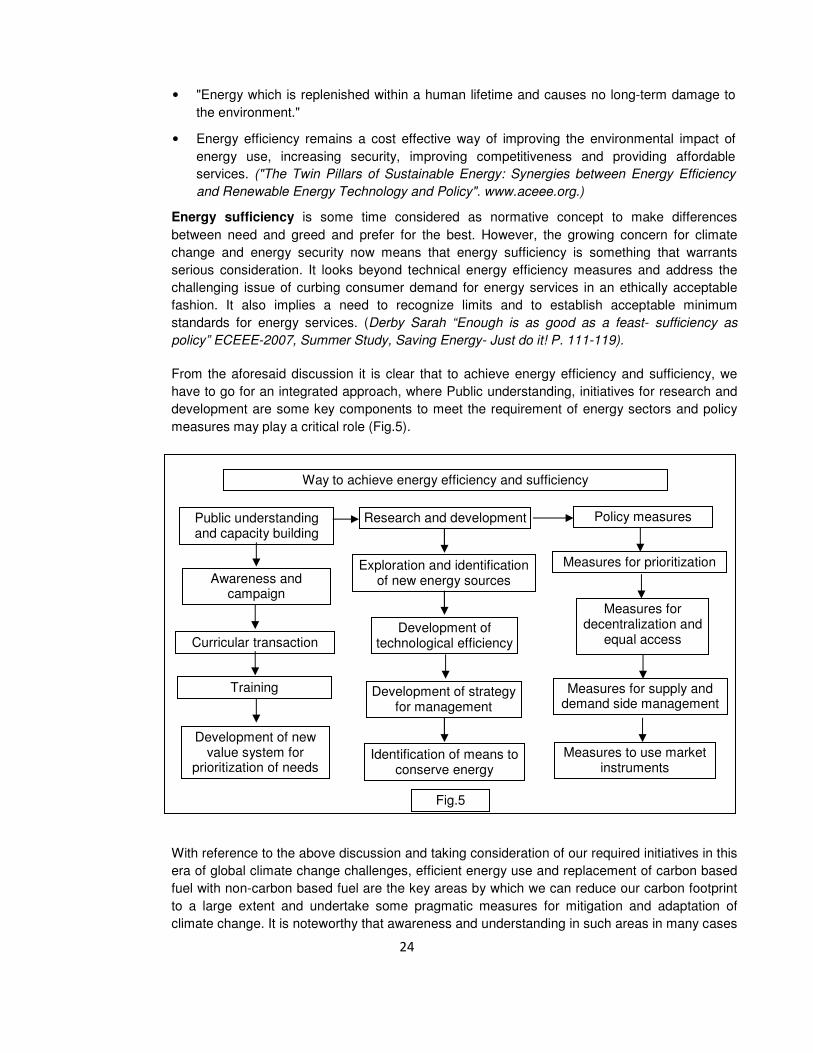
From the aforesaid discussion it is clear that to achieve energy efficiency and sufficiency, we
have to go for an integrated approach, where Public understanding, initiatives for research and
development are some key components to meet the requirement of energy sectors and policy
measures may play a critical role (Fig.5).
With reference to the above discussion and taking consideration of our required initiatives in this
era of global climate change challenges, efficient energy use and replacement of carbon based
fuel with non-carbon based fuel are the key areas by which we can reduce our carbon footprint
to a large extent and undertake some pragmatic measures for mitigation and adaptation of
climate change. It is noteworthy that awareness and understanding in such areas in many cases
Fig.5
Way to achieve energy efficiency and sufficiency
Public understanding and capacity building
Awareness and campaign
Curricular transaction
Training
Research and development
Exploration and identification of new energy sources
Development of technological efficiency
Identification of means to conserve energy
Development of new value system for
prioritization of needs
Development of strategy for management
Policy measures
Measures for prioritization
Measures for decentralization and
equal access
Measures for supply and demand side management
Measures to use market instruments
25
encourage us for taking self initiatives for conservation, rational uses and strategies for
enhancing efficiency. Therefore, “Energy: Explore, Harness and Conserve!” has been
proposed as the focal theme for the CSC of 2012 and 2013, with an expectation that young
minds will be able to realize the need, take different initiatives to explore, identify the energy
resources and find ways to harness it, identify approaches to achieve optimum use through
enhancing energy efficiency and energy conservation along with creating awareness among the
masses through their project works.
2.2. Sub-themes
2.2.1. Energy Resources:
Energy inputs are the critical components of national economic activity of our country, which
contributes in increasing the gross domestic product (GDP) at an average annual rate of over
7% since 2004. However, it is believed by all concerned around the world that the conventional
sources of energy, particularly the fossil fuels, will get exhausted by the turn of this century. It is,
therefore, essential to identify the different energy resources, their potential reserves, and
sustainability.
All the energy sources are divided into two groups- Renewable and Non- renewable.
Renewable Energy:
Renewable energy includes solar, wind, hydel, bio-mass and geothermal resources.
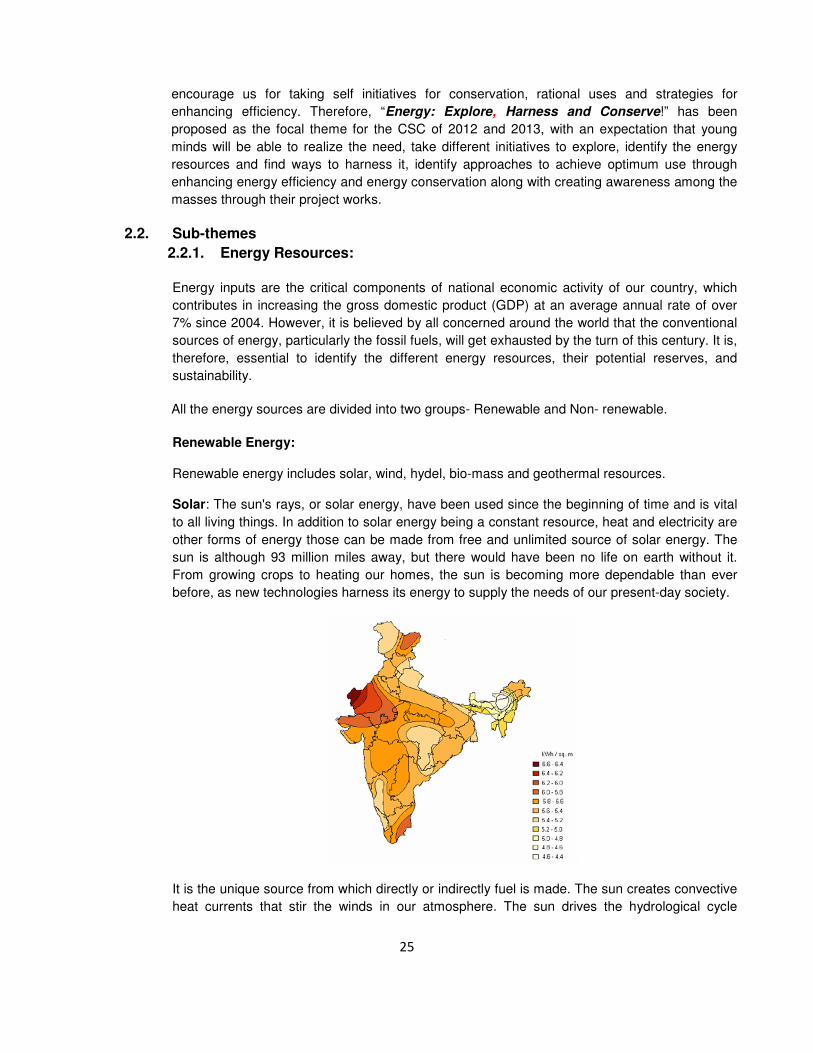
Solar: The sun's rays, or solar energy, have been used since the beginning of time and is vital
to all living things. In addition to solar energy being a constant resource, heat and electricity are
other forms of energy those can be made from free and unlimited source of solar energy. The
sun is although 93 million miles away, but there would have been no life on earth without it.
From growing crops to heating our homes, the sun is becoming more dependable than ever
before, as new technologies harness its energy to supply the needs of our present-day society.
It is the unique source from which directly or indirectly fuel is made. The sun creates convective
heat currents that stir the winds in our atmosphere. The sun drives the hydrological cycle
26
causing water to evaporate and condense. Plants also process radiant energy through a
process called photosynthesis.
India is endowed with rich solar energy resource since it is located in the equatorial sun belt of
the earth. Theoretically, India receives about 5000 trillion kWh solar radiations (power) with
about 300 clear sunny days in a year. The daily average solar energy incident over India varies
from 4 to 7 kWh/m2 with about 2,300–3,200 sunshine hours per year, depending upon location,
which is far more than the current total energy consumption. While India has technology and
sunlight in abundance, and while these are key ingredients for a green energy future, it is
daunting to think solar thermal and solar electric power can increase their share of energy
production from today’s negligible percentage to provide all needed growth in energy production
within a generation. For conventional human usage, sunlight must be captured and converted.
Solar-powered devices are the most direct way to transform raw thermal energy into electricity.
Wind: Winds are caused by the uneven heating of the atmosphere by the sun, the irregularities
of the earth's surface, and rotation of the earth. The earth’s surface is made of different types of
land and water. These surfaces absorb sun’s heat at different rates, giving rise to the
differences in temperature and subsequently to winds. During the day, the air above the land
gets heated up more quickly than the air over water. The warm air over the land expands and
rises, and the heavier, cooler air rushes in to take its place, creating winds. At night, the winds
are reversed because the air cools more rapidly over land than over water. In the same way, the
large atmospheric winds that circle the earth are created because the land near the earth's
equator is heated more by the sun than the land near the North and South Poles. From ancient
times till nineteenth century, the manufacture and use of sailing ships determined the economic
and political power of nations. The first known use of sailing ships was by the Egyptians in 2800
B.C. Further, the first uses of the wind for mechanical power appear to have been developed in
Persia where water was pumped for irrigation by windmills. Between the seventh and tenth
centuries, windmills were firmly established in Persia. By the thirteenth century, windmills were
common in Europe, with significant advances being made by the Dutch and the English. Wind
mills were evolved only for grinding grain and water pumping purposes. But at present the wind
turbines convert the kinetic energy of the moving wind into electricity. Wind Energy, like solar
energy, is free resource, but is much intermittent than the solar. Wind speeds may vary within
minutes and affect the power generation and in cases of high speeds it may result in
overloading of generator. The range of wind speeds that are usable by a particular wind turbine
for electricity generation is called productive wind speed. The power available from wind is
proportional to cube of the wind's speed. So as the speed of the wind falls, the amount of
energy that can be received from it falls very rapidly. On the other hand, as the wind speed
rises, so the amount of energy in it rises very rapidly. However, productive wind speed ranges
between 4 m/sec to 35 m/sec. The minimum prescribed speed for optimal performance of a
wind mill is about 6 m/s. Wind power potential of a place is mostly assessed considering wind
power density higher than 200 W/m2 at 50 m height.
It is a known fact that wind high above the ground is stronger than winds near the ground. On
average a five-fold increase in elevation, say raising the height of the wind machine from 10 feet
to 50 feet, the power of available wind will be double. That’s why wind turbines are placed on
tall towers and is often located on mountains or hilltops. On the other hand, in our country ‘on-
shore’ potential for utilization of wind energy for electricity generation is of the order of 65,000
MW. India is also blessed with 7517km of coastline and its territorial waters extend up to 12
nautical miles into the sea. This unexploited resource availability has the potential to sustain the
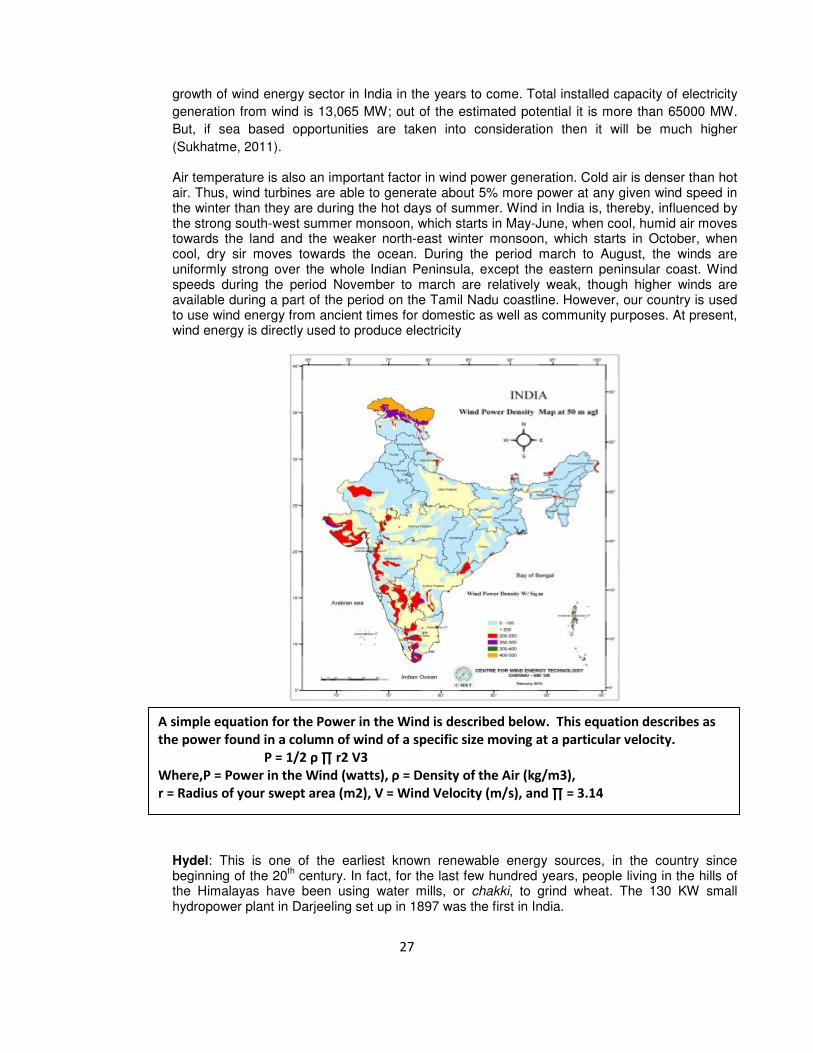
27
growth of wind energy sector in India in the years to come. Total installed capacity of electricity
generation from wind is 13,065 MW; out of the estimated potential it is more than 65000 MW.
But, if sea based opportunities are taken into consideration then it will be much higher
(Sukhatme, 2011).
Air temperature is also an important factor in wind power generation. Cold air is denser than hot air. Thus, wind turbines are able to generate about 5% more power at any given wind speed in the winter than they are during the hot days of summer. Wind in India is, thereby, influenced by the strong south-west summer monsoon, which starts in May-June, when cool, humid air moves towards the land and the weaker north-east winter monsoon, which starts in October, when cool, dry sir moves towards the ocean. During the period march to August, the winds are uniformly strong over the whole Indian Peninsula, except the eastern peninsular coast. Wind speeds during the period November to march are relatively weak, though higher winds are available during a part of the period on the Tamil Nadu coastline. However, our country is used to use wind energy from ancient times for domestic as well as community purposes. At present, wind energy is directly used to produce electricity
Hydel: This is one of the earliest known renewable energy sources, in the country since beginning of the 20
th century. In fact, for the last few hundred years, people living in the hills of
the Himalayas have been using water mills, or chakki, to grind wheat. The 130 KW small hydropower plant in Darjeeling set up in 1897 was the first in India.
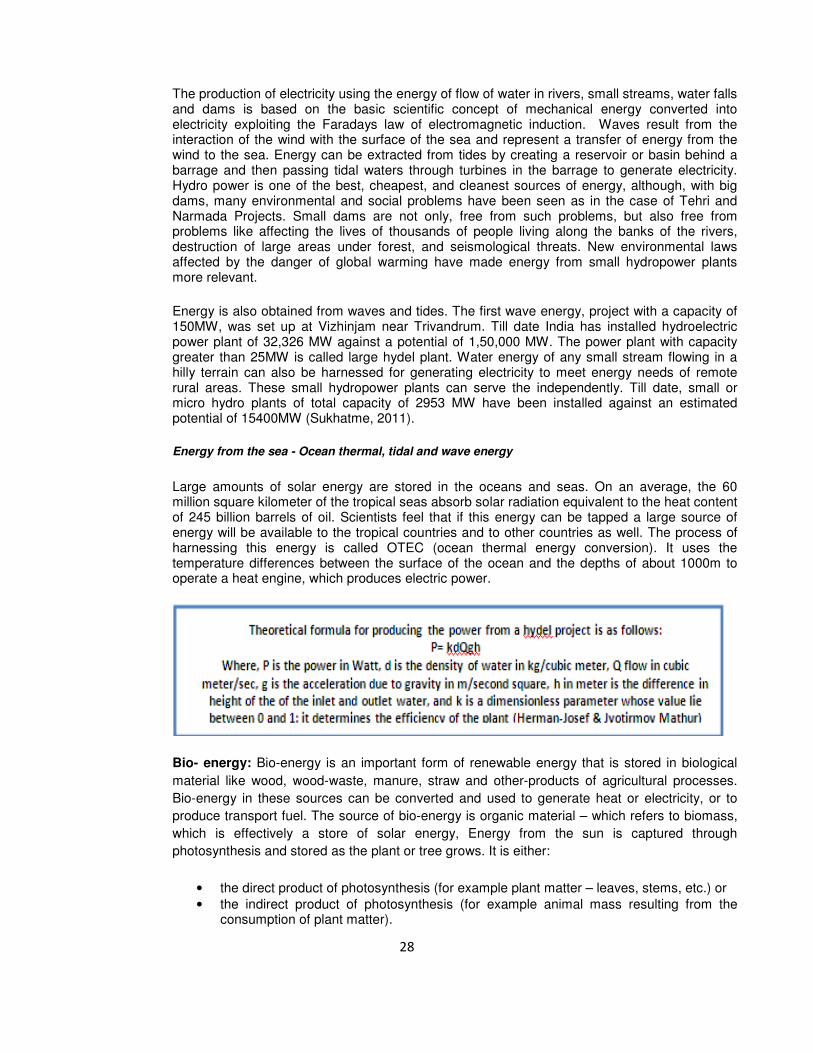
A simple equation for the Power in the Wind is described below. This equation describes as
the power found in a column of wind of a specific size moving at a particular velocity.
P = 1/2 ρ ∏ r2 V3
Where,P = Power in the Wind (watts), ρ = Density of the Air (kg/m3),
r = Radius of your swept area (m2), V = Wind Velocity (m/s), and ∏ = 3.14
28
The production of electricity using the energy of flow of water in rivers, small streams, water falls and dams is based on the basic scientific concept of mechanical energy converted into electricity exploiting the Faradays law of electromagnetic induction. Waves result from the interaction of the wind with the surface of the sea and represent a transfer of energy from the wind to the sea. Energy can be extracted from tides by creating a reservoir or basin behind a barrage and then passing tidal waters through turbines in the barrage to generate electricity. Hydro power is one of the best, cheapest, and cleanest sources of energy, although, with big dams, many environmental and social problems have been seen as in the case of Tehri and Narmada Projects. Small dams are not only, free from such problems, but also free from problems like affecting the lives of thousands of people living along the banks of the rivers, destruction of large areas under forest, and seismological threats. New environmental laws affected by the danger of global warming have made energy from small hydropower plants more relevant.
Energy is also obtained from waves and tides. The first wave energy, project with a capacity of 150MW, was set up at Vizhinjam near Trivandrum. Till date India has installed hydroelectric power plant of 32,326 MW against a potential of 1,50,000 MW. The power plant with capacity greater than 25MW is called large hydel plant. Water energy of any small stream flowing in a hilly terrain can also be harnessed for generating electricity to meet energy needs of remote rural areas. These small hydropower plants can serve the independently. Till date, small or micro hydro plants of total capacity of 2953 MW have been installed against an estimated potential of 15400MW (Sukhatme, 2011).
Energy from the sea - Ocean thermal, tidal and wave energy
Large amounts of solar energy are stored in the oceans and seas. On an average, the 60 million square kilometer of the tropical seas absorb solar radiation equivalent to the heat content of 245 billion barrels of oil. Scientists feel that if this energy can be tapped a large source of energy will be available to the tropical countries and to other countries as well. The process of harnessing this energy is called OTEC (ocean thermal energy conversion). It uses the temperature differences between the surface of the ocean and the depths of about 1000m to operate a heat engine, which produces electric power.
Bio- energy: Bio-energy is an important form of renewable energy that is stored in biological
material like wood, wood-waste, manure, straw and other-products of agricultural processes.
Bio-energy in these sources can be converted and used to generate heat or electricity, or to
produce transport fuel. The source of bio-energy is organic material – which refers to biomass,
which is effectively a store of solar energy, Energy from the sun is captured through
photosynthesis and stored as the plant or tree grows. It is either:
• the direct product of photosynthesis (for example plant matter – leaves, stems, etc.) or
• the indirect product of photosynthesis (for example animal mass resulting from the consumption of plant matter).
29
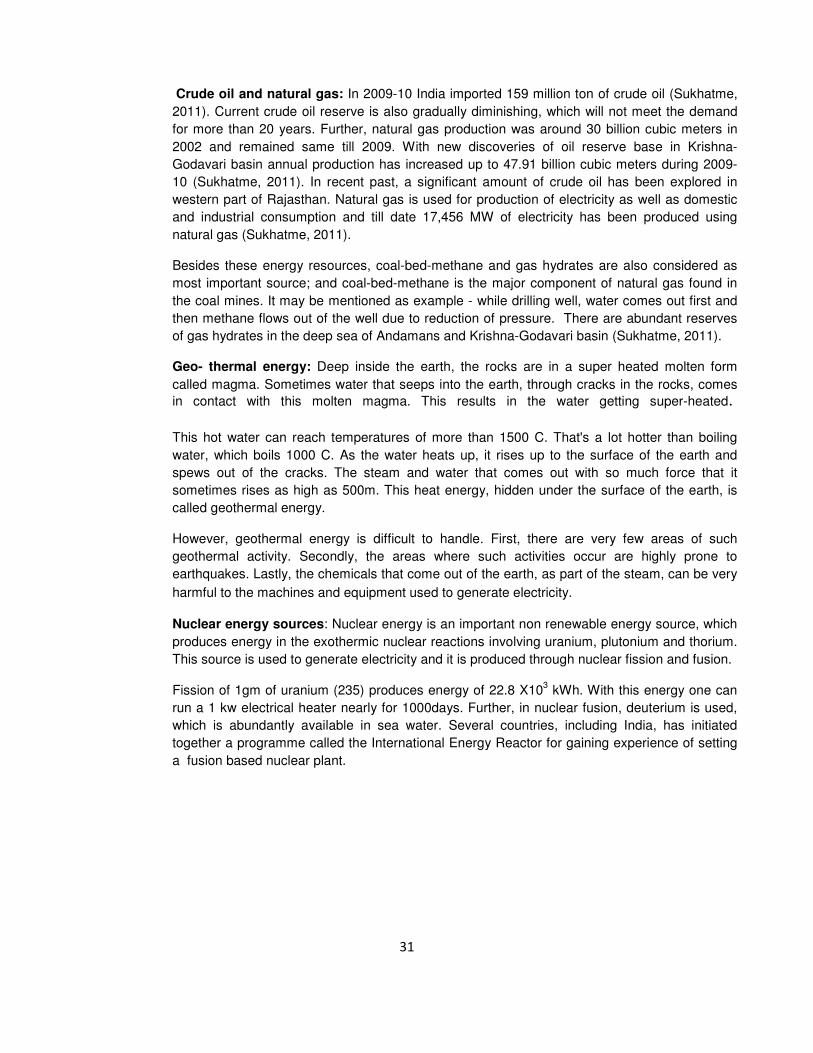
Biomass is defined as the total mass of living organisms in a given area or of a given species is
usually expressed as dry weight. Organic matter consisting of or recently derived from living
organisms (especially regarded as fuel) excluding peat. Biomass includes products, by-
products and waste derived from such material. Cellulosic biomass is biomass from cellulose,
the primary structural component of plants and trees (IPCC 2007). An alternative name for
biomass used to produce bioenergy is a “feedstock.” The main categories of feedstock are: oil
seed crops, grains, sugar crops, and agricultural residues, trees, grasses, and algae (Pena
2008). The last category containing trees and grasses is commonly referred to as cellulosic
biomass. Different parts of the plants are used depending on the category of feedstock. For
example, fats and oils from oil seed crops, such as soybeans, can be directly converted to
biodiesel using the processes of transesterfication or hydro- treating. The possible products that
can be derived from biomass include biodiesel, ethanol, butanol, methane, hydrocarbons, and
natural oils, which can be further processed into any number of desirable fuels (Pena 2008).
Rotting garbage, and agricultural and human waste, all release methane gas—also called
"landfill gas" or "biogas."
(a) Bio fuel: About 51% of solar energy reached on the earth can be converted into bio-fuel energy by green plants. The Rural people of India depend mostly on fuel-wood for cooking but there is a great gap between demand and supply. India has a great scope for energy plantation on 70 million ha and can generate wood biomass to the tune of 560 million tones of fuel biomass. From the energy plantation on an average 4000 kcal/kg energy can be produced.
(b) Bio-ethanol: Bio-fuels are potential alternatives to the liquid fossil fuels as they can
directly be blended with petrol / diesel. Bio-fuels are of two types : alcohols (ethanol and
butanol) and diesel substitutes (bio-diesel and hydro-treated vegetable oils). Ethanol
produced from starch and sugar has remarkable characteristics of having high latent
heat of vaporization, high octane number, rating; emission of toxic compounds on
combustion is also low as compared to gasoline. Presently, approximately 1 million ton
against a potential of10 million ton is being produced in India. The raw materials used
for production of ethanol are cellulose available from wood, agricultural residue, waste
from paper industries, municipal solid waste etc.

30
(c ) Bio diesel: Bio diesel is another type of liquid fuel which is produced from non edible
tree seed’s oil. By the process of trans-esterification of these oils, glycerin and bio
diesel are produced. The potential of such resources in India is 20 million ton per year.
(d) Wood: Wood is considered humankind’s very first source of energy. Today it still is the
most important single source of renewable energy providing over 9% of the global
total primary energy supply. Wood energy is as important as all other renewable energy
sources altogether (hydro, geothermal, wastes, biogas, solar and liquid bio fuels). Fuel
wood and charcoal production is often the predominant use of woody biomass in
developing countries and economies in transition. A common hardwood has an energy
content of 14.89 mega joules per kilogram (6,388 BTU per pound), and 10.423 mega
joules recoverable if burned at 70% efficiency.
Bio-energy also includes human and animal energies. From ancient times the power vis-à-vis energies of these two resources were extensively used for wellbeing of the society. Till date more than 55% of the total cultivated area is still being tilled by draught animals. In India bullocks, buffaloes and camels are the major draught animals for field operations. Horses, mules, donkeys, yak and mithun are the pack animals for transport. We are also resourceful in human labour as well.
Non-renewable Energy Resources:
The non-renewable energy resources include fossil fuels viz. coal, lignite, crude oil as well as
natural gas along with fossil-fuel-like substances like coal-bed-methane, gas hydrates etc.
Nuclear energy is the other important non-renewable source which produces energy in
exothermic nuclear reactions involving uranium, plutonium and thorium.
Coal & lignite: India has 38,930 million ton reserve of lignite, called brown coal, but even then
we are to import coal to meet our deficit. In 2009- 10 around 73 million ton of coal was imported
(Sukhatme, 2011) and with the passage of time we have to import more and more coal to meet
our energy needs.
When coal is burnt in the presence of oxygen, carbon dioxide (CO2) is produced in an
exothermic chemical reaction, as shown below:
C + O2 → CO2 + Energy (Heat) .
It has been observed that burning of 1 kg coal yields 6150 Wh (22.14 MJ) of heat energy.
The carbon content of vegetation is surprisingly constant across a wide variety of tissue types and
species. Schlesinger (1991) noted that C content of biomass is almost always found to be between
45 and 50% (by oven-dry mass).In many applications, the carbon content of vegetation may be
estimated by simply taking a fraction of the biomass, say Where, C is carbon content by mass, and B is oven-dry biomass.
Ref: http://www.fao.org/forestry/17111/en/
31
Crude oil and natural gas: In 2009-10 India imported 159 million ton of crude oil (Sukhatme,
2011). Current crude oil reserve is also gradually diminishing, which will not meet the demand
for more than 20 years. Further, natural gas production was around 30 billion cubic meters in
2002 and remained same till 2009. With new discoveries of oil reserve base in Krishna-
Godavari basin annual production has increased up to 47.91 billion cubic meters during 2009-
10 (Sukhatme, 2011). In recent past, a significant amount of crude oil has been explored in
western part of Rajasthan. Natural gas is used for production of electricity as well as domestic
and industrial consumption and till date 17,456 MW of electricity has been produced using
natural gas (Sukhatme, 2011).
Besides these energy resources, coal-bed-methane and gas hydrates are also considered as
most important source; and coal-bed-methane is the major component of natural gas found in
the coal mines. It may be mentioned as example - while drilling well, water comes out first and
then methane flows out of the well due to reduction of pressure. There are abundant reserves
of gas hydrates in the deep sea of Andamans and Krishna-Godavari basin (Sukhatme, 2011).
Geo- thermal energy: Deep inside the earth, the rocks are in a super heated molten form
called magma. Sometimes water that seeps into the earth, through cracks in the rocks, comes
in contact with this molten magma. This results in the water getting super-heated.
This hot water can reach temperatures of more than 1500 C. That's a lot hotter than boiling
water, which boils 1000 C. As the water heats up, it rises up to the surface of the earth and
spews out of the cracks. The steam and water that comes out with so much force that it
sometimes rises as high as 500m. This heat energy, hidden under the surface of the earth, is
called geothermal energy.
However, geothermal energy is difficult to handle. First, there are very few areas of such
geothermal activity. Secondly, the areas where such activities occur are highly prone to
earthquakes. Lastly, the chemicals that come out of the earth, as part of the steam, can be very
harmful to the machines and equipment used to generate electricity.
Nuclear energy sources: Nuclear energy is an important non renewable energy source, which
produces energy in the exothermic nuclear reactions involving uranium, plutonium and thorium.
This source is used to generate electricity and it is produced through nuclear fission and fusion.
Fission of 1gm of uranium (235) produces energy of 22.8 X10³ kWh. With this energy one can
run a 1 kw electrical heater nearly for 1000days. Further, in nuclear fusion, deuterium is used,
which is abundantly available in sea water. Several countries, including India, has initiated
together a programme called the International Energy Reactor for gaining experience of setting
a fusion based nuclear plant.
32
2.2.1.1. Framework
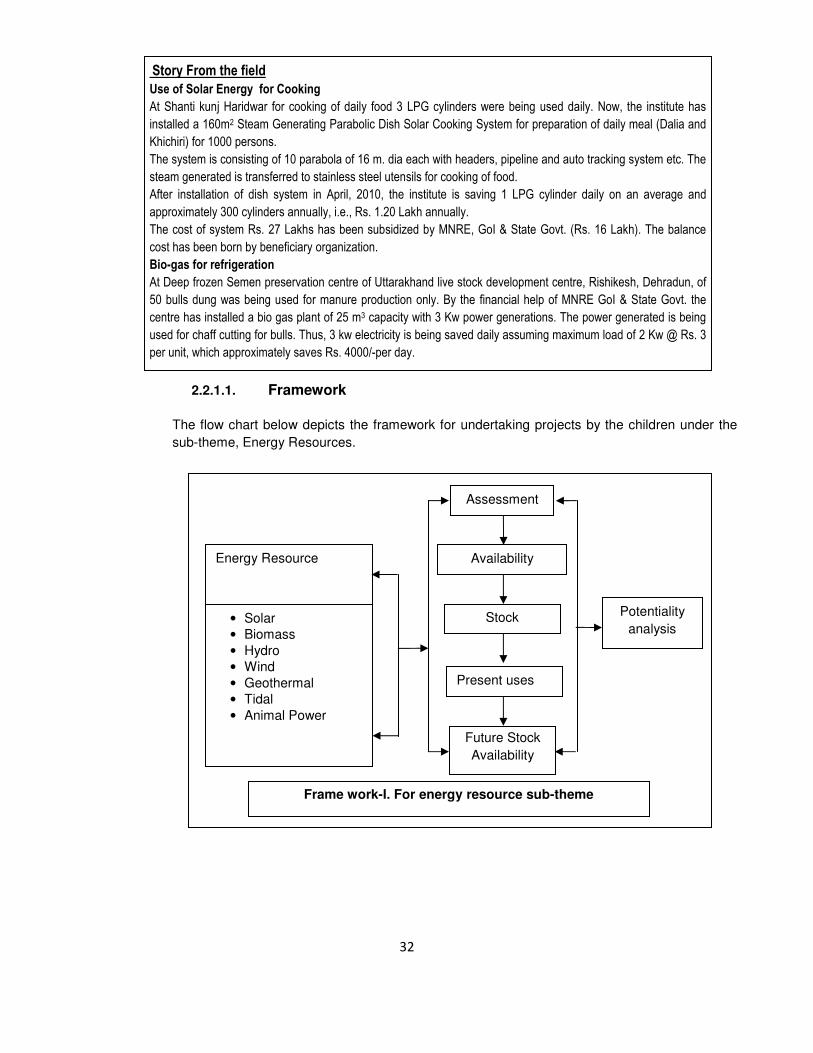
The flow chart below depicts the framework for undertaking projects by the children under the
sub-theme, Energy Resources.
Story From the field
Use of Solar Energy for Cooking
At Shanti kunj Haridwar for cooking of daily food 3 LPG cylinders were being used daily. Now, the institute has
installed a 160m2 Steam Generating Parabolic Dish Solar Cooking System for preparation of daily meal (Dalia and
Khichiri) for 1000 persons.
The system is consisting of 10 parabola of 16 m. dia each with headers, pipeline and auto tracking system etc. The
steam generated is transferred to stainless steel utensils for cooking of food.
After installation of dish system in April, 2010, the institute is saving 1 LPG cylinder daily on an average and
approximately 300 cylinders annually, i.e., Rs. 1.20 Lakh annually.
The cost of system Rs. 27 Lakhs has been subsidized by MNRE, GoI & State Govt. (Rs. 16 Lakh). The balance
cost has been born by beneficiary organization.
Bio-gas for refrigeration
At Deep frozen Semen preservation centre of Uttarakhand live stock development centre, Rishikesh, Dehradun, of
50 bulls dung was being used for manure production only. By the financial help of MNRE GoI & State Govt. the
centre has installed a bio gas plant of 25 m3 capacity with 3 Kw power generations. The power generated is being
used for chaff cutting for bulls. Thus, 3 kw electricity is being saved daily assuming maximum load of 2 Kw @ Rs. 3
per unit, which approximately saves Rs. 4000/-per day.
Energy Resource
Assessment
Availability
Stock
Present uses
Future Stock
Availability
• Solar
• Biomass
• Hydro
• Wind
• Geothermal
• Tidal
• Animal Power
Potentiality
analysis
Frame work-I. For energy resource sub-theme
33
2.2.1.2 Model Project
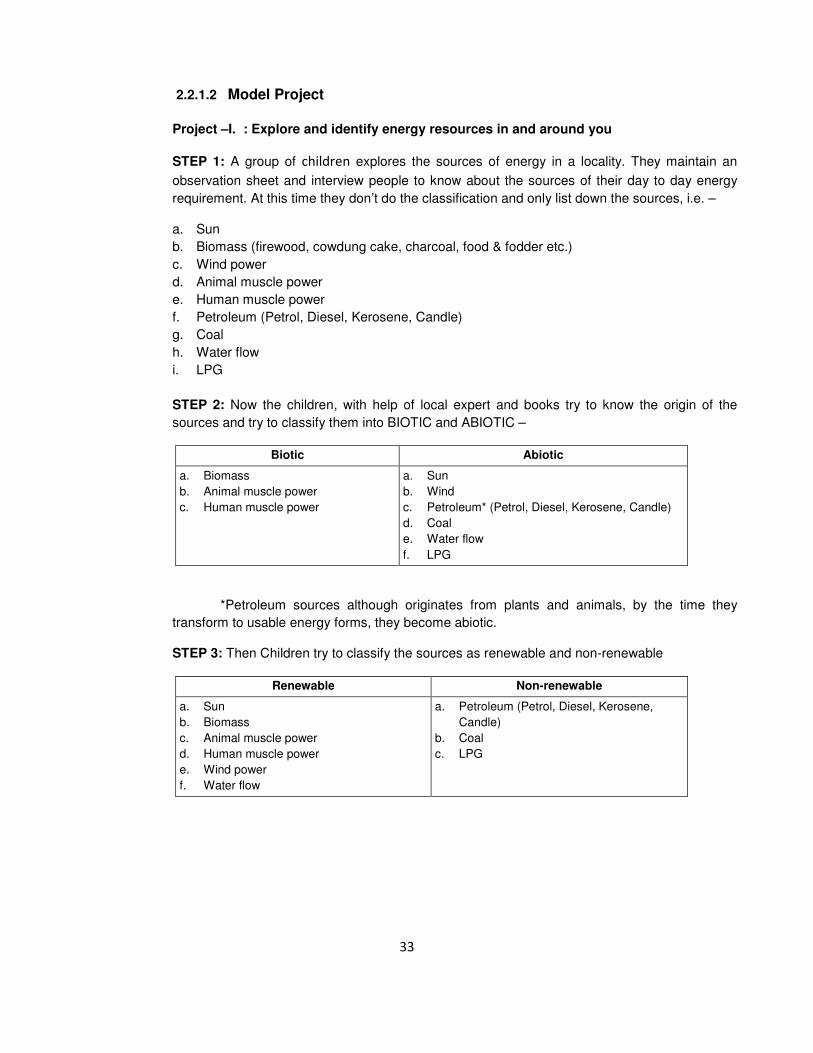
Project –I. : Explore and identify energy resources in and around you
STEP 1: A group of children explores the sources of energy in a locality. They maintain an
observation sheet and interview people to know about the sources of their day to day energy
requirement. At this time they don’t do the classification and only list down the sources, i.e. –
a. Sun
b. Biomass (firewood, cowdung cake, charcoal, food & fodder etc.)
c. Wind power
d. Animal muscle power
e. Human muscle power
f. Petroleum (Petrol, Diesel, Kerosene, Candle)
g. Coal
h. Water flow
i. LPG
STEP 2: Now the children, with help of local expert and books try to know the origin of the
sources and try to classify them into BIOTIC and ABIOTIC –
Biotic Abiotic
a. Biomass
b. Animal muscle power
c. Human muscle power
a. Sun
b. Wind
c. Petroleum* (Petrol, Diesel, Kerosene, Candle)
d. Coal
e. Water flow
f. LPG
*Petroleum sources although originates from plants and animals, by the time they
transform to usable energy forms, they become abiotic.
STEP 3: Then Children try to classify the sources as renewable and non-renewable
Renewable Non-renewable
a. Sun
b. Biomass
c. Animal muscle power
d. Human muscle power
e. Wind power
f. Water flow
a. Petroleum (Petrol, Diesel, Kerosene,
Candle)
b. Coal
c. LPG
34
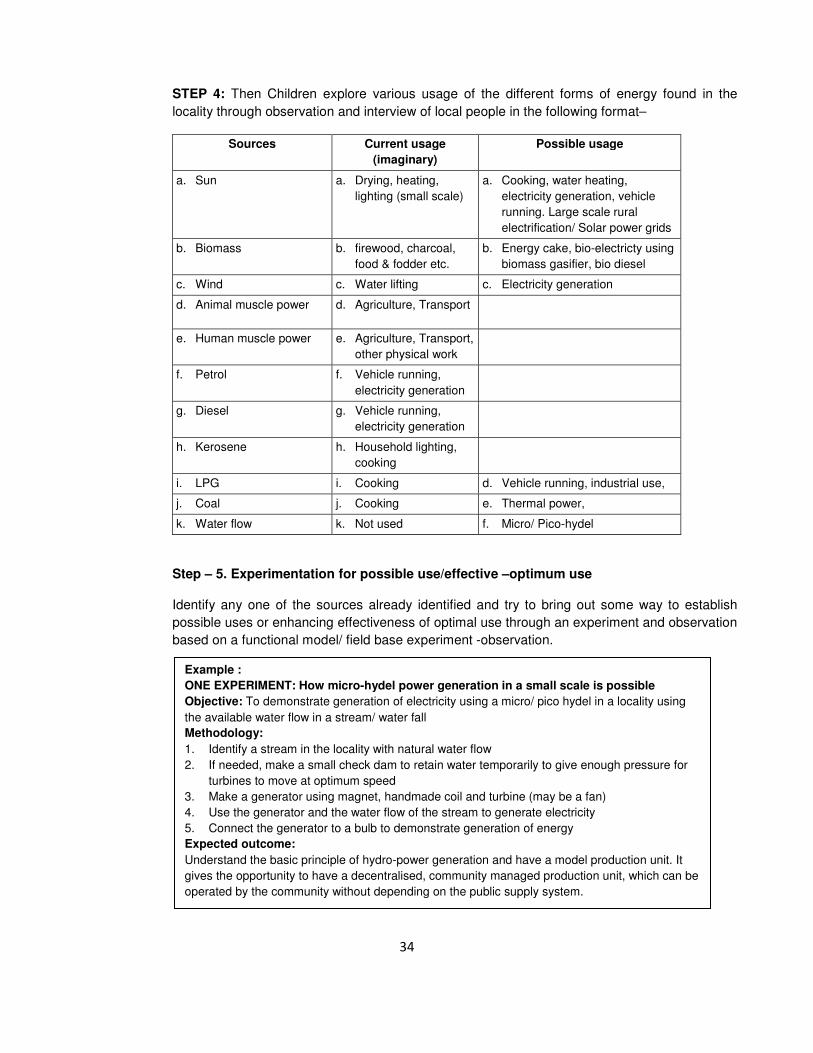
Example :
ONE EXPERIMENT: How micro-hydel power generation in a small scale is possible
Objective: To demonstrate generation of electricity using a micro/ pico hydel in a locality using
the available water flow in a stream/ water fall
Methodology:
1. Identify a stream in the locality with natural water flow
2. If needed, make a small check dam to retain water temporarily to give enough pressure for
turbines to move at optimum speed
3. Make a generator using magnet, handmade coil and turbine (may be a fan)
4. Use the generator and the water flow of the stream to generate electricity
5. Connect the generator to a bulb to demonstrate generation of energy
Expected outcome:
Understand the basic principle of hydro-power generation and have a model production unit. It
gives the opportunity to have a decentralised, community managed production unit, which can be
operated by the community without depending on the public supply system.
STEP 4: Then Children explore various usage of the different forms of energy found in the
locality through observation and interview of local people in the following format–
Sources Current usage
(imaginary)
Possible usage
a. Sun a. Drying, heating,
lighting (small scale)
a. Cooking, water heating,
electricity generation, vehicle
running. Large scale rural
electrification/ Solar power grids
b. Biomass b. firewood, charcoal,
food & fodder etc.
b. Energy cake, bio-electricty using
biomass gasifier, bio diesel
c. Wind c. Water lifting c. Electricity generation
d. Animal muscle power d. Agriculture, Transport
e. Human muscle power e. Agriculture, Transport,
other physical work
f. Petrol f. Vehicle running,
electricity generation
g. Diesel g. Vehicle running,
electricity generation
h. Kerosene h. Household lighting,
cooking
i. LPG i. Cooking d. Vehicle running, industrial use,
j. Coal j. Cooking e. Thermal power,
k. Water flow k. Not used f. Micro/ Pico-hydel
Step – 5. Experimentation for possible use/effective –optimum use
Identify any one of the sources already identified and try to bring out some way to establish
possible uses or enhancing effectiveness of optimal use through an experiment and observation
based on a functional model/ field base experiment -observation.
35
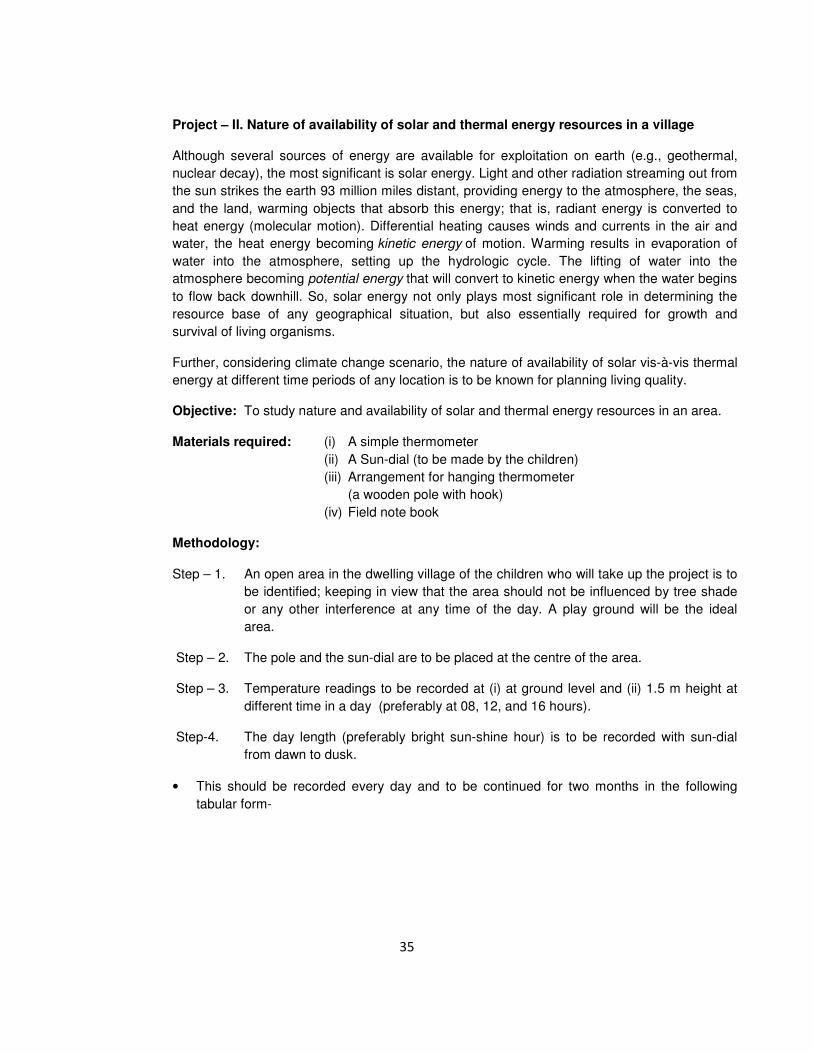
Project – II. Nature of availability of solar and thermal energy resources in a village
Although several sources of energy are available for exploitation on earth (e.g., geothermal,
nuclear decay), the most significant is solar energy. Light and other radiation streaming out from
the sun strikes the earth 93 million miles distant, providing energy to the atmosphere, the seas,
and the land, warming objects that absorb this energy; that is, radiant energy is converted to
heat energy (molecular motion). Differential heating causes winds and currents in the air and
water, the heat energy becoming kinetic energy of motion. Warming results in evaporation of
water into the atmosphere, setting up the hydrologic cycle. The lifting of water into the
atmosphere becoming potential energy that will convert to kinetic energy when the water begins
to flow back downhill. So, solar energy not only plays most significant role in determining the
resource base of any geographical situation, but also essentially required for growth and
survival of living organisms.
Further, considering climate change scenario, the nature of availability of solar vis-à-vis thermal
energy at different time periods of any location is to be known for planning living quality.
Objective: To study nature and availability of solar and thermal energy resources in an area.
Materials required: (i) A simple thermometer
(ii) A Sun-dial (to be made by the children)
(iii) Arrangement for hanging thermometer
(a wooden pole with hook)
(iv) Field note book
Methodology:
Step – 1. An open area in the dwelling village of the children who will take up the project is to
be identified; keeping in view that the area should not be influenced by tree shade
or any other interference at any time of the day. A play ground will be the ideal
area.
Step – 2. The pole and the sun-dial are to be placed at the centre of the area.
Step – 3. Temperature readings to be recorded at (i) at ground level and (ii) 1.5 m height at
different time in a day (preferably at 08, 12, and 16 hours).
Step-4. The day length (preferably bright sun-shine hour) is to be recorded with sun-dial
from dawn to dusk.
• This should be recorded every day and to be continued for two months in the following
tabular form-

36
Table:1. Diurnal air temperature (oC)
Day Date At ground level At 1.5 m
8 hr (A) 12 hr (B) 16 hr (C) 8 hr (A) 12 hr (B) 16 hr (C)
Mean
Table:2. Day-length/ Bright sunshine hour by days
Day Date Day length, hr Total radiation available* Energy, Watt/d
Mean
Table:3. Mean temperature at different day time and inversion layer
Day Mean Temperature (oC) at
ground level
(A+C)/2
Mean Temperature (oC)
at 1.5 m height
(A+C)/2
Inversion
Layer*
(C – A)
Note: * A layer of air that is warmer than the air below it is called an inversion layer (Gordon et
al.1980). Such a layer traps the surface air in place and prevents dispersion of any
pollutants it contains.
Table:4. Cumulative temperature
Day Date Mean temperature Cumulative temperature**
At ground level At 1.5 m
height
At ground level At 1.5 m
height
X1 y 1 x1 Y1
x2 y2 x1 + x2 = xa y1 + y2 = ya
x3 y3 xa + x3 = xb ya + y3 = yb
Total
37
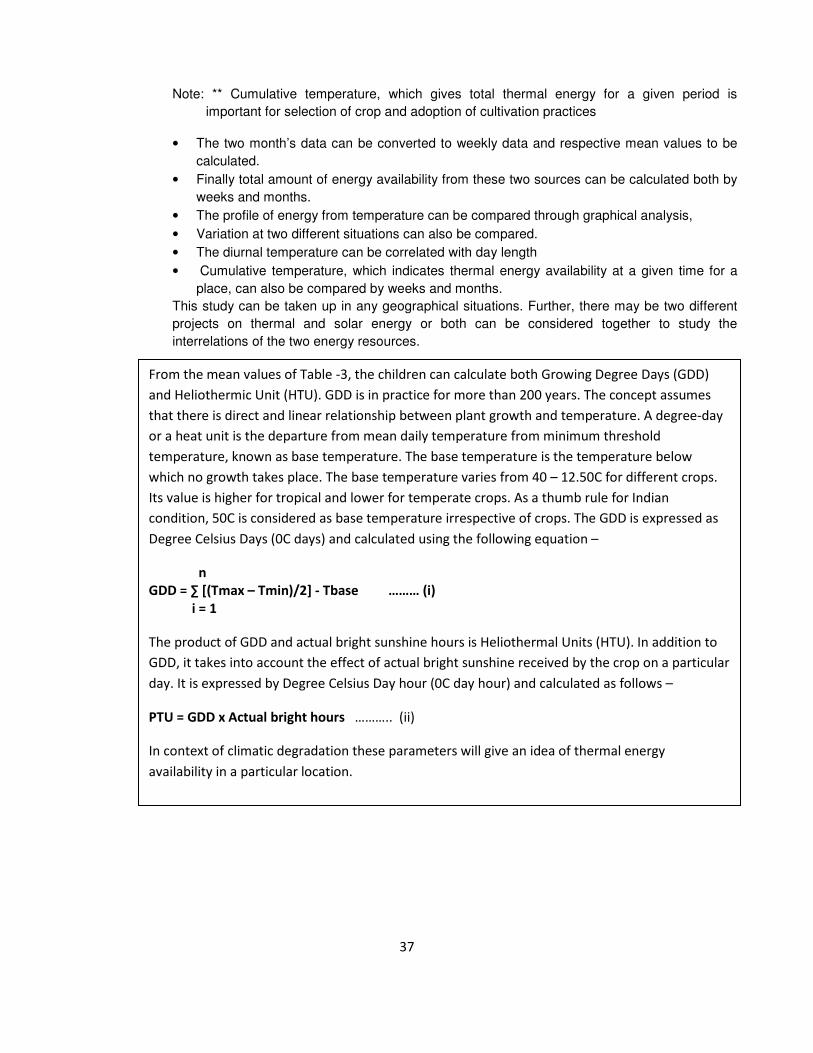
Note: ** Cumulative temperature, which gives total thermal energy for a given period is
important for selection of crop and adoption of cultivation practices
• The two month’s data can be converted to weekly data and respective mean values to be
calculated.
• Finally total amount of energy availability from these two sources can be calculated both by
weeks and months.
• The profile of energy from temperature can be compared through graphical analysis,
• Variation at two different situations can also be compared.
• The diurnal temperature can be correlated with day length
• Cumulative temperature, which indicates thermal energy availability at a given time for a
place, can also be compared by weeks and months.
This study can be taken up in any geographical situations. Further, there may be two different
projects on thermal and solar energy or both can be considered together to study the
interrelations of the two energy resources.
From the mean values of Table -3, the children can calculate both Growing Degree Days (GDD)
and Heliothermic Unit (HTU). GDD is in practice for more than 200 years. The concept assumes
that there is direct and linear relationship between plant growth and temperature. A degree-day
or a heat unit is the departure from mean daily temperature from minimum threshold
temperature, known as base temperature. The base temperature is the temperature below
which no growth takes place. The base temperature varies from 40 – 12.50C for different crops.
Its value is higher for tropical and lower for temperate crops. As a thumb rule for Indian
condition, 50C is considered as base temperature irrespective of crops. The GDD is expressed as
Degree Celsius Days (0C days) and calculated using the following equation –
n
GDD = ∑ [(Tmax – Tmin)/2] - Tbase ……… (i)
i = 1
The product of GDD and actual bright sunshine hours is Heliothermal Units (HTU). In addition to
GDD, it takes into account the effect of actual bright sunshine received by the crop on a particular
day. It is expressed by Degree Celsius Day hour (0C day hour) and calculated as follows –
PTU = GDD x Actual bright hours ……….. (ii)
In context of climatic degradation these parameters will give an idea of thermal energy
availability in a particular location.
38
Project – III. Study on bio-resource potential in a village
Biomass can be understood as regenerative (renewable) organic material that can be used to
produce energy. These sources include aquatic or terrestrial vegetation, residues from forestry
or agriculture, animal waste and municipal waste. In fact, it is composed of organic matter found
in flora throughout the world as well as manure of some animals. The simple explanation is that
the natural plants collect energy from the sun. This is converted, through photosynthesis with
the other compounds, within the plants, making a source of solar energy. This energy is
displayed in the use of wood for home and industry use. With the exception of manure, which is
converted by the use of yeast, the materials are burned to produce the energy. The use of
municipal waste has been very effective in the production of electricity, as well as gas using this
theory.
For many years there has been much controversy over the disposal of animal waste such as
manure. In large animal farm this can be a problem. It has now been found that this waste can
be turned into methane gas by using anaerobic digestions plants. It is expected that biomass
products will one day supply the entire world's energy in place of many of the forms now used.
Thus, one can be assured that when the secret of really unleashing biomass power is revealed
and applied it will greatly benefit the entire world. Hence, Estimating of resources from different
bio-sources is required to be known as first hand information for planning and management for
improving quality of life of rural mass.
Objective: To estimate different bio-resources in a village.
Materials required:
(i) Village map
(ii) Questionnaire
(iii) Basket (preferably bamboo made)
(iv) Rope for hanging basket in the spring balance
(v) Spring balance
Methodology:
Step -1: A village where the participating children dwell the need to be selected
Step – 2. Using questionnaire following information is to be collected.
(i) Name of the village (with JL number)
(ii) Area of the village (To be marked in the map)
(iii) Number of household
(iv) Number of people per household
(v) Number of labour force
(vi) Amount of farm and/or kitchen waste
(vii) Types and number of domesticated animals
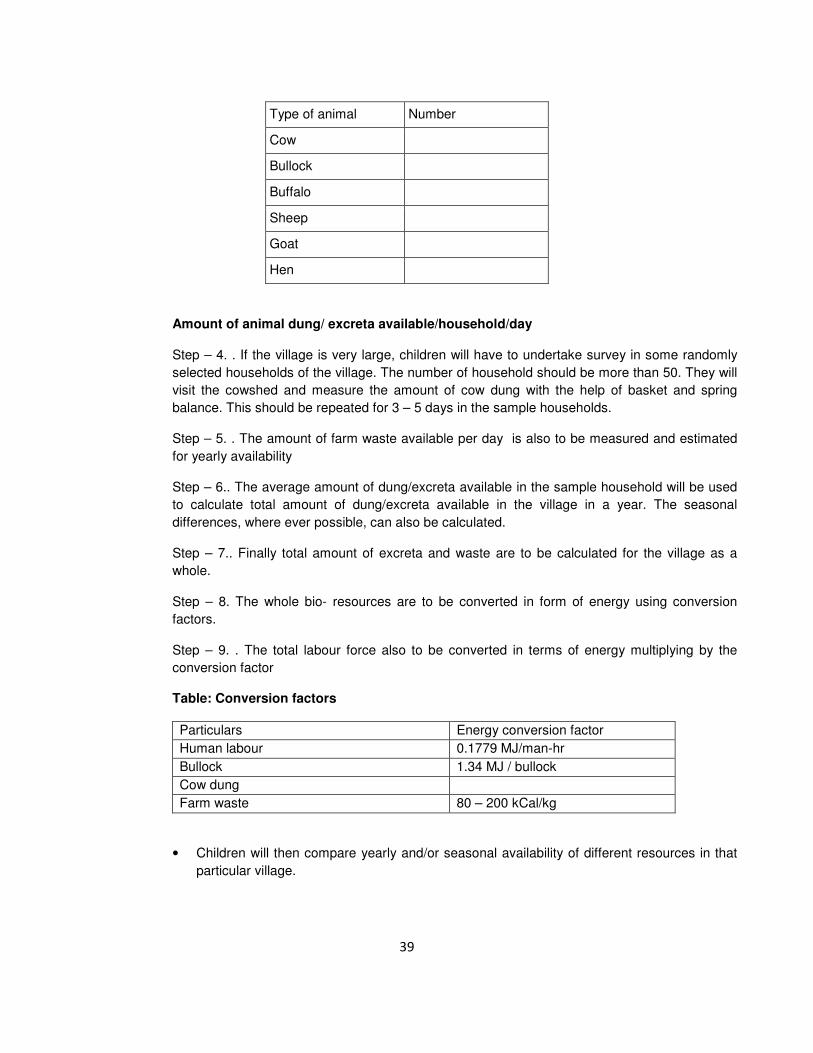
39
Amount of animal dung/ excreta available/household/day
Step – 4. . If the village is very large, children will have to undertake survey in some randomly
selected households of the village. The number of household should be more than 50. They will
visit the cowshed and measure the amount of cow dung with the help of basket and spring
balance. This should be repeated for 3 – 5 days in the sample households.
Step – 5. . The amount of farm waste available per day is also to be measured and estimated
for yearly availability
Step – 6.. The average amount of dung/excreta available in the sample household will be used
to calculate total amount of dung/excreta available in the village in a year. The seasonal
differences, where ever possible, can also be calculated.
Step – 7.. Finally total amount of excreta and waste are to be calculated for the village as a
whole.
Step – 8. The whole bio- resources are to be converted in form of energy using conversion
factors.
Step – 9. . The total labour force also to be converted in terms of energy multiplying by the
conversion factor
Table: Conversion factors
Particulars Energy conversion factor
Human labour 0.1779 MJ/man-hr
Bullock 1.34 MJ / bullock
Cow dung
Farm waste 80 – 200 kCal/kg
• Children will then compare yearly and/or seasonal availability of different resources in that
particular village.
Type of animal Number
Cow
Bullock
Buffalo
Sheep
Goat
Hen

40
Project – IV. . : Assessment of hydel energy (Water) in a flowing water body
Objective: To study the kinetic energy in a stream flow
Materials required:
1. Map of the area
2. Colour pen
3. Tracing paper
4. A piece of small float
5. A long string
6. Bamboo poles
7. A float (may be a piece of thermocol or cork)
8. Stop watch
9. Measuring tape
10. Note book
Methodology:
Step – 1. A stream or an open channel is to be identified
Step – 2. Map should be traced in the tracing paper and the location of the stream flow/ open
channel is to be marked showing direction of flow,
Step – 3. The children will visit the place and identify a segment of the channel.
Step – 4. The bamboo poles are to be put in two ends of the segment.
Step – 5. They will then measure the length of the flow in the channel.
Step – 6. Using bamboo poles depth of the flow is to be measured.
Step – 7. The bamboo poles are also to be put just opposite side of the channel in a line of the
previously placed the poles (as shown in the diagram).
Step – 8. The strings are to be tied across the channel at both the ends.
Step -9. The float will be placed at the top of the channel (marked A)
Step – 10. With the stop watch the time of run of the float will be recorded.
Step – 11. Then the calculations will have to be performed –
(i) cross sectional area of the channel, A (sq. M)
(ii) depth of the flow, h( m)
So, the volume of water in the section, V = A* h (m3)
Since density of water is 1, so V = M (mass), g
(iii) Velocity, P = L (length of the channel section)/ time , m/sec
Finally, Kinetic energy of the flow will be calculated using the following equation
KE = ½ M* V2
41
Note: This study can be undertaken before and after the rainfall, thereby a comparative study
on energy in flowing channel can be made.
i) Suggestive project idea
(i) Quantification of heat generated in exothermic chemical reactions (such as burning of coal,
wood, charcoal, gas etc
(ii) Identification of estimation of components of the gas produced from cow dung, kitchen
waste, human waste, tree leaves etc.
(iii) To study potential wind velocity in an area.
(iv) Estimation of incidence of solar radiation
(v) Estimating biomass energy stock in a school compound
(vi) Measuring kinetic energy in a stream
(vii) Comparative study on thermal energy availability in open and closed spaces in urban area.
(viii) Collection and recording of different plant parts and seeds available for use as food and
fuel.
(ix) Estimating Growing Degree Days (GDD) using time-scale recording of atmospheric
temperature
(x) Measuring and correlating air and soil temperature and thermal resources
2.2.2. Energy System
Energy is the capacity or capability to do work. All matters possess energy, because they can
all be utilised in some form of energy conversion process. For example, most substances will
burn or vaporise, and the consequent heat energy can be harnessed within mechanical energy
systems that create motion. The use of energy usually involves transformations between
different forms of energy - a process known as energy conversion. Any conversion between
different energy forms is imperfect in that some of the energy has to be used to facilitate the
conversion process. The converted energy output is lower than the energy input and this feature
is usually described as the conversion efficiency.
Energy is usually defined as the ability to do work or the capacity of any system to perform
work. Though this is an anthropocentric and utilitarian perspective of energy, it is a useful
definition for engineering where the aim of machines is to convert energy to work. As a more
general description, energy is a fundamental entity whose availability and flow are required for
all phenomena, natural or artificial. An understanding of how energy is generated and measured
is central to our decisions concerning the use and conservation of energy. Everything that
takes place in the planet is the expression of flow of energy from one form to another form.
The term energy systems, refers to the interrelated network of energy sources and stores of
energy, connected by conversion, transmission and distribution process. In the energy systems,
the energy converts from one form to another useable form of energy.

42
Framework
The flowchart below depicts the framework for undertaking projects by the children under the
sub-theme of Energy System.
Projects under the sub-theme ‘energy system’ can go at various spatial scales connected functionally
through the various energy transfer mechanisms. This sub-theme represented is the study and
projects that deal with the energy under transformation or the different aspects of the system in which
the conversion or transmission of energy occurs. During this conversion, certain amount of energy is
lost to the environment, and cannot be converted to useable forms of energy. Hence, though energy
conservation law states that energy cannot be created or destroyed, but it converts to un-useable
forms, which cannot be used for our purposes. Energy flows take place at all scales, from the
quantum level to the biosphere and cosmos.
At the children’s level, our aim is to deal with Natural systems such as physical, chemical and
biological processes, the human centric process of generation/harnessing of energy and its utilization
systems. The energy systems are classified based on the source or the processes.
Source based Energy Systems
• Renewable Energy Systems (based on renewable energy sources like solar, wind, biomass
etc.)
• Non-Renewable Energy Systems ( based on non-renewable energy sources like coal, oil etc)
Type of Energy Systems Process Output
Renewable Systems
Solar
Wind
Biomass
Hydro
Ocean/Tidal
Non-Renewable Systems
Coal
Oil; Gas
Living Systems
Biological
Development of simple
devices
Testing efficiency
Feasibility &
appropriateness
Understanding of Energy
dynamics
Potentials,
Limitations,
Practicability
Appreciation of natural laws
and phenomena
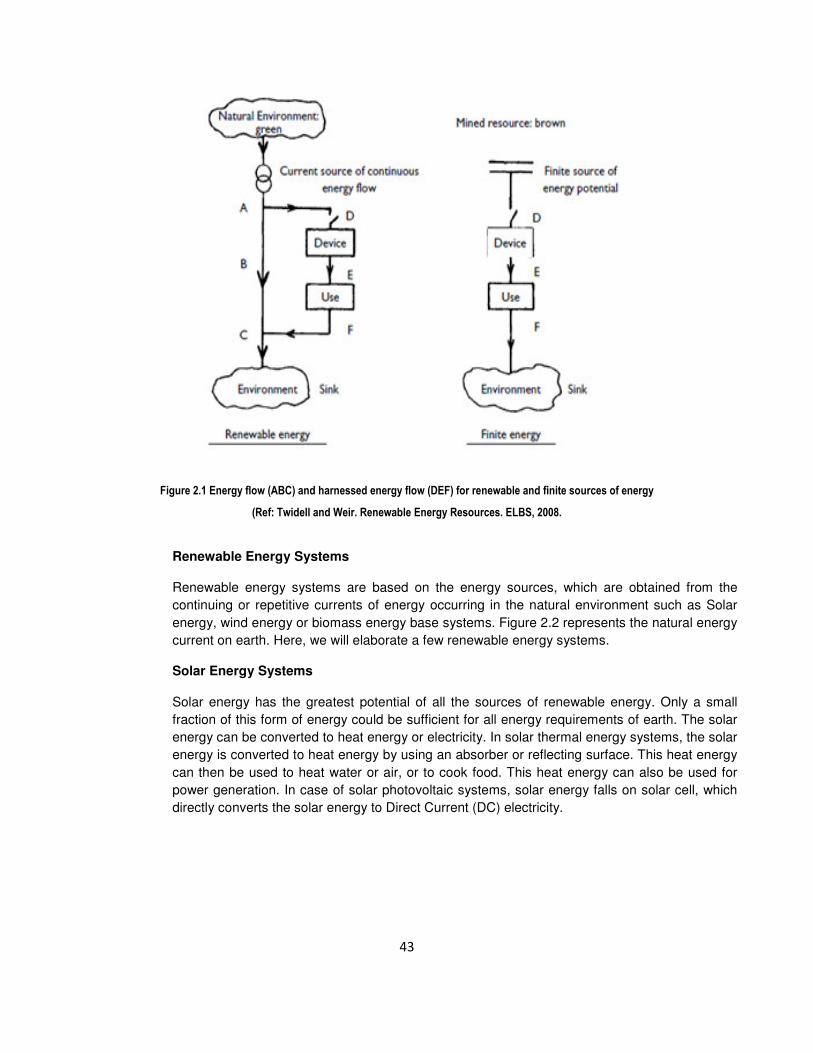
43
Figure 2.1 Energy flow (ABC) and harnessed energy flow (DEF) for renewable and finite sources of energy
(Ref: Twidell and Weir. Renewable Energy Resources. ELBS, 2008.
Renewable Energy Systems
Renewable energy systems are based on the energy sources, which are obtained from the
continuing or repetitive currents of energy occurring in the natural environment such as Solar
energy, wind energy or biomass energy base systems. Figure 2.2 represents the natural energy
current on earth. Here, we will elaborate a few renewable energy systems.
Solar Energy Systems
Solar energy has the greatest potential of all the sources of renewable energy. Only a small
fraction of this form of energy could be sufficient for all energy requirements of earth. The solar
energy can be converted to heat energy or electricity. In solar thermal energy systems, the solar
energy is converted to heat energy by using an absorber or reflecting surface. This heat energy
can then be used to heat water or air, or to cook food. This heat energy can also be used for
power generation. In case of solar photovoltaic systems, solar energy falls on solar cell, which
directly converts the solar energy to Direct Current (DC) electricity.
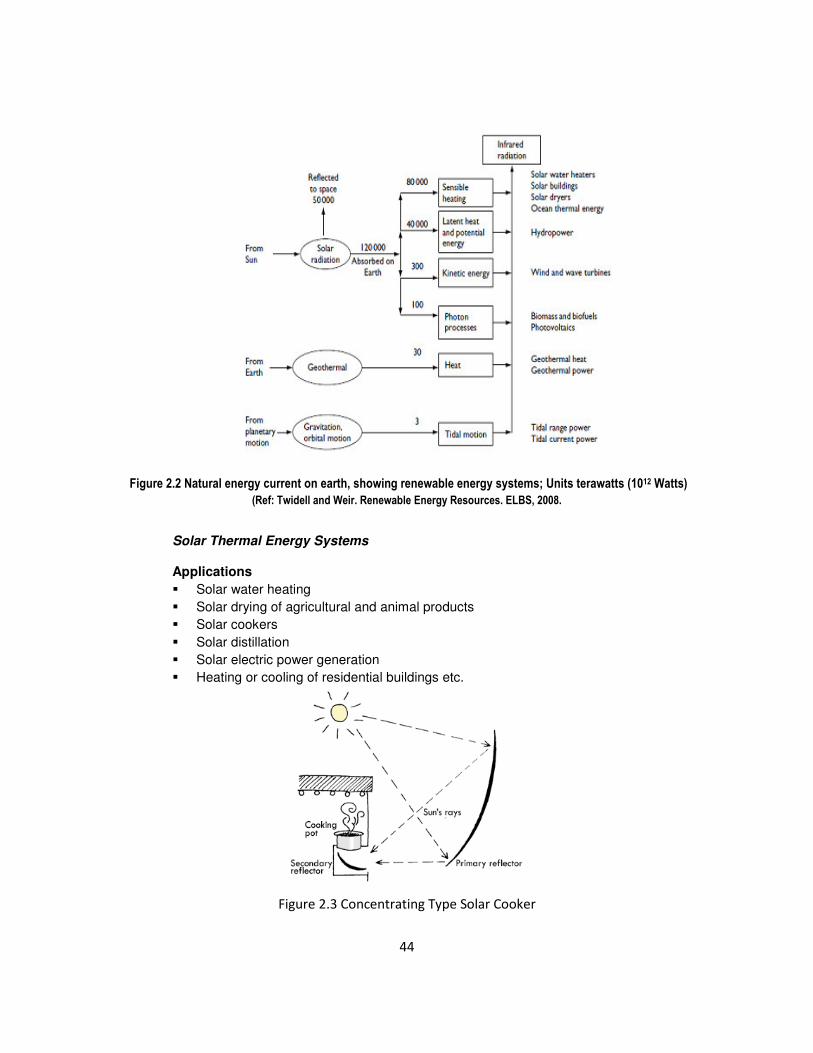
44
Figure 2.2 Natural energy current on earth, showing renewable energy systems; Units terawatts (1012 Watts)
(Ref: Twidell and Weir. Renewable Energy Resources. ELBS, 2008.
Solar Thermal Energy Systems
Applications
� Solar water heating
� Solar drying of agricultural and animal products
� Solar cookers
� Solar distillation
� Solar electric power generation
� Heating or cooling of residential buildings etc.
Figure 2.3 Concentrating Type Solar Cooker

45
Solar Photovoltaic Energy Systems
Application
• Stand alone systems
♦ Lighting (Solar Lantern, Solar home lighting system, Solar Street light etc.)
♦ Water Pump, Health clinics
♦ Power for mobile towers (Telecommunications)
♦ Consumer Electronics (Calculator, watches)
• Off-grid systems
♦ Remote Village Electrification
• Grid-connected systems
♦ Direct Connection with the utility grid
• Hybrid systems
♦ Coupled with Diesel generator / Wind systems/ Biomass gasification systems etc.
Figure 2.4 Schematic diagram of a solar photovoltaic system
Wind Energy Conversion Systems
“Windmills have fascinated us for centuries and will continue to do so. Like campfires or falling
water, they’re mesmerizing; indeed, entrancing.”
Since early recorded history, people have been harnessing the energy of the wind. Wind energy
was used to propel boats along the Nile River as early as 5000 B.C. The first windmills were
developed to automate the tasks of grain-grinding and water-pumping and the earliest-known
design is the vertical axis system developed in Persia about 500-900 A.D. The first use was
apparently water pumping. Vertical-axis windmills were also used in China, which is often
claimed as their birthplace. While the belief that the windmill was invented in China more than
2000 years ago is widespread and may be correct, the earliest actual documentation of a
Chinese windmill was in 1219 A.D. by the Chinese statesman Yehlu Chhu-Tshai. Here also, the
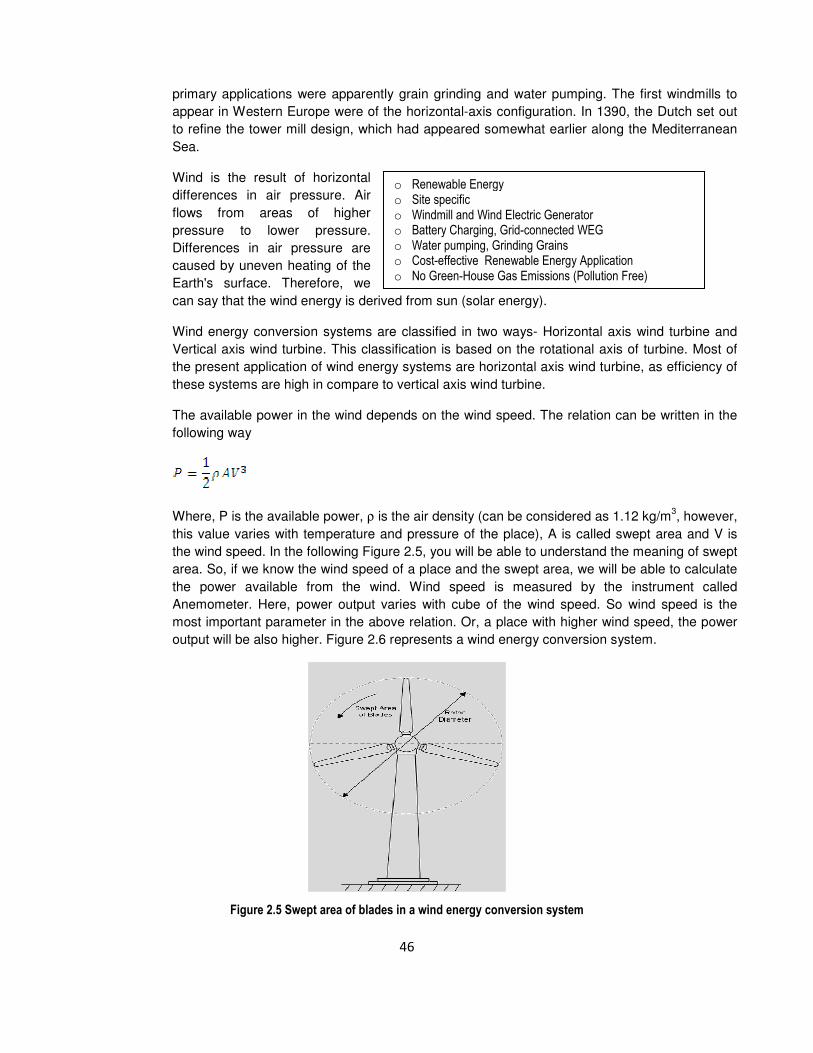
46
o Renewable Energy o Site specific o Windmill and Wind Electric Generator o Battery Charging, Grid-connected WEG o Water pumping, Grinding Grains o Cost-effective Renewable Energy Application o No Green-House Gas Emissions (Pollution Free)
primary applications were apparently grain grinding and water pumping. The first windmills to
appear in Western Europe were of the horizontal-axis configuration. In 1390, the Dutch set out
to refine the tower mill design, which had appeared somewhat earlier along the Mediterranean
Sea.
Wind is the result of horizontal
differences in air pressure. Air
flows from areas of higher
pressure to lower pressure.
Differences in air pressure are
caused by uneven heating of the
Earth's surface. Therefore, we
can say that the wind energy is derived from sun (solar energy).
Wind energy conversion systems are classified in two ways- Horizontal axis wind turbine and
Vertical axis wind turbine. This classification is based on the rotational axis of turbine. Most of
the present application of wind energy systems are horizontal axis wind turbine, as efficiency of
these systems are high in compare to vertical axis wind turbine.
The available power in the wind depends on the wind speed. The relation can be written in the
following way
Where, P is the available power, ρ is the air density (can be considered as 1.12 kg/m3, however,
this value varies with temperature and pressure of the place), A is called swept area and V is
the wind speed. In the following Figure 2.5, you will be able to understand the meaning of swept
area. So, if we know the wind speed of a place and the swept area, we will be able to calculate
the power available from the wind. Wind speed is measured by the instrument called
Anemometer. Here, power output varies with cube of the wind speed. So wind speed is the
most important parameter in the above relation. Or, a place with higher wind speed, the power
output will be also higher. Figure 2.6 represents a wind energy conversion system.
Figure 2.5 Swept area of blades in a wind energy conversion system
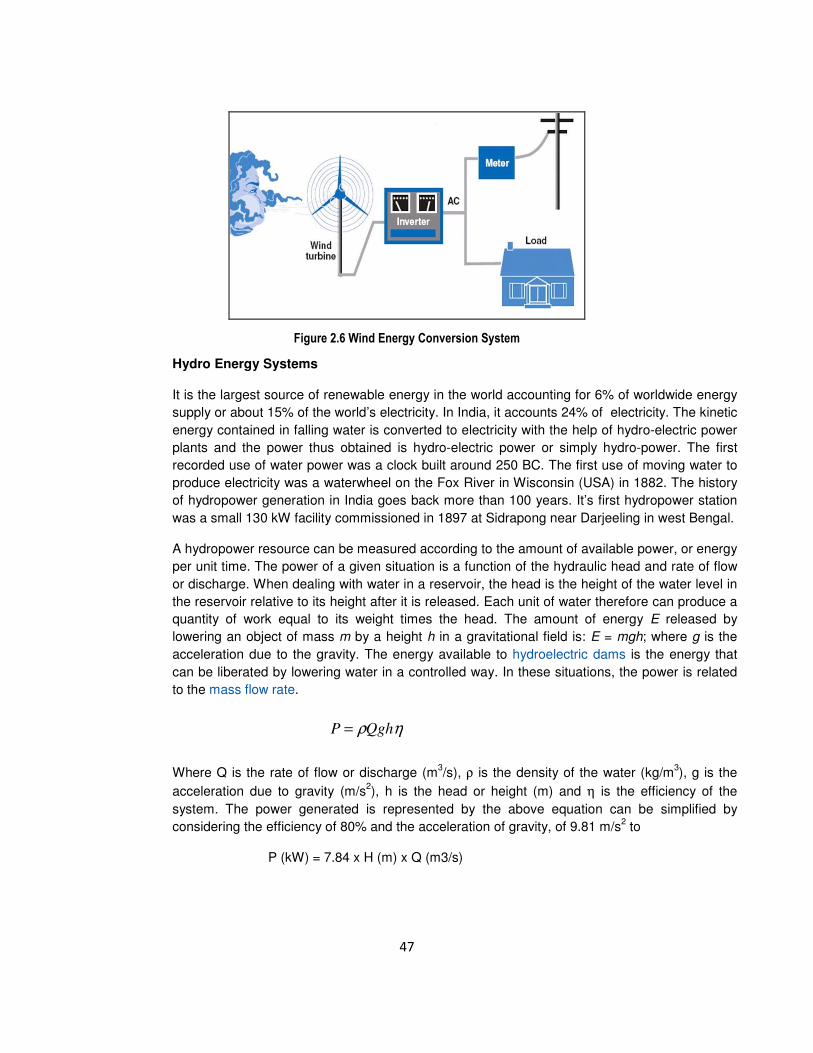
47
Figure 2.6 Wind Energy Conversion System
Hydro Energy Systems
It is the largest source of renewable energy in the world accounting for 6% of worldwide energy
supply or about 15% of the world’s electricity. In India, it accounts 24% of electricity. The kinetic
energy contained in falling water is converted to electricity with the help of hydro-electric power
plants and the power thus obtained is hydro-electric power or simply hydro-power. The first
recorded use of water power was a clock built around 250 BC. The first use of moving water to
produce electricity was a waterwheel on the Fox River in Wisconsin (USA) in 1882. The history
of hydropower generation in India goes back more than 100 years. It’s first hydropower station
was a small 130 kW facility commissioned in 1897 at Sidrapong near Darjeeling in west Bengal.
A hydropower resource can be measured according to the amount of available power, or energy
per unit time. The power of a given situation is a function of the hydraulic head and rate of flow
or discharge. When dealing with water in a reservoir, the head is the height of the water level in
the reservoir relative to its height after it is released. Each unit of water therefore can produce a
quantity of work equal to its weight times the head. The amount of energy E released by
lowering an object of mass m by a height h in a gravitational field is: E = mgh; where g is the
acceleration due to the gravity. The energy available to hydroelectric dams is the energy that
can be liberated by lowering water in a controlled way. In these situations, the power is related
to the mass flow rate.
Where Q is the rate of flow or discharge (m3/s), ρ is the density of the water (kg/m
3), g is the
acceleration due to gravity (m/s2), h is the head or height (m) and η is the efficiency of the
system. The power generated is represented by the above equation can be simplified by
considering the efficiency of 80% and the acceleration of gravity, of 9.81 m/s2 to
P (kW) = 7.84 x H (m) x Q (m3/s)
ηρQghP =
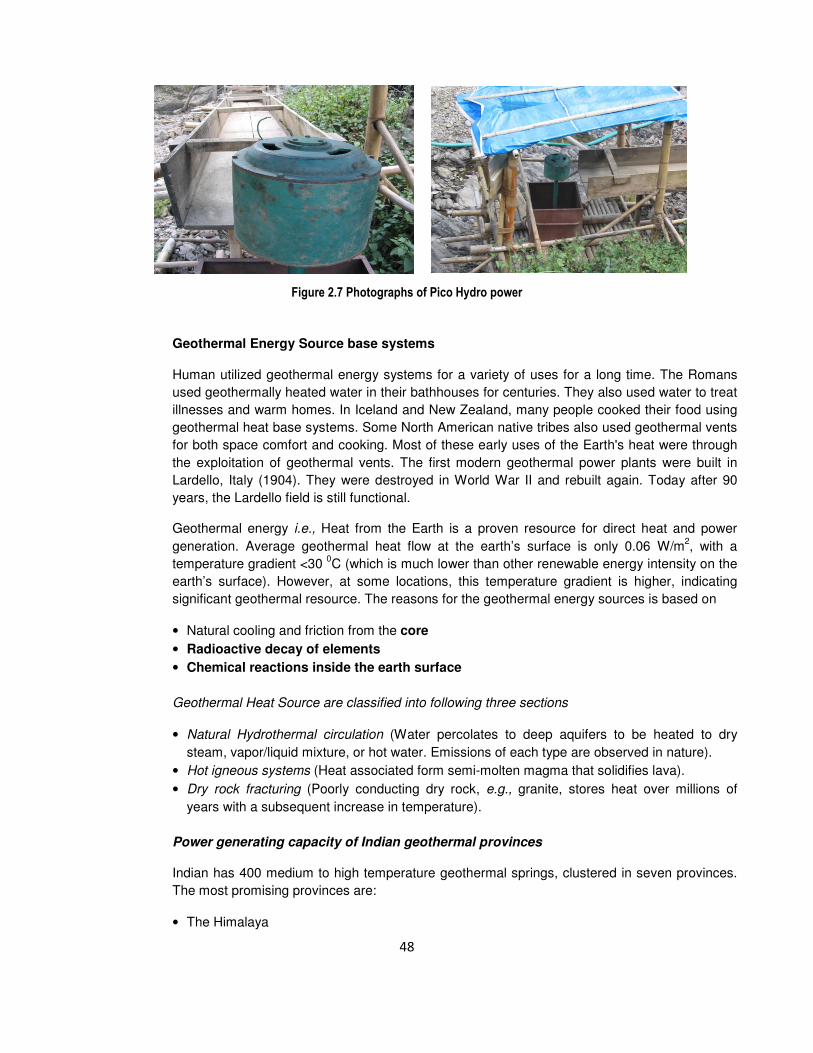
48
Figure 2.7 Photographs of Pico Hydro power
Geothermal Energy Source base systems
Human utilized geothermal energy systems for a variety of uses for a long time. The Romans
used geothermally heated water in their bathhouses for centuries. They also used water to treat
illnesses and warm homes. In Iceland and New Zealand, many people cooked their food using
geothermal heat base systems. Some North American native tribes also used geothermal vents
for both space comfort and cooking. Most of these early uses of the Earth's heat were through
the exploitation of geothermal vents. The first modern geothermal power plants were built in
Lardello, Italy (1904). They were destroyed in World War II and rebuilt again. Today after 90
years, the Lardello field is still functional.
Geothermal energy i.e., Heat from the Earth is a proven resource for direct heat and power
generation. Average geothermal heat flow at the earth’s surface is only 0.06 W/m2, with a
temperature gradient <30 0C (which is much lower than other renewable energy intensity on the
earth’s surface). However, at some locations, this temperature gradient is higher, indicating
significant geothermal resource. The reasons for the geothermal energy sources is based on
• Natural cooling and friction from the core
• Radioactive decay of elements
• Chemical reactions inside the earth surface
Geothermal Heat Source are classified into following three sections
• Natural Hydrothermal circulation (Water percolates to deep aquifers to be heated to dry
steam, vapor/liquid mixture, or hot water. Emissions of each type are observed in nature).
• Hot igneous systems (Heat associated form semi-molten magma that solidifies lava).
• Dry rock fracturing (Poorly conducting dry rock, e.g., granite, stores heat over millions of
years with a subsequent increase in temperature).
Power generating capacity of Indian geothermal provinces
Indian has 400 medium to high temperature geothermal springs, clustered in seven provinces.
The most promising provinces are:
• The Himalaya

49
• Cambay
• Son-Narmada-Tapi (SONATA)
• The Godavari
• Bakreswar province
• The Barren island
Province Surface
Temperature (0C)
Reservoir
Temperature
(0C)
Heat Flow
(mW/m2)
Thermal gradient
(0C/km)
Himalaya >90 260 468 100
Cambay 40-90 150-175 80-93 70
West coast 46-72 102-137 75-129 47-59
SONATA 60 - 95 105-217 120-290 60-90
Godavari 50-60 175-215 93-104 60
Figure 2.8 Dry Steam Electrical Power Generation through geothermal energy source (ref: Twidell and Weir)
Biomass energy based systems
A wide variety of conversion technologies are available for converting biomass based energy sources to
high grade fuel. Each biomass resource like wood, cow dung, vegetable waste can be converted in
many ways to provide a wide spectrum of useful products. Figure 2.9 represents the various conversion
processes of biomass. Biomass conversion can be performed in various ways
• Direct combustion (such as firewood burned in traditional chulha etc.)
• Thermo-chemical conversion ( biomass converts to producer gas in gasification systems)
• Bio-chemical conversion ( cow dung, vegetable waste to high grade fuel in anaerobic
digestion)
Direct combustion
Biomass is burnt to provide heat for cooking, comfort (space heat), crop drying, factory processes and
raising steam for electricity production and transport. Traditional use of biomass combustion includes (a)
cooking with firewood, and (b) commercial and industrial use for heat and power. A significant proportion
of the world’s population depends on fuel wood or other biomass for cooking, heating and other domestic
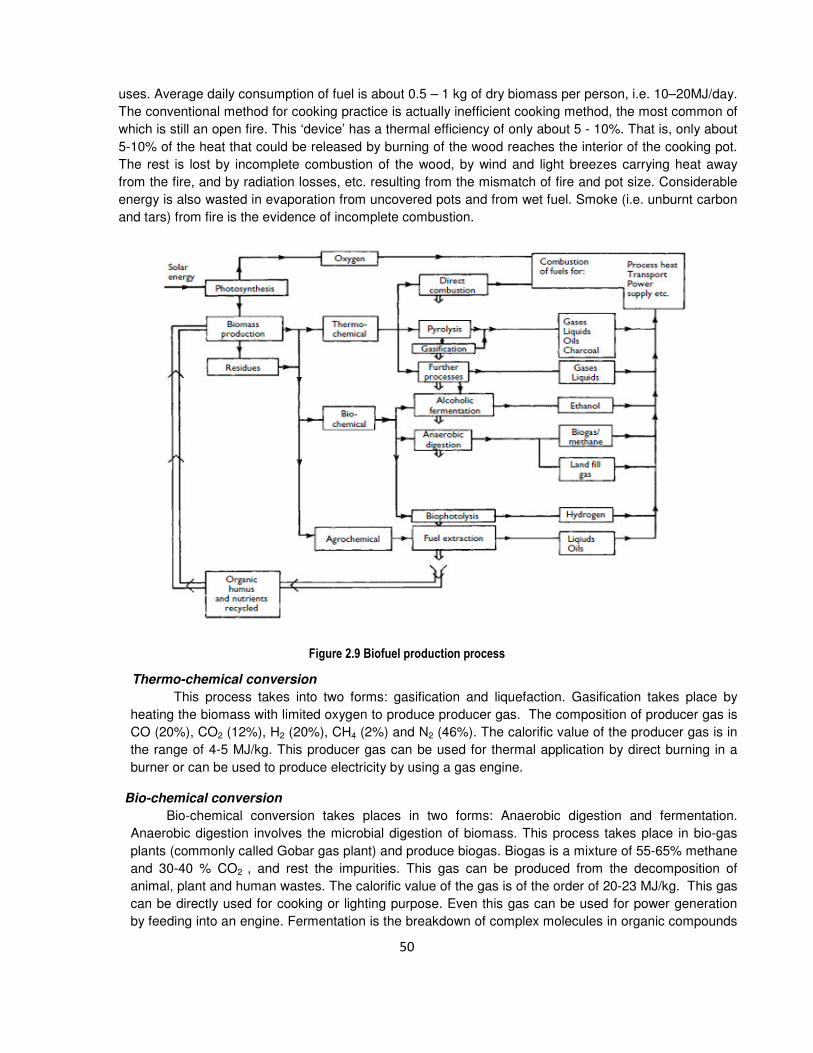
50
uses. Average daily consumption of fuel is about 0.5 – 1 kg of dry biomass per person, i.e. 10–20MJ/day.
The conventional method for cooking practice is actually inefficient cooking method, the most common of
which is still an open fire. This ‘device’ has a thermal efficiency of only about 5 - 10%. That is, only about
5-10% of the heat that could be released by burning of the wood reaches the interior of the cooking pot.
The rest is lost by incomplete combustion of the wood, by wind and light breezes carrying heat away
from the fire, and by radiation losses, etc. resulting from the mismatch of fire and pot size. Considerable
energy is also wasted in evaporation from uncovered pots and from wet fuel. Smoke (i.e. unburnt carbon
and tars) from fire is the evidence of incomplete combustion.
Figure 2.9 Biofuel production process
Thermo-chemical conversion
This process takes into two forms: gasification and liquefaction. Gasification takes place by
heating the biomass with limited oxygen to produce producer gas. The composition of producer gas is
CO (20%), CO2 (12%), H2 (20%), CH4 (2%) and N2 (46%). The calorific value of the producer gas is in
the range of 4-5 MJ/kg. This producer gas can be used for thermal application by direct burning in a
burner or can be used to produce electricity by using a gas engine.
Bio-chemical conversion
Bio-chemical conversion takes places in two forms: Anaerobic digestion and fermentation.
Anaerobic digestion involves the microbial digestion of biomass. This process takes place in bio-gas
plants (commonly called Gobar gas plant) and produce biogas. Biogas is a mixture of 55-65% methane
and 30-40 % CO2 , and rest the impurities. This gas can be produced from the decomposition of
animal, plant and human wastes. The calorific value of the gas is of the order of 20-23 MJ/kg. This gas
can be directly used for cooking or lighting purpose. Even this gas can be used for power generation
by feeding into an engine. Fermentation is the breakdown of complex molecules in organic compounds
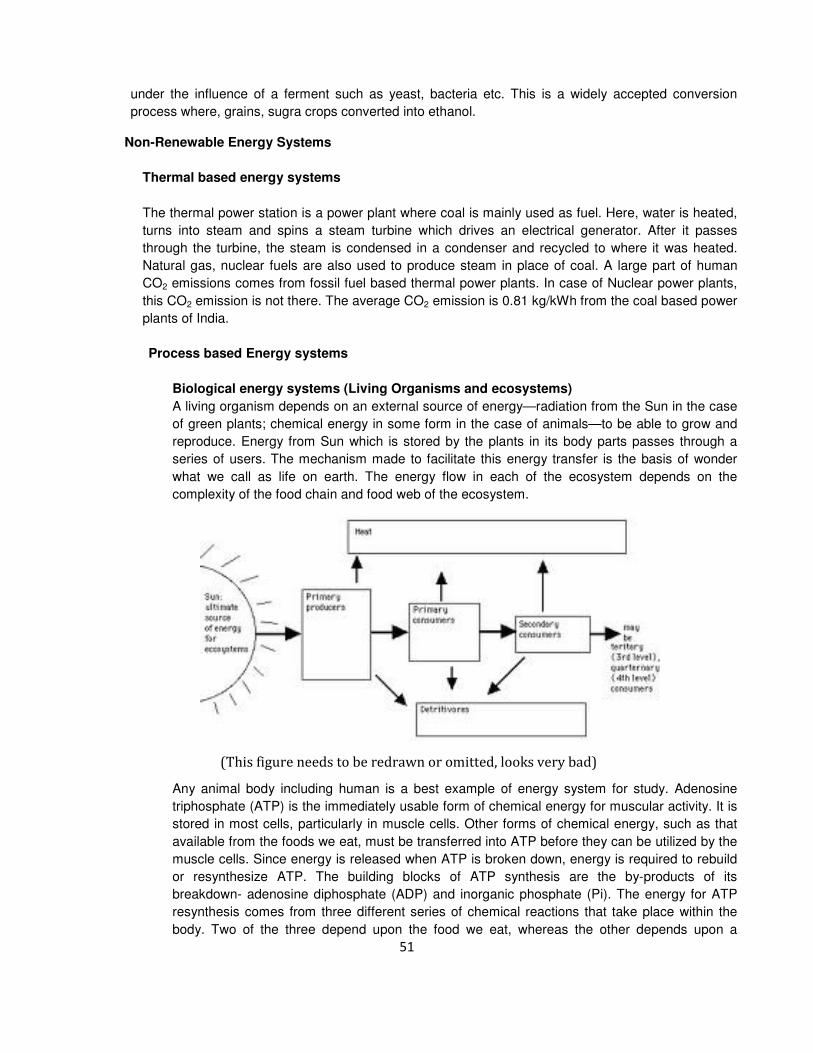
51
under the influence of a ferment such as yeast, bacteria etc. This is a widely accepted conversion
process where, grains, sugra crops converted into ethanol.
Non-Renewable Energy Systems
Thermal based energy systems
The thermal power station is a power plant where coal is mainly used as fuel. Here, water is heated,
turns into steam and spins a steam turbine which drives an electrical generator. After it passes
through the turbine, the steam is condensed in a condenser and recycled to where it was heated.
Natural gas, nuclear fuels are also used to produce steam in place of coal. A large part of human
CO2 emissions comes from fossil fuel based thermal power plants. In case of Nuclear power plants,
this CO2 emission is not there. The average CO2 emission is 0.81 kg/kWh from the coal based power
plants of India.
Process based Energy systems
Biological energy systems (Living Organisms and ecosystems)
A living organism depends on an external source of energy—radiation from the Sun in the case
of green plants; chemical energy in some form in the case of animals—to be able to grow and
reproduce. Energy from Sun which is stored by the plants in its body parts passes through a
series of users. The mechanism made to facilitate this energy transfer is the basis of wonder
what we call as life on earth. The energy flow in each of the ecosystem depends on the
complexity of the food chain and food web of the ecosystem.
(This figure needs to be redrawn or omitted, looks very bad)
Any animal body including human is a best example of energy system for study. Adenosine
triphosphate (ATP) is the immediately usable form of chemical energy for muscular activity. It is
stored in most cells, particularly in muscle cells. Other forms of chemical energy, such as that
available from the foods we eat, must be transferred into ATP before they can be utilized by the
muscle cells. Since energy is released when ATP is broken down, energy is required to rebuild
or resynthesize ATP. The building blocks of ATP synthesis are the by-products of its
breakdown- adenosine diphosphate (ADP) and inorganic phosphate (Pi). The energy for ATP
resynthesis comes from three different series of chemical reactions that take place within the
body. Two of the three depend upon the food we eat, whereas the other depends upon a
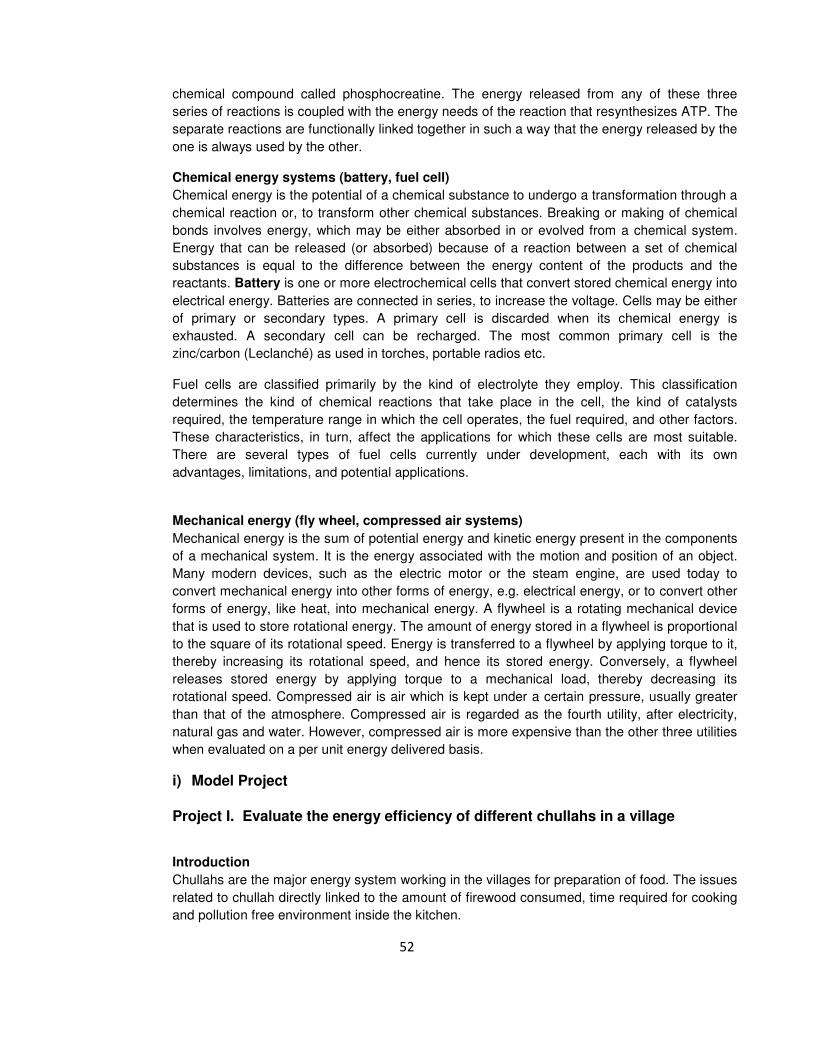
52
chemical compound called phosphocreatine. The energy released from any of these three
series of reactions is coupled with the energy needs of the reaction that resynthesizes ATP. The
separate reactions are functionally linked together in such a way that the energy released by the
one is always used by the other.
Chemical energy systems (battery, fuel cell)
Chemical energy is the potential of a chemical substance to undergo a transformation through a
chemical reaction or, to transform other chemical substances. Breaking or making of chemical
bonds involves energy, which may be either absorbed in or evolved from a chemical system.
Energy that can be released (or absorbed) because of a reaction between a set of chemical
substances is equal to the difference between the energy content of the products and the
reactants. Battery is one or more electrochemical cells that convert stored chemical energy into
electrical energy. Batteries are connected in series, to increase the voltage. Cells may be either
of primary or secondary types. A primary cell is discarded when its chemical energy is
exhausted. A secondary cell can be recharged. The most common primary cell is the
zinc/carbon (Leclanché) as used in torches, portable radios etc.
Fuel cells are classified primarily by the kind of electrolyte they employ. This classification
determines the kind of chemical reactions that take place in the cell, the kind of catalysts
required, the temperature range in which the cell operates, the fuel required, and other factors.
These characteristics, in turn, affect the applications for which these cells are most suitable.
There are several types of fuel cells currently under development, each with its own
advantages, limitations, and potential applications.
Mechanical energy (fly wheel, compressed air systems)
Mechanical energy is the sum of potential energy and kinetic energy present in the components
of a mechanical system. It is the energy associated with the motion and position of an object.
Many modern devices, such as the electric motor or the steam engine, are used today to
convert mechanical energy into other forms of energy, e.g. electrical energy, or to convert other
forms of energy, like heat, into mechanical energy. A flywheel is a rotating mechanical device
that is used to store rotational energy. The amount of energy stored in a flywheel is proportional
to the square of its rotational speed. Energy is transferred to a flywheel by applying torque to it,
thereby increasing its rotational speed, and hence its stored energy. Conversely, a flywheel
releases stored energy by applying torque to a mechanical load, thereby decreasing its
rotational speed. Compressed air is air which is kept under a certain pressure, usually greater
than that of the atmosphere. Compressed air is regarded as the fourth utility, after electricity,
natural gas and water. However, compressed air is more expensive than the other three utilities
when evaluated on a per unit energy delivered basis.
i) Model Project
Project I. Evaluate the energy efficiency of different chullahs in a village
Introduction
Chullahs are the major energy system working in the villages for preparation of food. The issues
related to chullah directly linked to the amount of firewood consumed, time required for cooking
and pollution free environment inside the kitchen.

53
Objectives:
i. To identify the different types of chullahs in practice in a village.
ii. To study the differences in structure, location and other details of chullahs.
iii. To evaluate the relative energy efficiency of the chullahs and to recommends the best design
aspect available in the village of study.
Methodology
• Identify the different types of chullahs used in a village.
• Note down the different structural aspects of the chullahs with measurements.
• Draw a rough picture of each of these chullahs in the note book
• Classify the chullahs into different types.
• Analyse the differences in the design aspects of each type.
• Identify one representative chullah of each type.
• Cook a specific amount of food in similar way with similar utensils and same fuel and record
the time taken for cooking and amount of fuel used.
• Analyse the result and identify the best and efficient system and try to interpret the reasons
for it.
Expected Outcome:
• Understanding of the village cooking energy system
• Developing scientific awareness among the children and villagers on energetic of cooking.
Project II : Comparison of Food web of two different natural ecosystems in an area ( this
model needs to be reviewed)
Introduction
Food chain and food web represents the complexity of energy transaction or energy flow in an
ecosystem. By careful observation and recording, children can identify various elements of
different food chain operating in the area and construct the functional food web.
Objectives
i. To identify the food chains of two different natural ecosystems in the area
ii. To construct the food web of each of these area and study the difference.
iii. To construct the approximate energy flow diagrams applicable for the ecosystems under
study.
Materials required:
Binoculars, Magnifying glasses, microscope, notebook, pen/pencil etc
Methodology:
• Identify the two different ecosystems of similar special extent for study.
• Mark the boundaries and make an approximate manual map of the area depicting the
changes of micro ecosystems of the area.
• Spend 10 hours per week for at least two months in each of the area and note down all
observations of organisms.
• Identify directly or by taking photos, in the case of soil insects collect a few of them and
identify using the magnifying / microscope.
• Record all the observation of eating and being eater with details of time and date.
• Construct the simple food chains first later develop in to the working food web of the system.

54
• It is estimated that only less than 7 % of the solar energy is used in photosynthesis at each
trophic level of energy transfer their is similar loss of energy.
• Construct an approximate energy flow diagram and appropriate energy pyramid for the two
ecosystems under study.
• Compare the energy flow scenario between the ecosystems, interpret the result discuss the
energy transaction and its implications.
Expected Outcome:
Understanding and appreciating the energy transactions in the natural ecosystems.
ii) Suggestive project idea
i. Using a solar module, calculate the maximum power output at different solar radiation and
also try to evaluate the power output at different inclination angle of the solar module.
ii. Try to make a concentrating type solar cooker and measure the temperature at the focal point
at different solar radiation throughout the day.
iii. Make a box type solar cooker by using ply-board and cook your food. Note down the time
taken for cooking of different kind of food items.
iv. Measure the amount of gas output from different kinds of organic waste materials (cow dung,
vegetable waste, food waste, municipal solid waste etc.).
v. Evaluation/estimation of human energy used for the human activities such as procuring water
from the well, bringing the fodder, ploughing of cattle and estimate the amount of other
conventional energy sources required to substitute them.
vi. Evaluation/estimation of energy supplied by cattle in the village ecosystem for the traction
power, cow dung as fuel etc and estimates the amount of other conventional energy sources
required to substitute them.
vii. Study the amount of fuel required to boil water/cook a certain amount of food in different
structured utensils and identify the most energy efficient one.
viii. Study the components of energy systems supporting in maintaining a garden and relative
roles.
ix. Study the relative role of different energy systems in development of a green building.
x. Study the energy systems involved in the road transport.
xi. Study the relative energy systems that are in use in operating a boat.
xii. Comparison of energy usage and energy system contributions in food processing.
xiii. Compare the heating value of different biomass (fire wood) by noting the time taken to boil a
certain fixed amount of water and the amount of biomass consumed.
xiv. Try to note down the different kinds of chullahs in the village (draw the details and quantify
the minor differences). Check the performance of each type and rank them on the basis of
performance.
xv. Write down the different energy conversion systems in a village. This need to include the
energy source conversion devices, output work and kind of losses and try to rank them based
on the work performance.
xvi. Use one solar module to charge the battery. During charging, note down the voltage vs. time
and plot the profile. Repeat this experiment during the discharge by connecting with the
battery for different rating of LED lamps.
xvii. Construct a zero energy refrigeration system. Measure the inside and outside temperature at
different seasons of the year. Observe the freshness of vegetables kept in the refrigeration
system.
55
xviii. Record and analyse the room temperature inside the building with different types of roofs.
xix. Charcoal production potential of different types of biomass.
xx. Use two GI sheets and try to make blades of a wind turbine. Now connect the system with a
dynamo motor. Measure the power output from the system at different wind velocity.
2.2.3. Energy and Society The last century evidenced an exponential growth of human population and it has altered the
life style of the people from ecosystem based approach to a market base approach. In this
context, the development index is controlled by GDP and associated with the pattern of
consumption. As a result of which growth of different sectors like agriculture, industry etc is
highly dependent on energy consumption. These processes create more demand for energy
generation. Eventually to full fill these demand now a day’s focuses is given more on power
generation either from hydel or from thermal. But normally in planning and designing such
project only economic perspectives is considered while ignoring the issues related to
environment, human life and society. Such non-futuristic and unsustainable approach leads to
the problems of global warming, developmental inequality, conflicts, and health and ecosystem
damage.
There are other example of energy related societal issues, e.g. decrease of forest coverage
increases workload on women to collect fuel wood particularly in forest fringe area because they
have to walk long distances in search fuel wood; similarly degradation of common property
resources within the village deprived the poorer section of families from bio-energy sources. So
degradation natural resources deprived economically weaker section of rural society to large
extent.
On the other hand a section of high income group design their housing and other activities such
way which is shifted to mechanization, where uses of electricity also increases; e.g. washing of
cloth is shifted from manual to washing machine base, where manual labour is replaced by
machine with energy inputs of electricity. So issues of optimal use of energy are also related
with lifestyle and life style change is also important for optimization of energy use.
It is therefore essential to address these issues to take care of all the evolving system related to
development. If the development process has to be sustainable, it is necessary to increase the
efficiency of energy utilities and processes, conserve energy and explore renewable sources of
energy. From such perspectives, efficient and equitable energy access and supply system can
creates an ideal situation for energy sufficiency and provides energy security to all.
In these contexts, this sub-theme will give focuses on developing an understanding about
relationship between energy and society. It is linked with understanding the relationship
between societal system and the energy system, e.g. relation between life style and energy
consumption, social/traditional practices and energy consumption etc.
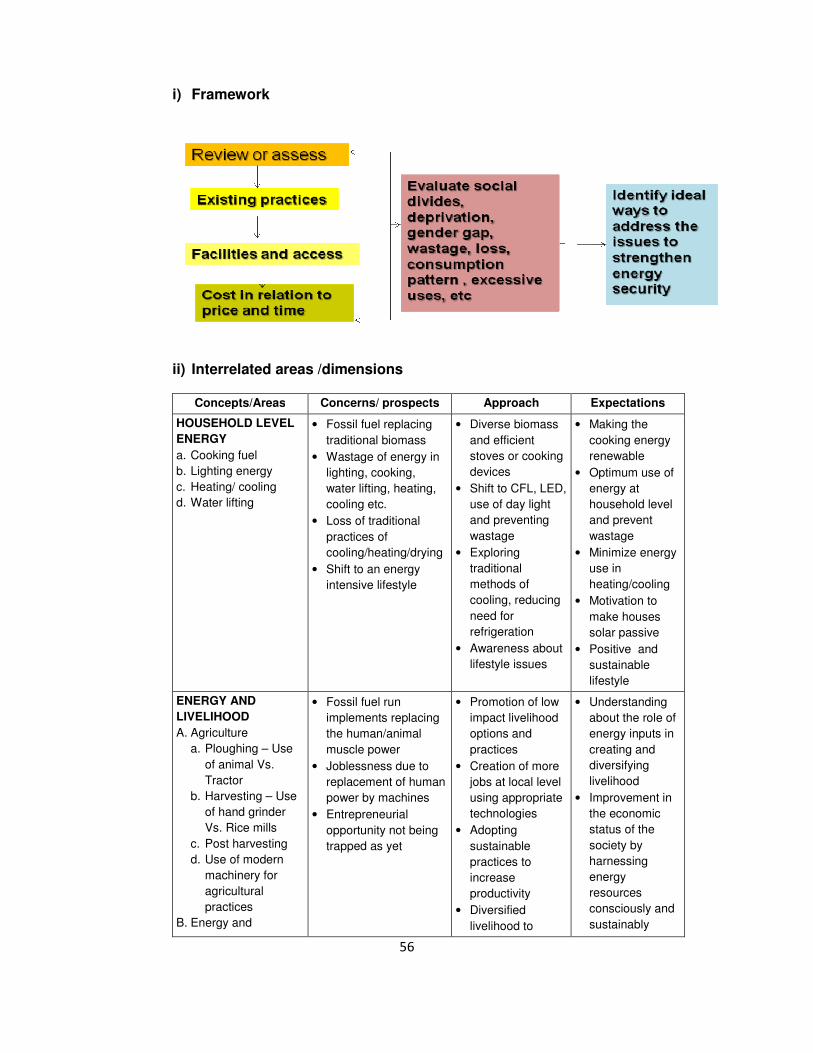
56
i) Framework
ii) Interrelated areas /dimensions
Concepts/Areas Concerns/ prospects Approach Expectations
HOUSEHOLD LEVEL
ENERGY
a. Cooking fuel
b. Lighting energy
c. Heating/ cooling
d. Water lifting
• Fossil fuel replacing
traditional biomass
• Wastage of energy in
lighting, cooking,
water lifting, heating,
cooling etc.
• Loss of traditional
practices of
cooling/heating/drying
• Shift to an energy
intensive lifestyle
• Diverse biomass
and efficient
stoves or cooking
devices
• Shift to CFL, LED,
use of day light
and preventing
wastage
• Exploring
traditional
methods of
cooling, reducing
need for
refrigeration
• Awareness about
lifestyle issues
• Making the
cooking energy
renewable
• Optimum use of
energy at
household level
and prevent
wastage
• Minimize energy
use in
heating/cooling
• Motivation to
make houses
solar passive
• Positive and
sustainable
lifestyle
ENERGY AND
LIVELIHOOD
A. Agriculture
a. Ploughing – Use
of animal Vs.
Tractor
b. Harvesting – Use
of hand grinder
Vs. Rice mills
c. Post harvesting
d. Use of modern
machinery for
agricultural
practices
B. Energy and
• Fossil fuel run
implements replacing
the human/animal
muscle power
• Joblessness due to
replacement of human
power by machines
• Entrepreneurial
opportunity not being
trapped as yet
• Promotion of low
impact livelihood
options and
practices
• Creation of more
jobs at local level
using appropriate
technologies
• Adopting
sustainable
practices to
increase
productivity
• Diversified
livelihood to
• Understanding
about the role of
energy inputs in
creating and
diversifying
livelihood
• Improvement in
the economic
status of the
society by
harnessing
energy
resources
consciously and
sustainably
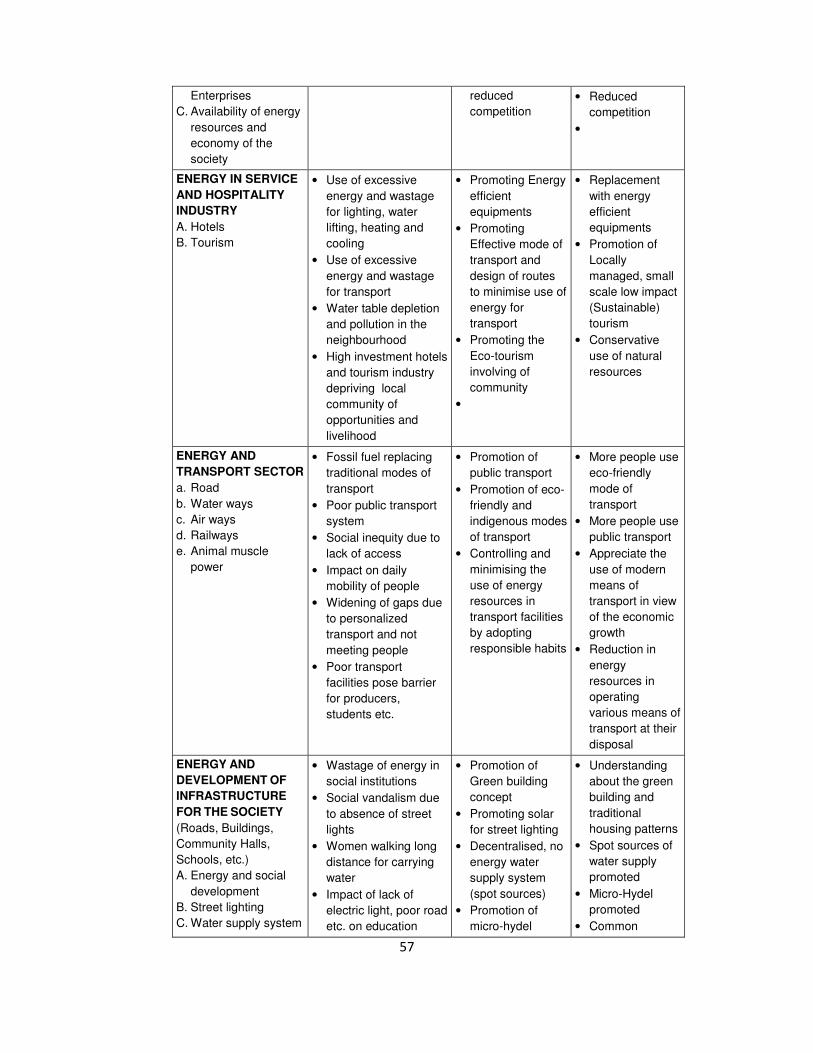
57
Enterprises
C. Availability of energy
resources and
economy of the
society
reduced
competition
• Reduced
competition
•
ENERGY IN SERVICE
AND HOSPITALITY
INDUSTRY
A. Hotels
B. Tourism
• Use of excessive
energy and wastage
for lighting, water
lifting, heating and
cooling
• Use of excessive
energy and wastage
for transport
• Water table depletion
and pollution in the
neighbourhood
• High investment hotels
and tourism industry
depriving local
community of
opportunities and
livelihood
• Promoting Energy
efficient
equipments
• Promoting
Effective mode of
transport and
design of routes
to minimise use of
energy for
transport
• Promoting the
Eco-tourism
involving of
community
•
• Replacement
with energy
efficient
equipments
• Promotion of
Locally
managed, small
scale low impact
(Sustainable)
tourism
• Conservative
use of natural
resources
ENERGY AND
TRANSPORT SECTOR
a. Road
b. Water ways
c. Air ways
d. Railways
e. Animal muscle
power
• Fossil fuel replacing
traditional modes of
transport
• Poor public transport
system
• Social inequity due to
lack of access
• Impact on daily
mobility of people
• Widening of gaps due
to personalized
transport and not
meeting people
• Poor transport
facilities pose barrier
for producers,
students etc.
• Promotion of
public transport
• Promotion of eco-
friendly and
indigenous modes
of transport
• Controlling and
minimising the
use of energy
resources in
transport facilities
by adopting
responsible habits
• More people use
eco-friendly
mode of
transport
• More people use
public transport
• Appreciate the
use of modern
means of
transport in view
of the economic
growth
• Reduction in
energy
resources in
operating
various means of
transport at their
disposal
ENERGY AND
DEVELOPMENT OF
INFRASTRUCTURE
FOR THE SOCIETY
(Roads, Buildings,
Community Halls,
Schools, etc.)
A. Energy and social
development
B. Street lighting
C. Water supply system
• Wastage of energy in
social institutions
• Social vandalism due
to absence of street
lights
• Women walking long
distance for carrying
water
• Impact of lack of
electric light, poor road
etc. on education
• Promotion of
Green building
concept
• Promoting solar
for street lighting
• Decentralised, no
energy water
supply system
(spot sources)
• Promotion of
micro-hydel
• Understanding
about the green
building and
traditional
housing patterns
• Spot sources of
water supply
promoted
• Micro-Hydel
promoted
• Common
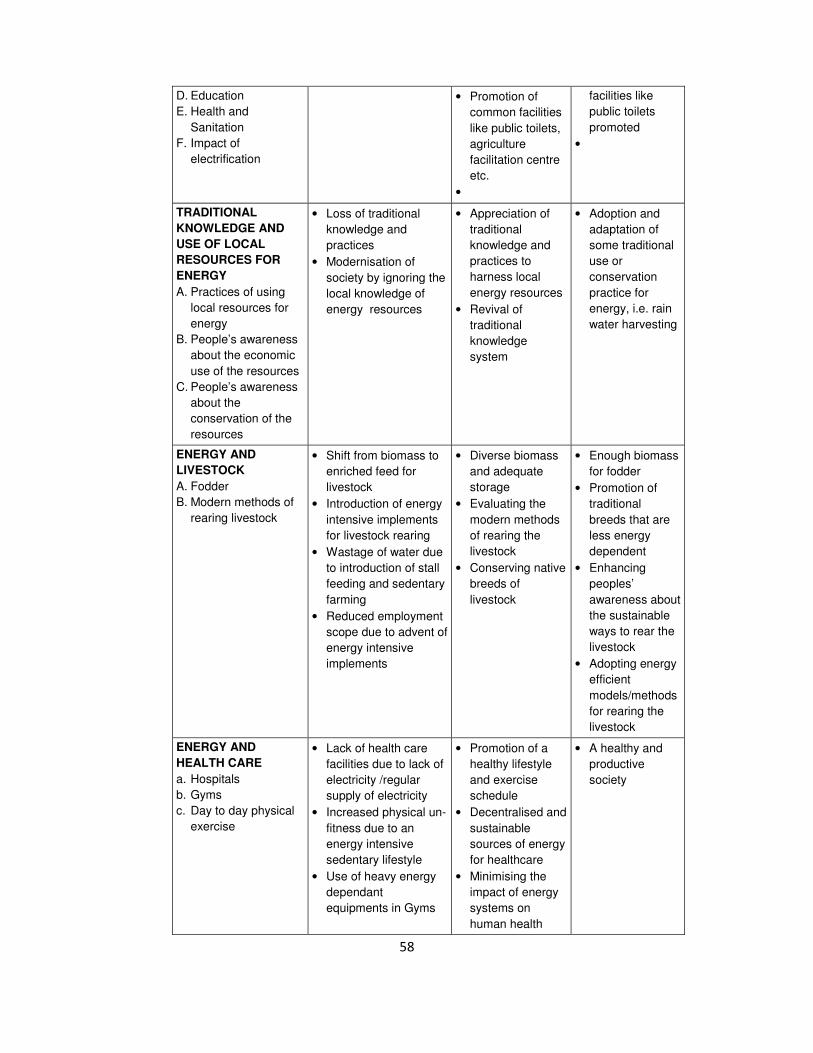
58
D. Education
E. Health and
Sanitation
F. Impact of
electrification
• Promotion of
common facilities
like public toilets,
agriculture
facilitation centre
etc.
•
facilities like
public toilets
promoted
•
TRADITIONAL
KNOWLEDGE AND
USE OF LOCAL
RESOURCES FOR
ENERGY
A. Practices of using
local resources for
energy
B. People’s awareness
about the economic
use of the resources
C. People’s awareness
about the
conservation of the
resources
• Loss of traditional
knowledge and
practices
• Modernisation of
society by ignoring the
local knowledge of
energy resources
• Appreciation of
traditional
knowledge and
practices to
harness local
energy resources
• Revival of
traditional
knowledge
system
• Adoption and
adaptation of
some traditional
use or
conservation
practice for
energy, i.e. rain
water harvesting
ENERGY AND
LIVESTOCK
A. Fodder
B. Modern methods of
rearing livestock
• Shift from biomass to
enriched feed for
livestock
• Introduction of energy
intensive implements
for livestock rearing
• Wastage of water due
to introduction of stall
feeding and sedentary
farming
• Reduced employment
scope due to advent of
energy intensive
implements
• Diverse biomass
and adequate
storage
• Evaluating the
modern methods
of rearing the
livestock
• Conserving native
breeds of
livestock
• Enough biomass
for fodder
• Promotion of
traditional
breeds that are
less energy
dependent
• Enhancing
peoples’
awareness about
the sustainable
ways to rear the
livestock
• Adopting energy
efficient
models/methods
for rearing the
livestock
ENERGY AND
HEALTH CARE
a. Hospitals
b. Gyms
c. Day to day physical
exercise
• Lack of health care
facilities due to lack of
electricity /regular
supply of electricity
• Increased physical un-
fitness due to an
energy intensive
sedentary lifestyle
• Use of heavy energy
dependant
equipments in Gyms
• Promotion of a
healthy lifestyle
and exercise
schedule
• Decentralised and
sustainable
sources of energy
for healthcare
• Minimising the
impact of energy
systems on
human health
• A healthy and
productive
society

59
iii) Some important areas: • Gender-wise energy consumption pattern
• Change in the pattern of energy consumption and impact on lifestyle and society
• Energy for basic needs and livelihood
• Availability of bio-resources and efficient uses in the kitchen
• Energy implications of dietary habits
• Festival and energy consumption pattern– impacts on society
• Change in energy dynamics due to shift in agricultural practices (crop, cattle, fertiliser use)
• Common public facilities and impacts on energy consumptions.
Story from the field
Changing lifestyle through lighting: “There is a remote village in kamrup district of Assam where no
electricity was available till 1995. Inhabitants used to end their daily routine just after the sunset and go to bed.
They had limited income opportunities and had to earn livelihood from their surrounding jungle and jhum
cultivation. In late 1995 Government took up village electrification programmes through solar photovoltaic
module (SPV) . The modules were installed in the houses of all the inhabitants. This changed the lifestyle of
the people dramatically. Children started reading in the evening under light, women started to take up weaving
works in the evening, villagers went to community halls in the evening for interaction. Some enterprising
people started battery charging units with solar panels, thereby helping the batteries of the domestic solar
systems to sustain and generate earning for themselves too. Women started to earn through weaving and all
inhabitants could go to community video hall that run through SPV. By running community video hall, some
youths could also earn their livelihood. This is an example how a society can be transformed through efficient
energy input”
##############################
The PURA community bio-gas experience: Engineers at ASTRA, IISc working in the village of Pura in
Kunigal Taluk of Karnataka convinced the villagers that as individual bio-gas plants were not possible to
construct due to various reasons (non-availability of land, resources, etc), a community bio-gas plant would
benefit the entire village. They designed and built a bio-gas plant using cow dung as raw material. Each
household delivered cow dung to the site after recording the weight. Cow dung in the plant evolved bio-gas
(methane and carbon dioxide) which was used to run a diesel engine with 80% bio-gas and 20% diesel. The
plant was operated for 8 hours a day; two hours for pumping water from the borewell to the overhead tank,
two hours for grinding grains in the floor mill and four hours in the evening from 6-10 pm for lighting the
homes.The entire village got reliable energy services by way of water, flour milling and lighting with only 20%
diesel (fossil fuel) consumption. They also got back enriched manure from the bio-gas plant in proportion to
the cow dung they contributed.

60
iv) Model Projects
Project-I. Gender-wise energy consumption pattern
Introduction:
The study helps to bring out gender wise energy consumption pattern with respect to age
groups, education, occupation, economic class and helps determine the gender that consumes
the most, and also find the gender that can control the society in terms of conservation. This
study in turn supports the energy conservation efforts.
Objectives:
To understand the gender wise consumption pattern and their influence in deciding the energy
consumption in a society and also to graphically plot the area of their influence in the society.
Methodology
Select an area and identify few houses for study.
• Collect information about gender and the age classes of the area from the village records
• Classify the gender according to the age
• Classify the gender and age with respect to economic status
• With the help of questionnaire survey and village information sources, list the occupation of
the people into classes with respect to gender and express them in percentages such as
agriculture, factory, office, school and house.
• Mode of transportation: frequency of movement per month and extrapolate to per year
against each categories of transportation (this can be done by interviewing people)
• Record the frequency of their electricity use by noting the time spent for watching television,
lighting (number of bulbs with respect to kitchen, bed rooms, drawing room etc.), so that
relative use of gender in each room/area can be calculated – this is the example for a house.
• Compare the relation between economic classes and the gender wise energy expenditure
• Similarly, compare the education and occupation also with gender wise energy consumption
• Tabulate the results for comparison; come to a conclusion and suggest alternatives for better
management
Expected Outcome
1. Gender role in determining and influencing the energy consumption
2. The gender wise pattern of resource use in the area
Project –II. Energy implications of food and diet
Introduction
Food is the energy source of all living beings. With the invention of fire and with the social
evolution, varieties of food habits arose. Food preparation also accordingly evolved and has
grown complex over time. Nowadays the food preparation activities have started consuming a
lot of energy and time. From survival it has moved on to become a lifestyle statement. It will be
61
interesting to compare the calorific output of each food item and the energy necessary to
prepare it.
Objectives
To assess the energy required to prepare quantities of different food items, which will provide
equal calorie of energy
Methodology
1. Select different food items of different food styles (Traditional Indian, Traditional to your
locality, modern food items, Chinese, etc.)
2. Identify the calorific value of each of the food items, by an expert consultation if necessary
3. Identify the quantities of different types of food items required to provide a particular, given
calorie of energy
4. List out the processes and duration in the course of preparation of each food item
5. Calculate the energy input in all the cooking processes for each item
6. Estimate the energy required for preparing each types of food required to produce particular
quantities of energy
7. The results can be illustrated by graphs, box plots etc.
8. Draw your conclusion.
Social relevance of the project
This study will help to identify the students to understand the energy costs of taste and lifestyle,
which will give a new outlook to the students about the real value of food and their energy
implications.
Project – III. Energy spent to stay fit
Introduction
Energy is a valuable resource of mankind. The resources should be conserved and used for
constructive purposes. Nowadays lot many people are regularly exercised in the health clubs
and gymnasiums to stay fit. Such exercises lead to burning extra calories of energy from the
food taken and avoid the cholesterol formation in the body. This can be easily overcome by
managing the qualities and quantities of food consumed,( which is very important in case of
country facing food security problems), and by a physically active lifestyle. An assessment of
the energy spent in health clubs and gymnasiums, we will get an idea about how much of the
energy which has to be used for the constructive purposes are being used to “stay fit”.
Objective
Quantify the energy requirement to stay fit

62
Materials required
Pen, papers, etc.
Methodology
1. Calculate the energy required in making a single step of one exercise by one person, e.g.
lifting 3kg of weight to a height of say 1 meter.
Thus , W=mgh
=3kgx9.8m/secx1meter ( where , m= mass, g=acceleration, h=height )
2. Note the numbers of times (n) the exercise is repeted.
3. Multiply n with w to get total energy (E1) spent by one person in one exercise.
4. Similarly calculate the total energy spent by one person in other type of exercises (
E1,E2,E3..... etc )
5. Find the total (E) and average energy spent by one person in one exercise
E1 + E2+......... + Ex / X = E
Where, X is the number of exercises .
6. Convert the energy in terms of calories
7. This spent energy on exercises can also be converted to some equivalent amount of typical
food.
Social relevance of the project
The students can identify better methods of energy used to” stay fit. This will also highlight the
significance of a physically active and productive life styles of people.
Project – IV. Festivals and change in energy consumption pattern– Impact on Society
Introduction:
Celebration of festivals in different parts of country witnesses increased energy interactions.
This may be by way of cooking, transportation, lighting, firecrackers, etc. Students may be
encouraged to explore the ways in which the celebration practices have changed over time and
their impact on the health of the community and eco-system.
Objectives:
1. To study the change in the pattern of energy uses in festivals
2. To find out the amount of energy consumed by a group of households during the festival
days.
3. To compare the energy consumption pattern in the society during festival days and non-
festival days.
63
4. To suggest ways to reduce the excessive/ unwanted use of energy during festival
celebrations
Methodology:
Sample: For the study the students should select, randomly, a group of households in their
locality. A suggested sample size could be 25-40 households.
Tools: Students should prepare the following types of tools under the guidance of their
teachers;
1. Check Lists of devices used, during the festivals, which consumes energy and the quantity of
material/fuels etc. procured and consumed during festival days.
2. Interview Schedules to collect information from the Heads of households about the practices
that require energy for celebrating festivals
3. Collection and analysis of electricity bills for the festival month(s) and non-festival month(s)
to find out the difference in the energy consumption, if any.
Techniques:
1. The students should visit the households before the festival and after the festivals to collect
relevant data and information.
2. If possible, they should collect the information from the field/sample by observing the
households during the festivals.
Analysis and Interpretation of the Data:
The data/information so collected should be analysed in view of the objectives of the study and
it should be interpreted to arrive at conclusions.
Expected outcome:
1. Suggestion of Eco-friendly efforts/measures to be taken up by the society while celebrating
the festivals
2. Awareness levels of public about energy saving techniques particularly for celebrating
festivals
3. Examining people’s sensitivity towards energy conservation while celebrating festivals
Project – V. Common transport facilities to minimize energy inputs and its social impacts
Introduction:
Human beings are mobile entities and movement from one place to the other is a basic human
requirement. We use energy to move from place to place. Before the advent of the modern
transport means, people used to walk, ride bi-cycle or go by pull rickshaw or animal pull carts.
The use of human and animal muscle power was utilized extensively during those days.
At present the dominant energy sources used for transportation is the fossil fuel or electricity. It
is noteworthy that in the absence of readily available public transportation system, people take

64
resort to private transportation system. Relying more and more on private transportation
increases the consumption level of energy for transportation. Moreover, such individualistic
approach of movement isolates the individual from society, reducing the social connectivity.
Adaptation of public transportation system helps not only reducing the overall energy
consumption but also promotes social connectivity irrespective of class creed and caste.
The idea of this project is to see how a good public transport system can impact the economic
growth of a society, equity, social harmony apart from reducing energy consumption.
Objectives:
The objective of this project is to –
1. Assess the change in means of transport in a locality over a long period of time and the
associated energy consumption pattern
2. Observe how the modernization of transport helped in economic growth of an area
3. Review people’s perception about equity and how common transport can foster harmony in
the society
Methodology:
1. Select an area for the study
2. Develop a questionnaire and interview senior citizens in the area about the change in
transport system and how it has impacted them
3. Interview common people about their perception of equity and their idea of travelling together
4. If there is a school bus / car pool system in any of the local school, interview some students
who come by bus and who come alone and find out their perception about ‘friendship’,
‘togetherness’ and ‘cooperation’
5. Find out the fuel consumption of a bus and a personal four wheeler / two wheeler. Calculate
the per capita consumption in public transportation system and in private transportation
system. Compare the results.
Expected outcome:
1. Children will understand how muscle power has been gradually taken over by the modern
conventional energy forms
2. Children will understand the impact of improved transport on the local economy
3. Children will understand the concept of ‘equity’ and value of ‘togetherness’
Extension/variation:
1. Similar projects may be carried out for common facilities in a village/ locality like a common
agriculture facilitation centre where all implements are commonly bought and shared or a
common biogas plant or a public toilet etc.
v) Suggestive project idea:
i. Assessing livestock value from energy perspective
65
ii. Innovative energy efficient stoves to utilize locally available bio-residues
iii. Carbon sequestration through community initiatives
iv. Comparison of animal draught power with machines
v. An investigation about the impact of energy availability on the change on lifestyle of the
people
vi. Traditional practice of backyard farming of the non-timber firewood species
vii. Experimental study on conscious reduction in energy use in the household
2.2.4. Energy and Environment
Energy is a basic necessity for survival and a critical factor affecting economic development. The
production and consumption of energy places a wide range of pressures on the environment and on
public health. Energy-related greenhouse gas (GHG) emissions remain dominant, accounting for 80 %
of the total emissions, with the largest emitting sector being electricity and heat production, followed by
transport.
The impact of energy on environment can be dealt at five levels: Production, Processing, Transmission,
Consumption and Disposal. Energy production, let it be hydel, thermal, nuclear, fossil fuel, biomass or
non conventional, has some impact on environment. Oil refineries pump a large quantity of GHS into the
atmosphere. The high voltage transmission line and petroleum transmission pipes cause some mishaps
in the environment. The greatest quantity of pollutants are emitted during the consumption of energy
and fuels. The consumption of energy in industry, health care, cooking, agriculture, entertainment,
housing, transportation, communication and in domestic domains have direct or indirect far reaching
impact on life supporting systems like air, water, land and ecosystems like forests, wetlands, rivers,
water sources, and biodiversity at large.
Beginning of agriculture and industrial revolution are considered as landmarks in human civilization.
During the progress of civilization the demand on energy also increased. Energy consumption rate is
considered an indicator of standard of living and development index of a country.
Coal was the source of energy to the early industries. The automobile explosion paved way for the
drilling of more fossil fuel, ultimately contributing to global warming and climate change. Hydel energy is
mainly at the expense of forest and other natural ecosystems and the livelihood of ecosystem people.
The fly ashes from the coal based thermal power plants pollute air, land and water. There are two main
environmental concerns about nuclear power, both mostly with regard to its potential impacts on human
health. One involves the highly radioactive products produced by nuclear fission inside power reactors.
The other is the disposal of nuclear waste. Safe disposal of nuclear plants whose life span is expired is
still a question.
Renewable energy technologies usually have less environmental impacts than fossil fuel, although
some concerns exist with respect to the environmental sustainability of particular types of biofuels.
About half of the world’s households use solid fuels (biomass and coal) for cooking and heating in
simple devices that produce large amounts of air pollution that is probably responsible for 4–5 percent
of the global burden of diseases.
The chief ecosystem impacts relate to charcoal production and fuel wood harvesting. The negative
impact of fuel collection on the local environment is also quite well known.
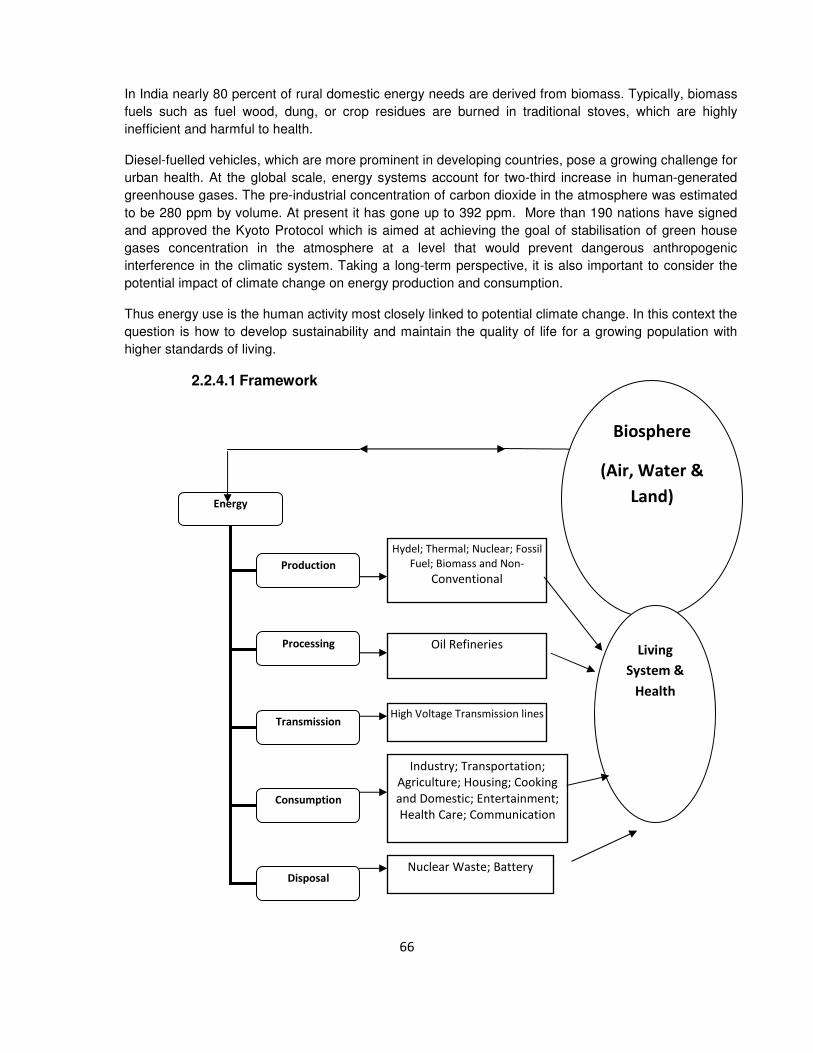
66
In India nearly 80 percent of rural domestic energy needs are derived from biomass. Typically, biomass
fuels such as fuel wood, dung, or crop residues are burned in traditional stoves, which are highly
inefficient and harmful to health.
Diesel-fuelled vehicles, which are more prominent in developing countries, pose a growing challenge for
urban health. At the global scale, energy systems account for two-third increase in human-generated
greenhouse gases. The pre-industrial concentration of carbon dioxide in the atmosphere was estimated
to be 280 ppm by volume. At present it has gone up to 392 ppm. More than 190 nations have signed
and approved the Kyoto Protocol which is aimed at achieving the goal of stabilisation of green house
gases concentration in the atmosphere at a level that would prevent dangerous anthropogenic
interference in the climatic system. Taking a long-term perspective, it is also important to consider the
potential impact of climate change on energy production and consumption.
Thus energy use is the human activity most closely linked to potential climate change. In this context the
question is how to develop sustainability and maintain the quality of life for a growing population with
higher standards of living.
2.2.4.1 Framework
Energy
Production
Consumption
Disposal
Transmission
Processing
Hydel; Thermal; Nuclear; Fossil
Fuel; Biomass and Non-
Conventional
Oil Refineries
High Voltage Transmission lines
Industry; Transportation;
Agriculture; Housing; Cooking
and Domestic; Entertainment;
Health Care; Communication
Nuclear Waste; Battery
Biosphere
(Air, Water &
Land)
Living
System &
Health

67
i) Model Project
Project –I. Environmental impact of large Coal based Thermal Power Plants
Background:
The large thermal plants exhaust a large quantity of fly ash to the surroundings. This is found to
be having impact on the ecosystem and human health in the vicinity. Knowledge on the impact
of such projects will help us plan better and mitigate the problems.
Objective
• Impact assessment of fly ash and other pollutants on human health
• To analyse the impact of pollutants to the local ecosystems
• To study the impact of pollutants at different distance zones in the locality
Methodology:
1. Back ground information on the power plant
• The year of installation
• Capacity
• How much fuel is used per day during the operation
• The approximate quantity of fly ash and other pollutants generated per unit time while
operation
• How much water is used for the operation and source of the water
• The method of disposal of fly ash and pollutants
Story from the field
Silent Valley- a success story
Silent Valley is a tropical rain forest, about 90 square kilometers, in the Western Ghats, on the south -western flank of the Nilgiris, in
Kerala. There was a proposal from the Kerala State Electricity Board for constructing a large dam across river Kunthi which
originates from the valley, for power generation. There is no human habitation in the Silent Valley or in its immediate vicinity. The
move to construct the dam was intensified in the mid 1970s. Many enlightened environmentalists in the state and also from the
country started voicing against destroying a prime evergreen forest ecosystem in the name of electricity. Soon it became a
movement – the Save Silent Valley Movement. India's Great ornithologist Salim Ali also was there in the forefront. They argued that
power can be generated in many ways, but if the rain forest is destroyed once will be lost for ever. Silent Valley and nearby forests
supported a good population of endemic Lion Tailed Macaque (Macacca silenus), which has been listed as “Endangered” by the
IUCN. At last in 1984 Prime Minister Smt. Indira Gandhi decided to abandon the project on ecological reasons and the area was
declared a national park. On 7th September 1985, Silent Valley national park was formally inaugurated by Rajiv Gandhi, the then
Prime Minister of India.

68
2. Collection of information on the impacts on environment
• First a rough map of the area with the power plant in the center and the human
habitations and other ecosystems in the surrounding area
• Two or three circles around the power plant should be determined at various radii say,
with in 1 km, between 1 and 3 km, between 3 and 5 km.
• Collect direct information on health problems if any by a standard survey method from the
households within the selected circle.
• Here the student will have to probe from the elders incidents of lung, skin and other
health problems before and after the installation of the plant.
• The information thus collected can be substantiated by studying the records in the nearby
health centre and hospitals.
• Interviews with doctors and other health workers in the vicinity is to be conducted to
assess the health status of the people living at various distances from the plant.
• Surface and ground water quality are to be assessed in terms of colour, solids, pH etc.
Outcome
• The student will be getting an idea on the impact of large coal based power plants on
environment and on human health and the living systems.
• By taking samples at different distances from the plant the distribution of the pollutants in the
environment and the impact at different zones can be assessed.
• This will help in understanding the probable impacts of any such large installation in the
populated areas.
Project -II. The impact of deposition of suspended particles on photosynthesis
Background:
The suspended particles generated from the industries and big thermal power plants get settled
on the surface of leaves blocking the sunlight and stomata openings. This will have an impact
on the capacity of plants in fixing of solar energy. Plants being the primary producers all the
units in the food chain, the whole ecosystem will be adversely affected.
Objective:
• To find out the impact of solid deposition on foliages on the rate of photosynthesis
Methodology:
• Potted plants or plants in the garden or in natural condition the vicinity can be used for
experiment.
• The plants should be in the out door in convenient places.
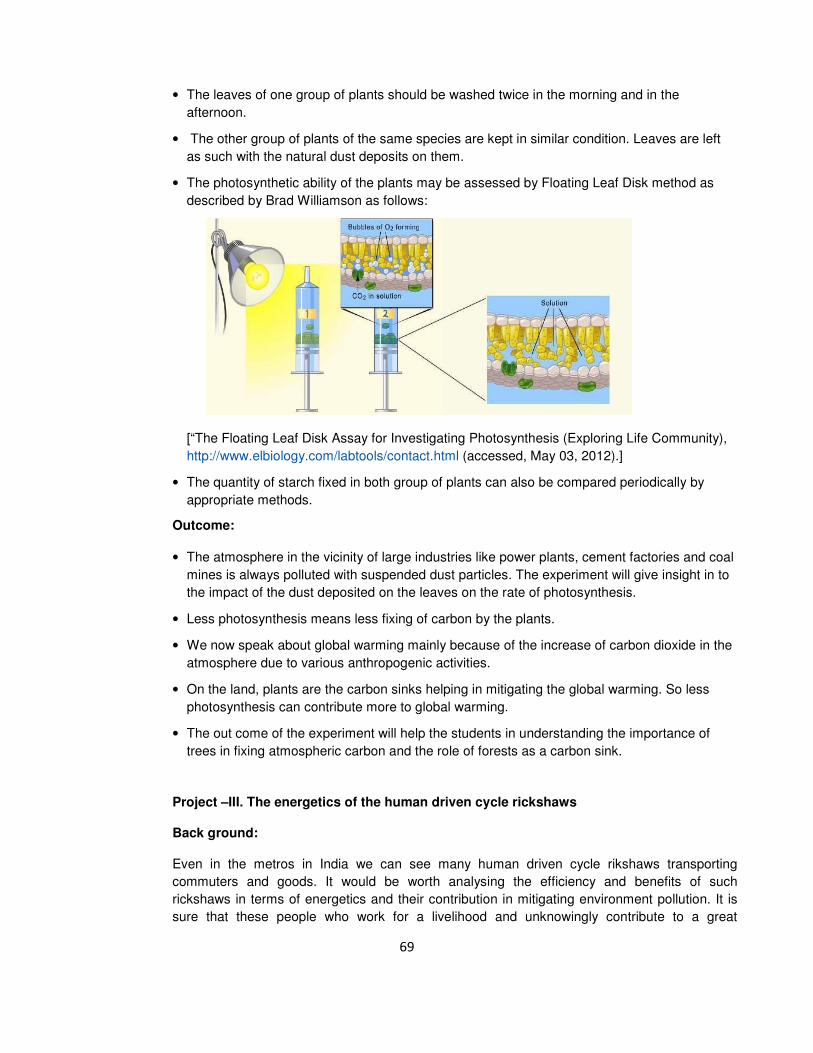
69
• The leaves of one group of plants should be washed twice in the morning and in the
afternoon.
• The other group of plants of the same species are kept in similar condition. Leaves are left
as such with the natural dust deposits on them.
• The photosynthetic ability of the plants may be assessed by Floating Leaf Disk method as
described by Brad Williamson as follows:
[“The Floating Leaf Disk Assay for Investigating Photosynthesis (Exploring Life Community),
http://www.elbiology.com/labtools/contact.html (accessed, May 03, 2012).]
• The quantity of starch fixed in both group of plants can also be compared periodically by
appropriate methods.
Outcome:
• The atmosphere in the vicinity of large industries like power plants, cement factories and coal
mines is always polluted with suspended dust particles. The experiment will give insight in to
the impact of the dust deposited on the leaves on the rate of photosynthesis.
• Less photosynthesis means less fixing of carbon by the plants.
• We now speak about global warming mainly because of the increase of carbon dioxide in the
atmosphere due to various anthropogenic activities.
• On the land, plants are the carbon sinks helping in mitigating the global warming. So less
photosynthesis can contribute more to global warming.
• The out come of the experiment will help the students in understanding the importance of
trees in fixing atmospheric carbon and the role of forests as a carbon sink.
Project –III. The energetics of the human driven cycle rickshaws
Back ground:
Even in the metros in India we can see many human driven cycle rikshaws transporting
commuters and goods. It would be worth analysing the efficiency and benefits of such
rickshaws in terms of energetics and their contribution in mitigating environment pollution. It is
sure that these people who work for a livelihood and unknowingly contribute to a great
70
environmental cause should be rewarded with the dividends from some green funds. Most of
the people bargain for a cheaper ride with these people. Such a bargaining is usually not made
with the motorised rickshaws and taxis. If at all we try to begin a bargain suddenly we are
silenced by putting forth the periodic hike in the petroleum fuel and spare parts price. Here we
pay more money and also cause to contribute to global warming.
Objective
• To assess the energetics of the human drawn cycle rickshaws
• To assess the contribution of certain strata of people in mitigating the global warming
Methodology:
• To begin with it is better to gather information on the number of cycle rickshaws operating in
the proposed area of work.
• In large towns and metros the students can target a particular locality and later extrapolate
the result for the entire town.
• It is better to befriend with the rickshaw peddlers/pullers and gather information on the
average distance they travel every day/ every week by a structured questionnaire method.
• The student can calculate the quantity and cost of the fuel for riding similar distances in
motorised rickshaws.
• From the quantity of fuel that would have been used for these travels in rickshaws using
fuels, the environment cost also can be calculated in terms of carbon dioxide and other
pollutants.
• Extrapolation of the result will give an indication on the energetics of travel in the entire town
or metros and the contribution of the people driving the rickshaws.
Out come:
• The result generated by way of this project will give the student an idea on the energetics of
the travels in motorised rickshaws/ vehicles and other vehicles.
• It is better to understand that the people at the lower strata of the society contribute to the
cause of environment protection during their livelihood processes.
Project -IV. Use of bio-resources as fuel in the kitchen and the impacts on health of
women
Introduction:
Human beings need tremendous amount of energy for their day to day life. One of the main
household energy requirements is the fuel for cooking. The cooking energy depends to a large
extent on the locally available bio-resources. Due to inefficient device and chullahs the fuels are
partially burnt and produce more smoke and less energy. The women who are continually
exposed to noxious gases in the poorly ventilated kitchen suffer from various health problems.
This project highlights the importance of need of efficient chullahs and devices that will safe
guard the health of women.
71
Objective:
To explore the traditional use of bio-resources as cooking fuel and the probable impact on the
health of women
Methods:
i. Select a study site in the vicinity
ii. Questionnaire may be developed and survey can be done to understand the cooking device
used in the households and the health problems suffered by the women.
iii. The records in the local health centers and hospitals may be verified for further information
and the general trend in the village. Additional information may be collected from the
doctors in the local hospitals.
iv. Look for any correlation between the health problems and the energy devices in the kitchen
v. Suggestions may be made for minimizing the health hazards in the kitchen and the
probable modifications in the devices.
Expected outcome
• Understanding the correlation between the energy sources, efficiency of the devices in the
kitchen and the probable health hazards.
• Enabling the children to suggest more energy efficient type of chullahs and saving of fuel
wood safe guarding the healthy environment in the households.
• Saving fuel by way of efficient devices will safe guard the bio-resources in the vicinity
ii) Suggestive project idea
• Environment impact of power plants -fly ash and the probable impact on biodiversity and
human health
• Automobile pollution- impact on human health- Sufficient samples can be drawn from Traffic
police and auto drivers in the urban areas who had at least 10 year exposure to urban
exhaust ridden environment. The pollution status can be assessed by some simple
methodologies. The medical record and health history of the selected human samples can be
looked into with their permission and cooperation. Can be analyzed for any possible
correlation.
• Impact of hydel dams on the local environment, ecosystem, biodiversity and local tribal
community
• Environmental impact assessment of a proposed hydel or any other power project on the
local ecosystem and communities
• Kitchen Smoke – In large majority of houses in the rural India fire wood or coal are used in
poorly ventilated kitchens. Continuous exposure to CO and other pollutants in the kitchen can
result in some kind of health problems among the house wives and small children getting
exposed to such noxious gases in poorly ventilated environment.
• Pollution of the aquatic bodies by the water disposed off from the thermal plants

72
• Animals dead on the power lines: many animals are electrocuted in the rural and urban
areas. An analysis can be made on such incidents and suggestions can be given to mitigate
such mishaps
• Insects congregating around lights and probable impact on its population
• Congregation of insects around lights and congregation of predators like geckos and
probable impacts
• Impact of wind generators of birds and other animals: Though a devise for non conventional
energy there are reports how with the blades of wind turbines are causing death of birds,
including the migrants.
• Impact of pollution from the coal mining areas on the drinking and irrigation water
• Impact of sulphur and dust accumulation on agriculture in the neighbourhood of mining areas.
• Energy consumption in the brick industries- firewood utilisation and probable impacts
• Fire wood collection and probable impact on forest and biodiversity
• Photosynthesis – in dust polluted environment and dust free environment.
• Agriculture- energy utilisation in different agriculture practices and its impacts
• Energy utilisation in different irrigation practices and efficiency of the system
• Energy in land preparation, harvesting, transportation and processing and cost benefit
analysis and probable alternate ways.
• Energy efficiency of food in terms of energy consumption and energy yield
• Energetics of human driven rickshaws
• Battery disposal and impact on environment- impact on animals like earth worms and other
soil micro-fauna.
• Solid waste – probable impact on environment while energy production. A lot of dioxin,
sulphur dioxide, carbon monoxide, carbon dioxide and other toxic gases are released into the
atmosphere during the process. The students can suggest alternate ways for the disposal of
the wastes.
73
2.2.5. Energy Management and Conservation
Energy is the driver of growth. International studies on human development indicate that India
needs much larger per capita energy consumption to provide better living conditions to its
citizens. But such growth has to be balanced and sustainable. Two important concepts here are
energy management and conservation.
Planning commission of India has estimated that India has conservation potential at 23% of the
total commercial energy generated in the country. India’s energy requirement comes from five
sectors; agriculture, industry, transport, services and domestic, each having considerable
saving potential. For example, energy costs amount to 20 percent of the total production cost of
steel in India which is much higher than the international standards. Similarly the energy
intensity per unit of food grain production in India is 3 – 4 times higher than that in Japan.
Sustainable growth also implies that our energy management and energy conservation
measures are eco-friendly and accompanied by minimum pollution, in particular minimum
carbon emission. The key concepts of this subtheme are elaborated below.
Energy Management
The fundamental goal of energy management is to produce goods and provide services with the
least cost and least environmental effect.
Definition
Energy management is a process that not only manages the energy production from different
energy harvesting resources (solar, nuclear, fossil fuel) but also concerns optimal utilization
at the consumer devices.
Another comprehensive definition is "The judicious and effective use of energy to maximize
profits (minimize costs) and enhance competitive positions"
Objective
The objective of Energy Management is to achieve and maintain optimum energy procurement
and utilisation, throughout the organization and:
• To minimise energy costs / waste without affecting production, comfort and quality To
minimise the environmental effects.
Energy Conservation
Energy, irrespective of its form is a scarce commodity and a most valuable resource. However,
if we look at the predicted future human population figures and consider the probability that the
individual life expectation will increase, we see that energy could, in the future, be in short
supply. Unless that supply is increased, it will be a source of friction in human affairs.
Energy Conservation is the deliberate practice or an attempt to save electricity, fuel oil or gas or
any other combustible material, to be able to put to additional use for additional productivity
without spending any additional resources or money.
Objective
Broadly energy conservation program initiated at micro or macro level will have the following
objectives:
74
a. To reduce the imports of energy and reduce the drain on foreign exchange.
b. To improve exports of manufactured goods (either lower process or increased availability
helping sales) or of energy, or both.
c. To reduce environmental pollution per unit of industrial output - as carbon dioxide, smoke,
sulphur dioxide, dust, grit or as coal mine discard for example.
What is Energy Conservation?
Energy conservation is achieved when growth of energy consumption is reduced, measured in
physical terms. Energy conservation can, therefore, be the result of several processes or
developments, such as productivity increase or technological progress.
Energy conservation and Energy Efficiency are separate, but related concepts.
Energy Efficiency
Energy Efficiency is achieved when energy intensity in a specific product, process or area of
production or consumption is reduced without effecting output, consumption or comfort levels.
Promotion of energy efficiency will contribute to energy conservation and is therefore an integral
part of energy conservation promotional policies.
For example, replacing traditional light bulbs with Compact Fluorescent Lamps (CFL) (which
use only 1/4th of the energy to same light output). Light Emitting Diode (LED) lamps are also
used for the same purpose.
Energy Conservation Opportunities (ECOS)
Opportunities to conserve energy are broadly classified into three categories:
i) Minor ECOs
These are simple, easy to implement, and require less investment implementation time. These
may correspond to stopping of leakage points, avoiding careless waste, lapses in housekeeping
and maintenance etc.
ii) Medium ECOs
These are more complex, and required additional investment and moderate implementation
time. For example, replacement of existing household appliances by new energy efficient ones.
iii) Major ECOs
These provide significant energy saving. They are complex and demand major investment
and long implementation periods. For example, replacement or major renovation of old
buildings, machineries etc.
Barriers to Energy Conservation
While there is considerable scope for energy conservation in our country, there also exist many
barriers to it. For example Psycho – social (people do not like to change: social taboos and
traditions), Economic (replacement is often costly).
75
Energy Audit
Energy Audit is the key aspect of energy conservation and management.
Definition
Energy audit is defined as “The Verification, Monitoring and Analysis of use of energy including
submission of Technical Report containing recommendations for improving energy efficiency
with cost benefit analysis and an action plan to reduce energy consumption”. (Ref: Bureau of
Energy Efficiency Guidelines; http://www.beeindia.in/)
• Energy Accounting
Energy accounting simply means record of energy used in an establishment for comparison
against a budget or another standard of performance.
• Systematic Approach To Decision Making
Energy Audit is the key to systematic approach for decision making in the areas of energy
management. It attempts to balance the total energy inputs with its use and serves to identify all
the energy streams in a facility. It quantities the energy usage according to its discrete
functions.
• Effective Tool for Energy Management
Energy Audit is an effective tool in defining and pursuing comprehensive energy management
programme. In this field also, the basic functions of management like planning, decision making,
organizing and controlling, apply equally as in any other management subject.
• Ways of Usage of Energy
Energy Audit will help to understand more about the ways energy and fuel are used in any
establishment, and help in identifying the areas where waste can occur and where scope for
improvement exists.
• Construction and Stream Lining
The Energy Audit would give a positive orientation to the energy cost reduction, preventive
maintenance and quality control programme which are vital for production and utility activities.
• Ideas and Feasible Solution
In general, Energy Audit is the translation of conservation ideas into realities, by blending
technically feasible solutions with economic and other organizational considerations within a
specified time frame.
In brief energy audit is an in-depth study of a facility to determine how and where energy is
being used or converted from one form to another, to identify opportunities to reduce energy
usage, to evaluate the economics and technical practicability of implementing these reductions
and to formulate prioritized recommendations for implementing measures to save energy.
Scope of Energy Audit
1. Analyze present consumption and past trends in detail.
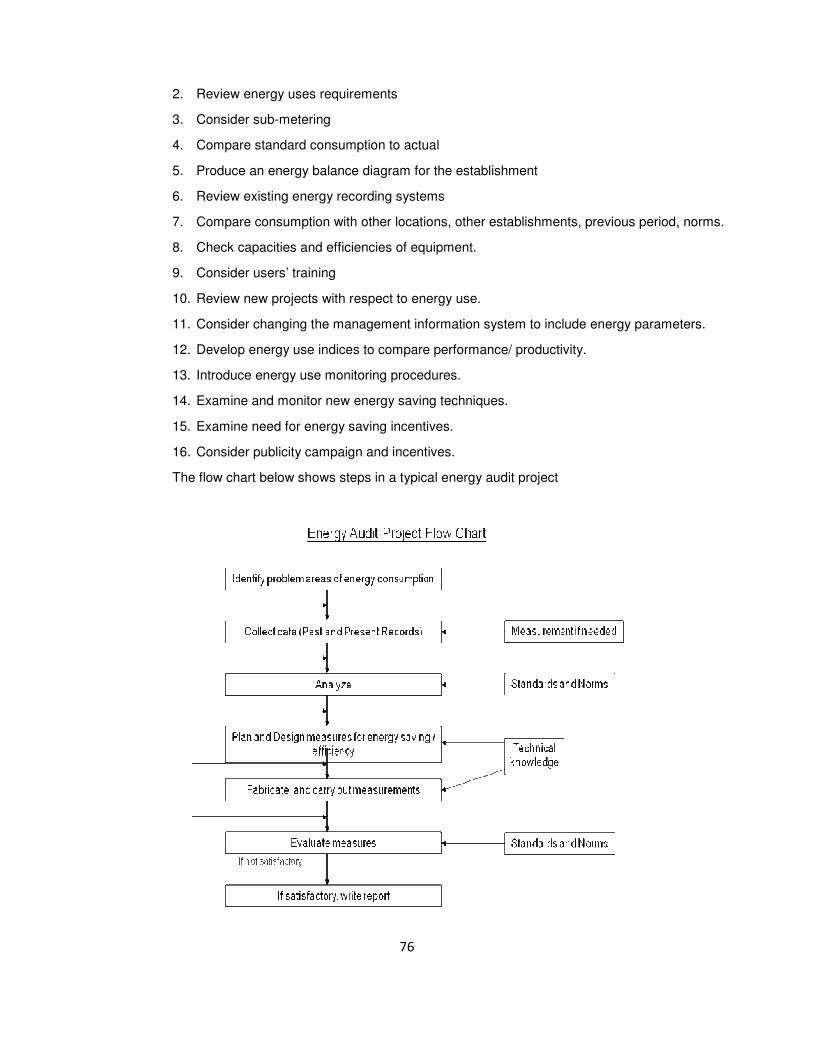
76
2. Review energy uses requirements
3. Consider sub-metering
4. Compare standard consumption to actual
5. Produce an energy balance diagram for the establishment
6. Review existing energy recording systems
7. Compare consumption with other locations, other establishments, previous period, norms.
8. Check capacities and efficiencies of equipment.
9. Consider users’ training
10. Review new projects with respect to energy use.
11. Consider changing the management information system to include energy parameters.
12. Develop energy use indices to compare performance/ productivity.
13. Introduce energy use monitoring procedures.
14. Examine and monitor new energy saving techniques.
15. Examine need for energy saving incentives.
16. Consider publicity campaign and incentives.
The flow chart below shows steps in a typical energy audit project

77
2.2.6 Energy Planning and Modelling
Planning is a process for developing a system and approach to full fill a predefined goal and
objectives on the basis of reviewing the present scenario. Planning is meant for betterment. This
betterment can be the strengthening resource base, efficient resource utilization and fulfilment of
human needs. In case of energy planning it is targeted for fulfilling the present energy needs in
an optimum and efficient way so that it may not destroy its ability to fulfil the future needs.
Story from the field
Village level biogas plant as source of cooking fuel
A village in Kolhapur district of South Maharashtra has very effectively implemented this eco-friendly project. It uses gobor from the villege for running a Gobor Gas Plant which supplies cooking fuel to the village. Earlier the villagers used wood as a fuel for cooking. They are now saving 113 Tonnes of wood per year, which means saving forest trees over a large area. The villagers are very proud of their achievement which they have been able to do with the help of a NGO.
Irrigation without expenses for energy
The same village under the guidance of the same NGO has taken up another energy saving project. The village has set up a water reservoir on a hill 4.5 Km. Away. The reservoir supplies water almost round the year. The villagers have laid pipe lines which reach their farms and irrigate them. The water flows from the reservoir to the farms by gravity and no pump is needed for the irrigation. It is estimated that the villagers are saving about 70,000 units (KWHrs.) of electricity annually by this method. In money terms, this is saving of about Rs. 4,00,000/- per year. It is to be noted that, the farms are set up on 48 acres of waste land. So, land which was useless, has been made productive at practically zero recurring cost, an achievement certainly remarkable.
Source: www. Venumadhuri.org
Planning Assess the present situation and identify needs
Define goal and objectives
Identify ways and means
Design and establish system of operation
Monitoring and evaluation
Feed
back
78
Planning is a process for accomplishing purposes. It is a blue print of growth and a road map of
development. It helps in deciding
objectives both in quantitative and
qualitative terms. It is setting of goals
on the basis of objectives and keeping
in the resources. A plan can play a vital
role in helping to avoid mistakes or
recognize hidden opportunities.
Planning helps in forecasting the future,
makes the future visible to some extent.
It bridges between where we are and
where we want to go. Planning is
looking ahead.
Forecasting is the process of making
statements about events whose actual outcomes (typically) have not yet been observed. A
commonplace example might be estimation for some variable of interest at some specified
future date. Prediction is a similar, but more general term. Both might refer to formal statistical
methods employing time series, cross-sectional or longitudinal data, or alternatively to less
formal judgemental methods. In any case, the data must be up to date in order for the forecast
to be as accurate as possible. Forecasting can be described as predicting what the future
will look like, whereas planning predicts what the future should look like.
Scientific modelling is the process of generating abstract, conceptual, graphical or mathematical
models of an event. Science offers a growing collection of methods, techniques and theory
about all kinds of specialized scientific modelling. Modelling is an essential and inseparable part
of all scientific activity, and many scientific disciplines have their own ideas about specific types
of modelling. There is an increasing attention for scientific modelling in fields such as of
philosophy of science, systems theory, and knowledge visualization. Traditionally, the formal
modelling of systems has been via a mathematical model, which attempts to find analytical
solutions enabling the prediction of the behaviour of the system from a set of parameters and
initial conditions.
One application of scientific modelling is the field of "Modelling and Simulation", which has a
spectrum of applications which range from concept development and analysis, through
experimentation, measurement and verification, to disposal analysis. Projects and programs
may use hundreds of different simulations, simulators and model analysis tools.
A simulation brings a model to life and shows how a particular object or phenomenon would
behave. Such a simulation can be useful for testing, analysis or training in those cases where
real-world systems or concepts can be represented by models.
Energy planning and modelling:
Economic growth of a country is strongly dependent on the availability and access to energy.
More than half the population of India does not have access to electricity or any form of
commercial energy. Meeting the energy access, challenges and ensuring lifeline supply of clean
energy to all, requires planning in capacity building and supply. The challenge is to ensure cost-
A scientific model brings out the simplified pattern out of complex data collected, analysed and interpreted in a study. This sub-theme differs from the rest of the sub-themes by bringing out the general concept and future predictions in a more abstract form. Without this specific generalization, the concerned project may become part of the other sub-themes. Please note that planning and modelling processes are completely different from making physical or working models of the systems under study. Model making is discouraged, in principle,
in Children’s Science Congress at all levels

79
effective energy supply at the same time conforming to norms set for minimizing global
warming. Since the energy section involves large gestation lags, long-term planning is essential.
The projected energy requirement of the fossil energy source in 2030 is cited below.
According to planning commission of India, the country needs to increase its primary energy
supply by 3 to 4 times, and electricity generation capacity by 5 to 6 times, if it is to meet the
energy needs of all its citizens by 2032 and maintain an 8 % GDP growth rate. Despite a
continuous increase in total installed capacity, the gap between supply and demand continues
to increase. The underlying reason for such a demand is a growing population, urbanisation,
industrial production, and income.
As far as India is concerned, coal will remain the major energy resource. Coal demand in 2011-
12 is projected to be 731.1 million tonnes, whereas the projected domestic availability is only
680 million Tonnes. So, there is a shortage of 51.1 million Tonnes for 2011-12 even in the
projected scale. The energy demand-supply gap (peak) in 2009, 2009 and 2011 were 11.7%,
12% and 13.4%, respectively. The distribution of primary commercial energy resources in the
country is quite skewed. 70% of the total coal reserves is concentrated in eastern India,
whereas the western part accounts for over 70% of the hydrocarbon reserves. Similarly the
north has more than 70% of the total hydro potential. This leaves the south with only 6% of the
total coal reserves and 10% of the total hydro potential. The above data summarises the need
to plan the augmentation of renewable energy resources and strategies for effective distribution
of energy to the entire populace. With energy saving potential of 25%, 30, 20%, 20%, 20% and
23% in industrial, agricultural, domestic, commercial, transport, and other sectors, respectively,
there is plenty of scope for planning.
For India there is a need for integrated energy planning. This means that at a particular place
we must have multiple energy sources and these sources can be used depending upon the
particular requirement i.e., for low grade work high grade energy should not be used. Hence
there is need of integrated energy planning and for that appropriate models are required and in
these models renewable energy sources will play a very vital role. Hence we need to explore
renewable energy options at all levels.
The need and relevance of energy forecasting is hence obvious. .Various new tools and
methods for forecasting have been developed. In the past, straight-line extrapolations of
historical energy consumption trends served well. However, with the onset of inflation and

80
rapidly rising energy prices, emergence of alternative fuels and technologies (in energy supply
and end-use), changes in lifestyles, institutional changes etc, it has become imperative to use
modelling techniques which capture the effect of factors such as prices, income, population,
technology and other economic, demographic, policy and technological variables. The ethical
pressure to use more of renewable and green energy has further complicated the prediction
process. There is an urgent need for precision in the demand forecasts. In the past, the world
over, an underestimate was usually attended to by setting up turbine generator plants fired by
cheap oil or gas, since they could be set up in a short period of time with relatively small
investment. On the other hand, overestimate was corrected by demand growth. Short-term
demand forecasting also plays a role in the process of regulation. A precise estimate of demand
is important for the purpose of setting tariffs. A detailed consumer category-wise consumption
forecast helps in the determination of a just and reasonable tariff structure wherein no consumer
pays less than the cost incurred by the utility for supplying the power.
2.2.6.1 Framework
81
i) Model Project
Project -I. : Micro-level energy planning and modelling – start from your school
At micro-level, which comprise of your home, classroom, school, village or the likes, you can
take up projects on energy planning and modelling. But before venturing into this let us
understand the reason for undertaking it. Applications of energy are varied and for same
application, different energies can be utilized, thus at the first step we need to understand
energy services. Say for example, if drying clothes is an objective, it can be achieved by
electricity (dryer in washing machine) or sunlight (spreading under the sun). So we need to
identify the application and options available for energy services. In short, planning is nothing
but matching the need with sources available for optimization.
An exercise to be carried out at your school
1. Identify any one key area which you intend to plan for, let us say, fuel consumption.
2. We know that students reach school either walking, cycling, by school bus, public transport
or their own vehicles. Now fuel is being consumed while you and / or your friends are being
dropped and / or picked up from the school. Since vehicles are not only guzzlers of fuel but
also loads the environment with pollution, which necessitates planning for optimal utilization
of energy resources, and this can be done in the following way;
3. To begin with you need to collect some basic information like;
a. Number of students in your class / school
b. Number of students coming to school by different modes (i) walking, (ii) cycling, (iii) two
wheeler, (iv) four wheeler, (v) shared vehicle, (vi) school bus, (vii) public transport, or (viii)
others
c. For two and four wheelers used, how much is the mileage given by the vehicle (km/litre)
and how many trips are made by the vehicle (it would be 4 if dropped and picked up by
someone and 2 if vehicles are self-driven
����������
Children like you who tried their hands on such ideas, not only developed the models but also won the laurels at
national and international levels.
Electricity production at Sabarimala
Sabarimala, a pilgrimage site in Kerala, is thronged by around ten million devotees who offer coconut filled with
clarified butter (ghee) which is placed in the burning fire. The continuous fire burning for almost three months
period generates a lot of heat energy, which if is trapped and utilized for steam generation; enormous amount of
electricity can be produced thereby to take care for the requirements for festival period.
Self-cooling of CPU
CPU, which gets heated with continuous use of the computer, if is covered with jacket carrying water, the water
gets condensed and in turn keep the CPU cool.
����������

82
d. Also gather information about the distance of their residence from the school
e. Depict the data graphically and analyse.
4. Analysis of data would include fuel consumption by two and four wheelers used on daily
basis. This would provide you with an idea about level to which fuel can be conserved. In
addition, how much level of air and sound pollution (carbon dioxide load and decibel levels)
is added to the environment.
5. Next step is to identify options available, say for example switching to walking, cycling,
school bus or public transport or any other idea that you have (like car pool, motorized
bicycle)
Continuing with the same idea let us further expand and find out how energy modelling
can be done?
We have understood that the present trend is to use vehicles including self-driven, which
speaks of the pattern for future. Presuming that in times to come everyone would be driving
motorized vehicles (e.g., motorized bicycle) to reach school let us develop a model for the
same.
Issues related to such vehicles are needed to be identified; charging of batteries of these
vehicles being the most important of the all. Can we tap solar energy for this purpose? If yes,
where can we install the charging units, at home or at school? How many hours we are at
school, and can that period be utilized for charging the vehicles?, If yes, then where and how
many solar panels are to be installed, how much charging is required for one vehicle, presuming
10% of the students switch over to such vehicles, what would be total requirement in your
school? Go on working with open ended questions and at the end you would come up with
certain model which would indeed be a cost-effective and eco-friendly solution to the problem
you had identified at the beginning.
Project II.: Planning for energy-efficient buildings
At present the buildings are using a lot of energy, even in the day when sun is there the
buildings are designed in such a way that we need to switch on the lights and this results in
wastage of energy. The buildings also require a lot of cooling for comfort. If the buildings are
designed for north south orientation, glare free daylight and with appropriate shading devices
this would reduce a lot of energy requirement in the buildings. If the predominant wind direction
is also taken into account while planning for buildings then this would reduce a lot of cooling
requirement in the buildings. If the building walls are properly insulated this would reduce a lot
of cooling requirements in the buildings.
Each and every building should be a hub of innovation and energy efficient practices. The
building should be aesthetically designed with several features of passive solar design, energy-
efficiency and water and waste management systems. Following is the detailed outline of the
different energy conservation measures that should be taken at any building
• Passive solar design
• Glare-free daylight
• North South orientation

83
• Minimum windows on East West and South facades
• Shading devices on
The predominant wind direction should be taken into account in designing the open space.
Energy-efficient lighting and daylight integration
• Recess mounting luminaire fitted with CFL for task lighting.
• Surface mounted single/twin horizontal mounting CFL downlighter for task lighting and
common areas.
• High lumen output and controlled light distribution
• Fitted with mirror optics reflectors and batwing louvers for glare-free uniform illumination
• Energy saving electronic ballast should be used
• Lighting load reduced can be reduced from 2 W/sqft to 1 W/sqft
• Where daylight is available, fixtures fitted with continuous dimming electronic ballast These
fixtures controlled by light sensors
• In areas with non-uniform illumination, occupancy sensors should be installed
• Overall energy-saving potential is 70%
Thermal Insulation of Walls
Use of efficient double glazing window units helps significantly reduce the heat gained through
window glazing in the summers and the heat lost in the winters without compromising on the
day lighting integration and the levels of visual comfort. The walls that are exposed to the harsh
solar rays have a stone cladding which is fixed to the wall by channels. The air gap between the
wall and the stone cladding by itself acts as an insulation layer. On the facades rock wool
insulation is also provided in the wall. Energy efficiency is further proposed to be enhanced by
insulation in the roof slab
The Campus should be equipped with three types of cooling systems;
The variable refrigerant system Volume (VRS) system.
This modern type of Air conditioning system which is similar to a split AC is highly efficient
under partial loading conditions and beneficial to areas with varying occupancy. It allows
customized control of individual zones, eliminating the use of chilled water piping, ducting and
piping room.
Earth Air Tunnel (EAT)
The EAT can be used in rooms uses the heat sink property of the earth to maintain comfortable
temperatures inside the building. The air that passes through the buried pipes gets cooled in
summer and heated in winter. Depending upon the severity of the climate, supplementary

84
system can be used. This gives energy saving of approximately 50% as compare to
conventional system.
Thermal mass Storage
Thermal mass storage involves storing energy when available and using when required. Here
cooling of thermal mass is done during night. This cool thermal mass is used to cool air in day
time. This system gives an energy saving of almost 40%.
Water Management
• Buildings in the campus should be provided with low-flow fixtures such as dual flush toilets
and sensor taps
• This would result in 25% savings in water use
Waste Water management
• Treatment of waste water generated from the by biological process using a combination of
micro-organisms and bio-media filter
• Low area requirement for this treatment plant
• Treated water meets the prescribed standards for landscape irrigation
• Very low energy consumption for operation of the treatment plant
Rain Water harvesting
• Rainwater run-off from roof and the site will be used for recharge of aquifer through
• Enhance the sustainable yield in areas where over-development has depleted the aquifer
• Conservation and storage of excess surface water for future requirements
• Improve the quality of existing groundwater through dilution
Project-III. : Modelling grey water recycling in a colony
Factors such as growing population, decreasing quality of water resulting from pollution, and
augmenting requirement of expanding industries and agriculture all lead to increasing demand
for drinking water. It is estimated that one third of the world’s population will suffer from chronic
water shortage by the year 2025. India has already started facing impending crisis, most visible
in the cities. The receding water level in supply sources also result in the shortage of water. On
top of it the limited supply hours amplify the scarcity effect of water.
Under these circumstances one needs to plan for optimizing the utilization of the precious
commodity - water. There are several ways by which we can plan for the conservation of this
nature’s gift and one of which is recycling. Again, recycling could be achieved through various
means and one of which is recycling of grey water. Grey water, the water drained out from our
bathrooms and kitchen, is being wasted in enormous amounts every day, by each household.
Before you plan to design a model for grey water recycling in your locality or colony, you need
to collect some basic information, including;
85
1. No. of houses
2. No. of households
3. Amount of water consumed per day (from monthly water bill of individual house or entire
building as the case may be)
4. No. of vehicles of the residents
5. Amount of water used for washing the vehicles and frequency (daily, alternate days,
weekly)
6. Presence of garden in the colony or locality
7. Duration and frequency for which the park is watered
8. Amount of water used up in watering the garden
Based on this information and with the help of certain standards available, calculate amount of
water being drained out as grey water from bathrooms and kitchen in the colony. Now add the
amount of water being used up by washing of vehicles and watering the garden area. Can you
make a plan for your colony or locality on these facts and figures, wherein grey water if recycled
can be used for washing of vehicles, watering of the garden, and in addition, provided for
flushing purpose to the toilets in every house.
Projection for optimal utilization and conservation of water would not only cheer you up but also
ensure the smile on the faces of future generation.
Project IV. : Assessing present energy usage and projection for future requirement
Now let us consider your village or locality, wherein we would explore usage of energy and
based on which we would try to project future requirements. To begin with, we would find out
and collect following information on different applications and types of energy used;
1. Total energy used for cooking
a. No. of LPG cylinders required for a month
b. Total weight of fuel woods required
c. Other sources used like electricity for heating (total wattage /1000 * number of hours
used per day), kerosene, charcoal etc.
2. Total energy used for other types of heating
3. Total energy required for lighting like electricity, kerosene or other types of lamps used
4. Total fuel consumed for travelling including daily usage like going to school/office etc. and
occasional travelling
5. Total energy used for agriculture, may be in the homestead for watering, ploughing and also
the man-days used.
6. Total energy used for entertainment like TV, music systems etc. or AC.
After summing the energy used for different purposes, divide the total by the number of
members of each of the sample household of each group. The average of the total energy
utilized for each group would give us the per capita energy requirement.
86
Based on the trend of rise in population, the data for which can be obtained from the census
information or competent authorities, of previous three decades, we can project the future
population of the locality. This would give us the total energy requirement for an area. Likewise,
we can also assess the energy requirement for different applications; like cooking, lighting,
agriculture, etc.
ii) Suggestive Project Idea
i. Assessing the energy (solar, wind and biomass) generation potential of any particular
society or village
ii. Economic projections for energy generation from local energy resources
iii. Model for optimization of energy usage
iv. Planning for low energy buildings
v. Energy planning for transport sector
vi. Modeling of windows for optimal utilization of energy
vii. Modeling of home/office interiors for efficient power consumption
viii. Modeling of energy efficient cooking systems

87
Children’s Science Congress in Punjab
State Coordinating Agency:
Punjab State Council for Science & Technology
MGSIPA Complex, Sector-26,
Chandigarh-160019
0172-2792325, 2795001; 2793143 (Fax)
www.pscst.com
Resource Persons:
Dr. (Mrs) Neelam Gulati Sharma, PSCST- 9888372333; [email protected]
Dr. Kulbir Singh Bath, PSCST- 9855017723; [email protected]
Ms. Preeti Thakur, PSCST- 8556060474; [email protected]
Ms. Neetu Gupta, PSCST – 9988257641; [email protected]
Dr. Balwinder Singh Sooch, PUP- 9815491199; [email protected]
Dr. Avtar Singh Dhindsa, DIET, Sangrur- 9463489789; [email protected]
Dr. P.L. Garg, BGVS- 9914505009, [email protected]
Mrs. Shruti Shukla, PSEB- 9592401000, [email protected]
Sh. Vijay Sharma, SISE- 9417185426, [email protected]
Surinder Singh, DIET, Ropar- 9417027661


