4 2.0 Characterising the UK Higher Education Sector 2.1. INTRODUCTION This section provides an initial characterisation of the UK higher education (HE) sector. It describes: • the structure of the UK HE sector; • recent trends and financial problems; • environmental management initiatives; • energy management initiatives; • the pattern of energy use in the HE sector; • best practice energy use for difference types of HE building; and • potential energy saving technologies. The report combines information from a range of sources, but relies heavily on publications by the Energy Efficiency Office (EEO) and the Higher Education Funding Council for England (HEFCE). While there is relatively little literature that specifically covers energy efficiency opportunities in HE, there is a wide range of literature on the generic energy using technologies used throughout the sector. For example, much of the work of the Building Research Energy Conservation Support Unit (BRECSU) is highly relevant to HE. 2.2 HIGHER EDUCATION IN THE UK 2.2.1 Overview Higher education (HE) is defined as the academic standard beyond GCE A level or equivalent. This includes: higher degrees, first degrees, Higher National Diplomas & Certificates, and a wide range of professional qualifications. As a result of the 1992 Further and Higher Education Act, the former polytechnics and some other higher education institutions were designated as universities in 1992/3, thereby ending the two-tier provision of degrees. Students normally attend HE courses at higher education institutions, but some attend at further education colleges. Some students also attend institutions which do not receive a public grant, such as the University of Buckingham. Such institutions are excluded from the national statistics. As Table 2.1 shows, there were 90 universities in the UK in August 1997, or 115 if the constituent colleges of the federal universities of London and Wales are counted separately. In addition, there were 62 colleges of higher education. In 1996-97 there were 1.126 million full-time students and 0.538 million part-time students, taught by 126600 academic staff (CVCP, 1997). First degrees were obtained by 242000 students in 1994/95, corresponding to 51.5% of the total qualifications awarded (Table 2.1). Some 285000 students were housed in university accommodation in 1995/96, representing 25% of the total number of full time students (Table 2.2).
Transcript
4
2.0 Characterising the UK Higher Education Sector
2.1. INTRODUCTION
This section provides an initial characterisation of the UK higher education (HE) sector. Itdescribes:
• the structure of the UK HE sector;• recent trends and financial problems;• environmental management initiatives;• energy management initiatives;• the pattern of energy use in the HE sector;• best practice energy use for difference types of HE building; and• potential energy saving technologies.
The report combines information from a range of sources, but relies heavily on publicationsby the Energy Efficiency Office (EEO) and the Higher Education Funding Council forEngland (HEFCE). While there is relatively little literature that specifically covers energyefficiency opportunities in HE, there is a wide range of literature on the generic energy usingtechnologies used throughout the sector. For example, much of the work of the BuildingResearch Energy Conservation Support Unit (BRECSU) is highly relevant to HE.
2.2 HIGHER EDUCATION IN THE UK
2.2.1 Overview
Higher education (HE) is defined as the academic standard beyond GCE A level orequivalent. This includes: higher degrees, first degrees, Higher National Diplomas &Certificates, and a wide range of professional qualifications. As a result of the 1992 Furtherand Higher Education Act, the former polytechnics and some other higher educationinstitutions were designated as universities in 1992/3, thereby ending the two-tier provision ofdegrees. Students normally attend HE courses at higher education institutions, but someattend at further education colleges. Some students also attend institutions which do notreceive a public grant, such as the University of Buckingham. Such institutions are excludedfrom the national statistics.
As Table 2.1 shows, there were 90 universities in the UK in August 1997, or 115 if theconstituent colleges of the federal universities of London and Wales are counted separately.In addition, there were 62 colleges of higher education. In 1996-97 there were 1.126 millionfull-time students and 0.538 million part-time students, taught by 126600 academic staff(CVCP, 1997). First degrees were obtained by 242000 students in 1994/95, corresponding to51.5% of the total qualifications awarded (Table 2.1). Some 285000 students were housed inuniversity accommodation in 1995/96, representing 25% of the total number of full timestudents (Table 2.2).
5
Table 2.1 Higher Education institutions in the UK (August 1997)
Table 2.3 Students obtaining higher education qualifications 1994/95
� Type Number (thousand) % of totalSub-degree BTEC & equivalent 46.2 9.8
Other 79.7 17.0Total 125.9 26.8
Degree Total 242.1 51.5Postgraduate PhD 8.7 1.9
Other 93.3 19.9Total 102.0 21.7
TOTAL 470.0 100.0Source: Office of National Statistics, 1997
Table 2.4 Students in University residential accommodation 1985-96
Student type 1985/6 1989/90 1993/4 1995/6142090 150821 183910 285139
Source: Office of National Statistics, 1997Note: From 1 April 1993, 40 former polytechnics and colleges were reclassified as universities,leading to a corresponding increase in recorded student numbers.
6
The income and expenditure of higher education institutions is summarised in Table 2.5.Total expenditure in 1995-96 was £11.5 billion, which is approximately 10% of the educationbudget. The primary source (41%) of funding is the Higher Education Funding Councils(HEFCs) which distribute funds provided by the Department of Education and Employment.There are separate funding councils for England (HEFCE), Wales (HEFCW) and Scotland(SHEFC), while the province of Northern Ireland is the responsibility of the Department ofEducation for Northern Ireland.
Table 2.5 Income and expenditure of UK higher education institutions 1995-96 (%) Total£11 billion
Income Funding Council grants 41Full-time home HE fees 11Other fees and support grants 12Research grants and contracts 15Other services 5Other income 16
Expenditure Staff costs 58Depreciation and interest 6Other operating costs 36
Source: Committee Of Vice Chancellors & Principals, 1997
The HEFCs fund teaching, research and capital expenditure at universities and HE collegesand also fund courses at 74 further education colleges whose primary funds come from theFurther Education Funding Councils. In 1997, the HEFCE budget of £3.5 billion was split65% for teaching, 20% for research and 15% for capital expenditure. The funds for researchform one part of a ‘dual support’ system. The other part is provided by the Research Councilswhich fund the direct costs (not infrastructural) of specific projects in response to proposalsfrom academics. The HEFCs allocate research funds selectively, on the basis of qualitydetermined by the outcomes of the Research Assessment Exercise.
Higher education provision in Wales is broadly similar to that in England although adistinctive feature is a large amount of residential full-time provision because of thedependence of the institutions on students coming to study from outside the vicinity.Provision in Scotland has a number of distinctive features including high participation ratesand a greater proportion of sub-degree provision. Northern Ireland has only two universitiesand two colleges of higher education.
2.2.2 Change and crisis
Over the last 30 years, UK higher education has evolved from an elite system, with 5% ofyoung people attending university in 1960, to a mass system where one in three schoolleavers now study for a degree. This has created enormous pressure on resources asuniversities attempt to maintain traditional degree structures and teaching styles - in particularthe relatively low ratios of staff to students as compared to continental systems. Between1962 and 1980, student numbers rose from 321000 to 827000; and between 1980 and 1995,numbers doubled to 1659000. A particularly rapid increase occurred between 1988 and 1993,coinciding with an economic recession and tight controls on public spending.
7
The combination of financial constraints and growth in student numbers led to a reduction inunit funding per student of 40% between 1977 and 1997. During this period, funding forhigher education increased in real terms by 45%, but public spending on higher education as apercentage of GDP remained constant. In 1993, the government placed a cap on any furthergrowth in publicly-funded full-time undergraduate student numbers and subsequentlywithdrew almost all public funding for capital expenditure. Universities faced severe financialpenalties if they exceeded the allocation laid down by the government.
The cap restricted supply, but demand for higher education continued to increase. Theaverage participation rate of young people in UK higher education is 32%, which is lowerthan many European countries. The figure for Scotland is 48%, which may be a long termprojection for the UK as a whole.
Table 2.6 Participation rates in UK higher education 1985- 1997
Country 1985-86 1990-91 1995-96 1996-97GB age participation index (API) 14 19 30-32 30-32API Scots domiciled students - 26 44 48NI participation - 27 40 -Source: Committee Of Vice Chancellors & Principals, 1997Notes:1. GB API = under 21 home initial entrants / average number of 18 to 19 year olds in the population2. API Scots domiciled = under 21 Scots entrants to full-time HE courses in the UK / population of
17 year olds in Scotland in the previous year3. NI participation = Full-time new entrants to HE in the UK / 18 year olds in NI population
By 1996-97, the financial constraints were leading to a crisis in higher education. Unit costreductions had been achieved in part by under-investment in infrastructure, leading to afunding gap for capital projects of between £140 and £700 million (Dearing, 1997). Fundingplans over the period 1997-2000 required a further reduction in unit costs. Some universitieswere proposing to charge tuition fees to make up the difference, thereby threatening theprinciple of free education (the replacement of maintenance grants by loans was already wellunderway). This led the government to set up a Committee of Enquiry into higher education,headed by Sir Ron Dearing.
2.2.3 Dearing and after
Dearing produced a lengthy and wide ranging report, informed by a vision of ‘a societycommitted to learning throughout life’ (Dearing, 1997). He emphasised the social, culturaland particularly economic benefits of higher education and concluded that higher educationshould resume its growth. He recommended that the cap on full-time sub-degree places belifted immediately, and the cap on undergraduate places should be lifted over the next threeyears. A participation rate of 45% was anticipated in the long term, with a correspondingincrease in the number of mature students and postgraduates. This would mean that by 2016,universities would be admitting an extra 300000 undergraduates per year and would need anextra £2.1 billion per year. The latter figure could be reduced to around £800 million if morestudents enrolled on sub-degree courses such as Higher National Certificates, and if cheaperdistance learning became more popular.
8
At the time of the report, the public spending plans for higher education assumed a reductionin real terms of expenditure per student of 6.5% over 1998-2000. Dearing concluded thatinstitutions should be able to manage a one percent a year real reduction in funding perstudent, but 6.5% would damage quality. He identified a range of immediate fundingrequirements including alleviation of the proposed cut per student, infrastructurerequirements and accommodating the resumed growth in student numbers. This led to a totalrequirement for an additional £350 million in 1998-99 and £565 million in 1999-2000. Inaddition, he recommended that graduates in work make a flat rate contribution of around 25%of the average cost of higher education tuition through an income contingent mechanism.
The new Labour government responded to the Dearing report with proposals that included£1000/year means tested tuition fees and a removal of what was left of the maintenance grant.These proposals were implemented in the Teaching & Higher Education Act of 1998.Reserve powers in the Act prevented institutions from charging ‘top-up’ fees by threateningto withdraw state funding. In retrospect, the primary purpose of the Dearing report was tolegitimise the ending of free education. The government also announced an extra £165million for universities in October 1997 - well short of what Dearing had recommended - andpublished many of the other proposals in a consultation document.
The continuing shortfall in funding remained a sensitive political issue that was partiallyaddressed with the Comprehensive Spending Review of July 1997. This promised fullfunding for an extra half million further and higher education students over a three yearperiod. Universities were given £280 million in 1999-2000 on top of the £165 millionawarded in 1997. In addition £1.4 billion over three years was allocated to research, includingnew laboratories and equipment. Universities were expected to admit an extra 80000 full-timeand part-time students before 2002.
The Spending Review proposals have ameliorated the funding crisis in the short term. In thelonger term, however, the pressures will return and it seems likely that some form of feedifferentials between universities will be introduced.
2.3. ENERGY AND ENVIRONMENTAL INITIATIVES IN HIGHER EDUCATION
2.3.1 The Toyne Report
The UK government is unique amongst member states in having developed a position onenvironmental responsibility in the further and higher education (FHE) sector, the 1993Environmental Responsibility (Toyne) report (Toyne, 1993). This report sets out in broad,non prescriptive terms the main areas of further and higher education institution responsibilityrelating to the environment, including:
• good housekeeping, including development of environmental management systems;• student entitlement to a basic level of environmental education;• course updating to take account of environmental connections; and• specialist environmental education provision in keeping with market demand.
9
The primary objective of the Toyne report was to ‘...examine the present state ofenvironmental education in FHE in England and Wales, and to make an assessment of whatneeds to be done now, to provide the workforce with the knowledge, skills and awarenesswhich it will need to assume greater environmental responsibility’. Hence it was primarilyconcerned with greening the curriculum rather than greening the university campuses. But theprincipal recommendation notes that:
‘...that (environmental education) strategy will have no credibility unless the institutionproclaiming it adopts and implements a wider strategy for the improvement of allaspects of its environmental performance. Institutions must simply practice what theyteach!’
The report noted that many institutions had tried to achieve energy savings, primarily forfinancial reasons. But few had addressed wider environmental issues and very few hadadopted comprehensive environmental management strategies. Progress had been greater inthe former polytechnics, partly as a result of a ‘Greening Polytechnics’ initiative by theCommittee of Directors of Polytechnics (CDP). This initiative provided a source forsubsequent work on environmental management in higher education, and provided the formerpolytechnics with a head start in this area.
The Toyne report included the following recommendation:
• Every FHE institution should, after consultation with its staff and students, adopt andpublicise, by the beginning of the academic year 1994/95 a comprehensive environmentalpolicy statement together with an action plan for its implementation.
The plan should include timetables, realistically attainable targets and allocation ofresponsibilities for implementation and monitoring. It would also need to be:
• publicly available;• widely publicised within the institution to gain the commitment of staff and students;• comprehensive in its coverage;• relevant to both academic and institutional practice;• understood, implemented and maintained at all levels in the institution;• based on an initial appraisal of the institution’s environmental impact, followed by regular
audits to check progress;• supported by a management system integrated with the institutions overall systems of
governance; and• committed to the continuous pursuit of sustainability.
The Toyne report also recommended that:
• The Further and Higher Education Funding Councils should take steps to encourage andreward the adoption of sound environmental practices in the institutions which they fund.
Such action might include:
10
• ensuring that careful consideration is given to the likely environmental impact of capitalprojects for which funding is sought;
• ensuring that financial savings achieved through improved environmental performanceaccrue to the benefit of the institutions;
• requiring institutions to include particulars of their environmental policies in their overallstrategic plans; and
• encouraging the adoption of meaningful environmental performance indicators across theirperspective sectors.
2.3.2 The 1996 Review of the Toyne Report
The Toyne report made 27 recommendations for action, but these took the form ofsuggestions rather than requirements. While this approach avoided being over-prescriptive itcreated the risk that little action would result. A review of the Toyne report, published in1996, showed that this was indeed the case and that ‘...little progress had been made in takingforward the agenda’ (Ali Khan, 1996)
Toyne had recommended that institutions develop an environmental policy statement togetherwith an action plan for implementation by 1994/95. However, the review found that the vastmajority of FHE institutions had not developed an environmental policy. While a smallnumber of trail-blazing institutions were making significant progress, implementation was atan early stage in most and was focused mainly on ‘good housekeeping’ (Ali Khan, 1996). Thefollowing table shows the results of a survey on environmental policy published in the 1996review.
Table 2.7 Environmental policy in FHE institutions in Autumn 1995
HE FE % ofrespondents
Number of institutions surveyed 222 534Response rate 29% 22%Number of respondents 65 115Number of institutions with own policy & strategy 39 75 63%Number of environmental co-ordinator posts 21 16 20%Number of institutions with environmental budget 15 10 14%Number of institutional environmentalaudits/reviews
26 35 34%
Number of institutions preparing for accreditationto recognised environmental standard
1 6 4%
Source: Ali Khan, 1996
When the Toyne report was published fewer than 10 FE colleges had environmental policies,while 27 new universities had signed the environmental policy statement of the CDP. Thesurvey showed that three years later the numbers had increased to 75 and 39 institutionsrespectively. Most of the signatories to the CDP statement had subsequently developed theirown policies. The survey found that there was more momentum within the FE sector, due inpart to support from the FEFC and the Further Education Development Agency (FEDA)which had conducted work on curriculum greening. However, with a few exceptions, most
11
FE colleges were at an earlier stage than the ‘trail-blazing’ HE institutions. The latterincluded:
Cheltenham and Gloucester College of Higher EducationUniversity of HertfordshireLancaster UniversityMiddlesex UniversityNorth East Wales Institute of Higher EducationUniversity of NorthumbriaNottingham Trent UniversityUniversity of SunderlandThe Surrey Institute of Art and Design
Two international initiatives on environmental policy in FHE - the Committee of EuropeanRector’s Copernicus Charter and the global Talloires Declaration - had little influence withonly six and five signatories respectively.
More progress had been made on energy efficiency than in other areas of policy, due to thepotential for cost saving. Thirty one FHE institutions had signed the DETR Making aCorporate Commitment, out of 1900 organisations in total. Energy use was also prominent inthe environmental audits and reviews that had been conducted by 34% of the institutionsresponding to the survey. In many cases, energy use was the only issue considered in theaudit. However, few institutions had used outside consultants or performance measurements.
Twenty-one HE respondents and 16 FE respondents had environmental co-ordinator posts.These varied from members of Estates staff with only two hours a week to devote toenvironmental duties, to co-ordinators working exclusively on environmental issues. Thelatter are in a minority and are often on very short contracts. In addition, the majority of co-ordinator posts deal only with housekeeping issues. The funds made available by institutionsare generally very small, ranging between £300 and £12000 per year. This excludes a smallnumber of large investments related specifically to energy efficiency. Some institutions havesecured external funds and where this has happened some significant progress has been made.Finally, only seven survey respondents were preparing for accreditation to a recognisedenvironmental management systems standard.
This limited progress led to the following recommendation been made in the review report:
• Within three years all FHE institutions should be either accredited to, or committed tobecoming accredited to, a nationally or internationally recognised environmentalmanagement standard such as the EU Eco-Management and Audit Scheme (EMAS).
The Toyne report had also recommended that the funding councils encourage sustainability.The HEFCE reported two initiatives:
• Supporting an Energy Management Study as part of a broader Value for Money (VfM)initiative. Outputs included a National Report, a Management Review Guide and EnergyBenchmarking Software (see section 2.34 below).
12
• Making funding available to pay consultants’ fees for environmental audits of six HEinstitutions. The results of this study will be used to produce national report and a self-diagnostic toolkit.
The review report made the following recommendations for further work by the fundingcouncils:
• Within three years the further and higher education funding councils should introducesome mechanism for linking environmental performance to the allocation of funds, forexample by introducing environmental criteria into existing quality assessment andinspection procedures.
• The FEFC should match the HEFCE environmental audit initiative by funding six collegeenvironmental audits.
• Following on from the pilot audits, the FEFC and HEFCE should develop anenvironmental audit methodology for their respective sectors, including guidance onproducing computerised environmental reports
Since the review, promotional work on environmental management in the HE sector hastaken place in three different forums. First, the environmental managers within the HE sectorhave formed their own Environmental Association for Universities & Colleges (EAUC), withregular meetings and an email network run by David Somerevell at the University ofEdinburgh. Mr Somervell has promoted energy and environmental management in HE for thelast 10 years and published a book on the topic in 1990 (Somervell & Talbot, 1990). TheAssociation is currently trying to obtain the support of the Committee of Vice Chancellors &Principals (CVCP).
Second, the environmental NGO Forum for the Future has obtained government funding for atwo year project to promote best practice for sustainability across the higher education sector.The project is co-ordinated by Shirley Ali Khan, the author of the review of the Toyne reportand is described in section 2.3.3 below. Finally, the higher education funding councils areproducing a report on environmental management based on the audits conducted at sixinstitutions. This report follows the 1997 VfM study on energy management, which isdiscussed below in section 2.3.4. There are links between these various initiatives - forexample, Forum for the Future is collaborating with the EAUC in producing a brochure onenvironmentally responsible purchasing.
2.3.3 The HE 21 Project
In 1997, Forum for the Future was awarded a grant from the Department of the EnvironmentTransport and the Regions (DETR) to run a two year project to ‘generate and promote bestpractice for sustainability’ across the HE sector. The project was endorsed by the Departmentof Education and Employment and supported by the Higher Education Funding Councils andthe Association of University Directors of Estates. The project is worked with 25 universitieswho provided varying examples of best practice.
The primary output of the project was a generic guide to establishing an environmentalmanagement system (EMS) within universities, which also provides details of the existingEMS standards, ISO 14001 and EMAS (Forum for the Future, 1997). The process ofestablishing an EMS is set out in fifteen steps and the benefits of good environmental
13
management are highlighted. This guide was followed by bulletins on specific issues, such asresource efficiency and transport (Forum for the Future, 1998a-c).
The basic aim of an environmental management system is continual improvement inenvironmental performance. The guidance for EMAS indicates that this will require thefollowing (Forum for the Future, 1997, p26):
• environmental policy: with commitment to comply with relevant legislation andcontinuous improvement in environmental performance;
• environmental review: to provide assigned data and information;• environmental program: setting out quantified objectives and targets with measures to
show how these will be achieved;• environmental management system: including organisational structure, responsibilities,
practices, procedures and resources to ensure implementation of the policy and program;• environmental audit: a systematic, documented, periodic and objective evaluation of the
performance of the organisation, management system and processes to ensure compliancewith the environmental policy and the effectiveness of the system;
• environmental statement: for each site, written in non technical language and madepublicly available. This should include a description of activities, an assessment ofsignificant environmental impacts, information on environmental performance, apresentation of environmental policy, program and management system and a date for thenext report.
• verification: the environmental statement must be verified by an independent, accreditedenvironmental verifier such as the Institute of Environmental Assessment in the UK.
Both EMAS and ISO 14001 are designed mainly for use by manufacturing industry and therequirements indicated above go much further than current management practice within FHEinstitutions. Furthermore, FHE institutions are not currently eligible for EMAS registration.However, this is expected to change when the current review of EMAS is completed.
The Forum guidance is set out in very general terms as a step by step guide (Forum for theFuture, 1997). The project also identifies ‘trail blazing’ institutions that have made significantprogress with environmental management. These include the universities of Sunderland,Liverpool John Moores, North London, and Edinburgh, together with Cheltenham &Gloucester College of HE and the Surrey Institute of Art and Design. An important featurethese institutions have in common is a single individual strongly committed to improving theinstitution’s environmental performance.
The HE 21 team ran a series of EMS working parties involving representatives from 19universities. These included training sessions for relevant university staff. The level ofcommitment from participating institutions varies, but several (including the universities ofNorthumbria and Sunderland) are committed to becoming formally registered. At presentonly one UK FHE institution, Elmwood College in Scotland, is accredited to anenvironmental management system.
The HE 21 project now aims to track progress on the adoption of EMS by means of aCorporate Index of Sustainability Engagement for HE, using process indices (management
14
systems etc.) as opposed to performance indices (energy consumption; waste). This will becompiled from a questionnaire sent to all universities and colleges.
2.3.4 The HEFC energy management study
The HEFC Energy Management study was the first in a series under the auspices of the Valuefor Money Steering Group of the UK HEFCs (HEFC, 1996). The objective was to produce astudy that would have a real, practical outcome in the handling of energy management in HEinstitutions. The methodology included pilot studies of energy management at 19 sites, theundertaking of a sector-wide energy management questionnaire, and discussions withcolleagues in the sector (‘by the sector for the sector’). The pilot studies included site visitsand the collection of energy use data over a four month period. The specific objectives wereto:
• identify areas of good energy management performance and practice at the pilot sites anddetermine the constraints that may exist on further improvements being made;
• identify good practice that has improved energy efficiency within the HE sector;• identify good practice in the public and private sectors which may be appropriate for HE;
and• develop a set of activity-based benchmarks for determining the overall and specific energy
efficiency norms for higher education institutions.
There were three main outputs from the study:
• The National Report summarises the main findings, gives examples of good practice andencourages institutions to review their energy management arrangements. It is aimed atsenior managers plus Estate committee members.
• The Energy Management Benchmarking Software enables institutions to calculateindividual site/building performance benchmarks for comparison against higher educationspecific benchmarks. It is aimed at Estate professionals and institutional managers.
• The Management Review Guide is a practitioners handbook that will enable institutions tocarry out a review of their practices to see how they measure up to good practice within thesector. It contains advice on conducting such a review and detailed practical examples ofactions that institutions can take.
The three products are designed to be used together to support a process of improved energymanagement. Overall, the guidance is much more detailed and specific than that given in theHE 21 project. It is specifically designed for the typical management structure of a UKuniversity - which at first site seems to exhibit a somewhat baroque complexity, including alarge number of committees! The guidance includes targeted actions for key departments &groups, such as the Estates Committee and Senior Management Teams.
The National Report had two main conclusions. First, overall energy savings of between 10%and 20% of utilities spend are possible ‘over a period’ - representing a total of £20 million to£40 million per annum. Second, such savings will only be realised if there is commitmentfrom senior management and adequately funded staffing resources. The Report emphasisesthat energy is a management concern and not just a technical issue. A structured and co-ordinated approach is required if these potential cost savings are to be achieved.
15
Some other main findings and recommendations may be summarised as follows:
• There is a wide range of good practice and achievement within the HE sector, whichprovides examples for other institutions to follow.
• An effective energy management program can be financially self supporting, using savingsfrom effective utility purchasing and energy efficiency investments to fund both futureinvestments and the salary costs of energy management staff.
• The promotion of energy awareness amongst staff and students assists the EstatesDepartment in the implementation of energy management initiatives and generatesvaluable feedback. Awareness raising may focus on environmental concerns, but monetaryincentives may sometimes be needed. For example, one institution introduced prepaidelectricity cards at student residences, leading to a 40% reduction in energy consumption.
• Most building and maintenance programs already seek to consider energy efficiency, butmore could be achieved through a integrated approach. It is important to involve theenergy management team (if there is one) and departmental users in the early stage of abuilding design.
• There is considerable scope for innovative ways of financing capital equipment, includingenergy service companies and the government Private Finance Initiative (PFI).
• Responsibilities for energy management should be clarified, since these can be ad hoc andunstructured. An integrated approach requires: a) a formally approved energy policyintegrated to the strategic objectives of the institution; b) structured levels of delegatedauthority for energy management; and c) dedicated energy management resources, eitherin-house or externally provided.
In respect of the last recommendation, the National Report provides a plan to implement an‘effective and disciplined energy management initiative’. Central to this plan is a review ofthe institution’s current energy management arrangements, with the Management ReviewGuide and Benchmarking Software providing management aids to undertake such a review.The report recommends that the review is conducted by an Energy Management ReviewGroup, while overall responsibility is given to an Energy Committee.
2.3.5 Summary
In summary, the initiatives by the HEFCs and Forum for the Future have provide a wealth ofvaluable material that can guide implementation of energy and environmental management inFHE institutions. Energy management is increasingly being seen as one element of a broaderenvironmental management system, although systematic attempts to introduce environmentalmanagement are still rare. An interesting question is whether improved energy managementcan be taken forward most effectively within this broader context, or whether more could beachieved through the independent pursuit of improved energy management for reasons of costsaving. The HEFC guidance is more specific and hence more immediately useful than thatprovided under HE 21 and reflects an existing institutional expertise with energy issues that isstill to be developed for environmental management.
16
2.4 ENERGY USE IN FURTHER AND HIGHER EDUCATION
Data on energy use in the HE sector is difficult to obtain. The Higher Education StatisticsAgency (HESA) collects information on energy expenditure as part of a widen survey of HEexpenditure but this is only available on CD ROM for £1000. In this section some basic datawill be presented from the following sources:
• recent information on university and college estates from the HEFCE;• a database on the UK non-domestic building stock, funded by the DETR;• the HEFCE study on energy management in higher education; and• An Energy Efficiency Office publication on energy use in further and higher education
buildings.
2.4.1 The HEFCE 1997 analysis of estate returns
The Higher Education Funding Councils support both maintenance and capital expenditureon university estates. This includes expenditure on energy use and energy efficiency projects.The HEFCE conducted an analysis of estates expenditure in English universities and collegesin 1997 (HEFCE, 1998). While this provides little information on energy use, it includesuseful data on overall expenditure and the spending constraints faced. The following pointsmay be highlighted:
• The net internal floor space of universities in England and Wales is 9.3 million m2 and thegross internal floor space is 12.37 million m2. Of this, 27 institutions have over100000m2,and eight institutions have over 200000m2 net space.
• In England & Wales, the sector provides a total of 215000 bed spaces, which representsone bed space for every first year 18-21 year old full time undergraduate not living athome. A further 7000 bed spaces are under construction. There is a wide variation in thelevel of provision between institutions.
• There are wide variations in the use of floor space by different disciplines. The largestusers of space are Science (20%), Engineering and Technology (10%), Clinical and Pre-Clinical Medicine (8%) and Art Design and Performing Arts (8%)
• The amount sent aside for routine non-residential maintenance is approximately £140million/year, in addition to a sum for long-term non-residential maintenance of about £120million/year. The corresponding sums for residential maintenance are £40 million/year and£35 million/year.
• The sector faces estate problems with an estimated cost of £4.2 billion over a five yearperiod. The greatest problems are health and safety compliance, backlog maintenance,disabled access and insufficient space. These affect over 20% of the estate. The level ofplanned routine maintenance is not sufficient to maintain the present quality of the estate.
• Total new project proposals amount to £2.3 billion over the period 1995-6 to 2000-01. Thelargest category is new residences - £445 million for 423000m2 of space.
• The total energy spend of the HE sector is approximately £200 million/year. Thisrepresents around 1.8% of total expenditure by the sector, or 4% of government spendingon higher education.
17
• Energy efficiency is one of the problem areas highlighted by Estates departments and £9million was budgeted for energy management systems in 1996/97. Despite the relativelysmall sum, it fell in the top five categories in terms of area affected.
The spending constraints identified in this study should have been eased by the outcome ofthe Comprehensive Spending Review
2.4.2 The database on UK non-domestic buildings
Data on energy consumption and energy efficiency opportunities in the public andcommercial sectors in the UK is generally much poorer than that for the manufacturing anddomestic sectors. This is partly due to lack of research, but also reflects the very wide rangeof building types in the sector and the extremely diverse activities that occur within thesebuildings. The higher education sector is no exception to this.
In an attempt to rectify this problem, the DETR is funding a major project to map the non-domestic building stock (NDBS) in the UK. The main elements of the project, which began in1991, are summarised in Table 2.8.
Table 2.8 A database on the UK non-domestic building stock (NDBS)
Stage Elements Main contractorStock composition Aims to characterise the NDBS in terms of
number of premises, floor area and type ofbuilding. Primary data source is Rating andValuation (RVO) office.
Open University
Physicalcharacteristics ofbuildings
External surveys used to collect detaileddescriptive information on built form of 3350premises. Results used to characterise NDBSdatabase.
Open University
Energy use Internal surveys used to collect detailedinformation on patterns of energy use andenergy efficiency opportunities. Results usedto characterise NDBS database, includingfigures on total delivered energy per unit floorarea.
Sheffield HallamUniversity
Energy model Model of energy use in the NDBS, producingprojections of energy use, CO2 emissions andefficiency opportunities.
Building ResearchEstablishment
This project is well advanced and is now producing useful results (Mortimer et al, 1998).However, the FHE sector is not well covered. Since FHE accounts for only a small proportionof total public & commercial energy use it was not a priority during the energy surveys. Onlytwo surveys were conducted on FHE buildings, which is not enough to produce statisticallysignificant results.
Table 2.9 summarises the number of premises and floor area of the total UK NDBS, whileTable 2.10 shows the corresponding data for the FHE sector. The NDBS database recordsonly 630 FHE institutions, as opposed to 736 in official government data (Office of NationalStatistics, 1998). There are 10 fewer universities, 5 fewer HE colleges and 180 fewer FE
18
colleges. Table 2.10 shows that FHE accounts for 0.04% of the total number of NDBSpremises and 2.9% of the floor area. Similarly, FHE accounts for 1.7% of the total number ofeducational establishments, but 26.5% of the total educational area. The FHE premises have atotal gross external area of 26.5km2, with each premise having a mean area of 0.04km2.
The university floor area breaks down into 10.55km2 of academic space and 3.82km2 ofresidential area - a ratio of 2.7 to 1. The 42 old universities have a mean area of 261900 m2,which compares to only 91110 m2 for the 37 former polytechnics. The old universitiestherefore have an average external area which is three times that of the former polytechnics.The mean area of university campuses (181900m2) is 4.6 times that of HE colleges (39380m2)and as much as 21 times that of FE colleges (8100m2).
Table 2.9 Summary of the UK non-domestic building stock
Total education 35,551 100,257,016 2822 2.125 11.08
TOTAL NDBS 1,672,647 904,485,593 540 100.0 100.0Source: Bruhns et al (1997a)
Due to the small number of energy surveys, the NDBS database does not contain accurateinformation on energy use in the FHE sector. However, data is available for the educationsector as a whole. Table 2.11 provides estimates of energy consumption in the educationsector by end use. Separate estimates are given for fossil fuel and electricity and the resultsare compared to the total energy use in the NDBS.
Table 2.11 Energy consumption in the education sector as a proportion of services as awhole (PJ)
In education as a whole, fossil fuel use is dominated by space heating which accounts for87%. The remainder is hot water (5.3%) and catering (6.6%) with 2.6% unknown. Educationuses a total of 76PJ of fossil fuel, which corresponds to 15.5% of the total used in non-domestic buildings.
20
Electricity uses are more diverse. The most important is lighting which accounts for 61% ofthe total. Space heating, hot water, catering and process use each account for around 7.5%,while small power equipment accounts for 14%. IT equipment accounts for only 0.3PJ, or2.3% of the total. All these figures, and particularly the last, may differ in FHE buildings.Overall, the education sector use 13PJ of electricity, which corresponds to only 4.5% of totalnon-domestic building electricity use. This implies that the FHE sector is more heat intensiveand less electricity intensive than the public and commercial sector as a whole. The impliedfuel to power ratio is 5.8, which is higher than that found in the 1988 study. This is surprisingas we would expect electricity use to be rising faster than fossil fuel consumption.
The two energy surveys of FHE institutions found an average energy use of 1.1 GJ/m2. This ishigh compared to other non-domestic buildings. For example, the corresponding figure foroffices is 0.68GJ/m2, and that for manufacturing premises 0.43 GJ/m2. The study estimatesuniversity energy intensity to be higher than colleges as follows:
FE colleges: 1.0GJ/m2 +/-0.3Universities: 1.1GJ/m2 +0.2/-0.1
2.4.3 The HEFCE Benchmarks
The diversity of building uses in higher education creates a need for more disaggregatedfigures for energy consumption. These are available from the HEFCE study into energymanagement, which divides buildings into the following designated activity areas (DAAs):
• Academic• Residential• Administration• Libraries• Recreational• Students Union
DAAs are subdivided further to allow for various factors, including use of air conditioning. Akey difference between DAAs is their average hours of occupancy. Table 2.12 summarisestypical figures for normal and extended occupancy for each DAA.
21
Table 2.12 HEFCE definitions of normal and extended occupancy periods for six buildingtypes
Source: Higher Education Funding Council for England et al, 1996b
The HEFCE study identified upper (poor performance) and lower (good performance)benchmarks for energy consumption per unit area for each of the subdivided DAAs. Thesebenchmarks were based on a combination of published government data and the results ofenergy monitoring at the 25 pilot university sites. The benchmarks have been incorporatedinto the energy management benchmarking software, to allow institutions to assess their ownperformance. Table 2.13 summarises the benchmarks used, while Table 2.14 summarises thecorresponding figures for CO2
emissions and energy costs.
22
Table 2.13 HEFCE benchmarks for higher education building energy consumption
Source: Higher Education Funding Council for England et al, 1996b
23
Some points that emerge from these figures are as follows:
• There is very wide variation between DAAs. For example, a good consumption level fornaturally ventilated administration buildings is around 0.21 GJ/m2 while the correspondingfigure for fast food catering is 1.58GJ/m2.
• An air conditioned building typically consumes more than twice the amount of energy of anaturally ventilated building, most of which is electricity.
• Science laboratories use around 60% more energy than arts academic areas.• Residential areas use around twice as much fuel as academic areas, but use less electricity.• Halls of residence use around twice as much electricity as self contained flats.• The difference between good and bad energy consumption levels varies between 17% for
science labs to 84% for air conditioned administration buildings. The correspondingfigures for fuel consumption are 20% and 121%, and for electricity consumption 12.5%and 53%.
• Electricity dominates energy costs. Hence, for example, an air conditioned library can havefive times the energy costs of a naturally ventilated library.
Energy consumption will vary according to individual circumstance. The benchmarkingsoftware includes adjustment factors for occupancy, degree days, building construction typeand exposure. Adjustment for actual occupancy and degree days is done on a pro rata basis.Adjustments for building type and exposure are summarised in the following tables.
Table 2.15 HEFCE adjustment factors for building type
Description Adjustment factor(fuel only)
Curtain walling, masonry or concrete construction,especially multi-story and/or extensive internalsubdivision
1.63
Buildings with large window areas and appreciable areaof solid partitions.
1.50
Single story buildings of masonry or concrete with solidpartitions
1.0
Single story buildings of factory type with little or nosolid partitions
0.65
Top floors of multi story buildings 0.65Source: Higher Education Funding Council for England et al, 1996b
Table 2.16 HEFCE adjustment factors for exposure
Type Description Adjustment factor(fuel only)
Sheltered Building in built up area with otherbuildings of similar or greater heightsurrounding it
1.1
Normal Building on level ground in urban allrural surroundings.
1.0
Exposed Coastal or any sites with little 0.9
24
screeningSource: Higher Education Funding Council for England et al, 1996b
2.4.4 The EEO benchmarks
The HEFCE study used information from an earlier study on energy use in FHE buildingsconducted by the Energy Efficiency Office (EEO, 1991). This study followed a similarformat, with benchmarks for certain building types and adjustment factors for occupancy,exposure and degree days. The results are still useful, as overall figures are obtained for threetypes of institution - old universities, new universities (former polytechnics) and furthereducation colleges. Important differences between these are:
• colleges rarely include residential areas;• old universities are usually located on a single out of town campus and are supplied with
heat from a central boilerhouse;• new universities and colleges are typically located at several separate locations throughout
an urban area.
The performance benchmarks derived for old universities combine residential and academicbuildings since these are generally not separately metered (although energy efficiency benefitscould be derived from doing so). Separate benchmarks were derived for residential andacademic areas in new universities. The average proportion of floor space devoted toresidential areas in universities was 25%.
Table 2.17 summarises annual hours of use for each broad building type, while Table 2.18summarises the performance benchmarks.
Table 2.17 Standard annual hours of use in FHE buildings
Type of FHE building Annual hours of useCollege of further education 3200New universities - teaching & administration 3500New universities - residential 6000Old universities - teaching & administration 3500Old universities - residential 6000Old universities - overall 4250Source: EEO, 1991
Table 2.18 EEO benchmarks for energy use in FHE buildings
Type of FHE building Good Fair PoorOld university <1.17 1.17-1.28 >1.28New university - residential <0.83 0.83- 1.13 >1.13New university - teaching & administration <0.68 0.68-0.94 >0.94College of further education <0.83 0.83-1.01 >1.01Source: EEO, 1991
The figures indicate that, due largely to the absence of residential areas, FE colleges usearound 40% less energy per unit area than universities.
25
2.5 POTENTIAL ENERGY SAVING TECHNOLOGIES
2.5.1 Information sources
A wide range of information on energy efficiency opportunities is published by the DETRunder the Best Practice Program. This includes case studies of good practice and moregeneral information guides. A total of 18 publications have focused specifically on projectswithin the FHE sector. These are listed in Table 2.19, together with a brief summary of theircontent. However, the diversity of building uses within the FHE sector means that many ofthe publications targeted on other sectors are also relevant; for example, swimming pools andleisure centres, offices, catering establishments and residences.
26
Table 2.19 DETR best practice publications in the FHE sector
Code Title Area ContentGPCS42 Energy efficiency in higher education buildings:
condensing gas boilersBoiler plant Condensing gas boilers in academic buildings at
Edinburgh, Keele and Oxford Brookes universities.Paybacks under 5 years.
GPCS 79 Energy efficiency in large residential buildings:condensing gas boilers
Boiler plant Condensing gas boilers for Keele University hall ofresidence. Payback 6 years.
GPG204 CHP in universities CHP General guide to scope for CHP at universities. Includescase studies of large central CHP at Liverpool University;medium packaged CHP at York; and small packaged CHPat Bangor (in residential building).
GPCS351 CHP at a university campus: University of Liverpool CHP 3.6MWe gas turbine installed in 1986 to supply campusheating & electricity. Payback 5 years. Energy costsreduced 28%
GPCS292 Long term operation of CHP in university halls ofresidence: UMIST
CHP Small (38kWe) gas fired CHP installed in hall of residence.Simple payback of 3.6 years. Average savings of£5000/year. Successful long term operation.
GPCS334 The benefits of including energy efficiency early in thedesign stage: Anglia Polytechnic University
New building Comprehensive approach to energy efficiency in newbuilding design led to savings of 50%.
NPIP91 Energy efficient multi-residential accommodation:Panns Bank, University of supplement
New building New building design incorporating high levels ofinsulation, passive solar, BEMS and low energy lighting.Students pay for electricity via individual metering system.Annual energy savings of £975000
NPFR102 The Queens Building De Montfort University:feedback for designers and clients
New building Incorporation of daylighting and natural ventilation led tohalving of energy costs in new academic building.
NPIP80 Low energy multi residential student accommodation New building Integrated approach to energy efficiency in new buildingdesign
GPCS 16 Energy efficiency in offices: Heslington Hall,University of York
Energymanagement
Energy savings on listed building including insulation,boiler fuel switching, electronic energy management andseparation of domestic hot water from heating. Payback <2years for efficiency measures.
GPCS335 Investment in energy efficiency at the University of Energy Energy management strategy including energy design
27
Warwick management standards for new/refurbished buildings; ring-fencedbudget for energy efficiency projects; and alternativefinancing options for CHP. Saving of 5.3% since 1993.
GPCS333 Energy management practices in further education:Southwark College - a pragmatic approach
Energymanagement
Effective energy management with limited technical andfinancial resources. Energy costs reduced by 60%. Focuson low cost measures.
GPCS150 Energy management at Manchester University Energymanagement
Energy management initiatives lead to 36% cut inconsumption in 8 years. Electricity budgets devolved touser departments’ staff. Five percent of fuel budgetallocated to energy efficiency measures. Use of BEMS,heating controls and insulation on steam network.
GPCS336 Energy efficiency in FHE: monitoring & targeting atUniversity of Wales, Cardiff
Monitoring &targeting
M&T system installed to provide accurate information onenergy use allowing targeting of efficiency measures. Startup costs retrieved in 6 months. Savings of £63000/year
28
2.5.2 Potential energy saving technologies
With the wide range of building types and uses in the HE sector, there is a correspondinglywide range of potential energy saving technologies. The majority of these are generictechnologies that are equally applicable to other sectors. This section gives an overview of themost important energy saving opportunities. Where possible, an indication is given of the sizeof investment required. A short description of the measure/technology is also included, butfor further details reference should be made to the Best Practice literature supplied by theEnergy Efficiency Office - particularly the Fuel Efficiency booklets (see reference list). It isimportant to note that:
1. the cost effectiveness of an individual measure can vary very widely, depending uponindividual circumstances;
2. many energy saving measures will only be cost effective where existing equipment is duefor replacement; and
3. many measures are more suitable for inclusion in new buildings than for retrofit in existingbuildings.
The energy saving measures/technologies are organised under the following general headings:
• Electrical Plant• Lighting Systems• Boiler Plant• Fuel Storage and Handling Systems• Distribution Systems• Space Heating Systems• Domestic Hot Water Systems (DHW)• Air Conditioning and Mechanical Ventilation• Building Fabric• Catering• Swimming Pools• Chiller/Cold Store Plant• Utility Management
29
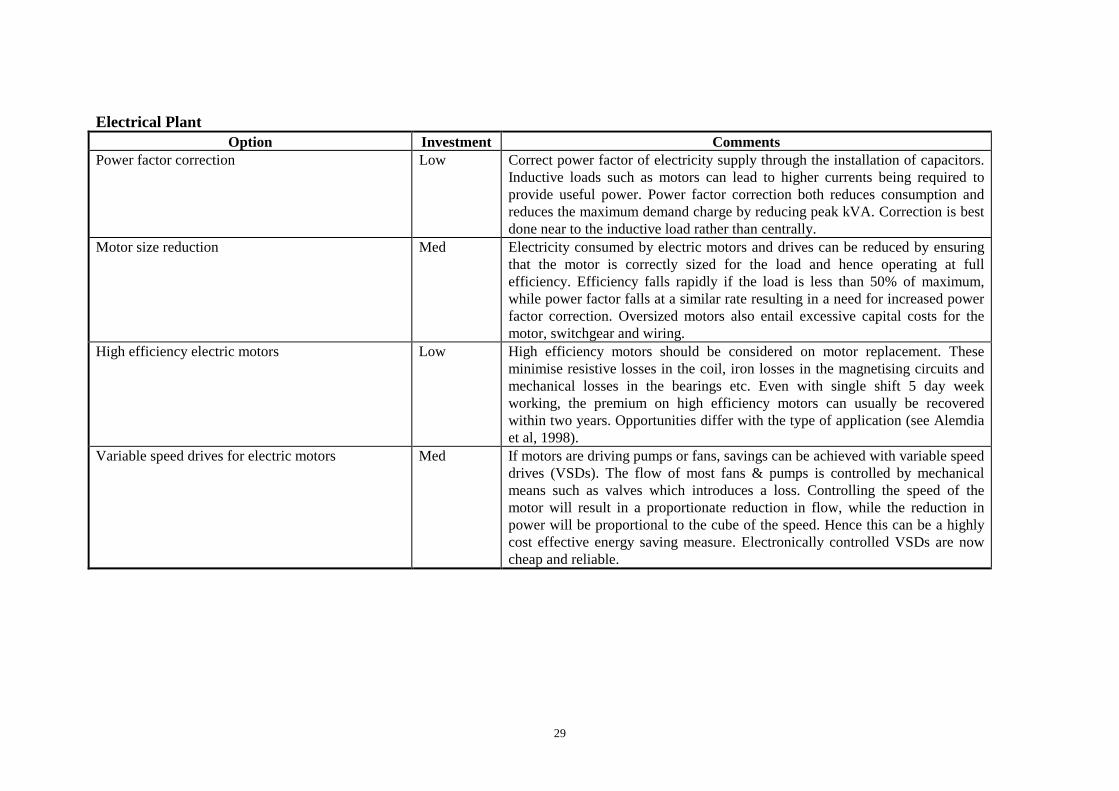
Electrical PlantOption Investment Comments
Power factor correction Low Correct power factor of electricity supply through the installation of capacitors.Inductive loads such as motors can lead to higher currents being required toprovide useful power. Power factor correction both reduces consumption andreduces the maximum demand charge by reducing peak kVA. Correction is bestdone near to the inductive load rather than centrally.
Motor size reduction Med Electricity consumed by electric motors and drives can be reduced by ensuringthat the motor is correctly sized for the load and hence operating at fullefficiency. Efficiency falls rapidly if the load is less than 50% of maximum,while power factor falls at a similar rate resulting in a need for increased powerfactor correction. Oversized motors also entail excessive capital costs for themotor, switchgear and wiring.
High efficiency electric motors Low High efficiency motors should be considered on motor replacement. Theseminimise resistive losses in the coil, iron losses in the magnetising circuits andmechanical losses in the bearings etc. Even with single shift 5 day weekworking, the premium on high efficiency motors can usually be recoveredwithin two years. Opportunities differ with the type of application (see Alemdiaet al, 1998).
Variable speed drives for electric motors Med If motors are driving pumps or fans, savings can be achieved with variable speeddrives (VSDs). The flow of most fans & pumps is controlled by mechanicalmeans such as valves which introduces a loss. Controlling the speed of themotor will result in a proportionate reduction in flow, while the reduction inpower will be proportional to the cube of the speed. Hence this can be a highlycost effective energy saving measure. Electronically controlled VSDs are nowcheap and reliable.
30
Lighting SystemsOption Investment Comments
More efficient lighting systems, i.e. slim fluorescenttubes, compact fluorescent units, tungsten halogen.
Low/Med Energy savings: CFLs - 75%; slim fluorescents - 10%; tungsten halogen -25%.CFLs last five times longer. Replace twin tube fluorescents with single tube.
Replacement of electromagnetic with highfrequency electronic ballast
Med These control the lamp and correct the power factor. With higher frequencies,lamp output is increased per watt input, losses in the ballast are reduced, lamplife is prolonged and quality of light improved. Savings of up to 30% arepossible.
Lighting switching arrangements - configure withroom layout etc.
Low Should not control large area with single switch. Switches should be near tolights they control. Useful when occupancy intermittent.
Lighting control to include photocell, acoustic,movement, time etc.
Med Aim to make better use of daylight and to switch lights off when not needed.Payback can be as short as 1.5 years. Essential that occupants know how thesystem works and can override it.
Microprocessor-based lighting control systems Med Simpler options should be explored first. Lighting controls may be integratedinto a Building Energy Management System (BEMS - see below)
Cleanliness of luminaries & windows Low Dirty lamps can reduce light output by 20% even in a clean atmosphere. Regularcleaning schedule required.
Reflector and silvered type light fittings Low Reflectors can deteriorate with age
31
Boiler PlantOption Investment Comments
Improvement to boiler plant management andoperating procedures
Low Run the minimum number of boilers required to meet the load. (boiler efficiencyis poor at low load factor). Use boiler sequencing controls to ensure on-lineboilers are run as efficiently as possible.
Installation of sequence boiler firing controls Low Where multi boiler installations are in operation, significant savings can resultfrom installation of microprocessor controlled systems which monitor andsequence operations according to heat demand.
Decentralisation of boilers Med May be efficient to replace central generation of hot water with small boilerssupplying point of use applications
Use of condensing boilers Med Recovers latent heat of evaporation. Economics depend on whether existingboiler plant is due for replacement. Can achieve savings of 10-20%.
Boiler replacement Med Economics of boiler replacement depend on age and performance of existingboiler; opportunities for saving through fuel switching; and extent to whichexisting installation is matched to heat load. Oversized boilers will operateinefficiently.
Installation of economisers Med Economisers recover heat from flue gas to preheat boiler feed water. Generallynot suitable for boilers fired on fuel oil as sulphur content of oil condenses assulphuric acid and corrodes pipework.
Full automation, i.e. oxygen trim controls Med Oxygen trim control gives precise regulation of air/fuel mixtures and improvesboiler efficiency. Uses electronic analysis of flue gas coupled to servo control ofair dampers and fuel valves.
Pre-heat combustion air. Med The thermal efficiency of a boiler can be raised by 1% if the combustion airtemperature is raised by 20oC. Heat sources include: the flue gas economiser,higher temperature air from the top of the boiler house, and heat recovered bydrawing air over the boiler casing.
Boiler blowdown Med Minimise water use in boiler blowdown. Blowdown is necessary in steamboilers to remove sludge and prevent scaling of tubes. Small amounts of waterare bled off (either manually or automatically) and replaced by feedwater tomaintain the desired level of dissolved solids. This water contains useful heat -typically 2.3% of heat input. If losses are high, heat recovery should be used
32
On Site Power ProductionOption Investment Comments
Combined heat and power High In some situations it may be appropriate to replace boilers with a gas turbine orreciprocating engine CHP system. The primary savings are through thedisplacement of imported electricity. The economics of such a scheme dependcritically on a range of variables including heat to power ratios, average loadfactors, electricity tariffs and site operating patterns. Universities offer range ofopportunities, including large gas turbine based CHP in central boiler plant, andsmall engine based CHP for residences and leisure centres. Basic requirement isfor a heat demand around 5000hr/year. The diversity of building uses inuniversities, - including residential accommodation in most cases - can makeCHP viable option.
Peak demand reduction ('lopping') using stand-bypower generation
High CHP should be explored first.
Distribution SystemsOption Investment Comments
Insulation of distribution pipework and of pipeworkfittings and valves, etc.
Low Large savings may be possible for limited expenditure. Insulation of largediameter pipes gives a payback of a few weeks. Standard procedures allow theeconomic thickness of insulation to be calculated.
Improvements to condensate recovery Med With steam boilers, recover as much condensate as possible and return to boiler.This recovers heat as well as boiler feed water.
33
Domestic Hot Water Systems (DHW)Option Investment Comments
Improvements to existing DHW controls Low Minimum requirement is time controls, to only heat water when required, andthermostatic controls. Legislative requirement that water temperature exceed60oC to avoid Legionnaires disease but the less than 65oC to avoid scalding.
Introduction of improved DHW controls Low/MedChanging centralised DHW generation to localelectric/gas heating systems
Med Reduces need for hot water storage and reduces distribution losses. Manybuildings have oversized storage cylinders which are heated from boilers whichare oversized for the load. Particularly appropriate for large distribution systems.
Insulate storage tanks & pipework Low If surfaces are warm to the touch, insulation needs to be improved
Space Heating Systems
Option Investment CommentsImprovements to existing space heating controls Low Savings often available through resetting controls to avoid heating out of hours.
Important if there has been changes in occupancy patterns, building use orefficiency investments. Also important to checked thermostat settings.
Introduction of improved space heating controls Low/Med Options include: i) optimisers, which switch plant on at such time thattemperature reaches required value just before occupancy begins; and ii)compensators, which regulate heating system according to outside temperature.
Improvements to zoning of space heating Low Install zone controls for areas with differing times of use, temperaturerequirements and heat gains from sun, information technology and occupancypatterns.
Installation of thermostatic radiator valves Low These sense space temperature and control flow through radiator, therebyproviding localised control of each radiator. Eliminates unnecessary heating.Settings must be checked regularly.
34
Air Conditioning and Mechanical VentilationOption Investment Comments
Improvements to existing Heating, Ventilation andAir Conditioning (HVAC) controls
Low Controls are generally more sophisticated than for space heating. Variables to becontrolled include temperature, humidity, pressure, air flow volume and fresh airsupply. Essential to ensure that building is cooled only when necessary and thatthe volumes of air being circulated are not greater than needed. Avoidsimultaneous heating and cooling!
Introduction of improved HVAC controls Low/MedInstallation of variable speed drives on fridges,pumps and fans
Med See above. In most air conditioning plant more energy is used by fans than foractual cooling. VSDs preferred to dampers for reducing air volumes, and VSDspreferred to throttles on pumps.
Free cooling Energy is wasted when air is first cooled and then reheated to maintain thecorrect temperature and humidity. This can be minimised by making optimumuse of outside air for cooling.
Building FabricOption Investment Comments
Improvements to building insulation Med Roof, wall and floor insulation. There are relatively few opportunities for loftand cavity wall insulation in the predominant building types in thepublic/commercial sector in the UK (Mortimer et al, 1998). Flat roof andexternal wall insulation should be explored.
Installation of secondary glazing Med Double glazing is rarely cost effective on its own, unless the windows are beingreplaced anyway. Glazing has additional benefits such as reduction in noiselevels.
Improvement of draught-stripping Low External doors and windowsInstallation of fast acting doors Med Particularly useful on goods and vehicle entrances
35
CateringOption Investment Comments
Replacement of existing equipment Med Energy efficiency of fridges, cookers etc. can vary considerably but often do notfeature in purchase decisions.
Improvements to operation techniques (use by staff)- avoiding excessive pre-heating of cateringequipment, operation of freezers/fridges etc.
Low Worth installing separate metering as catering can be a major energy user.Energy often wasted through poor housekeeping e.g. not turning equipment off.Energy also wasted through low loading of catering equipment. Local controlsshould be provided for ventilation equipment, incorporating a time clock.
Utility ManagementOption Investment Comments
Installation of Building Energy ManagementSystems (BEMS)
Med/High BEMS are computer based systems which automatically monitor and control arange of building services such as heating, air conditioning, ventilation, boilersand lighting. They both control environmental parameters and provide data onenergy performance. There are two main types: centralised and distributed.Efficiency improvements of up to 20% compared to independent control ofindividual services are common.
Initiation of formal Monitoring and Targetingprogramme
Low This is the fundamental energy management technique that must always beimplemented first. It ensures that all energy usage is monitored on a regularbasis at departmental level and compared against performance standards. Linemanagers are thereby held accountable for performance. M&T systems can besimple and easy to apply while providing a very attractive payback.
Energy awareness programme and goodhousekeeping programmes
Low Regular campaigns to raise awareness of energy saving possibilities can bringrewards. Simple measures such as reducing leaks, switching of unwanted plant,cleaning etc. can often give savings of up to 10% at little or no cost.
Energy-conscious design incorporated into newbuild and refurbishment projects
Many energy efficiency measures are far more attractive in new buildings thanin retrofit. This requires attention to energy consumption at an early stage indesign. The Best Practice Program gives a number of good examples includingthe Queens Building at DeMontfort University, which incorporates naturalventilation, daylighting, CHP, high efficiency lighting and BEMS.
36
Energy services contract Med Very wide range of possibilities. Energy service company supply heat andpower at least cost, which may involve investment in both energy efficiency andself generation. The energy service contract offers guaranteed supplies of heatand power at a discount on present and projected costs. The ESCO offers energymonitoring and targeting, feasibility studies, construction, installation andmaintenance of equipment, finance, and fuel and electricity purchasing. Bydoing so, it allows the host company to lower risk; avoid capital expenditure;minimise transaction costs with the use of a 'one-stop shop' and concentrateattention on the core business.