110 2.0 Maintenance of Productive Capacity of Forest Ecosystems Productive forests supply a number of important goods and services to society: they help prevent soil erosion, produce oxygen, filter pollutants, protect and enhance water quality, and offer opportunities for recreation and spiritual renewal; they supply lumber and wood for homes, furniture, papermaking, and fuel; and they supply non-wood products like cones, boughs, herbs, medicines and foods such as mushrooms, nuts and berries. Forest productivity varies according to the amount of forest land available and its fertility, health, environmental pollutants, location along the urban to rural continuum, past and current uses and management. Managing forests sustainability means balancing resource production with the ecosystem’s capacity to renew and sustain itself. Measuring and tracking the amount of forest land available for producing goods and services, the productivity of that forest land, and the amount, quality, and type of trees and other plants growing there is critical to determining whether people are balancing production, long-term ecological health and the capacity of forest products markets to utilize timber and other forest products. 2.1 Area of Timberland Sustainable forest management promotes production of wood and non-timber forest products in a way that maintains the ecosystem’s capacity for renewal. A forest’s ability to provide these benefits is dependent upon the soil type, water access and general health of sites that are suitable for production. Forest use decisions affect the acreage available for production, and management choices affect short and long-term yield potential. According to 2007 USDA-FS-FIA data, Iowa has 3,054,000 acres of forest land, which the Forest Service defines as land comprised of at least 10 percent forest trees of any size; land that formerly had such tree cover and that will be naturally or artificially regenerated falls within this classification as well. Forest land includes transition zones, such as areas between heavily forested and non- forested lands comprised of at least ten percent forest tree stock and areas adjacent to urban and built-up lands; afforested areas, where no trees were growing before trees were planted, also count as forest land. The minimum area for classification of forest land is 1 acre; roadside, streamside, and shelterbelt strips of trees must have a crown width of at least 120 feet, whereas unimproved roads and trails, streams, and clearings in forest areas are classified as forest if less than 120 feet wide. 98% of Iowa’s forest land is timber land, defined by the Forest Service as land, not withdrawn from timber utilization by statute or administrative regulation, which produces or is capable of producing industrial wood crops. Areas qualifying as timberland are capable of producing in excess of 20 cubic feet of wood per acre per year in natural stands. 26 In Iowa, 98% of forests are mixed hardwoods, which means that 2% are conifer trees, otherwise known as softwoods. The 2007 USDA-FS-FIA data reported that all of the softwoods on timber land were found in native stands of timber on private land. 26 Miles.
Transcript
110
2.0 Maintenance of Productive Capacity of Forest Ecosystems Productive forests supply a number of important goods and services to society: they help prevent soil erosion, produce oxygen, filter pollutants, protect and enhance water quality, and offer opportunities for recreation and spiritual renewal; they supply lumber and wood for homes, furniture, papermaking, and fuel; and they supply non-wood products like cones, boughs, herbs, medicines and foods such as mushrooms, nuts and berries. Forest productivity varies according to the amount of forest land available and its fertility, health, environmental pollutants, location along the urban to rural continuum, past and current uses and management. Managing forests sustainability means balancing resource production with the ecosystem’s capacity to renew and sustain itself. Measuring and tracking the amount of forest land available for producing goods and services, the productivity of that forest land, and the amount, quality, and type of trees and other plants growing there is critical to determining whether people are balancing production, long-term ecological health and the capacity of forest products markets to utilize timber and other forest products.
2.1 Area of TimberlandSustainable forest management promotes production of wood and non-timber forest products in a way that maintains the ecosystem’s capacity for renewal. A forest’s ability to provide these benefits is dependent upon the soil type, water access and general health of sites that are suitable for production. Forest use decisions affect the acreage available for production, and management choices affect short and long-term yield potential.
According to 2007 USDA-FS-FIA data, Iowa has 3,054,000 acres of forest land, which the Forest Service defines as land comprised of at least 10 percent forest trees of any size; land that formerly had such tree cover and that will be naturally or artificially regenerated falls within this classification as well. Forest land includes transition zones, such as areas between heavily forested and non-forested lands comprised of at least ten percent forest tree stock and areas adjacent to urban and built-up lands; afforested areas, where no trees were growing before trees were planted, also count as forest land. The minimum area for classification of forest land is 1 acre; roadside, streamside, and shelterbelt strips of trees must have a crown width of at least 120 feet, whereas unimproved roads and trails, streams, and clearings in forest areas are classified as forest if less than 120 feet wide. 98% of Iowa’s forest land is timber land, defined by the Forest Service as land, not withdrawn from timber utilization by statute or administrative regulation, which produces or is capable of producing industrial wood crops. Areas qualifying as timberland are capable of producing in excess of 20 cubic feet of wood per acre per year in natural stands.26
In Iowa, 98% of forests are mixed hardwoods, which means that 2% are conifer trees, otherwise known as softwoods. The 2007 USDA-FS-FIA data reported that all of the softwoods on timber land were found in native stands of timber on private land.
26Miles.
111
Productive forests supply a number of important goods and services to society: they help prevent soil erosion, produce oxygen, filter pollutants, protect and enhance water quality, and offer opportunities for recreation and spiritual renewal; they supply lumber and wood for homes, furniture, papermaking, and fuel; and they supply non-wood products like cones, boughs, herbs, medicines and foods such as mushrooms, nuts and berries. Forest productivity varies according to the amount of forest land available and its fertility, health, environmental pollutants, location along the urban to rural continuum, past and current uses and management. Managing forests sustainability means balancing resource production with the ecosystem’s capacity to renew and sustain itself. Measuring and tracking the amount of forest land available for producing goods and services, the productivity of that forest land, and the amount, quality, and type of trees and other plants growing there is critical to determining whether people are balancing production, long-term ecological health and the capacity of forest products markets to utilize timber and other forest products.
2.1 Area of TimberlandSustainable forest management promotes production of wood and non-timber forest products in a way that maintains the ecosystem’s capacity for renewal. A forest’s ability to provide these benefits is dependent upon the soil type, water access and general health of sites that are suitable for production. Forest use decisions affect the acreage available for production, and management choices affect short and long-term yield potential.
According to 2007 USDA-FS-FIA data, Iowa has 3,054,000 acres of forest land, which the Forest Service defines as land comprised of at least 10 percent forest trees of any size; land that formerly had such tree cover and that will be naturally or artificially regenerated falls within this classification as well. Forest land includes transition zones, such as areas between heavily forested and non-forested lands comprised of at least ten percent forest tree stock and areas adjacent to urban and built-up lands; afforested areas, where no trees were growing before trees were planted, also count as forest land. The minimum area for classification of forest land is 1 acre; roadside, streamside, and shelterbelt strips of trees must have a crown width of at least 120 feet, whereas unimproved roads and trails, streams, and clearings in forest areas are classified as forest if less than 120 feet wide. 98% of Iowa’s forest land is timber land, defined by the Forest Service as land, not withdrawn from timber utilization by statute or administrative regulation, which produces or is capable of producing industrial wood crops. Areas qualifying as timberland are capable of producing in excess of 20 cubic feet of wood per acre per year in natural stands.26
In Iowa, 98% of forests are mixed hardwoods, which means that 2% are conifer trees, otherwise known as softwoods. The 2007 USDA-FS-FIA data reported that all of the softwoods on timber land were found in native stands of timber on private land.
During the 2007 USDA-FS-FIA inventory, hardwoods were inventoried on 2.9 million acres of naturally regenerated timberland. About 27,000 acres of hardwood timber land were planted, of which 14,000 acres were on public land and 13,000 were on private land. The inventory plots were located on 2.4 million acres of private land and on 406,000 acres of public land.
Riparian corridors, like the one pictured here, tend to have even aged stands of elm, ash, cottonwood, swamp white oak, silver maple, black walnut, bur oak, basswood and hickory. On the uplands, there is a mix of white oak, bur oak, hickory and ash on drier sites while red oak, walnut, green ash and hard maple tend to grow on cooler north and east-facing slopes.
Knowing how much actual land is unavailable for harvesting, or reserved, is difficult to determine because private landowners own over 90% of Iowa’s forests, and landowner attitudes about cutting trees on their land can change from day to day. Data from the 2006 Forest Service Woodland Owner Survey reveals that landowners who had trees harvested or removed from their property were out-numbered 2:1 by those who had not allowed any harvesting or cutting. Of those landowners that did harvest trees, only 1 in 6 received professional forestry assistance. Iowa landowners who do not intend to harvest timber from their land in the next five years outnumber those that do by a ratio of five to one. Those landowners that do harvest typically do so in order to improve the quality of remaining trees, remove trees damaged by natural catastrophes or use the wood of mature trees for personal consumption.27
Landowners with relatively small amounts of forest are less likely to harvest than those with relatively large amounts because the little land that they do own is usually valued for its aesthetic rather than its productive capabilities; furthermore, those with older, larger trees are concerned about the time frame needed for the reestablishment of such trees once they are cut down. Approximately 111,000 forest landowners in Iowa collectively own roughly 482,000 acres or an average of less than five acres apiece.28
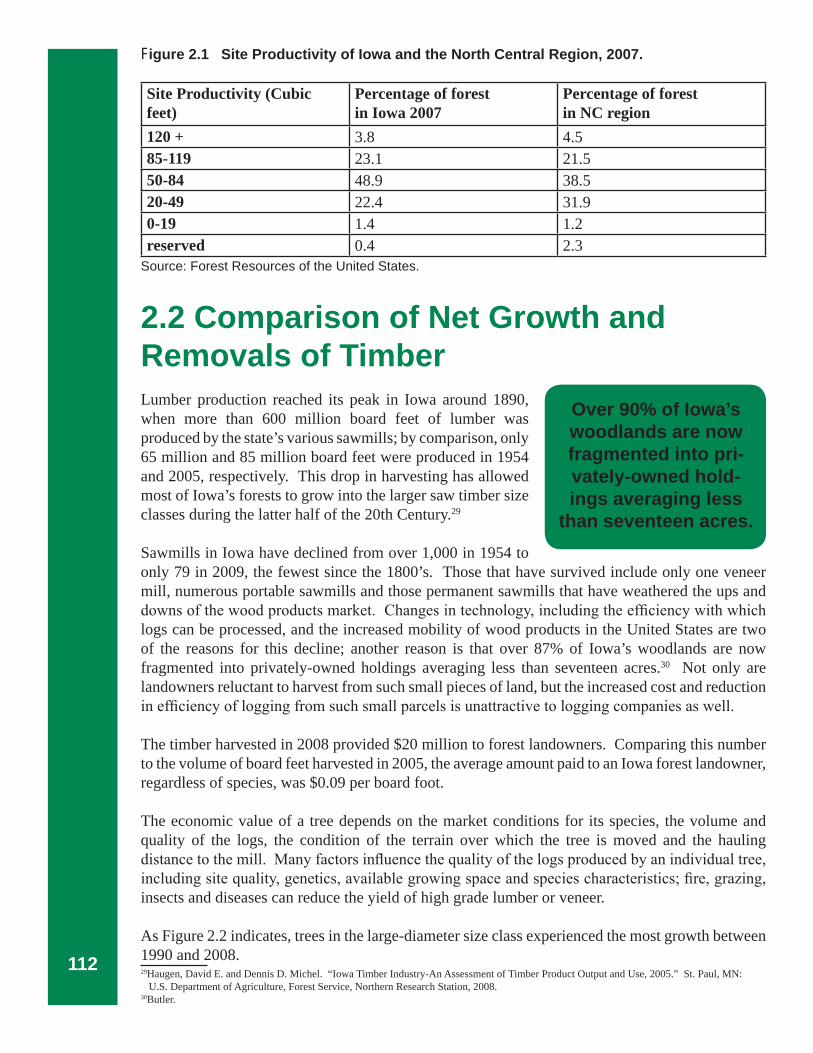
The USDA-FS defines the North Central Region as the states of Illinois, Indiana, Iowa, Michigan, Minnesota, Missouri, Ohio and Wisconsin. Figure 2.1 compares the percentage of forest in Iowa and the percentage of forest in the North Central region capable of producing a specific volume of wood for different volume ranges in 2007; for example, 23.1% of Iowa’s forests produced 85-119 cubic feet of wood, compared to 21.5% in the North Central Region as a whole; the figure also shows that most of Iowa’s forests were capable of producing at least 50-84 cubic feet.
Riparian forest area. Photo by Mark Vitosh.
27Butler.28Butler.
112
Figure 2.1 Site Productivity of Iowa and the North Central Region, 2007.
2.2 Comparison of Net Growth and Removals of TimberLumber production reached its peak in Iowa around 1890, when more than 600 million board feet of lumber was produced by the state’s various sawmills; by comparison, only 65 million and 85 million board feet were produced in 1954 and 2005, respectively. This drop in harvesting has allowed most of Iowa’s forests to grow into the larger saw timber size classes during the latter half of the 20th Century.29 Sawmills in Iowa have declined from over 1,000 in 1954 to only 79 in 2009, the fewest since the 1800’s. Those that have survived include only one veneer mill, numerous portable sawmills and those permanent sawmills that have weathered the ups and downs of the wood products market. Changes in technology, including the efficiency with which logs can be processed, and the increased mobility of wood products in the United States are two of the reasons for this decline; another reason is that over 87% of Iowa’s woodlands are now fragmented into privately-owned holdings averaging less than seventeen acres.30 Not only are landowners reluctant to harvest from such small pieces of land, but the increased cost and reduction in efficiency of logging from such small parcels is unattractive to logging companies as well.
The timber harvested in 2008 provided $20 million to forest landowners. Comparing this number to the volume of board feet harvested in 2005, the average amount paid to an Iowa forest landowner, regardless of species, was $0.09 per board foot.
The economic value of a tree depends on the market conditions for its species, the volume and quality of the logs, the condition of the terrain over which the tree is moved and the hauling distance to the mill. Many factors influence the quality of the logs produced by an individual tree, including site quality, genetics, available growing space and species characteristics; fire, grazing, insects and diseases can reduce the yield of high grade lumber or veneer.
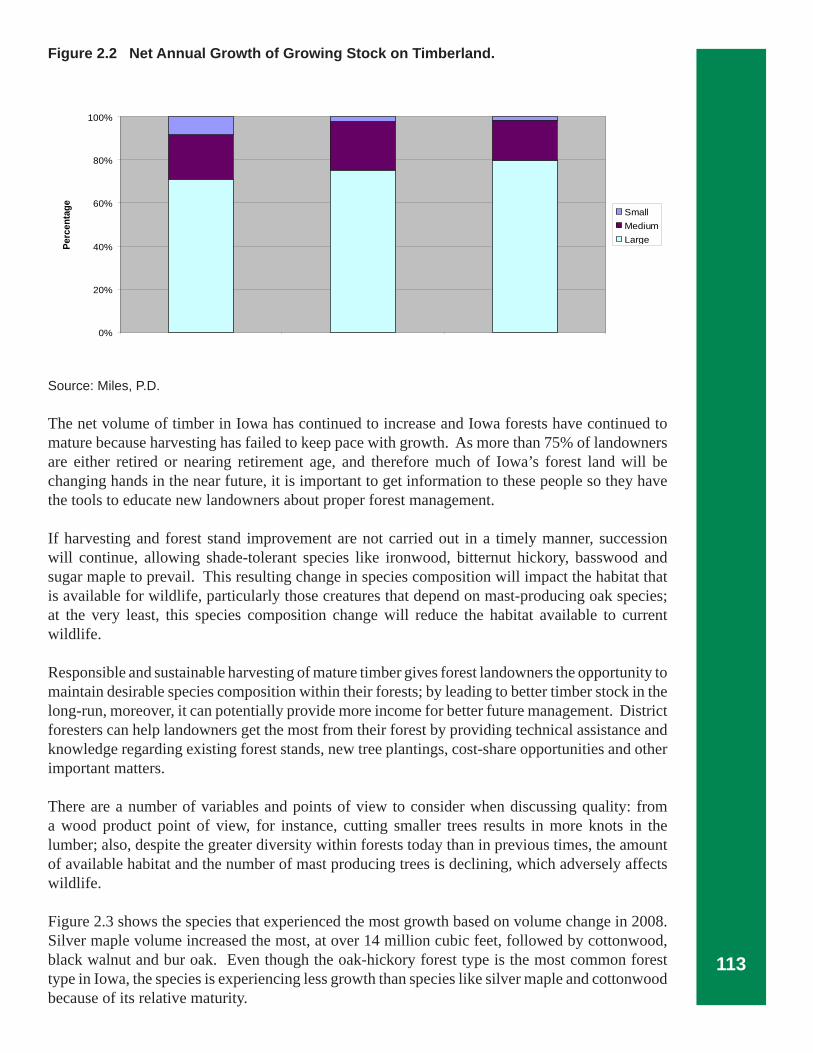
As Figure 2.2 indicates, trees in the large-diameter size class experienced the most growth between 1990 and 2008. 29Haugen, David E. and Dennis D. Michel. “Iowa Timber Industry-An Assessment of Timber Product Output and Use, 2005.” St. Paul, MN: U.S. Department of Agriculture, Forest Service, Northern Research Station, 2008.30Butler.
Over 90% of Iowa’s woodlands are now fragmented into pri-vately-owned hold-ings averaging less
than seventeen acres.
113
Figure 2.2 Net Annual Growth of Growing Stock on Timberland.
Source: Miles, P.D.
The net volume of timber in Iowa has continued to increase and Iowa forests have continued to mature because harvesting has failed to keep pace with growth. As more than 75% of landowners are either retired or nearing retirement age, and therefore much of Iowa’s forest land will be changing hands in the near future, it is important to get information to these people so they have the tools to educate new landowners about proper forest management.
If harvesting and forest stand improvement are not carried out in a timely manner, succession will continue, allowing shade-tolerant species like ironwood, bitternut hickory, basswood and sugar maple to prevail. This resulting change in species composition will impact the habitat that is available for wildlife, particularly those creatures that depend on mast-producing oak species; at the very least, this species composition change will reduce the habitat available to current wildlife.
Responsible and sustainable harvesting of mature timber gives forest landowners the opportunity to maintain desirable species composition within their forests; by leading to better timber stock in the long-run, moreover, it can potentially provide more income for better future management. District foresters can help landowners get the most from their forest by providing technical assistance and knowledge regarding existing forest stands, new tree plantings, cost-share opportunities and other important matters.
There are a number of variables and points of view to consider when discussing quality: from a wood product point of view, for instance, cutting smaller trees results in more knots in the lumber; also, despite the greater diversity within forests today than in previous times, the amount of available habitat and the number of mast producing trees is declining, which adversely affects wildlife.
Figure 2.3 shows the species that experienced the most growth based on volume change in 2008. Silver maple volume increased the most, at over 14 million cubic feet, followed by cottonwood, black walnut and bur oak. Even though the oak-hickory forest type is the most common forest type in Iowa, the species is experiencing less growth than species like silver maple and cottonwood because of its relative maturity.
New Annual Growth of Growing Stock on Timberland
0%
20%
40%
60%
80%
100%
1990 2003 2008
Year
Perc
enta
ge SmallMediumLarge
114
Figure 2.3 Species with the Most Growth, 2008.
Source: Miles, P.D.
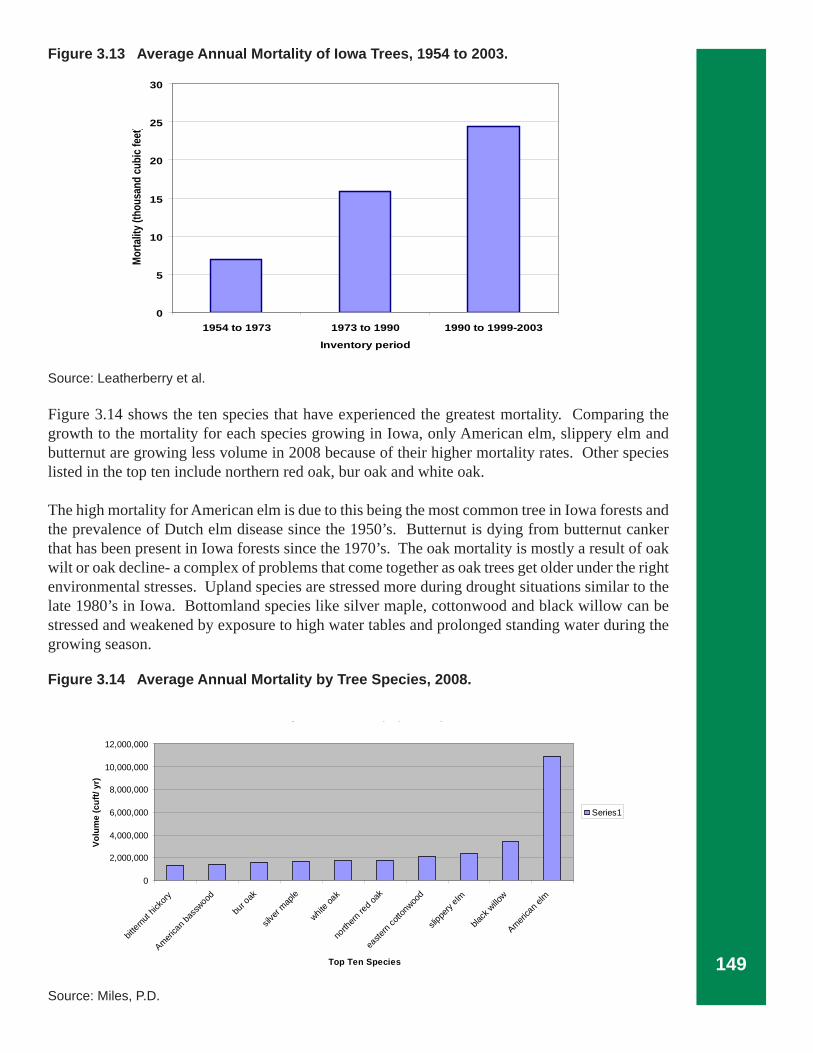
Figure 2.4 shows that growth within Iowa forests continues to out-pace removals from harvesting and mortality. Most of Iowa’s forests are experiencing growth of approximately 30% less than their potential because of poor stocking levels. The ratio of growing wood volume to harvested volume was more than two to one in 2008; this trend may be difficult to maintain as Iowa’s trees mature because growth rates will decrease while losses from harvesting and mortality will likely stay the same or increase. This trend is reflected in Figure 2.4, which shows that there was a 20% drop in forest growth between 2003 and 2008. In 2008, 45% of the volume of wood grown on timber land was harvested and another 35% was lost due to mortality, a combined loss of over 36 million cubic feet; mortality losses that year were the highest reported in the eighteen years leading up to that time.
Species with the most Growth in 2008
0
2,000,000
4,000,000
6,000,000
8,000,000
10,000,000
12,000,000
14,000,000
16,000,000
hone
ylocu
st
green
ash
white oa
k
America
n bas
swood
north
ern re
d oak
hack
berry
bur o
ak
black
walnu
t
easte
rn co
ttonwoo
d
silve
r map
le
Species
Volu
me
of G
row
th (c
uft/
yr)
More volume of timber is lost to
mortality than what is harvested for wood
products.
115
Figure 2.4 Estimates for Growth, Removals & Mortality of Growing Stock on Iowa Timberland.
Source: Miles, P.D.
Figure 2.5 compares the net annual growth, removal and mortality in forests located in Iowa and surrounding states. Iowa was one of four states out of seven in the surrounding area that had a positive growth rate according to 2002 Timber Product Output (TPO) data. Even after taking acreage discrepancies between the different states into account, Iowa’s net growth from its timber land ranked fifth out of the seven (Illinois was ranked highest). Since over half of Iowa’s forests are under-stocked, their growth will continue to lag behind surrounding states, even though Iowa has soils that provide a competitive advantage. This data shows that Iowa has the ability to produce a significant amount of timber from its forests while also providing carbon storage, high quality water, habitat for wildlife, erosion resistance and natural beauty. Considering that most of Iowa’s forests are on poor quality soils, steep slopes or areas too wet to farm, the potential to grow highly productive stands of timber remains very high. When faced with the choice between growing agricultural crops for an annual income or growing trees, which provide benefits such as clean air, clean water and habitat for hundred of species of native wildlife, landowners typically choose annual income; only those people that do not depend on agriculture for their livelihood can afford to take land out of agricultural production to grow trees. Until there is a mechanism to reimburse forest landowners for the benefits that the trees on their land provide to society, the short-term financial gains associated with agriculture are going to make increasing forest cover in the state extremely difficult.
Estimates for Growth, Removals & Mortality of growing-stock on Iowa Timberland
0
20,000,000
40,000,000
60,000,000
80,000,000
100,000,000
120,000,000
140,000,000
1990 2003 2008
Year
Volu
me
(cuf
t/yr)
GrowthRemovals (harvest and other)Mortality
116
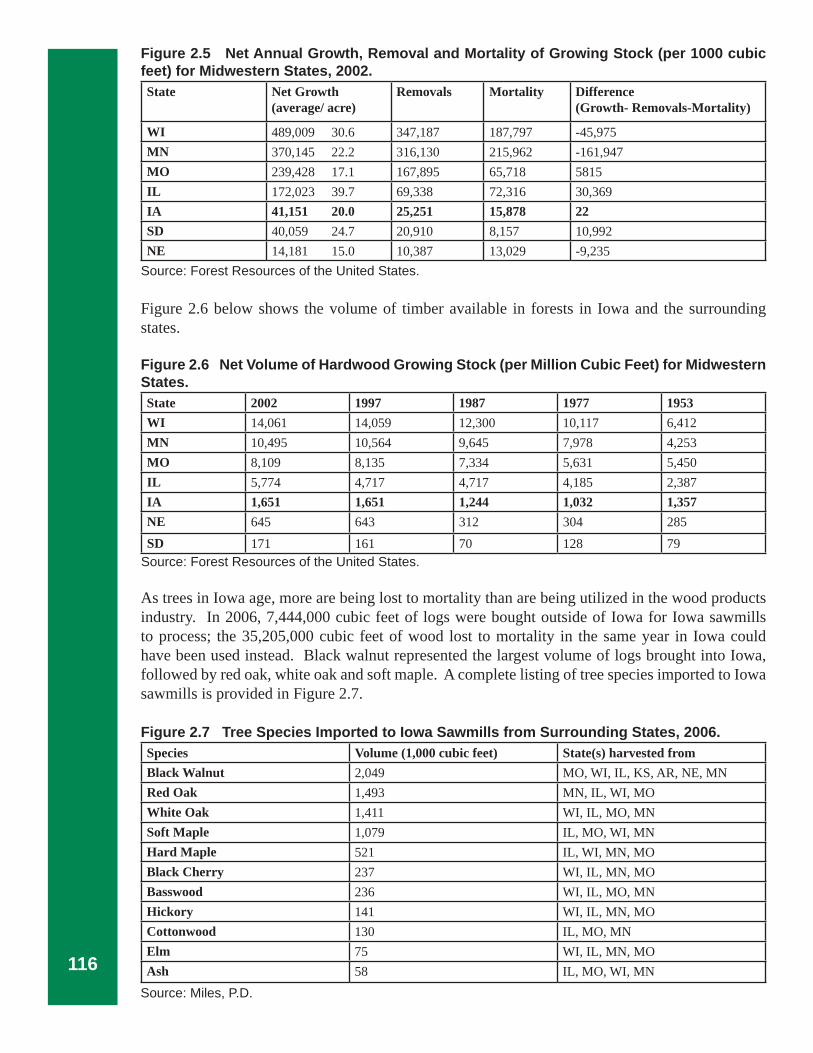
Figure 2.5 Net Annual Growth, Removal and Mortality of Growing Stock (per 1000 cubic feet) for Midwestern States, 2002.State Net Growth
Figure 2.6 below shows the volume of timber available in forests in Iowa and the surrounding states.
Figure 2.6 Net Volume of Hardwood Growing Stock (per Million Cubic Feet) for Midwestern States. State 2002 1997 1987 1977 1953WI 14,061 14,059 12,300 10,117 6,412MN 10,495 10,564 9,645 7,978 4,253MO 8,109 8,135 7,334 5,631 5,450IL 5,774 4,717 4,717 4,185 2,387IA 1,651 1,651 1,244 1,032 1,357NE 645 643 312 304 285SD 171 161 70 128 79
Source: Forest Resources of the United States.
As trees in Iowa age, more are being lost to mortality than are being utilized in the wood products industry. In 2006, 7,444,000 cubic feet of logs were bought outside of Iowa for Iowa sawmills to process; the 35,205,000 cubic feet of wood lost to mortality in the same year in Iowa could have been used instead. Black walnut represented the largest volume of logs brought into Iowa, followed by red oak, white oak and soft maple. A complete listing of tree species imported to Iowa sawmills is provided in Figure 2.7.
Figure 2.7 Tree Species Imported to Iowa Sawmills from Surrounding States, 2006.Species Volume (1,000 cubic feet) State(s) harvested fromBlack Walnut 2,049 MO, WI, IL, KS, AR, NE, MNRed Oak 1,493 MN, IL, WI, MOWhite Oak 1,411 WI, IL, MO, MNSoft Maple 1,079 IL, MO, WI, MNHard Maple 521 IL, WI, MN, MOBlack Cherry 237 WI, IL, MN, MOBasswood 236 WI, IL, MO, MNHickory 141 WI, IL, MN, MOCottonwood 130 IL, MO, MNElm 75 WI, IL, MN, MOAsh 58 IL, MO, WI, MN
Source: Miles, P.D.
117
2.3 Trend of Timber Harvesting by SpeciesWhile the volume of timber from Iowa’s forests has increased in the past twenty-five years, the quantity and quality of the state’s woodlands are at considerable risk. The strong markets for traditional agricultural commodities in the 1960’s and 70’s created incentives for forest landowners that led to the clearing of one-third of Iowa’s existing woodlands. If concern for Iowa’s forest resources does not increase among the general populace, agricultural incentives and rapid suburban development will continue to cause woodland losses, which will in turn lead to degraded wildlife habitat and decreased water quality.
Figure 2.8 shows that in 2008, white oak harvesting exceeded black walnut harvesting by a factor of nearly two; what’s more, the amount of silver maple and northern red oak harvested also surpassed that of black walnut.31
Figure 2.8 Harvest Removals from Iowa Forests by Species, 2008.
Source: Miles, P.D.
Between 2000 and 2005, veneer log production in Iowa increased by 40%, from 3.6 million board feet to 5.1 million board feet; in 2005, black walnut accounted for 2.5 million board feet, while white oak accounted for 1.7 million board feet.32
Improper management and harvesting techniques have led to a reduction in the quality of much of Iowa’s forests; moreover, high-grading, or the selective cutting of the best trees, has forced log buyers and sawmills to revert to using increasingly smaller diameter and lower quality logs than they used in the past. As a result, the amount of timber land with little to no immediate economic, wildlife, or aesthetic value continues to increase.
31Miles.32Haugen and Michel.
2008 Harvest Removals by Species
0
500,000
1,000,000
1,500,000
2,000,000
2,500,000
3,000,000
3,500,000
4,000,000
America
n bas
swood
black
cherr
y
America
n elm
suga
r map
le
black
oak
easte
rn co
ttonwoo
d
black
walnu
t
north
ern re
d oak
silve
r map
le
white oa
k
Species
Har
vest
Vol
ume
(cuf
t/yr)
118
Figure 2.9 gives a county-level breakdown of timber harvesting in Iowa for 2006. As the figure reflects, the eastern quarter of the state, which has the most forest and greatest number of sawmills, experienced the most overall harvesting activity.
Figure 2.9 Industrial Roundwood Production by County, 2006.
Source: Leatherberry, et al.
Volume of Timber in Iowa’s ForestsIn the 1950’s oak, hickory, elm, ash and cottonwood made up nearly 90% of the forest land in Iowa. In 1954, Iowa’s forests contained 1.4 billion cubic feet of volume growing stock; American elm made up the largest portion of this stock, at 206.6 million cubic feet, followed by white oak, northern red oak and cottonwood at 132.5 million, 126.8 million and 120.4 million cubic feet, respectively.33 By comparison, the total volume of growing stock in 2007 was about 4.2 billion cubic feet, an increase of roughly 2.8 billion cubic feet or 200% over a sixty-year period. Silver maple made up the biggest share at 515 million cubic feet, followed by bur oak and cottonwood. Figure 2.10 shows a more complete breakdown by species for 2007.
Biological diversity is important for the long term sustainability of a healthy forest. The tree species composition within Iowa is diverse and stable. The greatest determinant of the future composition of a forest is its exposure to sunlight, or, in Iowa’s case, lack thereof; species such as sugar maple and basswood, which are highly shade-tolerant, will thrive, while those that require sun exposure, such as oak, will not. This is a point that has been made numerous times throughout this assessment, and, as the above paragraph indicates, it is a fact that has already affected the composition of Iowa’s forests.
33Thornton, P.L. and J.T. Morgan. The Forest Resources of Iowa. For. Surv. Release 22. Columbus, OH: U.S. Department of Agriculture - Forest Service, Central States Forest Experiment Station, 1959. p. 40.
119
Figure 2.10 Most Common Tree Species by Volume, 2007.Species Volume of live
Trees on Forest Land (1,000,000 ft^3)
Sampling Error (%)
Change since2006 (%)
Silver Maple 516.2 20.2 4.3Bur Oak 434.6 11.7 -6.7Cottonwood 372.2 31.5 2.0White Oak 351.0 13.5 -0.9Black Walnut 266.9 12.5 2.5Northern Red Oak 257.1 15.3 -1.2American Elm 245.2 8.0 3.8American Basswood 193.0 15.6 0.3Hackberry 186.5 13.1 0.9Shagbark Hickory 159.2 12.0 -2.7Other Softwood Species
44.8 16.3 -5.9
Other HardwoodSpecies
1217.2 4.8 2.5
All Species 4243.9 4.5 0.8Source: Nelson and Brewer.
Sawtimber VolumeFigures 2.11 and 2.12 show the distribution of sawtimber volume by species as a percentage of total volume for 1954 and 2006, respectively. Figure 2.12 shows that by 2006, Dutch elm disease had reduced elm, which made up the largest portion of sawtimber in 1954 at 21%, to only 4% of total sawtimber. Black walnut, the most economically valuable tree species in the state, saw its representation nearly double from 1954 to 2006 as forest landowners came to recognize its financial value. Iowa’s increasing forest diversity is reflected in the emergence of an “other” category in Figure 2.12, which represented nearly one-third of all sawtimber in 2006.
Figure 2.11 Percentage of Sawtimber Volume by Species Group, 1954.
Source: Thornton and Morgan.
Percentage of Sawtimber Volume by Species Group (1954)
ELMS
WHITE OAK
RED OAK
COTTONWOOD
SILVER MAPLE
BASSWOOD
WHITE ASH HICKORYBLACK WALNUT
ELMS= 21.1
WHITE OAK= 17.4
RED OAK= 15
COTTONWOOD= 11.8
SILVER MAPLE= 9.1
BASSWOOD= 6.7
BLACK WALNUT= 3.8
WHITE ASH= 3.2
HICKORY= 3
120
Figure 2.12 Percentage of Sawtimber Volume by Species Group, 2006.
Source: Miles, P.D.
The volume of wood in all diameter size classes increased in Iowa between 1990 and 2003, a fact displayed in Figure 2.13 below. Growing stock in the 22”+ categories made up the largest proportion of total stock, and doubled over the thirteen-year time period.
Figure 2.13 Distribution of Growing-Stock Volume by Diameter Class, 1990 and 2003.
Management ImplicationsMarkets are needed to utilize small diameter trees that are girdled during forest stand improvement activities; this could potentially allow forest landowners to not only pay for forest stand improvements through the removal and sale of low-quality timber, but to improve their long-term potential by putting more quality growth on the trees that remain after such treatments. This would help forest landowners become more engaged with their forests and counteract the low stocking levels present in the majority of their forests. Another area in which markets are lacking for landowners is that of harvesting residues; in 2005, loggers left 11.4 million cubic feet of timber residue behind, of which about 33% was oak and 24% was silver maple.34
Knowledge and skills are available to landowners through workshops, field-days and one-on-one appointments with DNR district foresters across the state; unfortunately, the dramatic increase in the number of landowners in recent years has made it difficult for these foresters, who continue to be spread more and more thinly. It is a challenge to keep forest landowners updated on programs for which they may be eligible and to ensure that thinning is performed at the correct times in a forest’s lifecycle; as land continues to change ownership and parcels continue to decrease in size, however, these tasks will be even more difficult to carry out.
Management plans guide making decisions for stands on state forests; these plans reflect management intentions over a twenty year period, and are based on current knowledge of land capability, inventory data, sound forestry practices, land stewardship and public demands. They are considered working documents, and are revised as needed to address the challenges of managing constantly changing forest resources.
A species-specific summary of timber harvested on state forest land is given in Figure 2.14.
Figure 2.14 Percentage of Sawtimber Harvested on State Forests in 2010.
Source: Jeff Goerndt.
Percentage of Sawtimber Harvested on State Forests in 2010
Often times, forest landowners sell their timber without thinking about how the remaining stand composition of their forest lands will influence future economic potential. High-grading typically results in changing species composition, particularly the growth of less desirable species and the decline of more desirable ones. As these stands become less productive, loggers lose interest in them and financial opportunities for landowners dry up, leading to no management in the future and even further decline. In order to ensure that this cycle does not persist, it is important that incentives for proper forest management are provided to landowners.
2.4 Highlights of Productive Capacity The number of sawmills in Iowa has shrunk to its lowest since the 1800s.
Shade-intolerant species are becoming less common in Iowa’s forests due to lack of disturbances.
About 111,000 forest landowners own less than 20 acres of forest apiece, and they are unlikely to commit such small parcels to timber harvesting.
Over 36 million cubic feet of wood in Iowa’s forest land that could have been harvested for wood products died in 2008, due either to a lack of awareness of proper management techniques or an unwillingness to manage on the part of forest landowners.
Lack of disturbance is creating changes in the species composition of Iowa forests, which is in turn leading to changes in wildlife composition.
Until incentives are put into place that reward forest landowners for the numerous benefits that their forests provide, Iowa forest lands will continue to succumb to the financial appeal of agriculture.
The species most harvested in 2008 were shade-intolerant white oak, silver maple, northern red oak and black walnut.
Markets are needed for sawtimber and small diameter trees so that forest landowners have financial incentives to better manage their forests.
Shade-intolerant species are becoming
less common in Iowa’s forests due to lack of disturbances.
123
3.0 Maintenance of Forest Ecosystem Health and Vitality Forest health describes the overall condition of forests and trees and how well they recover from stress. There are many factors that affect forest health: natural factors include insects and diseases, as well as severe weather or catastrophic events like ice storms, tornados, hurricanes, floods, and droughts; unnatural or human-induced factors include housing and other developments, which cause changes in soil hydrology and reduce the size of forest patches, leading to destruction of habitat for native species. The greatest problems are caused by a combination of stressors; much as human susceptibility to illness depends on constantly changing factors, stressors to trees come and go, making forest health difficult to assess at individual points in time; for example, damage from native insects varies from year to year and decade to decade, depending upon weather, natural population cycles and other factors.
Iowa’s forest health issues can be separated into two categories, native and non-native. Native insects and pathogens that help to recycle trees by breaking them down to simpler organic compounds are usually beneficial. These insects and diseases usually help maintain a healthy forest and are usually only a problem for a tree when it has reached its biological maturity or natural causes have compromised its ability to grow, which causes it to release pheromones, or chemical signals, that attract insects. Healthy trees are able to repel attacks from native insects and diseases; often times insects act as disease carriers. Normal insect feeding activity may by tolerable to a tree, but if the insect releases a disease while feeding on the tree, even an exceptionally healthy tree can be compromised.
Some forest health issues affecting states bordering Iowa include the non-native gypsy moth, emerald ash borer, and Asian long-horned beetle, which, if established, will impact Iowa’s forest composition. Non-native insects or pathogens do not have as many predators as native ones, and are usually devastating to the tree species they feed on because those trees’ defense mechanisms are not able to repel them.
In addition to insects and diseases, weather has an indiscriminate impact on both forest resources and urban community trees in Iowa. In 2008, 87 of Iowa’s 99 counties were declared national disaster areas by the President of the United States due to severe flooding and tornado damage; these events displaced 38,000 residents and required 166,000 tons of debris to be removed from affected communities. State managed lands were severely impacted as well, as wind and water caused an estimated $3.3 million in damage to campgrounds, trails, roads, docks, beaches, bridges, buildings, playgrounds, and residences in 32 Iowa parks. The economic impact of lost revenue during 2008 for DNR operations totaled more than $1.1 million.35
35Feeley, Tivon. 2009 Forest Health Report. <iowadnr.gov/forestry/files/fhr2009.pdf>.
124
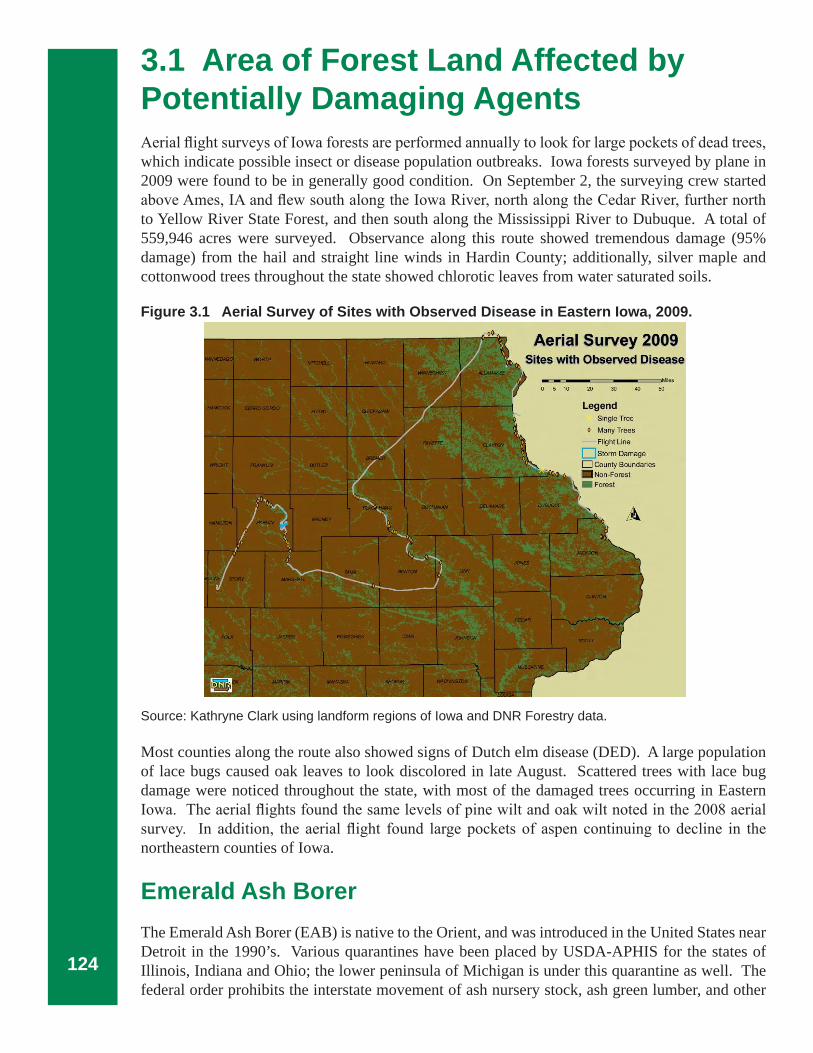
3.1 Area of Forest Land Affected by Potentially Damaging AgentsAerial flight surveys of Iowa forests are performed annually to look for large pockets of dead trees, which indicate possible insect or disease population outbreaks. Iowa forests surveyed by plane in 2009 were found to be in generally good condition. On September 2, the surveying crew started above Ames, IA and flew south along the Iowa River, north along the Cedar River, further north to Yellow River State Forest, and then south along the Mississippi River to Dubuque. A total of 559,946 acres were surveyed. Observance along this route showed tremendous damage (95% damage) from the hail and straight line winds in Hardin County; additionally, silver maple and cottonwood trees throughout the state showed chlorotic leaves from water saturated soils.
Figure 3.1 Aerial Survey of Sites with Observed Disease in Eastern Iowa, 2009.
Source: Kathryne Clark using landform regions of Iowa and DNR Forestry data.
Most counties along the route also showed signs of Dutch elm disease (DED). A large population of lace bugs caused oak leaves to look discolored in late August. Scattered trees with lace bug damage were noticed throughout the state, with most of the damaged trees occurring in Eastern Iowa. The aerial flights found the same levels of pine wilt and oak wilt noted in the 2008 aerial survey. In addition, the aerial flight found large pockets of aspen continuing to decline in the northeastern counties of Iowa.
Emerald Ash BorerThe Emerald Ash Borer (EAB) is native to the Orient, and was introduced in the United States near Detroit in the 1990’s. Various quarantines have been placed by USDA-APHIS for the states of Illinois, Indiana and Ohio; the lower peninsula of Michigan is under this quarantine as well. The federal order prohibits the interstate movement of ash nursery stock, ash green lumber, and other
125
materials such as logs, stumps, roots, branches, and composted and un-composted chips. Due to the difficulty of distinguishing between species of hardwood firewood, all hardwood firewood is included in this quarantine.
EAB has more potential for future harm to Iowa forests and urban communities than any other insect currently being dealt with in the United States. EAB kills all ash species by burrowing under the bark and eating the growth (cambium) layers of the trees. EAB has been found capable of killing every species and size of ash tree in neighborhoods or woodlands. Ash is one of the most abundant native tree species in North America, and has been a preferred and heavily planted landscape tree in yards and other urban areas.
Managing urban ash tree with an advancing emerald ash borer will require resources for inventory, outreach, monitoring, tree removal and tree replacement. With ash representing approximately 20% of every community’s public trees, the costs associated with emerald ash borer will be significant for both homeowners and communities.
Emerald Ash Borer Locations in Surrounding States
The Iowa Department of Natural Resources (IDNR) Forestry Bureau, in cooperation with the Iowa Department of Agriculture (IDALS) State Entomologist Office, has been following the United States Department of Agriculture Forest Service (USFS) protocol to monitor Iowa for signs of EAB. The detection of EAB in Victory, WI in the spring of 2009 places this insect only a few miles away from Allamakee County in northeast Iowa, which is of particular concern because it is Iowa’s most heavily forested county and is essential to the state’s timber industry. The detection of EAB in Peru, Illinois in July of 2007 places EAB only 85 miles from the city of Davenport, Iowa; this detection is of concern because of its proximity to both Iowa and Interstate 80, which is a major link between the two states. Furthermore, the confirmation of EAB in Missouri in 2008 is of great concern. According to recent sources, Iowa has an estimated 60 million rural ash trees and 35 million urban ash trees.36
An EAB surveillance effort has been in place since 2004. In 2004 and 2005, this activity consisted of visual surveys of urban ash trees in cities of more than 1,000 residents in all 99 counties, as well as visual inspections of ash saw logs from 43 sawmills and ash nursery stock. Visual surveys involved 2,078 trees on 252 sites in 2004 and 1,318 trees on 238 sites in 2005.
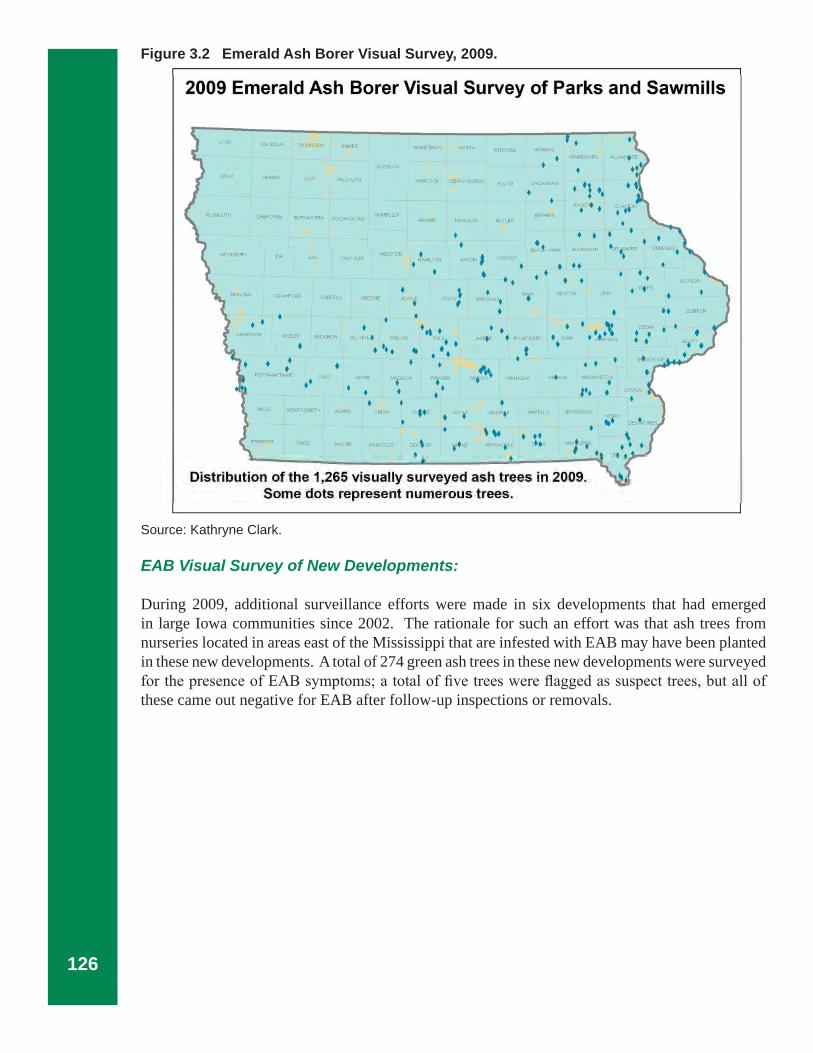
During the 2006, 2007, 2008 and 2009 seasons, surveillance strategies shifted to the highest risk areas in the state, campgrounds. Sites were selected based on proximity to interstate highways, tourism sites, and the state’s eastern border. Up to 10 trees were examined in each campground for signs of EAB; the larger the campground and the greater the ash density, the more ash trees that were visually examined. In 2006, 417 ash trees were surveyed in 50 state and 10 county campgrounds; in 2007, surveillance increased to 1,102 trees in 400 campgrounds, including all federal, state, private and large campgrounds in 69 counties. In 2008, 235 campgrounds in 55 counties were identified as high risk sites and 1,269 ash trees were subsequently inspected; in 2009, 234 campgrounds in 55 counties were identified as high risk and 1,265 trees were inspected. No evidence of EAB was noted during visual surveillance in Iowa from 2004 to 2009. Figure 3.2 shows where visual surveys were performed in 2009.
36Miles.
126
Figure 3.2 Emerald Ash Borer Visual Survey, 2009.
Source: Kathryne Clark.
EAB Visual Survey of New Developments:
During 2009, additional surveillance efforts were made in six developments that had emerged in large Iowa communities since 2002. The rationale for such an effort was that ash trees from nurseries located in areas east of the Mississippi that are infested with EAB may have been planted in these new developments. A total of 274 green ash trees in these new developments were surveyed for the presence of EAB symptoms; a total of five trees were flagged as suspect trees, but all of these came out negative for EAB after follow-up inspections or removals.
127
Source: Kathryne Clark.
Sentinel Trees
Sentinel trees are created in one of two ways: girdling standing ash trees that are 4-13 inches in DBH, or planting and girdling donated containerized ash trees that are approximately three inches in caliper. Sentinel trees are established by June 1 of each year. In general, containerized trees are used for private campgrounds or in areas with few ash trees, while standing ash trees are used on federal, state or county properties. A tree is girdled by using a folding hand saw to make two cuts through the bark approximately four to six inches apart, and then removing the bark between the cuts with a drawknife. Every effort is made to select standing ash that are either in the open or exposed on two or three sides; trees within forest stands are rejected as possible sentinel trees.
128
In 2005, 48 sentinel trees, including 23 standing and 25 containerized trees, were set up on 12 sites across the state; in 2006, 68 sentinel trees, including 27 standing and 41 containerized were established on 18 sites; of these sites, ten were retained for evaluation in 2007. In 2007, 237 sentinel trees, including 190 standing and 47 containerized trees, were established on 57 sites; in 2008, 401 sentinel trees, including 272 standing and 129 containerized, were established on 117 sites. During the fall of each year, sentinel trees were bark peeled on site, and new sentinel trees were girdled for monitoring the following season. A single EAB larvae was discovered in one sentinel tree in Clayton county in 2008, but no other signs have been detected in the area. Figure 3.3 shows general locations of sentinel trap trees throughout Iowa in 2009.
During a site visit in May of 2010, four EAB larvae were found in an ash tree growing on an island in the Mississippi River about 2 miles south of the Minnesota border in Allamakee County. This was Iowa’s first confirmation of EAB. A quarantine prohibiting the movement of firewood, ash nursery stock, ash timber, or any other article that could further spread EAB is in effect from the Iowa Department of Agriculture and Land Stewardship. A federal quarantine will follow the state quarantine.
Experimental TrapsDuring 2009, 656 purple sticky traps were obtained from USDA-APHIS for detection efforts in Iowa. Traps were installed in June and a mid-season trap check was conducted approximately one month after placement in order to collect suspect beetles, re-coat panels with Tanglefoot (glue) and then re-install traps in the canopy. By the end of August of that year, all traps were removed, insects were collected, and traps were discarded. The picture to the right is an example of an EAB purple trap hung in an ash tree. Figure 3.4 shows where purple traps were located in 2009.
Figure 3.4 Iowa Emerald Ash Borer National and Delimiting Survey Draft, 2009.
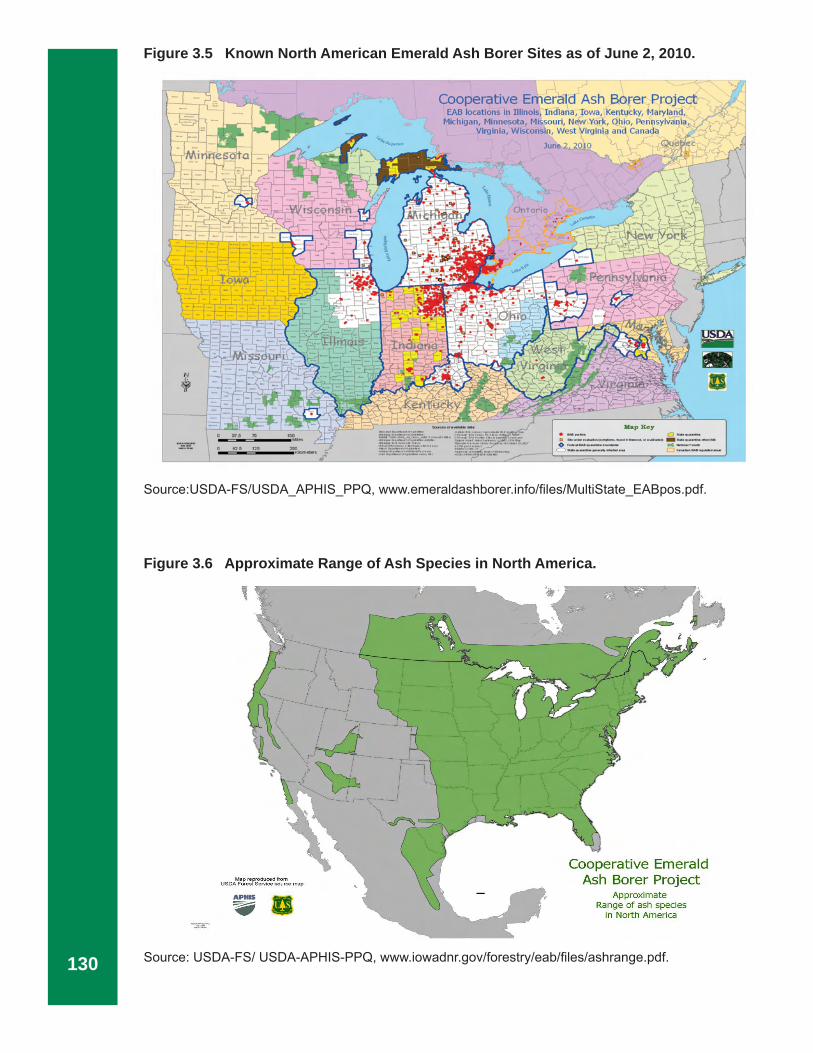
Source: Mark Hollister, USDA-APHIS-PPQ.Figure 3.5 shows EAB locations in the United States as of June 2, 2010, while Figure 3.6 shows the range of ash trees susceptible to EAB in the U.S. Because ash trees have been useful as trainer trees in tree plantings, as firewood for homeowners, and for successful planting in urban areas, preventing EAB from getting established is the key to protecting the ash resource. The longer Iowa can isolate or minimize the population of the emerald ash borer, the longer ash trees will still be a viable tree in the landscape. Hopefully researchers will soon come up with a better detection system and/or a way to contain this destructive insect. For now, these survey methods offer the best tools for monitoring for the presence of EAB in Iowa. (For current information on the status of EAB, log onto www.emeraldashborer.info).
EAB purple trap hanging in an ash tree. Photo by Mark Vitosh.
130
Figure 3.5 Known North American Emerald Ash Borer Sites as of June 2, 2010.
Gypsy MothGypsy Moth is a European insect species that was introduced into New England over 100 years ago in an attempt to provide silk for the textile industry. This exotic insect continues to spread west from its introduction site and defoliate native forests wherever it becomes established. Gypsy moth larvae feed on the leaves of host trees during the summer, removing the hosts’ ability to use their leaves to create food. If repeated defoliation occurs several years in a row on the same trees, these trees’ stored reserves of nutrients will be depleted, leading to their decline. The establishment of Gypsy Moth in Iowa will affect the survival of some of the oldest trees in the state.
The 2008 summer season provided the largest catch of male gypsy moths in state history; 626 moths were caught in 495 traps, with most catches found in northeast Iowa, the part of the state closest to the established population in Wisconsin. Unlike previous years, many traps had multiple moths in 2008. There were far fewer catches during the 2009 summer than during the previous year, as only 82 male moths were caught in 68 traps. Because no egg masses were found, no treatments are being planned for Iowa in 2010; however, there will be additional traps placed around the positive catches.
Weather patterns, an introduced fungus disease called entomophaga maimaiga and a federal program called Slow the Spread (STS) have collectively contributed to a decrease in the rate of spread of gypsy moth into Iowa; the insect is not currently established in the state, but there are now five counties (Allamakee, Clayton, Dubuque, Jackson and Clinton) that are within 60 miles of the gypsy moth establishment boundary line, shown in Figure 3.7. Figure 3.7 Distribution of Gypsy Moth in the United States, 2009.
Source: STS, da.ento.vt.edu/results4.html.
132
The number of gypsy moth catches and the number of acres treated for the purpose of gypsy moth eradication in Iowa each year from 1970 to 2008 can be viewed in Table 1 of Appendix G. For more information about gypsy moth and updates on its movement throughout the United States, visit www.aphis.usda.gov/ppq/ispm/gm/.
Current
Gypsy moth trap locations in 2009 were focused within cities, campgrounds, and around nursery operations. Along the Mississippi, traps were placed every 1500 meters to form a line of detection along Iowa’s eastern border; the nine largest cities were also put on a 1500 meter grid.
In 2009 the following agencies were involved with gypsy moth trapping:
Figure 3.8 shows the locations of the gypsy moth catches in Iowa for 2009. Populations have been building in neighboring Adams, Columbia, Dane, Marathon and Sauk counties in Wisconsin over the past couple of years; this, combined with good weather conditions, has allowed for the movement of male gypsy moths into one of Iowa’s most heavily forested areas.
In 2009, Iowa worked with STS to begin trapping in Allamakee, Clayton, Delaware, Dubuque, Jackson, and Clinton counties. Using the STS calculations, 2,500 traps were set up in these counties alone, while an additional 4,000 traps were set up outside the STS zone.
Iowa will be working with STS for a second year in 2010. In addition to the six aforementioned counties, the STS region will now include Winneshiek and Fayette counties. Using the STS calculations, 2,566 traps will be set up in this region, which now includes five delimit sites; approximately 4,000 more traps will be set up throughout the rest of the state.
Male pheromone trapping is currently the most effective way to monitor for the presence of gypsy moth. Considering that 67% of Iowa’s forests are classified as sawtimber, it is important to manage this resource for the upcoming stress this insect will cause. Furthermore, since gypsy moth typically attacks mature trees, and because most of Iowa’s mature trees are oak, establishment of the insect could lead to even greater decline in the state’s population of oak trees.
Considering that 67% of Iowa’s forests are
classified as sawtimber, it is important to manage
this resource for the upcoming stress this
insect will cause.
133
Figure 3.8 Gypsy Moth Traps, 2009.
Source: Mark Hollister.
Bur Oak Blight (Tubakia spp.)Bur Oak Blight has been found on bur oak trees over the past four years in Iowa; it appears in late July or August as discoloration in the leaves, especially along the interveinal tissue. The DNR and Iowa State University are currently working to determine if this disease is causing long-term oak decline in Iowa. A number of sightings have already occurred throughout western and central Iowa, with comparatively fewer sightings in the eastern part of the state.
In an effort to better understand the impact of this disease, permanent monitoring plots were established in 2007 at Loess Hills State Forest, Gull Point State Park and Thomas Mitchell Park. Trees were mapped and rated for severity of infection, digital pictures were taken to show the condition of the trees, and notes were taken about the presence of new leaf flushing.
An example of bur oak leaves infected with Tubakia spp. Photo by Christine Engelbrecht.
134
Leaves from documented trees were then collected, bagged, and taken to the Iowa State University (ISU) Plant Insect Lab for diagnoses. All the samples tested positive for Tubakia spp. and negative for bacterial leaf scorch (which can be confused with Tubakia). Bur Oak Blight generally does not affect a tree’s health unless repeated infection occurs several years in a row, in which case serious decline results from loss of starch reserves.
During the 2009 season, samples from around the state were sent to Dr. Tom Harrington at Iowa State University for genetic analysis. Based on DNA sequence analyses and morphology of cultures, it was determined that the species of Tubakia spp. that is consistently associated with blighted bur oak trees in Iowa is distinct from two other species that have been found in the U.S., both of which are leaf-spot fungi; one is commonly found on red oak and the other was found on an ornamental white oak on
the campus of ISU. The red oak species is probably one that is commonly reported in eastern North America.
The Tubakia species associated with bur oak blight apparently moves into twigs and branches as an endophyte and, by doing so, can probably overwinter in its host. This might explain how the leaf symptoms tend to be uniform across affected branches and often uniform throughout the entire crown in the most seriously affected trees; trees seriously affected one year tend to be severely affected the next year, and leaves of affected trees may be colonized by the fungus even before leaf symptoms appear in late July.
These bur oak trees show different levels of Tubakia de-cline; the tree on the right is healthy, the tree on the left is infected, and the tree in the top left corner is dead. Photo by Aron Flickinger.
Bur oak leaves with a new flush at the end of August. Photo by Aron Flickinger.
135
Further research is needed to understand this fungal blight and its current distribution. According to Dr. Harrington, the species of Tubakia spp. that causes bur oak blight was confirmed on post oak in Missouri in 2008. In Iowa, about 33 million bur oak trees, which make up 7% of the state’s forest, are at risk to this disease; Figure 3.9 shows counties in Iowa where bur oak blight was found in 2008 and 2009.
Figure 3.9 Confirmed Cases of Bur Oak Blight.
Source: Kathryne Clark using ISU Plant and Insect Diagnostic Clinic data.
Tatters Study in IowaLeaf tatters causes a reduction in interveinal leaf tissue in newly emerged oak leaves as they grow larger, which makes them look deformed or “tattered”; the first sign is curling of the young succulent white oak leaves. Not all trees develop tatters, as leaves must be exposed to certain conditions after they have emerged from their buds and may escape tatters if they have grown a certain amount; however, oak trees of all ages growing in both urban and rural areas are susceptible to damage. Leaf tatters was first reported in Iowa, Indiana, and Ohio in the 1980’s and in Wisconsin and Minnesota more recently.
The current theory is that oak tatters is caused by the transfer of farm chemicals from crops to trees; so far, foresters have not found any links to insects or other diseases. It appears that acetochlor, a herbicide used to control weeds, volatilizes after being applied on agricultural fields, and it is possible that these vapors are then blown into nearby trees and forested areas; another possibility is that wind could be carrying acetochlor-covered soil particles into these areas. These are good theories because they account for occurrences of tatters on edge and interior forests rather than
136
just edge forests, and because they explain how tatters affects all sides of a tree rather than just some parts. Trees that do not experience tatters one year may develop them the following year, while trees that experience tatters one year may not the next. Though a tree’s susceptibility to tatters may vary from year to year, one thing is certain: exposure to tatters for many successive years can lead to serious decline or mortality.
On April 27, 2006, five tree pollination bags were placed over several branches of a white oak tree that had shown leaf tatters in the past year at White Pine Hollow in Dubuque County; normal emergence of white oak leaves was noted during this time. The photos to the right show findings from a visit to the same site on May 2nd, only five days later. The leaves that were protected by the pollination bags displayed no signs of tatters and looked normal; those that weren’t protected, conversely, displayed curling indicative of early-stage oak tatters. Iowa DNR foresters have been investigating the incident ever since it occurred; one theory is that the sudden outbreak of tatters was caused by chemical spraying, as much farming activity was observed in the county at the time of these visits.
From April 10 to May 18 of 2006, air, rainwater and leaf tissue samples were collected from White Pine Hollow and analyzed at the University of Iowa Hygienic Laboratory. It was discovered that air concentrations of acetochlor nearly quadrupled during this time, from 15 nanograms per cubic meter (ng/m^3) to 55 ng/m^3. Rainwater concentrations went from almost nothing on April 10th to more than 9.5 ng/ml on May 2nd, followed by a dramatic decrease by May 18th. Concentrations were 5 ng/g or less for leaves protected by pollination bags, while unprotected leaves had levels 3 to 10 times greater. These elevated levels of acetochlor are likely associated with the occurrence of tatters at the site (it is worth noting that neither frost nor freezing temperatures, both of which are capable of causing leaf damage similar to that of tatters, occurred during this time).
In addition, the DNR and ISU collaborated in 2008 for a study to determine which chemicals could be causing oak tatters in Iowa. Each of the following six treatments was applied to 120 white oak seedlings: 300 grams(g) (1/10 application rate), 30 g (1/100), and 3 g (1/1000) of acetochlor; 5 parts per million (ppm) of chlorine; 2-4 D (another farm chemical known to volatilize and damage leaves); and water, the control treatment.
White oak leaves protected from pollination bags; the rest of the leaves on the trees showed tatters. Photos by Aron Flickinger.
137
As expected, the water treatment did not have any visual effects. The chlorine treatment caused the leaves to turn purple for about two weeks and then back to green shortly thereafter. The 2-4D completely killed the leaf material on the trees that were treated at bud break, and discolored and cupped the leaves that were expanding; within a month, however, these trees began to re-flush with new growth, and they no longer showed signs of damage. Finally, all trees treated with acetochlor showed damage, including those treated with the relatively minute 1/1000 application rate.
Tatters from 1/10th application rate Acetochlor. Tatters from 1/10th Acetochlor application rate at bud break.
Tatters from 1/10th Acetochlor application rate; leaf tissue separating out and gone within two weeks of treatment.
Cupping and discoloration of leaves prior to tattering treated with Acetochlor rate of 1/100th; Leaves treated at bud break.
138
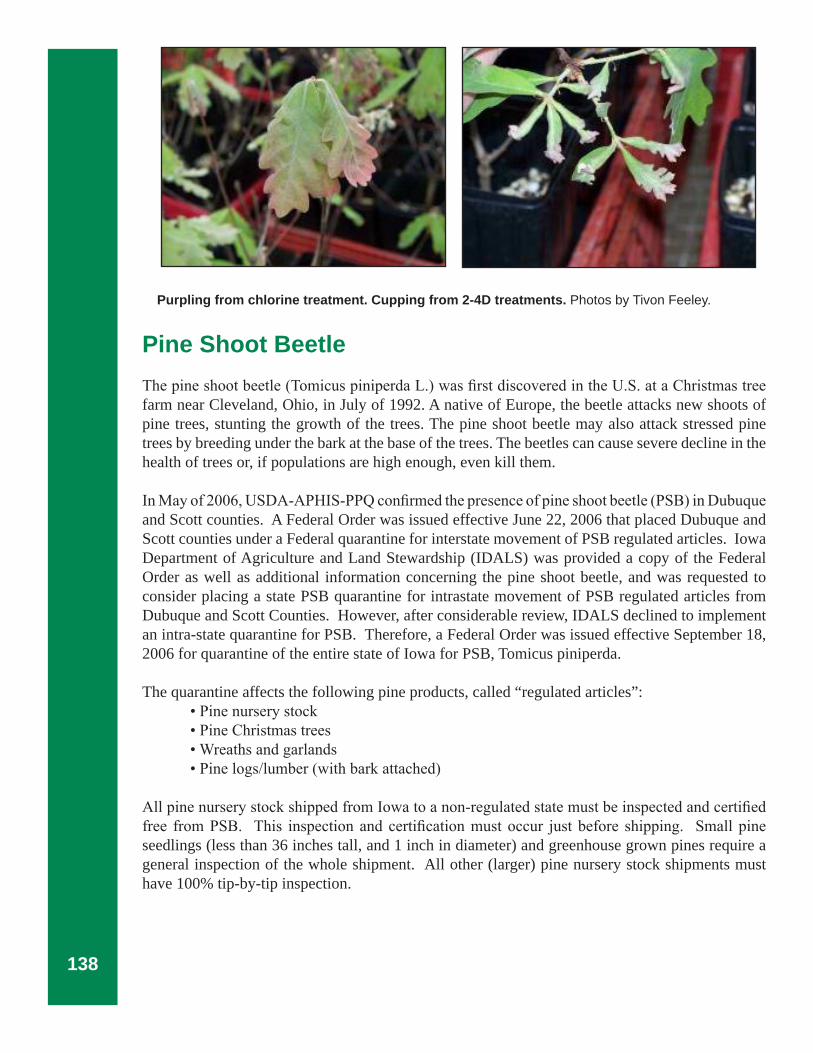
Purpling from chlorine treatment. Cupping from 2-4D treatments. Photos by Tivon Feeley.
Pine Shoot BeetleThe pine shoot beetle (Tomicus piniperda L.) was first discovered in the U.S. at a Christmas tree farm near Cleveland, Ohio, in July of 1992. A native of Europe, the beetle attacks new shoots of pine trees, stunting the growth of the trees. The pine shoot beetle may also attack stressed pine trees by breeding under the bark at the base of the trees. The beetles can cause severe decline in the health of trees or, if populations are high enough, even kill them.
In May of 2006, USDA-APHIS-PPQ confirmed the presence of pine shoot beetle (PSB) in Dubuque and Scott counties. A Federal Order was issued effective June 22, 2006 that placed Dubuque and Scott counties under a Federal quarantine for interstate movement of PSB regulated articles. Iowa Department of Agriculture and Land Stewardship (IDALS) was provided a copy of the Federal Order as well as additional information concerning the pine shoot beetle, and was requested to consider placing a state PSB quarantine for intrastate movement of PSB regulated articles from Dubuque and Scott Counties. However, after considerable review, IDALS declined to implement an intra-state quarantine for PSB. Therefore, a Federal Order was issued effective September 18, 2006 for quarantine of the entire state of Iowa for PSB, Tomicus piniperda.
The quarantine affects the following pine products, called “regulated articles”: • Pine nursery stock • Pine Christmas trees • Wreaths and garlands • Pine logs/lumber (with bark attached)
All pine nursery stock shipped from Iowa to a non-regulated state must be inspected and certified free from PSB. This inspection and certification must occur just before shipping. Small pine seedlings (less than 36 inches tall, and 1 inch in diameter) and greenhouse grown pines require a general inspection of the whole shipment. All other (larger) pine nursery stock shipments must have 100% tip-by-tip inspection.
Hickory MortalityFungal isolates obtained from cankered stems of bitternut hickory trees sampled in Iowa during 2008 survey were identified. All Ceratocystis isolates obtained in 2007 and 2008 surveys were found to be C. smalleyi based on morphological characteristics and DNA sequences (ITS and TEF gene regions). All Fusarium isolates obtained were identified as F. solani, though two types were found (black walnut canker and birch bark types) based on DNA sequences (TEF gene region). C. smalleyi, F. solani and Phomposis sp. isolates obtained during the survey were summarized by state on a poster presented at the 2009 meeting of the American Phytopathological Society. These findings represent the first report of C. smalleyi and associated cankers in Iowa, Indiana, Minnesota, New York and Ohio. Two additional field evaluations (transect surveys) were completed in Iowa and Wisconsin in July of 2009. Disease incidence and severity data were collected.
Multiple year monitoring plots were established in two eastern Wisconsin locations and three Iowa locations during the summer of 2009. Six to eight apparently healthy bitternut hickories were selected for each plot, and plots were chosen based on their proximity to stands with advanced hickory decline and mortality. Data on tree size, tree crown condition, stem damage and other stand characteristics were collected for each plot in August of 2009. Plots will be visited two times per growing season from 2010 to 2012 in order to assess the rate at which hickories become affected and the decline of individual trees progresses, and whether mortality results.
Restrictions are imposed on the movement of the regulated articles fromthe quarantined (red shaded) areas into or through the unshaded areas.
Consult your State or Federal plant protection inspector or yourcounty agent for assistance regarding exact areas under regulationand requirements for moving regulated articles. For detailedinformation, see 7 CFR 301.50 for quarantine and regulations.
Quarantine Area
140
The study fulfilled Koch’s Postulates demonstrating that C. smalleyi is the cause of diffuse cankers with reddish inner bark and sapwood on pole-timber size bitternut hickory. Ji-Hyun Park, a Ph.D. student at the University of Minnesota who is working on the project, is currently preparing a Disease Note for publication on this work.
Evaluations were made of pole-timber size bitternut hickory inoculated in July 2008 at 5 and 50 points on the main stem with ascospores of C. smalleyi. The objective was to determine the relationship between Ceratocystis cankers and crown decline. No evidence of crown decline was observed fourteen months later; however, elongate diffuse cankers with reddish inner bark and outer sapwood were common. Effect of the 50 point inoculations on sap flow in the treated trees compared to water inoculated and negative control trees was the subject of two week field monitoring efforts in mid-September. Data are currently being summarized and analyzed.
An ongoing anatomical study is examining vessel occlusion by metabolic substances and occurrence of tyloses in response to fungus infection. Presence of the fungus in the sapwood associated with the infection sites has been documented.
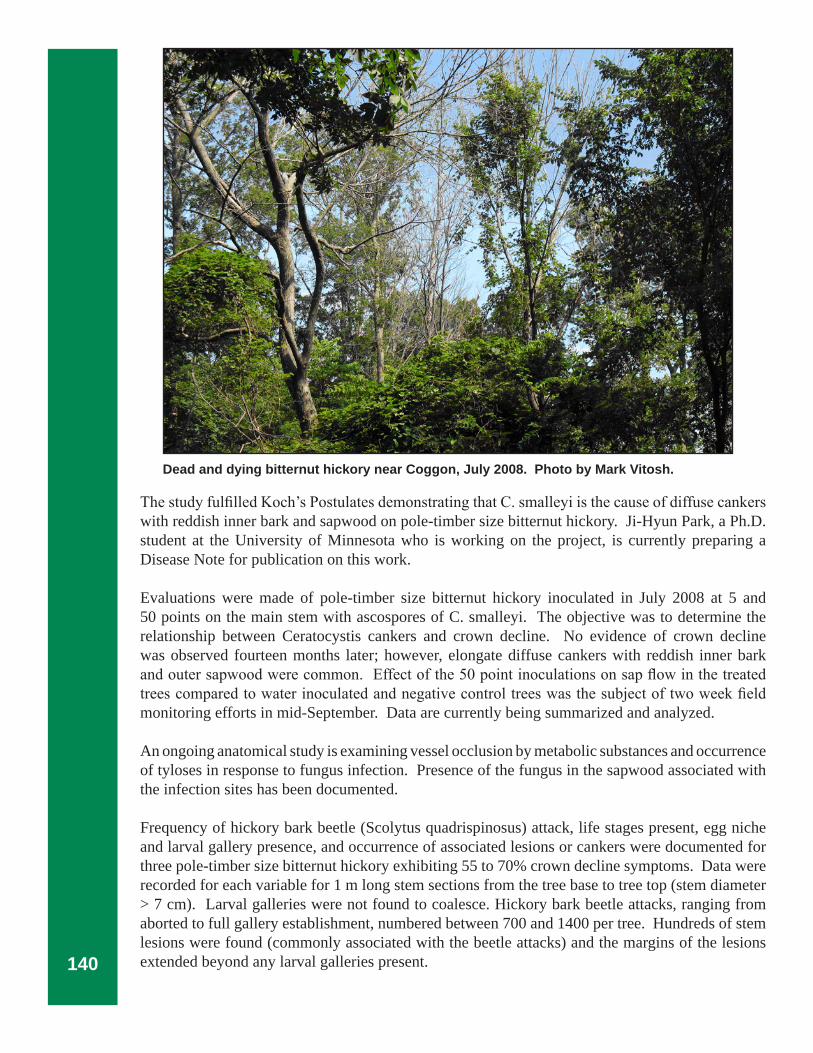
Frequency of hickory bark beetle (Scolytus quadrispinosus) attack, life stages present, egg niche and larval gallery presence, and occurrence of associated lesions or cankers were documented for three pole-timber size bitternut hickory exhibiting 55 to 70% crown decline symptoms. Data were recorded for each variable for 1 m long stem sections from the tree base to tree top (stem diameter > 7 cm). Larval galleries were not found to coalesce. Hickory bark beetle attacks, ranging from aborted to full gallery establishment, numbered between 700 and 1400 per tree. Hundreds of stem lesions were found (commonly associated with the beetle attacks) and the margins of the lesions extended beyond any larval galleries present.
Dead and dying bitternut hickory near Coggon, July 2008. Photo by Mark Vitosh.
141
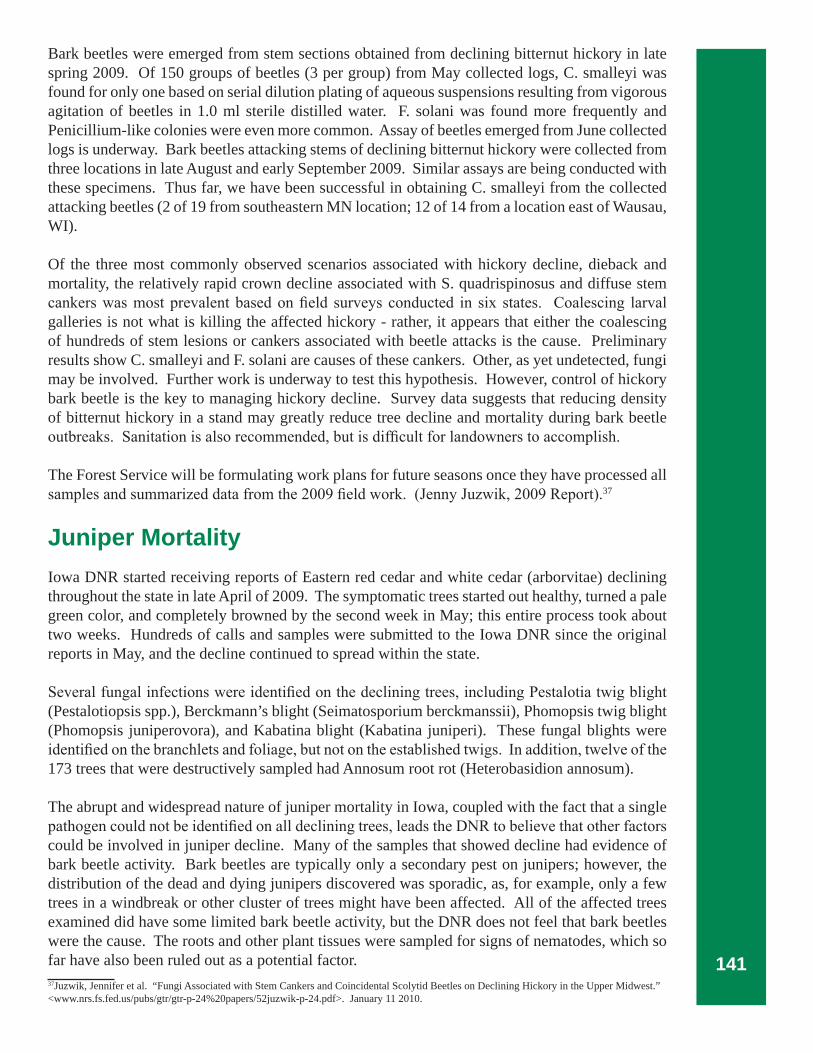
Bark beetles were emerged from stem sections obtained from declining bitternut hickory in late spring 2009. Of 150 groups of beetles (3 per group) from May collected logs, C. smalleyi was found for only one based on serial dilution plating of aqueous suspensions resulting from vigorous agitation of beetles in 1.0 ml sterile distilled water. F. solani was found more frequently and Penicillium-like colonies were even more common. Assay of beetles emerged from June collected logs is underway. Bark beetles attacking stems of declining bitternut hickory were collected from three locations in late August and early September 2009. Similar assays are being conducted with these specimens. Thus far, we have been successful in obtaining C. smalleyi from the collected attacking beetles (2 of 19 from southeastern MN location; 12 of 14 from a location east of Wausau, WI).
Of the three most commonly observed scenarios associated with hickory decline, dieback and mortality, the relatively rapid crown decline associated with S. quadrispinosus and diffuse stem cankers was most prevalent based on field surveys conducted in six states. Coalescing larval galleries is not what is killing the affected hickory - rather, it appears that either the coalescing of hundreds of stem lesions or cankers associated with beetle attacks is the cause. Preliminary results show C. smalleyi and F. solani are causes of these cankers. Other, as yet undetected, fungi may be involved. Further work is underway to test this hypothesis. However, control of hickory bark beetle is the key to managing hickory decline. Survey data suggests that reducing density of bitternut hickory in a stand may greatly reduce tree decline and mortality during bark beetle outbreaks. Sanitation is also recommended, but is difficult for landowners to accomplish.
The Forest Service will be formulating work plans for future seasons once they have processed all samples and summarized data from the 2009 field work. (Jenny Juzwik, 2009 Report).37
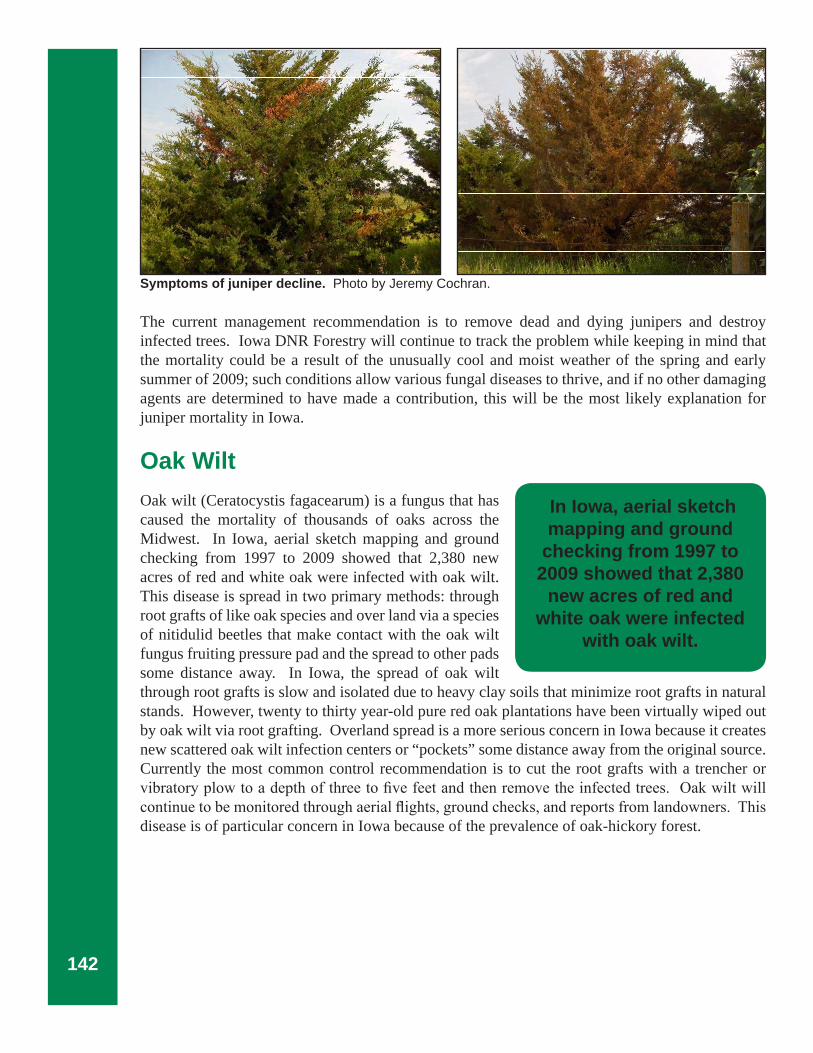
Juniper MortalityIowa DNR started receiving reports of Eastern red cedar and white cedar (arborvitae) declining throughout the state in late April of 2009. The symptomatic trees started out healthy, turned a pale green color, and completely browned by the second week in May; this entire process took about two weeks. Hundreds of calls and samples were submitted to the Iowa DNR since the original reports in May, and the decline continued to spread within the state.
Several fungal infections were identified on the declining trees, including Pestalotia twig blight (Pestalotiopsis spp.), Berckmann’s blight (Seimatosporium berckmanssii), Phomopsis twig blight (Phomopsis juniperovora), and Kabatina blight (Kabatina juniperi). These fungal blights were identified on the branchlets and foliage, but not on the established twigs. In addition, twelve of the 173 trees that were destructively sampled had Annosum root rot (Heterobasidion annosum).
The abrupt and widespread nature of juniper mortality in Iowa, coupled with the fact that a single pathogen could not be identified on all declining trees, leads the DNR to believe that other factors could be involved in juniper decline. Many of the samples that showed decline had evidence of bark beetle activity. Bark beetles are typically only a secondary pest on junipers; however, the distribution of the dead and dying junipers discovered was sporadic, as, for example, only a few trees in a windbreak or other cluster of trees might have been affected. All of the affected trees examined did have some limited bark beetle activity, but the DNR does not feel that bark beetles were the cause. The roots and other plant tissues were sampled for signs of nematodes, which so far have also been ruled out as a potential factor.37Juzwik, Jennifer et al. “Fungi Associated with Stem Cankers and Coincidental Scolytid Beetles on Declining Hickory in the Upper Midwest.” <www.nrs.fs.fed.us/pubs/gtr/gtr-p-24%20papers/52juzwik-p-24.pdf>. January 11 2010.
142
The current management recommendation is to remove dead and dying junipers and destroy infected trees. Iowa DNR Forestry will continue to track the problem while keeping in mind that the mortality could be a result of the unusually cool and moist weather of the spring and early summer of 2009; such conditions allow various fungal diseases to thrive, and if no other damaging agents are determined to have made a contribution, this will be the most likely explanation for juniper mortality in Iowa.
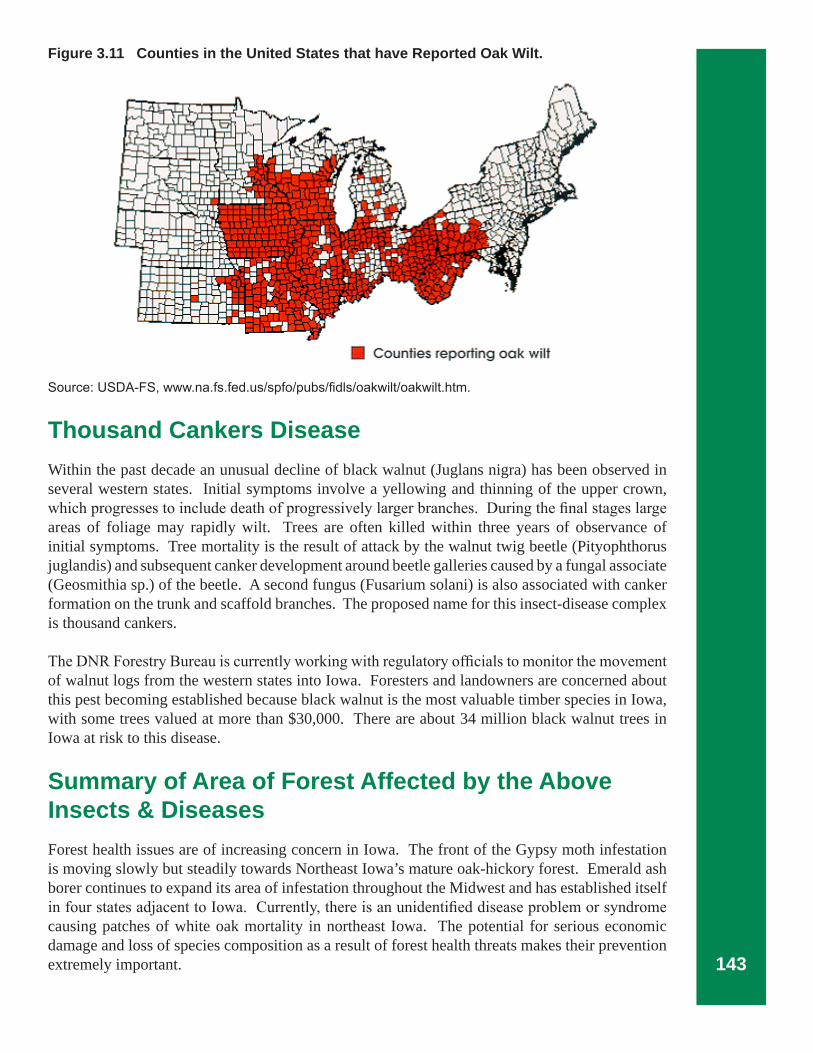
Oak WiltOak wilt (Ceratocystis fagacearum) is a fungus that has caused the mortality of thousands of oaks across the Midwest. In Iowa, aerial sketch mapping and ground checking from 1997 to 2009 showed that 2,380 new acres of red and white oak were infected with oak wilt. This disease is spread in two primary methods: through root grafts of like oak species and over land via a species of nitidulid beetles that make contact with the oak wilt fungus fruiting pressure pad and the spread to other pads some distance away. In Iowa, the spread of oak wilt through root grafts is slow and isolated due to heavy clay soils that minimize root grafts in natural stands. However, twenty to thirty year-old pure red oak plantations have been virtually wiped out by oak wilt via root grafting. Overland spread is a more serious concern in Iowa because it creates new scattered oak wilt infection centers or “pockets” some distance away from the original source. Currently the most common control recommendation is to cut the root grafts with a trencher or vibratory plow to a depth of three to five feet and then remove the infected trees. Oak wilt will continue to be monitored through aerial flights, ground checks, and reports from landowners. This disease is of particular concern in Iowa because of the prevalence of oak-hickory forest.
Symptoms of juniper decline. Photo by Jeremy Cochran.
In Iowa, aerial sketch mapping and ground
checking from 1997 to 2009 showed that 2,380
new acres of red and white oak were infected
with oak wilt.
143
Figure 3.11 Counties in the United States that have Reported Oak Wilt.
Thousand Cankers DiseaseWithin the past decade an unusual decline of black walnut (Juglans nigra) has been observed in several western states. Initial symptoms involve a yellowing and thinning of the upper crown, which progresses to include death of progressively larger branches. During the final stages large areas of foliage may rapidly wilt. Trees are often killed within three years of observance of initial symptoms. Tree mortality is the result of attack by the walnut twig beetle (Pityophthorus juglandis) and subsequent canker development around beetle galleries caused by a fungal associate (Geosmithia sp.) of the beetle. A second fungus (Fusarium solani) is also associated with canker formation on the trunk and scaffold branches. The proposed name for this insect-disease complex is thousand cankers.
The DNR Forestry Bureau is currently working with regulatory officials to monitor the movement of walnut logs from the western states into Iowa. Foresters and landowners are concerned about this pest becoming established because black walnut is the most valuable timber species in Iowa, with some trees valued at more than $30,000. There are about 34 million black walnut trees in Iowa at risk to this disease.
Summary of Area of Forest Affected by the Above Insects & DiseasesForest health issues are of increasing concern in Iowa. The front of the Gypsy moth infestation is moving slowly but steadily towards Northeast Iowa’s mature oak-hickory forest. Emerald ash borer continues to expand its area of infestation throughout the Midwest and has established itself in four states adjacent to Iowa. Currently, there is an unidentified disease problem or syndrome causing patches of white oak mortality in northeast Iowa. The potential for serious economic damage and loss of species composition as a result of forest health threats makes their prevention extremely important.
144
Iowa lacks the inventory data necessary to determine the risk of insect and disease problems for different communities; however, the DNR Forestry Bureau estimates that an average Iowa community’s tree stock is comprised of 20% ash and 50% maple, and that therefore most communities are probably at risk for insect and disease problems. Promoting diversity within communities and in forested areas is another way to improve forest health, as diversity can keep harmful levels of diseases and insects from building up and destroying particular species. The best long-term strategy for communities is to ensure that no more than 10% of their forest resources be made up of any one particular species.
Forest health surveys help to monitor where various insects and diseases are affecting the state’s forest resources. Field days, workshops and publications are important and effective ways to keep forest landowners and urban homeowners aware of the steps they can take to keep their trees healthy; proper management is crucial as well. When it comes to managing their woodland, the two best tools that a landowner can possess are diverse woodlands and a goal-oriented management plan. Because such a significant portion of Iowa’s forests are in the large size class category, it is crucial that landowners be educated about how to keep these mature, large trees healthy. Silvicultural practices like thinning can reduce basal area in these forests, which can in turn improve their health.
Ozone Pollution Ozone pollution occurs when ground level ozone concentrations increase to phytotoxic levels. Elevated levels of ozone are a concern to foresters for several reasons: they can cause foliar injury to several tree species, they may cause growth loss and they can make trees more susceptible to insects and diseases. Ash and black cherry would be the first Iowa species to show damage, while shrubs like plum and blackberry are also sensitive. There are currently seven permanent bio-sites that are annually monitored by DNR Forestry staff for ozone in Iowa.
3.2 Invasive Plant SpeciesInvasive species described in this section are plants that are non-native to an ecosystem and cause or are likely to cause economic or environmental harm to humans, crops, livestock or natural plant and animal communities. Some examples of non-native species found to be a problem in Iowa forests are buckthorn, garlic mustard, honeysuckle, oriental bittersweet and multiflora rose. These invasive and exotic plants out-compete native forest species, diminish fisheries and wildlife habitat, reduce water quality, reduce economic returns from forest management and tourism and threaten long-term forest sustainability and biodiversity. A list of invasive plants known to exist in Iowa is provided in Table 2 of Appendix G.
Invasive species are displacing native vegetation throughout Iowa’s forests and reducing the biological diversity of the woodlands they invade. These non-native plants have several advantages over competing native plants, including prolific seed production, shade tolerance, earlier production of leaves in the spring and maintenance of leaves longer in the fall. All of these traits give invasive plants a competitive advantage over native tree seedlings and native understory plants, which leads to a reduction in both plant diversity and availability of suitable habitat for a variety of wildlife species.
District foresters have recently begun recording invasive plants in databases after visiting private
145
landowners as part of stewardship plans. Figure 3.12 shows the list of invasive plants that are being observed during landowner site visits, with the darker color coding showing where more occurrences have been reported as a result of these visits. The map shows that the most invasive plants are being observed in the eastern half of Iowa. Although this is not a systematic survey, it is the best available information at the county level.
Figure 3.12 Invasive Species Reported by District Foresters in Stewardship Plans.
Source: Kathryne Clark using data collected from forest stewardship plans through 2009.
Garlic mustard is considered a severe threat because it out-competes native plants by aggressively monopolizing light, moisture, nutrients, soil and space. White-tailed deer facilitate its invasion by feeding on native plant species and avoiding it. Garlic mustard roots produce toxins that prevent the establishment of other plant species, including oak trees. Amur honeysuckle rapidly invades and overtakes a site by forming a dense shrub layer that crowds and shades out native plant species. Oriental bittersweet is an aggressive invader that threatens all vegetation levels of a forest. It grows over other vegetation, completely covering it and killing it through prevention of photosynthesis, girdling and forceful uprooting. The non-native variety appears to be displacing the native climbing bittersweet.
In the future, Iowa forests will be impacted by invasive species that are already establishing themselves in the state’s woodland understory or that are established in neighboring states. Efforts to provide landowners with cost-effective solutions to these problems continue; however, significantly more energy and resources need to be directed to solving these problems before irreparable damage is done to Iowa’s woodlands. No longer will passive management allow for
146
woodlands to be “preserved” in the condition they are in today. Educating forest landowners about their woodlands and how each component affects another will make it easier for Iowa’s woodlands to be managed for adequate long-term health. Through utilization of focused Stewardship funding, EQIP, WHIP and REAP efforts are under way to improve the health of Iowa’s forests.
Animal Depredation
White-tailed deer (Odocoileus virginianus)
Where deer populations are high, deer browsing can impact plant species composition and community structure. Deer browsing has a profound impact on the establishment of regeneration, the density of hardwood seedlings and the presence of understory plants. Ironically, their impact is reducing biodiversity and hurting Iowa’s largest forest type, the oak-hickory, the very habitat they depend on in the fall and winter for food and shelter. Deer also impact vegetation by moving parasites and invasive plant seeds, through bedding and by rubbing their antlers on trees. In the winter they seek shelter in forests, while during the growing season they feed on the herbaceous portion of woody plants under the shade of trees.
Species that fall victim to browsing are unable to regenerate, while those that aren’t browsed on, including invasive plants such as garlic mustard, continue to thrive.
Deer damage to a young conifer planting. Photo by Bruce Blair.
Tree shelters are becoming more common in tree plantings because of high concentrations of deer. Photo by Cathy Marcotte.
147
Over time, this selective browsing can lead to a reduction in forest biodiversity, which can then lead to a change in habitat. Reductions in understory plants, for example, can lead to declines in insect activities, including those of pollinators. Browsing activity also affects moisture at the forest floor and the vertical structure within the forest. Soil moisture and humidity decline as more light is able to reach the ground and heat up the area.
Rabbits and mice can do damage to new tree plantings. Unfortunately, they seem to show a preference for oak species, particularly white oaks. Rabbits eat the terminal leaders of seedlings during the winter, and their preference for oaks causes them to fall behind the growth of other tree species in plantings. Mice girdle seedlings during the winter, and their preference for oaks also causes these trees to fall behind the growth of other species.
Lack of understory layer may be evidence of an overpopulation of deer in this woodland. Photo by Bruce Blair.
Deer coming out of the woods to browse. Photo by Bruce Blair.
Tree shelters may be necessary for establishing seedlings in some parts of the state, but they provide new habitat for mice as well. Photo by Bruce Blair.
148
Open and forested-area ash tree shelters. Photo by Cathy Marcotte.
Forest Tree Mortality Trees can die from insects, diseases, weather (lightning, wind), physical damage, climate change and old age. The Forest Service monitors for mortality to compare how much volume of wood is being lost from forests due to forest health issues versus harvesting. This allows for independently monitoring changes to Iowa’s forest resource. The remaining portion of this section will focus on mortality, not harvesting.
As Iowa’s trees have matured the amount of mortality has steadily increased between 1955 and 2003. Figure 3.13 below shows the mortality trend through time. Reviewing the inventory data from 2008 shows a continued increase to over 36 million cubic feet.38
Mortality is expected to continue to climb in the future for many reasons. Iowa’s forests are within 60 miles of established gypsy moth colonies in Wisconsin and 90 miles from where emerald ash borer has been found in Illinois. Flooding during the 2008 season will cause a decline for riparian species throughout the next 10 years. With most of Iowa’s forest in the large size class, more of the forest is approaching the age where these trees are more vulnerable to a wide variety of insect and disease problems.
38Miles.
149
Figure 3.13 Average Annual Mortality of Iowa Trees, 1954 to 2003.
Source: Leatherberry et al.
Figure 3.14 shows the ten species that have experienced the greatest mortality. Comparing the growth to the mortality for each species growing in Iowa, only American elm, slippery elm and butternut are growing less volume in 2008 because of their higher mortality rates. Other species listed in the top ten include northern red oak, bur oak and white oak.
The high mortality for American elm is due to this being the most common tree in Iowa forests and the prevalence of Dutch elm disease since the 1950’s. Butternut is dying from butternut canker that has been present in Iowa forests since the 1970’s. The oak mortality is mostly a result of oak wilt or oak decline- a complex of problems that come together as oak trees get older under the right environmental stresses. Upland species are stressed more during drought situations similar to the late 1980’s in Iowa. Bottomland species like silver maple, cottonwood and black willow can be stressed and weakened by exposure to high water tables and prolonged standing water during the growing season.
Figure 3.14 Average Annual Mortality by Tree Species, 2008.
Source: Miles, P.D.
0
5
10
15
20
25
30
1954 to 1973 1973 to 1990 1990 to 1999-2003
Inventory period
Morta
lity (
thou
sand
cubi
c fee
t)
2008 Average Annual Mortality by Tree Species
0
2,000,000
4,000,000
6,000,000
8,000,000
10,000,000
12,000,000
bitternu
t hick
ory
America
n bas
swood
bur o
ak
silve
r map
le
white oa
k
north
ern re
d oak
easte
rn co
ttonwoo
d
slippe
ry elm
black
willo
w
America
n elm
Top Ten Species
Volu
me
(cuf
t/ yr
)
Series1
150
All trees in Iowa are at risk to insect and disease problems. Prioritizing which insects and diseases are impacting various tree species changes from year-to-year. Creating a priority map for this issue is really just taking a snapshot in time.
Figure 3.15 uses USDA-FS-FIA data to show where the highest levels of tree mortality were recorded for Iowa in 2008.
Figure 3.15 Forest Areas with the Highest Levels of Mortality.
Source: Kathryne Clark using 2008 FIA data.
3.3 FireLow-intensity, vegetation-renewing fires occurred over large areas of land in Iowa every one to five years prior to statehood. These fires moved rapidly across the land without penetrating into the soil very far; they killed most tree seedlings and removed the thatch of dead leaves, allowing early flowering spring wildflowers to grow. Oak and hickory are among the trees that evolved along with wildfire; their thick bark enabled them to withstand heat and flames and their underground storage structures allowed them to re-sprout vigorously as seedlings if burned off, which in turn allowed them to become large enough to withstand future fires.
As European settlers arrived during the latter half of the nineteenth century, Iowa’s landscape became altered as a result of agriculture and domestic livestock grazing, road creation and emergence of other firebreaks. By the turn of the 20th century, Iowa had lost over 95% of the native prairie and over 70% of the native forests, as land was cleared, drained and put into row crop production. The removal of fire from the ecosystem allowed plants and trees that were not able to survive the presence of fire to increase their populations. As a result, Iowa’s forest composition has changed dramatically (see Chapter 2).
Historically, most fires were started by Native Americans, which influenced and even renewed forest ecosystems. However, decades of wildfire suppression have created conditions ripe for destructive
151
wildfires on forests and grasslands. Over 90% of forest land in Iowa is privately owned, leaving only 9% in public ownership; furthermore, 450,000 acres of public land are in permanent grass or woodland vegetation. Between 1985 and 2008, millions of acres of permanent vegetation were added to the Iowa landscape with incentives from the Conservation Reserve Program (CRP). As of January 2010, Iowa had 1.6 million acres of land in CRP, with most of the vegetation in the form of cool and warm season grasses.39 These areas are not typically burned, which allows dead thatch to build up for years on end, which leads to high risk for destructive wildfire.
Additionally, there are over 100,000 acres in federal properties owned by the U.S. Fish and Wildlife Service, U.S. Army Corps of Engineers and Department of Defense. Over 130,000 acres are in conservation easements in the Wetland Reserve Program and Emergency Wetlands Reserve Program. These federal lands and easements are mostly forested or grass ecosystems. Iowa also has over 12 million acres of corn planted annually, which can be a fire hazard under hot and dry condition in the fall.40 With fire suppression over the last 160 years, the amount of large woody debris has increased on forest lands, allowing fires that go through these areas to burn longer and more intensively. Overall, there is approximately 24 million acres of flammable fuels that can burn throughout the state during any given year.
Figure 3.16 below shows wildfire risk in Iowa at the county level. Rankings were determined by reviewing State Fire Marshall data regarding wildfire occurrences between 1994 and 1999. Information about natural vegetation, like cool and warm season grasses and oak litter, and land coverage was utilized to help predict future risks. Iowa wildfire fuel conditions are often dry enough with seasonal winds and contiguous enough in the Moderate and High categories to require burning bans by the State Fire Marshall’s office during the Iowa fire season.
Figure 3.16 Iowa Wildfire Risk Based on Historical Data.
Source: Kathryne Clark using State Fire Marshall Office data.
39<http://content.fsa.usda.gov/crpstorpt/rmepegg/MEPEGGR1.HTM>. March 5 2010.40<http://extension.agron.iastate.edu/soils/PDFs/acretrends.pdf>. March 5 2010.
152
The Forestry Bureau of the Iowa Department of Natural Resources, per 456A.24 (9) of the Code of Iowa, is responsible to:
“Provide for the protection against fire and other destructive agencies on state and privately owned forests, parks, wildlife areas and other property under its jurisdiction, and cooperate with federal and other state agencies in protection programs approved by the department, and the consent of the owner, on private owned areas.”
The Iowa DNR Forestry Bureau, in cooperation with the USDA Forest Service and other federal, state and local partners, work to provide assistance to rural volunteer fire departments through a variety of programs and activities in an effort to provide quality fire protection across the state. The state fire assistance program works to protect natural resources from fire on state and private lands through fire prevention and suppression, fuels management education, training and outreach opportunities.
Iowa’s natural areas contain sizable amounts of flammable grasses and leaf materials. Prescribed fire has been promoted as one effective management tool in Iowa for ecological restoration, vegetation management and fuels reduction by federal, state and local agencies.
Prescribed FireIowa’s native oak woodlands, savannas and prairies are fire dependent ecosystems, and natural resource managers have developed a renewed interest in utilizing prescribed fire to maintain, enhance and restore these systems in recent years. The limited number of trained and National Wildfire Coordinating Group (NWCG) qualified fire fighters, squad bosses, burn bosses and fire crews have severely hampered efforts to expand the use of prescribed fire as a management tool. Equally concerning is the poor technique, lack of awareness and lack of training provided to the volunteer firefighters in prescribed and wildland fire suppression. Proper wildland fire training is a prerequisite to the implementation of prescribed fire. Restoration of fire adapted ecosystems, such as savanna and oak woodlands, and invasive species suppression can only occur with the expanded use of prescribed fire as a silvicultural tool. Most landowners do not possess the education and training necessary to safely perform prescribed burns independently.
Opportunities for prescribed fire applications are limited by three factors: a small weather “window”, a limited number of certified and qualified burn bosses and crews and long distances between areas for application. The “window” of weather for safe burning conditions in Iowa is limited to approximately 16 days between winter and spring and 16 days between fall and winter. What’s more, weather conditions are often difficult to predict and can vary across the state; prescribed fire crews often drive long distances to implement practices only to find weather or fuel conditions unacceptable for prescribed fire application.
Burning woodland to promote oak-hickory for-est and suppress invasive plants. Photo by Bruce Blair.
153
Beneficial prescribed fire data is not easily obtainable because reporting is voluntary. Figure 3.17 shows the number of reported fire occurrences and acres burned over the last five years. Bringing prescribed fire back to forests and grasslands is a difficult challenge for many reasons. There are now over 150,000 forest landowners and many more landowners with grass or corn growing on their property, many of whom have built houses close to these flammable fuels. Convincing these landowners that burning is beneficial for their forest or grassland even though it puts their homes at risk to fire exposure is a challenge. As more people come to own smaller stands of forest, it becomes increasingly difficult to keep fires on individual properties from moving into other properties; it can also take more people and equipment to burn smaller areas, since they often lack the natural firebreaks contained in larger areas. Since most of Iowa’s forests have not been burned for over 100 years, there are often large dead debris scattered on the forest floor; this allows fires in these areas to burn hotter and longer, causing more damage to the forest and increased difficulty of containment.
The concept of using prescribed fire as a management and fuel reduction tool in Iowa has been slow to be accepted among private landowners. Obstacles to the expansion of prescribed fire on private lands include a lack of insured and qualified private contractors, limited opportunities during the burning season, lack of awareness by private landowners about the benefits of prescribed fire and a lack of concise prescribed fire training for landowners.
Figure 3.17 Number of Prescribed Fires and Number of Acres Burned 2004-2009. Year Number of Prescribed
Fires ReportedNumber of Acres Reported Burned Using Prescribed Fire
Source: Gail Kantak, Iowa DNR Forestry Bureau Fire Supervisor.
Recently the USDA Natural Resource Conservation Service (NRCS) and the Farm Service Agency (FSA) in Iowa have supported the requirement that prescribed fire be used as a mid-term management practice to improve wildlife habitat on new CRP-contracted cool and warm season grasslands. These areas require either regular mowing or prescribed burning to keep woody vegetation from becoming established and to remain in compliance with FSA/ NRCS rules.
Iowa DNR Forestry is a member of the Big Rivers Forest Fire Management Compact. The compact has helped to expand training opportunities and distribute fire fighting equipment and clothing to state and county natural resource agencies and volunteer fire departments. Through opportunities provided by this compact, approximately 95% of the Bureau’s field staff have taken approved basic fire fighting courses. Other Bureaus within the Division that are tasked with fire-related resource management are also utilizing such training opportunities.
Efforts to provide NWCG wildland fire training through regional and local partnerships have been provided through the Big Rivers Compact, the Loess Hills Alliance and the University of Northern Iowa Integrated Roadside Vegetation Management Program. Local instructors are limited in number and often have other full-time positions, which makes it difficult to offer the highly demanded NWCG courses on a regular basis and in convenient locations across the state.
154
Due to a lack of standard wildland fire training, physical testing and qualification tracking, Iowa is one of the few states in the nation lacking organized wildland fire crews to assist federal agencies and other states with wildfire control issues. Since 2006 the DNR Forestry Bureau has had a dedicated fire training coordinator to offer regular NWCG wildland fire training, to improve safe prescribed fire use and to reduce hazardous fuel situations in Iowa’s wildland-urban interface (WUI). This person is now able to coordinate with local partners to provide training, contract with NWCG qualified instructors to provide training in a variety of wildland fire classes, purchase educational materials for those classes, track the number of participants that receive certification from these classes, encourage reporting of prescribed fire accomplishments, develop a network of in-state NWCG instructors for program expansion and establish an-Iowa based, red-carded wildland fire fighting crew.
The DNR Forestry Bureau fire team has been able to annually provide base-level (100 and 200 level) NWCG Firefighter training and annual refreshers, as well as fitness and endurance testing; it has also maintained a resource list of qualified NWCG agency and volunteer personnel for use on interagency out-of-state assignments and compact activations. The amount of training that has been provided in recent years is summarized in Figure 3.18.
Figure 3.18 Fire Training Figures, 2005-2009. Training Season Number of
Increasing professional opportunities for continuing education involving prescribed fire in the WUI is a goal of the Forestry Bureau, which has expanded the wildland fire and prescribed fire management program through increased awareness, training, coordination and equipment. Training for natural resource managers and volunteer fire department personnel is available through classes like Wildland Fire Operations, Wildland Fire Engine Operations and Tactics and Prescribed Fire. Promotional efforts have involved publications, general seminars, fire discussions with interested partners and Firewise training and awareness opportunities. The DNR Forestry Bureau Fire Program staff have utilized NWCG curriculum for field staff and individuals interested in pursuing red cards. They have also developed a wildfire operations and tactics curriculum specific to volunteer fire department needs and a prescribed fire curriculum specific to natural resource manager needs.
Wildfire is the responsibility of over 850 rural, mainly volunteer fire departments scattered across the state. Volunteer fire fighters in Iowa are decreasing in number, and many lack appropriate wildfire training and equipment to deal with the issues of the wildland urban interface. Concerns also exist about the appropriate use and timing of prescribed fire, because of the issues of smoke management, air quality and maintaining control of the area to be burned. It is estimated that over 90% of wildfires involve grassland, cropland or forested areas, many of which occur within the wildland-urban interface.Figure 3.19 shows areas of the state where communities expanded into existing forest between 1990 and 2000; such growth has contributed to an increase in the wildland-urban interface.
155
Residential homes that are built in rural areas with forest or grass cover are often surrounded by lots of flammable fine fuels. It is a challenge for fire departments in these areas to access property with their equipment and to have enough water resources to control fires. The issue of wildfire in Iowa is receiving a renewed look as residential housing encroaches onto natural areas of grasses and trees. The threat of wildfire to people and personal property is a concern for both fire departments and people living on acreages surrounded by permanent vegetation. Furthermore, lack of awareness of Firewise concepts in road and water source layout as well as other aspects of development increases the risk of wildland fire hazards.
Figure 3.19 Areas of Housing Density Change, 1990-2000.
Source: Kathryne Clark using 9HD0030 housing density change provided by the US Forest Service and satellite land cover from 2002.
The Iowa DNR Forestry Bureau, the U.S. Forest Service and a wide range of other federal, state, and local partners are working to encourage homeowners and communities to be proactive in identifying and mitigating situations that may prevent effective fire protection in the rural and wildland urban interface locations.
During 2001, the Iowa Department of Natural Resources Forestry Bureau led an effort to determine the cities in Iowa most at risk to wildfire. This listing took into consideration availability of fuels, new residential development into natural areas, topography and history of wildfire; furthermore, communities were listed even if only portions of them were considered to be at risk. Many updates have occurred since 2001, giving a total of 31 communities along with 15 townships that have been selected, and they are listed in Figure 3.20.
156
Figure 3.20 Iowa Communities Most at Risk of Wildfire Event.
Community CountyAnkeny PolkBelle Plaine Benton Belmond WrightBoone BooneCalifornia Jct HarrisonCarlisle WarrenChelsea TamaCoralville JohnsonFredonia LouisaHartford WarrenIowa City JohnsonJohnston PolkKnoxville Rural MarionKoszta IowaMadrid BooneMarquette ClaytonMesquakie TamaMesquakie Indian Reservation TamaNorth Liberty JohnsonPella MarionPolk City PolkPrairie City JasperSolon JohnsonSpirit Lake DickinsonSwan MarionSwisher JohnsonTama TamaVandalia LouisaWapello LouisaMarengo IowaDiamond Lake TWP DickinsonSpirit Lake TWP DickinsonCenter Grove TWP DickinsonRichland TWP DickinsonExcellsior TWP DickinsonLakeland TWP DickinsonSuperior TWP DickinsonLost Island TWP Palo AltoHighland TWP Palo AltoRuthven Palo AltoLake TWP ClayFreeman TWP ClaySummitt TWP ClayRiverton TWP ClayJefferson TWP Louisa
Source: USFWS.
157
The Iowa DNR Forestry Bureau has developed Community Wildfire Protection Plans (CWPP) for communities in Linn, Harrison, Johnson, Pottawattamie and Polk counties. These plans provide communities with information about how to reduce their wildfire risk. Figure 3.21 shows communities that have been identified to be at most risk of wildfire events and that would therefore also benefit from CWPPs. Figure 3.21 Iowa Wildland and Urban Interface Risk Map.
Source: Kathryne Clark using Forest Service Fire Program data.
Figure 3.21 shows where there is a mix of housing and natural vegetation, which is referred to as a wildland-urban interface (WUI). The data behind the map tells us there are 84,982 people who live in these areas, which depend primarily on volunteer fire departments for their fire response needs.
PreparednessIowa’s fire department firefighters are the front line of wildfire protection in Iowa. According to the State Fire Marshall’s Office, there are 80,000 firefighters in Iowa; of these, approximately 20% or 16,000 receive some form of monetary compensation and the remaining 80% or 64,000 do not. There are approximately 850 community and rural fire departments in the state; of these, only 35 are career-track, most of which are located in larger cities and suburbs. Each fire department has equipment usable for both structure fires and wildfire, and most of Iowa’s firefighters are trained or have experience in dealing with structure fires. Many Iowa firefighters have experience with wildfire, but few have formal training or equipment. Several State Fire Schools are coordinated by the State Fire Marshall’s Office in cooperation with the Joint Fire Chiefs Council, Iowa State University and
The area classified as wildland-urban
interface represents 262,803 acres in Iowa.
158
community colleges across the state. According to Response 2020, Iowa’s fire departments are beset by the following problems:
• Lack of recruitment and retention of personnel • Lack of daytime coverage • High cost of training and equipment • Increased hazards of responses • Unfunded mandates • Time constraints • Administration demands • Lack of available resources
Through the efforts of the State Fire Marshall’s Office, DNR Forestry Bureau, Iowa Firemen’s Association, Iowa Association of Professional Firefighters and many others, efforts to expand training, funding and equipment for wildfire management and control are underway for Iowa’s fire department firefighters.
All 99 counties in Iowa have County Conservation Boards (CCBs) to manage their park, forest and wildlife areas; employee numbers range from two in Monroe County in southern Iowa to 40 in Polk County, and depend upon populations and the extent to which individual counties value their natural resources. The CCBs have long had interests in the use of prescribed fire as a management tool for prairie and savanna restoration efforts, and many of their employees have wildfire training and management experience.
A fire management plan has been created by a working group to guide fire policy for the state. Iowa’s Wildfire and Prescribed Fire Management Goals:
• To protect public safety and property from wildfires • To provide for firefighter safety through education and training, awareness and access to appropriate equipment • To suppress all unwanted and undesirable wildfires regardless of ignition source protect the public, check fire spread and protect natural, cultural and historic resources • To use prescribed fire where and when appropriate to meet natural resource management objectives • To reduce wildfire hazards around developing areas using examples and education • To facilitate open communications and cooperative efforts with all firefighting agencies and organizations to avoid duplication • To advance overall wildfire management in Iowa • To develop a Iowa Wildfire Action Plan for the DNR and the State of Iowa
Prescribed Fire CouncilIt is important to establish a viable statewide prescribed fire council in Iowa in order to increase professional awareness and networking and to promote safe use of prescribed fire for fuel reduction and ecological restoration in the WUI; such a council is also important because it provides an opportunity for agencies with conflicting agendas, such as those that promote prescribed fire and those in charge of suppressing it, to work together.
159
Many groups and individuals who embrace conservation and environmentalism in Iowa support the use of prescribed fire for ecological restoration of prairie and forests; however, these groups typically fail to recognize or acknowledge the possible health and safety impacts of fire on WUIs. Volunteer fire departments, county emergency management directors and elected local officials are often suspicious of prescribed fire use because of such concerns; these agencies have the authority to issue county burn bans even when prescribed fire can reduce wildland fire hazards. Developing a positive, long-term relationship between structural fire services and conservation organizations will benefit agencies that suppress fire as well as groups who support the use of prescribed fire in natural areas. Utilizing traditional Firewise concepts in Iowa is difficult because of the fragmentation of continuous fuels due to agriculture. Incidents of wildland fire or escaped prescribed fire are increasing as more and more of the remaining natural landscape is being developed into acreages with homes.
Rural Fire Departments in Iowa must be prepared to deliver fire suppression to areas that are beyond the reach of municipal water systems. The lack of available water resources for use against wildfires or escaped prescribed fire is a problem for rural fire departments across the state. When hauling large volumes of water to remote locations in tankers is not feasible, dry hydrants that have been established in existing water sources can be used to reduce the hauling distance for tanker trucks to fires.
Fire Assistance ProgramsThe goal of the rural fire program, through the cooperative State Fire Assistance (SFA) and Volunteer Fire Assistance (VFA) programs of the USDA-FS, is to protect Iowa’s wildlands, forests and non-forests from damage from wildfire. The State and Volunteer Fire Assistance programs are geared toward providing Iowa communities of fewer than 10,000 residents with the training, organization and equipment necessary for adequate wildfire protection.
The SFA program focuses on wildfire prevention through the development and distribution of prevention materials; it also prioritizes the acquisition and distribution of federal excess property such as trucks, pumps, and breathing apparatuses. The Forestry Bureau fire staff provide wildfire training for volunteer firefighters, as well as state, county and community emergency personnel and natural resource managers. The VFA program works to increase the ability of Iowa’s rural volunteer fire departments to protect lives, structures, and natural resources in rural and wildland-urban interface areas; it does this by providing financial, technical and other assistance to State Foresters, who then pass these resources on to local fire departments and fire training academies. Additionally, the program provides Federal Excess Personal Property (FEPP) and Department of Defense Firefighter Property DOD-FFP to volunteer fire departments and provides Smokey Bear fire prevention materials, which are used during promotions such as Fire Prevention Week.
Depending on the availability of funding, fire departments are able to purchase wildland gear, communication equipment, hand tools, portable tanks, portable pumps, small diameter hose and slip-on units and other types of equipment. The VFA program makes approximately $200,000 of federal funds available annually through grants to volunteer fire departments; a fiscal report of such funding is shown in Figure 3.22.
160
Figure 3.22 Distribution of VFA Funds to Rural Fire Departments. Federal Fiscal Year VFW & VFA-NFP Funding
made Available for Volunteer Fire Dept. Grants
Number of IowaVolunteer Fire Dept. Provided Grant Funds
The General Services Administration (GSA) Federal Supply Service offers wildfire protection equipment and supplies to federal, state and municipal fire agencies and other organizations that operate under formal agreements with the U.S. Forest Service. The DNR Forestry Bureau, as an affiliate of the U.S. Forest Service, can assist fire departments in purchases of fire associated gear from the GSA Federal Supply Service.
Federal Excess Personal Property (FEPP) is acquired on behalf of the U.S. Forest Service and loaned to state forestry agencies and cooperators such as volunteer fire departments for use in providing wildland and rural community fire protection. Since 2004 a FEPP screener and equipment manager has been working with volunteer fire departments to help them with their equipment needs. The FEPP program has been a tremendous asset to the fire service community in enhancing the overall fire protection capabilities within Iowa. Currently there are 697 long-term inventory items valued at over $15.6 million being utilized by volunteer fire departments in Iowa. Figure 3.23 shows the amount and value of FEPP equipment annually acquired in Iowa between 1999 and 2008.
Figure 3.23 Value of FEPP Equipment Annually Acquired by Iowa Fire Departments.Federal Fiscal Year Number of FEPP Inventory
In August 2008, the Forestry Bureau entered into an agreement with the U.S. Forest Service that authorized the bureau to participate in the Department of Defense Firefighter Property (DOD-FFP) program. This program is similar to the FEPP program, with the exception that once the equipment is modified, ready to put into service and inspected by a DNR Forestry fire staff person, title is transferred to the fire department using the equipment. From October 2008 through December 2009, the Forestry Bureau has acquired 121 line items through DOD-FFP valued at $2,561,674.
161
Wildfire RiskThe map in Figure 3.24 below shows where forests in Iowa are at most risk for wildfire according to three weighted layers: the 40 Scott and Burgan Fire Behavior Fuel Model - Drought Condition (80%), Wildland-Urban Interface (10%), and Topography (10%). There are 438,760 acres in the moderate to high category, and 118,842 acres in the very high to extreme category.
Figure 3.24 Statewide Wildfire Risk Assessment.
Source: Kathryne Clark using satellite land cover from 2002 and Scott Burgan Fire Behavior Fuel Model.
Iowa has five weather stations located in Moderate and High wildfire risk locations; these stations are linked to satellites and are available as web-based applications for reporting and data sharing for all governmental agencies and non-profit organizations. The stations are located in Loess Hills, Shimek, Stephens, and Yellow River State Forests and in Broken Kettle Grassland.
There are 438,760 acres of forest in the
moderate to high risk category, and
118,842 acres in the very high to extreme
category.
Woodland burning. Photo by Bruce Blair.
162
3.4 WeatherAccording to the National Oceanic and Atmospheric Administration (NOAA) National Climatic Data Center figures, averages for temperature and precipitation in Iowa have steadily increased from 1895 to 2008. Since record keeping began, temperature has increased in the state by an average of 0.10 degrees Fahrenheit (F) per decade, a trend reflected in Figure 3.26. In 2006 Iowa experienced the 5th warmest year on record with a statewide average of 50.3 degrees F. Three of the five warmest years on record have occurred since 1987; Figure 3.25 shows average temperatures for four of these five years, along with how that year ranks among the 113 years records are available to compare.
Figure 3.25 Selected Statewide Average Temperatures in Iowa.Year Average Statewide
Temperature (degrees F)Historical Ranking(1895-2008)
2006 50.3 51998 50.9 41987 51.3 21931 52.1 1
Source: National Climatic Data Center, www.ncdc.noaa.gov/oa/ncdc.html.
Figure 3.26 Historical Temperature Trends for Iowa.
Source: National Climatic Data Center, www.ncdc.noaa.gov/oa/ncdc.html.
Figure 3.27 shows average national temperature trends over the same period as in Figure 3.26. It is worth noting that Iowa’s average decade temperature increase of 0.10 degrees F is slightly lower than the national average of 0.13 degrees.
Figure 3.27 Historical Temperature Trends for the U.S.
Source: National Climatic Data Center, www.ncdc.noaa.gov/oa/ncdc.html.
Precipitation increased by an average of 0.35 inches per decade in Iowa from 1895 to 2008. Four of Iowa’s five wettest years occurred from 1993 to 2008, including the wettest year on record (2008). Four of the state’s wettest years, the amounts of precipitation in these years, and their overall historical rankings are given in Figure 3.28.
Figure 3.28 Selected Statewide Average Rainfall in Iowa.Year Average Statewide
Precipitation (inches)Ranking (1895-2008)
2008 43.07 32007 42.99 41998 40.31 81993 48.23 1
Source: National Climatic Data Center, www.ncdc.noaa.gov/oa/ncdc.html.
Figure 3.29 Historical Precipitation Trends for Iowa.
Source: National Climatic Data Center, www.ncdc.noaa.gov/oa/ncdc.html.
Figure 3.30 shows historical trends in precipitation for the U.S. as a whole. The average per-decade increase in precipitation in Iowa over this time period is more than twice that of the entire U.S.
Figure 3.30 Historical Precipitation Trends for the U.S.
Source: National Climatic Data Center, www.ncdc.noaa.gov/oa/ncdc.html.
The trends reflected in the precipitation data indicate a need to maintain or improve the water holding capacities of existing rivers and floodplains. Topsoil erosion, water quality reduction, aquatic wildlife decline and increased expenses for water treatment plants and dredging operations will likely result if excess rainfall is not better managed. Although local weather conditions cannot be controlled, people can minimize the costs and affects of weather by using land appropriately, particularly along rivers.
3.5 Highlights of Issues Affecting Forest Ecosystem Health and VitalityThreats to Iowa’s forest resource include both native and non-native insects and diseases.
Lack of tree diversity and lack of available native growing stock put communities at risk to forest health threats.
Survey, outreach, detection and prevention efforts are crucial for keeping Iowa’s forests healthy.
Iowa’s average annual temperature and rainfall have been increasing since 1895, with rainfall increasing by twice the national average.
Ozone pollution causes growth loss and makes trees more susceptible to destructive insects and diseases.
Species that are not native to an ecosystem are likely to cause economic or environmental harm to people, crops, livestock and natural plant and wildlife communities.
Depredation reduces biodiversity and alters the species composition and structure within a forest ecosystem.
A lack of dedicated fire personnel reduces the ability of volunteer fire departments to react to wildfires in a timely manner.
Construction of homes and other establishments in the Wildland-Urban Interface (WUI) without consideration for wildfire threats puts people and property at risk to fire.
Lack of prescribed fire contributes to species composition changes in Iowa’s forests.
Volunteer fire fighters in Iowa are decreasing in number, while those that remain often lack appropriate wildfire training and equipment.