18
20 Q2 Update - April Equipment Leasing & Finance U.S. Economic Outlook
20нл Q2 Update - April Equipment Leasing & Finance U.S. Economic Outlook
1April 2020|
r
LeaseFoundation.org
EQUIPMENT LEASING & FINANCE ECONOMIC OUTLOOK
April 2020
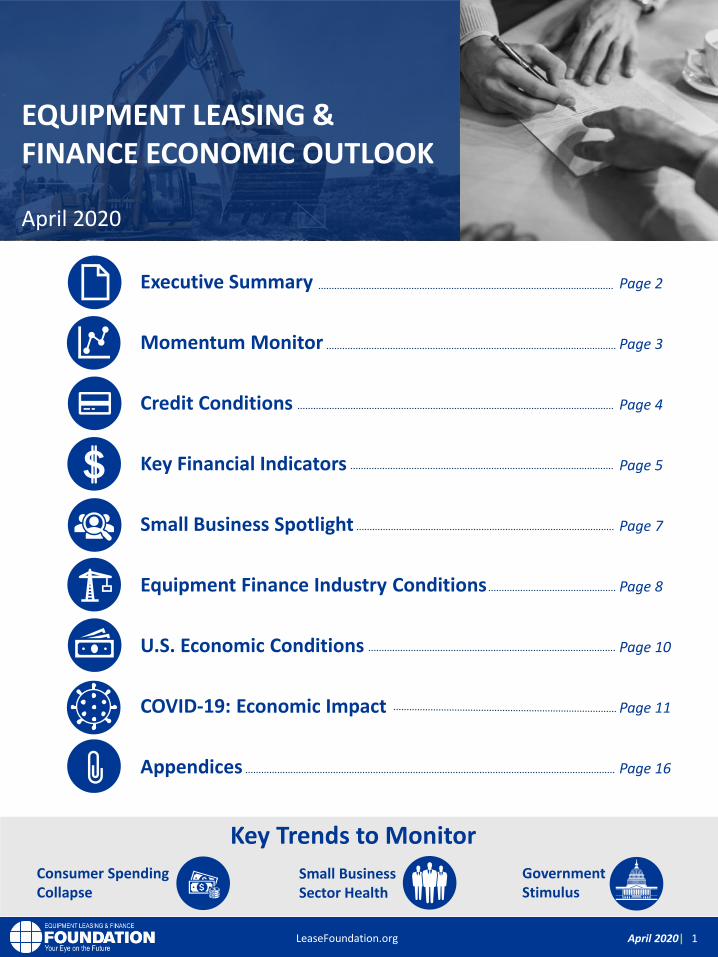
Executive Summary Page 2
Momentum Monitor Page 3
Credit Conditions Page 4
Key Financial Indicators Page 5
Small Business Spotlight Page 7
Equipment Finance Industry Conditions Page 8
U.S. Economic Conditions Page 10
COVID-19: Economic Impact Page 11
Appendices Page 16
Consumer Spending Collapse
GovernmentStimulus
Key Trends to Monitor
Small Business Sector Health
2April 2020|
r
LeaseFoundation.org
Projected
Projected
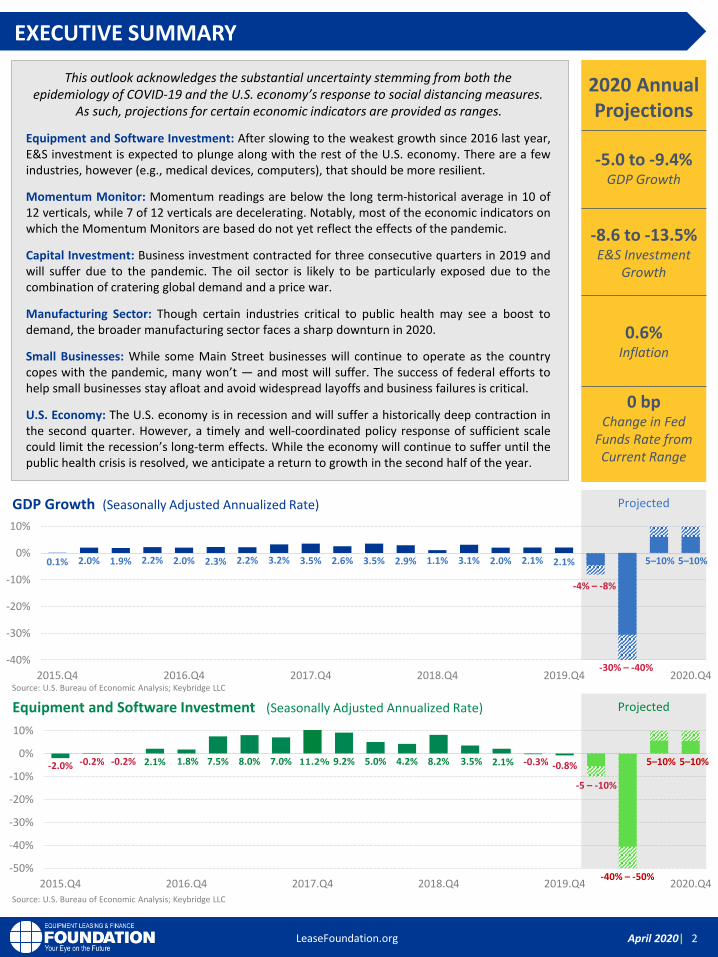
0.1% 2.0% 1.9% 2.2% 2.0% 2.3% 2.2% 3.2% 3.5% 2.6% 3.5% 2.9% 1.1% 3.1% 2.0% 2.1% 2.1%
-4% – -8%
-30% – -40%-40%
-30%
-20%
-10%
0%
10%
2015.Q4 2016.Q4 2017.Q4 2018.Q4 2019.Q4 2020.Q4
-2.0% -0.2% -0.2% 2.1% 1.8% 7.5% 8.0% 7.0% 9.2% 5.0% 4.2% 8.2% 3.5% 2.1% -0.3% -0.8%
-5 – -10%
-50%
-40%
-30%
-20%
-10%
0%
10%
2015.Q4 2016.Q4 2017.Q4 2018.Q4 2019.Q4 2020.Q4
This outlook acknowledges the substantial uncertainty stemming from both the epidemiology of COVID-19 and the U.S. economy’s response to social distancing measures.
As such, projections for certain economic indicators are provided as ranges.
Equipment and Software Investment: After slowing to the weakest growth since 2016 last year,E&S investment is expected to plunge along with the rest of the U.S. economy. There are a fewindustries, however (e.g., medical devices, computers), that should be more resilient.
Momentum Monitor: Momentum readings are below the long term-historical average in 10 of12 verticals, while 7 of 12 verticals are decelerating. Notably, most of the economic indicators onwhich the Momentum Monitors are based do not yet reflect the effects of the pandemic.
Capital Investment: Business investment contracted for three consecutive quarters in 2019 andwill suffer due to the pandemic. The oil sector is likely to be particularly exposed due to thecombination of cratering global demand and a price war.
Manufacturing Sector: Though certain industries critical to public health may see a boost todemand, the broader manufacturing sector faces a sharp downturn in 2020.
Small Businesses: While some Main Street businesses will continue to operate as the countrycopes with the pandemic, many won’t — and most will suffer. The success of federal efforts tohelp small businesses stay afloat and avoid widespread layoffs and business failures is critical.
U.S. Economy: The U.S. economy is in recession and will suffer a historically deep contraction inthe second quarter. However, a timely and well-coordinated policy response of sufficient scalecould limit the recession’s long-term effects. While the economy will continue to suffer until thepublic health crisis is resolved, we anticipate a return to growth in the second half of the year.
EXECUTIVE SUMMARY
-5.0 to -9.4% GDP Growth
-8.6 to -13.5%E&S Investment
Growth
0.6%Inflation
2020 Annual Projections
Equipment and Software Investment (Seasonally Adjusted Annualized Rate)
GDP Growth (Seasonally Adjusted Annualized Rate)
0 bpChange in Fed
Funds Rate from Current Range
Source: U.S. Bureau of Economic Analysis; Keybridge LLC
Source: U.S. Bureau of Economic Analysis; Keybridge LLC
11.2%
5–10% 5–10%
-40% – -50%
5–10% 5–10%
3April 2020|
r
LeaseFoundation.org
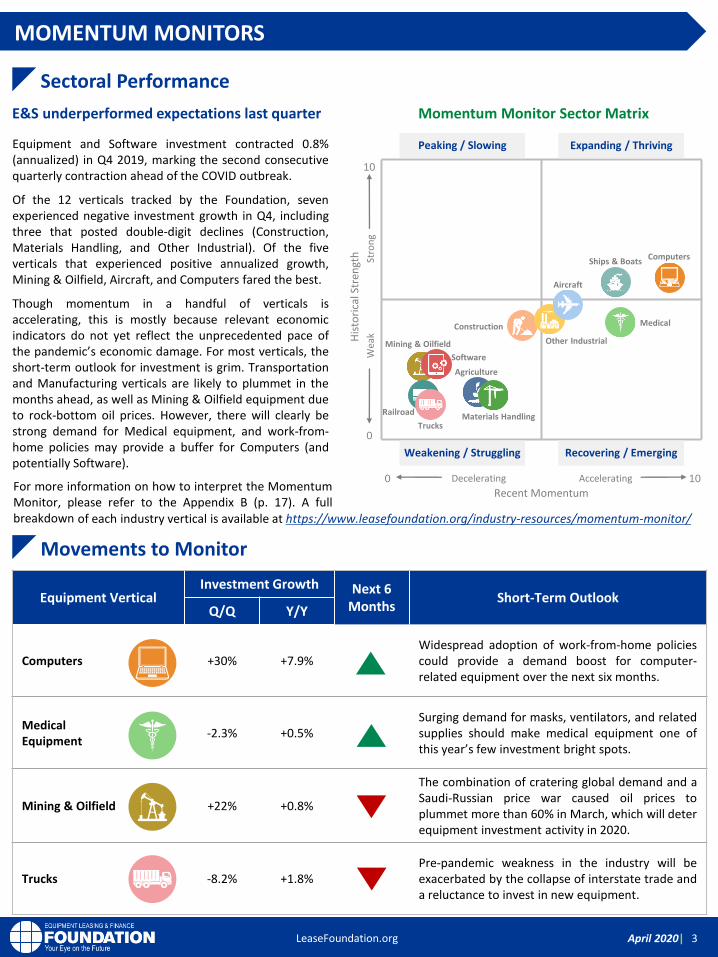
Equipment VerticalInvestment Growth Next 6
MonthsShort-Term Outlook
Q/Q Y/Y
Computers +30% +7.9%Widespread adoption of work-from-home policiescould provide a demand boost for computer-related equipment over the next six months.
Medical Equipment
-2.3% +0.5%Surging demand for masks, ventilators, and relatedsupplies should make medical equipment one ofthis year’s few investment bright spots.
Mining & Oilfield +22% +0.8%
The combination of cratering global demand and aSaudi-Russian price war caused oil prices toplummet more than 60% in March, which will deterequipment investment activity in 2020.
Trucks -8.2% +1.8%Pre-pandemic weakness in the industry will beexacerbated by the collapse of interstate trade anda reluctance to invest in new equipment.
Equipment and Software investment contracted 0.8%(annualized) in Q4 2019, marking the second consecutivequarterly contraction ahead of the COVID outbreak.
Of the 12 verticals tracked by the Foundation, sevenexperienced negative investment growth in Q4, includingthree that posted double-digit declines (Construction,Materials Handling, and Other Industrial). Of the fiveverticals that experienced positive annualized growth,Mining & Oilfield, Aircraft, and Computers fared the best.
Though momentum in a handful of verticals isaccelerating, this is mostly because relevant economicindicators do not yet reflect the unprecedented pace ofthe pandemic’s economic damage. For most verticals, theshort-term outlook for investment is grim. Transportationand Manufacturing verticals are likely to plummet in themonths ahead, as well as Mining & Oilfield equipment dueto rock-bottom oil prices. However, there will clearly bestrong demand for Medical equipment, and work-from-home policies may provide a buffer for Computers (andpotentially Software).
Sectoral Performance
Momentum Monitor Sector Matrix
MOMENTUM MONITORS
Movements to Monitor
E&S underperformed expectations last quarter
Weakening / Struggling Recovering / Emerging
Expanding / ThrivingPeaking / Slowing
His
tori
cal S
tren
gth
Wea
kSt
ron
g
0
10
Recent Momentum
Decelerating Accelerating0 10
Ships & Boats
TrucksMaterials HandlingRailroad
Aircraft
Mining & Oilfield Other Industrial
Computers
Software
Medical
Agriculture
Construction
For more information on how to interpret the MomentumMonitor, please refer to the Appendix B (p. 17). A fullbreakdown of each industry vertical is available at https://www.leasefoundation.org/industry-resources/momentum-monitor/

4April 2020|
r
LeaseFoundation.org
In Q4, credit supply conditions for businesses tightenedslightly from the third quarter.
• Banks left standards on C&I loans largely unchanged.
• Banks also left standards unchanged among most types ofcommercial real estate loans (“CRE”). However, a modestnet share (7.3%) of banks reported tightening standardsfor construction and land development loans.
• According to a special question, a net share of 8.6% ofbanks expect to tighten standards in 2020 on C&I loans tomedium and large firms as risk tolerance has decreased.
Meanwhile, credit supply conditions for consumers tightenedmoderately.
• A moderate net share of banks (14%) reported tighterstandards on credit card loans, while a modest net share(8.9%) reported tighter standards on auto loans.
• However, banks reportedly left standards on residentialreal estate (“RRE”) loans unchanged.
Among businesses, credit demand weakened in the fourthquarter, consistent with the decline in business investment.
• On net, roughly 11% of banks reported weaker demandfrom firms of all sizes for C&I loans.
• Demand for CRE loans was roughly unchanged on net, buta modest net share (5.8%) reported weaker demand forconstruction and land development loans.
Meanwhile, consumer credit demand strengthened modestlyin the fourth quarter.
• Regarding loans to households, a significant net share(21%) of banks report stronger demand for GSE-eligibleresidential mortgages.
• However, banks reported that demand was unchanged forcredit card and other consumer loans, and a modest netshare of banks (5.3%) reported weaker demand for autoloans.
Demand conditions mixed in Q4
Consumer and business conditions tighten in Q4
Economic Conditions as Reason for Credit TighteningFed Senior Loan Officer Survey, Percent of Respondents
62%14%
24%
Very Important
Not Important
Somewhat Important
CREDIT CONDITIONS
Credit Supply
Credit Demand
Net Change in Credit Supply ConditionsFed Senior Loan Officer Survey
Tighter LooserUnchanged
Slight Tightening from Q3
StrongerWeaker Unchanged
Moderate decrease from Q3
Net Change in Credit Supply ConditionsFed Senior Loan Officer Survey
Source: Federal Reserve Senior Loan Officer Survey
Lower Demand due to Decreased Business InvestmentFed Senior Loan Officer Survey, Percent of Respondents
71%
14%
14%
Very Important
Not Important
Somewhat Important
Source: Federal Reserve Senior Loan Officer Survey

5April 2020|
r
LeaseFoundation.org
0%
1%
2%
3%
4%
5%
2016.02 2017.02 2018.02 2019.02 2020.02
• The Fed has taken extraordinary measures to increaseliquidity in the financial system in response to COVID.
• After an emergency 50 bps rate cut in early March, theFed cut rates again in mid-March to 0-25 bps —equivalent to levels during the financial crisis.
• Furthermore, the Fed announced what amounts to ablank check to purchase Treasuries and mortgagebacked securities, in addition to measures supportingdebt from companies and state & local governments.
Household Debt Service RatioPrior to the COVID outbreak, consumers were reasonablywell-positioned to handle normal fluctuations in economicconditions. However, due to historic job losses, consumerfinancial stress will likely rise sharply, and spending will fall.
Based on the latest available pre-pandemic data:
• The household debt-service ratio is near the lowest levelon record in Q4, suggesting U.S. consumers were on solidfooting prior to the virus outbreak.
• Credit card delinquencies rose to a four-year high in Q4but remain well-below recession-era levels.
• However, auto loan delinquencies (90+ days) rose to a 10-year high of 4.9% in Q4, suggesting that financial stresscould be creeping up, particularly among subprimeborrowers.
While the labor market was strong by most measures prior toCOVID, there were signs that the consumer-driven economywas losing steam.
• After peaking above 4% Y/Y growth in mid-2018, realdisposable personal income growth has decelerated andhad fallen to early 2017 rates even before the pandemicushered in widespread job loss.
• In light of these trends, it is not surprising that consumersappear to have been tightening their belts prior to COVID.Personal consumption expenditures growth fell from 3.2%in Q3 to 1.8% in Q4 (SAAR), while retail sales fell inFebruary for the second time in three months.
Real Disposable Income (Y/Y Change)
Consumer Finances
Financial stress was relatively low before COVID
However, income and job growth were slowing
Fed Acts aggressively to dampen COVID impact“Everything is on the table. There is more we can do
if necessary. This is a planned, organized, partial
shutdown of the U.S. economy. The overall goal is
to keep everyone, households and businesses,
whole. It is a huge shock and we are trying to cope
with it and keep it under control.”
— St. Louis Fed President James Bullard, March 2020
KEY FINANCIAL INDICATORS
Fed Policy Corner
8%
10%
12%
14%
1991 1998 2005 2012 2019
9.7%30-year avg.
Source: Federal Reserve
Source: Bureau of Economic Analysis
2.2%
6April 2020|
r
LeaseFoundation.org
0%
1%
2%
3%
4%
2015 2016 2017 2018 2019 2020
KEY FINANCIAL INDICATORS (CONT’D)
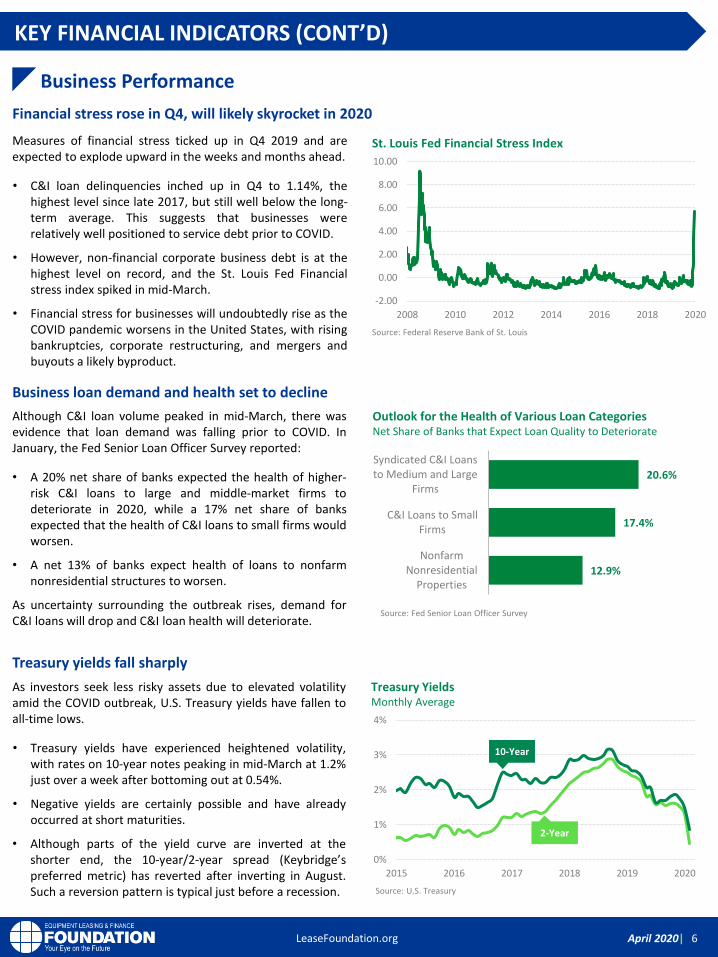
Measures of financial stress ticked up in Q4 2019 and areexpected to explode upward in the weeks and months ahead.
• C&I loan delinquencies inched up in Q4 to 1.14%, thehighest level since late 2017, but still well below the long-term average. This suggests that businesses wererelatively well positioned to service debt prior to COVID.
• However, non-financial corporate business debt is at thehighest level on record, and the St. Louis Fed Financialstress index spiked in mid-March.
• Financial stress for businesses will undoubtedly rise as theCOVID pandemic worsens in the United States, with risingbankruptcies, corporate restructuring, and mergers andbuyouts a likely byproduct.
Although C&I loan volume peaked in mid-March, there wasevidence that loan demand was falling prior to COVID. InJanuary, the Fed Senior Loan Officer Survey reported:
• A 20% net share of banks expected the health of higher-risk C&I loans to large and middle-market firms todeteriorate in 2020, while a 17% net share of banksexpected that the health of C&I loans to small firms wouldworsen.
• A net 13% of banks expect health of loans to nonfarmnonresidential structures to worsen.
As uncertainty surrounding the outbreak rises, demand forC&I loans will drop and C&I loan health will deteriorate.
2-Year
10-Year
Source: U.S. Treasury
As investors seek less risky assets due to elevated volatilityamid the COVID outbreak, U.S. Treasury yields have fallen toall-time lows.
• Treasury yields have experienced heightened volatility,with rates on 10-year notes peaking in mid-March at 1.2%just over a week after bottoming out at 0.54%.
• Negative yields are certainly possible and have alreadyoccurred at short maturities.
• Although parts of the yield curve are inverted at theshorter end, the 10-year/2-year spread (Keybridge’spreferred metric) has reverted after inverting in August.Such a reversion pattern is typical just before a recession.
Business Performance
Financial stress rose in Q4, will likely skyrocket in 2020
Business loan demand and health set to decline
Treasury yields fall sharply
Treasury YieldsMonthly Average
Outlook for the Health of Various Loan Categories Net Share of Banks that Expect Loan Quality to Deteriorate
-2.00
0.00
2.00
4.00
6.00
8.00
10.00
2008 2010 2012 2014 2016 2018 2020
St. Louis Fed Financial Stress Index
Source: Federal Reserve Bank of St. Louis
Source: Fed Senior Loan Officer Survey
20.6%
17.4%
12.9%
Syndicated C&I Loansto Medium and Large
Firms
C&I Loans to SmallFirms
NonfarmNonresidential
Properties
7April 2020|
r
LeaseFoundation.org
PayNet Small Business Lending Index3-Month Moving Average
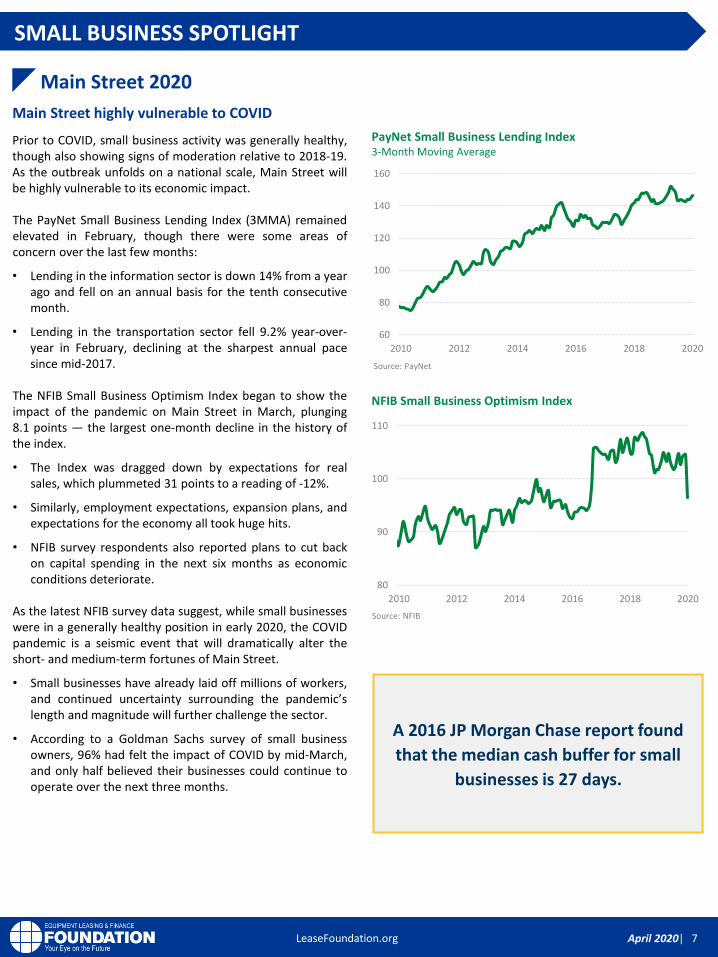
Prior to COVID, small business activity was generally healthy,though also showing signs of moderation relative to 2018-19.As the outbreak unfolds on a national scale, Main Street willbe highly vulnerable to its economic impact.
The PayNet Small Business Lending Index (3MMA) remainedelevated in February, though there were some areas ofconcern over the last few months:
• Lending in the information sector is down 14% from a yearago and fell on an annual basis for the tenth consecutivemonth.
• Lending in the transportation sector fell 9.2% year-over-year in February, declining at the sharpest annual pacesince mid-2017.
The NFIB Small Business Optimism Index began to show theimpact of the pandemic on Main Street in March, plunging8.1 points — the largest one-month decline in the history ofthe index.
• The Index was dragged down by expectations for realsales, which plummeted 31 points to a reading of -12%.
• Similarly, employment expectations, expansion plans, andexpectations for the economy all took huge hits.
• NFIB survey respondents also reported plans to cut backon capital spending in the next six months as economicconditions deteriorate.
As the latest NFIB survey data suggest, while small businesseswere in a generally healthy position in early 2020, the COVIDpandemic is a seismic event that will dramatically alter theshort- and medium-term fortunes of Main Street.
• Small businesses have already laid off millions of workers,and continued uncertainty surrounding the pandemic’slength and magnitude will further challenge the sector.
• According to a Goldman Sachs survey of small businessowners, 96% had felt the impact of COVID by mid-March,and only half believed their businesses could continue tooperate over the next three months.
NFIB Small Business Optimism Index
Source: PayNet
Main Street highly vulnerable to COVID
Source: NFIB
Main Street 2020
SMALL BUSINESS SPOTLIGHT
60
80
100
120
140
160
2010 2012 2014 2016 2018 2020
80
90
100
110
2010 2012 2014 2016 2018 2020
A 2016 JP Morgan Chase report found
that the median cash buffer for small
businesses is 27 days.

8April 2020|
r
LeaseFoundation.org
ELFA’s March Monthly Leasing and Finance Index pointed tosolid year-over-year growth, but the survey was conductedbefore COVID and thus does not reflect recent events.
• New business volume in February was $6.8 billion, a 15%year-over-year increase. Year-to-date, cumulative newbusiness volume was up 22% compared to 2019.
• 30-day delinquencies held at 2.00% but are up 20 basispoints from a year ago.
• Charge-offs rose 4 basis points in February to 0.51% andare up 16 basis points from a year ago.
The robust volume data captured in theFebruary MLFI-25 will no doubt take a turnin succeeding months as the coronaviruspandemic puts a damper on businessgrowth and expansion and equipmentacquisition plans.
Ralph Petta, President & CEO, ELFA
40
50
60
70
80
2015.03 2016.03 2017.03 2018.03 2019.03 2020.03
The Monthly Confidence Index for the Equipment FinanceIndustry (“MCI-EFI”) dropped 12.7 points to 46.0 in March, itslowest level since the series began in 2009.
• Nearly half (48.2%) of executives responded that theybelieve business conditions will worsen in March, up from3.9% last month.
• 37% of industry executives expect demand for loans andleases to fund capital expenditures will decline over thenext four months, an increase from 3.9% in February.
• 48% of industry executives expect U.S. economicconditions to worsen in the next six months.
46.0
Net Worsen
Net Improve
Expectations for demand for loans and leases to fund capital expenditures*
-4
-5
-3
-2
-1 0
2
3
4
5
1
New Business Volume ($ Billions)
Aging of Receivables Over 30 Days (Percent)
*Note: Diffusion index of the difference in the share of respondents who believe demand for loans / leases will increase vs. decrease.
Source: ELFF
MLFI-25
New business volume likely to decline amid COVID
The MCI-EFI fell to the lowest level on record in March
Source: ELFA
Source: ELFF
EQUIPMENT FINANCE INDUSTRY CONDITIONS
MCI-EFI
-40%
-30%
-20%
-10%
0%
10%
20%
30%
40%
2015.02 2016.02 2017.02 2018.02 2019.02 2020.02
15% (Y/Y)
Source: ELFA
0.0%
0.5%
1.0%
1.5%
2.0%
2.5%
3.0%
2015.02 2016.02 2017.02 2018.02 2019.02 2020.02
2.0%
9April 2020|
r
LeaseFoundation.org
-6%
-3%
0%
3%
6%
2015.02 2016.02 2017.02 2018.02 2019.02 2020.02
40
50
60
70
2015.03 2016.03 2017.03 2018.03 2019.03 2020.03
$55
$60
$65
$70
$75
2015.02 2016.02 2017.02 2018.02 2019.02 2020.02
Purchasing Managers’ Indices (PMI)Institute for Supply Management (ISM) & Chicago MNI
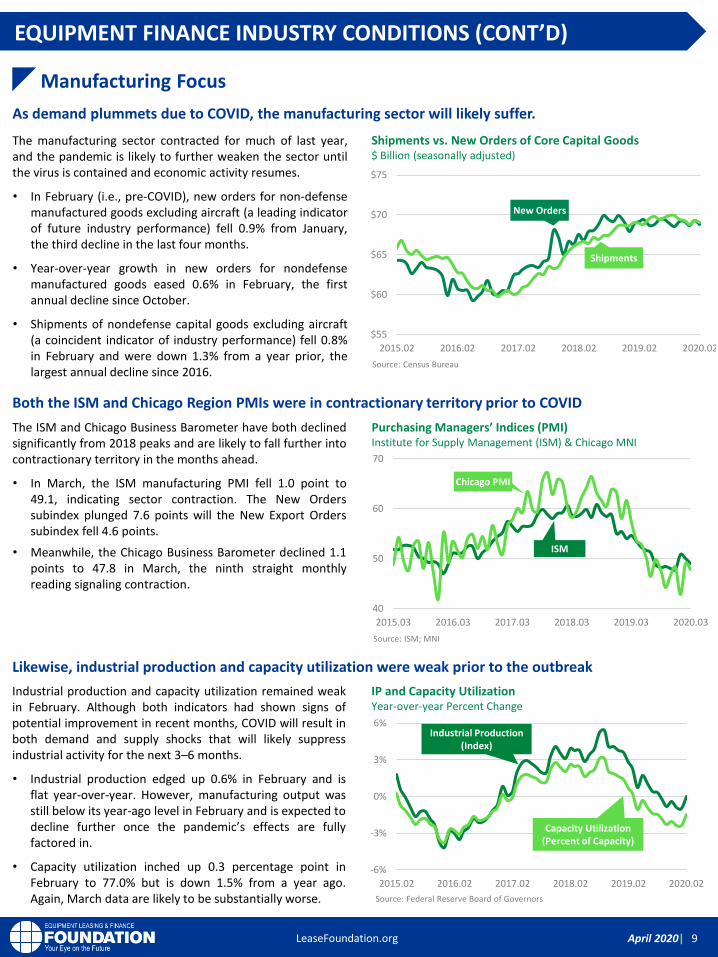
The manufacturing sector contracted for much of last year,and the pandemic is likely to further weaken the sector untilthe virus is contained and economic activity resumes.
• In February (i.e., pre-COVID), new orders for non-defensemanufactured goods excluding aircraft (a leading indicatorof future industry performance) fell 0.9% from January,the third decline in the last four months.
• Year-over-year growth in new orders for nondefensemanufactured goods eased 0.6% in February, the firstannual decline since October.
• Shipments of nondefense capital goods excluding aircraft(a coincident indicator of industry performance) fell 0.8%in February and were down 1.3% from a year prior, thelargest annual decline since 2016.
Source: Census Bureau
The ISM and Chicago Business Barometer have both declinedsignificantly from 2018 peaks and are likely to fall further intocontractionary territory in the months ahead.
• In March, the ISM manufacturing PMI fell 1.0 point to49.1, indicating sector contraction. The New Orderssubindex plunged 7.6 points will the New Export Orderssubindex fell 4.6 points.
• Meanwhile, the Chicago Business Barometer declined 1.1points to 47.8 in March, the ninth straight monthlyreading signaling contraction.
Source: Federal Reserve Board of Governors
Source: ISM; MNI
Industrial production and capacity utilization remained weakin February. Although both indicators had shown signs ofpotential improvement in recent months, COVID will result inboth demand and supply shocks that will likely suppressindustrial activity for the next 3–6 months.
• Industrial production edged up 0.6% in February and isflat year-over-year. However, manufacturing output wasstill below its year-ago level in February and is expected todecline further once the pandemic’s effects are fullyfactored in.
• Capacity utilization inched up 0.3 percentage point inFebruary to 77.0% but is down 1.5% from a year ago.Again, March data are likely to be substantially worse.
As demand plummets due to COVID, the manufacturing sector will likely suffer.
Both the ISM and Chicago Region PMIs were in contractionary territory prior to COVID
Likewise, industrial production and capacity utilization were weak prior to the outbreak
Shipments vs. New Orders of Core Capital Goods$ Billion (seasonally adjusted)
Shipments
New Orders
Chicago PMI
ISM
Capacity Utilization(Percent of Capacity)
Industrial Production(Index)
Manufacturing Focus
IP and Capacity UtilizationYear-over-year Percent Change
EQUIPMENT FINANCE INDUSTRY CONDITIONS (CONT’D)

10April 2020|
r
LeaseFoundation.org
Source: Bureau of Economic Analysis (BEA)
Positive
Contributions
[+2.49]
Negative
Contributions
[-0.15]
+1.76
GDP GROWTH
[+2.34]
+0.41
+0.22
Government Spending
Consumer Spending
Other Investment(+0.10)
The U.S. economy grew at a 2.3% rate last year, the slowestannual expansion since 2016 but in line with longer-termgrowth trends.
• Consumer spending, the largest component of theeconomy, was the primary growth driver for most of 2019and expanded at a healthy 2.6% rate on the year.
• Equipment and software (E&S) investment, a subset ofoverall business investment and the lifeblood of theequipment finance industry, rose 3.4% last year. Thisrepresents the slowest annual growth rate since 2016.
• Net exports suffered from significant volatility throughoutthe year due to the trade war with China and subtracted0.2 percentage point from full-year growth.
• Government Spending: Government spending expanded2.3% in 2019, the fastest growth since 2009.
• Other Investment: Other investment was a drag ongrowth in 2019. Structures investment fell to -4.3% in2019 while residential investment contracted -1.5%.
Source: Bureau of Economic Analysis (BEA)
Record U.S. economic expansion will end in 2020
2019: A Year in Review
2.1%
1.2%
-6.2%
-9.4%
2020 Growth Forecasts
Contributions to GDP Growth2019
Composition of Gross Domestic Product (GDP)GDP = C + I + G + NX
2019 was generally healthy for the U.S. economy
Consumer Spending (C)
Govt.Spending(G)
Other
Net Exports(NX)
Equipment & Software
Investment (I)
While last year the economy was generally healthy, 2020 islikely to be among the most challenging peacetime years for theU.S. economy in history. A recession is already underway.
• The COVID pandemic spreading across the globe has broughtnations to their knees, including the United States.
• Roughly 10 million people filed for unemployment benefits inMarch, with millions more expected to file in April. Smallbusinesses will bear the brunt of the damage.
• Until the public health crisis is resolved, the economy willcontinue to sputter. However, we expect Q3 and Q4 to be animprovement over Q2, which should produce strongannualized growth rates. Nonetheless, the economy will besmaller at the end of 2020 than it was at the start.
2020: The Year Ahead
2020 may prove to be the sharpest downturn since the Great Depression.
Dr. Robert Wescott President, Keybridge LLC
E&S Investment
Net Exports(-0.15)
Goldman Sachs
Wall Street Journal
Federal Reserve
*Range reflects uncertainty of epidemiology of COVID-19.
U.S. ECONOMIC OVERVIEW
ELFF / Keybridge* -5.0%
11April 2020|
r
LeaseFoundation.org
0
1,000
2,000
3,000
4,000
5,000
6,000
7,000
2005 2008 2011 2014 2017 2020
Thousands
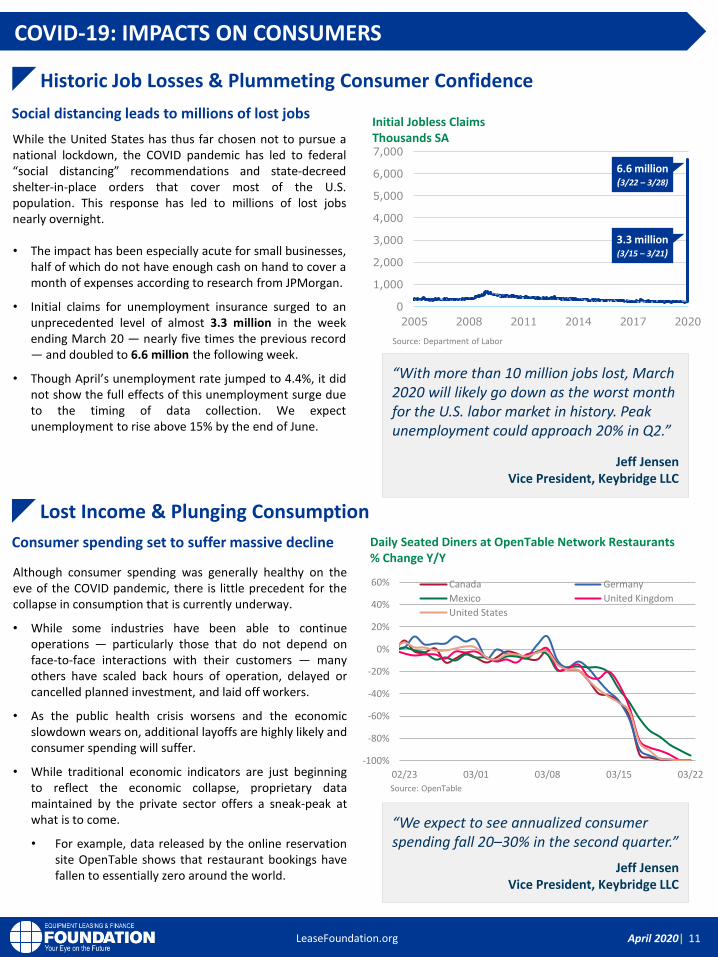
6.6 million (3/22 – 3/28)
Initial Jobless Claims Thousands SAWhile the United States has thus far chosen not to pursue a
national lockdown, the COVID pandemic has led to federal“social distancing” recommendations and state-decreedshelter-in-place orders that cover most of the U.S.population. This response has led to millions of lost jobsnearly overnight.
• The impact has been especially acute for small businesses,half of which do not have enough cash on hand to cover amonth of expenses according to research from JPMorgan.
• Initial claims for unemployment insurance surged to anunprecedented level of almost 3.3 million in the weekending March 20 — nearly five times the previous record— and doubled to 6.6 million the following week.
• Though April’s unemployment rate jumped to 4.4%, it didnot show the full effects of this unemployment surge dueto the timing of data collection. We expectunemployment to rise above 15% by the end of June.
Although consumer spending was generally healthy on theeve of the COVID pandemic, there is little precedent for thecollapse in consumption that is currently underway.
• While some industries have been able to continueoperations — particularly those that do not depend onface-to-face interactions with their customers — manyothers have scaled back hours of operation, delayed orcancelled planned investment, and laid off workers.
• As the public health crisis worsens and the economicslowdown wears on, additional layoffs are highly likely andconsumer spending will suffer.
• While traditional economic indicators are just beginningto reflect the economic collapse, proprietary datamaintained by the private sector offers a sneak-peak atwhat is to come.
• For example, data released by the online reservationsite OpenTable shows that restaurant bookings havefallen to essentially zero around the world.
“With more than 10 million jobs lost, March 2020 will likely go down as the worst month for the U.S. labor market in history. Peak unemployment could approach 20% in Q2.”
Jeff JensenVice President, Keybridge LLC
Historic Job Losses & Plummeting Consumer Confidence
Lost Income & Plunging Consumption
-100%
-80%
-60%
-40%
-20%
0%
20%
40%
60%
02/23 03/01 03/08 03/15 03/22
Canada Germany
Mexico United Kingdom
United States
Daily Seated Diners at OpenTable Network Restaurants% Change Y/Y
Source: Department of Labor
Source: OpenTable
Consumer spending set to suffer massive decline
Social distancing leads to millions of lost jobs
“We expect to see annualized consumer spending fall 20–30% in the second quarter.”
Jeff JensenVice President, Keybridge LLC
COVID-19: IMPACTS ON CONSUMERS
3.3 million (3/15 – 3/21)
12April 2020|
r
LeaseFoundation.org
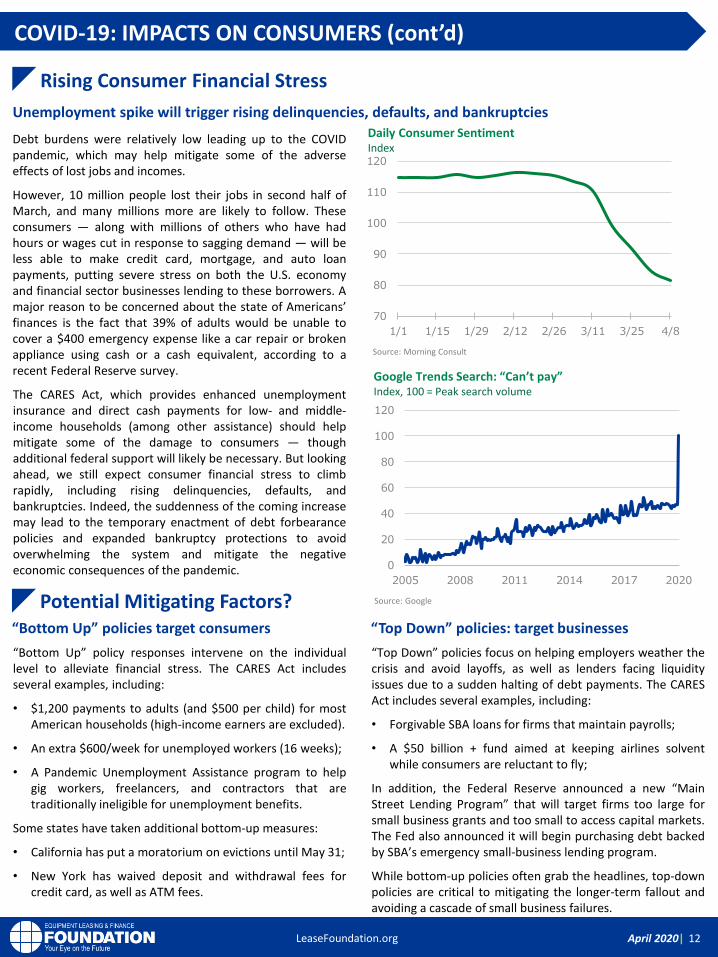
Debt burdens were relatively low leading up to the COVIDpandemic, which may help mitigate some of the adverseeffects of lost jobs and incomes.
However, 10 million people lost their jobs in second half ofMarch, and many millions more are likely to follow. Theseconsumers — along with millions of others who have hadhours or wages cut in response to sagging demand — will beless able to make credit card, mortgage, and auto loanpayments, putting severe stress on both the U.S. economyand financial sector businesses lending to these borrowers. Amajor reason to be concerned about the state of Americans’finances is the fact that 39% of adults would be unable tocover a $400 emergency expense like a car repair or brokenappliance using cash or a cash equivalent, according to arecent Federal Reserve survey.
The CARES Act, which provides enhanced unemploymentinsurance and direct cash payments for low- and middle-income households (among other assistance) should helpmitigate some of the damage to consumers — thoughadditional federal support will likely be necessary. But lookingahead, we still expect consumer financial stress to climbrapidly, including rising delinquencies, defaults, andbankruptcies. Indeed, the suddenness of the coming increasemay lead to the temporary enactment of debt forbearancepolicies and expanded bankruptcy protections to avoidoverwhelming the system and mitigate the negativeeconomic consequences of the pandemic.
“Bottom Up” policy responses intervene on the individuallevel to alleviate financial stress. The CARES Act includesseveral examples, including:
• $1,200 payments to adults (and $500 per child) for mostAmerican households (high-income earners are excluded).
• An extra $600/week for unemployed workers (16 weeks);
• A Pandemic Unemployment Assistance program to helpgig workers, freelancers, and contractors that aretraditionally ineligible for unemployment benefits.
Some states have taken additional bottom-up measures:
• California has put a moratorium on evictions until May 31;
• New York has waived deposit and withdrawal fees forcredit card, as well as ATM fees.
Rising Consumer Financial Stress
Potential Mitigating Factors? “Bottom Up” policies target consumers
Unemployment spike will trigger rising delinquencies, defaults, and bankruptcies
“Top Down” policies focus on helping employers weather thecrisis and avoid layoffs, as well as lenders facing liquidityissues due to a sudden halting of debt payments. The CARESAct includes several examples, including:
• Forgivable SBA loans for firms that maintain payrolls;
• A $50 billion + fund aimed at keeping airlines solventwhile consumers are reluctant to fly;
In addition, the Federal Reserve announced a new “MainStreet Lending Program” that will target firms too large forsmall business grants and too small to access capital markets.The Fed also announced it will begin purchasing debt backedby SBA’s emergency small-business lending program.
While bottom-up policies often grab the headlines, top-downpolicies are critical to mitigating the longer-term fallout andavoiding a cascade of small business failures.
“Top Down” policies: target businesses
0
20
40
60
80
100
120
2005 2008 2011 2014 2017 2020
Google Trends Search: “Can’t pay”Index, 100 = Peak search volume
Source: Google
Source: Morning Consult
COVID-19: IMPACTS ON CONSUMERS (cont’d)
70
80
90
100
110
120
1/1 1/15 1/29 2/12 2/26 3/11 3/25 4/8
Daily Consumer SentimentIndex
13April 2020|
r
LeaseFoundation.org
Service industry bears brunt of coronavirus impact
Medical equipment industry may see uptick
Equity markets experience massive swings
COVID-19: IMPACT ON BUSINESSES
Negative Industry Impact
Potential Growth
Financial Market Turmoil
Source: Homebase
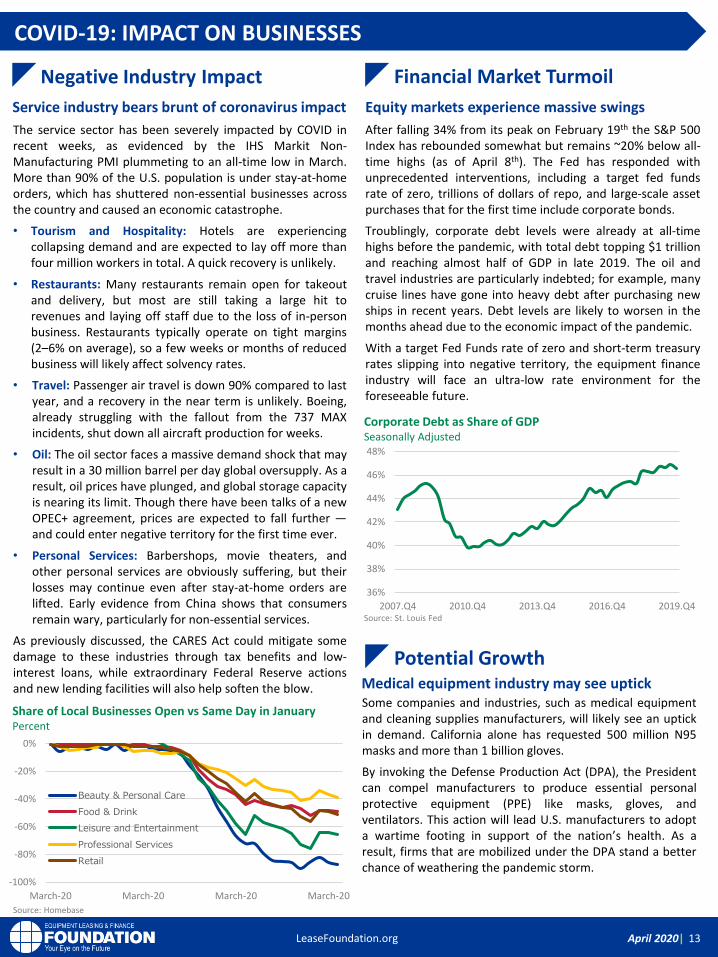
Some companies and industries, such as medical equipmentand cleaning supplies manufacturers, will likely see an uptickin demand. California alone has requested 500 million N95masks and more than 1 billion gloves.
By invoking the Defense Production Act (DPA), the Presidentcan compel manufacturers to produce essential personalprotective equipment (PPE) like masks, gloves, andventilators. This action will lead U.S. manufacturers to adopta wartime footing in support of the nation’s health. As aresult, firms that are mobilized under the DPA stand a betterchance of weathering the pandemic storm.
The service sector has been severely impacted by COVID inrecent weeks, as evidenced by the IHS Markit Non-Manufacturing PMI plummeting to an all-time low in March.More than 90% of the U.S. population is under stay-at-homeorders, which has shuttered non-essential businesses acrossthe country and caused an economic catastrophe.
• Tourism and Hospitality: Hotels are experiencingcollapsing demand and are expected to lay off more thanfour million workers in total. A quick recovery is unlikely.
• Restaurants: Many restaurants remain open for takeoutand delivery, but most are still taking a large hit torevenues and laying off staff due to the loss of in-personbusiness. Restaurants typically operate on tight margins(2–6% on average), so a few weeks or months of reducedbusiness will likely affect solvency rates.
• Travel: Passenger air travel is down 90% compared to lastyear, and a recovery in the near term is unlikely. Boeing,already struggling with the fallout from the 737 MAXincidents, shut down all aircraft production for weeks.
• Oil: The oil sector faces a massive demand shock that mayresult in a 30 million barrel per day global oversupply. As aresult, oil prices have plunged, and global storage capacityis nearing its limit. Though there have been talks of a newOPEC+ agreement, prices are expected to fall further —and could enter negative territory for the first time ever.
• Personal Services: Barbershops, movie theaters, andother personal services are obviously suffering, but theirlosses may continue even after stay-at-home orders arelifted. Early evidence from China shows that consumersremain wary, particularly for non-essential services.
As previously discussed, the CARES Act could mitigate somedamage to these industries through tax benefits and low-interest loans, while extraordinary Federal Reserve actionsand new lending facilities will also help soften the blow.
After falling 34% from its peak on February 19th the S&P 500Index has rebounded somewhat but remains ~20% below all-time highs (as of April 8th). The Fed has responded withunprecedented interventions, including a target fed fundsrate of zero, trillions of dollars of repo, and large-scale assetpurchases that for the first time include corporate bonds.
Troublingly, corporate debt levels were already at all-timehighs before the pandemic, with total debt topping $1 trillionand reaching almost half of GDP in late 2019. The oil andtravel industries are particularly indebted; for example, manycruise lines have gone into heavy debt after purchasing newships in recent years. Debt levels are likely to worsen in themonths ahead due to the economic impact of the pandemic.
With a target Fed Funds rate of zero and short-term treasuryrates slipping into negative territory, the equipment financeindustry will face an ultra-low rate environment for theforeseeable future.
Corporate Debt as Share of GDPSeasonally Adjusted
36%
38%
40%
42%
44%
46%
48%
2007.Q4 2010.Q4 2013.Q4 2016.Q4 2019.Q4Source: St. Louis Fed
Share of Local Businesses Open vs Same Day in JanuaryPercent
-100%
-80%
-60%
-40%
-20%
0%
March-20 March-20 March-20 March-20
Beauty & Personal Care
Food & Drink
Leisure and Entertainment
Professional Services
Retail

14April 2020|
r
LeaseFoundation.org
In anticipation of the economic and public health effects ofcoronavirus, Congress passed three bipartisan relief packagesin March. The first two bills funded vaccine development, paidsick leave for most employees, and free coronavirus testing.The third bill (the CARES Act) provides $2.3 trillion in fiscalstimulus to consumers, businesses, and states, including:
• $510 billion in loans and aid to large businesses;
• $377 billion in loans to small businesses — most of whichis forgiven if the employer maintains pre-crisis payrolls;
• $300 billion in tax relief (over 90% of which is directed atbusinesses);
• $290 billion in direct household payments via tax rebates;
• $260 billion in expanded unemployment benefits;
• $150 billion in state and local government support;
• $72 billion in support for transportation providers &industries (including airlines).
Congress may provide additional fiscal stimulus in the form ofmore direct payments to consumers, increased funding forsmall business loans, debt forbearance, or infrastructurespending, in subsequent legislation. However, a fourth reliefpackage appears unlikely to pass until May at the earliest.
Government ResponseHow much can Congress mitigate the damage?
COVID-19: IMPACT ON FEDERAL, STATE, & LOCAL GOVERNMENTS
Unemployment claims rose sharply in the last two weeks ofMarch and are expected to increase further in the comingweeks. This will impact state budgets in multiple ways.
• Unemployment benefits will skyrocket, and stateunemployment trust funds will be drawn down at levelsthat could easily surpass the 2008–09 recession.
• The widespread closure of businesses will sharply reducesales tax collection, while the unemployment spike willalso reduce income tax revenue.
• Given that most states are required balance their budgets,governors may need to cut services and plannedinvestments. CARES Act assistance will help but is unlikelyto fully plug the funding shortfall.
Municipal budgets will face similar revenue shortfalls, whichwill likely lead to funding cuts in education, transit, andinfrastructure projects across the country.
Rising costs and lower revenues for states
State & Local Government Impact In the short run, the federal government is focused primarilyon controlling the spread of COVID, dealing with the publichealth effects, and providing a cushion for households andbusinesses. These efforts, while badly needed, will lead tolarge increases in the federal deficit.
• The U.S. national debt reached 105% of GDP in 2019 Q3,and the CARES Act — with a cost of roughly 10% of GDP —will drive this number higher.
• Federal tax revenue will fall sharply in the months ahead,while automatic stabilization programs such as Medicaidand SNAP food benefits will further increase spending.
Additionally, normal government functions will likely beaffected. Agencies such as EPA have suspended or curtailedregular enforcement activity, the Census Bureau haspostponed in-person contact efforts (potentially inhibiting itsability to accurately count hard-to-reach populations), andSBA’s lending activity will be put into overdrive.
If the virus is not sufficiently contained by the fall, in-personvoting could become a public health issue. Congress providedsome funding to states for vote-by-mail in the CARES Act, butit is likely insufficient to fund nationwide voting changes.
How will coronavirus affect policy choices?
Federal Government Impact
Federal Reserve AssetsBillions of Dollars
Source: St. Louis Fed
3,000
3,500
4,000
4,500
5,000
5,500
2017.09 2018.03 2018.09 2019.03 2019.09 2020.03
$510 BLoans / loan gurantees to large businesses
$290 BDirect cash payments to households
$300 BTax cuts
$377 BLoans and grants to small businesses
$260 BUnemployment insurance
$150 BState aid
$385 B Other
Source: U.S. Senate, Bloomberg News
CARES Act Funding BreakdownBillions of Dollars
15April 2020|
r
LeaseFoundation.org
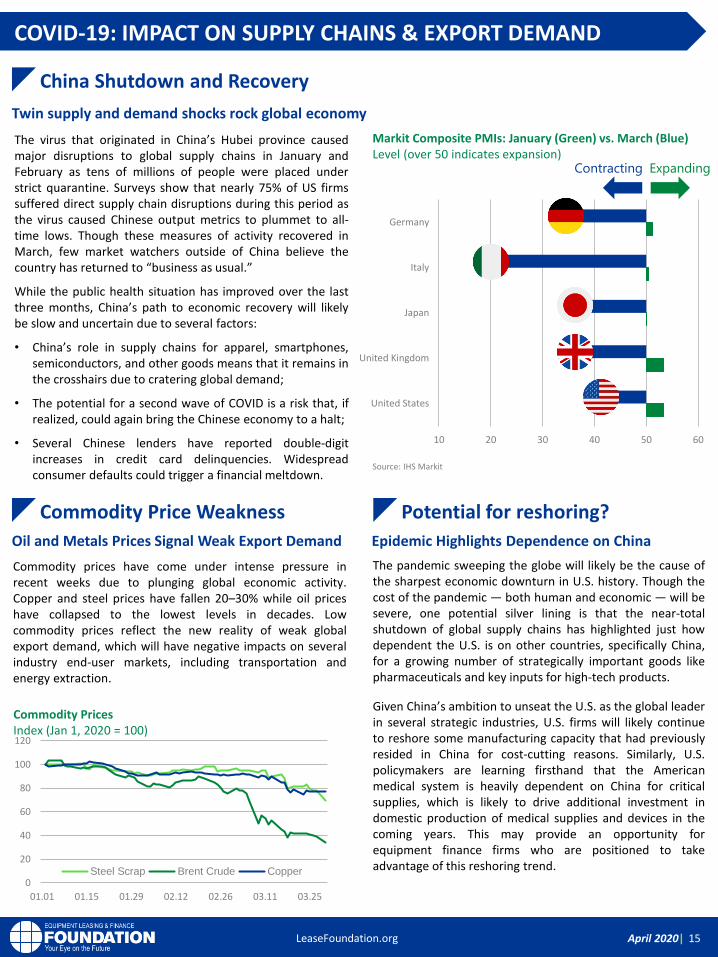
The virus that originated in China’s Hubei province causedmajor disruptions to global supply chains in January andFebruary as tens of millions of people were placed understrict quarantine. Surveys show that nearly 75% of US firmssuffered direct supply chain disruptions during this period asthe virus caused Chinese output metrics to plummet to all-time lows. Though these measures of activity recovered inMarch, few market watchers outside of China believe thecountry has returned to “business as usual.”
While the public health situation has improved over the lastthree months, China’s path to economic recovery will likelybe slow and uncertain due to several factors:
• China’s role in supply chains for apparel, smartphones,semiconductors, and other goods means that it remains inthe crosshairs due to cratering global demand;
• The potential for a second wave of COVID is a risk that, ifrealized, could again bring the Chinese economy to a halt;
• Several Chinese lenders have reported double-digitincreases in credit card delinquencies. Widespreadconsumer defaults could trigger a financial meltdown.
Markit Composite PMIs: January (Green) vs. March (Blue)Level (over 50 indicates expansion)
China Shutdown and Recovery
Commodity prices have come under intense pressure inrecent weeks due to plunging global economic activity.Copper and steel prices have fallen 20–30% while oil priceshave collapsed to the lowest levels in decades. Lowcommodity prices reflect the new reality of weak globalexport demand, which will have negative impacts on severalindustry end-user markets, including transportation andenergy extraction.
Commodity Price Weakness
The pandemic sweeping the globe will likely be the cause ofthe sharpest economic downturn in U.S. history. Though thecost of the pandemic — both human and economic — will besevere, one potential silver lining is that the near-totalshutdown of global supply chains has highlighted just howdependent the U.S. is on other countries, specifically China,for a growing number of strategically important goods likepharmaceuticals and key inputs for high-tech products.
Given China’s ambition to unseat the U.S. as the global leaderin several strategic industries, U.S. firms will likely continueto reshore some manufacturing capacity that had previouslyresided in China for cost-cutting reasons. Similarly, U.S.policymakers are learning firsthand that the Americanmedical system is heavily dependent on China for criticalsupplies, which is likely to drive additional investment indomestic production of medical supplies and devices in thecoming years. This may provide an opportunity forequipment finance firms who are positioned to takeadvantage of this reshoring trend.
Potential for reshoring?
Twin supply and demand shocks rock global economy
Oil and Metals Prices Signal Weak Export Demand Epidemic Highlights Dependence on China
10 20 30 40 50 60
United States
United Kingdom
Japan
Italy
Germany
Source: IHS Markit
Commodity PricesIndex (Jan 1, 2020 = 100)
0
20
40
60
80
100
120
01.01 01.15 01.29 02.12 02.26 03.11 03.25
Steel Scrap Brent Crude Copper
ExpandingContracting
COVID-19: IMPACT ON SUPPLY CHAINS & EXPORT DEMAND
16April 2020|
r
LeaseFoundation.org
Projections
-24,000
-18,000
-12,000
-6,000
0
6,000
12,000
2015.Q4 2016.Q4 2017.Q4 2018.Q4 2019.Q4 2020.Q4
Projections
0%
1%
2%
3%
2015.Q4 2016.Q4 2017.Q4 2018.Q4 2019.Q4 2020.Q4
Fed Funds Target (upper bound, end of period)
Projections
-60%
-45%
-30%
-15%
0%
15%
2015.Q4 2016.Q4 2017.Q4 2018.Q4 2019.Q4 2020.Q4
Real Investment Growth (% SAAR)
Projections
-40%
-30%
-20%
-10%
0%
10%
20%
2015.Q4 2016.Q4 2017.Q4 2018.Q4 2019.Q4 2020.Q4
Projections
-2%
-1%
0%
1%
2%
3%
2015.Q4 2016.Q4 2017.Q4 2018.Q4 2019.Q4 2020.Q4
CPI Inflation (year-on-year %)
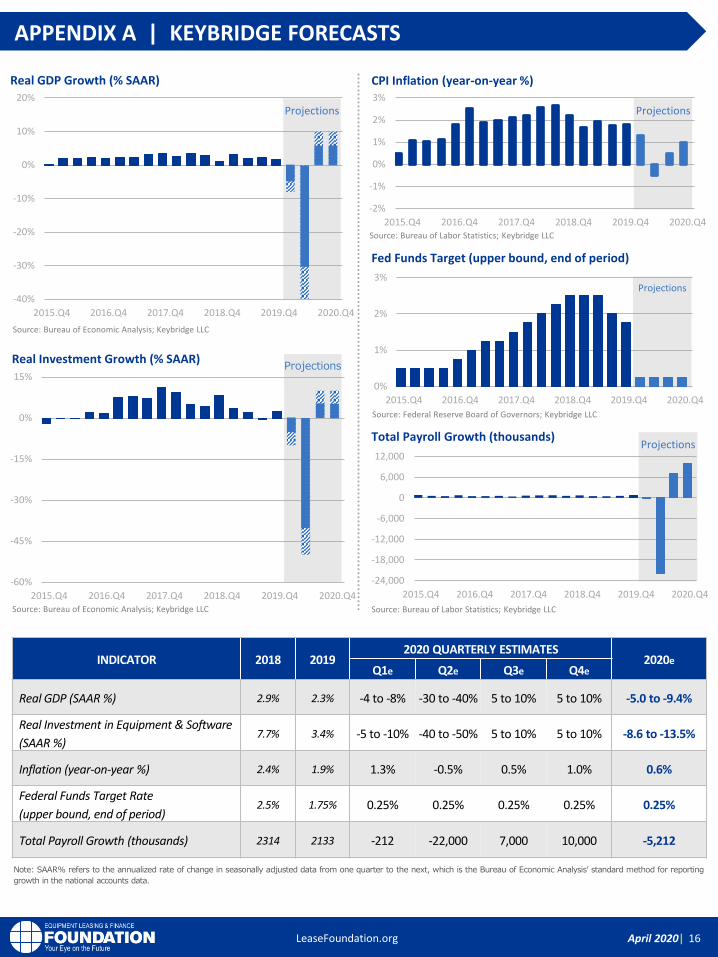
INDICATOR 2018 20192020 QUARTERLY ESTIMATES
2020eQ1e Q2e Q3e Q4e
Real GDP (SAAR %) 2.9% 2.3% -4 to -8% -30 to -40% 5 to 10% 5 to 10% -5.0 to -9.4%
Real Investment in Equipment & Software
(SAAR %)7.7% 3.4% -5 to -10% -40 to -50% 5 to 10% 5 to 10% -8.6 to -13.5%
Inflation (year-on-year %) 2.4% 1.9% 1.3% -0.5% 0.5% 1.0% 0.6%
Federal Funds Target Rate
(upper bound, end of period)2.5% 1.75% 0.25% 0.25% 0.25% 0.25% 0.25%
Total Payroll Growth (thousands) 2314 2133 -212 -22,000 7,000 10,000 -5,212
Note: SAAR% refers to the annualized rate of change in seasonally adjusted data from one quarter to the next, which is the Bureau of Economic Analysis’ standard method for reporting
growth in the national accounts data.
Real GDP Growth (% SAAR)
Total Payroll Growth (thousands)
Source: Bureau of Economic Analysis; Keybridge LLC
Source: Bureau of Economic Analysis; Keybridge LLC
Source: Bureau of Labor Statistics; Keybridge LLC
Source: Bureau of Labor Statistics; Keybridge LLC
Source: Federal Reserve Board of Governors; Keybridge LLC
APPENDIX A | KEYBRIDGE FORECASTS
17April 2020|
r
LeaseFoundation.org
APPENDIX B | ABOUT THE MOMENTUM MONITOR
About the Momentum Monitor
Business leaders require actionable forward-looking intelligence to make strategic decisions.
Accordingly, the Foundation commissioned Keybridge LLC to develop a series of custom leading
indicators for the equipment sector. The Foundation-Keybridge Equipment & Software Investment
Momentum Monitor consists of indices for 12 equipment and software investment verticals.
These indices are designed to identify turning points in their respective investment cycles with a
3–6-month lead time.
The Momentum Monitor is based on Keybridge’s extensive research which shows that not all
movements in economic data are reliable signals of future economic trends. Keybridge has
operationalized its research by constructing indices, each comprised of between 10 to 20 high-
frequency indicators. These indicators undergo rigorous testing to determine the optimal
thresholds at which their short-term fluctuations are economically meaningful. In simpler terms,
the Momentum Monitor sifts out the “noise” in the data and identifies the dominant trends. As a
result, each Momentum Monitor index is statistically optimized to signal turning points in the
investment cycle without giving false readings of shifts in momentum.
How to Read the Momentum Monitor
The Momentum Monitor Matrix summarizes the current values of each of the 12 Equipment &
Software Investment Momentum Indices based on two factors: Recent Momentum (x-axis) and
Historical Strength (y-axis):
• “Recent Momentum" indicates a vertical’s recent acceleration or deceleration in the past
month relative to its average movement during the previous 3 months. Ratings closer to "0"
indicate rapid deceleration, while ratings near “10” represent rapid acceleration.
• "Historical Strength" reflects a vertical’s strength in the past month relative to its typical level
since 1999. Ratings closer to "0" represent an indicator that is weaker than average, while
ratings closer to "10" represent an indicator that is stronger than average.
The matrix consists of four quadrants based on readings for each vertical’s recent momentum and
historical strength. If a vertical falls in the top-left quadrant, its momentum reading is higher than
average, but positive movement has slowed (and perhaps reversed) in recent months —
suggesting that investment levels may fall over the next 1-2 quarters. Verticals in the bottom-right
quadrant, however, have momentum readings that are below average, but recent movement
shows promise — suggesting that investment levels may rise over the next 1-2 quarters.


![[Unchanged] Growth Matters](https://static.documents.pub/doc/80x56/618bb69e8a49993a96117cb7/unchanged-growth-matters.jpg)


![[Unchanged] Decent demand dynamics](https://static.documents.pub/doc/80x56/618dc1a530002b5240749633/unchanged-decent-demand-dynamics.jpg)


