20 September 2021 Initiating Coverage Nuvoco Vistas Strengthening its leadership position We initiate coverage on Nuvoco Vistas (Nuvoco) with a BUY rating and a target price of INR 827/share (11x its consolidated Sep’23E EBITDA). The company has grown inorganically to become the sixth largest cement company in India and has consolidated its leadership position in the east. A large retail presence in the high-growth east region buoyed its operating margin during FY20-21. It should further expand to INR 1,177/MT in FY23E, riding on cost initiatives and synergy benefits from the integration of the recently acquired NU Vista (erstwhile Emami Cements). The recently concluded IPO has also firmed up Nuvoco’s balance sheet. We expect strong cash flow to help accelerate the company’s Karnataka expansion plan. Asset sweating and leverage reduction should bolster return ratios. Nuvoco emerges a major player and regional leader in east: Nuvoco soared to become the sixth largest player in India through two mega acquisitions in the east – Lafarge Cement (India) in 2016 and NU Vista (Emami Cement before the acquisition) in 2020. These moves consolidated its position as one of the top-3 sellers in the eastern region. Nuvoco’s Duraguard and Concreto brands have enjoyed premium positioning in the east for a long time. Multiple triggers to bolster operating margin: Nuvoco has recently added WHRS and is also expanding its CPPs, to bolster its low-cost power consumption share to ~70% from 50% in FY21, adding ~INR 50/MT in cost savings. The integration of the recently acquired NU Vista into Nuvoco, along with focus on further expanding its blended cement production ratio, is expected to unlock another ~INR 200/MT of unitary EBITDA by FY23E. These moves alongwith healthy pricing should drive up consolidated unitary EBITDA by ~INR 235/MT by FY23E, despite factoring in fuel cost inflation and the impact of accelerated capacity additions by competitors. Balance sheet back in shape, post IPO: Nuvoco’s leverage ratio got stretched, owing to the two mega acquisitions. However, with large INR 15bn equity infusion from the just concluded IPO, strong operating cash flow outlook, and lower Capex outgo, we estimate its net debt/EBITDA to cool off to below 1x FY23E onwards vs ~4x during FY17-21. We estimate its debt reduction to continue despite its ongoing 8/15% clinker/cement expansion by FY23E and despite factoring in Capex acceleration towards the Karnataka greenfield plant by late FY25E. Initiate coverage with a BUY rating: We like Nuvoco for its balance sheet turnaround after two mega acquisitions and robust operating performance, led by structural revenue and cost triggers. We initiate coverage on the stock with a BUY rating and target price of INR 827/sh (11x its Sep’23E consolidated EBITDA). In our view, Nuvoco’s continued strong performance should drive valuation multiple rerating. Consolidated Financial Summary YE Mar (INR mn) FY17 FY18 FY19 FY20 FY21 FY22E FY23E FY24E Net Sales 51,570 66,524 70,521 67,932 74,888 103,406 121,974 128,740 EBITDA 7,284 10,663 9,177 12,971 14,605 23,232 28,043 28,257 APAT 1,835 875 (265) 2,493 (259) 5,907 10,634 11,651 Diluted EPS (Rs) 12.2 5.8 (1.3) 10.3 (0.8) 16.5 29.8 32.6 EV / EBITDA (x) 31.7 22.0 25.5 17.9 17.9 9.7 7.8 7.5 EV/MT (Rs bn) 21.3 17.4 17.2 16.6 11.7 9.5 8.8 8.5 RoE (%) 4.5 2.0 (0.5) 4.9 (0.4) 6.7 10.0 10.0 Source: Company, HSIE Research BUY CMP (as on 17 Sep 2021) INR 539 Target Price INR 827 NIFTY 17,585 KEY STOCK DATA Bloomberg code NUVOCO IN No. of Shares (mn) 357 MCap (INR bn) / ($ mn) 192/2,585 6m avg traded value (INR mn) - 52 Week high / low 578/471 STOCK PERFORMANCE (%) 3M 6M 12M Absolute (%) - - - Relative (%) - - - SHAREHOLDING PATTERN (%) 17 Aug-21 Promoters 71.0 FIs & Local MFs 13.0 FPIs 8.9 Public & Others 7.1 Pledged Shares - Source : BSE Pledged shares as % of total shares Rajesh Ravi [email protected]+91-22-6171-7352 Keshav Lahoti [email protected]+91-22-6171-7353
Transcript
20 September 2021 Initiating Coverage
Nuvoco Vistas
Strengthening its leadership position
We initiate coverage on Nuvoco Vistas (Nuvoco) with a BUY rating and a
target price of INR 827/share (11x its consolidated Sep’23E EBITDA). The
company has grown inorganically to become the sixth largest cement
company in India and has consolidated its leadership position in the east. A
large retail presence in the high-growth east region buoyed its operating
margin during FY20-21. It should further expand to INR 1,177/MT in FY23E,
riding on cost initiatives and synergy benefits from the integration of the
recently acquired NU Vista (erstwhile Emami Cements). The recently
concluded IPO has also firmed up Nuvoco’s balance sheet. We expect strong
cash flow to help accelerate the company’s Karnataka expansion plan. Asset
sweating and leverage reduction should bolster return ratios.
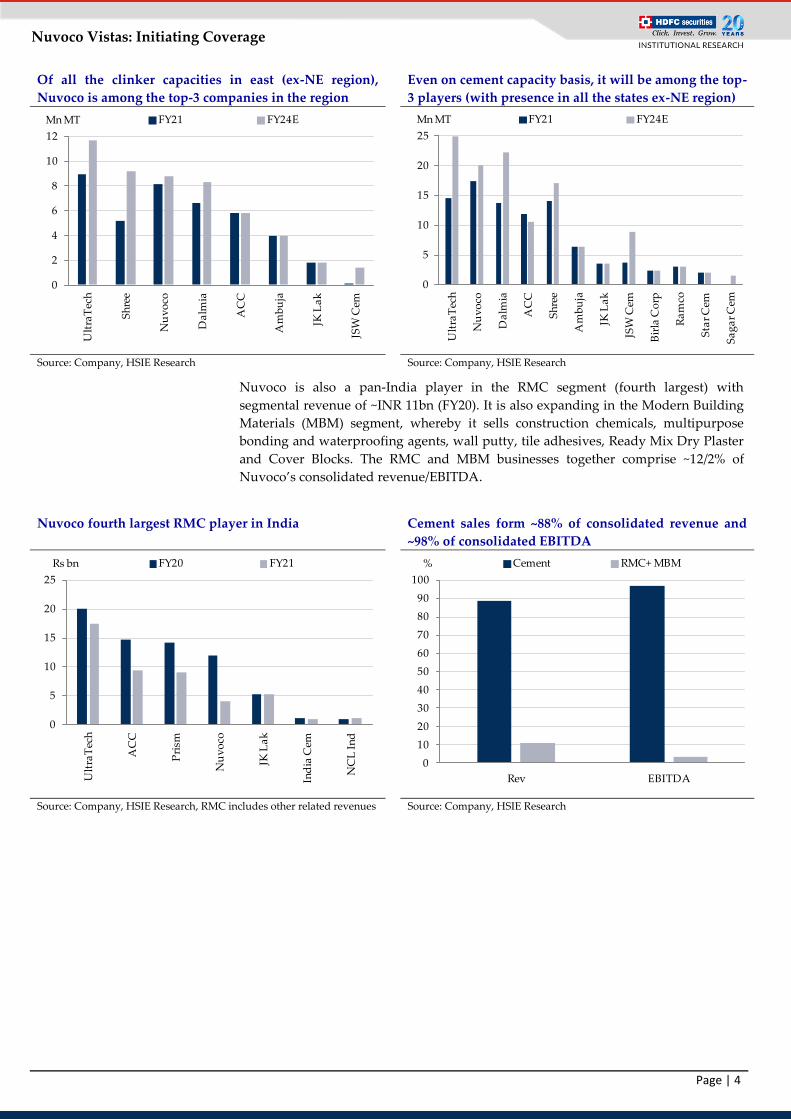
Nuvoco emerges a major player and regional leader in east: Nuvoco soared
to become the sixth largest player in India through two mega acquisitions in
the east – Lafarge Cement (India) in 2016 and NU Vista (Emami Cement
before the acquisition) in 2020. These moves consolidated its position as one
of the top-3 sellers in the eastern region. Nuvoco’s Duraguard and Concreto
brands have enjoyed premium positioning in the east for a long time.
Multiple triggers to bolster operating margin: Nuvoco has recently added
WHRS and is also expanding its CPPs, to bolster its low-cost power
consumption share to ~70% from 50% in FY21, adding ~INR 50/MT in cost
savings. The integration of the recently acquired NU Vista into Nuvoco,
along with focus on further expanding its blended cement production ratio,
is expected to unlock another ~INR 200/MT of unitary EBITDA by FY23E.
These moves alongwith healthy pricing should drive up consolidated
unitary EBITDA by ~INR 235/MT by FY23E, despite factoring in fuel cost
inflation and the impact of accelerated capacity additions by competitors.
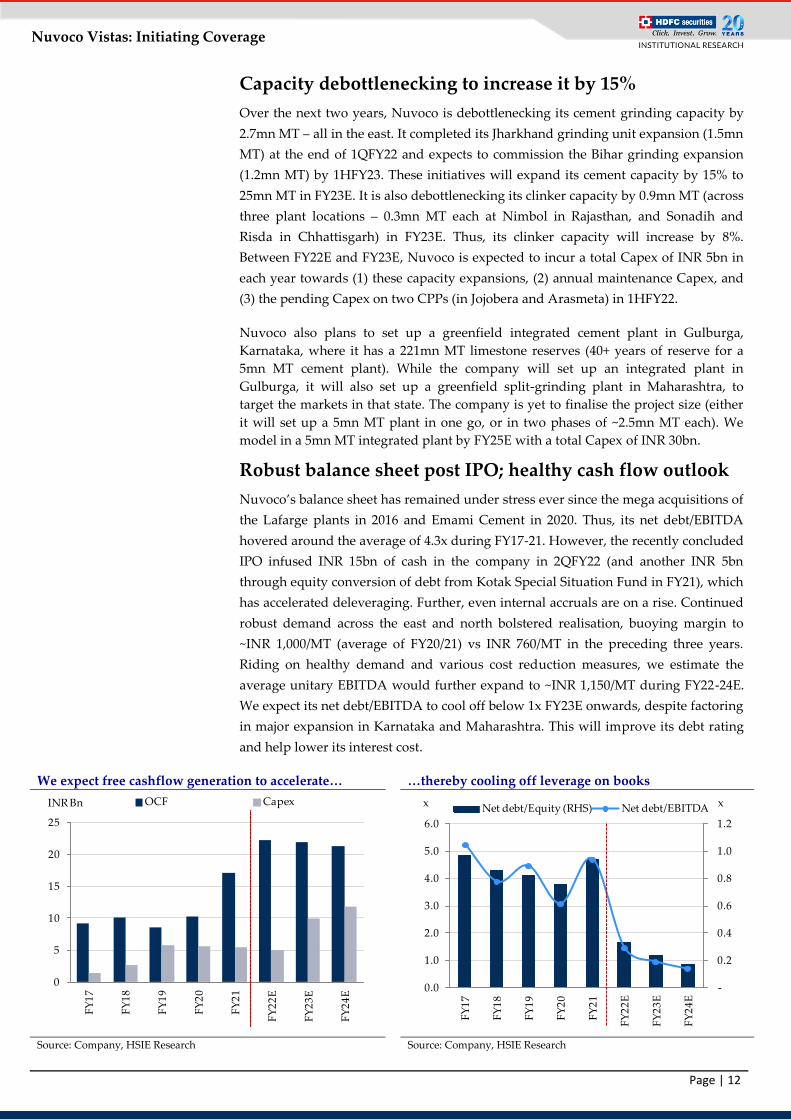
Balance sheet back in shape, post IPO: Nuvoco’s leverage ratio got
stretched, owing to the two mega acquisitions. However, with large INR
15bn equity infusion from the just concluded IPO, strong operating cash
flow outlook, and lower Capex outgo, we estimate its net debt/EBITDA to
cool off to below 1x FY23E onwards vs ~4x during FY17-21. We estimate its
debt reduction to continue despite its ongoing 8/15% clinker/cement
expansion by FY23E and despite factoring in Capex acceleration towards the
Karnataka greenfield plant by late FY25E.
Initiate coverage with a BUY rating: We like Nuvoco for its balance sheet
turnaround after two mega acquisitions and robust operating performance,
led by structural revenue and cost triggers. We initiate coverage on the stock
with a BUY rating and target price of INR 827/sh (11x its Sep’23E
consolidated EBITDA). In our view, Nuvoco’s continued strong
performance should drive valuation multiple rerating.
Consolidated Financial Summary
YE Mar (INR mn) FY17 FY18 FY19 FY20 FY21 FY22E FY23E FY24E
Net Sales 51,570 66,524 70,521 67,932 74,888 103,406 121,974 128,740
We, Rajesh Ravi, MBA & Keshav Lahoti, CA, authors and the names subscribed to this report, hereby certify that all of the views expressed in this research
report accurately reflect our views about the subject issuer(s) or securities. HSL has no material adverse disciplinary history as on the date of publication of this
report. We also certify that no part of our compensation was, is, or will be directly or indirectly related to the specific recommendation(s) or view(s) in this
report.
Research Analyst or his/her relative or HDFC Securities Ltd. does not have any financial interest in the subject company. Also Research Analyst or his relative
or HDFC Securities Ltd. or its Associate may have beneficial ownership of 1% or more in the subject company at the end of the month immediately preceding
the date of publication of the Research Report. Further Research Analyst or his relative or HDFC Securities Ltd. or its associate does not have any material
conflict of interest.
Any holding in stock –No
HDFC Securities Limited (HSL) is a SEBI Registered Research Analyst having registration no. INH000002475.
Disclaimer:
This report has been prepared by HDFC Securities Ltd and is solely for information of the recipient only. The report must not be used as a singular basis of any
investment decision. The views herein are of a general nature and do not consider the risk appetite or the particular circumstances of an individual investor;
readers are requested to take professional advice before investing. Nothing in this document should be construed as investment advice. Each recipient of this
document should make such investigations as they deem necessary to arrive at an independent evaluation of an investment in securities of the companies
referred to in this document (including merits and risks) and should consult their own advisors to determine merits and risks of such investment. The
information and opinions contained herein have been compiled or arrived at, based upon information obtained in good faith from sources believed to be
reliable. Such information has not been independently verified and no guaranty, representation of warranty, express or implied, is made as to its accuracy,
completeness or correctness. All such information and opinions are subject to change without notice. Descriptions of any company or companies or their
securities mentioned herein are not intended to be complete. HSL is not obliged to update this report for such changes. HSL has the right to make changes and
modifications at any time.
This report is not directed to, or intended for display, downloading, printing, reproducing or for distribution to or use by, any person or entity who is a citizen
or resident or located in any locality, state, country or other jurisdiction where such distribution, publication, reproduction, availability or use would be
contrary to law or regulation or what would subject HSL or its affiliates to any registration or licensing requirement within such jurisdiction.
If this report is inadvertently sent or has reached any person in such country, especially, United States of America, the same should be ignored and brought to
the attention of the sender. This document may not be reproduced, distributed or published in whole or in part, directly or indirectly, for any purposes or in
any manner.
Foreign currencies denominated securities, wherever mentioned, are subject to exchange rate fluctuations, which could have an adverse effect on their value or
price, or the income derived from them. In addition, investors in securities such as ADRs, the values of which are influenced by foreign currencies effectively
assume currency risk. It should not be considered to be taken as an offer to sell or a solicitation to buy any security.
This document is not, and should not, be construed as an offer or solicitation of an offer, to buy or sell any securities or other financial instruments. This report
should not be construed as an invitation or solicitation to do business with HSL. HSL may from time to time solicit from, or perform broking, or other services
for, any company mentioned in this mail and/or its attachments.
HSL and its affiliated company(ies), their directors and employees may; (a) from time to time, have a long or short position in, and buy or sell the securities of
the company(ies) mentioned herein or (b) be engaged in any other transaction involving such securities and earn brokerage or other compensation or act as a
market maker in the financial instruments of the company(ies) discussed herein or act as an advisor or lender/borrower to such company(ies) or may have any
other potential conflict of interests with respect to any recommendation and other related information and opinions.
HSL, its directors, analysts or employees do not take any responsibility, financial or otherwise, of the losses or the damages sustained due to the investments
made or any action taken on basis of this report, including but not restricted to, fluctuation in the prices of shares and bonds, changes in the currency rates,
diminution in the NAVs, reduction in the dividend or income, etc.
HSL and other group companies, its directors, associates, employees may have various positions in any of the stocks, securities and financial instruments dealt
in the report, or may make sell or purchase or other deals in these securities from time to time or may deal in other securities of the companies / organizations
described in this report.
HSL or its associates might have managed or co-managed public offering of securities for the subject company or might have been mandated by the subject
company for any other assignment in the past twelve months.
HSL or its associates might have received any compensation from the companies mentioned in the report during the period preceding twelve months from the
date of this report for services in respect of managing or co-managing public offerings, corporate finance, investment banking or merchant banking, brokerage
services or other advisory service in a merger or specific transaction in the normal course of business.
HSL or its analysts did not receive any compensation or other benefits from the companies mentioned in the report or third party in connection with
preparation of the research report. Accordingly, neither HSL nor Research Analysts have any material conflict of interest at the time of publication of this
report. Compensation of our Research Analysts is not based on any specific merchant banking, investment banking or brokerage service transactions. HSL may
have issued other reports that are inconsistent with and reach different conclusion from the information presented in this report.
Research entity has not been engaged in market making activity for the subject company. Research analyst has not served as an officer, director or employee of
the subject company. We have not received any compensation/benefits from the subject company or third party in connection with the Research Report.
HDFC securities Limited, I Think Techno Campus, Building - B, "Alpha", Office Floor 8, Near Kanjurmarg Station, Opp. Crompton Greaves, Kanjurmarg


![INDEX []...Bhiwani (Haryana). These cement manufacturing units were commissioned in October, 2013. (ii) Brief description of nature of the project M/s. Nuvoco Vistas Corp. Ltd. (Formerly](https://static.documents.pub/doc/80x56/5eb37acbc62680342b5179eb/index-bhiwani-haryana-these-cement-manufacturing-units-were-commissioned.jpg)


