88
2002-03 Washington State Tuition and Fee Report January 2003
2002-03 Washington State Tuition and Fee Report January 2003

1
2002-03 Washington State Tuition and Fee Report
Table of Contents Page Executive Summary ............................................................................................................... i Chapter 1: 2002-03 Washington State Tuition and Fees .............................................. 1
National Comparison Western States Comparison (WICHE) Peer Institution Comparison
Chapter 2: Washington’s Tuition and Fee Structure .................................................... 17 Components of Tuition and Fees Comparison of Tuition to Total Cost of Instruction Amount of Tuition Revenue Generated Tuition at Washington’s Technical Colleges
Chapter 3: Tuition History in Washington State .......................................................... 20 Historical Overview Tuition Increases Over Time Tuition Changes in 2002-03
Chapter 4: Tables ................................................................................................................. 27 National Comparison Western States Comparison (WICHE) Peer Institution Comparison
University of Washington Peer Groups Washington State University Peer Groups The Evergreen State College Peer Groups
Appendices Data Methods ................................................................................................Appendix A Washington State Tuition and Fees by Institution......................................Appendix B Participating Public Colleges and Universities .........................................Appendix C

iii
University of Washington
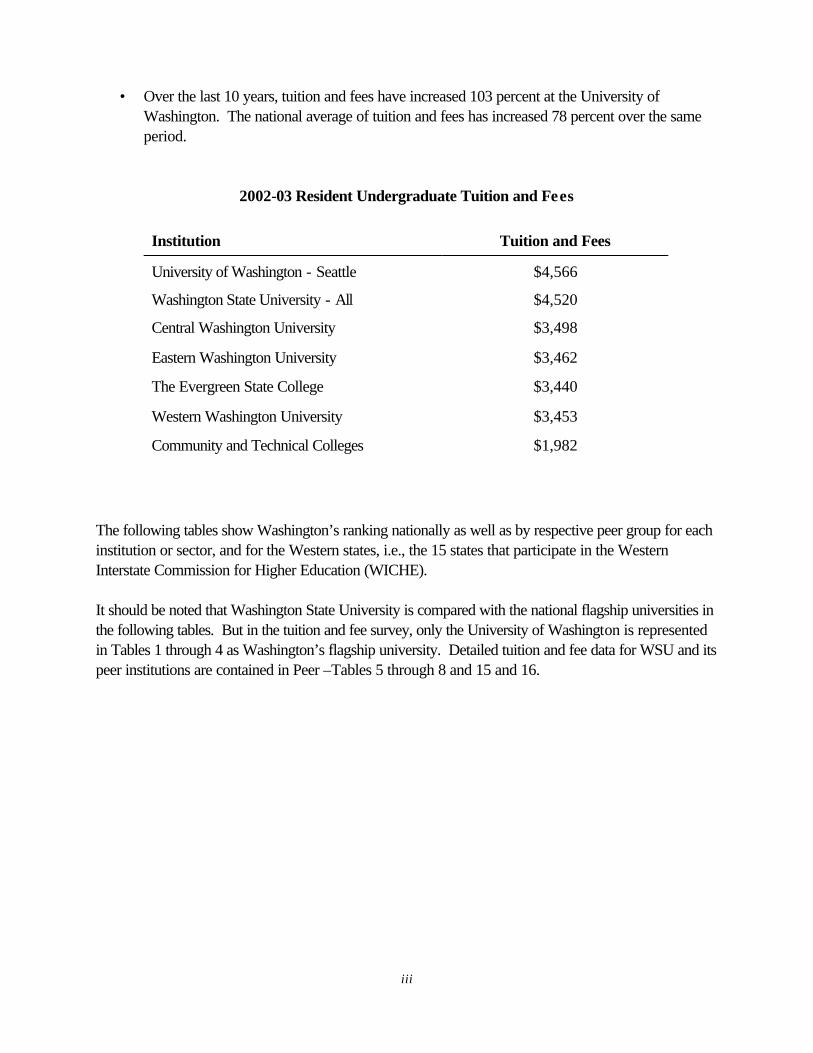
2002-03 Resident Undergraduate Tuition and Fees
Tuition 2002-03
UW rank
UW
$4,566
National average
$4,675
21st
WICHE average
$3,522
1st of 15
Peer average
$5,175
13th of 25
Note: Tuition includes operating and building fee plus mandatory fees.
Washington State University 2002-03 Resident Undergraduate Tuition and Fees
Tuition
2002-03
WSU rank WSU
$4,520
National average
$4,675
21st
WICHE average
$3,522
1st of 15
Peer average
$4,776
10th of 23
Note: Tuition includes operating and building fee plus mandatory fees.

iii
University of Washington
2002-03 Resident Undergraduate Tuition and Fees
Tuition 2002-03
UW rank
UW
$4,566
National average
$4,675
21st
WICHE average
$3,522
1st of 15
Peer average
$5,175
13th of 25
Note: Tuition includes operating and building fee plus mandatory fees.
Washington State University 2002-03 Resident Undergraduate Tuition and Fees
Tuition
2002-03
WSU rank WSU
$4,520
National average
$4,675
21st
WICHE average
$3,522
1st of 15
Peer average
$4,776
10th of 23
Note: Tuition includes operating and building fee plus mandatory fees.

iv
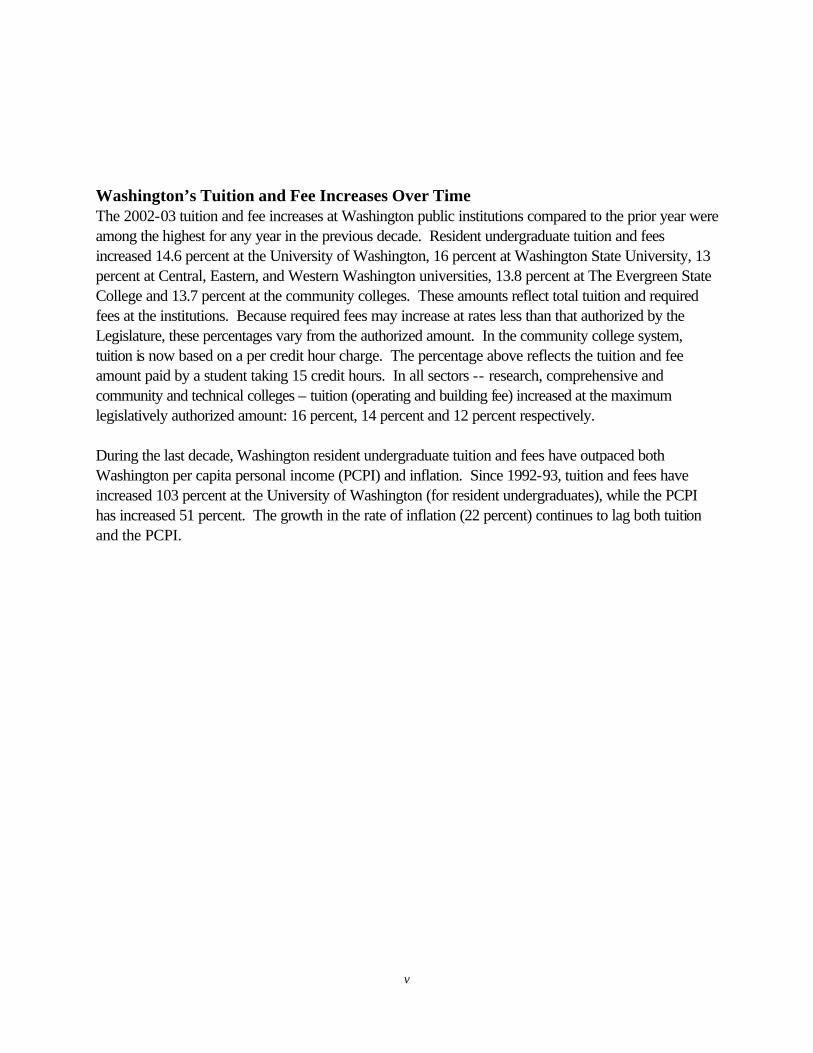
Washington Comprehensive Universities 2002-03 Resident Undergraduate Tuition and Fees
Tuition
2002-03 Comprehensive
rank Washington comprehensives
$3,471
National average
$3,718
28th
WICHE average
$2,967
4th of 15
Peer average
*
*
*National average is based on 214 institutions that have been used for more than 30 years, and this average also serves as the comprehensive peer average. (For comparison purposes, The Evergreen State College tuition and fees rate for 2002-03 is $3,440.) Note: Tuition includes operating and building fee plus mandatory fees.
Washington Community and Technical Colleges 2002-03 Resident Tuition and Fees
Tuition
2002-03 Community and
technical college rank Washington community and technical colleges
$1,982
National average
$1,957
23rd
WICHE average
$1,584
5th of 15
Peer average
*
*
*49-state average serves as the peer group for the community and technical colleges (South Dakota has no community colleges). Note: Tuition includes operating and building fee plus mandatory fees.
v
Washington’s Tuition and Fee Increases Over Time The 2002-03 tuition and fee increases at Washington public institutions compared to the prior year were among the highest for any year in the previous decade. Resident undergraduate tuition and fees increased 14.6 percent at the University of Washington, 16 percent at Washington State University, 13 percent at Central, Eastern, and Western Washington universities, 13.8 percent at The Evergreen State College and 13.7 percent at the community colleges. These amounts reflect total tuition and required fees at the institutions. Because required fees may increase at rates less than that authorized by the Legislature, these percentages vary from the authorized amount. In the community college system, tuition is now based on a per credit hour charge. The percentage above reflects the tuition and fee amount paid by a student taking 15 credit hours. In all sectors -- research, comprehensive and community and technical colleges – tuition (operating and building fee) increased at the maximum legislatively authorized amount: 16 percent, 14 percent and 12 percent respectively. During the last decade, Washington resident undergraduate tuition and fees have outpaced both Washington per capita personal income (PCPI) and inflation. Since 1992-93, tuition and fees have increased 103 percent at the University of Washington (for resident undergraduates), while the PCPI has increased 51 percent. The growth in the rate of inflation (22 percent) continues to lag both tuition and the PCPI.

Washington Higher Education Coordinating Board
2002-03 WASHINGTON STATE TUITION AND FEE REPORT
January 2003
CHAPTER 1: 2002-03 WASHINGTON STATE TUITION AND FEES
As part of its yearly analysis of tuition and fees, HECB staff conducts an annual survey of tuition and fee rates at public colleges and universities in all 50 states to determine how Washington State tuition and fees compare both nationally and with other Western states. In addition, staff examines how tuition and fees at individual Washington institutions compare with tuition and fees charged by their respective “peer” institutions. In 1988, a joint legislative and executive study group, in consultation with the HECB, adopted a national comparison “peer” group for each of the following: (1) the University of Washington (flagship), (2) Washington State University, (3) comprehensive institutions, which include Central, Eastern and Western Washington universities, (4) The Evergreen State College, and (5) the Washington community and technical college system. For a more detailed description of the peer group selection, see page 13. Undergraduate tuition and fees for comprehensive institutions are based on data from 214 public colleges and universities. Graduate tuition and fees are based on data from the same group of public colleges and universities, although not all offer graduate programs. Required fees are fees paid by all full-time students and do not include any optional fees, such as parking or health care, unless they are paid by all full-time students. Following is a summary of how 2002-03 tuition and fees at Washington colleges and universities compare with all 50 states, with other Western states, and with peer institutions. National Comparison To better understand how Washington tuition and fee rates compare nationally, HECB staff looked at three categories: (1) flagship universities, (2) comprehensive colleges and state universities, and (3) community colleges. The following summary tables provide an overview of the relationship of tuition and fee rates at Washington colleges and universities to national averages. Tables also graph this year’s percentage increases in resident undergraduate tuition and fee rates for each state. For more detailed analysis by category and a national perspective over the last five years, see the tables in Section IV (National Tables 1-10). Tables 1 through 4 represent tuition and fee rates at the public flagship university in each state. Tables 5 through 8 represent the average tuition and fees for a selected set of comprehensive colleges and universities in all 50 states. Washington institutions represented in this sector include


2002-03 Washington State Tuition and Fee Report Page 2
Central Washington University, Eastern Washington University and Western Washington University. (The Evergreen State College is compared with its own set of peer institutions in Peer Tables 17 through 20. It is presented in the following table for comparison to the comprehensive peer group). The comprehensive colleges and universities peer group, created in 1969, is composed of 214 institutions reporting undergraduate tuition and fees and 192 of those reporting graduate tuition and fees. Although not all public institutions are included in this survey, the averages and changes over time with the same set of institutions offer consistency, while the large number of institutions provides a close approximation of state averages. Tables 9 and 10 display state averages for community colleges.
2002-03 Washington Tuition And Fee Rates Compared With National Averages
2002-03 Undergraduate Graduate Resident Nonresident Resident Nonresident University of Washington $4,566 $15,267 $6,688 $15,775 National Average $4,675 $13,250 $5,171 $12,875 Dollar Difference - $109 $2,017 $1,517 $2,900 Percent +/- National Average -2.3% 15.2% 29.3% 22.5% Undergraduate Graduate Resident Nonresident Resident Nonresident Washington State University $4,520 $12,270 $6,088 $14,918 National Average $4,675 $13,250 $5,171 $12,875 Dollar Difference - $155 - $980 $917 $2,043 Percent +/- National Average -3.3% -7.4% 17.7% 15.9% Undergraduate Graduate Resident Nonresident Resident Nonresident Washington Comprehensive Institutions (CWU, EWU & WWU) $3,471 $11,626 $5,250 $15,688 National Average(N=215) $3,718 $9,594 $4,074 $9,593 Dollar Difference - $247 $2,032 $1,176 $6,095 Percent +/- National Average -6.6% 21.2% 28.9% 63.5% The Evergreen State College $3,440 $12,264 $5,519 $16,828 National Average(N=215) $3,718 $9,594 $4,074 $9,593 Dollar Difference $278 $2,670 $1,445 $7,235 Percent +/- National Average 7.5% 40.5% 35.5% 75.4% Undergraduate Resident Nonresident Community Colleges $1,982 $7,191 National Average(N=48) $1,957 $5,326 Dollar Difference $25 $1,865 Percent +/- National Average 1.3% 35.0%
2002-03 Washington State Tuition and Fee Report Page 3
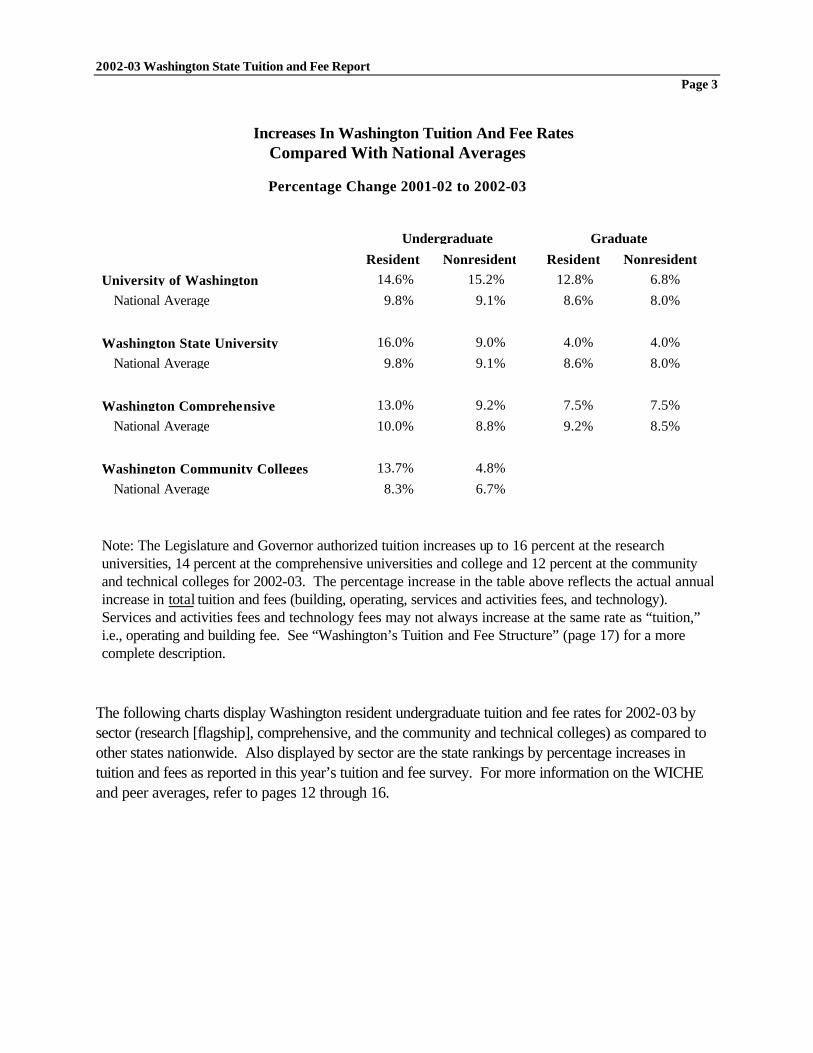
Increases In Washington Tuition And Fee Rates Compared With National Averages
Percentage Change 2001-02 to 2002-03
Undergraduate Graduate Resident Nonresident Resident Nonresident University of Washington 14.6% 15.2% 12.8% 6.8% National Average 9.8% 9.1% 8.6% 8.0%
Washington State University 16.0% 9.0% 4.0% 4.0% National Average 9.8% 9.1% 8.6% 8.0%
Washington Comprehensive 13.0% 9.2% 7.5% 7.5% National Average 10.0% 8.8% 9.2% 8.5%
Washington Community Colleges 13.7% 4.8% National Average 8.3% 6.7%
Note: The Legislature and Governor authorized tuition increases up to 16 percent at the research universities, 14 percent at the comprehensive universities and college and 12 percent at the community and technical colleges for 2002-03. The percentage increase in the table above reflects the actual annual increase in total tuition and fees (building, operating, services and activities fees, and technology). Services and activities fees and technology fees may not always increase at the same rate as “tuition,” i.e., operating and building fee. See “Washington’s Tuition and Fee Structure” (page 17) for a more complete description.
The following charts display Washington resident undergraduate tuition and fee rates for 2002-03 by sector (research [flagship], comprehensive, and the community and technical colleges) as compared to other states nationwide. Also displayed by sector are the state rankings by percentage increases in tuition and fees as reported in this year’s tuition and fee survey. For more information on the WICHE and peer averages, refer to pages 12 through 16.

2002-03 Washington State Tuition and Fee Report Page 4
Resident Undergraduate Tuition and Fees 2002-03 Research Universities University of Washington (flagship):
• The University of Washington ranks 21st nationally in the amount of tuition and fees charged to resident undergraduates. (The state with the highest tuition and fees would rank number 1.) The tuition and fee increase at the UW this year was the 8th highest percentage increase in the country.
o The UW increased resident undergraduate tuition and fees 14.6 percent in 2002-03; the national average increased 9.8 percent.
o In 2002-03, 17 states increased tuition and fees 10 percent or more as compared to seven states in 2001-02.
o Four states increased tuition and fees more than 20 percent, and four states increased tuition and fees three percent or less.
Note: UW is considered the “flagship” university” and is used for the national flagship university comparison in the tuition survey. Tuition and fees for WSU are reported in the Peer-Tables 5 through 8 and 15 and 16.
Washington State University:
• Washington State University also ranks 21st nationally in the amount of tuition and fees charged to resident undergraduates if compared to the national flagship universities. The tuition and fee increase at the WSU this year was the 8th highest percentage increase nationally for flagship universities.
o WSU increased resident undergraduate tuition and fees 16 percent in 2002-03; the national average increased 9.8 percent.
Comprehensive Universities (Central, Eastern, and Western Washington Universities)
• Washington’s comprehensive institutions rank 28th nationally in the amount of tuition and fees charged to resident undergraduates. The tuition and fee increase at Washington’s comprehensive institutions was the 12th highest in the country.
• Washington comprehensive institutions increased resident undergraduate tuition and fees 13 percent in 2002-03; the national average increased 10 percent.
• In 2002-03, 18 states increased tuition and fees 10 percent or more as compared to nine states in 2001-02.
• Two states increased tuition and fees more than 20 percent and one state increased tuition and fees 3 percent or less.
• The Evergreen State College ranks comparably if compared to the comprehensive universities nationally. Evergreen’s peer data is offered in Peer – Tables 17 through 20.

2002-03 Washington State Tuition and Fee Report Page 5
Washington’s Community and Technical Colleges
• Washington’s community and technical colleges rank 23rd nationally in the amount of tuition and fees charged to resident undergraduates. The tuition and fee increase at Washington’s community and technical colleges was the 5th highest in the country.
• Washington community and technical colleges increased resident undergraduate tuition and fees 13.7 percent in 2002-03; the national average increased 8.3 percent.
• In 2002-03, 14 states increased tuition and fees 10 percent or more as compared to 10 states in 2001-02.
• Two states increased tuition and fees more than 20 percent, and six states increased tuition and fees 3 percent or less.

2002-03 Washington State Tuition and Fee Report Page 6
University of Washington resident undergraduate tuition ranks 21st nationally, 2002-03
$8,994$8,382
$8,130$7,485
$7,308$6,704
$6,482$6,280
$6,154$5,854
$5,670$5,640
$5,552$5,550
$5,454$5,340$5,315
$5,175$4,984
$4,850$4,675
$4,595$4,566
$4,456$4,423$4,359
$4,201$4,191$4,176$4,125
$4,056$3,974$3,916$3,872$3,856
$3,662$3,616$3,595$3,566$3,556$3,536$3,522$3,484
$3,349$3,325
$3,240$3,206$3,170
$3,044$2,997
$2,583$2,581
$2,370
$0 $1,000 $2,000 $3,000 $4,000 $5,000 $6,000 $7,000 $8,000 $9,000 $10,000
VermontPennsylvania
New HampshireMichigan
New JerseyIllinois
MassachusettsMinnesota
ConnecticutRhode Island
MarylandDelawareMissouri
MaineOhio
TexasIndiana
Peer AverageSouth Carolina
New YorkNational Average
VirginiaWASHINGTON
ArkansasWisconsin
OregonCalifornia
IowaMontana
NebraskaTennessee
KentuckyMississippi
South DakotaNorth CarolinaNorth Dakota
GeorgiaAlaska
ColoradoAlabama
LouisianaWICHE Average
KansasHawaii
UtahWest Virginia
OklahomaNew Mexico
IdahoWyoming
ArizonaFlorida
Nevada

2002-03 Washington State Tuition and Fee Report Page 7
University of Washington resident undergraduate tuition grew by 14.6% (8th highest in the nation) in 2002-03
26.4%24.4%
22.6%20.8%
19.8%19.0%
16.5%14.6%14.5%
13.9%13.6%
13.4%13.3%
12.3%12.3%
11.9%10.6%
10.1%9.9%9.8%9.8%
9.3%9.1%
8.5%8.5%
8.2%8.2%
8.0%8.0%7.9%
7.4%7.2%7.2%7.1%
6.8%6.6%
6.4%6.3%6.2%6.2%
5.8%5.7%5.7%5.6%
4.8%4.2%
3.9%3.8%
3.3%3.0%2.9%
1.9%0.7%
0.0% 5.0% 10.0% 15.0% 20.0% 25.0% 30.0%
TexasMassachusettsSouth Carolina
KansasNorth Carolina
IowaIllinois
WASHINGTONMontana
OhioMissouri
Minnesota*PennsylvaniaNorth Dakota
IndianaIdaho
Peer AverageNebraska
West VirginiaNew Jersey
National AverageUtah
Rhode IslandVirginiaMaine
WisconsinOklahoma
AlabamaMississippiMichigan*
WICHE AverageTennessee
ArkansasOregon
WyomingDelawareKentucky
South DakotaColoradoMarylandGeorgia
New HampshireConnecticut
FloridaNew Mexico
LouisianaArizona
VermontNevadaHawaiiAlaska
CaliforniaNew York

2002-03 Washington State Tuition and Fee Report Page 8
Washington Comprehensive Institutions resident undergraduate tuition ranks 28th nationally, 2002-03
$6,533
$5,995
$5,920$5,532
$5,374
$5,148$4,891
$4,606
$4,556$4,468
$4,340
$4,195$4,153
$4,127
$4,118$4,075
$3,987
$3,970$3,860
$3,773
$3,761
$3,725$3,718
$3,707
$3,531$3,526
$3,491
$3,488$3,471
$3,307
$3,259$3,205
$3,199
$3,060$2,967
$2,856
$2,704$2,691
$2,677
$2,605$2,593
$2,587
$2,583$2,427
$2,377
$2,370$2,222
$1,993
$0 $1,000 $2,000 $3,000 $4,000 $5,000 $6,000 $7,000
New Jersey
New Hampshire
OhioPennsylvania
Vermont
Maryland
MichiganIllinois
Connecticut
IndianaSouth Carolina
Virginia
New YorkMissouri
Iowa
MassachusettsSouth Dakota
Minnesota
MaineOregon
Rhode Island
ArkansasNational Average
Montana
MississippiWisconsin
Tennessee
AlabamaWASHINGTON
North Dakota
TexasKentucky
Nebraska
IdahoWICHE Average
West Virginia
Colorado
FloridaNorth Carolina
Georgia
KansasLouisiana
Arizona
UtahOklahoma
Nevada
New MexicoCalifornia

2002-03 Washington State Tuition and Fee Report Page 9
Washington Comprehensive Institutions resident undergraduate tuition grew by 13% (12th highest in the nation) in 2002-03
23.7%
20.1%
19.7%19.6%
18.7%
17.0%15.0%
14.5%
13.7%13.4%
13.2%
13.0%12.0%
11.5%
11.3%10.7%
10.1%
10.1%10.0%
9.7%
9.5%
9.3%9.2%
9.2%
8.8%8.7%
8.7%
8.2%7.9%
7.8%
7.7%7.7%
7.7%
7.5%7.1%
7.0%
7.0%6.8%
5.5%
5.1%5.1%
4.7%
4.6%3.9%
3.8%
3.4%3.3%
2.1%
0.0% 5.0% 10.0% 15.0% 20.0% 25.0%
Massachusetts
Missouri
IowaTexas
North Carolina
Ohio
MontanaSouth Carolina
North Dakota
New JerseyIndiana
WASHINGTON
IdahoMinnesota
Pennsylvania
KentuckyWest Virginia
Mississippi
National AverageNebraska
Oklahoma
IllinoisVirginia
Connecticut
New MexicoWICHE Average
Michigan
MarylandNew Hampshire
Utah
WisconsinSouth Dakota
Colorado
TennesseeArkansas
Kansas
Alabama
Rhode IslandFlorida
Georgia
CaliforniaVermont
Maine
ArizonaLouisiana
Oregon
NevadaNew York

2002-03 Washington State Tuition and Fee Report Page 10
Waashington Community College resident undergraduate tuition ranks 23rd nationally, 2002-03
$4,429$3,312
$3,049$2,957
$2,902$2,861$2,855
$2,670$2,564
$2,524$2,437
$2,343$2,300$2,285
$2,263$2,208
$2,117$2,099
$2,059$2,040$2,034$2,014
$1,982$1,957
$1,891$1,806
$1,770$1,752$1,752$1,740$1,708
$1,684$1,613
$1,584$1,576$1,575$1,554$1,550$1,547$1,536$1,536
$1,485$1,396$1,365
$1,323$1,304
$1,096$977$977
$768$330
$0 $500 $1,000 $1,500 $2,000 $2,500 $3,000 $3,500 $4,000 $4,500 $5,000
New HampshireVermont
MinnesotaIndiana
WisconsinMassachusetts
New YorkIowa
MarylandNew Jersey
MissouriSouth Carolina
OhioPennsylvaniaNorth Dakota
AlaskaColoradoAlabama
OregonMaine
ConnecticutRhode Island
WASHINGTONNational Average
MontanaDelaware
UtahArkansasMichigan
TennesseeWest Virginia
IllinoisOklahoma
WICHE AverageFlorida
WyomingKansasGeorgia
IdahoKentuckyNebraskaLouisiana
MississippiNevadaHawaii
VirginiaNorth Carolina
ArizonaTexas
New MexicoCalifornia

2002-03 Washington State Tuition and Fee Report Page 11
Washington Community College resident undergraduate tuition grew by 13.7% (5th highest in the nation) in 2002-03
26.2%25.5%
17.2%16.6%
13.7%13.7%
12.5%10.9%10.9%10.8%
10.5%10.2%
10.1%10.0%
9.3%9.2%9.2%
8.9%8.6%
8.3%7.7%7.6%7.5%
7.0%6.9%
6.6%6.5%6.3%
6.1%6.0%5.9%5.9%5.8%
5.6%5.2%5.1%4.9%4.9%
4.5%4.3%
4.0%3.8%
3.4%3.3%3.2%
2.8%1.5%
0.6%0.1%0.0%0.0%
0.0% 5.0% 10.0% 15.0% 20.0% 25.0% 30.0%
South CarolinaMassachusetts
New HampshireArkansas
WASHINGTONIndianaVirginia
North DakotaMinnesotaWisconsin
North CarolinaIowa
MissouriIdaho
MarylandMississippi
TexasUtah
Rhode IslandNational Average
ConnecticutOhio
KansasTennessee
AlabamaIllinois
OregonWICHE Average
OklahomaVermont
KentuckyColoradoLouisianaDelaware
New JerseyArizona
WyomingWest Virginia
MichiganGeorgia
MontanaNebraska
NevadaFlorida
New MexicoAlaska
PennsylvaniaNew York
HawaiiCalifornia
Maine

2002-03 Washington State Tuition and Fee Report Page 12
Western States Comparison HECB staff compared tuition and fees at Washington public colleges and universities with those at public colleges and universities in 14 other Western states. Like Washington, these states are members of the Western Interstate Commission for Higher Education (WICHE). They include Alaska, Arizona, California, Colorado, Hawaii, Idaho, Montana, Nevada, New Mexico, North Dakota, Oregon, South Dakota, Utah, Washington and Wyoming. The summary table and graph below compares Washington tuition and fee rates with those of other WICHE states. Please note that the comprehensive universities include Central, Eastern and Western Washington universities. The Evergreen State College (TESC) is represented within its own peer group and, consequently, is represented in the Peer Institution Comparison section. TESC is presented separately in the graph for information. For more detailed analysis, see the tables in Section IV in this report (WICHE States Tables 1-10). Tables 1 through 8 display historical and current tuition and required fee rates for full-time undergraduate and graduate students at public four-year colleges and universities in the Western states. Tables 9 and 10 display the average tuition and fee rates for community colleges in each Western state.
Washington Tuition and Fee Rates Compared with WICHE States 2002-03
Undergraduate Graduate Resident Nonresident Resident Nonresident
University of Washington $4,566 $15,267 $6,688 $15,775 WICHE Average $3,522 $11,632 $4,163 $11,377 Dollar Difference $1,044 $3,635 $2,525 $4,398 Percent +/- WICHE Average 29.6% 31.3% 60.7% 38.7% Washington State University
$4,520
$12,270
$6,088
$14,918
WICHE Average $3,522 $11,632 $4,163 $11,377 Dollar Difference $998 $638 $1,925 $3,541 Percent +/- WICHE Average 28.3% 5.5% 46.2% 31.1% Washington Comprehensive Institutions
$3,471
$11,626
$5,250
$15,688
WICHE Average (N=38) $2,967 $9,496 $3,466 $10,135 Dollar Difference $504 $2,130 $1,784 $5,553 Percent +/- WICHE Average 17.0% 22.4% 51.5% 54.8% Washington Community Colleges
$1,982
$7,191
WICHE Average (N=14) $1,584 $5,212 Dollar Difference $398 $1,979 Percent +/- WICHE Average 25.1% 38.0%
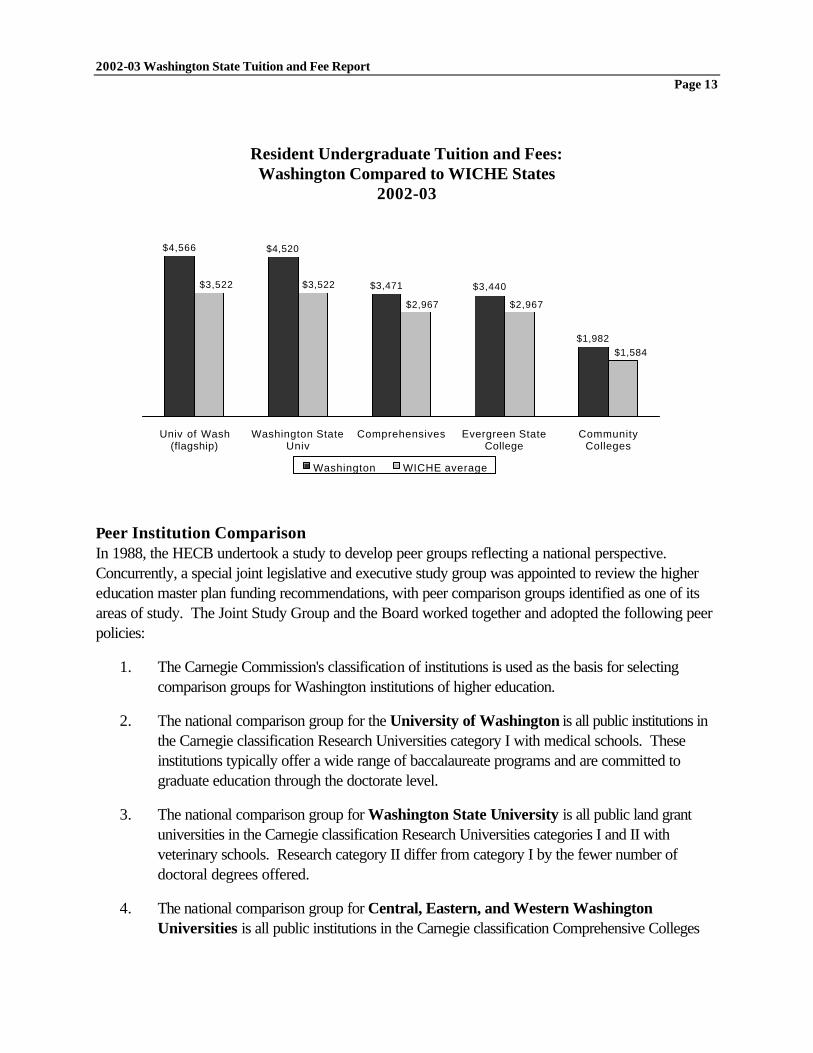
2002-03 Washington State Tuition and Fee Report Page 13
$4,520
$3,471 $3,440
$1,982
$4,566
$1,584
$2,967$2,967
$3,522$3,522
$-
$1,000
$2,000
$3,000
$4,000
$5,000
$6,000
Univ of Wash(flagship)
Washington StateUniv
Comprehensives Evergreen StateCollege
CommunityColleges
Washington WICHE average
Resident Undergraduate Tuition and Fees: Washington Compared to WICHE States
2002-03 Peer Institution Comparison In 1988, the HECB undertook a study to develop peer groups reflecting a national perspective. Concurrently, a special joint legislative and executive study group was appointed to review the higher education master plan funding recommendations, with peer comparison groups identified as one of its areas of study. The Joint Study Group and the Board worked together and adopted the following peer policies: 1. The Carnegie Commission's classification of institutions is used as the basis for selecting
comparison groups for Washington institutions of higher education. 2. The national comparison group for the University of Washington is all public institutions in
the Carnegie classification Research Universities category I with medical schools. These institutions typically offer a wide range of baccalaureate programs and are committed to graduate education through the doctorate level.
3. The national comparison group for Washington State University is all public land grant
universities in the Carnegie classification Research Universities categories I and II with veterinary schools. Research category II differ from category I by the fewer number of doctoral degrees offered.
4. The national comparison group for Central, Eastern, and Western Washington
Universities is all public institutions in the Carnegie classification Comprehensive Colleges

2002-03 Washington State Tuition and Fee Report Page 14
and Universities category I. These institutions typically offer a wide range of baccalaureate programs and are committed to graduate education through the master’s degree.
5. The national comparison group for the Washington community college system is all state
community college systems. In 1990, the HECB adopted a peer group for The Evergreen State College using the Carnegie Commission classification of institutions. The Board screened a composite category of public institutions in the Comprehensive I and Liberal Arts II classification. (Institutions in the Liberal Arts II classification are primarily undergraduate colleges with major emphasis on baccalaureate programs.) The selected peer institutions were also based on size, similarities of degrees awarded, and other characteristics common to The Evergreen State College. The summary table on the following page shows tuition and fee rates at Washington public colleges and universities compared to those of their respective peer groups. For more detailed analysis, see the tables in Section IV of this report. Peers Tables 1 through 20 display peer groups for the University of Washington, Washington State University and The Evergreen State College. Peer groups for Washington comprehensive institutions, with the exception of The Evergreen State College, are represented in National Tables 5 through 8. Washington community colleges are represented in National Tables 9 and 10 Also included in the peer comparison section (Peers Tables 9 through 16) are tuition and fee data for the University of Washington’s professional programs of medical, dental, and law. Tables 15 and 16 display veterinary medicine tuition and fee rates for Washington State University and its national peer group.

2002-03 Washington State Tuition and Fee Report Page 15
Washington Tuition and Fee Rates Compared to Peer Institutions
2002-03
Undergraduate Graduate Medical Dental Res Nonres Res Nonres Res Nonres Res Nonres University of Washington $4,566 $15,267 $6,688 $15,775 $11,351 $27,477 $11,351 $27,477 Peer Average $5,175 $15,273 $6,123 $14,970 $14,676 $29,913 $14,114 $29,553 Dollar Difference - $609 - $6 $565 $805 - $3,325 - $2,436 - $2,763 - $2,076 Percent +/- Peer Average -11.8% 0.0% 9.2% 5.4% -22.7% -8.1% -19.6% -7.0% Undergraduate Graduate Veterinary Res Nonres Res Nonres Res Nonres Washington State University $4,520 $12,270 $6,088 $14,918 $11,056 $10,194 Peer Average $4,776 $13,643 $5,353 $13,068 $10,566 $24,799 Dollar Difference - $256 - $1,373 $735 $1,850 $490 - $14,605 Percent +/- Peer Average -5.4% -10.1% 13.7% 14.2% 4.6% -58.9% Undergraduate Graduate Res Nonres Res Nonres Central, Eastern, Western Washington universities $3,471 $11,626 $5,250 $15,688 Peer Average $3,718 $9,594 $4,074 $9,593 Dollar Difference - $247 $2,032 $1,176 $6,095 Percent +/- Peer Average -6.6% 21.2% 28.9% 63.5% Undergraduate Graduate Res Nonres Res Nonres The Evergreen State College $3,440 $12,264 $5,519 $16,828 Peer Average $4,437 $10,988 $4,695 $10,532 Dollar Difference - $997 $1,276 $824 $6,296 Percent +/- Peer Average -22.5% 11.6% 17.5% 59.8% Undergraduate Res Nonres Community Colleges $1,982 $7,191 Peer Average $1,957 $5,326 Dollar Difference $25 $1,865 Percent +/- Peer Average 1.3% 35.0%

2002-03 Washington State Tuition and Fee Report Page 16
$5,175
$4,776$4,437
$3,718
$1,982
$3,471$3,440
$4,520$4,566
$1,957
$-
$1,000
$2,000
$3,000
$4,000
$5,000
$6,000
University ofWashington
Washington StateUniversity
The EvergreenState College
Comprehensives CommunityColleges
Washington Peer Average
Resident Undergraduate Tuition and Fees: Washington Compared to Peer Averages
2002-03

2002-03 Washington State Tuition and Fee Report Page 17
CHAPTER 2: WASHINGTON’S TUITION AND FEE STRUCTURE Components of Tuition and Fees Often the phrase "tuition and fees" is used to refer to the charges that all students pay to attend a college or university. At Washington colleges and universities, "tuition and fees" includes operating fees, building fees, services and activities fees, and technology fees. The actual "tuition" portion, as outlined in statute, includes operating fees and building fees. In this report, the word "tuition" refers to all major types of fees (operating, building, services and activities, and technology fees). However, for legislation, which specifies “tuition,” as is the case currently where allowable tuition increases are specified in statute, tuition refers only to the total of operating and building fees combined. Operating Fee The operating fee represents 80 to 90 percent of tuition and fees and primarily funds instructional activities of the institution. Building Fee The building fee, which comprises 3 percent to 10 percent of tuition and fees, is used to fund building projects and retire bonds. During most of the past decade, the building fee portion of tuition was a fixed dollar amount set in statute. While operating fees increased, the building fee did not. Legislative changes in 1993 provided for increases in the amount of tuition dedicated to building fees. In 1995-96, the building fee became a percentage of total tuition and fees, rather than a fixed amount and, consequently, increased as overall tuition increased.1 Services and Activities Fee The services and activities fee (S&A), which represents 8 percent to 12 percent of tuition and fees, funds non-instructional student activities and programs, including some bond repayments for student-support facilities. S&A fees may increase each year, if the services and activities fee committee at an institution initiates a request. However, the S&A rate increases may not exceed tuition rate increases for the applicable tuition category.2 Technology Fee In 1996, the Legislature also authorized the public four-year institutions to impose technology fees of up to $120 per year. Four institutions, including the University of Washington, Western Washington University, Central Washington University, and Eastern Washington University, now charge this fee, but no institution is currently at the maximum allowed in statute. Although capped at $120, the technology
1 RCW 28B.15.069. 2 RCW 28B.15.069.

2002-03 Washington State Tuition and Fee Report Page 18
fee may be adjusted or abolished with approval of the student government association and the institutional governing board.3 Currently, this fee represents 3 percent, or less of total tuition and fees. The table below illustrates the relationship among the various fees for resident undergraduates. Nonresident tuition and fees – for students who are not residents of Washington – are considerably higher.
Breakdown of Tuition and Fees for
Full-Time Resident Undergraduate Students 2002-03
Tuition
Building Operating
Services & Activities
Technology
Total
University of Washington * $ 209 $ 3,958 $ 288 $ 111 $ 4,566
Washington State University 206 3,939 375 4,520
Central Washington University 121 2,906 396 75 3,498
Eastern Washington University 116 2,860 381 105 3,462
Western Washington University 120 2,907 381 45 3,453
The Evergreen State College 121 2,908 411 3,440
Community Colleges ** 195 1,588 199 1,982
* Applies to UW main campus. Some fees vary slightly at branch campuses.
** Community college full-time tuition is based on 15 credits.
Comparison of Tuition to the Total Cost of Instruction Washington public colleges and universities receive resources for instruction from two primary sources: operating fee revenue (tuition) and the State General Fund. Therefore, the tuition paid by an individual student covers a portion of the total cost incurred by colleges and universities to provide the instructional program for each student. Prior to 1995, tuition was charged as a specified percentage of the total cost of instruction. Since 1995, the Legislature and Governor have set (or capped) tuition without specific reference to the total cost of instruction.
3 RCW 28B.15.051.

2002-03 Washington State Tuition and Fee Report Page 19
For an undergraduate student, the following table shows the proportion of costs covered by tuition. In the current 2002-03 academic year, resident tuition makes up approximately one-third of the cost at comprehensive institutions and community colleges, and nearly one-half of the cost at research universities. (The remaining portion of costs are covered primarily by the State General Fund, i.e., from state taxes.) Tuition for nonresident undergraduates covers the entire cost of instruction.

2002-03 Washington State Tuition and Fee Report Page 20
Tuition’s Proportion of Instructional Costs: Undergraduate Residents and Nonresidents
(selected years)
1977-98 to
1980-81
1981-82 to
1991-92
1993-94
1994-95
2001-02
Estimate for
2002-03 Research Universities Resident 25.0% 33.3% 36.3% 41.1% 41.6% 46.6% Nonresident * 100.0% 109.4% 122.9% 138.3% 150.2% Comprehensives Resident * 25.0% 27.7% 31.5% 31.1% 35.2% Nonresident * 100.0% 109.4% 123.0% 120.5% 132.2% Community Colleges Resident ** 23.0% 25.4% 28.8% 29.8% 33.3% Nonresident ** 100.0% 109.3% 122.7% 127.2% 130.4% * Rates were set at 80 percent of the research universities. ** Rates were set at 45 percent or 50 percent of research universities. Note: The estimate for 2002-03 will be revised when the 2001-02 Education Cost Study is completed in early 2003. Total Amount of Tuition Revenue Generated In fiscal year 2002-03, institutions will receive about $480 million from tuition. In comparison, institutions will receive approximately $1.2 billion from the State General Fund.4 Tuition at Washington's Technical Colleges In 1991, Washington’s technical colleges merged with the community college system. Although the State Board for Community and Technical Colleges (SBCTC) now oversees both the technical and community colleges, the two types of schools set tuition differently. Following the merger, a SBCTC task force reviewed the tuition process and recommended, with SBCTC approval, that tuition responsibility for the technical colleges remain at the local level. Technical colleges (and the Seattle Vocational Institute) set tuition and retain it in local accounts. The task force determined that this method provides significant flexibility and allows the colleges to make decisions based on local needs. Each technical college sets tuition locally, based on program costs and market influences. Tuition rates are generally comparable across the technical colleges for similar programs and comparable to rates at community colleges.
4 Legislative Evaluation and Accountability Program (LEAP), worksheet, November 2002.

2002-03 Washington State Tuition and Fee Report Page 21
CHAPTER 3: TUITION HISTORY IN WASHINGTON STATE Historical Overview 1977-1995: Legislature Links Tuition Rates to the Cost of Instruction Between 1977 and 1995, the Legislature established tuition rates as a percentage of the cost of instruction. In 1977, when this approach was enacted by the Legislature, a Carnegie Commission study, Who Pays? Who Benefits? Who Should Pay? determined that, nationally, tuition covered 24 percent of the cost of instruction at public higher education institutions. The Commission recommended that this proportion be increased to 33 percent within 10 years. Under this “cost-sharing” approach, the student contributed a specified portion of the cost, and the state provided the remainder. Cost-sharing assumes that both the student and society benefit from having an educated and productive citizenry. To determine undergraduate and graduate instructional costs, the Legislature directed the HECB to develop and perform a cost study every four years.5 Using cost study data, the HECB transmitted to the institutions the cost basis upon which tuition would be established. 1995-1999: Legislature Sets Tuition in Statute In 1995, the Legislature removed the direct link to the cost of instruction and instead set tuition in statute as dollar amounts for each public institution. Although 1995 legislative intent stated that the tuition increases of 1995-96 and 1996-97 were a “transition measure until final action is taken in 1997,”6 the practice of specifying dollar amounts was continued through the 1997-99 biennium. Tuition amounts (or percentage increases) specified in statute have referred only to the “tuition” portion of tuition and fees. Public colleges and universities may assess additional fees, such as services and activities fees and technology fees. State statutes establish maximum amounts that can be charged for these additional fees, which vary by institution. The Legislature also directed the HECB to continue to conduct the cost study and submit “approved undergraduate and graduate educational costs to the several boards of regents and trustees of the state institutions of higher education by November 10 of each even-numbered year...”7 1999-2001: Legislature Gives Limited Tuition-Setting Authority to Institutions For the first time, in academic year 1999-2000, the Legislature and Governor gave institutions limited local tuition-setting authority, within maximums. The 1999-2001 operating budget authorized colleges and universities to increase tuition up to 4.6 percent in the 1999-2000 academic year and 3.6 percent in the 2000-2001 academic year.
5RCW 28B.15.070. 6RCW 28B.15.031. 7RCW 28B.15.076.
2002-03 Washington State Tuition and Fee Report Page 22
2001-2002 academic year: Limited Tuition-Setting Authority Continues The Legislature and Governor continued to give institutions limited local tuition-setting authority in academic year 2001-2002, with tuition increases authorized up to 6.7 percent. However, maximum tuition increases for graduate programs of law and business were set at 12 percent, and the University of Washington was allowed to increase tuition up to 15 percent for its graduate business programs. 2002-2003 academic year: Limited Tuition-Setting Authority for Resident Undergraduates (other categories unlimited) Institutions were allowed specified maximum percentage increases (above the prior year’s tuition) for resident undergraduates, as follows:
Research Universities (UW and WSU) 16% Comprehensive Institutions (CWU, EWU, TESC, WWU) 14% Community and Technical Colleges 12%
These increases were among the highest for any year in the previous decade. And, in all cases, the institutions found it necessary to raise tuition to the allowable maximum. For other student categories – graduate and professional students and all non-residents – no maximum was placed on allowable tuition increases. In 2002-2003, Washington’s community and technical colleges changed the basis of tuition and fees from a full-time, part-time basis to a per credit hour base. Tuition and fees reported here reflect the amount charged to a student taking 15 credit hours. The table on the following page compares tuition increases for the past two years for each public four-year institution, and for the community and technical colleges.
2002-03 Washington State Tuition and Fee Report Page 23
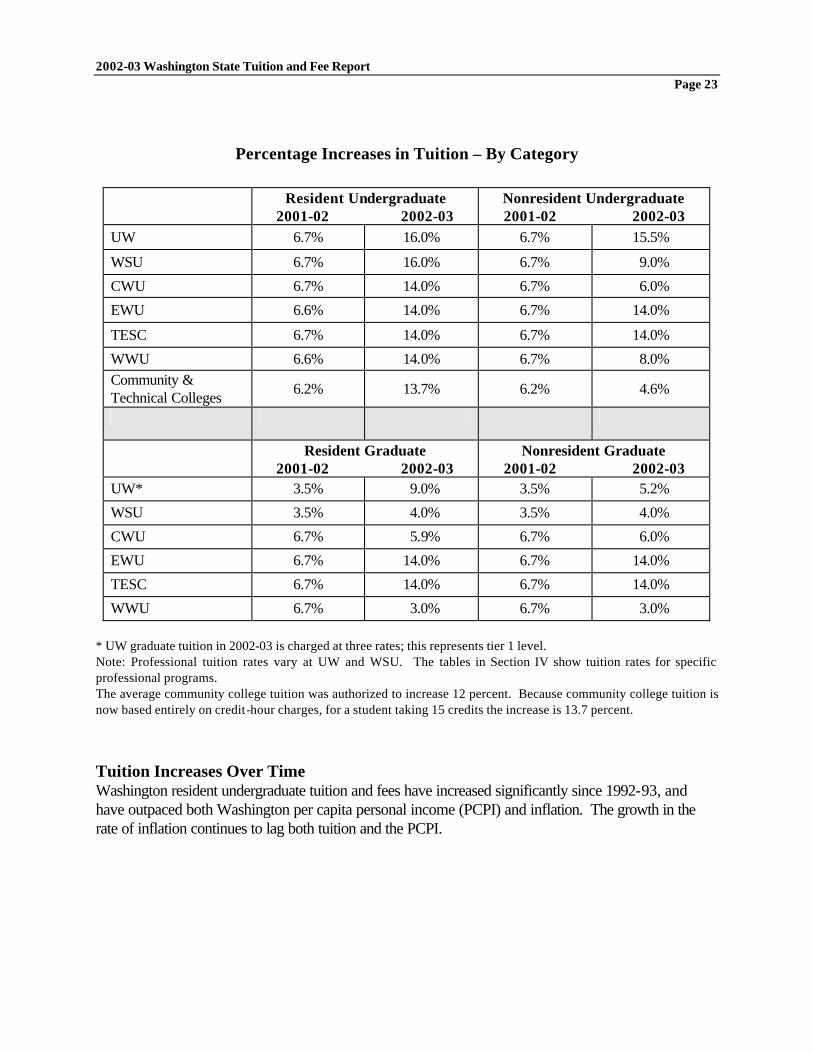
Percentage Increases in Tuition – By Category
Resident Undergraduate
2001-02 2002-03 Nonresident Undergraduate 2001-02 2002-03
UW 6.7% 16.0% 6.7% 15.5%
WSU 6.7% 16.0% 6.7% 9.0%
CWU 6.7% 14.0% 6.7% 6.0%
EWU 6.6% 14.0% 6.7% 14.0%
TESC 6.7% 14.0% 6.7% 14.0%
WWU 6.6% 14.0% 6.7% 8.0% Community & Technical Colleges 6.2% 13.7% 6.2% 4.6%
Resident Graduate 2001-02 2002-03
Nonresident Graduate 2001-02 2002-03
UW* 3.5% 9.0% 3.5% 5.2%
WSU 3.5% 4.0% 3.5% 4.0%
CWU 6.7% 5.9% 6.7% 6.0%
EWU 6.7% 14.0% 6.7% 14.0%
TESC 6.7% 14.0% 6.7% 14.0%
WWU 6.7% 3.0% 6.7% 3.0% * UW graduate tuition in 2002-03 is charged at three rates; this represents tier 1 level. Note: Professional tuition rates vary at UW and WSU. The tables in Section IV show tuition rates for specific professional programs. The average community college tuition was authorized to increase 12 percent. Because community college tuition is now based entirely on credit-hour charges, for a student taking 15 credits the increase is 13.7 percent.
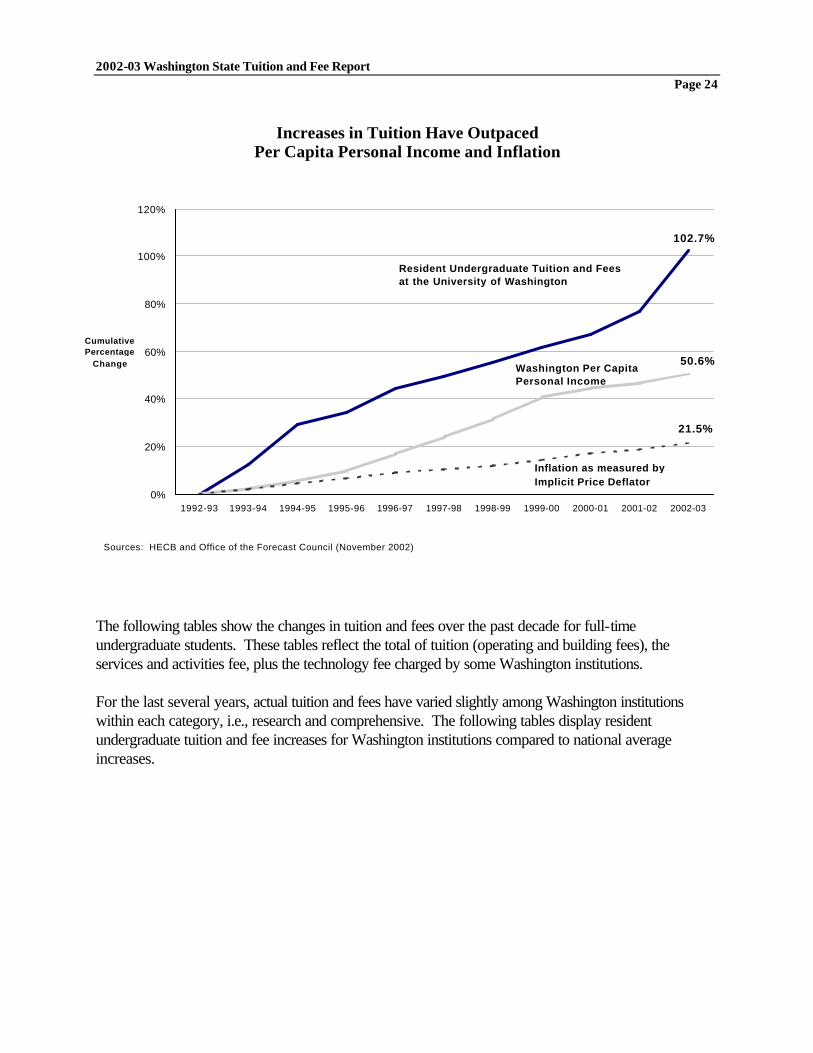
Tuition Increases Over Time Washington resident undergraduate tuition and fees have increased significantly since 1992-93, and have outpaced both Washington per capita personal income (PCPI) and inflation. The growth in the rate of inflation continues to lag both tuition and the PCPI.
2002-03 Washington State Tuition and Fee Report Page 24
0%
20%
40%
60%
80%
100%
120%
1992-93 1993-94 1994-95 1995-96 1996-97 1997-98 1998-99 1999-00 2000-01 2001-02 2002-03
Cumulative Percentage
Change
Resident Undergraduate Tuition and Fees at the University of Washington
Washington Per CapitaPersonal Income
Inflation as measured by Implicit Price Deflator
Sources: HECB and Office of the Forecast Council (November 2002)
102.7%
50.6%
21.5%
Increases in Tuition Have Outpaced Per Capita Personal Income and Inflation
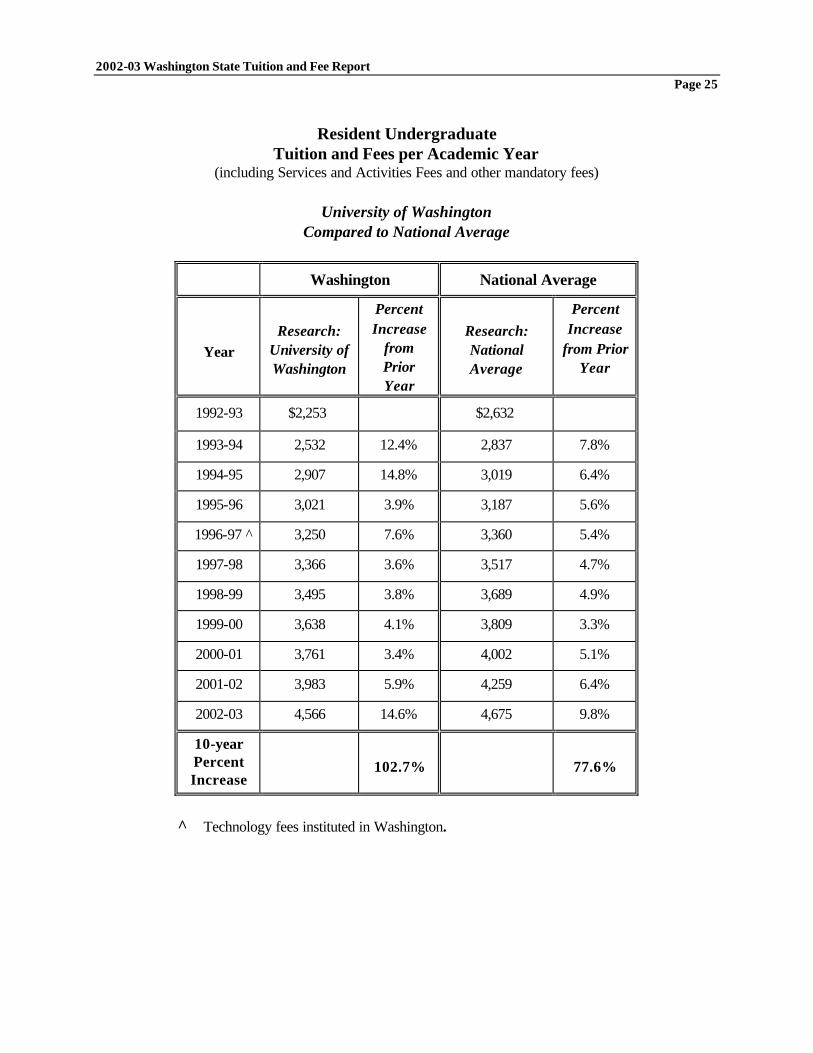
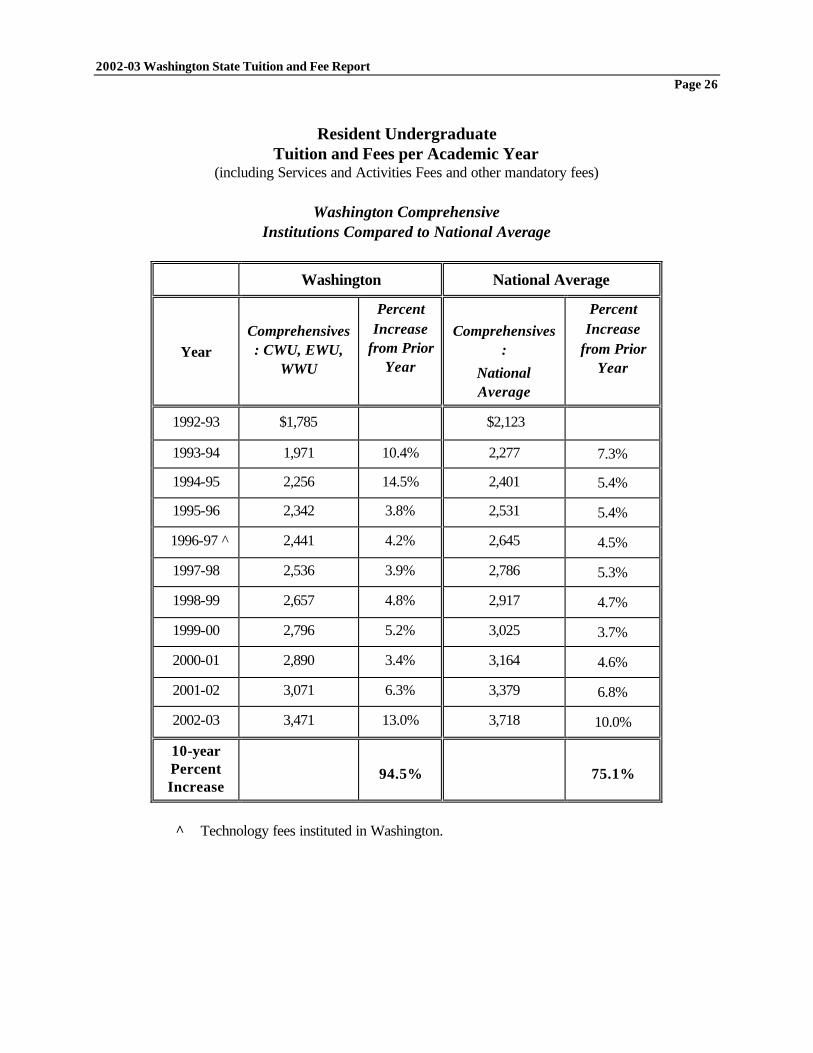
The following tables show the changes in tuition and fees over the past decade for full-time undergraduate students. These tables reflect the total of tuition (operating and building fees), the services and activities fee, plus the technology fee charged by some Washington institutions. For the last several years, actual tuition and fees have varied slightly among Washington institutions within each category, i.e., research and comprehensive. The following tables display resident undergraduate tuition and fee increases for Washington institutions compared to national average increases.
2002-03 Washington State Tuition and Fee Report Page 25
Resident Undergraduate Tuition and Fees per Academic Year
(including Services and Activities Fees and other mandatory fees)
University of Washington Compared to National Average
Washington National Average
Year
Research: University of Washington
Percent Increase
from Prior Year
Research: National Average
Percent Increase
from Prior Year
1992-93 $2,253 $2,632
1993-94 2,532 12.4% 2,837 7.8%
1994-95 2,907 14.8% 3,019 6.4%
1995-96 3,021 3.9% 3,187 5.6%
1996-97 ̂ 3,250 7.6% 3,360 5.4%
1997-98 3,366 3.6% 3,517 4.7%
1998-99 3,495 3.8% 3,689 4.9%
1999-00 3,638 4.1% 3,809 3.3%
2000-01 3,761 3.4% 4,002 5.1%
2001-02 3,983 5.9% 4,259 6.4%
2002-03 4,566 14.6% 4,675 9.8%
10-year Percent Increase
102.7%
77.6%
^ Technology fees instituted in Washington.
2002-03 Washington State Tuition and Fee Report Page 26
Resident Undergraduate Tuition and Fees per Academic Year
(including Services and Activities Fees and other mandatory fees)
Washington Comprehensive Institutions Compared to National Average
Washington National Average
Year
Comprehensives: CWU, EWU,
WWU
Percent Increase
from Prior Year
Comprehensives:
National Average
Percent Increase
from Prior Year
1992-93 $1,785 $2,123
1993-94 1,971 10.4% 2,277 7.3%
1994-95 2,256 14.5% 2,401 5.4%
1995-96 2,342 3.8% 2,531 5.4%
1996-97 ̂ 2,441 4.2% 2,645 4.5%
1997-98 2,536 3.9% 2,786 5.3%
1998-99 2,657 4.8% 2,917 4.7%
1999-00 2,796 5.2% 3,025 3.7%
2000-01 2,890 3.4% 3,164 4.6%
2001-02 3,071 6.3% 3,379 6.8%
2002-03 3,471 13.0% 3,718 10.0%
10-year Percent Increase
94.5%
75.1%
^ Technology fees instituted in Washington.

2002-03 Washington State Tuition and Fee Report Page 27
Resident Undergraduate Tuition and Fees Per Academic Year
(including Services and Activities Fees and other mandatory fees)
Washington Community Colleges Compared to National Average
Washington National Average
Year
Community Colleges
Percent Increase
from Prior Year
Community Colleges: National Average
Percent Increase
from Prior Year
1992-93 $ 999 $1,152
1993-94 1,125 12.6% 1,234 7.1%
1994-95 1,296 15.2% 1,318 6.8%
1995-96 1,350 4.2% 1,385 5.1%
1996-97 1,401 3.8% 1,473 6.4%
1997-98 1,458 4.1% 1,533 4.1%
1998-99 1,515 3.9% 1,584 3.3%
1999-00 1,584 4.6% 1,633 3.1%
2000-01 1,641 3.6% 1,721 5.4%
2001-02 1,743 6.2% 1,808 5.1%
2002-03 1,982 13.7% 1,957 8.3%
10-year Percent Increase
98.4%
69.9%

2002-03 Washington State Tuition and Fee Report Page 28
CHAPTER 4: TABLES
• National Comparison • Western States Comparison (WICHE) • Peer Institution Comparison
National Comparison

NATIONAL - TABLE 1RESIDENT UNDERGRADUATE TUITION AND REQUIRED FEES
FLAGSHIP UNIVERSITIES
1998-99 1999-00 2000-01 2001-02 2002-03 Percentage IncreaseOne Year Four Year
Alabama 2,684 2,872 3,014 3,292 3,556 8.0% 32.5%Alaska 2,770 2,845 3,420 3,495 3,595 2.9% 29.8%Arizona 2,158 2,259 2,344 2,486 2,583 3.9% 19.7%Arkansas 3,181 3,466 3,867 4,158 4,456 7.2% 40.1%California 4,177 4,047 ^ 4,046 ^ 4,123 4,201 1.9% 0.6%Colorado 3,038 3,118 3,188 3,357 3,566 6.2% 17.4%Connecticut 5,330 5,404 5,596 5,824 6,154 5.7% 15.5%Delaware 4,716 5,008 5,005 ^ 5,290 5,640 6.6% 19.6%Florida 2,114 2,233 2,348 2,444 2,581 5.6% 22.1%Georgia 2,930 3,034 3,276 3,418 3,616 5.8% 23.4%Hawaii 3,046 3,142 3,157 3,253 3,349 3.0% 9.9%Idaho 2,136 2,348 2,476 2,720 3,044 11.9% 42.5%Illinois 4,586 4,770 4,994 5,754 6,704 16.5% 46.2%Indiana 4,069 4,212 4,405 4,734 5,315 12.3% 30.6%Iowa 2,868 2,998 3,204 3,522 4,191 19.0% 46.1%Kansas 2,470 2,518 2,725 2,884 3,484 20.8% 41.1%Kentucky 3,016 3,296 3,446 3,734 3,974 6.4% 31.8%Louisiana 2,841 2,851 3,395 3,395 3,536 4.2% 24.5%Maine 4,551 4,656 4,829 5,117 5,550 8.5% 22.0%Maryland 4,699 4,939 5,136 5,341 5,670 6.2% 20.7%Massachusetts 5,229 5,212 ^ 5,212 5,212 6,482 24.4% 24.0%Michigan* 6,098 6,333 6,513 6,935 7,485 7.9% 22.7%Minnesota* 4,602 4,649 4,877 5,536 6,280 13.4% 36.5%Mississippi 3,053 3,053 3,153 3,626 3,916 8.0% 28.3%Missouri 4,439 4,581 4,726 4,887 5,552 13.6% 25.1%Montana 2,880 3,075 3,178 3,648 4,176 14.5% 45.0%Nebraska 3,083 3,278 3,465 3,745 4,125 10.1% 33.8%Nevada 2,070 2,145 2,220 2,295 2,370 3.3% 14.5%New Hampshire 6,555 6,939 7,395 7,693 8,130 5.7% 24.0%New Jersey 5,718 6,000 6,333 6,655 7,308 9.8% 27.8%New Mexico 2,241 2,430 2,795 3,026 3,170 4.8% 41.5%New York 4,510 4,510 4,715 4,815 4,850 0.7% 7.5%North Carolina 2,211 2,314 2,710 3,219 3,856 19.8% 74.4%North Dakota 2,830 2,956 3,088 3,261 3,662 12.3% 29.4%Ohio 3,879 4,110 4,383 4,788 5,454 13.9% 40.6%Oklahoma 2,633 2,686 2,861 2,963 3,206 8.2% 21.8%Oregon 3,726 3,810 3,819 4,071 4,359 7.1% 17.0%Pennsylvania 6,092 6,436 6,852 7,396 8,382 13.3% 37.6%Rhode Island 4,752 4,928 5,154 5,365 5,854 9.1% 23.2%South Carolina 3,630 3,740 3,868 4,064 4,984 22.6% 37.3%South Dakota 3,015 3,243 3,448 3,642 3,872 6.3% 28.4%Tennessee 2,744 3,104 3,362 3,784 4,056 7.2% 47.8%Texas 3,847 3,422 ^ 3,800 4,226 5,340 26.4% 38.8%Utah 2,709 2,790 2,895 3,043 3,325 9.3% 22.7%Vermont 7,788 8,024 8,288 8,665 8,994 3.8% 15.5%Virginia 4,866 4,130 ^ 4,160 4,236 4,595 8.5% -5.6%WASHINGTON 3,495 3,638 3,761 3,983 4,566 14.6% 30.6%West Virginia 2,662 2,748 2,836 2,948 3,240 9.9% 21.7%Wisconsin 3,405 3,735 3,788 4,086 4,423 8.2% 29.9%Wyoming 2,330 2,416 2,575 2,807 2,997 6.8% 28.6%
National Average 3,689 3,809 4,002 4,259 4,675 9.8% 26.7%Washington Rank 23 23 25 25 21CHANGES FROM PREVIOUS YEAR:National Average 3.2% 5.1% 6.4% 9.8%Washington 4.1% 3.4% 5.9% 14.6%
*Average of lower division and upper division charges.^Fees reduced.
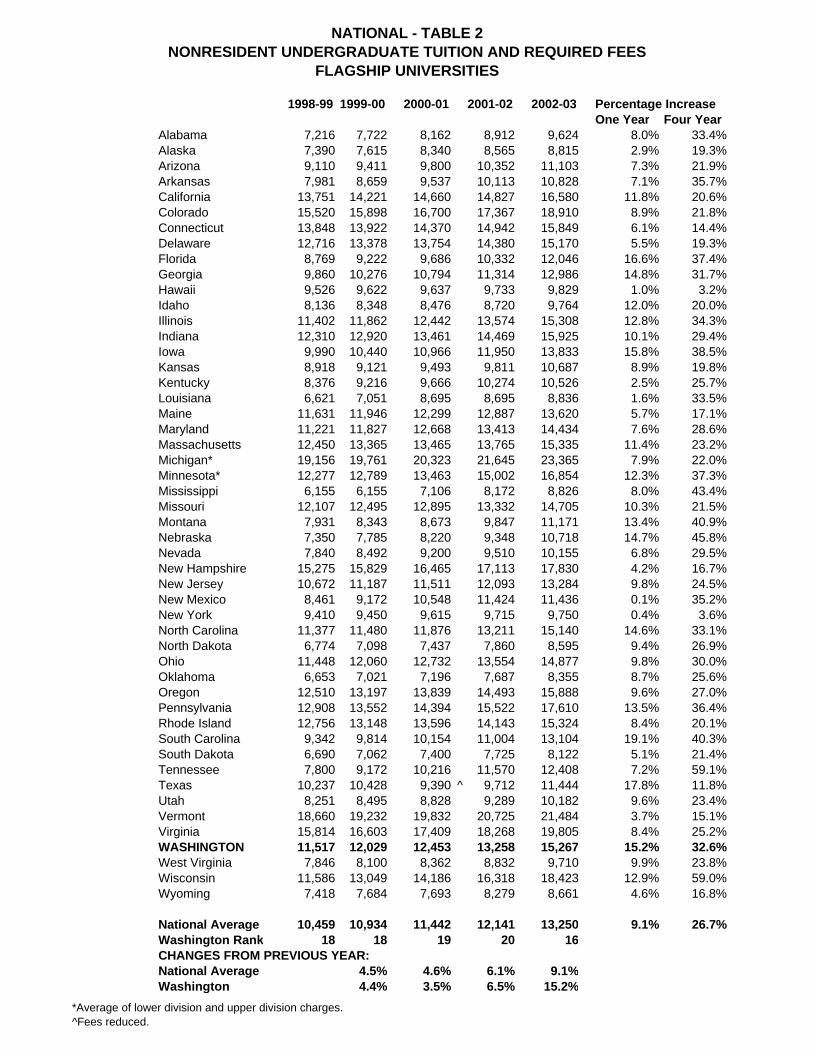
NATIONAL - TABLE 2NONRESIDENT UNDERGRADUATE TUITION AND REQUIRED FEES
FLAGSHIP UNIVERSITIES
1998-99 1999-00 2000-01 2001-02 2002-03 Percentage IncreaseOne Year Four Year
Alabama 7,216 7,722 8,162 8,912 9,624 8.0% 33.4%Alaska 7,390 7,615 8,340 8,565 8,815 2.9% 19.3%Arizona 9,110 9,411 9,800 10,352 11,103 7.3% 21.9%Arkansas 7,981 8,659 9,537 10,113 10,828 7.1% 35.7%California 13,751 14,221 14,660 14,827 16,580 11.8% 20.6%Colorado 15,520 15,898 16,700 17,367 18,910 8.9% 21.8%Connecticut 13,848 13,922 14,370 14,942 15,849 6.1% 14.4%Delaware 12,716 13,378 13,754 14,380 15,170 5.5% 19.3%Florida 8,769 9,222 9,686 10,332 12,046 16.6% 37.4%Georgia 9,860 10,276 10,794 11,314 12,986 14.8% 31.7%Hawaii 9,526 9,622 9,637 9,733 9,829 1.0% 3.2%Idaho 8,136 8,348 8,476 8,720 9,764 12.0% 20.0%Illinois 11,402 11,862 12,442 13,574 15,308 12.8% 34.3%Indiana 12,310 12,920 13,461 14,469 15,925 10.1% 29.4%Iowa 9,990 10,440 10,966 11,950 13,833 15.8% 38.5%Kansas 8,918 9,121 9,493 9,811 10,687 8.9% 19.8%Kentucky 8,376 9,216 9,666 10,274 10,526 2.5% 25.7%Louisiana 6,621 7,051 8,695 8,695 8,836 1.6% 33.5%Maine 11,631 11,946 12,299 12,887 13,620 5.7% 17.1%Maryland 11,221 11,827 12,668 13,413 14,434 7.6% 28.6%Massachusetts 12,450 13,365 13,465 13,765 15,335 11.4% 23.2%Michigan* 19,156 19,761 20,323 21,645 23,365 7.9% 22.0%Minnesota* 12,277 12,789 13,463 15,002 16,854 12.3% 37.3%Mississippi 6,155 6,155 7,106 8,172 8,826 8.0% 43.4%Missouri 12,107 12,495 12,895 13,332 14,705 10.3% 21.5%Montana 7,931 8,343 8,673 9,847 11,171 13.4% 40.9%Nebraska 7,350 7,785 8,220 9,348 10,718 14.7% 45.8%Nevada 7,840 8,492 9,200 9,510 10,155 6.8% 29.5%New Hampshire 15,275 15,829 16,465 17,113 17,830 4.2% 16.7%New Jersey 10,672 11,187 11,511 12,093 13,284 9.8% 24.5%New Mexico 8,461 9,172 10,548 11,424 11,436 0.1% 35.2%New York 9,410 9,450 9,615 9,715 9,750 0.4% 3.6%North Carolina 11,377 11,480 11,876 13,211 15,140 14.6% 33.1%North Dakota 6,774 7,098 7,437 7,860 8,595 9.4% 26.9%Ohio 11,448 12,060 12,732 13,554 14,877 9.8% 30.0%Oklahoma 6,653 7,021 7,196 7,687 8,355 8.7% 25.6%Oregon 12,510 13,197 13,839 14,493 15,888 9.6% 27.0%Pennsylvania 12,908 13,552 14,394 15,522 17,610 13.5% 36.4%Rhode Island 12,756 13,148 13,596 14,143 15,324 8.4% 20.1%South Carolina 9,342 9,814 10,154 11,004 13,104 19.1% 40.3%South Dakota 6,690 7,062 7,400 7,725 8,122 5.1% 21.4%Tennessee 7,800 9,172 10,216 11,570 12,408 7.2% 59.1%Texas 10,237 10,428 9,390 ^ 9,712 11,444 17.8% 11.8%Utah 8,251 8,495 8,828 9,289 10,182 9.6% 23.4%Vermont 18,660 19,232 19,832 20,725 21,484 3.7% 15.1%Virginia 15,814 16,603 17,409 18,268 19,805 8.4% 25.2%WASHINGTON 11,517 12,029 12,453 13,258 15,267 15.2% 32.6%West Virginia 7,846 8,100 8,362 8,832 9,710 9.9% 23.8%Wisconsin 11,586 13,049 14,186 16,318 18,423 12.9% 59.0%Wyoming 7,418 7,684 7,693 8,279 8,661 4.6% 16.8%
National Average 10,459 10,934 11,442 12,141 13,250 9.1% 26.7%Washington Rank 18 18 19 20 16CHANGES FROM PREVIOUS YEAR:National Average 4.5% 4.6% 6.1% 9.1%Washington 4.4% 3.5% 6.5% 15.2%
*Average of lower division and upper division charges.^Fees reduced.

NATIONAL - TABLE 3RESIDENT GRADUATE TUITION AND REQUIRED FEES
FLAGSHIP UNIVERSITIES
1998-99 1999-00 2000-01 2001-02 2002-03 Percentage IncreaseOne Year Four Year
Alabama 2,684 2,872 3,014 3,292 3,556 8.0% 32.5%Alaska 3,700 3,800 5,088 4,520 ^ 5,386 19.2% 45.6%Arizona 2,158 2,259 2,344 2,486 2,583 3.9% 19.7%Arkansas 3,457 3,786 5,107 5,407 5,778 6.9% 67.1%California 4,409 4,269 ^ 4,268 ^ 4,349 4,431 1.9% 0.5%Colorado 3,822 3,920 4,014 4,217 4,480 6.2% 17.2%Connecticut 6,076 6,140 6,354 6,614 6,999 5.8% 15.2%Delaware 4,626 4,762 5,005 5,290 5,520 4.3% 19.3%Florida 2,801 2,951 3,108 3,273 3,587 9.6% 28.1%Georgia 3,290 3,516 3,776 3,942 4,174 5.9% 26.9%Hawaii 4,030 4,150 4,165 4,309 4,453 3.3% 10.5%Idaho 2,676 2,888 3,016 3,260 3,584 9.9% 33.9%Illinois 3,844 4,016 4,200 4,764 5,454 14.5% 41.9%Indiana 4,013 4,213 4,449 4,818 5,361 11.3% 33.6%Iowa 3,368 3,520 3,750 4,108 4,887 19.0% 45.1%Kansas 2,448 2,496 2,661 2,819 3,252 15.4% 32.8%Kentucky 3,276 3,596 3,766 4,074 4,346 6.7% 32.7%Louisiana 2,850 2,860 3,404 3,404 3,545 4.1% 24.4%Maine 4,258 4,348 4,514 4,743 4,890 3.1% 14.8%Maryland 5,440 5,440 5,560 5,780 6,100 5.5% 12.1%Massachusetts 5,802 5,642 ^ 5,616 ^ 5,842 6,753 15.6% 16.4%Michigan 10,192 10,501 10,821 11,523 12,197 5.8% 19.7%Minnesota 5,611 5,517 ^ 5,794 6,547 7,662 17.0% 36.6%Mississippi 3,053 3,053 3,153 3,626 3,916 8.0% 28.3%Missouri 4,439 4,580 4,728 4,885 5,497 12.5% 23.8%Montana 2,839 3,025 3,128 3,433 3,884 13.1% 36.8%Nebraska 2,766 2,940 3,090 3,351 3,730 11.3% 34.9%Nevada 1,860 1,930 2,000 2,070 2,140 3.4% 15.1%New Hampshire 6,308 6,647 7,083 7,993 7,771 ^ -2.8% 23.2%New Jersey 7,701 8,043 7,992 ^ 8,368 9,194 9.9% 19.4%New Mexico 2,474 2,682 3,084 3,341 3,485 4.3% 40.9%New York 5,670 5,970 6,053 6,143 6,153 0.2% 8.5%North Carolina* 2,202 2,354 2,807 3,391 4,043 19.2% 83.6%North Dakota 3,040 3,166 3,298 3,471 3,887 12.0% 27.9%Ohio 5,445 5,730 6,048 6,333 6,639 4.8% 21.9%Oklahoma 2,148 2,272 2,390 2,466 2,649 7.4% 23.3%Oregon 6,384 6,750 7,056 7,497 7,848 4.7% 22.9%Pennsylvania 6,786 7,160 7,620 8,224 9,324 13.4% 37.4%Rhode Island 4,722 4,892 5,118 5,322 5,820 9.4% 23.3%South Carolina 3,994 4,114 4,314 4,534 5,560 22.6% 39.2%South Dakota 2,592 2,767 2,925 3,075 3,255 5.9% 25.6%Tennessee 3,354 3,806 4,004 4,280 4,840 13.1% 44.3%Texas 2,858 3,112 3,308 3,335 3,644 9.3% 27.5%Utah 2,198 2,262 2,348 2,489 2,760 10.9% 25.6%Vermont 7,788 6,372 ^ 6,592 6,876 7,148 4.0% -8.2%Virginia 4,866 4,916 5,023 5,178 5,661 9.3% 16.3%WASHINGTON 5,433 5,583 5,745 5,929 6,438 8.6% 18.5%West Virginia 2,820 2,910 3,004 3,242 3,564 9.9% 26.4%Wisconsin 4,926 5,403 5,884 6,358 6,877 8.2% 39.6%Wyoming 2,816 2,920 3,117 3,386 3,585 5.9% 27.3%
National Average 4,126 4,256 4,494 4,760 5,166 8.5% 25.2%Washington Rank 13 11 12 12 12CHANGES FROM PREVIOUS YEAR:National Average 3.2% 5.6% 5.9% 8.5%Washington 2.8% 2.9% 3.2% 8.6%
*U of NC/Chapel Hill instituted a mandatory grad fee (AY99) at the Business School that is not included in the amount reported above.^Fees reduced.

NATIONAL - TABLE 4NONRESIDENT GRADUATE TUITION AND REQUIRED FEES
FLAGSHIP UNIVERSITIES
1998-99 1999-00 2000-01 2001-02 2002-03 Percentage IncreaseOne Year Four Year
Alabama 7,216 7,722 8,162 8,912 9,624 8.0% 33.4%Alaska 6,780 6,980 9,024 7,900 ^ 9,288 17.6% 37.0%Arizona 9,110 9,411 9,800 10,352 11,103 7.3% 21.9%Arkansas 7,897 8,646 11,275 11,885 12,709 6.9% 60.9%California 13,793 14,263 14,702 15,053 15,753 4.7% 14.2%Colorado 15,304 15,686 16,506 17,367 18,910 8.9% 23.6%Connecticut 14,256 14,320 14,778 15,366 16,304 6.1% 14.4%Delaware 12,536 13,132 13,754 14,380 15,050 4.7% 20.1%Florida 9,672 10,166 10,609 11,416 13,359 17.0% 38.1%Georgia 11,300 12,204 12,794 13,410 15,218 13.5% 34.7%Hawaii 9,958 10,078 10,093 10,309 10,525 2.1% 5.7%Idaho 8,676 8,888 9,016 9,260 10,304 11.3% 18.8%Illinois 8,428 8,784 9,206 10,020 11,236 12.1% 33.3%Indiana 11,033 11,586 12,190 13,102 14,440 10.2% 30.9%Iowa 10,404 10,874 11,420 12,330 14,271 15.7% 37.2%Kansas 7,023 7,181 7,463 7,706 8,334 8.1% 18.7%Kentucky 9,156 10,116 10,626 11,294 11,564 2.4% 26.3%Louisiana 6,630 7,060 8,704 8,704 8,895 2.2% 34.2%Maine 11,338 11,628 11,974 12,523 12,990 3.7% 14.6%Maryland 8,000 8,300 8,600 8,960 9,640 7.6% 20.5%Massachusetts 12,527 13,112 13,186 13,512 14,955 10.7% 19.4%Michigan 20,484 21,107 21,749 23,163 24,517 5.8% 19.7%Minnesota 10,555 10,377 ^ 10,921 12,200 14,220 16.6% 34.7%Mississippi 6,155 6,155 7,106 8,172 8,826 8.0% 43.4%Missouri 12,275 12,668 13,075 13,515 14,855 9.9% 21.0%Montana 7,315 7,694 7,997 8,927 10,084 13.0% 37.9%Nebraska 5,981 6,330 6,670 7,593 8,730 15.0% 46.0%Nevada 7,630 8,277 8,980 9,285 9,925 6.9% 30.1%New Hampshire 15,028 15,537 16,153 17,413 17,471 0.3% 16.3%New Jersey 10,363 10,844 11,310 11,852 13,022 9.9% 25.7%New Mexico 8,722 9,456 10,874 11,777 11,777 0.0% 35.0%New York 9,286 9,286 9,369 9,459 9,469 0.1% 2.0%North Carolina* 11,368 11,520 11,973 13,702 15,692 14.5% 38.0%North Dakota 7,336 7,658 7,997 8,421 9,196 9.2% 25.4%Ohio 14,145 14,865 15,639 16,404 17,214 4.9% 21.7%Oklahoma 5,638 6,042 6,160 6,575 7,127 8.4% 26.4%Oregon 10,812 11,409 11,958 12,645 13,254 4.8% 22.6%Pennsylvania 13,712 14,392 15,286 16,484 18,702 13.5% 36.4%Rhode Island 11,126 11,468 11,872 12,340 13,390 8.5% 20.3%South Carolina 8,214 8,628 9,182 9,954 11,848 19.0% 44.2%South Dakota 5,916 6,220 6,499 6,766 7,097 4.9% 20.0%Tennessee 8,410 9,874 10,346 12,066 12,942 7.3% 53.9%Texas 7,118 7,432 7,608 7,555 ^ 8,004 5.9% 12.4%Utah 6,614 6,812 7,081 7,543 8,396 11.3% 26.9%Vermont 18,660 15,712 ^ 16,212 16,936 17,548 3.6% -6.0%Virginia 15,814 16,603 17,409 18,268 18,751 2.6% 18.6%WASHINGTON 13,479 13,872 14,283 14,766 15,525 5.1% 15.2%West Virginia 8,104 8,368 8,640 9,110 10,016 9.9% 23.6%Wisconsin 15,188 17,107 18,594 20,496 22,147 8.1% 45.8%Wyoming 7,906 8,190 8,199 8,858 9,273 4.7% 17.3%
National Average 10,288 10,681 11,260 11,920 12,870 8.0% 25.1%Washington Rank 11 11 11 11 12CHANGES FROM PREVIOUS YEAR:National Average 3.8% 5.4% 5.9% 8.0%Washington 2.9% 3.0% 3.4% 5.1%
*U of NC/Chapel Hill instituted a mandatory grad fee in the Business School that is not included in the amount reported above.^Fees reduced.

NATIONAL - TABLE 5RESIDENT UNDERGRADUATE TUITION AND REQUIRED FEES (State Averages)
COMPREHENSIVE COLLEGES AND UNIVERSITIES
# 1998-99 1999-00 2000-01 2001-02 2002-03 Percentage IncreaseOne Year Four Year
Alabama 5 2,668 2,761 2,892 3,261 3,488 7.0% 30.7%Arizona 2 2,158 2,259 2,344 2,486 2,583 3.9% 19.7%Arkansas 4 2,615 2,801 2,974 3,477 3,725 7.1% 42.5%California 11 1,878 1,847 ^ 1,859 1,897 1,993 5.1% 6.1%Colorado 5 2,238 2,302 2,353 2,511 2,704 7.7% 20.8%Connecticut 3 3,670 3,747 3,908 4,172 4,556 9.2% 24.1%Florida 6 2,114 2,233 2,348 2,551 2,691 5.5% 27.3%Georgia 8 2,144 2,239 2,361 2,480 2,605 5.1% 21.5%Idaho 2 2,156 2,340 2,514 2,732 3,060 12.0% 41.9%Illinois 5 3,500 3,844 4,001 4,215 4,606 9.3% 31.6%Indiana 2 3,438 3,556 3,697 3,947 4,468 13.2% 30.0%Iowa 1 2,860 2,988 3,130 3,440 4,118 19.7% 44.0%Kansas 4 2,165 2,216 2,354 2,424 2,593 7.0% 19.8%Kentucky 7 2,339 2,533 2,699 2,897 3,205 10.7% 37.0%Louisiana 7 2,173 2,224 2,473 2,492 2,587 3.8% 19.0%Maine 3 3,320 3,393 3,510 3,690 3,860 4.6% 16.3%Maryland 6 4,228 4,426 4,650 4,759 5,148 8.2% 21.8%Massachusetts 7 3,337 3,206 ^ 3,260 3,295 4,075 23.7% 22.1%Michigan 6 3,603 3,800 4,027 4,501 4,891 8.7% 35.7%Minnesota 7 2,931 3,076 3,238 3,561 3,970 11.5% 35.4%Mississippi 5 2,689 2,689 2,789 3,207 3,531 10.1% 31.3%Missouri 5 2,870 3,019 3,202 3,436 4,127 20.1% 43.8%Montana 2 2,677 2,823 2,924 3,222 3,707 15.0% 38.5%Nebraska 2 2,336 2,500 2,693 2,916 3,199 9.7% 37.0%Nevada 1 2,070 2,145 2,220 2,295 2,370 3.3% 14.5%New Hampshire 2 4,765 5,034 5,309 5,557 5,995 7.9% 25.8%New Jersey 7 4,708 5,002 5,328 5,762 6,533 13.4% 38.8%New Mexico 1 1,708 1,762 1,933 2,042 2,222 8.8% 30.1%New York 10 3,917 3,963 4,006 4,068 4,153 2.1% 6.0%North Carolina 5 1,757 1,862 2,025 2,255 2,677 18.7% 52.3%North Dakota 4 2,623 2,709 2,790 2,909 3,307 13.7% 26.1%Ohio 4 4,171 4,396 4,674 5,058 5,920 17.0% 41.9%Oklahoma 6 1,837 1,944 1,996 2,171 2,377 9.5% 29.4%Oregon 4 3,305 3,362 3,435 3,650 3,773 3.4% 14.2%Pennsylvania 14 4,302 4,476 4,695 4,969 5,532 11.3% 28.6%Rhode Island 1 3,149 3,260 3,371 3,521 3,761 6.8% 19.4%South Carolina 1 3,350 3,350 3,350 3,790 4,340 14.5% 29.6%South Dakota 2 3,008 3,258 3,485 3,702 3,987 7.7% 32.5%Tennessee 6 2,441 2,622 2,852 3,246 3,491 7.5% 43.0%Texas 9 2,467 2,468 2,651 2,724 3,259 19.6% 32.1%Utah 1 1,986 2,042 2,106 2,252 2,427 7.8% 22.2%Vermont 2 4,592 4,780 4,944 5,132 5,374 4.7% 17.0%Virginia 5 4,139 3,658 ^ 3,730 3,841 4,195 9.2% 1.3%WASHINGTON 3 2,657 2,796 2,890 3,071 3,471 13.0% 30.6%West Virginia 7 2,280 2,393 2,494 2,593 2,856 10.1% 25.3%Wisconsin 4 2,827 3,027 3,058 3,272 3,526 7.7% 24.7%
Average* 2,917 3,025 3,164 3,379 3,718 10.0% 27.5%Washington Rank 26 25 26 28 28CHANGES FROM PREVIOUS YEAR:National Average 3.7% 4.6% 6.8% 10.0%Washington 5.2% 3.4% 6.3% 13.0%
#Number of institutions in survey.*Does not include Alaska, Delaware, Hawaii, or Wyoming.^Fees reduced.

NATIONAL - TABLE 6NONRESIDENT UNDERGRADUATE TUITION AND REQUIRED FEES (State Averages)
COMPREHENSIVE COLLEGES AND STATE UNIVERSITIES
# 1998-99 1999-00 2000-01 2001-02 2002-03 Percentage IncreaseOne Year Four Year
Alabama 5 5,112 5,337 5,628 6,252 6,694 7.1% 30.9%Arizona 2 8,592 8,893 9,288 10,352 11,103 7.3% 29.2%Arkansas 4 5,280 5,663 6,026 7,019 7,535 7.4% 42.7%California 11 9,259 9,965 9,241 ^ 9,279 10,453 12.7% 12.9%Colorado 5 7,916 8,074 8,406 8,851 9,501 7.3% 20.0%Connecticut 3 9,179 9,287 9,661 10,145 10,758 6.0% 17.2%Florida 6 8,769 9,222 9,686 10,439 12,030 15.2% 37.2%Georgia 8 7,364 7,663 7,989 8,501 8,860 4.2% 20.3%Idaho 2 8,216 8,400 8,634 8,952 9,380 4.8% 14.2%Illinois 5 8,537 8,284 ^ 8,580 8,425 ^ 9,158 8.7% 7.3%Indiana 2 8,833 9,200 9,594 10,186 11,438 12.3% 29.5%Iowa 1 7,415 7,748 8,094 8,762 10,426 19.0% 40.6%Kansas 4 7,013 7,179 7,549 7,759 8,253 6.4% 17.7%Kentucky 7 6,396 6,842 7,255 7,739 8,419 8.8% 31.6%Louisiana 7 6,566 7,148 7,858 7,893 8,017 1.6% 22.1%Maine 3 7,700 7,883 8,120 8,490 8,980 5.8% 16.6%Maryland 6 9,009 9,600 10,175 10,567 11,271 6.7% 25.1%Massachusetts 7 9,227 9,545 9,805 10,433 11,480 10.0% 24.4%Michigan 6 8,340 8,732 9,149 10,243 11,094 8.3% 33.0%Minnesota 7 5,971 6,406 6,574 7,180 6,781 ^ -5.6% 13.6%Mississippi 5 5,631 5,631 6,510 7,487 8,152 8.9% 44.8%Missouri 5 5,391 5,674 6,002 6,451 7,732 19.9% 43.4%Montana 2 7,358 7,726 8,056 9,049 10,319 14.0% 40.3%Nebraska 2 4,106 4,364 4,654 5,140 5,760 12.1% 40.3%Nevada 1 7,840 8,492 9,200 9,510 10,155 6.8% 29.5%New Hampshire 2 10,065 10,344 10,619 11,057 11,655 5.4% 15.8%New Jersey 7 7,535 8,061 8,530 9,239 10,447 13.1% 38.6%New Mexico 1 6,205 6,440 7,078 7,706 8,438 9.5% 36.0%New York 10 8,817 8,863 8,906 8,968 9,115 1.6% 3.4%North Carolina 5 8,857 9,021 9,244 10,121 11,534 14.0% 30.2%North Dakota 4 5,737 5,952 6,167 6,435 7,060 9.7% 23.1%Ohio 4 9,420 9,960 10,471 11,161 12,685 13.7% 34.7%Oklahoma 6 4,320 4,599 4,651 5,064 5,530 9.2% 28.0%Oregon 4 8,706 9,090 9,567 10,020 10,385 3.6% 19.3%Pennsylvania 14 9,624 9,244 ^ 9,698 10,305 11,356 10.2% 18.0%Rhode Island 1 7,929 8,185 8,471 8,911 9,525 6.9% 20.1%South Carolina 1 6,610 6,610 6,610 7,410 8,530 15.1% 29.0%South Dakota 2 6,683 7,077 7,438 7,785 8,236 5.8% 23.2%Tennessee 6 7,275 7,810 8,524 9,768 10,502 7.5% 44.4%Texas 9 8,863 9,076 8,835 ^ 8,980 9,734 8.4% 9.8%Utah 1 5,886 6,058 6,283 6,718 7,295 8.6% 23.9%Vermont 2 9,860 10,276 10,632 11,048 11,586 4.9% 17.5%Virginia 5 10,193 10,289 10,572 10,970 11,772 7.3% 15.5%WASHINGTON 3 9,350 9,761 9,989 10,651 11,626 9.2% 24.3%West Virginia 7 5,575 5,791 5,993 6,338 7,002 10.5% 25.6%Wisconsin 4 9,109 9,891 10,586 12,040 13,572 12.7% 49.0%
Average* 7,644 7,943 8,274 8,822 9,594 8.8% 25.5%Washington Rank 6 7 7 6 6CHANGES FROM PREVIOUS YEAR:National Average 3.9% 4.2% 6.6% 8.8%Washington 4.4% 2.3% 6.6% 9.2%
#Number of institutions in survey.*Does not include Alaska, Delaware, Hawaii, or Wyoming.^Fees reduced.

NATIONAL - TABLE 7RESIDENT GRADUATE TUITION AND REQUIRED FEES (State Averages)
COMPREHENSIVE COLLEGES AND STATE UNIVERSITIES
# 1998-99 1999-00 2000-01 2001-02 2002-03 Percentage IncreaseOne Year Four Year
Alabama 5 2,625 2,848 2,993 3,342 3,572 6.9% 36.1%Arizona 2 2,158 2,259 2,344 2,486 2,583 3.9% 19.7%Arkansas 4 2,543 3,187 3,407 3,713 3,974 7.0% 56.3%California 11 1,957 1,925 ^ 1,939 1,977 2,071 4.8% 5.9%Colorado 5 2,702 2,750 2,822 2,912 3,055 4.9% 13.1%Connecticut 3 4,144 4,221 4,403 4,682 5,074 8.4% 22.4%Florida 6 2,801 2,951 3,108 3,360 3,669 9.2% 31.0%Georgia 8 2,414 2,601 2,737 2,882 3,022 4.8% 25.2%Idaho 2 2,700 2,906 3,113 3,347 3,699 10.5% 37.0%Illinois 5 2,806 2,903 3,060 3,226 3,488 8.1% 24.3%Indiana 2 3,564 3,691 3,835 4,091 4,632 13.2% 30.0%Iowa 1 3,360 3,510 3,676 4,026 4,814 19.6% 43.3%Kansas 4 2,233 2,290 2,421 2,494 2,680 7.5% 20.0%Kentucky 7 2,548 2,747 2,921 3,134 3,451 10.1% 35.5%Louisiana 7 2,006 2,079 2,330 2,273 ^ 2,360 3.8% 17.6%Maryland 6 3,304 3,484 3,652 4,124 4,368 5.9% 32.2%Massachusetts 7 3,925 3,741 ^ 3,833 3,996 4,744 18.7% 20.9%Michigan 6 4,386 4,611 5,007 5,460 5,915 8.3% 34.9%Minnesota 7 2,980 3,131 3,281 3,617 3,935 8.8% 32.0%Mississippi 5 2,661 2,661 2,761 3,175 3,531 11.2% 32.7%Missouri 5 3,281 3,503 3,699 3,923 4,341 10.6% 32.3%Montana 2 2,445 2,687 3,006 3,370 3,887 15.3% 59.0%Nebraska 2 1,970 2,116 2,290 2,495 2,777 11.3% 41.0%Nevada 1 1,860 1,930 2,000 2,070 2,140 3.4% 15.1%New Hampshire 2 4,900 5,198 5,010 ^ 6,017 5,946 ^ -1.2% 21.3%New Jersey 7 6,024 5,843 ^ 6,262 6,806 7,393 8.6% 22.7%New Mexico 1 1,828 1,882 2,053 2,187 2,365 8.1% 29.4%New York 10 5,542 5,555 5,571 5,579 5,744 3.0% 3.6%North Carolina 5 1,805 1,926 2,070 2,331 2,759 18.4% 52.8%North Dakota 4 2,853 2,971 3,095 3,274 4,077 24.5% 42.9%Ohio 4 5,651 6,018 6,378 7,004 8,064 15.1% 42.7%Oklahoma 6 1,546 1,632 1,685 1,812 1,960 8.2% 26.8%Oregon 4 5,461 5,734 6,065 6,355 6,641 4.5% 21.6%Pennsylvania 14 4,210 4,546 4,972 5,502 6,370 15.8% 51.3%Rhode Island 1 3,130 3,208 3,320 3,372 3,632 7.7% 16.0%South Carolina 1 3,550 3,550 3,550 3,990 4,540 13.8% 27.9%South Dakota 2 2,587 2,777 2,995 3,115 3,331 7.0% 28.8%Tennessee 6 3,064 3,289 3,710 3,977 4,277 7.5% 39.6%Texas 9 1,891 1,940 2,172 2,189 2,491 13.8% 31.7%Utah 1 2,028 2,086 2,172 2,430 2,494 2.6% 23.0%Vermont 2 4,592 4,780 4,944 5,132 5,374 4.7% 17.0%Virginia 5 3,952 4,023 4,183 4,337 4,709 8.6% 19.1%WASHINGTON 3 4,235 4,438 4,589 4,885 5,250 7.5% 24.0%West Virginia 7 2,543 2,598 2,724 2,976 3,266 9.7% 28.4%Wisconsin 4 3,659 3,918 4,195 4,491 4,843 7.8% 32.3%
Average* 3,165 3,303 3,475 3,732 4,074 9.2% 28.7%Washington Rank 8 9 9 9 9CHANGES FROM PREVIOUS YEAR:National Average 4.4% 5.2% 7.4% 9.2%Washington 4.8% 3.4% 6.5% 7.5%
#Number of institutions in survey.*Does not include Alaska, Delaware, Hawaii, Maine, or Wyoming.^Fees reduced.

NATIONAL - TABLE 8NONRESIDENT GRADUATE TUITION AND REQUIRED FEES (State Averages)
COMPREHENSIVE COLLEGES AND STATE UNIVERSITIES
# 1998-99 1999-00 2000-01 2001-02 2002-03 Percentage IncreaseOne Year Four Year
Alabama 5 5,073 5,669 5,886 6,476 6,932 7.0% 36.6%Arizona 2 8,592 8,893 9,288 10,352 11,103 7.3% 29.2%Arkansas 4 5,305 6,649 7,094 7,643 8,192 7.2% 54.4%California 11 9,337 10,042 9,319 ^ 9,357 10,532 12.6% 12.8%Colorado 5 8,787 8,867 9,207 9,638 10,349 7.4% 17.8%Connecticut 3 9,629 9,737 10,132 10,631 11,251 5.8% 16.8%Florida 6 9,672 10,166 10,688 11,504 13,329 15.9% 37.8%Georgia 8 8,414 9,111 9,493 10,112 10,528 4.1% 25.1%Idaho 2 8,760 8,966 9,233 9,567 10,019 4.7% 14.4%Illinois 5 6,624 6,233 ^ 6,495 6,428 ^ 6,955 8.2% 5.0%Indiana 2 8,679 9,039 9,429 10,013 11,246 12.3% 29.6%Iowa 1 7,999 8,358 8,732 9,446 11,238 19.0% 40.5%Kansas 4 5,985 6,132 6,444 6,600 7,189 8.9% 20.1%Kentucky 7 7,022 7,485 7,871 8,369 9,148 9.3% 30.3%Louisiana 7 6,380 6,692 7,362 7,163 ^ 7,268 1.5% 13.9%Maryland 6 5,684 6,004 6,332 7,096 7,512 5.9% 32.2%Massachusetts 7 9,227 9,358 9,470 9,952 10,897 9.5% 18.1%Michigan 6 8,823 9,296 10,150 10,768 11,381 5.7% 29.0%Minnesota 7 4,490 4,708 4,909 5,434 5,341 ^ -1.7% 19.0%Mississippi 5 5,344 5,603 6,482 7,454 8,152 9.4% 52.5%Missouri 5 6,193 6,615 6,995 7,437 8,124 9.2% 31.2%Montana 2 5,845 6,505 7,319 8,233 9,372 13.8% 60.3%Nebraska 2 3,455 3,681 3,940 4,368 4,937 13.0% 42.9%Nevada 1 7,630 8,277 8,980 9,285 9,925 6.9% 30.1%New Hampshire 2 7,790 8,108 7,890 ^ 9,017 9,056 0.4% 16.3%New Jersey 7 8,239 8,144 ^ 8,731 9,490 10,364 9.2% 25.8%New Mexico 1 6,325 6,560 7,198 7,851 8,605 9.6% 36.0%New York 10 8,858 8,871 8,887 8,917 9,060 1.6% 2.3%North Carolina 5 9,075 9,270 9,288 10,342 11,782 13.9% 29.8%North Dakota 4 7,149 7,463 7,794 8,224 9,349 13.7% 30.8%Ohio 4 10,600 11,261 11,857 12,788 14,480 13.2% 36.6%Oklahoma 6 3,586 3,812 3,865 4,188 4,549 8.6% 26.9%Oregon 4 9,569 10,034 10,536 10,994 11,531 4.9% 20.5%Pennsylvania 14 7,041 7,376 7,872 8,513 9,586 12.6% 36.1%Rhode Island 1 6,046 6,196 6,326 6,702 7,286 8.7% 20.5%South Carolina 1 7,010 7,010 7,010 7,810 8,930 14.3% 27.4%South Dakota 2 5,911 6,230 6,524 6,821 7,173 5.2% 21.3%Tennessee 6 7,898 8,477 9,321 10,499 11,288 7.5% 42.9%Texas 9 6,101 6,238 6,382 6,425 6,816 6.1% 11.7%Utah 1 6,054 6,234 6,484 7,344 7,974 8.6% 31.7%Vermont 2 9,860 10,276 10,632 11,048 11,586 4.9% 17.5%Virginia 5 9,784 9,947 10,234 10,653 11,538 8.3% 17.9%WASHINGTON 3 12,815 13,367 13,681 14,591 15,688 7.5% 22.4%West Virginia 7 6,848 7,078 7,328 7,915 8,684 9.7% 26.8%Wisconsin 4 11,304 12,276 13,139 14,315 15,453 7.9% 36.7%
Average* 7,574 7,918 8,272 8,839 9,593 8.5% 26.7%Washington Rank 1 1 1 1 1CHANGES FROM PREVIOUS YEAR:National Average 4.5% 4.5% 6.9% 8.5%Washington 4.3% 2.3% 6.7% 7.5%
#Number of institutions in survey.*Does not include Alaska, Delaware, Hawaii, Maine, or Wyoming.^Fees reduced.

NATIONAL - TABLE 9RESIDENT* TUITION AND REQUIRED FEES (Estimated State Averages)
COMMUNITY COLLEGES
1998-99 1999-00 2000-01 2001-02 2002-03 Percentage IncreaseOne Year Four Year
Alabama 1,239 1,587 1,653 1,964 2,099 6.9% 69.4%Alaska 1,968 2,028 2,088 2,148 2,208 2.8% 12.2%Arizona 831 854 903 930 977 5.1% 17.6%Arkansas 1,007 982 ^ 1,314 1,503 1,752 16.6% 74.0%California 360 330 ^ 330 330 330 0.0% -8.3%Colorado 1,877 1,904 1,920 1,999 2,117 5.9% 12.8%Connecticut 1,814 1,814 1,886 1,888 2,034 7.7% 12.1%Delaware 1,440 1,470 1,530 1,710 1,806 5.6% 25.4%Florida 1,309 1,404 1,463 1,525 1,576 3.3% 20.4%Georgia 1,386 1,416 1,514 1,486 ^ 1,550 4.3% 11.8%Hawaii 1,005 1,053 1,061 1,322 1,323 0.1% 31.6%Idaho 1,179 1,250 1,313 1,406 1,547 10.0% 31.2%Illinois 1,397 1,426 1,507 1,580 1,684 6.6% 20.5%Indiana 2,540 2,540 2,540 2,601 2,957 13.7% 16.4%Iowa 2,052 2,112 2,187 2,422 2,670 10.2% 30.1%Kansas 1,272 1,304 1,368 1,446 1,554 7.5% 22.2%Kentucky 1,140 1,180 1,230 1,450 1,536 5.9% 34.7%Louisiana 1,142 1,118 ^ 1,378 1,403 1,485 5.8% 30.0%Maine 2,040 2,040 2,040 2,040 2,040 0.0% 0.0%Maryland 2,188 2,238 2,262 2,345 2,564 9.3% 17.2%Massachusetts 2,317 2,175 ^ 2,180 2,279 2,861 25.5% 23.5%Michigan 1,499 1,527 1,570 1,677 1,752 4.5% 16.9%Minnesota 2,268 2,378 2,472 2,750 3,049 10.9% 34.4%Mississippi 972 1,016 1,072 1,278 1,396 9.2% 43.6%Missouri 1,378 1,404 2,129 2,214 2,437 10.1% 76.8%Montana 1,529 1,802 1,944 1,818 ^ 1,891 4.0% 23.7%Nebraska 1,315 1,357 1,415 1,480 1,536 3.8% 16.8%Nevada 1,185 1,230 1,275 1,320 1,365 3.4% 15.2%New Hampshire 3,630 3,735 4,114 3,780 ^ 4,429 17.2% 22.0%New Jersey 2,247 2,310 2,337 2,399 2,524 5.2% 12.3%New Mexico 664 677 714 744 768 3.2% 15.7%New York 2,552 2,554 2,602 2,838 2,855 0.6% 11.9%North Carolina 560 749 880 992 1,096 10.5% 95.7%North Dakota 1,840 1,906 1,954 2,040 2,263 10.9% 23.0%Ohio 2,045 2,045 2,133 2,138 2,300 7.6% 12.5%Oklahoma 1,336 1,406 1,399 ^ 1,520 1,613 6.1% 20.7%Oregon 1,628 1,661 1,828 1,934 2,059 6.5% 26.5%Pennsylvania 2,042 2,105 2,134 2,252 2,285 1.5% 11.9%Rhode Island 1,746 1,746 1,806 1,854 2,014 8.6% 15.3%South Carolina 1,269 1,385 1,507 1,856 2,343 26.2% 84.6%Tennessee 1,240 1,308 1,430 1,626 1,740 7.0% 40.3%Texas 996 1,022 1,072 895 ^ 977 9.2% -1.9%Utah 1,429 1,476 1,526 1,626 1,770 8.9% 23.9%Vermont 2,692 2,804 3,004 3,124 3,312 6.0% 23.0%Virginia 1,437 1,159 ^ 1,159 1,159 1,304 12.5% -9.3%WASHINGTON 1,515 1,584 1,641 1,743 1,982 13.7% 30.8%West Virginia 1,526 1,610 1,675 1,628 ^ 1,708 4.9% 11.9%Wisconsin 2,292 2,448 2,453 2,619 2,902 10.8% 26.6%Wyoming 1,262 1,364 1,431 1,501 1,575 4.9% 24.8%
Average** 1,584 1,633 1,721 1,808 1,957 8.3% 23.6%Washington Rank 22 23 24 24 23CHANGES FROM PREVIOUS YEAR:National Average 3.1% 5.4% 5.0% 8.3%Washington 4.6% 3.6% 6.2% 13.7%
*In-district rates for Arizona, Arkansas, Colorado, and Montana.**Does not include So. Dakota. Arizona - rates reflect estimate for 2002-03.^Fees reduced.

NATIONAL - TABLE 10NONRESIDENT TUITION AND REQUIRED FEES (Estimated State Averages)
COMMUNITY COLLEGES
1998-99 1999-00 2000-01 2001-02 2002-03 Percentage IncreaseOne Year Four Year
Alabama 2,378 2,958 3,050 3,708 3,910 5.4% 64.4%Alaska 6,588 2,028 ^ 2,088 2,148 2,208 2.8% -66.5%Arizona 4,708 4,927 5,035 5,093 5,348 5.0% 13.6%Arkansas 2,284 2,284 2,564 2,843 3,216 13.1% 40.8%California 3,900 4,050 4,230 4,020 ^ 4,380 9.0% 12.3%Colorado 6,821 7,594 7,826 8,352 8,702 4.2% 27.6%Connecticut 5,438 5,438 5,438 5,816 6,062 4.2% 11.5%Delaware 3,510 3,630 3,780 4,086 4,290 5.0% 22.2%Florida 4,877 5,130 5,382 5,624 5,806 3.2% 19.0%Georgia 4,926 5,118 5,354 5,326 ^ 5,546 4.1% 12.6%Hawaii 5,781 5,829 5,837 7,292 7,293 0.0% 26.2%Idaho 3,592 3,840 4,093 4,347 4,782 10.0% 33.1%Illinois 6,968 8,122 8,369 8,632 9,100 5.4% 30.6%Indiana 6,040 6,040 6,040 6,340 7,065 11.4% 17.0%Iowa 3,243 3,225 ^ 3,457 3,734 3,999 7.1% 23.3%Kansas 2,522 2,528 2,534 2,544 2,624 3.1% 4.0%Kentucky 3,260 3,380 3,530 4,350 4,608 5.9% 41.3%Louisiana 3,348 3,425 3,864 3,749 ^ 3,809 1.6% 13.8%Maine 4,470 4,470 4,470 4,470 4,470 0.0% 0.0%Maryland 5,790 7,346 5,711 ^ 5,752 6,208 7.9% 7.2%Massachusetts 7,676 8,241 8,510 8,636 9,719 12.5% 26.6%Michigan 2,198 2,250 2,285 2,482 2,596 4.6% 18.1%Minnesota 4,247 4,447 4,623 5,101 5,253 3.0% 23.7%Mississippi 2,486 2,844 2,898 3,140 3,286 4.6% 32.2%Missouri 2,770 2,887 3,013 3,129 3,500 11.9% 26.4%Montana 4,949 5,676 5,097 ^ 5,182 5,447 5.1% 10.1%Nebraska 1,610 1,649 1,705 1,773 1,840 3.8% 14.3%Nevada 5,023 5,220 5,425 5,610 5,795 3.3% 15.4%New Hampshire 7,920 8,312 8,976 8,460 ^ 9,903 17.1% 25.0%New Jersey 5,543 5,397 ^ 5,260 ^ 5,310 1.0%New Mexico 1,627 1,617 ^ 1,707 1,708 1,794 5.0% 10.3%New York 4,998 4,919 ^ 4,825 ^ 4,985 5,360 7.5% 7.2%North Carolina 4,564 4,753 5,432 5,544 6,104 10.1% 33.7%North Dakota 4,432 4,565 4,685 4,856 4,825 ^ -0.6% 8.9%Ohio 4,865 4,758 ^ 4,475 ^ 4,477 4,782 6.8% -1.7%Oklahoma 3,200 3,435 3,428 ^ 3,730 4,019 7.7% 25.6%Oregon 4,474 4,496 4,787 4,821 5,157 7.0% 15.3%Pennsylvania 6,126 6,223 6,316 6,619 6,556 ^ -1.0% 7.0%Rhode Island 4,764 4,764 4,932 5,074 5,428 7.0% 13.9%South Carolina 3,500 3,587 3,880 4,364 5,358 22.8% 53.1%Tennessee 4,626 4,896 5,306 6,084 6,532 7.4% 41.2%Texas 1,928 2,030 1,989 ^ 2,069 2,069 0.0% 7.3%Utah 4,945 5,119 5,315 5,675 6,029 6.2% 21.9%Vermont 5,260 5,480 5,764 5,980 6,672 11.6% 26.8%Virginia 4,848 4,990 5,115 5,175 5,682 9.8% 17.2%WASHINGTON 5,961 6,234 6,459 6,861 7,191 4.8% 20.6%West Virginia 4,874 5,079 5,349 5,342 ^ 5,702 6.7% 17.0%Wisconsin 7,766 8,452 9,037 10,285 11,602 12.8% 49.4%Wyoming 3,187 3,467 3,687 3,853 4,023 4.4% 26.2%
Average* 4,485 4,639 4,757 4,990 5,326 6.7% 18.8%Washington Rank 9 7 6 7 7CHANGES FROM PREVIOUS YEAR:National Average 3.4% 2.5% 4.9% 6.7%Washington 4.6% 3.6% 6.2% 4.8%
*Does not include or South Dakota. **New Jersey reported nonresident rates for the first time in 1999-00.^Fees reduced. ~AK eliminated the nonresident portion of tuition beginning in Fall 1999. AZ rates for 2002-03 are estimates.

Western States Comparison (WICHE)

WICHE STATES - TABLE 1RESIDENT UNDERGRADUATE TUITION AND REQUIRED FEES
FLAGSHIP UNIVERSITIES
1998-99 1999-00 2000-01 2001-02 2002-03 Percentage IncreaseOne Year Four Year
Alaska 2,770 2,845 3,420 3,495 3,595 2.9% 29.8%Arizona 2,158 2,259 2,344 2,486 2,583 3.9% 19.7%California 4,177 4,047 ^ 4,046 ^ 4,123 4,201 1.9% 0.6%Colorado 3,038 3,118 3,188 3,357 3,566 6.2% 17.4%Hawaii 3,046 3,142 3,157 3,253 3,349 3.0% 9.9%Idaho 2,136 2,348 2,476 2,720 3,044 11.9% 42.5%Montana 2,880 3,075 3,178 3,648 4,176 14.5% 45.0%Nevada 2,070 2,145 2,220 2,295 2,370 3.3% 14.5%New Mexico 2,241 2,430 2,795 3,026 3,170 4.8% 41.5%North Dakota 2,830 2,956 3,088 3,261 3,662 12.3% 29.4%Oregon 3,726 3,810 3,819 4,071 4,359 7.1% 17.0%South Dakota 3,015 3,243 3,448 3,642 3,872 6.3% 28.4%Utah 2,709 2,790 2,895 3,043 3,325 9.3% 22.7%WASHINGTON 3,495 3,638 3,761 3,983 4,566 14.6% 30.6%Wyoming 2,330 2,416 2,575 2,807 2,997 6.8% 28.6%
WICHE States Average 2,841 2,951 3,094 3,281 3,522 7.4% 24.0%
Washington Rank (n=15) 3 3 3 3 1
CHANGES FROM PREVIOUS YEAR:WICHE States Average (15)$ 109 143 187 242% Increase 3.9% 4.9% 6.0% 7.4%
Washington$ 143 123 222 583% Increase 4.1% 3.4% 5.9% 14.6%
^Fees reduced.
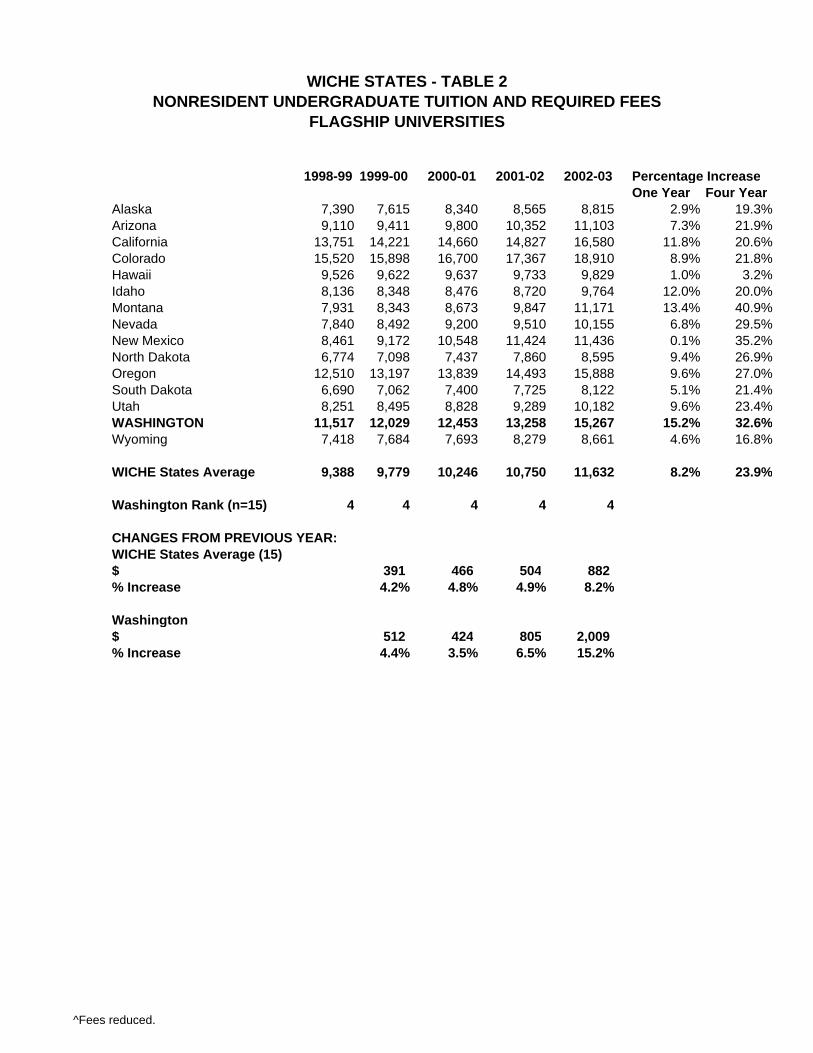
WICHE STATES - TABLE 2NONRESIDENT UNDERGRADUATE TUITION AND REQUIRED FEES
FLAGSHIP UNIVERSITIES
1998-99 1999-00 2000-01 2001-02 2002-03 Percentage IncreaseOne Year Four Year
Alaska 7,390 7,615 8,340 8,565 8,815 2.9% 19.3%Arizona 9,110 9,411 9,800 10,352 11,103 7.3% 21.9%California 13,751 14,221 14,660 14,827 16,580 11.8% 20.6%Colorado 15,520 15,898 16,700 17,367 18,910 8.9% 21.8%Hawaii 9,526 9,622 9,637 9,733 9,829 1.0% 3.2%Idaho 8,136 8,348 8,476 8,720 9,764 12.0% 20.0%Montana 7,931 8,343 8,673 9,847 11,171 13.4% 40.9%Nevada 7,840 8,492 9,200 9,510 10,155 6.8% 29.5%New Mexico 8,461 9,172 10,548 11,424 11,436 0.1% 35.2%North Dakota 6,774 7,098 7,437 7,860 8,595 9.4% 26.9%Oregon 12,510 13,197 13,839 14,493 15,888 9.6% 27.0%South Dakota 6,690 7,062 7,400 7,725 8,122 5.1% 21.4%Utah 8,251 8,495 8,828 9,289 10,182 9.6% 23.4%WASHINGTON 11,517 12,029 12,453 13,258 15,267 15.2% 32.6%Wyoming 7,418 7,684 7,693 8,279 8,661 4.6% 16.8%
WICHE States Average 9,388 9,779 10,246 10,750 11,632 8.2% 23.9%
Washington Rank (n=15) 4 4 4 4 4
CHANGES FROM PREVIOUS YEAR:WICHE States Average (15)$ 391 466 504 882 % Increase 4.2% 4.8% 4.9% 8.2%
Washington$ 512 424 805 2,009 % Increase 4.4% 3.5% 6.5% 15.2%
^Fees reduced.

WICHE STATES - TABLE 3RESIDENT GRADUATE TUITION AND REQUIRED FEES
FLAGSHIP UNIVERSITIES
1998-99 1999-00 2000-01 2001-02 2002-03 Percentage IncreaseOne Year Four Year
Alaska 3,700 3,800 5,088 4,520 ^ 5,386 19.2% 45.6%Arizona 2,158 2,259 2,344 2,486 2,583 3.9% 19.7%California 4,409 4,269 ^ 4,268 ^ 4,349 4,431 1.9% 0.5%Colorado 3,822 3,920 4,014 4,217 4,480 6.2% 17.2%Hawaii 4,030 4,150 4,165 4,309 4,453 3.3% 10.5%Idaho 2,676 2,888 3,016 3,260 3,584 9.9% 33.9%Montana 2,839 3,025 3,128 3,433 3,884 13.1% 36.8%Nevada 1,860 1,930 2,000 2,070 2,140 3.4% 15.1%New Mexico 2,474 2,682 3,084 3,341 3,485 4.3% 40.9%North Dakota 3,040 3,166 3,298 3,471 3,887 12.0% 27.9%Oregon 6,384 6,750 7,056 7,497 7,848 4.7% 22.9%South Dakota 2,592 2,767 2,925 3,075 3,255 5.9% 25.6%Utah 2,198 2,262 2,348 2,489 2,760 10.9% 25.6%WASHINGTON 5,433 5,583 5,745 5,929 6,438 8.6% 18.5%Wyoming 2,816 2,920 3,117 3,386 3,585 5.9% 27.3%
WICHE States Average 3,362 3,491 3,706 3,855 4,147 7.6% 23.3%
Washington Rank (n=15) 2 2 2 2 2
CHANGES FROM PREVIOUS YEAR:WICHE States Average (15)$ 129 215 149 291 % Increase 3.8% 6.2% 4.0% 7.6%
Washington$ 150 162 184 509 % Increase 2.8% 2.9% 3.2% 8.6%
^Fees reduced.*University of Washington rates reflect tier I graduate level.

WICHE STATES - TABLE 4NONRESIDENT GRADUATE TUITION AND REQUIRED FEES
FLAGSHIP UNIVERSITIES
1998-99 1999-00 2000-01 2001-02 2002-03 Percentage IncreaseOne Year Four Year
Alaska 6,780 6,980 9,024 7,900 ^ 9,288 17.6% 37.0%Arizona 9,110 9,411 9,800 10,352 11,103 7.3% 21.9%California 13,793 14,263 14,702 15,053 15,753 4.7% 14.2%Colorado 15,304 15,686 16,506 17,367 18,910 8.9% 23.6%Hawaii 9,958 10,078 10,093 10,309 10,525 2.1% 5.7%Idaho 8,676 8,888 9,016 9,260 10,304 11.3% 18.8%Montana 7,315 7,694 7,997 8,927 10,084 13.0% 37.9%Nevada 7,630 8,277 8,980 9,285 9,925 6.9% 30.1%New Mexico 8,722 9,456 10,874 11,777 11,777 0.0% 35.0%North Dakota 7,336 7,658 7,997 8,421 9,196 9.2% 25.4%Oregon 10,812 11,409 11,958 12,645 13,254 4.8% 22.6%South Dakota 5,916 6,220 6,499 6,766 7,097 4.9% 20.0%Utah 6,614 6,812 7,081 7,543 8,396 11.3% 26.9%WASHINGTON 13,479 13,872 14,283 14,766 15,525 5.1% 15.2%Wyoming 7,906 8,190 8,199 8,858 9,273 4.7% 17.3%
WICHE States Average 9,290 9,660 10,201 10,615 11,361 7.0% 22.3%
Washington Rank (n=15) 3 3 3 3 3
CHANGES FROM PREVIOUS YEAR:WICHE States Average (15)$ 370 541 415 745 % Increase 4.0% 5.6% 4.1% 7.0%
Washington$ 393 411 483 759 % Increase 2.9% 3.0% 3.4% 5.1%
^Fees reduced.*University of Washington rates reflect tier I graduate level.

WICHE STATES - TABLE 5RESIDENT UNDERGRADUATE TUITION AND REQUIRED FEES (State Averages)
COMPREHENSIVE COLLEGES AND UNIVERSITIES
# 1998-99 1999-00 2000-01 2001-02 2002-03 Percentage IncreaseOne Year Four Year
Arizona 2 2,158 2,259 2,344 2,486 2,583 3.9% 19.7%California 11 1,878 1,847 ^ 1,859 1,897 1,993 5.1% 6.1%Colorado 5 2,238 2,302 2,353 2,511 2,704 7.7% 20.8%Idaho 2 2,156 2,340 2,514 2,732 3,060 12.0% 41.9%Montana 2 2,677 2,823 2,924 3,222 3,707 15.0% 38.5%Nevada 1 2,070 2,145 2,220 2,295 2,370 3.3% 14.5%New Mexico 1 1,708 1,762 1,933 2,042 2,222 8.8% 30.1%North Dakota 4 2,623 2,709 2,790 2,909 3,307 13.7% 26.1%Oregon 4 3,305 3,362 3,435 3,650 3,773 3.4% 14.2%South Dakota 2 3,008 3,258 3,485 3,702 3,987 7.7% 32.5%Utah 1 1,986 2,042 2,106 2,252 2,427 7.8% 22.2%WASHINGTON 3 2,657 2,796 2,890 3,071 3,471 13.0% 30.6%
WICHE States Average* 2,372 2,470 2,571 2,731 2,967 8.7% 25.1%
Washington Rank (n=12) 4 4 4 4 4
CHANGES FROM PREVIOUS YEAR:WICHE States Average (12)$ 98 101 160 236 % Increase 4.1% 4.1% 6.2% 8.7%
Washington$ 139 94 181 400 % Increase 5.2% 3.4% 6.3% 13.0%
#Number of institutions in survey.*Does not include Alaska, Hawaii, or Wyoming.^Fees reduced.

WICHE STATES - TABLE 6NONRESIDENT UNDERGRADUATE TUITION AND REQUIRED FEES (State Averages)
COMPREHENSIVE COLLEGES AND STATE UNIVERSITIES
# 1998-99 1999-00 2000-01 2001-02 2002-03 Percentage IncreaseOne Year Four Year
Arizona 2 8,592 8,893 9,288 10,352 11,103 7.3% 29.2%California 11 9,259 9,965 9,241 ^ 9,279 10,453 12.7% 12.9%Colorado 5 7,916 8,074 8,406 8,851 9,501 7.3% 20.0%Idaho 2 8,216 8,400 8,634 8,952 9,380 4.8% 14.2%Montana 2 7,358 7,726 8,056 9,049 10,319 14.0% 40.3%Nevada 1 7,840 8,492 9,200 9,510 10,155 6.8% 29.5%New Mexico 1 6,205 6,440 7,078 7,706 8,438 9.5% 36.0%North Dakota 4 5,737 5,952 6,167 6,435 7,060 9.7% 23.1%Oregon 4 8,706 9,090 9,567 10,020 10,385 3.6% 19.3%South Dakota 2 6,683 7,077 7,438 7,785 8,236 5.8% 23.2%Utah 1 5,886 6,058 6,283 6,718 7,295 8.6% 23.9%WASHINGTON 3 9,350 9,761 9,989 10,651 11,626 9.2% 24.3%
WICHE States Average* 7,646 7,994 8,279 8,776 9,496 8.2% 24.2%
Washington Rank (n=12) 1 2 1 1 1
CHANGES FROM PREVIOUS YEAR:WICHE States Average (12)$ 348 285 497 720 % Increase 4.6% 3.6% 6.0% 8.2%
Washington$ 411 228 662 975 % Increase 4.4% 2.3% 6.6% 9.2%
#Number of institutions in survey.*Does not include Alaska, Hawaii, or Wyoming.^Fees reduced.
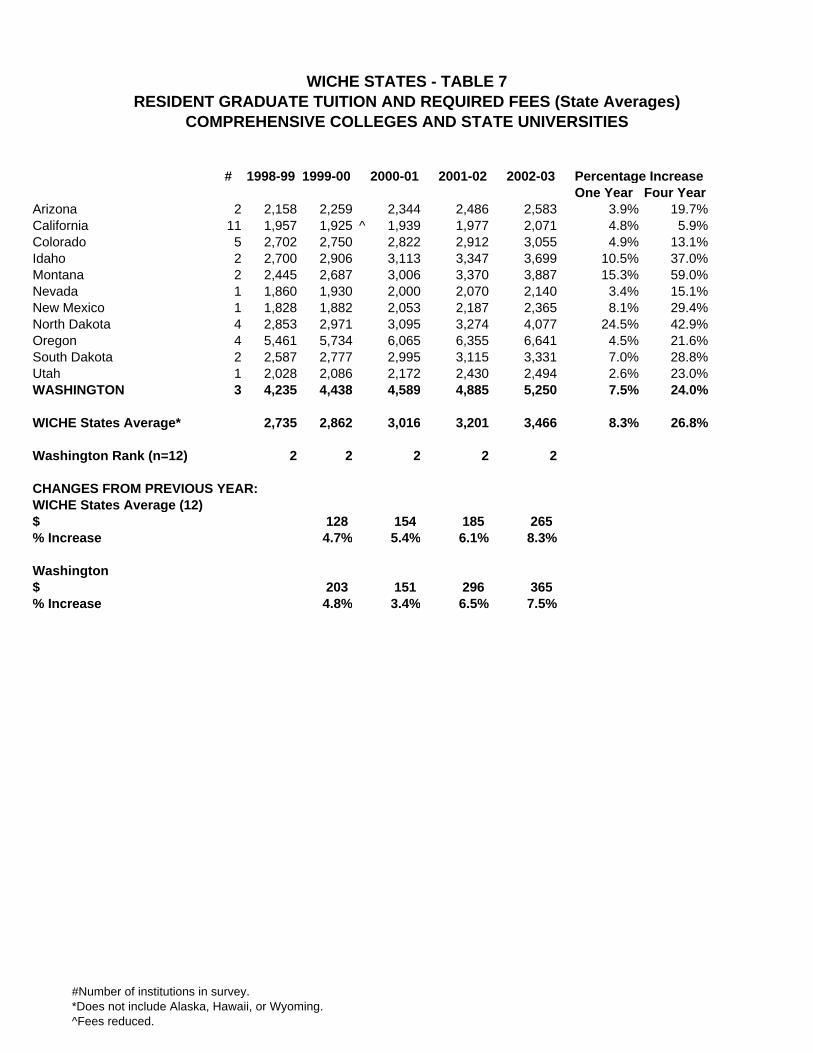
WICHE STATES - TABLE 7RESIDENT GRADUATE TUITION AND REQUIRED FEES (State Averages)
COMPREHENSIVE COLLEGES AND STATE UNIVERSITIES
# 1998-99 1999-00 2000-01 2001-02 2002-03 Percentage IncreaseOne Year Four Year
Arizona 2 2,158 2,259 2,344 2,486 2,583 3.9% 19.7%California 11 1,957 1,925 ^ 1,939 1,977 2,071 4.8% 5.9%Colorado 5 2,702 2,750 2,822 2,912 3,055 4.9% 13.1%Idaho 2 2,700 2,906 3,113 3,347 3,699 10.5% 37.0%Montana 2 2,445 2,687 3,006 3,370 3,887 15.3% 59.0%Nevada 1 1,860 1,930 2,000 2,070 2,140 3.4% 15.1%New Mexico 1 1,828 1,882 2,053 2,187 2,365 8.1% 29.4%North Dakota 4 2,853 2,971 3,095 3,274 4,077 24.5% 42.9%Oregon 4 5,461 5,734 6,065 6,355 6,641 4.5% 21.6%South Dakota 2 2,587 2,777 2,995 3,115 3,331 7.0% 28.8%Utah 1 2,028 2,086 2,172 2,430 2,494 2.6% 23.0%WASHINGTON 3 4,235 4,438 4,589 4,885 5,250 7.5% 24.0%
WICHE States Average* 2,735 2,862 3,016 3,201 3,466 8.3% 26.8%
Washington Rank (n=12) 2 2 2 2 2
CHANGES FROM PREVIOUS YEAR:WICHE States Average (12)$ 128 154 185 265 % Increase 4.7% 5.4% 6.1% 8.3%
Washington$ 203 151 296 365 % Increase 4.8% 3.4% 6.5% 7.5%
#Number of institutions in survey.*Does not include Alaska, Hawaii, or Wyoming.^Fees reduced.

WICHE STATES - TABLE 8NONRESIDENT GRADUATE TUITION AND REQUIRED FEES (State Averages)
COMPREHENSIVE COLLEGES AND STATE UNIVERSITIES
# 1998-99 1999-00 2000-01 2001-02 2002-03 Percentage IncreaseOne Year Four Year
Arizona 2 8,592 8,893 9,288 10,352 11,103 7.3% 29.2%California 11 9,337 10,042 9,319 ^ 9,357 10,532 12.6% 12.8%Colorado 5 8,787 8,867 9,207 9,638 10,349 7.4% 17.8%Idaho 2 8,760 8,966 9,233 9,567 10,019 4.7% 14.4%Montana 2 5,845 6,505 7,319 8,233 9,372 13.8% 60.3%Nevada 1 7,630 8,277 8,980 9,285 9,925 6.9% 30.1%New Mexico 1 6,325 6,560 7,198 7,851 8,605 9.6% 36.0%North Dakota 4 7,149 7,463 7,794 8,224 9,349 13.7% 30.8%Oregon 4 9,569 10,034 10,536 10,994 11,531 4.9% 20.5%South Dakota 2 5,911 6,230 6,524 6,821 7,173 5.2% 21.3%Utah 1 6,054 6,234 6,484 7,344 7,974 8.6% 31.7%WASHINGTON 3 12,815 13,367 13,681 14,591 15,688 7.5% 22.4%
WICHE States Average* 8,065 8,453 8,797 9,355 10,135 8.3% 25.7%
Washington Rank (n=12) 1 1 1 1 1
CHANGES FROM PREVIOUS YEAR:WICHE States Average (12)$ 389 344 558 780 % Increase 4.8% 4.1% 6.3% 8.3%
Washington$ 552 314 910 1,097 % Increase 4.3% 2.3% 6.7% 7.5%
#Number of institutions in survey.*Does not include Alaska, Hawaii, or Wyoming.^Fees reduced.

WICHE STATES - TABLE 9RESIDENT* TUITION AND REQUIRED FEES (Estimated State Averages)
COMMUNITY COLLEGES
1998-99 1999-00 2000-01 2001-02 2002-03 Percentage IncreaseOne Year Four Year
Alaska 1,968 2,028 2,088 2,148 2,208 2.8% 12.2%Arizona 831 854 903 930 977 5.1% 17.6%California 360 330 ^ 330 330 330 0.0% -8.3%Colorado 1,877 1,904 1,920 1,999 2,117 5.9% 12.8%Hawaii 1,005 1,053 1,061 1,322 1,323 0.1% 31.6%Idaho 1,179 1,250 1,313 1,406 1,547 10.0% 31.2%Montana 1,529 1,802 1,944 1,818 ^ 1,891 4.0% 23.7%Nevada 1,185 1,230 1,275 1,320 1,365 3.4% 15.2%New Mexico 664 677 714 744 768 3.2% 15.7%North Dakota 1,840 1,906 1,954 2,040 2,263 10.9% 23.0%Oregon 1,628 1,661 1,828 1,934 2,059 6.5% 26.5%Utah 1,429 1,476 1,526 1,626 1,770 8.9% 23.9%WASHINGTON 1,515 1,584 1,641 1,743 1,982 13.7% 30.8%Wyoming 1,262 1,364 1,431 1,501 1,575 4.9% 24.8%
WICHE States Average* 1,305 1,366 1,423 1,490 1,584 6.3% 21.4%
Washington Rank (n=14) 6 6 6 6 5
CHANGES FROM PREVIOUS YEAR:WICHE States Average (14)$ 61 58 67 94 % Increase 4.6% 4.2% 4.7% 6.3%
Washington$ 69 57 102 239 % Increase 4.6% 3.6% 6.2% 13.7%
*South Dakota is not included.^Fees reduced.

WICHE STATES - TABLE 10NONRESIDENT TUITION AND REQUIRED FEES (Estimated State Averages)
COMMUNITY COLLEGES
1998-99 1999-00 2000-01 2001-02 2002-03 Percentage IncreaseOne Year Four Year
Alaska 6,588 2,028 ^ 2,088 2,148 2,208 2.8% -66.5%Arizona 4,708 4,927 5,035 5,093 5,348 5.0% 13.6%California 3,900 4,050 4,230 4,020 ^ 4,380 9.0% 12.3%Colorado 6,821 7,594 7,826 8,352 8,702 4.2% 27.6%Hawaii 5,781 5,829 5,837 7,292 7,293 0.0% 26.2%Idaho 3,592 3,840 4,093 4,347 4,782 10.0% 33.1%Montana 4,949 5,676 5,097 ^ 5,182 5,447 5.1% 10.1%Nevada 5,023 5,220 5,425 5,610 5,795 3.3% 15.4%New Mexico 1,627 1,617 ^ 1,707 1,708 1,794 5.0% 10.3%North Dakota 4,432 4,565 4,685 4,856 4,825 ^ -0.6% 8.9%Oregon 4,474 4,496 4,787 4,821 5,157 7.0% 15.3%Utah 4,945 5,119 5,315 5,675 6,029 6.2% 21.9%WASHINGTON 5,961 6,234 6,459 6,861 7,191 4.8% 20.6%Wyoming 3,187 3,467 3,687 3,853 4,023 4.4% 26.2%
WICHE States Average** 4,713 4,619 4,734 4,987 5,212 4.5% 10.6%
Washington Rank (n=14) 3 2 2 3 3
CHANGES FROM PREVIOUS YEAR:WICHE States Average (14)$ (95) 115 253 225 % Increase -2.0% 2.5% 5.4% 4.5%
Washington$ 273 225 402 330 % Increase 4.6% 3.6% 6.2% 4.8%
^Fees reduced.*Alaska eliminated the nonresident portion of tuition beginning Fall 1999.**South Dakota is not included.
Peer Institution Comparison
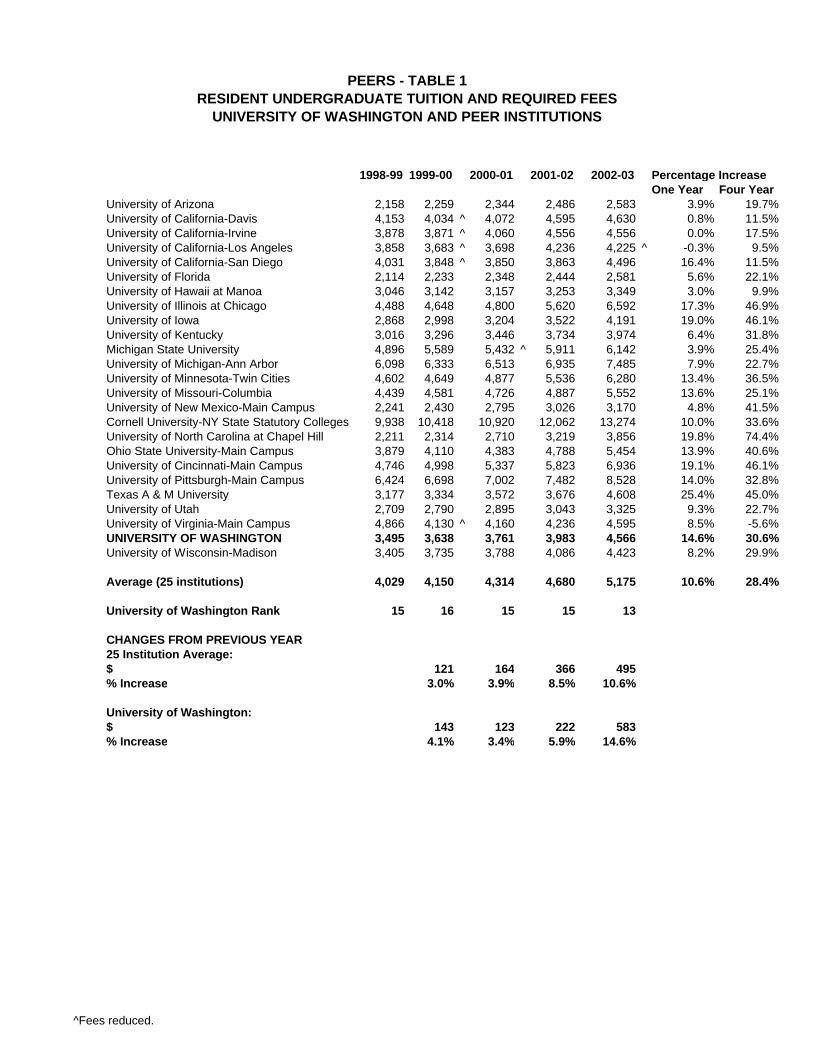
PEERS - TABLE 1RESIDENT UNDERGRADUATE TUITION AND REQUIRED FEES
UNIVERSITY OF WASHINGTON AND PEER INSTITUTIONS
1998-99 1999-00 2000-01 2001-02 2002-03 Percentage IncreaseOne Year Four Year
University of Arizona 2,158 2,259 2,344 2,486 2,583 3.9% 19.7%University of California-Davis 4,153 4,034 ^ 4,072 4,595 4,630 0.8% 11.5%University of California-Irvine 3,878 3,871 ^ 4,060 4,556 4,556 0.0% 17.5%University of California-Los Angeles 3,858 3,683 ^ 3,698 4,236 4,225 ^ -0.3% 9.5%University of California-San Diego 4,031 3,848 ^ 3,850 3,863 4,496 16.4% 11.5%University of Florida 2,114 2,233 2,348 2,444 2,581 5.6% 22.1%University of Hawaii at Manoa 3,046 3,142 3,157 3,253 3,349 3.0% 9.9%University of Illinois at Chicago 4,488 4,648 4,800 5,620 6,592 17.3% 46.9%University of Iowa 2,868 2,998 3,204 3,522 4,191 19.0% 46.1%University of Kentucky 3,016 3,296 3,446 3,734 3,974 6.4% 31.8%Michigan State University 4,896 5,589 5,432 ^ 5,911 6,142 3.9% 25.4%University of Michigan-Ann Arbor 6,098 6,333 6,513 6,935 7,485 7.9% 22.7%University of Minnesota-Twin Cities 4,602 4,649 4,877 5,536 6,280 13.4% 36.5%University of Missouri-Columbia 4,439 4,581 4,726 4,887 5,552 13.6% 25.1%University of New Mexico-Main Campus 2,241 2,430 2,795 3,026 3,170 4.8% 41.5%Cornell University-NY State Statutory Colleges 9,938 10,418 10,920 12,062 13,274 10.0% 33.6%University of North Carolina at Chapel Hill 2,211 2,314 2,710 3,219 3,856 19.8% 74.4%Ohio State University-Main Campus 3,879 4,110 4,383 4,788 5,454 13.9% 40.6%University of Cincinnati-Main Campus 4,746 4,998 5,337 5,823 6,936 19.1% 46.1%University of Pittsburgh-Main Campus 6,424 6,698 7,002 7,482 8,528 14.0% 32.8%Texas A & M University 3,177 3,334 3,572 3,676 4,608 25.4% 45.0%University of Utah 2,709 2,790 2,895 3,043 3,325 9.3% 22.7%University of Virginia-Main Campus 4,866 4,130 ^ 4,160 4,236 4,595 8.5% -5.6%UNIVERSITY OF WASHINGTON 3,495 3,638 3,761 3,983 4,566 14.6% 30.6%University of Wisconsin-Madison 3,405 3,735 3,788 4,086 4,423 8.2% 29.9%
Average (25 institutions) 4,029 4,150 4,314 4,680 5,175 10.6% 28.4%
University of Washington Rank 15 16 15 15 13
CHANGES FROM PREVIOUS YEAR25 Institution Average:$ 121 164 366 495% Increase 3.0% 3.9% 8.5% 10.6%
University of Washington:$ 143 123 222 583% Increase 4.1% 3.4% 5.9% 14.6%
^Fees reduced.

PEERS - TABLE 2NONRESIDENT UNDERGRADUATE TUITION AND REQUIRED FEES
UNIVERSITY OF WASHINGTON AND PEER INSTITUTIONS
1998-99 1999-00 2000-01 2001-02 2002-03 Percentage IncreaseOne Year Four Year
University of Arizona 9,110 9,411 9,800 10,352 11,103 7.3% 21.9%University of California-Davis 13,727 14,208 14,686 15,669 17,009 8.6% 23.9%University of California-Irvine 13,451 14,045 15,856 15,630 ^ 16,058 2.7% 19.4%University of California-Los Angeles 13,431 13,857 14,312 14,940 16,604 11.1% 23.6%University of California-San Diego 14,309 14,022 ^ 15,032 14,567 ^ 16,640 14.2% 16.3%University of Florida 8,769 9,222 9,686 10,332 12,046 16.6% 37.4%University of Hawaii at Manoa 9,526 9,622 9,637 9,733 9,829 1.0% 3.2%University of Illinois at Chicago 10,580 10,924 11,264 12,280 13,920 13.4% 31.6%University of Iowa 9,990 10,440 10,966 11,950 13,833 15.8% 38.5%University of Kentucky 8,376 9,216 9,666 10,274 10,526 2.5% 25.7%Michigan State University 12,126 12,992 13,056 14,214 15,210 7.0% 25.4%University of Michigan-Ann Arbor 19,156 19,761 20,323 21,645 23,365 7.9% 22.0%University of Minnesota-Twin Cities 12,277 12,789 13,463 15,002 16,854 12.3% 37.3%University of Missouri-Columbia 12,107 12,495 12,895 13,332 14,705 10.3% 21.5%University of New Mexico-Main Campus 8,461 9,172 10,548 11,424 11,436 0.1% 35.2%Cornell University-NY State Statutory Colleges 18,988 19,988 20,990 22,292 23,624 6.0% 24.4%University of North Carolina at Chapel Hill 11,377 11,480 11,876 13,211 15,140 14.6% 33.1%Ohio State University-Main Campus 11,448 12,060 12,732 13,554 14,877 9.8% 30.0%University of Cincinnati-Main Campus 12,252 12,379 13,614 14,760 17,319 17.3% 41.4%University of Pittsburgh-Main Campus 13,458 14,014 14,684 15,740 17,336 10.1% 28.8%Texas A & M University 9,567 10,052 9,592 ^ 9,584 ^ 10,712 11.8% 12.0%University of Utah 8,251 8,495 8,828 9,289 10,182 9.6% 23.4%University of Virginia-Main Campus 15,814 16,603 17,409 18,268 19,805 8.4% 25.2%UNIVERSITY OF WASHINGTON 11,517 12,029 12,453 13,258 15,267 15.2% 32.6%University of Wisconsin-Madison 11,586 13,049 14,186 16,318 18,423 12.9% 59.0%
Average (25 institutions) 11,986 12,493 13,102 13,905 15,273 9.8% 27.4%
University of Washington Rank 14 15 15 15 12
CHANGES FROM PREVIOUS YEAR25 Institution Average:$ 507 609 803 1,368% Increase 4.2% 4.9% 6.1% 9.8%
University of Washington:$ 512 424 805 2,009% Increase 4.4% 3.5% 6.5% 15.2%
^Fees reduced.

PEERS - TABLE 3RESIDENT GRADUATE TUITION AND REQUIRED FEES
UNIVERSITY OF WASHINGTON AND PEER INSTITUTIONS
1998-99 1999-00 2000-01 2001-02 2002-03 Percentage IncreaseOne Year Four Year
University of Arizona 2,158 2,259 2,344 2,486 2,583 3.9% 19.7%University of California-Davis 4,483 4,319 ^ 4,591 4,831 4,902 1.5% 9.3%University of California-Irvine 5,180 5,158 ^ 5,296 5,294 ^ 5,294 0.0% 2.2%University of California-Los Angeles 4,550 4,405 ^ 4,503 4,551 4,549 ^ 0.0% 0.0%University of California-San Diego 4,889 4,697 ^ 4,885 4,943 5,018 1.5% 2.6%University of Florida 2,801 2,951 3,108 3,273 3,587 9.6% 28.1%University of Hawaii at Manoa 4,030 4,150 4,165 4,309 4,453 3.3% 10.5%University of Illinois at Chicago 3,835 4,010 4,144 4,628 5,512 19.1% 43.7%University of Iowa 3,368 3,520 3,750 4,108 4,887 19.0% 45.1%University of Kentucky 3,276 3,596 3,766 4,074 4,346 6.7% 32.7%Michigan State University 5,916 6,674 6,290 ^ 6,510 7,093 9.0% 19.9%University of Michigan-Ann Arbor 10,192 10,501 10,821 11,523 12,197 5.8% 19.7%University of Minnesota-Twin Cities 5,611 5,517 ^ 5,794 6,547 7,662 17.0% 36.6%University of Missouri-Columbia 4,439 4,580 4,728 4,885 5,497 12.5% 23.8%University of New Mexico-Main Campus 2,474 2,682 3,084 3,341 3,485 4.3% 40.9%Cornell University-NY State Statutory Colleges 11,548 12,148 12,750 13,960 15,250 9.2% 32.1%University of North Carolina at Chapel Hill 2,202 2,354 2,807 3,391 4,043 19.2% 83.6%Ohio State University-Main Campus 5,445 5,730 6,048 6,333 6,639 4.8% 21.9%University of Cincinnati-Main Campus 5,586 5,880 6,264 6,822 8,094 18.6% 44.9%University of Pittsburgh-Main Campus 8,498 8,818 9,234 9,890 11,286 14.1% 32.8%Texas A & M University 2,732 3,002 3,186 3,506 4,720 34.6% 72.8%University of Utah 2,198 2,262 2,348 2,489 2,760 10.9% 25.6%University of Virginia-Main Campus 4,866 4,916 5,023 5,178 5,661 9.3% 16.3%UNIVERSITY OF WASHINGTON 5,433 5,583 5,745 5,929 6,438 8.6% 18.5%University of Wisconsin-Madison 4,926 5,403 5,884 6,358 6,877 8.2% 39.6%
Average (25 institutions) 4,825 5,005 5,222 5,566 6,113 9.8% 26.7%
University of Washington Rank 8 7 9 9 9
CHANGES FROM PREVIOUS YEAR25 Institution Average:$ 179 218 344 547% Increase 3.7% 4.4% 6.6% 9.8%
University of Washington:$ 150 162 184 509% Increase 2.8% 2.9% 3.2% 8.6%
^Fees reduced.*University of Washington rates reflect graduate tier I level.

PEERS - TABLE 4NONRESIDENT GRADUATE TUITION AND REQUIRED FEESUNIVERSITY OF WASHINGTON AND PEER INSTITUTIONS
1998-99 1999-00 2000-01 2001-02 2002-03 Percentage IncreaseOne Year Four Year
University of Arizona 9,110 9,411 9,800 10,352 11,103 7.3% 21.9%University of California-Davis 13,867 14,308 15,025 15,725 16,224 3.2% 17.0%University of California-Irvine 14,564 15,158 15,730 16,188 16,616 2.6% 14.1%University of California-Los Angeles 13,934 14,399 14,937 15,444 15,871 2.8% 13.9%University of California-San Diego 14,273 14,691 15,319 15,647 16,340 4.4% 14.5%University of Florida 9,672 10,166 10,609 11,416 13,359 17.0% 38.1%University of Hawaii at Manoa 9,958 10,078 10,093 10,309 10,525 2.1% 5.7%University of Illinois at Chicago 8,131 8,570 8,840 9,464 10,834 14.5% 33.2%University of Iowa 10,404 10,874 11,420 12,330 14,271 15.7% 37.2%University of Kentucky 9,156 10,116 10,626 11,294 11,564 2.4% 26.3%Michigan State University 11,376 12,296 12,110 ^ 12,510 13,603 8.7% 19.6%University of Michigan-Ann Arbor 20,484 21,107 21,749 23,163 24,517 5.8% 19.7%University of Minnesota-Twin Cities 10,555 10,377 ^ 10,921 12,200 14,220 16.6% 34.7%University of Missouri-Columbia 12,275 12,668 13,075 13,515 14,855 9.9% 21.0%University of New Mexico-Main Campus 8,722 9,456 10,874 11,777 11,777 0.0% 35.0%Cornell University-NY State Statutory Colleges 11,548 12,148 12,750 13,960 15,250 9.2% 32.1%University of North Carolina at Chapel Hill 11,368 11,520 11,973 13,702 15,692 14.5% 38.0%Ohio State University-Main Campus 14,145 14,865 15,639 16,404 17,214 4.9% 21.7%University of Cincinnati-Main Campus 10,524 11,067 11,709 12,705 14,931 17.5% 41.9%University of Pittsburgh-Main Campus 16,988 17,648 18,506 19,856 21,872 10.2% 28.7%Texas A & M University 6,991 7,322 7,486 7,726 8,531 10.4% 22.0%University of Utah 6,614 6,812 7,081 7,543 8,396 11.3% 26.9%University of Virginia-Main Campus 15,814 16,603 17,409 18,268 18,751 2.6% 18.6%UNIVERSITY OF WASHINGTON 13,479 13,872 14,283 14,766 15,525 5.1% 15.2%University of Wisconsin-Madison 15,188 17,107 18,594 20,496 22,147 8.1% 45.8%
Average (25 institutions) 11,966 12,506 13,062 13,870 14,960 7.9% 25.0%
University of Washington Rank 10 10 10 10 11
CHANGES FROM PREVIOUS YEAR25 Institution Average:$ 540 557 808 1,089% Increase 4.5% 4.5% 6.2% 7.9%
University of Washington:$ 393 411 483 759% Increase 2.9% 3.0% 3.4% 5.1%
^Fees reduced.*University of Washington rates reflect graduate tier I level.

PEERS - TABLE 5RESIDENT UNDERGRADUATE TUITION AND REQUIRED FEESWASHINGTON STATE UNIVERSITY AND PEER INSTITUTIONS
1998-99 1999-00 2000-01 2001-02 2002-03 Percentage IncreaseOne Year Four Year
Auburn University-Main Campus 2,760 2,895 3,154 3,380 3,784 12.0% 37.1%University of California-Davis 4,153 4,034 ^ 4,072 4,595 4,630 0.8% 11.5%Colorado State University 3,037 3,054 3,133 3,252 3,435 5.6% 13.1%University of Florida 2,114 2,233 2,348 2,444 2,581 5.6% 22.1%University of Georgia 2,930 3,034 3,276 3,418 3,616 5.8% 23.4%University of Illinois at Urbana 4,586 4,770 4,994 5,754 6,704 16.5% 46.2%Purdue University-Main Campus 3,564 3,724 3,872 4,164 5,080 22.0% 42.5%Iowa State University 2,874 3,004 3,132 3,442 4,110 19.4% 43.0%Kansas State Univ of Ag and App Sci 2,544 2,592 2,781 2,835 3,444 21.5% 35.4%Louisiana St Univ A&M 2,841 2,851 3,395 3,395 3,536 4.2% 24.5%Michigan State University 4,896 5,589 5,432 ^ 5,911 6,142 3.9% 25.4%University of Minnesota-Twin Cities 4,602 4,649 4,877 5,536 6,280 13.4% 36.5%Mississippi State University 3,017 3,017 3,117 3,586 3,873 8.0% 28.4%University of Missouri-Columbia 4,439 4,581 4,726 4,887 5,552 13.6% 25.1%Cornell University-NY State Statutory Colleges 9,938 10,418 10,920 12,062 13,274 10.0% 33.6%North Carolina State University at Raleigh 2,310 2,414 2,814 3,228 3,827 18.6% 65.7%Ohio State University-Main Campus 3,879 4,110 4,383 4,788 5,454 13.9% 40.6%Oklahoma State University-Main Campus 2,394 2,548 2,672 2,811 2,974 5.8% 24.2%University of Tennessee-Knoxville 2,744 3,104 3,362 3,784 4,056 7.2% 47.8%Texas A & M University 3,177 3,334 3,572 3,676 4,608 25.4% 45.0%Virginia Tech 4,305 3,620 ^ 3,640 3,664 3,936 7.4% -8.6%WASHINGTON STATE UNIVERSITY 3,396 3,530 3,658 3,898 4,520 16.0% 33.1%University of Wisconsin-Madison 3,405 3,735 3,788 4,086 4,423 8.2% 29.9%
Average (23 institutions) 3,648 3,776 3,962 4,287 4,776 11.4% 30.9%
Washington State University Rank 11 11 10 10 10
CHANGES FROM PREVIOUS YEAR23 Institution Average:$ 128 186 325 489% Increase 3.5% 4.9% 8.2% 11.4%
Washington State University:$ 134 128 240 622% Increase 3.9% 3.6% 6.6% 16.0%
^Fees reduced.

PEERS - TABLE 6NONRESIDENT UNDERGRADUATE TUITION AND REQUIRED FEES
WASHINGTON STATE UNIVERSITY AND PEER INSTITUTIONS
1998-99 1999-00 2000-01 2001-02 2002-03 Percentage IncreaseOne Year Four Year
Auburn University-Main Campus 8,280 8,685 9,150 9,900 11,084 12.0% 33.9%University of California-Davis 13,727 14,208 14,686 15,669 17,009 8.6% 23.9%Colorado State University 10,543 10,740 11,153 11,694 12,705 8.6% 20.5%University of Florida 8,769 9,222 9,686 10,332 12,046 16.6% 37.4%University of Georgia 9,860 10,276 10,794 11,314 12,986 14.8% 31.7%University of Illinois at Urbana 11,402 11,862 12,442 13,574 15,308 12.8% 34.3%Purdue University-Main Campus 11,784 12,348 12,904 13,872 15,760 13.6% 33.7%Iowa State University 9,152 9,564 9,974 10,776 12,802 18.8% 39.9%Kansas State Univ of Ag and App Sci 8,992 9,195 9,549 9,762 10,704 9.6% 19.0%Louisiana St Univ A&M 6,621 7,051 8,695 8,695 8,836 1.6% 33.5%Michigan State University 12,126 12,992 13,056 14,214 15,210 7.0% 25.4%University of Minnesota-Twin Cities 12,277 12,789 13,463 15,002 16,854 12.3% 37.3%Mississippi State University 6,119 6,119 7,065 8,128 8,778 8.0% 43.5%University of Missouri-Columbia 12,107 12,495 12,895 13,332 14,705 10.3% 21.5%Cornell University-NY State Statutory Colleges 18,988 19,988 20,990 22,292 23,624 6.0% 24.4%North Carolina State University at Raleigh 11,476 11,580 11,980 13,220 15,111 14.3% 31.7%Ohio State University-Main Campus 11,448 12,060 12,732 13,554 14,877 9.8% 30.0%Oklahoma State University-Main Campus 6,414 6,883 7,007 7,535 8,028 6.5% 25.2%University of Tennessee-Knoxville 7,800 9,172 10,216 11,570 12,408 7.2% 59.1%Texas A & M University 9,567 10,052 9,592 ^ 9,584 ^ 10,712 11.8% 12.0%Virginia Tech 11,521 11,844 12,128 12,488 13,552 8.5% 17.6%WASHINGTON STATE UNIVERSITY 10,554 10,564 10,574 11,258 12,270 9.0% 16.3%University of Wisconsin-Madison 11,586 13,049 14,186 16,318 18,423 12.9% 59.0%
Average (23 institutions) 10,483 10,989 11,518 12,351 13,643 10.5% 30.1%
Washington State University Rank 12 13 14 15 16
CHANGES FROM PREVIOUS YEAR23 Institution Average:$ 505 530 833 1,292% Increase 4.8% 4.8% 7.2% 10.5%
Washington State University:$ 10 10 684 1,012% Increase 0.1% 0.1% 6.5% 9.0%
^Fees reduced.

PEERS - TABLE 7RESIDENT GRADUATE TUITION AND REQUIRED FEES
WASHINGTON STATE UNIVERSITY AND PEER INSTITUTIONS
1998-99 1999-00 2000-01 2001-02 2002-03 Percentage IncreaseOne Year Four Year
Auburn University-Main Campus 2,760 2,895 3,154 3,380 3,784 12.0% 37.1%University of California-Davis 4,483 4,319 ^ 4,591 4,831 4,902 1.5% 9.3%Colorado State University 3,383 3,408 3,497 3,630 3,838 5.7% 13.4%University of Florida 2,801 2,951 3,108 3,273 3,587 9.6% 28.1%University of Georgia 3,290 3,516 3,776 3,942 4,174 5.9% 26.9%University of Illinois at Urbana 3,844 4,016 4,200 4,764 5,454 14.5% 41.9%Purdue University-Main Campus 3,564 3,724 3,872 4,164 5,080 22.0% 42.5%Iowa State University 3,374 3,526 3,678 4,000 4,770 19.3% 41.4%Kansas State Univ of Ag and App Sci 2,454 2,502 2,647 2,702 3,211 18.8% 30.8%Louisiana St Univ A&M 2,850 2,860 3,404 3,404 3,545 4.1% 24.4%Michigan State University 5,916 6,674 6,290 ^ 6,510 7,093 9.0% 19.9%University of Minnesota-Twin Cities 5,611 5,517 ^ 5,794 6,547 7,662 17.0% 36.6%Mississippi State University 3,017 3,017 3,117 3,586 3,873 8.0% 28.4%University of Missouri-Columbia 4,439 4,580 4,728 4,885 5,497 12.5% 23.8%Cornell University-NY State Statutory Colleges 11,548 12,148 12,750 13,960 15,250 9.2% 32.1%North Carolina State University at Raleigh 2,316 2,470 2,931 3,411 4,036 18.3% 74.3%Ohio State University-Main Campus 5,445 5,730 6,048 6,333 6,639 4.8% 21.9%Oklahoma State University-Main Campus 2,040 2,170 2,313 2,352 2,570 9.3% 26.0%University of Tennessee-Knoxville 3,354 3,806 4,004 4,280 4,840 13.1% 44.3%Texas A & M University 2,732 3,002 3,186 3,506 4,720 34.6% 72.8%Virginia Tech 4,927 4,950 5,069 5,219 5,631 7.9% 14.3%WASHINGTON STATE UNIVERSITY 5,334 5,494 5,660 5,854 6,088 4.0% 14.1%University of Wisconsin-Madison 4,926 5,403 5,884 6,358 6,877 8.2% 39.6%
Average (23 institutions) 4,105 4,290 4,509 4,821 5,353 11.0% 30.4%
Washington State University Rank 5 5 6 6 6
CHANGES FROM PREVIOUS YEAR23 Institution Average:$ 186 218 313 532% Increase 4.5% 5.1% 6.9% 11.0%
Washington State University:$ 160 166 194 234% Increase 3.0% 3.0% 3.4% 4.0%
^Fees reduced.

PEERS - TABLE 8NONRESIDENT GRADUATE TUITION AND REQUIRED FEES
WASHINGTON STATE UNIVERSITY AND PEER INSTITUTIONS
1998-99 1999-00 2000-01 2001-02 2002-03 Percentage IncreaseOne Year Four Year
Auburn University-Main Campus 8,280 8,685 9,150 9,900 11,084 12.0% 33.9%University of California-Davis 13,867 14,308 15,025 15,725 16,224 3.2% 17.0%Colorado State University 10,967 11,174 11,603 12,162 13,218 8.7% 20.5%University of Florida 9,672 10,166 10,609 11,416 13,359 17.0% 38.1%University of Georgia 11,300 12,204 12,794 13,410 15,218 13.5% 34.7%University of Illinois at Urbana 8,428 8,784 9,206 10,020 11,236 12.1% 33.3%Purdue University-Main Campus 11,784 12,348 12,904 13,872 15,760 13.6% 33.7%Iowa State University 9,532 9,962 10,390 11,196 13,296 18.8% 39.5%Kansas State Univ of Ag and App Sci 7,029 7,187 7,448 7,589 8,289 9.2% 17.9%Louisiana St Univ A&M 6,630 7,060 8,704 8,704 8,895 2.2% 34.2%Michigan State University 11,376 12,296 12,110 ^ 12,510 13,603 8.7% 19.6%University of Minnesota-Twin Cities 10,555 10,377 ^ 10,921 12,200 14,220 16.6% 34.7%Mississippi State University 6,119 6,119 7,065 8,128 8,778 8.0% 43.5%University of Missouri-Columbia 12,275 12,668 13,075 13,515 14,855 9.9% 21.0%Cornell University-NY State Statutory Colleges 11,548 12,148 12,750 13,960 15,250 9.2% 32.1%North Carolina State University at Raleigh 11,482 11,636 12,097 13,722 15,685 14.3% 36.6%Ohio State University-Main Campus 14,145 14,865 15,639 16,404 17,214 4.9% 21.7%Oklahoma State University-Main Campus 5,530 5,940 6,083 6,461 6,966 7.8% 26.0%University of Tennessee-Knoxville 8,410 9,874 10,346 12,066 12,942 7.3% 53.9%Texas A & M University 6,991 7,322 7,486 7,726 8,531 10.4% 22.0%Virginia Tech 7,537 7,758 7,949 8,189 8,866 8.3% 17.6%WASHINGTON STATE UNIVERSITY 13,380 13,390 13,872 14,344 14,918 4.0% 11.5%University of Wisconsin-Madison 15,188 17,107 18,594 20,496 22,147 8.1% 45.8%
Average (23 institutions) 10,088 10,582 11,123 11,901 13,068 9.8% 29.5%
Washington State University Rank 4 4 4 4 8
CHANGES FROM PREVIOUS YEAR23 Institution Average:$ 494 541 778 1,167% Increase 4.9% 5.1% 7.0% 9.8%
Washington State University:$ 10 482 472 574% Increase 0.1% 3.6% 3.4% 4.0%
^Fees reduced.

PEERS - TABLE 9RESIDENT MEDICAL TUITION AND REQUIRED FEES
UNIVERSITY OF WASHINGTON AND PEER INSTITUTIONS
1998-99 1999-00 2000-01 2001-02 2002-03 Percentage IncreaseOne Year Four Year
University of Arizona 8,430 8,831 9,282 9,734 10,649 9.4% 26.3%University of California-Davis 9,901 10,336 10,198 ^ 10,439 11,132 6.6% 12.4%University of California-Irvine 10,630 10,806 10,627 ^ 10,731 11,235 4.7% 5.7%University of California-Los Angeles 9,993 10,032 10,130 10,177 10,176 ^ 0.0% 1.8%University of California-San Diego 10,324 10,324 10,636 10,510 ^ 10,769 2.5% 4.3%University of Florida 10,447 10,947 11,510 12,398 13,611 9.8% 30.3%University of Hawaii at Manoa 10,932 12,948 13,347 13,755 14,331 4.2% 31.1%University of Illinois at Chicago 15,458 17,874 18,302 19,374 21,716 12.1% 40.5%University of Iowa 9,618 10,052 10,588 14,919 17,687 18.6% 83.9%University of Kentucky 9,544 10,284 10,594 10,796 11,112 2.9% 16.4%Michigan State University 10,556 10,868 11,244 11,600 11,892 2.5% 12.7%University of Michigan-Ann Arbor 17,840 18,205 18,759 19,331 19,732 2.1% 10.6%University of Minnesota-Twin Cities 12,888 12,461 ^ 13,120 15,094 17,576 16.4% 36.4%University of Missouri-Columbia 14,669 15,139 15,625 16,152 17,820 10.3% 21.5%University of New Mexico-Main Campus 6,478 7,126 8,195 9,015 9,466 5.0% 46.1%University of North Carolina at Chapel Hill 3,302 3,546 4,065 6,007 8,068 34.3% 144.3%Ohio State University-Main Campus 11,637 12,744 13,848 15,195 17,439 14.8% 49.9%University of Cincinnati-Main Campus 12,537 13,173 13,902 15,090 17,709 17.4% 41.3%University of Pittsburgh-Main Campus 21,014 21,834 22,900 24,580 28,034 14.1% 33.4%Texas A & M University 7,948 7,952 7,766 ^ 7,840 8,200 4.6% 3.2%University of Utah 7,419 8,405 10,265 11,235 12,507 11.3% 68.6%University of Virginia-Main Campus 11,642 13,154 13,686 15,450 18,284 18.3% 57.1%UNIVERSITY OF WASHINGTON 8,823 9,210 9,533 10,142 11,351 11.9% 28.7%University of Wisconsin-Madison 15,510 17,003 18,564 20,102 21,721 8.1% 40.0%
Average (24 institutions) 11,148 11,802 12,362 13,319 14,676 10.2% 31.7%
University of Washington Rank 19 19 20 20 15
CHANGES FROM PREVIOUS YEAR24 Institution Average:$ 655 560 958 1,356% Increase 5.9% 4.7% 7.7% 10.2%
University of Washington$ 387 323 609 1,209% Increase 4.4% 3.5% 6.4% 11.9%
Note: Medical degrees are not offered at Cornell University Statutory Colleges.
^Fees reduced.
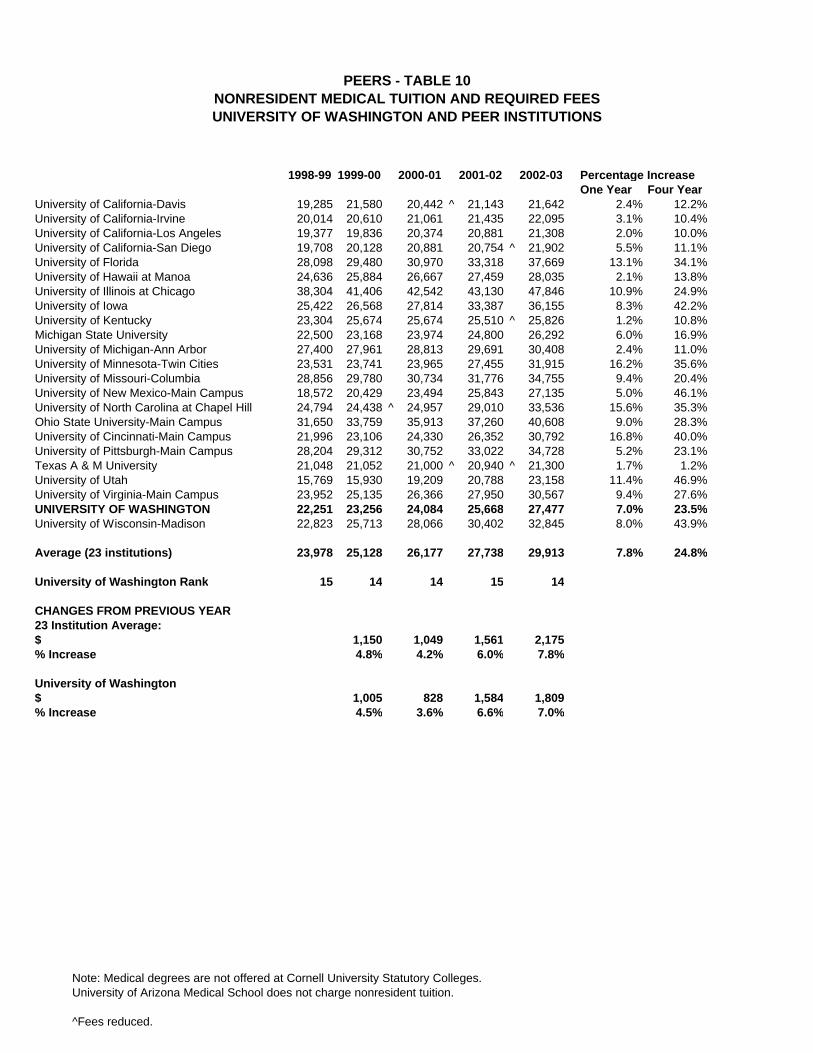
PEERS - TABLE 10NONRESIDENT MEDICAL TUITION AND REQUIRED FEESUNIVERSITY OF WASHINGTON AND PEER INSTITUTIONS
1998-99 1999-00 2000-01 2001-02 2002-03 Percentage IncreaseOne Year Four Year
University of California-Davis 19,285 21,580 20,442 ^ 21,143 21,642 2.4% 12.2%University of California-Irvine 20,014 20,610 21,061 21,435 22,095 3.1% 10.4%University of California-Los Angeles 19,377 19,836 20,374 20,881 21,308 2.0% 10.0%University of California-San Diego 19,708 20,128 20,881 20,754 ^ 21,902 5.5% 11.1%University of Florida 28,098 29,480 30,970 33,318 37,669 13.1% 34.1%University of Hawaii at Manoa 24,636 25,884 26,667 27,459 28,035 2.1% 13.8%University of Illinois at Chicago 38,304 41,406 42,542 43,130 47,846 10.9% 24.9%University of Iowa 25,422 26,568 27,814 33,387 36,155 8.3% 42.2%University of Kentucky 23,304 25,674 25,674 25,510 ^ 25,826 1.2% 10.8%Michigan State University 22,500 23,168 23,974 24,800 26,292 6.0% 16.9%University of Michigan-Ann Arbor 27,400 27,961 28,813 29,691 30,408 2.4% 11.0%University of Minnesota-Twin Cities 23,531 23,741 23,965 27,455 31,915 16.2% 35.6%University of Missouri-Columbia 28,856 29,780 30,734 31,776 34,755 9.4% 20.4%University of New Mexico-Main Campus 18,572 20,429 23,494 25,843 27,135 5.0% 46.1%University of North Carolina at Chapel Hill 24,794 24,438 ^ 24,957 29,010 33,536 15.6% 35.3%Ohio State University-Main Campus 31,650 33,759 35,913 37,260 40,608 9.0% 28.3%University of Cincinnati-Main Campus 21,996 23,106 24,330 26,352 30,792 16.8% 40.0%University of Pittsburgh-Main Campus 28,204 29,312 30,752 33,022 34,728 5.2% 23.1%Texas A & M University 21,048 21,052 21,000 ^ 20,940 ^ 21,300 1.7% 1.2%University of Utah 15,769 15,930 19,209 20,788 23,158 11.4% 46.9%University of Virginia-Main Campus 23,952 25,135 26,366 27,950 30,567 9.4% 27.6%UNIVERSITY OF WASHINGTON 22,251 23,256 24,084 25,668 27,477 7.0% 23.5%University of Wisconsin-Madison 22,823 25,713 28,066 30,402 32,845 8.0% 43.9%
Average (23 institutions) 23,978 25,128 26,177 27,738 29,913 7.8% 24.8%
University of Washington Rank 15 14 14 15 14
CHANGES FROM PREVIOUS YEAR23 Institution Average:$ 1,150 1,049 1,561 2,175% Increase 4.8% 4.2% 6.0% 7.8%
University of Washington$ 1,005 828 1,584 1,809% Increase 4.5% 3.6% 6.6% 7.0%
Note: Medical degrees are not offered at Cornell University Statutory Colleges.University of Arizona Medical School does not charge nonresident tuition.
^Fees reduced.

PEERS - TABLE 11RESIDENT DENTAL TUITION AND REQUIRED FEES
UNIVERSITY OF WASHINGTON AND PEER INSTITUTIONS
1998-99 1999-00 2000-01 2001-02 2002-03 Percentage IncreaseOne Year Four Year
University of California-Los Angeles 9,628 9,667 9,765 9,812 10,696 9.0% 11.1%University of Florida 9,184 9,626 10,117 10,901 11,965 9.8% 30.3%University of Illinois at Chicago 10,576 12,094 12,470 13,370 15,132 13.2% 43.1%University of Iowa 7,282 7,566 9,968 10,772 15,783 46.5% 116.7%University of Kentucky 7,794 8,554 8,894 9,218 9,756 5.8% 25.2%University of Michigan-Ann Arbor 14,942 15,725 16,203 17,665 18,546 5.0% 24.1%University of Minnesota-Twin Cities 11,461 10,477 ^ 10,976 12,654 14,746 16.5% 28.7%University of North Carolina at Chapel Hill 3,557 3,801 4,320 6,262 8,323 32.9% 134.0%Ohio State University-Main Campus 9,813 10,746 11,784 12,867 14,376 11.7% 46.5%University of Pittsburgh-Main Campus 19,630 20,396 21,390 22,958 26,184 14.1% 33.4%University of Utah 7,419 8,405 10,265 11,235 12,507 11.3% 68.6%UNIVERSITY OF WASHINGTON 8,823 9,210 9,533 10,142 11,351 11.9% 28.7%
Average (12 institutions) 10,009 10,522 11,307 12,321 14,114 14.5% 41.0%
University of Washington Rank 8 8 10 9 9
CHANGES FROM PREVIOUS YEAR12 Institution Average:$ 513 785 1,014 1,792% Increase 5.1% 7.5% 9.0% 14.5%
University of Washington Rank:$ 387 323 609 1,209% Increase 4.4% 3.5% 6.4% 11.9%
Note: Dental degrees are not offered at these University of Washington peer universities:University of ArizonaUniversity of California-DavisUniversity of California-IrvineUniversity of California-San DiegoUniversity of Hawaii at ManoaMichigan State UniversityUniversity of Missouri-ColumbiaUniversity of New Mexico Main CampusCornell University Statutory CollegesUniversity of Cincinnati Main CampusTexas A&M University Main CampusUniversity of Virginia Main CampusUniversity of Wisconsin-Madison
^Fees reduced.

PEERS - TABLE 12NONRESIDENT DENTAL TUITION AND REQUIRED FEES
UNIVERSITY OF WASHINGTON AND PEER INSTITUTIONS
1998-99 1999-00 2000-01 2001-02 2002-03 Percentage IncreaseOne Year Four Year
University of California-Los Angeles 19,012 19,471 20,009 20,516 22,123 7.8% 16.4%University of Florida 24,532 25,742 27,039 29,093 33,794 16.2% 37.8%University of Illinois at Chicago 27,692 31,950 32,922 34,438 38,308 11.2% 38.3%University of Iowa 20,090 20,950 23,928 25,738 30,749 19.5% 53.1%University of Kentucky 19,504 21,034 21,794 22,512 23,050 2.4% 18.2%University of Michigan-Ann Arbor 27,056 28,125 28,979 30,863 31,924 3.4% 18.0%University of Minnesota-Twin Cities 19,068 17,737 ^ 18,599 20,852 24,155 15.8% 26.7%University of North Carolina at Chapel Hill 21,751 21,995 22,514 25,529 28,907 13.2% 32.9%Ohio State University-Main Campus 27,684 29,511 31,488 33,555 36,096 7.6% 30.4%University of Pittsburgh-Main Campus 28,340 29,454 30,902 33,182 34,896 5.2% 23.1%University of Utah 15,769 15,930 19,209 20,788 23,158 11.4% 46.9%UNIVERSITY OF WASHINGTON 22,251 23,256 24,084 25,668 27,477 7.0% 23.5%
Average (12 institutions) 22,729 23,763 25,122 26,895 29,553 9.9% 30.0%
University of Washington Rank 6 6 6 7 8
CHANGES FROM PREVIOUS YEAR12 Institution Average:$ 1,034 1,359 1,772 2,659% Increase 4.5% 5.7% 7.1% 9.9%
University of Washington:$ 1,005 828 1,584 1,809% Increase 4.5% 3.6% 6.6% 7.0%
Note: Dental degrees are not offered at these University of Washington peer universities:University of ArizonaUniversity of California-DavisUniversity of California-IrvineUniversity of California-San DiegoUniversity of Hawaii at ManoaMichigan State UniversityUniversity of Missouri-ColumbiaUniversity of New Mexico Main CampusCornell University Statutory CollegesUniversity of Cincinnati Main CampusTexas A&M University Main CampusUniversity of Virginia Main CampusUniversity of Wisconsin-Madison
^Fees reduced.

PEERS - TABLE 13RESIDENT LAW TUITION AND REQUIRED FEES
UNIVERSITY OF WASHINGTON AND PEER INSTITUTIONS
1998-99 1999-00 2000-01 2001-02 2002-03 Percentage IncreaseOne Year Three Year
University of Arizona 4,534 5,009 5,094 5,236 5,833 11.4% 28.7%University of California-Davis 10,859 10,896 10,244 ^ 11,425 11,132 ^ -2.6% 2.5%University of California-Los Angeles 10,972 11,011 11,109 11,156 11,415 2.3% 4.0%University of Florida 3,079 3,224 3,391 3,657 4,010 9.7% 30.2%University of Hawaii at Manoa 8,124 8,628 9,195 9,747 10,323 5.9% 27.1%University of Illinois at Chicago 8,456 9,346 10,298 11,332 12,830 13.2% 51.7%University of Iowa 6,510 7,108 7,824 8,655 10,509 21.4% 61.4%University of Kentucky 5,426 5,896 6,714 6,714 7,074 5.4% 30.4%University of Michigan-Ann Arbor 17,910 19,115 20,955 23,349 24,804 6.2% 38.5%University of Minnesota-Twin Cities 9,481 9,783 10,256 11,639 13,566 16.6% 43.1%University of Missouri-Columbia 8,842 9,126 10,066 10,405 11,535 10.9% 30.5%University of New Mexico-Main Campus 3,984 4,382 5,040 5,544 6,098 10.0% 53.1%University of North Carolina at Chapel Hill 3,118 3,521 4,973 7,388 9,966 34.9% 219.6%Ohio State University-Main Campus 7,692 8,424 10,002 10,844 11,898 9.7% 54.7%University of Cincinnati-Main Campus 7,704 8,104 8,600 9,348 11,020 17.9% 43.0%University of Pittsburgh-Main Campus 12,392 12,868 13,486 14,461 16,496 14.1% 33.1%University of Utah 3,597 3,702 4,186 5,517 6,542 18.6% 81.9%University of Virginia-Main Campus 14,606 15,319 15,803 18,090 20,627 14.0% 41.2%UNIVERSITY OF WASHINGTON 5,763 6,009 6,216 6,911 10,160 47.0% 76.3%University of Wisconsin-Madison 6,203 6,801 7,434 8,176 8,841 8.1% 42.5%
Average (19 institutions) 7,963 8,414 9,044 9,980 11,234
University of Washington Rank 14 14 15 15 13
CHANGES FROM PREVIOUS YEAR19 Institution Average:$ 451 631 935 1,254% Increase 5.7% 7.5% 10.3% 12.6%
University of Washington:$ 246 207 695 3,249% Increase 4.3% 3.4% 11.2% 47.0%
^Fees reduced.Note: University of Washington began charging law tuition and fees in AY1998.

PEERS - TABLE 14NONRESIDENT LAW TUITION AND REQUIRED FEES
UNIVERSITY OF WASHINGTON AND PEER INSTITUTIONS
1998-99 1999-00 2000-01 2001-02 2002-03 Percentage IncreaseOne Year Three Year
University of Arizona 11,486 12,161 12,550 13,102 14,353 9.5% 25.0%University of California-Davis 20,243 20,700 21,422 22,129 22,634 2.3% 11.8%University of California-Los Angeles 20,356 20,815 21,353 21,860 22,547 3.1% 10.8%University of Florida 10,236 10,739 11,281 12,139 14,188 16.9% 38.6%University of Hawaii at Manoa 14,220 14,940 15,699 16,635 17,595 5.8% 23.7%University of Illinois at Chicago 18,830 20,136 21,628 23,230 25,918 11.6% 37.6%University of Iowa 16,426 17,670 19,040 20,777 24,267 16.8% 47.7%University of Kentucky 14,036 15,266 15,786 16,528 16,574 0.3% 18.1%University of Michigan-Ann Arbor 23,880 25,085 26,955 29,345 30,804 5.0% 29.0%University of Minnesota-Twin Cities 15,781 16,236 17,104 19,314 22,464 16.3% 42.3%University of Missouri-Columbia 17,116 17,662 19,504 20,170 22,116 9.6% 29.2%University of New Mexico-Main Campus 13,338 14,672 16,872 18,559 18,559 0.0% 39.1%University of North Carolina at Chapel Hill 15,218 15,621 17,073 19,301 21,822 13.1% 43.4%Ohio State University-Main Campus 17,086 18,288 20,360 21,720 23,318 7.4% 36.5%University of Cincinnati-Main Campus 14,808 15,562 16,432 17,806 20,838 17.0% 40.7%University of Pittsburgh-Main Campus 19,098 19,842 20,810 22,334 24,598 10.1% 28.8%University of Utah 7,948 8,185 9,075 11,799 13,819 17.1% 73.9%University of Virginia-Main Campus 20,706 21,718 23,684 25,316 26,967 6.5% 30.2%UNIVERSITY OF WASHINGTON 14,169 14,802 15,326 17,114 17,899 4.6% 26.3%University of Wisconsin-Madison 16,293 18,353 20,036 22,480 24,289 8.0% 49.1%
Average (19 institutions) 16,064 16,923 18,100 19,583 21,278
University of Washington Rank 15 16 17 15 15
CHANGES FROM PREVIOUS YEAR19 Institution Average:$ 859 1,177 1,483 1,696% Increase 5.3% 7.0% 8.2% 8.7%
University of Washington:$ 633 524 1,788 785% Increase 4.5% 3.5% 11.7% 4.6%
^Fees reduced.Note: University of Washington began charging law tuition and fees in AY1998.

PEERS - TABLE 15RESIDENT VETERINARY MEDICINE TUITION AND REQUIRED FEES
WASHINGTON STATE UNIVERSITY AND PEER INSTITUTIONS
1998-99 1999-00 2000-01 2001-02 2002-03 Percentage IncreaseOne Year Four Year
Auburn University-Main Campus 5,280 5,535 5,830 6,360 7,124 12.0% 34.9%University of California-Davis 8,464 8,485 10,244 11,002 11,132 1.2% 31.5%Colorado State University 8,681 8,842 9,085 9,440 10,008 6.0% 15.3%University of Florida 7,836 8,211 8,632 9,305 10,200 9.6% 30.2%University of Georgia 5,278 6,462 6,834 7,154 7,926 10.8% 50.2%University of Illinois at Urbana 9,184 9,604 10,068 11,090 12,564 13.3% 36.8%Purdue University-Main Campus 8,600 8,760 8,908 9,576 11,036 15.2% 28.3%Iowa State University 6,290 6,574 6,856 7,436 9,618 29.3% 52.9%Kansas State Univ of Ag and App Sci 5,232 5,346 5,604 5,768 6,834 18.5% 30.6%Louisiana St Univ A&M 4,674 5,434 6,200 6,200 7,129 15.0% 52.5%Michigan State University 10,758 11,076 11,460 11,800 12,092 2.5% 12.4%University of Minnesota-Twin Cities 9,970 10,242 10,778 12,436 14,492 16.5% 45.4%Mississippi State University 5,635 6,011 6,019 5,750 ^ 6,612 15.0% 17.3%University of Missouri-Columbia 9,931 10,248 10,576 10,933 12,127 10.9% 22.1%Cornell University-NY State Statutory Colleges 14,548 14,948 15,450 16,590 18,250 10.0% 25.4%North Carolina State University at Raleigh 3,406 3,658 4,935 6,416 8,031 25.2% 135.8%Ohio State University-Main Campus 9,306 10,191 11,076 12,039 13,215 9.8% 42.0%Oklahoma State University-Main Campus 6,396 6,938 7,225 7,786 8,509 9.3% 33.0%University of Tennessee-Knoxville 5,402 6,160 7,360 7,712 8,458 9.7% 56.6%Texas A & M University 7,708 8,359 8,464 8,474 10,565 24.7% 37.1%Virginia Tech 8,653 8,812 9,134 9,406 10,194 8.4% 17.8%WASHINGTON STATE UNIVERSITY 8,724 8,988 9,260 9,872 11,056 12.0% 26.7%University of Wisconsin-Madison 11,360 12,453 13,540 14,656 15,839 8.1% 39.4%
Average (23 institutions) 7,883 8,319 8,849 9,444 10,566 11.9% 34.0%
Washington State University Rank 8 8 9 9 9
CHANGES FROM PREVIOUS YEAR23 Institution Average: 436 530 594 1,122$ 5.5% 6.4% 6.7% 11.9%% Increase
Washington State University$ 264 272 612 1,184% Increase 3.0% 3.0% 6.6% 12.0%
^Fees reduced.

PEERS - TABLE 16NONRESIDENT VETERINARY MEDICINE TUITION AND REQUIRED FEES
WASHINGTON STATE UNIVERSITY AND PEER INSTITUTIONS
1998-99 1999-00 2000-01 2001-02 2002-03 Percentage IncreaseOne Year Four Year
Auburn University-Main Campus 15,840 16,605 17,490 18,840 21,104 12.0% 33.2%University of California-Davis 17,848 18,289 21,005 21,706 22,205 2.3% 24.4%Colorado State University 28,581 29,242 29,985 31,140 32,608 4.7% 14.1%University of Florida 20,729 21,748 22,846 24,585 27,773 13.0% 34.0%University of Illinois at Urbana 22,718 23,682 24,850 26,610 29,636 11.4% 30.5%Purdue University-Main Campus 20,788 21,120 21,480 23,092 25,900 12.2% 24.6%Iowa State University 16,790 17,546 18,300 19,702 25,480 29.3% 51.8%Kansas State Univ of Ag and App Sci 17,234 17,636 18,202 18,742 20,219 7.9% 17.3%Louisiana St Univ A&M 15,904 17,234 18,476 18,476 20,379 10.3% 28.1%Michigan State University 22,208 22,868 23,664 24,400 25,692 5.3% 15.7%University of Minnesota-Twin Cities 14,714 19,977 21,049 24,187 28,124 16.3% 91.1%Mississippi State University 17,135 18,565 19,084 21,393 23,377 9.3% 36.4%University of Missouri-Columbia 19,301 19,919 20,556 21,253 23,314 9.7% 20.8%Cornell University-NY State Statutory Colleges 19,648 20,148 21,150 22,290 24,550 10.1% 24.9%North Carolina State University at Raleigh 21,136 21,388 22,665 26,364 30,594 16.0% 44.7%Ohio State University-Main Campus 27,774 29,586 31,440 33,420 35,664 6.7% 28.4%Oklahoma State University-Main Campus 16,768 18,866 19,153 21,503 23,186 7.8% 38.3%University of Tennessee-Knoxville 13,384 15,738 18,854 21,754 22,914 5.3% 71.2%Texas A & M University 18,508 19,159 19,264 19,274 21,365 10.8% 15.4%Virginia Tech 9,406 10,194 8.4%WASHINGTON STATE UNIVERSITY 22,152 22,162 22,960 24,482 27,420 12.0% 23.8%University of Wisconsin-Madison 16,664 18,771 20,402 22,094 23,873 8.1% 43.3%Average (21/22 institutions) 19,325 20,488 21,565 22,487 24,799 10.3% 28.3%
Washington State University Rank 5 5 5 6 7
CHANGES FROM PREVIOUS YEAR21 Institution Average:$ 1,163 1,077 921 2,312% Increase 6.0% 5.3% 4.3% 10.3%
Washington State University$ 10 798 1,522 2,938% Increase 0.0% 3.6% 6.6% 12.0%
Note: Univ of Georgia does not accept nonresident students outside the contract with Southern Regional Education Board.Virginia Polytech Inst and State Univ only accepts nonresident students from the state of Maryland.
^Fees reduced.

PEERS - TABLE 17RESIDENT UNDERGRADUATE TUITION AND REQUIRED FEESTHE EVERGREEN STATE COLLEGE AND PEER INSTITUTIONS
1998-99 1999-00 2000-01 2001-02 2002-03 Percentage IncreaseOne Year Four Year
University of Montevallo 3,110 3,290 3,480 3,974 4,334 9.1% 39.4%Sonoma State University 2,032 1,978 ^ 2,002 2,032 2,226 9.5% 9.5%Eastern Connecticut State University 3,657 3,754 3,906 4,095 4,455 8.8% 21.8%Fort Hays State University 2,026 2,064 2,179 2,217 2,328 5.0% 14.9%Coppin State College 3,164 3,272 3,370 3,477 3,959 13.9% 25.1%Saint Mary's College of Maryland 6,875 7,175 7,475 7,549 8,145 7.9% 18.5%University of Minnesota-Morris 5,061 5,312 5,567 6,142 7,154 16.5% 41.4%Missouri Western State College 2,660 2,774 3,026 3,224 4,064 26.1% 52.8%Keene State College 4,750 5,036 5,304 5,563 6,132 10.2% 29.1%SUNY College at Fredonia 4,125 4,175 4,225 4,275 4,373 2.3% 6.0%SUNY College at Geneseo 4,066 4,221 4,221 4,310 4,440 3.0% 9.2%SUNY College at Oneonta 4,026 4,132 4,185 4,216 4,291 1.8% 6.6%SUNY College at Potsdam 3,935 3,935 4,099 4,129 4,215 2.1% 7.1%North Carolina Central University 1,793 1,887 1,975 2,350 2,674 13.8% 49.1%Winston-Salem State University 1,561 1,664 1,805 1,918 2,326 21.3% 49.0%Southern Oregon State University 3,198 3,234 3,369 3,555 3,687 3.7% 15.3%East Stroudsburg University of Pennsylvania 4,314 4,492 4,718 4,984 5,502 10.4% 27.5%University of Pittsburgh-Johnstown 6,396 6,630 6,984 7,464 8,470 13.5% 32.4%College of Charleston 3,390 3,520 3,630 3,780 4,858 28.5% 43.3%Francis Marion University 3,350 3,350 3,350 3,790 4,340 14.5% 29.6%University of South Carolina at Spartanburg 3,018 3,360 3,624 3,868 4,748 22.8% 57.3%Longwood University 4,528 3,924 ^ 4,003 4,226 4,661 10.3% 2.9%Mary Washington College 3,674 3,204 ^ 3,246 3,340 3,934 17.8% 7.1%THE EVERGREEN STATE COLLEGE 2,637 2,758 2,857 3,024 3,440 13.8% 30.5%University of Wisconsin-Green Bay 2,916 3,150 3,306 3,648 4,023 10.3% 38.0%University of Wisconsin-River Falls 2,797 2,976 3,029 3,266 3,552 8.8% 27.0%University of Wisconsin-Superior 2,768 2,971 3,001 3,230 3,461 7.2% 25.0%
Average (27 institutions) 3,549 3,638 3,775 3,987 4,437 11.3% 25.0%
The Evergreen State College Rank 23 23 23 23 23
CHANGES FROM PREVIOUS YEAR27 Institution Average:$ 89 137 211 450% Increase 2.5% 3.8% 5.6% 11.3%
The Evergreen State College$ 121 99 167 416% Increase 4.6% 3.6% 5.8% 13.8%
^Fees reduced.
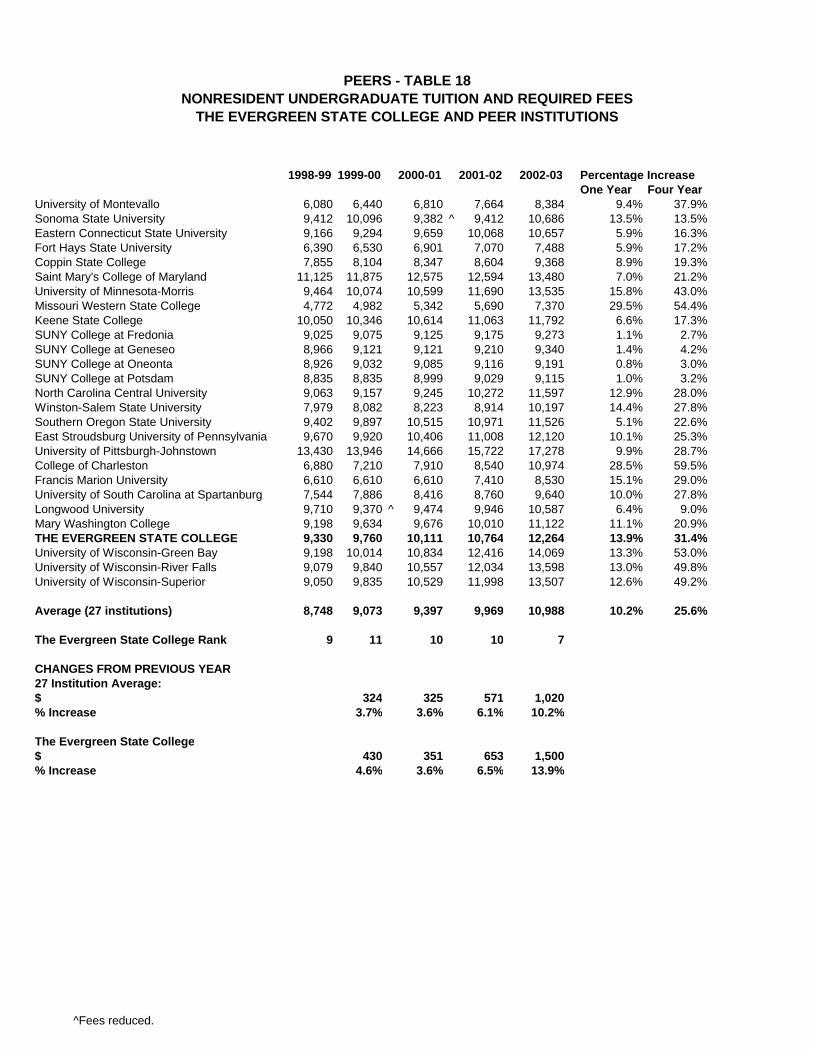
PEERS - TABLE 18NONRESIDENT UNDERGRADUATE TUITION AND REQUIRED FEES
THE EVERGREEN STATE COLLEGE AND PEER INSTITUTIONS
1998-99 1999-00 2000-01 2001-02 2002-03 Percentage IncreaseOne Year Four Year
University of Montevallo 6,080 6,440 6,810 7,664 8,384 9.4% 37.9%Sonoma State University 9,412 10,096 9,382 ^ 9,412 10,686 13.5% 13.5%Eastern Connecticut State University 9,166 9,294 9,659 10,068 10,657 5.9% 16.3%Fort Hays State University 6,390 6,530 6,901 7,070 7,488 5.9% 17.2%Coppin State College 7,855 8,104 8,347 8,604 9,368 8.9% 19.3%Saint Mary's College of Maryland 11,125 11,875 12,575 12,594 13,480 7.0% 21.2%University of Minnesota-Morris 9,464 10,074 10,599 11,690 13,535 15.8% 43.0%Missouri Western State College 4,772 4,982 5,342 5,690 7,370 29.5% 54.4%Keene State College 10,050 10,346 10,614 11,063 11,792 6.6% 17.3%SUNY College at Fredonia 9,025 9,075 9,125 9,175 9,273 1.1% 2.7%SUNY College at Geneseo 8,966 9,121 9,121 9,210 9,340 1.4% 4.2%SUNY College at Oneonta 8,926 9,032 9,085 9,116 9,191 0.8% 3.0%SUNY College at Potsdam 8,835 8,835 8,999 9,029 9,115 1.0% 3.2%North Carolina Central University 9,063 9,157 9,245 10,272 11,597 12.9% 28.0%Winston-Salem State University 7,979 8,082 8,223 8,914 10,197 14.4% 27.8%Southern Oregon State University 9,402 9,897 10,515 10,971 11,526 5.1% 22.6%East Stroudsburg University of Pennsylvania 9,670 9,920 10,406 11,008 12,120 10.1% 25.3%University of Pittsburgh-Johnstown 13,430 13,946 14,666 15,722 17,278 9.9% 28.7%College of Charleston 6,880 7,210 7,910 8,540 10,974 28.5% 59.5%Francis Marion University 6,610 6,610 6,610 7,410 8,530 15.1% 29.0%University of South Carolina at Spartanburg 7,544 7,886 8,416 8,760 9,640 10.0% 27.8%Longwood University 9,710 9,370 ^ 9,474 9,946 10,587 6.4% 9.0%Mary Washington College 9,198 9,634 9,676 10,010 11,122 11.1% 20.9%THE EVERGREEN STATE COLLEGE 9,330 9,760 10,111 10,764 12,264 13.9% 31.4%University of Wisconsin-Green Bay 9,198 10,014 10,834 12,416 14,069 13.3% 53.0%University of Wisconsin-River Falls 9,079 9,840 10,557 12,034 13,598 13.0% 49.8%University of Wisconsin-Superior 9,050 9,835 10,529 11,998 13,507 12.6% 49.2%
Average (27 institutions) 8,748 9,073 9,397 9,969 10,988 10.2% 25.6%
The Evergreen State College Rank 9 11 10 10 7
CHANGES FROM PREVIOUS YEAR27 Institution Average:$ 324 325 571 1,020% Increase 3.7% 3.6% 6.1% 10.2%
The Evergreen State College$ 430 351 653 1,500% Increase 4.6% 3.6% 6.5% 13.9%
^Fees reduced.

PEERS - TABLE 19RESIDENT GRADUATE TUITION AND REQUIRED FEES
THE EVERGREEN STATE COLLEGE AND PEER INSTITUTIONS
1998-99 1999-00 2000-01 2001-02 2002-03 Percentage IncreaseOne Year Four Year
University of Montevallo 2,708 2,852 3,030 3,434 3,746 9.1% 38.3%Sonoma State University 2,110 2,056 ^ 2,080 2,110 2,304 9.2% 9.2%Eastern Connecticut State University 4,163 4,260 4,432 4,641 5,022 8.2% 20.6%Fort Hays State University 1,872 1,909 2,016 2,058 2,170 5.4% 15.9%Coppin State College 2,800 2,880 2,980 3,060 3,220 5.2% 15.0%Keene State College 4,750 5,036 5,304 5,563 6,132 10.2% 29.1%SUNY College at Fredonia 5,825 5,875 5,925 5,975 6,073 1.6% 4.3%SUNY College at Geneseo 5,475 5,575 5,578 5,350 ^ 5,655 5.7% 3.3%SUNY College at Oneonta 5,582 5,682 5,709 5,716 5,766 0.9% 3.3%SUNY College at Potsdam 5,415 5,415 5,515 5,515 5,785 4.9% 6.8%North Carolina Central University 1,758 1,855 2,011 2,478 2,814 13.6% 60.1%Winston-Salem State University 1,837 1,970 2,382 20.9%Southern Oregon State University 5,187 5,460 5,844 6,111 6,423 5.1% 23.8%East Stroudsburg University of Pennsylvania 4,168 4,504 4,908 5,406 6,209 14.9% 49.0%College of Charleston 3,390 3,520 3,630 3,780 4,858 28.5% 43.3%Francis Marion University 3,550 3,550 3,550 3,990 4,540 13.8% 27.9%Longwood University 4,892 4,952 5,248 5,496 6,065 10.4% 24.0%Mary Washington College 2,160 2,980 3,000 3,260 3,660 12.3% 69.4%THE EVERGREEN STATE COLLEGE 4,215 4,408 4,567 4,848 5,519 13.8% 30.9%University of Wisconsin-Green Bay 3,773 4,066 4,468 4,892 5,365 9.7% 42.2%University of Wisconsin-River Falls 3,654 3,892 4,191 4,510 4,894 8.5% 33.9%University of Wisconsin-Superior 3,625 3,887 4,163 4,474 4,803 7.4% 32.5%
Average (21 institutions) 3,872 4,036 4,087 4,293 4,695 9.4% 21.3%
The Evergreen State College Rank 8 9 9 10 9
CHANGES FROM PREVIOUS YEAR21 Institution Average$ 164 50 207 402% Increase 4.2% 1.3% 5.1% 9.4%
The Evergreen State College$ 193 159 281 671% Increase 4.6% 3.6% 6.2% 13.8%
Note: Graduate degrees are not offered at these TESC peer institutions:St. Mary's College of MarylandUniversity of Minnesota-MorrisMissouri Western State CollegeUniversity of PittsburghUniversity of South Carolina-Spartanburg
^Fees reduced.*Winston-Salem State Univ began enrolling masters level students for the first time in Fall 2000.

PEERS - TABLE 20NONRESIDENT GRADUATE TUITION AND REQUIRED FEES
THE EVERGREEN STATE COLLEGE AND PEER INSTITUTIONS
1998-99 1999-00 2000-01 2001-02 2002-03 Percentage IncreaseOne Year Four Year
University of Montevallo 5,276 5,564 5,910 6,602 7,226 9.5% 37.0%Sonoma State University 9,490 10,174 9,460 ^ 9,490 10,764 13.4% 13.4%Eastern Connecticut State University 9,648 9,776 10,161 10,590 11,199 5.8% 16.1%Fort Hays State University 4,965 5,077 5,364 5,477 5,820 6.3% 17.2%Coppin State College 4,800 5,100 5,300 5,520 5,820 5.4% 21.3%Keene State College 10,050 10,346 10,614 11,063 11,792 6.6% 17.3%SUNY College at Fredonia 9,141 9,191 9,241 9,291 9,389 1.1% 2.7%SUNY College at Geneseo 8,791 8,891 8,891 8,666 ^ 8,971 3.5% 2.0%SUNY College at Oneonta 8,898 8,998 9,025 9,032 9,082 0.6% 2.1%SUNY College at Potsdam 8,731 8,731 8,831 8,831 9,101 3.1% 4.2%North Carolina Central University 9,028 9,125 9,281 10,546 11,907 12.9% 31.9%Winston-Salem State University 8,255 9,094 10,399 14.4%Southern Oregon State University 9,228 9,714 10,323 10,755 11,301 5.1% 22.5%East Stroudsburg University of Pennsylvania 6,936 7,334 7,778 8,360 9,413 12.6% 35.7%College of Charleston 6,880 7,210 7,910 8,540 10,974 28.5% 59.5%Francis Marion University 7,010 7,010 7,010 7,810 8,930 14.3% 27.4%Longwood University 10,004 10,064 10,360 10,848 11,873 9.4% 18.7%Mary Washington College 5,980 6,800 6,820 7,160 8,900 24.3% 48.8%THE EVERGREEN STATE COLLEGE 12,795 13,384 13,864 14,768 16,828 13.9% 31.5%University of Wisconsin-Green Bay 11,418 12,424 13,412 14,716 15,975 8.6% 39.9%University of Wisconsin-River Falls 11,299 12,250 13,135 14,334 15,504 8.2% 37.2%University of Wisconsin-Superior 11,270 12,245 13,107 14,298 15,413 7.8% 36.8%
Average (21 institutions) 8,518 8,858 9,093 9,595 10,532 9.8% 23.6%
The Evergreen State College Rank 1 1 1 1 1
CHANGES FROM PREVIOUS YEAR21 Institution Average$ 340 234 502 937% Increase 4.0% 2.6% 5.5% 9.8%
The Evergreen State College$ 589 480 904 2,060% Increase 4.6% 3.6% 6.5% 13.9%
Note: Graduate degrees are not offered at these TESC peer institutions:St. Mary's College of MarylandUniversity of Minnesota-MorrisMissouri Western State CollegeUniversity of PittsburghUniversity of South Carolina-Spartanburg
^Fees reduced.*Winston-Salem State Univ began enrolling masters level students for the first time in Fall 2000.

APPENDICES

2002-03 Washington State Tuition and Fee Report
Appendix A
Data Methods
All data contained in this report were compiled using Washington Higher Education Coordinating Board (HECB) surveys of state agencies or individual institutions. HECB staff greatly appreciates the continued cooperation and assistance of survey respondents. Their efforts to provide accurate and timely data have helped make these reports source documents for many states as they develop their own tuition and fee analyses. With each annual survey, respondents have an opportunity to review and revise previously reported data. Though small in number, such revisions modestly affect the national averages from those displayed in earlier reports. Revisions may reflect a mid-year surcharge, discontinuation of a nonresident differential, or an adjustment in incidental fees. Data for the state colleges and universities in Tables 5 through 8 represent the average undergraduate charges at 214 state public institutions and the average graduate charges at 192 of those with graduate programs. Although not all public institutions are included in this survey, the averages and changes over time at the same set of institutions offer consistency, and the large number of institutions included provides a close approximation to state averages. Washington universities included in this average include Central Washington University, Eastern Washington University, and Western Washington University. Tuition and fee rates for The Evergreen State College are displayed in the Peer Institution Comparison section of the report. For reporting comparability, full-time undergraduate students were based on 45 quarter hours or 30 semester hours and full-time graduate students were based on 30 quarter hours or 20 semester hours. Tuition and required fees include total academic year tuition and required fees for full-time students. Optional fees, such as parking or health care, are not included unless they are paid by all full-time students. Data Availability Data contained in this report, as well as the historical data since 1972-1973, are available upon request. The 2002-2003 Washington State Tuition and Fee Report is available on our Web site at www.hecb.wa.gov. For more information, please contact report author Kathy Raudenbush at (360) 753-7862 or by e-mail [email protected].

2002-03 Washington State Tuition and Fee Report
Appendix B
Washington State Tuition And Fees By Institution
S & A TOTALTechnology
feeOVERALL
TOTAL
RESIDENT
Operating fee
Building fee
Statutory tuition (sum of
operating and building
fees)
Services and Activities (S & A) fee
Tuition plus
S & A fees (Optional)
OVERALL TUITION
AND FEES
UW - Seattle *Undergraduate $3,958 $209 $4,167 $288 $4,455 $111 $4,566Graduate
Tier I $5,857 $182 $6,039 $288 $6,327 $111 $6,438Tier II $6,100 $189 $6,289 $288 $6,577 $111 $6,688Tier III $6,342 $197 $6,539 $288 $6,827 $111 $6,938
Pharm D $7,070 $219 $7,289 $288 $7,577 $111 $7,688Business Masters Program $7,760 $240 $8,000 $288 $8,288 $111 $8,399Law $9,468 $293 $9,761 $288 $10,049 $111 $10,160Professional (MD, DDS) $10,404 $548 $10,952 $288 $11,240 $111 $11,351
UW - BothellAll charges same as aboveexcept S & A and Technology: $249 $120
UW - TacomaAll charges same as aboveexcept S & A and Technology: $273 $120
WSU - all campusesUndergradaute $3,939 $206 $4,145 $375 $4,520 $4,520Graduate $5,590 $173 $5,763 $325 $6,088 $6,088Pharm D $8,767 $271 $9,038 $358 $9,396 $9,396Professional (Veterinary Med.) $10,163 $535 $10,698 $358 $11,056 $11,056
CWUUndergraduate $2,906 $121 $3,027 $396 $3,423 $75 $3,498Graduate $4,631 $115 $4,746 $396 $5,142 $75 $5,217
EWUUndergraduate $2,860 $116 $2,976 $381 $3,357 $105 $3,462Graduate $4,900 $122 $5,022 $381 $5,403 $105 $5,508
TESCUndergraduate $2,908 $121 $3,029 $411 $3,440 $3,440Graduate $4,980 $128 $5,108 $411 $5,519 $5,519
WWUUndergraduate $2,907 $120 $3,027 $381 $3,408 $45 $3,453Graduate $4,502 $111 $4,613 $368 $4,981 $45 $5,026
Community/Technical CollegesUndergraduate $1,588 $195 $1,784 $199 $1,982 varies
* UW - Seattle: Data do not include the new S & A fee II of $35 effective winter quarter 2003.
TUITION
at public higher education institutionsResident tuition and fees for full-time students
2002-03 academic year

2002-03 Washington State Tuition and Fee Report
Page B-2
S & A TOTALTechnology
feeOVERALL
TOTAL
NONRESIDENT
Operating fee
Building fee
Statutory tuition (sum of
operating and building
fees)
Services and Activities (S & A) fee
Tuition plus
S & A fees (Optional)
OVERALL TUITION
AND FEESUW - Seattle *Undergraduate $14,198 $670 $14,868 $288 $15,156 $111 $15,267Graduate
Tier I $14,596 $530 $15,126 $288 $15,414 $111 $15,525Tier II $14,837 $539 $15,376 $288 $15,664 $111 $15,775Tier III $15,079 $547 $15,626 $288 $15,914 $111 $16,025
Pharm D $15,561 $565 $16,126 $288 $16,414 $111 $16,525Business Masters Program $16,501 $599 $17,100 $288 $17,388 $111 $17,499Law $16,887 $613 $17,500 $288 $17,788 $111 $17,899Professional (MD, DDS) $26,265 $813 $27,078 $288 $27,366 $111 $27,477
UW - BothellAll charges same as aboveexcept S & A and Technology: $249 $120
UW - TacomaAll charges same as aboveexcept S & A and Technology: $273 $120
WSU - all campusesUndergradaute $11,403 $537 $11,940 $330 $12,270 $12,270Graduate $14,091 $511 $14,602 $316 $14,918 $14,918Pharm D $16,864 $612 $17,476 $348 $17,824 $17,824Professional (Veterinary Med.) $26,259 $813 $27,072 $348 $27,420 $27,420
CWUUndergraduate $10,581 $435 $11,016 $396 $11,412 $75 $11,487Graduate $14,810 $457 $15,267 $396 $15,663 $75 $15,738
EWUUndergraduate $10,811 $448 $11,259 $375 $11,634 $105 $11,739Graduate $15,134 $466 $15,600 $375 $15,975 $105 $16,080
TESCUndergraduate $11,379 $474 $11,853 $411 $12,264 $12,264Graduate $15,924 $493 $16,417 $411 $16,828 $16,828
WWUUndergraduate $10,779 $447 $11,226 $381 $11,607 $45 $11,652Graduate $14,387 $445 $14,832 $368 $15,200 $45 $15,245
Community/Technical CollegesUndergraduate $6,399 $593 $6,992 $199 $7,191 varies
* UW - Seattle: Data do not include the new S & A fee II of $35 effective winter quarter 2003.
at public higher education institutionsNonresident tuition and fees for full-time students
2002-03 academic year
TUITION

2002-03 Washington State Tuition and Fee Report
Appendix C
Participating Public Colleges and Universities
ALABAMA
*University of Alabama/Tuscaloosa Alabama State University University of North Alabama Livingston University University of Montevallo University of South Alabama
ALASKA
*University of Alaska, Fairbanks
ARIZONA
*University of Arizona
Northern Arizona University Arizona State University
ARKANSAS
*University of Arkansas/Fayetteville
Arkansas Tech University University of Central Arkansas University of Arkansas/Monticello Arkansas State University
CALIFORNIA
*University of California/Berkeley
California Poly State University California State College/San Bernadino Sonoma State University California State University/Chico California State University/Fresno California State University/Fullerton California State University/Northridge California State University/Long Beach California State University/Los Angeles California State University/Sacramento Humboldt State University
COLORADO
*University of Colorado/Boulder Adams State College Fort Lewis State College Metropolitan State College University of Northern Colorado Western State College of Colorado
CONNECTICUT
*University of Connecticut/Storrs Central Connecticut State University Southern Connecticut State University Western Connecticut State University
DELAWARE
*University of Delaware
FLORIDA1 University of Florida/Gainesville Florida Atlantic University Florida International University University of North Florida University of South Florida University of West Florida
GEORGIA
*University of Georgia Albany State University Armstrong Atlantic State University Augusta State University Columbus State University Georgia College & State University Georgia Southern University Valdosta State University State University of West Georgia College
*Indicates the state university reflected in Tables 1, 2, 3, and 4; tuition and fee data from the other state colleges and universities are averaged in Tables 5, 6, 7, and 8. 1In Florida, tuition and fee rates reflect the average of the following institutions in the state university system.

2002-03 Washington State Tuition and Fee Report
Page C-2
HAWAII
*University of Hawaii/Manoa
IDAHO
*University of Idaho Idaho State University Boise State University
ILLINOIS
*University of Illinois/Urbana Eastern Illinois University Illinois State University Northern Illinois University Northeastern Illinois University Western Illinois University
INDIANA
*Indiana University/Bloomington Ball State University Indiana State University
IOWA
*University of Iowa University of Northern Iowa
KANSAS
*University of Kansas/Lawrence Fort Hays State University Pittsburg State University Emporia State University Wichita State University
KENTUCKY
*University of Kentucky/Lexington Eastern Kentucky University Morehead State University Murray State University Northern Kentucky University Western Kentucky University University of Louisville Kentucky State University
LOUISIANA
*Louisiana State University/ Baton Rouge Louisiana Technical University McNeese State University Nicholls State University University of Louisiana/Monroe Northwestern State University Southeastern Louisiana University Grambling State University
MAINE
*University of Maine University of Maine/Machias University of Maine/Fort Kent University of Maine/Presque Isle
MARYLAND
*University of Maryland/College Park Bowie State University Coppin State College Morgan State University St. Mary's College of Maryland Towson State University Frostburg State University
MASSACHUSETTS
*University of Massachusetts/Amherst Fitchburg State College Framingham State College Massachusetts College of Art Massachusetts College of Liberal Arts University of Massachusetts/ Dartmouth Worcester State College Salem State College
MICHIGAN
*University of Michigan/Ann Arbor Central Michigan University Eastern Michigan University Grand Valley State University Northern Michigan University Oakland University Western Michigan University
*Indicates the state university reflected in Tables 1, 2, 3, and 4; tuition and fee data from the other state colleges and universities are averaged in Tables 5, 6, 7, and 8.

2002-03 Washington State Tuition and Fee Report
Page C-3
MINNESOTA
*University of Minnesota/Twin Cities **Bemidji State University
Mankato State University Metropolitan State University Moorhead State University Saint Cloud State University Southwest State University Winona State University
MISSISSIPPI
*University of Mississippi/Oxford Alcorn State University Jackson State University Mississippi University for Women University of Southern Mississippi Mississippi Valley State University
MISSOURI
*University of Missouri/Columbia Central Missouri State University Missouri Southern State College Missouri Western State College Truman State University Southwest Missouri State College
MONTANA
*University of Montana/Missoula Montana State University/Billings Western Montana College/University of Montana
NEBRASKA
*University of Nebraska/Lincoln Kearney State College Wayne State College
NEVADA
*University of Nevada/Reno University of Nevada/Las Vegas
NEW HAMPSHIRE
*University of New Hampshire/Durham Keene State College Plymouth State College
NEW JERSEY
*Rutgers/New Brunswick Rowan University New Jersey City University Montclair State University New Jersey Institute of Technology Ramapo College of New Jersey Richard Stockton College of NJ The College of New Jersey
NEW MEXICO
*University of New Mexico/ Albuquerque Western New Mexico University
NEW YORK
*State University of NY/Buffalo Empire State College State U of NY College/Brockport State U of NY College/Buffalo State U of NY College/Fredonia State U of NY College/Geneseo State U of NY College/Oneonta State U of NY College/New Paltz State U of NY College/Oswego State U of NY College/Plattsburgh State U of NY College/Potsdam
NORTH CAROLINA *University of North Carolina/Chapel Hill Appalachian State University East Carolina University North Carolina Central University Western Carolina University Winston Salem State University
*Indicates the state university reflected in Tables 1, 2, 3, and 4; tuition and fee data from the other state colleges and universities are averaged in Tables 5, 6, 7, and 8. **State university system.

2002-03 Washington State Tuition and Fee Report Page C-4
NORTH DAKOTA
*University of N Dakota/Grand Forks Dickinson State University Mayville State University Minot State University Valley City State University
OHIO
*Ohio State University/Columbus Bowling Green State University University of Akron University of Toledo Wright State University
OKLAHOMA
*University of Oklahoma/Norman University of Central Oklahoma East Central University Northeastern State University Northwestern OK State University Southeastern OK State University Southwestern OK State University
OREGON
*University of Oregon/Eugene Eastern Oregon State University Southern Oregon State University Portland State University Oregon Institute of Technology
PENNSYLVANIA
*PA State University/University Park Bloomsburg University of PA California University of PA Cheyney University of PA Clarion University of PA East Stroudsburg University of PA Edinboro University of PA Indiana University of PA Kutztown University of PA Lock Haven University of PA Mansfield University of PA Millersville University of PA Slippery Rock University of PA Shippensburg University of PA West Chester University of PA
RHODE ISLAND *University of Rhode Island
Rhode Island College
SOUTH CAROLINA
*University of South Carolina Francis Marion College
SOUTH DAKOTA
*University of S Dakota/Vermillion Black Hills State University Dakota State University
TENNESSEE
*University of Tennessee/Knoxville Austin Peay State University East Tennessee State University University of Memphis Middle Tennessee State University University of Tennessee/Chattanooga University of Tennessee/Martin
TEXAS
*University of Texas/Austin Angelo State University East Texas State University Midwestern State University North Texas State University Sam Houston State University Southwest Texas State University Stephen F. Austin State University Texas A & M/Kingsville West Texas State University
UTAH
*University of Utah Weber State University
VERMONT *University of Vermont and State College Castleton State College Lyndon State College
*Indicates the state university reflected in Tables 1, 2, 3, and 4; tuition and fee data from the other state colleges and universities are averaged in Tables 5, 6, 7, and 8.

2002-03 Washington State Tuition and Fee Report
Page C-5 VIRGINIA
*University of Virginia/Charlottesville
George Mason University Longwood College James Madison University Old Dominion University Radford University
WASHINGTON
*University of Washington Central Washington University Eastern Washington University The Evergreen State College Western Washington University
WEST VIRGINIA
*West Virginia University/Morgantown Bluefield State College Concord College Fairmont State College Marshall University Shepherd College West Liberty State College West Virginia Institute of Technology
WISCONSIN
*University of Wisconsin/Madison University of Wisconsin/Eau Claire University of Wisconsin/Oshkosh University of Wisconsin/River Falls University of Wisconsin/Stevens Point
WYOMING
*University of Wyoming
*Indicates the state university reflected in Tables 1, 2, 3, and 4; tuition and fee data from the other state colleges and universities are averaged in Tables 5, 6, 7, and 8.


