43
| Date post: | 14-Apr-2018 |
| Category: |
Documents |
| Upload: | texas-school-survey-of-drug-and-alcohol-use-elementary-reports |
| View: | 218 times |
| Download: | 0 times |

7/30/2019 2002 _ dallas county _ duncanville isd _ 2002 texas school survey of drug and alcohol use _ elementary report
http://slidepdf.com/reader/full/2002-dallas-county-duncanville-isd-2002-texas-school-survey-of-drug-and 1/43

7/30/2019 2002 _ dallas county _ duncanville isd _ 2002 texas school survey of drug and alcohol use _ elementary report
http://slidepdf.com/reader/full/2002-dallas-county-duncanville-isd-2002-texas-school-survey-of-drug-and 2/43
DuncanvilleSpring 2002
________________________________________________________________________________
Table T-1: How recently, if ever, have you used...
Ever School Not Past NeverUsed Year Year Used
________________________________________________________________________________Any tobacco product All 7.2% 3.4% 3.8% 92.8%
Grade 4 2.7% 1.2% 1.5% 97.3%Grade 5 7.8% 4.0% 3.8% 92.2%Grade 6 10.9% 5.0% 5.9% 89.1%
________________________________________________________________________________Cigarettes All 6.6% 3.2% 3.4% 93.4%
Grade 4 2.1% 0.9% 1.2% 97.9%Grade 5 7.2% 3.6% 3.6% 92.8%Grade 6 10.2% 4.9% 5.3% 89.8%
________________________________________________________________________________Smokeless tobacco All 1.2% 0.7% 0.5% 98.8%
Grade 4 0.6% 0.3% 0.3% 99.4%Grade 5 1.6% 1.0% 0.6% 98.4%
Grade 6 1.4% 0.7% 0.7% 98.6%
________________________________________________________________________________
Table T-2: Average number of times selected tobacco products were used by thosewho reported use of ...
Any tobacco product
School LifetimeYear
All 3.5 3.1Grade 4 * 3.2Grade 5 2.9 3.4Grade 6 3.8 3.0
Cigarettes
School LifetimeYear
All 3.1 2.9Grade 4 * 3.3Grade 5 2.6 2.7Grade 6 3.3 2.9
Smokeless tobacco
School LifetimeYear
All 3.5 3.0Grade 4 * *
Grade 5 * *Grade 6 * *

7/30/2019 2002 _ dallas county _ duncanville isd _ 2002 texas school survey of drug and alcohol use _ elementary report
http://slidepdf.com/reader/full/2002-dallas-county-duncanville-isd-2002-texas-school-survey-of-drug-and 3/43
DuncanvilleSpring 2002
________________________________________________________________________________
Table T-3: Average age of first use of tobacco:
Grade 4 Grade 5 Grade 6
Tobacco 7.9 8.6 9.5
________________________________________________________________________________
Table T-4: Average age of first use of tobacco by family situation:
Two Parent Family
Never 7/Under 8 9 10 11 12/Over
All 95.4% 1.6% 0.5% 0.7% 0.8% 0.7% 0.2%Grade 4 97.8% 1.0% 0.7% 0.2% 0.2% * % * %Grade 5 94.8% 2.2% * % 1.1% 1.1% 0.7% * %Grade 6 93.3% 1.7% 0.7% 0.7% 1.2% 1.5% 0.7%
Other Family Situation
Never 7/Under 8 9 10 11 12/Over
All 88.5% 2.9% 1.5% 1.7% 2.6% 2.2% 0.6%Grade 4 95.3% 2.4% 0.5% 1.4% 0.5% * % * %Grade 5 90.2% 2.9% 2.5% 1.5% 2.5% 0.5% * %Grade 6 81.7% 3.4% 1.4% 2.0% 4.4% 5.4% 1.7%
________________________________________________________________________________
Table T-6: Have you ever been offered ...
Any tobacco product?
NeverHeard of Yes No
All 2.3% 19.0% 78.7%Grade 4 3.6% 14.1% 82.3%Grade 5 2.7% 18.8% 78.5%Grade 6 0.7% 23.7% 75.6%
Cigarettes?
NeverHeard of Yes No
All 4.6% 17.7% 77.7%Grade 4 7.1% 12.9% 80.1%Grade 5 5.3% 17.5% 77.3%Grade 6 1.6% 22.5% 75.9%
Smokeless tobacco?
NeverHeard of Yes No
All 7.4% 4.3% 88.3%Grade 4 12.4% 3.5% 84.1%Grade 5 5.8% 4.7% 89.5%Grade 6 4.2% 4.7% 91.1%

7/30/2019 2002 _ dallas county _ duncanville isd _ 2002 texas school survey of drug and alcohol use _ elementary report
http://slidepdf.com/reader/full/2002-dallas-county-duncanville-isd-2002-texas-school-survey-of-drug-and 4/43
DuncanvilleSpring 2002
________________________________________________________________________________
Table T-7: How dangerous do you think it is for kids your age to use ...
Any tobacco product?
Never Very Not at All Do NotHeard of Dangerous Dangerous Dangerous Know
All 1.9% 73.7% 18.3% 1.3% 4.7%Grade 4 3.3% 77.7% 13.7% 1.1% 4.1%Grade 5 2.1% 73.7% 18.0% 0.8% 5.3%Grade 6 0.4% 70.0% 23.0% 1.9% 4.7%
Cigarettes?
Never Very Not at All Do NotHeard of Dangerous Dangerous Dangerous Know
All 3.6% 60.9% 27.0% 1.9% 6.6%
Grade 4 6.1% 65.0% 22.0% 1.1% 5.8%Grade 5 3.7% 61.9% 26.5% 1.5% 6.5%Grade 6 1.3% 56.3% 32.1% 2.9% 7.3%
Smokeless tobacco?
Never Very Not at All Do NotHeard of Dangerous Dangerous Dangerous Know
All 5.4% 67.0% 18.6% 1.7% 7.3%Grade 4 8.9% 70.0% 13.7% 1.0% 6.4%Grade 5 4.6% 67.0% 19.6% 1.3% 7.5%Grade 6 2.9% 64.3% 22.2% 2.6% 7.9%

7/30/2019 2002 _ dallas county _ duncanville isd _ 2002 texas school survey of drug and alcohol use _ elementary report
http://slidepdf.com/reader/full/2002-dallas-county-duncanville-isd-2002-texas-school-survey-of-drug-and 5/43

7/30/2019 2002 _ dallas county _ duncanville isd _ 2002 texas school survey of drug and alcohol use _ elementary report
http://slidepdf.com/reader/full/2002-dallas-county-duncanville-isd-2002-texas-school-survey-of-drug-and 6/43
DuncanvilleSpring 2002
________________________________________________________________________________
Table A-1: How recently, if ever, have you used...
Ever School Not Past NeverUsed Year Year Used
________________________________________________________________________________Any alcohol product All 24.7% 14.5% 10.2% 75.3%
Grade 4 18.1% 10.9% 7.3% 81.9%Grade 5 26.2% 14.2% 12.0% 73.8%Grade 6 29.4% 18.1% 11.3% 70.6%
________________________________________________________________________________Beer All 14.2% 7.2% 7.0% 85.8%
Grade 4 11.3% 6.6% 4.7% 88.8%Grade 5 15.6% 7.1% 8.5% 84.4%Grade 6 15.8% 8.0% 7.8% 84.2%
________________________________________________________________________________Wine coolers All 13.3% 7.4% 5.9% 86.7%
Grade 4 6.1% 3.1% 3.0% 93.9%Grade 5 12.9% 6.7% 6.1% 87.1%
Grade 6 20.6% 12.1% 8.5% 79.4%________________________________________________________________________________Wine All 12.9% 6.7% 6.2% 87.1%
Grade 4 7.2% 3.8% 3.4% 92.8%Grade 5 15.7% 7.7% 7.9% 84.3%Grade 6 15.8% 8.6% 7.2% 84.2%
________________________________________________________________________________Liquor All 5.0% 2.6% 2.4% 95.0%
Grade 4 2.2% 0.9% 1.3% 97.8%Grade 5 5.3% 2.1% 3.3% 94.7%Grade 6 7.4% 4.7% 2.7% 92.6%
________________________________________________________________________________
Table A-2: Average number of times selected alcohol products were used by thosewho reported use of ...
Any alcohol product
School LifetimeYear
All 4.3 5.0Grade 4 2.3 2.7Grade 5 4.2 4.5Grade 6 5.4 6.5
Beer
School LifetimeYear
All 2.3 2.8Grade 4 2.0 2.1
Grade 5 1.9 2.2Grade 6 2.8 3.7
Liquor
School LifetimeYear
All 2.9 3.0Grade 4 * 1.9Grade 5 3.5 2.8Grade 6 3.0 3.4

7/30/2019 2002 _ dallas county _ duncanville isd _ 2002 texas school survey of drug and alcohol use _ elementary report
http://slidepdf.com/reader/full/2002-dallas-county-duncanville-isd-2002-texas-school-survey-of-drug-and 7/43
DuncanvilleSpring 2002
________________________________________________________________________________
Wine
School LifetimeYear
All 2.7 2.6Grade 4 1.7 1.9Grade 5 2.6 2.5Grade 6 3.0 3.0
Wine coolers
School LifetimeYear
All 2.7 2.9Grade 4 1.5 2.0Grade 5 2.9 2.8
Grade 6 3.0 3.2
________________________________________________________________________________
Table A-3: In the past year, how many times have you had two or more drinks atone time of ...
Beer?
Never 1 Time 2 Times 3+ Times Ever
All 89.1% 7.1% 2.3% 1.6% 10.9%Grade 4 89.8% 6.6% 2.4% 1.1% 10.2%Grade 5 87.5% 9.9% 1.7% 0.9% 12.5%Grade 6 89.7% 4.9% 2.6% 2.7% 10.3%
Wine Coolers?
Never 1 Time 2 Times 3+ Times Ever
All 88.9% 5.8% 2.9% 2.5% 11.1%Grade 4 94.7% 2.8% 1.3% 1.2% 5.3%Grade 5 88.2% 5.9% 3.1% 2.9% 11.8%Grade 6 84.1% 8.3% 4.2% 3.4% 15.9%
Wine?
Never 1 Time 2 Times 3+ Times Ever
All 88.4% 8.2% 2.0% 1.4% 11.6%Grade 4 91.7% 5.8% 1.8% 0.7% 8.3%Grade 5 86.3% 10.9% 1.5% 1.3% 13.7%Grade 6 87.4% 7.9% 2.5% 2.2% 12.6%
Liquor?
Never 1 Time 2 Times 3+ Times Ever
All 96.1% 1.8% 1.1% 1.1% 3.9%Grade 4 98.3% 0.7% 0.3% 0.7% 1.7%Grade 5 95.6% 2.2% 0.9% 1.3% 4.4%Grade 6 94.5% 2.5% 1.9% 1.2% 5.5%
7/30/2019 2002 _ dallas county _ duncanville isd _ 2002 texas school survey of drug and alcohol use _ elementary report
http://slidepdf.com/reader/full/2002-dallas-county-duncanville-isd-2002-texas-school-survey-of-drug-and 8/43
DuncanvilleSpring 2002
________________________________________________________________________________
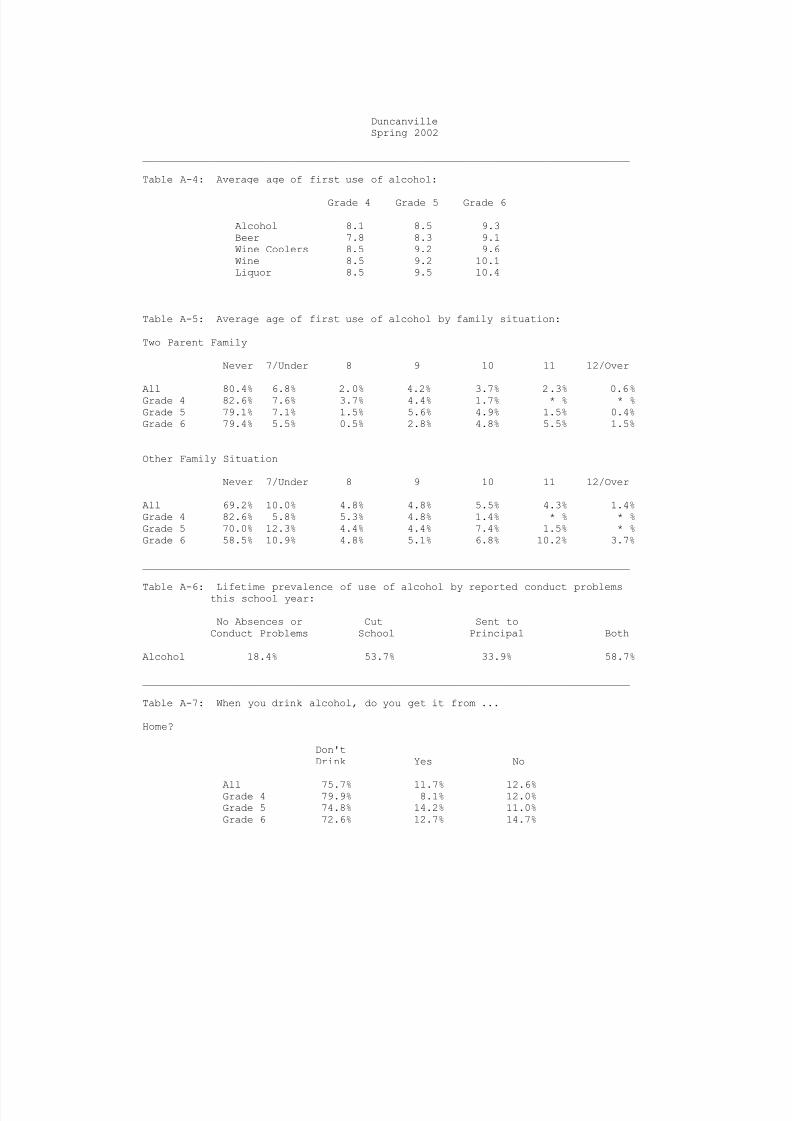
Table A-4: Average age of first use of alcohol:
Grade 4 Grade 5 Grade 6
Alcohol 8.1 8.5 9.3Beer 7.8 8.3 9.1Wine Coolers 8.5 9.2 9.6Wine 8.5 9.2 10.1Liquor 8.5 9.5 10.4
________________________________________________________________________________
Table A-5: Average age of first use of alcohol by family situation:
Two Parent Family
Never 7/Under 8 9 10 11 12/Over
All 80.4% 6.8% 2.0% 4.2% 3.7% 2.3% 0.6%Grade 4 82.6% 7.6% 3.7% 4.4% 1.7% * % * %Grade 5 79.1% 7.1% 1.5% 5.6% 4.9% 1.5% 0.4%Grade 6 79.4% 5.5% 0.5% 2.8% 4.8% 5.5% 1.5%
Other Family Situation
Never 7/Under 8 9 10 11 12/Over
All 69.2% 10.0% 4.8% 4.8% 5.5% 4.3% 1.4%Grade 4 82.6% 5.8% 5.3% 4.8% 1.4% * % * %Grade 5 70.0% 12.3% 4.4% 4.4% 7.4% 1.5% * %Grade 6 58.5% 10.9% 4.8% 5.1% 6.8% 10.2% 3.7%
________________________________________________________________________________
Table A-6: Lifetime prevalence of use of alcohol by reported conduct problemsthis school year:
No Absences or Cut Sent toConduct Problems School Principal Both
Alcohol 18.4% 53.7% 33.9% 58.7%
________________________________________________________________________________
Table A-7: When you drink alcohol, do you get it from ...
Home?
Don'tDrink Yes No
All 75.7% 11.7% 12.6%Grade 4 79.9% 8.1% 12.0%Grade 5 74.8% 14.2% 11.0%Grade 6 72.6% 12.7% 14.7%
7/30/2019 2002 _ dallas county _ duncanville isd _ 2002 texas school survey of drug and alcohol use _ elementary report
http://slidepdf.com/reader/full/2002-dallas-county-duncanville-isd-2002-texas-school-survey-of-drug-and 9/43
DuncanvilleSpring 2002
________________________________________________________________________________
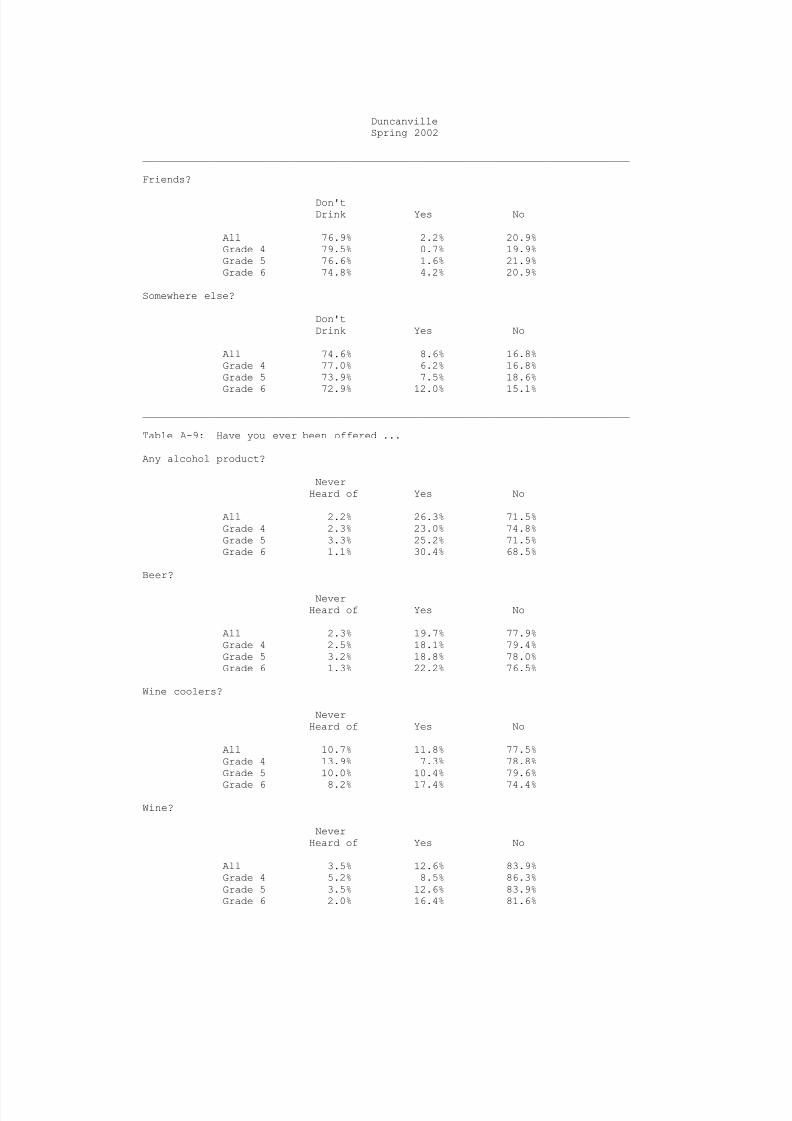
Friends?
Don'tDrink Yes No
All 76.9% 2.2% 20.9%Grade 4 79.5% 0.7% 19.9%Grade 5 76.6% 1.6% 21.9%Grade 6 74.8% 4.2% 20.9%
Somewhere else?
Don'tDrink Yes No
All 74.6% 8.6% 16.8%Grade 4 77.0% 6.2% 16.8%Grade 5 73.9% 7.5% 18.6%
Grade 6 72.9% 12.0% 15.1%
________________________________________________________________________________
Table A-9: Have you ever been offered ...
Any alcohol product?
NeverHeard of Yes No
All 2.2% 26.3% 71.5%Grade 4 2.3% 23.0% 74.8%Grade 5 3.3% 25.2% 71.5%Grade 6 1.1% 30.4% 68.5%
Beer?
NeverHeard of Yes No
All 2.3% 19.7% 77.9%Grade 4 2.5% 18.1% 79.4%Grade 5 3.2% 18.8% 78.0%Grade 6 1.3% 22.2% 76.5%
Wine coolers?
NeverHeard of Yes No
All 10.7% 11.8% 77.5%Grade 4 13.9% 7.3% 78.8%Grade 5 10.0% 10.4% 79.6%
Grade 6 8.2% 17.4% 74.4%
Wine?
NeverHeard of Yes No
All 3.5% 12.6% 83.9%Grade 4 5.2% 8.5% 86.3%Grade 5 3.5% 12.6% 83.9%Grade 6 2.0% 16.4% 81.6%
7/30/2019 2002 _ dallas county _ duncanville isd _ 2002 texas school survey of drug and alcohol use _ elementary report
http://slidepdf.com/reader/full/2002-dallas-county-duncanville-isd-2002-texas-school-survey-of-drug-and 10/43
DuncanvilleSpring 2002
________________________________________________________________________________
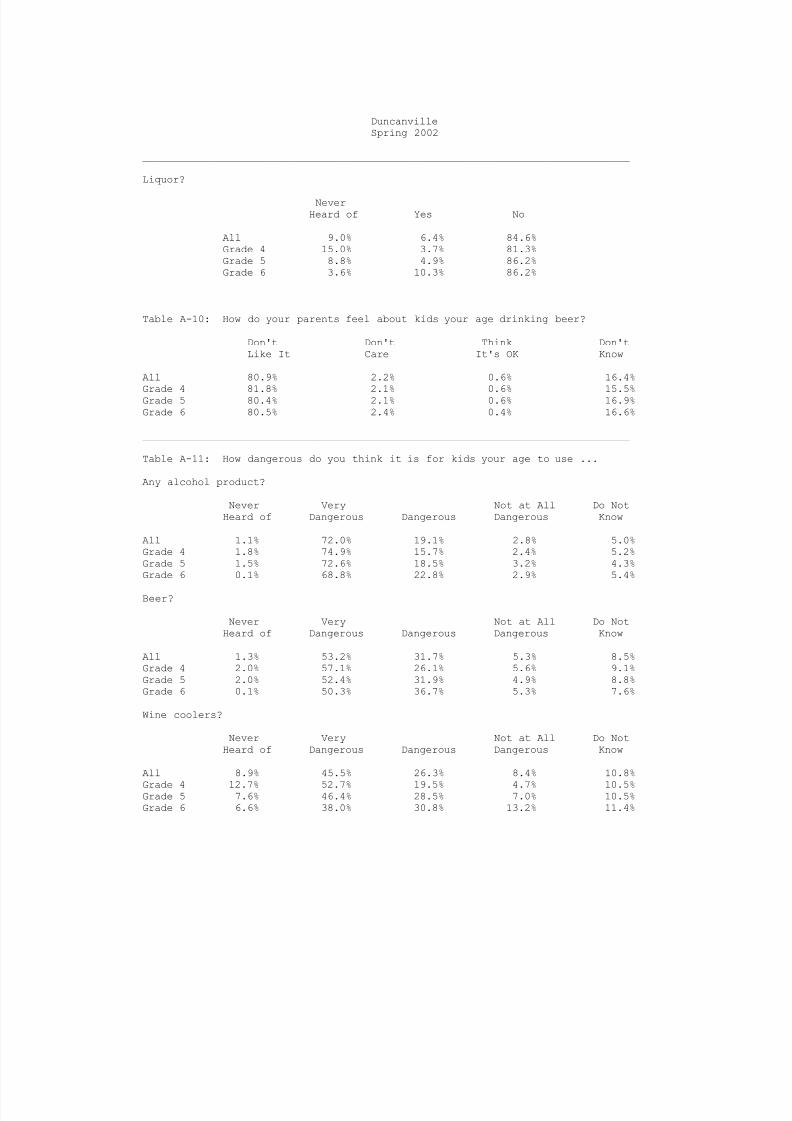
Liquor?
NeverHeard of Yes No
All 9.0% 6.4% 84.6%Grade 4 15.0% 3.7% 81.3%Grade 5 8.8% 4.9% 86.2%Grade 6 3.6% 10.3% 86.2%
________________________________________________________________________________
Table A-10: How do your parents feel about kids your age drinking beer?
Don't Don't Think Don'tLike It Care It's OK Know
All 80.9% 2.2% 0.6% 16.4%
Grade 4 81.8% 2.1% 0.6% 15.5%Grade 5 80.4% 2.1% 0.6% 16.9%Grade 6 80.5% 2.4% 0.4% 16.6%
________________________________________________________________________________
Table A-11: How dangerous do you think it is for kids your age to use ...
Any alcohol product?
Never Very Not at All Do NotHeard of Dangerous Dangerous Dangerous Know
All 1.1% 72.0% 19.1% 2.8% 5.0%Grade 4 1.8% 74.9% 15.7% 2.4% 5.2%Grade 5 1.5% 72.6% 18.5% 3.2% 4.3%Grade 6 0.1% 68.8% 22.8% 2.9% 5.4%
Beer?
Never Very Not at All Do NotHeard of Dangerous Dangerous Dangerous Know
All 1.3% 53.2% 31.7% 5.3% 8.5%Grade 4 2.0% 57.1% 26.1% 5.6% 9.1%Grade 5 2.0% 52.4% 31.9% 4.9% 8.8%Grade 6 0.1% 50.3% 36.7% 5.3% 7.6%
Wine coolers?
Never Very Not at All Do NotHeard of Dangerous Dangerous Dangerous Know
All 8.9% 45.5% 26.3% 8.4% 10.8%
Grade 4 12.7% 52.7% 19.5% 4.7% 10.5%Grade 5 7.6% 46.4% 28.5% 7.0% 10.5%Grade 6 6.6% 38.0% 30.8% 13.2% 11.4%

7/30/2019 2002 _ dallas county _ duncanville isd _ 2002 texas school survey of drug and alcohol use _ elementary report
http://slidepdf.com/reader/full/2002-dallas-county-duncanville-isd-2002-texas-school-survey-of-drug-and 11/43
DuncanvilleSpring 2002
________________________________________________________________________________
Wine?
Never Very Not at All Do NotHeard of Dangerous Dangerous Dangerous Know
All 2.1% 49.4% 29.3% 8.3% 11.0%Grade 4 3.8% 57.0% 22.9% 5.7% 10.5%Grade 5 2.2% 47.7% 29.8% 9.2% 11.2%Grade 6 0.4% 43.8% 34.8% 9.8% 11.2%
Liquor?
Never Very Not at All Do NotHeard of Dangerous Dangerous Dangerous Know
All 6.8% 66.2% 17.7% 2.3% 7.0%Grade 4 12.5% 66.5% 12.3% 0.8% 7.8%Grade 5 6.2% 67.3% 18.2% 2.9% 5.5%
Grade 6 2.1% 64.9% 22.2% 3.1% 7.7%

7/30/2019 2002 _ dallas county _ duncanville isd _ 2002 texas school survey of drug and alcohol use _ elementary report
http://slidepdf.com/reader/full/2002-dallas-county-duncanville-isd-2002-texas-school-survey-of-drug-and 12/43
DuncanvilleSpring 2002
________________________________________________________________________________
Table D-1: How recently, if ever, have you used...
Ever School Not Past NeverUsed Year Year Used
________________________________________________________________________________Marijuana All 1.7% 0.8% 0.9% 98.3%
Grade 4 1.1% 0.3% 0.8% 98.9%Grade 5 0.4% * % 0.4% 99.6%Grade 6 3.5% 2.1% 1.4% 96.5%
________________________________________________________________________________
Table D-2: Average number of times marijuana was used by those reporting usage:
School LifetimeYear
All 3.5 3.7
Grade 4 * *Grade 5 * *Grade 6 3.1 4.0
________________________________________________________________________________
Table D-3: Average age of first use of marijuana:
Grade 4 Grade 5 Grade 6
Marijuana * * 10.5
________________________________________________________________________________
Table D-4: Average age of first use of marijuana by family situation:
Two Parent Family
Never 7/Under 8 9 10 11 12/Over
All 99.6% 0.1% * % * % 0.1% 0.2% * %Grade 4 99.7% * % * % * % 0.3% * % * %Grade 5 99.6% 0.4% * % * % * % * % * %Grade 6 99.5% * % * % * % * % 0.5% * %
Other Family Situation
Never 7/Under 8 9 10 11 12/Over
All 97.3% 0.1% 0.3% 0.5% 0.7% 0.5% 0.5%Grade 4 98.5% 0.5% * % 1.0% * % * % * %Grade 5 99.5% * % 0.5% * % * % * % * %Grade 6 94.4% * % 0.3% 0.7% 1.7% 1.4% 1.4%

7/30/2019 2002 _ dallas county _ duncanville isd _ 2002 texas school survey of drug and alcohol use _ elementary report
http://slidepdf.com/reader/full/2002-dallas-county-duncanville-isd-2002-texas-school-survey-of-drug-and 13/43
DuncanvilleSpring 2002
________________________________________________________________________________
Table D-5: Lifetime prevalence of use of marijuana by reported conduct problems
this school year:
No Absences or Cut Sent toConduct Problems School Principal Both
Marijuana 0.7% 22.1% 2.7% 25.2%
________________________________________________________________________________
Table D-7: Have you ever been offered marijuana?
NeverHeard of Yes No
All 11.5% 5.5% 82.9%Grade 4 17.2% 4.2% 78.6%
Grade 5 12.6% 3.5% 83.9%Grade 6 5.3% 8.7% 86.0%
________________________________________________________________________________
Table D-8: How do your parents feel about kids your age smoking marijuana?
Don't Don't Think Don'tLike It Care It's OK Know
All 83.4% 1.4% 0.2% 15.1%Grade 4 82.8% 1.4% 0.2% 15.6%Grade 5 83.5% 0.8% * % 15.7%Grade 6 83.7% 1.8% 0.4% 14.0%
________________________________________________________________________________
Table D-9: How dangerous do you think it is for kids your age to use marijuana?
Never Very Not at All Do NotHeard of Dangerous Dangerous Dangerous Know
All 8.4% 76.1% 8.5% 1.3% 5.7%Grade 4 14.4% 70.0% 7.5% 1.0% 7.1%Grade 5 8.3% 78.7% 7.9% 0.4% 4.6%Grade 6 2.9% 79.4% 10.0% 2.3% 5.3%

7/30/2019 2002 _ dallas county _ duncanville isd _ 2002 texas school survey of drug and alcohol use _ elementary report
http://slidepdf.com/reader/full/2002-dallas-county-duncanville-isd-2002-texas-school-survey-of-drug-and 14/43
DuncanvilleSpring 2002
________________________________________________________________________________
Table I-1: How recently, if ever, have you used...
Ever School Not Past NeverUsed Year Year Used
________________________________________________________________________________Inhalants All 7.4% 4.8% 2.7% 92.6%
Grade 4 6.2% 2.7% 3.6% 93.8%Grade 5 8.0% 5.5% 2.4% 92.0%Grade 6 8.0% 6.1% 2.0% 92.0%
________________________________________________________________________________
Table I-2: Have you ever sniffed any of the following inhalants to get high?
Correction Fluid/Whiteout
Not Used Used
All 97.6% 2.4%Grade 4 98.6% 1.4%Grade 5 96.9% 3.1%Grade 6 97.2% 2.8%
Gasoline
Not Used Used
All 98.1% 1.9%Grade 4 98.4% 1.6%Grade 5 97.7% 2.3%Grade 6 98.1% 1.9%
Glue
Not Used Used
All 97.8% 2.2%Grade 4 97.4% 2.6%Grade 5 97.9% 2.1%Grade 6 98.1% 1.9%
Paint Thinner
Not Used Used
All 98.9% 1.1%Grade 4 99.2% 0.8%Grade 5 98.3% 1.7%Grade 6 99.3% 0.7%
Spray Paint
Not Used Used
All 98.3% 1.7%Grade 4 98.4% 1.6%Grade 5 98.3% 1.7%Grade 6 98.3% 1.7%

7/30/2019 2002 _ dallas county _ duncanville isd _ 2002 texas school survey of drug and alcohol use _ elementary report
http://slidepdf.com/reader/full/2002-dallas-county-duncanville-isd-2002-texas-school-survey-of-drug-and 15/43
DuncanvilleSpring 2002
________________________________________________________________________________
Other Inhalants
Not Used Used
All 96.6% 3.4%Grade 4 96.7% 3.3%Grade 5 96.3% 3.7%Grade 6 97.0% 3.0%
________________________________________________________________________________
Table I-3: Average number of times inhalants were used by those reporting usage:
School LifetimeYear
All 3.3 3.3
Grade 4 * *Grade 5 2.8 3.0Grade 6 3.1 2.9
________________________________________________________________________________
Table I-4: Number of different kinds of inhalants used:
0 1 2-3 4+
All 93.2% 3.6% 2.7% 0.5%Grade 4 94.2% 2.9% 2.3% 0.6%Grade 5 92.8% 3.3% 3.5% 0.4%Grade 6 92.7% 4.6% 2.3% 0.4%
________________________________________________________________________________
Table I-5: Average age of first use of inhalants:
Grade 4 Grade 5 Grade 6
Inhalants * 9.4 9.6
________________________________________________________________________________
Table I-6: Average age of first use of inhalants by family situation:
Two Parent Family
Never 7/Under 8 9 10 11 12/Over
All 96.9% 0.8% 0.4% 0.7% 0.5% 0.8% * %Grade 4 97.9% 0.3% 0.5% 1.3% * % * % * %Grade 5 95.1% 1.5% * % 0.8% 1.5% 1.1% * %
Grade 6 97.4% 0.8% 0.5% * % * % 1.3% * %

7/30/2019 2002 _ dallas county _ duncanville isd _ 2002 texas school survey of drug and alcohol use _ elementary report
http://slidepdf.com/reader/full/2002-dallas-county-duncanville-isd-2002-texas-school-survey-of-drug-and 16/43
DuncanvilleSpring 2002
________________________________________________________________________________
Other Family Situation
Never 7/Under 8 9 10 11 12/Over
All 94.7% 0.4% 0.5% 1.4% 1.2% 1.4% 0.4%Grade 4 99.5% * % * % 0.5% * % * % * %Grade 5 93.8% 0.5% 1.0% 1.0% 1.6% 2.1% * %Grade 6 92.0% 0.7% 0.3% 2.4% 1.7% 1.7% 1.0%
________________________________________________________________________________
Table I-7: Lifetime prevalence of use of inhalants by reported conduct problems
this school year:
No Absences or Cut Sent toConduct Problems School Principal Both
Inhalants 2.2% 12.1% 7.2% 18.1%
________________________________________________________________________________
Table I-9: Have you ever been offered inhalants?
NeverHeard of Yes No
All 7.3% 6.5% 86.2%Grade 4 11.6% 4.0% 84.4%Grade 5 7.4% 7.0% 85.6%Grade 6 3.1% 8.5% 88.4%
________________________________________________________________________________
Table I-10: How dangerous do you think it is for kids your age to use inhalants?
Never Very Not at All Do NotHeard of Dangerous Dangerous Dangerous Know
All 5.5% 65.8% 17.7% 2.7% 8.3%Grade 4 9.4% 64.8% 13.8% 2.5% 9.4%Grade 5 5.5% 64.7% 19.9% 2.4% 7.5%Grade 6 1.8% 67.9% 19.3% 3.0% 8.0%

7/30/2019 2002 _ dallas county _ duncanville isd _ 2002 texas school survey of drug and alcohol use _ elementary report
http://slidepdf.com/reader/full/2002-dallas-county-duncanville-isd-2002-texas-school-survey-of-drug-and 17/43
7/30/2019 2002 _ dallas county _ duncanville isd _ 2002 texas school survey of drug and alcohol use _ elementary report
http://slidepdf.com/reader/full/2002-dallas-county-duncanville-isd-2002-texas-school-survey-of-drug-and 18/43
DuncanvilleSpring 2002
________________________________________________________________________________
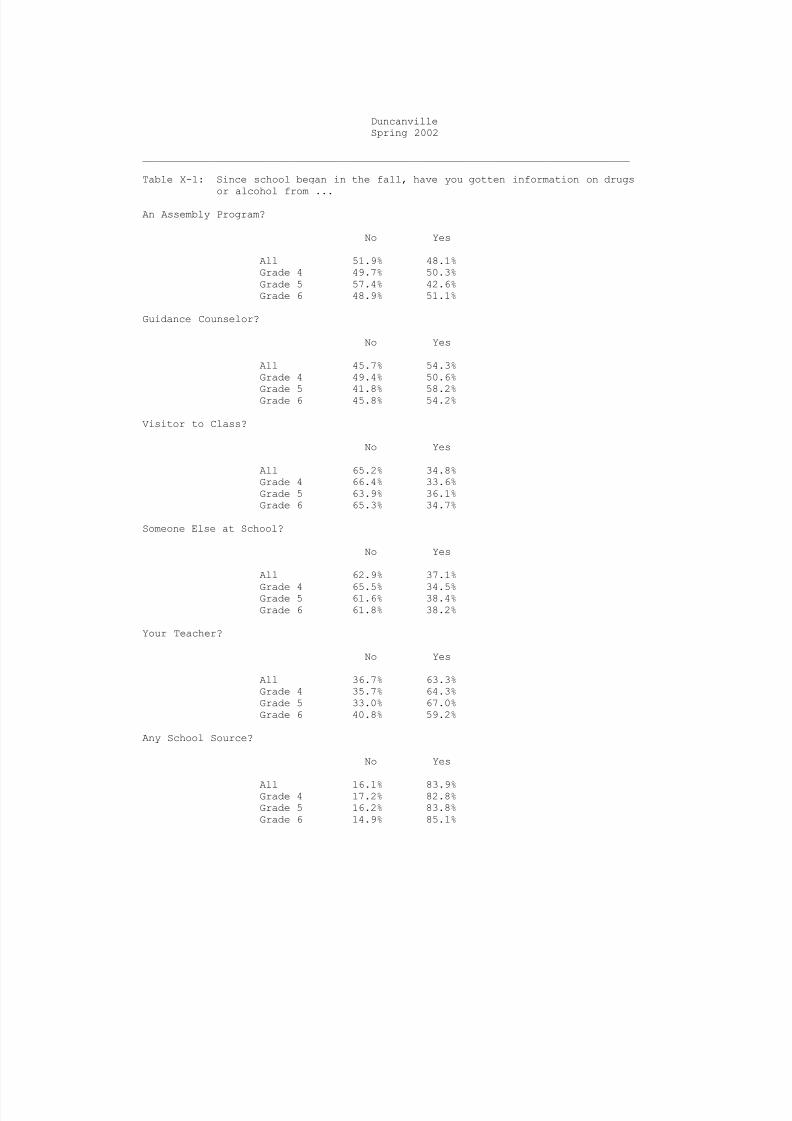
Table X-1: Since school began in the fall, have you gotten information on drugs
or alcohol from ...
An Assembly Program?
No Yes
All 51.9% 48.1%Grade 4 49.7% 50.3%Grade 5 57.4% 42.6%Grade 6 48.9% 51.1%
Guidance Counselor?
No Yes
All 45.7% 54.3%Grade 4 49.4% 50.6%
Grade 5 41.8% 58.2%Grade 6 45.8% 54.2%
Visitor to Class?
No Yes
All 65.2% 34.8%Grade 4 66.4% 33.6%Grade 5 63.9% 36.1%Grade 6 65.3% 34.7%
Someone Else at School?
No Yes
All 62.9% 37.1%
Grade 4 65.5% 34.5%Grade 5 61.6% 38.4%Grade 6 61.8% 38.2%
Your Teacher?
No Yes
All 36.7% 63.3%Grade 4 35.7% 64.3%Grade 5 33.0% 67.0%Grade 6 40.8% 59.2%
Any School Source?
No Yes
All 16.1% 83.9%Grade 4 17.2% 82.8%Grade 5 16.2% 83.8%Grade 6 14.9% 85.1%

7/30/2019 2002 _ dallas county _ duncanville isd _ 2002 texas school survey of drug and alcohol use _ elementary report
http://slidepdf.com/reader/full/2002-dallas-county-duncanville-isd-2002-texas-school-survey-of-drug-and 19/43

7/30/2019 2002 _ dallas county _ duncanville isd _ 2002 texas school survey of drug and alcohol use _ elementary report
http://slidepdf.com/reader/full/2002-dallas-county-duncanville-isd-2002-texas-school-survey-of-drug-and 20/43
DuncanvilleSpring 2002
Table B1: Prevalence and recency of use of selected substances by grade--> All Students
Ever School Not Past Never
Used Year Year Used________________________________________________________________________________Tobacco All 7.2% 3.4% 3.8% 92.8%
Grade 4 2.7% 1.2% 1.5% 97.3%Grade 5 7.8% 4.0% 3.8% 92.2%Grade 6 10.9% 5.0% 5.9% 89.1%
________________________________________________________________________________Alcohol All 24.7% 14.5% 10.2% 75.3%
Grade 4 18.1% 10.9% 7.3% 81.9%Grade 5 26.2% 14.2% 12.0% 73.8%Grade 6 29.4% 18.1% 11.3% 70.6%
________________________________________________________________________________Inhalants All 7.4% 4.8% 2.7% 92.6%
Grade 4 6.2% 2.7% 3.6% 93.8%Grade 5 8.0% 5.5% 2.4% 92.0%Grade 6 8.0% 6.1% 2.0% 92.0%
________________________________________________________________________________
Marijuana All 1.7% 0.8% 0.9% 98.3%Grade 4 1.1% 0.3% 0.8% 98.9%Grade 5 0.4% * % 0.4% 99.6%Grade 6 3.5% 2.1% 1.4% 96.5%
________________________________________________________________________________
Table B2: Prevalence and recency of use of selected substances by grade--> Male Students
Ever School Not Past NeverUsed Year Year Used
________________________________________________________________________________Tobacco All 9.9% 4.9% 4.9% 90.1%
Grade 4 3.4% 1.9% 1.5% 96.6%Grade 5 12.1% 6.5% 5.6% 87.9%Grade 6 14.1% 6.5% 7.6% 85.9%
________________________________________________________________________________Alcohol All 27.3% 15.5% 11.8% 72.7%
Grade 4 21.9% 11.6% 10.3% 78.1%Grade 5 27.0% 13.0% 13.9% 73.0%Grade 6 32.7% 21.2% 11.5% 67.3%
________________________________________________________________________________Inhalants All 8.4% 5.5% 3.0% 91.6%
Grade 4 6.9% 3.1% 3.8% 93.1%Grade 5 9.4% 5.8% 3.6% 90.6%Grade 6 9.1% 7.4% 1.7% 90.9%
________________________________________________________________________________Marijuana All 2.0% 1.1% 0.9% 98.0%
Grade 4 1.6% 0.6% 0.9% 98.4%Grade 5 0.4% * % 0.4% 99.6%Grade 6 3.7% 2.6% 1.1% 96.3%
________________________________________________________________________________
7/30/2019 2002 _ dallas county _ duncanville isd _ 2002 texas school survey of drug and alcohol use _ elementary report
http://slidepdf.com/reader/full/2002-dallas-county-duncanville-isd-2002-texas-school-survey-of-drug-and 21/43
DuncanvilleSpring 2002
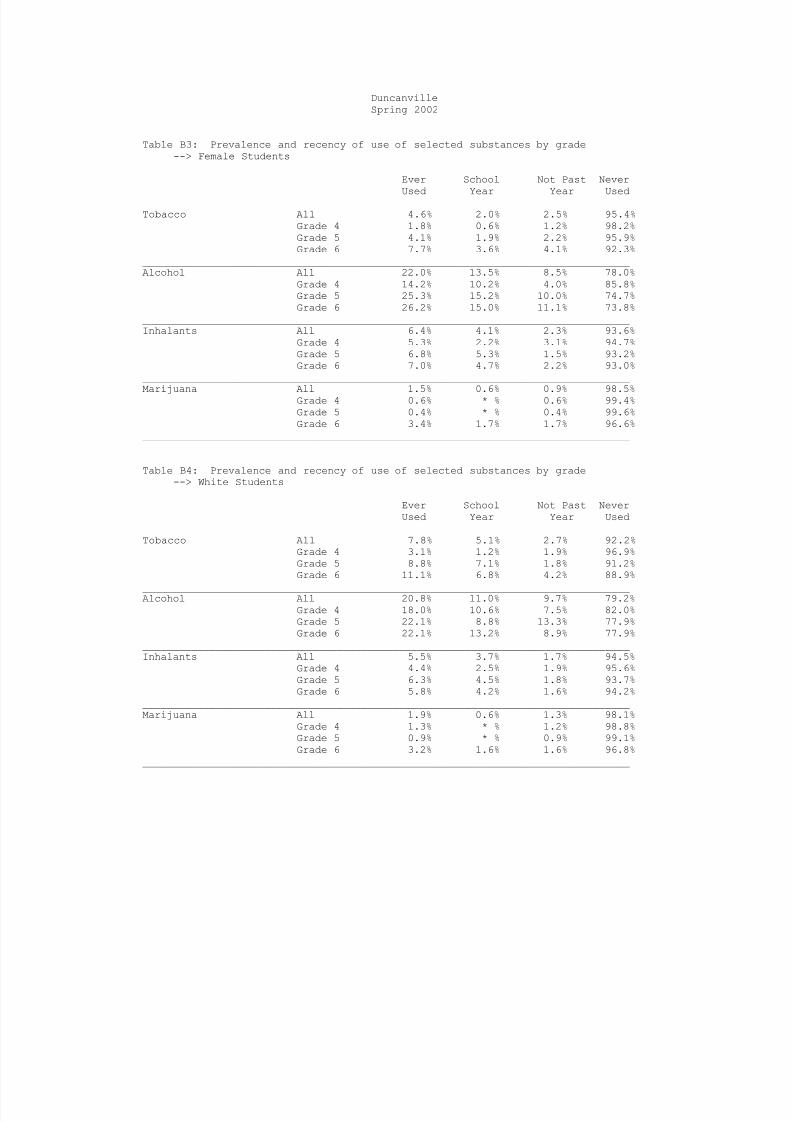
Table B3: Prevalence and recency of use of selected substances by grade--> Female Students
Ever School Not Past Never
Used Year Year Used________________________________________________________________________________Tobacco All 4.6% 2.0% 2.5% 95.4%
Grade 4 1.8% 0.6% 1.2% 98.2%Grade 5 4.1% 1.9% 2.2% 95.9%Grade 6 7.7% 3.6% 4.1% 92.3%
________________________________________________________________________________Alcohol All 22.0% 13.5% 8.5% 78.0%
Grade 4 14.2% 10.2% 4.0% 85.8%Grade 5 25.3% 15.2% 10.0% 74.7%Grade 6 26.2% 15.0% 11.1% 73.8%
________________________________________________________________________________Inhalants All 6.4% 4.1% 2.3% 93.6%
Grade 4 5.3% 2.2% 3.1% 94.7%Grade 5 6.8% 5.3% 1.5% 93.2%Grade 6 7.0% 4.7% 2.2% 93.0%
________________________________________________________________________________
Marijuana All 1.5% 0.6% 0.9% 98.5%Grade 4 0.6% * % 0.6% 99.4%Grade 5 0.4% * % 0.4% 99.6%Grade 6 3.4% 1.7% 1.7% 96.6%
________________________________________________________________________________
Table B4: Prevalence and recency of use of selected substances by grade--> White Students
Ever School Not Past NeverUsed Year Year Used
________________________________________________________________________________Tobacco All 7.8% 5.1% 2.7% 92.2%
Grade 4 3.1% 1.2% 1.9% 96.9%Grade 5 8.8% 7.1% 1.8% 91.2%Grade 6 11.1% 6.8% 4.2% 88.9%
________________________________________________________________________________Alcohol All 20.8% 11.0% 9.7% 79.2%
Grade 4 18.0% 10.6% 7.5% 82.0%Grade 5 22.1% 8.8% 13.3% 77.9%Grade 6 22.1% 13.2% 8.9% 77.9%
________________________________________________________________________________Inhalants All 5.5% 3.7% 1.7% 94.5%
Grade 4 4.4% 2.5% 1.9% 95.6%Grade 5 6.3% 4.5% 1.8% 93.7%Grade 6 5.8% 4.2% 1.6% 94.2%
________________________________________________________________________________Marijuana All 1.9% 0.6% 1.3% 98.1%
Grade 4 1.3% * % 1.2% 98.8%Grade 5 0.9% * % 0.9% 99.1%Grade 6 3.2% 1.6% 1.6% 96.8%
________________________________________________________________________________

7/30/2019 2002 _ dallas county _ duncanville isd _ 2002 texas school survey of drug and alcohol use _ elementary report
http://slidepdf.com/reader/full/2002-dallas-county-duncanville-isd-2002-texas-school-survey-of-drug-and 22/43
DuncanvilleSpring 2002
Table B5: Prevalence and recency of use of selected substances by grade--> African/American Students
Ever School Not Past Never
Used Year Year Used________________________________________________________________________________Tobacco All 6.8% 2.2% 4.6% 93.2%
Grade 4 4.1% 2.0% 2.0% 95.9%Grade 5 6.0% 1.5% 4.5% 94.0%Grade 6 10.0% 3.0% 7.0% 90.0%
________________________________________________________________________________Alcohol All 24.8% 13.8% 11.0% 75.2%
Grade 4 15.5% 8.4% 7.1% 84.5%Grade 5 23.1% 12.6% 10.6% 76.9%Grade 6 34.1% 19.4% 14.7% 65.9%
________________________________________________________________________________Inhalants All 7.4% 5.5% 1.9% 92.6%
Grade 4 3.8% 2.1% 1.7% 96.2%Grade 5 8.8% 6.2% 2.6% 91.2%Grade 6 9.2% 7.8% 1.4% 90.8%
________________________________________________________________________________
Marijuana All 1.0% 0.4% 0.6% 99.0%Grade 4 0.9% 0.4% 0.4% 99.1%Grade 5 0.0% * % * % 100.0%Grade 6 2.1% 0.7% 1.4% 97.9%
________________________________________________________________________________
Table B6: Prevalence and recency of use of selected substances by grade--> Mexican/American Students
Ever School Not Past NeverUsed Year Year Used
________________________________________________________________________________Tobacco All 8.5% 4.9% 3.6% 91.5%
Grade 4 1.2% 0.6% 0.6% 98.8%Grade 5 11.3% 6.5% 4.8% 88.7%Grade 6 13.5% 8.0% 5.5% 86.5%
________________________________________________________________________________Alcohol All 28.2% 18.3% 9.9% 71.8%
Grade 4 20.4% 12.6% 7.8% 79.6%Grade 5 34.1% 19.5% 14.6% 65.9%Grade 6 30.5% 23.2% 7.3% 69.5%
________________________________________________________________________________Inhalants All 8.9% 5.3% 3.6% 91.1%
Grade 4 9.6% 4.2% 5.4% 90.4%Grade 5 7.3% 5.7% 1.6% 92.7%Grade 6 9.8% 6.1% 3.7% 90.2%
________________________________________________________________________________Marijuana All 3.1% 2.0% 1.1% 96.9%
Grade 4 1.8% 0.6% 1.2% 98.2%Grade 5 0.8% * % 0.8% 99.2%Grade 6 6.8% 5.6% 1.2% 93.2%
________________________________________________________________________________
7/30/2019 2002 _ dallas county _ duncanville isd _ 2002 texas school survey of drug and alcohol use _ elementary report
http://slidepdf.com/reader/full/2002-dallas-county-duncanville-isd-2002-texas-school-survey-of-drug-and 23/43
DuncanvilleSpring 2002
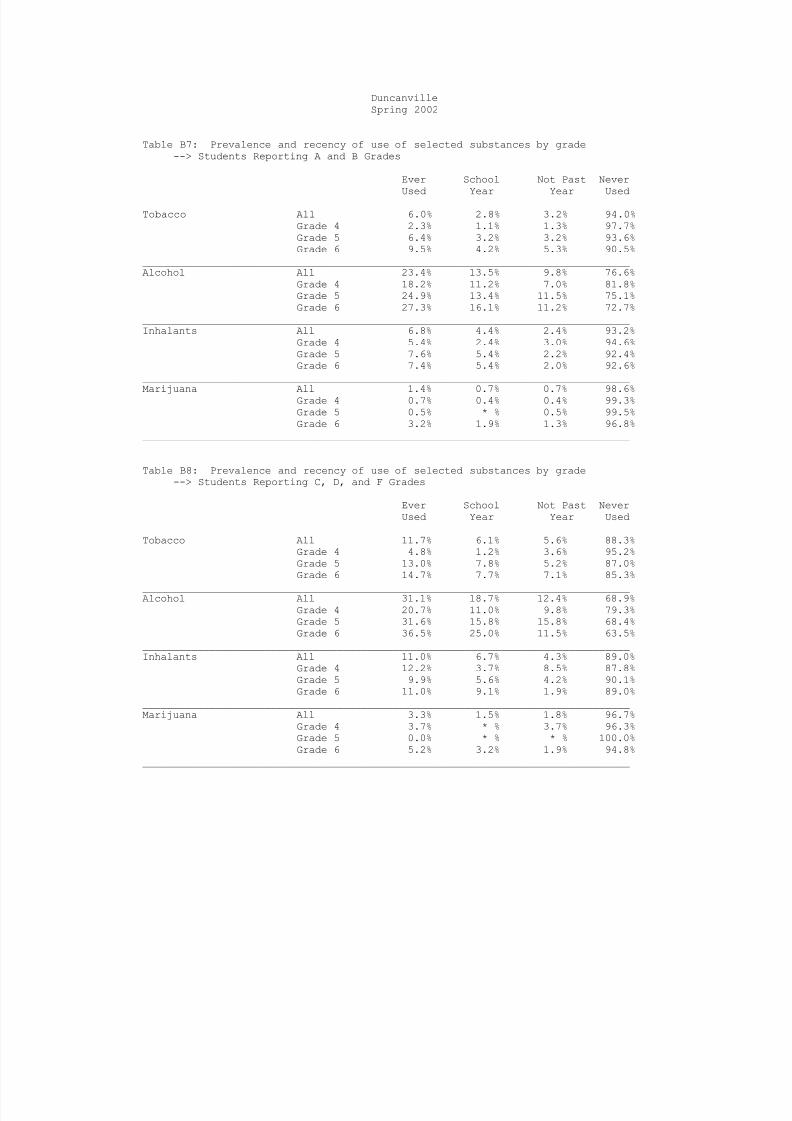
Table B7: Prevalence and recency of use of selected substances by grade--> Students Reporting A and B Grades
Ever School Not Past Never
Used Year Year Used________________________________________________________________________________Tobacco All 6.0% 2.8% 3.2% 94.0%
Grade 4 2.3% 1.1% 1.3% 97.7%Grade 5 6.4% 3.2% 3.2% 93.6%Grade 6 9.5% 4.2% 5.3% 90.5%
________________________________________________________________________________Alcohol All 23.4% 13.5% 9.8% 76.6%
Grade 4 18.2% 11.2% 7.0% 81.8%Grade 5 24.9% 13.4% 11.5% 75.1%Grade 6 27.3% 16.1% 11.2% 72.7%
________________________________________________________________________________Inhalants All 6.8% 4.4% 2.4% 93.2%
Grade 4 5.4% 2.4% 3.0% 94.6%Grade 5 7.6% 5.4% 2.2% 92.4%Grade 6 7.4% 5.4% 2.0% 92.6%
________________________________________________________________________________
Marijuana All 1.4% 0.7% 0.7% 98.6%Grade 4 0.7% 0.4% 0.4% 99.3%Grade 5 0.5% * % 0.5% 99.5%Grade 6 3.2% 1.9% 1.3% 96.8%
________________________________________________________________________________
Table B8: Prevalence and recency of use of selected substances by grade--> Students Reporting C, D, and F Grades
Ever School Not Past NeverUsed Year Year Used
________________________________________________________________________________Tobacco All 11.7% 6.1% 5.6% 88.3%
Grade 4 4.8% 1.2% 3.6% 95.2%Grade 5 13.0% 7.8% 5.2% 87.0%Grade 6 14.7% 7.7% 7.1% 85.3%
________________________________________________________________________________Alcohol All 31.1% 18.7% 12.4% 68.9%
Grade 4 20.7% 11.0% 9.8% 79.3%Grade 5 31.6% 15.8% 15.8% 68.4%Grade 6 36.5% 25.0% 11.5% 63.5%
________________________________________________________________________________Inhalants All 11.0% 6.7% 4.3% 89.0%
Grade 4 12.2% 3.7% 8.5% 87.8%Grade 5 9.9% 5.6% 4.2% 90.1%Grade 6 11.0% 9.1% 1.9% 89.0%
________________________________________________________________________________Marijuana All 3.3% 1.5% 1.8% 96.7%
Grade 4 3.7% * % 3.7% 96.3%Grade 5 0.0% * % * % 100.0%Grade 6 5.2% 3.2% 1.9% 94.8%
________________________________________________________________________________
7/30/2019 2002 _ dallas county _ duncanville isd _ 2002 texas school survey of drug and alcohol use _ elementary report
http://slidepdf.com/reader/full/2002-dallas-county-duncanville-isd-2002-texas-school-survey-of-drug-and 24/43
DuncanvilleSpring 2002
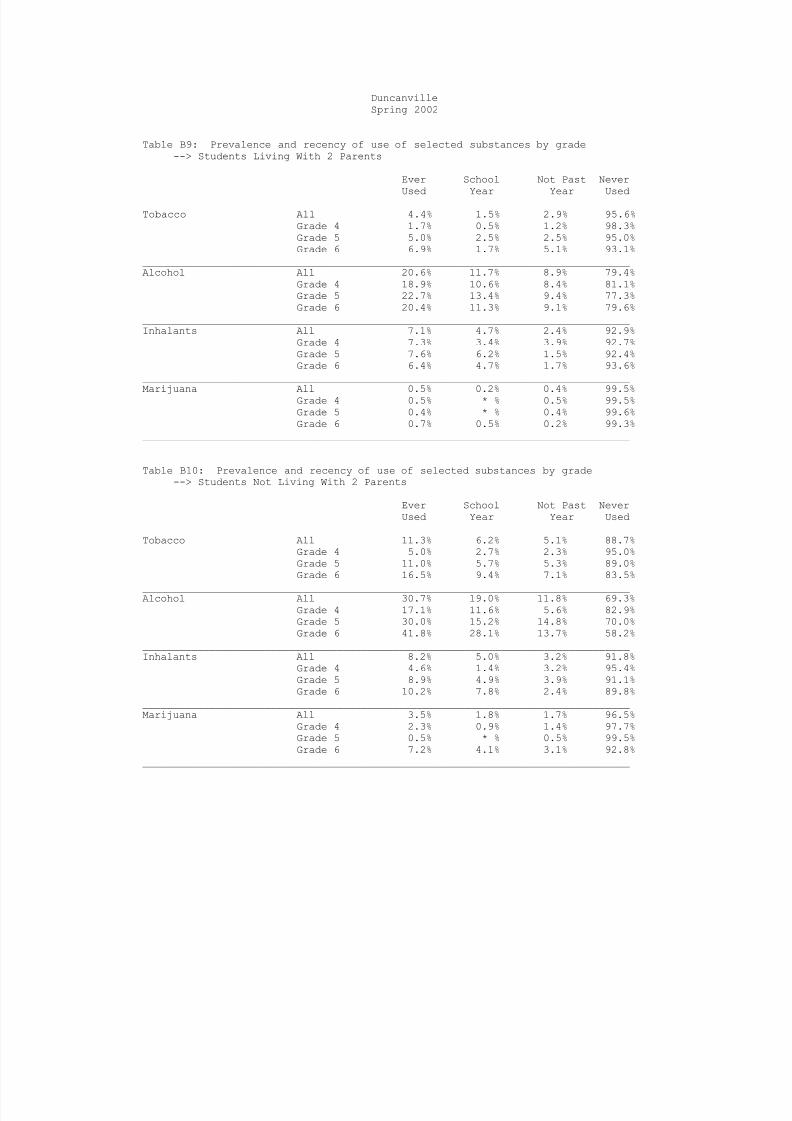
Table B9: Prevalence and recency of use of selected substances by grade--> Students Living With 2 Parents
Ever School Not Past Never
Used Year Year Used________________________________________________________________________________Tobacco All 4.4% 1.5% 2.9% 95.6%
Grade 4 1.7% 0.5% 1.2% 98.3%Grade 5 5.0% 2.5% 2.5% 95.0%Grade 6 6.9% 1.7% 5.1% 93.1%
________________________________________________________________________________Alcohol All 20.6% 11.7% 8.9% 79.4%
Grade 4 18.9% 10.6% 8.4% 81.1%Grade 5 22.7% 13.4% 9.4% 77.3%Grade 6 20.4% 11.3% 9.1% 79.6%
________________________________________________________________________________Inhalants All 7.1% 4.7% 2.4% 92.9%
Grade 4 7.3% 3.4% 3.9% 92.7%Grade 5 7.6% 6.2% 1.5% 92.4%Grade 6 6.4% 4.7% 1.7% 93.6%
________________________________________________________________________________
Marijuana All 0.5% 0.2% 0.4% 99.5%Grade 4 0.5% * % 0.5% 99.5%Grade 5 0.4% * % 0.4% 99.6%Grade 6 0.7% 0.5% 0.2% 99.3%
________________________________________________________________________________
Table B10: Prevalence and recency of use of selected substances by grade--> Students Not Living With 2 Parents
Ever School Not Past NeverUsed Year Year Used
________________________________________________________________________________Tobacco All 11.3% 6.2% 5.1% 88.7%
Grade 4 5.0% 2.7% 2.3% 95.0%Grade 5 11.0% 5.7% 5.3% 89.0%Grade 6 16.5% 9.4% 7.1% 83.5%
________________________________________________________________________________Alcohol All 30.7% 19.0% 11.8% 69.3%
Grade 4 17.1% 11.6% 5.6% 82.9%Grade 5 30.0% 15.2% 14.8% 70.0%Grade 6 41.8% 28.1% 13.7% 58.2%
________________________________________________________________________________Inhalants All 8.2% 5.0% 3.2% 91.8%
Grade 4 4.6% 1.4% 3.2% 95.4%Grade 5 8.9% 4.9% 3.9% 91.1%Grade 6 10.2% 7.8% 2.4% 89.8%
________________________________________________________________________________Marijuana All 3.5% 1.8% 1.7% 96.5%
Grade 4 2.3% 0.9% 1.4% 97.7%Grade 5 0.5% * % 0.5% 99.5%Grade 6 7.2% 4.1% 3.1% 92.8%
________________________________________________________________________________
7/30/2019 2002 _ dallas county _ duncanville isd _ 2002 texas school survey of drug and alcohol use _ elementary report
http://slidepdf.com/reader/full/2002-dallas-county-duncanville-isd-2002-texas-school-survey-of-drug-and 25/43
DuncanvilleSpring 2002
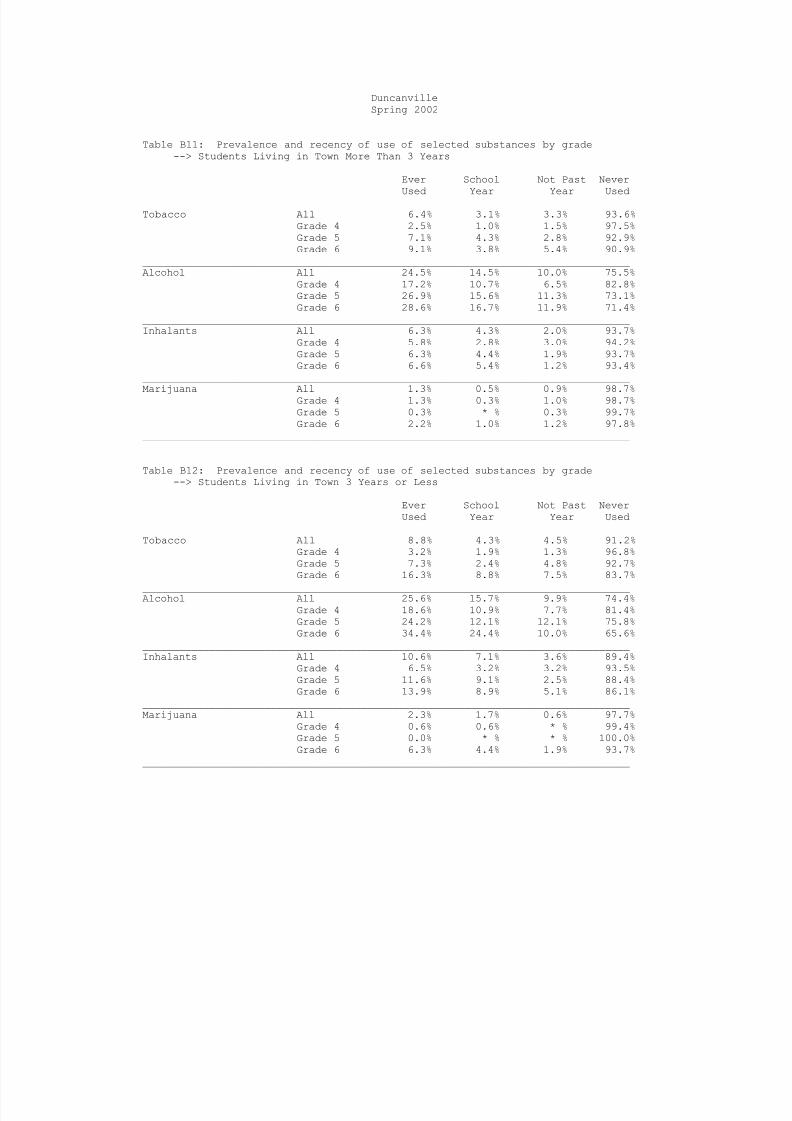
Table B11: Prevalence and recency of use of selected substances by grade--> Students Living in Town More Than 3 Years
Ever School Not Past Never
Used Year Year Used________________________________________________________________________________Tobacco All 6.4% 3.1% 3.3% 93.6%
Grade 4 2.5% 1.0% 1.5% 97.5%Grade 5 7.1% 4.3% 2.8% 92.9%Grade 6 9.1% 3.8% 5.4% 90.9%
________________________________________________________________________________Alcohol All 24.5% 14.5% 10.0% 75.5%
Grade 4 17.2% 10.7% 6.5% 82.8%Grade 5 26.9% 15.6% 11.3% 73.1%Grade 6 28.6% 16.7% 11.9% 71.4%
________________________________________________________________________________Inhalants All 6.3% 4.3% 2.0% 93.7%
Grade 4 5.8% 2.8% 3.0% 94.2%Grade 5 6.3% 4.4% 1.9% 93.7%Grade 6 6.6% 5.4% 1.2% 93.4%
________________________________________________________________________________
Marijuana All 1.3% 0.5% 0.9% 98.7%Grade 4 1.3% 0.3% 1.0% 98.7%Grade 5 0.3% * % 0.3% 99.7%Grade 6 2.2% 1.0% 1.2% 97.8%
________________________________________________________________________________
Table B12: Prevalence and recency of use of selected substances by grade--> Students Living in Town 3 Years or Less
Ever School Not Past NeverUsed Year Year Used
________________________________________________________________________________Tobacco All 8.8% 4.3% 4.5% 91.2%
Grade 4 3.2% 1.9% 1.3% 96.8%Grade 5 7.3% 2.4% 4.8% 92.7%Grade 6 16.3% 8.8% 7.5% 83.7%
________________________________________________________________________________Alcohol All 25.6% 15.7% 9.9% 74.4%
Grade 4 18.6% 10.9% 7.7% 81.4%Grade 5 24.2% 12.1% 12.1% 75.8%Grade 6 34.4% 24.4% 10.0% 65.6%
________________________________________________________________________________Inhalants All 10.6% 7.1% 3.6% 89.4%
Grade 4 6.5% 3.2% 3.2% 93.5%Grade 5 11.6% 9.1% 2.5% 88.4%Grade 6 13.9% 8.9% 5.1% 86.1%
________________________________________________________________________________Marijuana All 2.3% 1.7% 0.6% 97.7%
Grade 4 0.6% 0.6% * % 99.4%Grade 5 0.0% * % * % 100.0%Grade 6 6.3% 4.4% 1.9% 93.7%
________________________________________________________________________________

7/30/2019 2002 _ dallas county _ duncanville isd _ 2002 texas school survey of drug and alcohol use _ elementary report
http://slidepdf.com/reader/full/2002-dallas-county-duncanville-isd-2002-texas-school-survey-of-drug-and 26/43
DuncanvilleSpring 2002
The FREQ Procedure
GENDER
Q1 Frequency Percent
_______________________________Female 968.8964 51.27Male 920.8379 48.73
Frequency Missing = 5.2656435381
GRADE LEVEL
Q2 Frequency Percent________________________________Grade 4 624.2353 32.94Grade 5 620.5196 32.75Grade 6 650.2451 34.31
DO YOU LIVE WITH BOTH PARENTS?
Q3 Frequency Percent___________________________________No 737.8731 39.73Yes 1119.227 60.27
Frequency Missing = 37.899879009
AGE
Q4 Frequency Percent______________________________________8 or younger 2.841739 0.159 247.2313 13.0910 600.9508 31.8211 623.2995 33.00
12 377.4741 19.9913 or older 36.82327 1.95
Frequency Missing = 6.3793605274
ETHNICITY
Q5 Frequency Percent_________________________________________African/American 757.5063 40.81Asian/American 33.85196 1.82Mexican/American 457.6107 24.65Native/American 40.10242 2.16Other 106.0325 5.71White 461.0489 24.84
Frequency Missing = 38.847125282
The frequencies have been weighted so that theanalysis reflects the distribution of students by grade
level in the district

7/30/2019 2002 _ dallas county _ duncanville isd _ 2002 texas school survey of drug and alcohol use _ elementary report
http://slidepdf.com/reader/full/2002-dallas-county-duncanville-isd-2002-texas-school-survey-of-drug-and 27/43
DuncanvilleSpring 2002
The FREQ Procedure
WHAT GRADES DO YOU USUALLY GET
Q6 Frequency Percent
___________________________________Mostly A's 702.396 38.12Mostly B's 822.7788 44.66Mostly C's 269.4946 14.63Mostly D's 15.24329 0.83Mostly F's 32.47931 1.76
Frequency Missing = 52.607985257
LIVED IN THIS TOWN FOR MORE THAN 3 YEARS
Q7 Frequency Percent___________________________________Don't Know 190.117 10.12No 446.9205 23.79Yes 1241.458 66.09
Frequency Missing = 16.504363425
EITHER PARENT GRADUATE FROM COLLEGE
Q8 Frequency Percent___________________________________Don't Know 639.4787 34.33No 276.9137 14.87Yes 946.4045 50.81
Frequency Missing = 32.203058669
QUALIFY FOR A FREE/REDUCED PRICE LUNCH?
Q9 Frequency Percent___________________________________Don't Know 531.2636 28.85No 644.9922 35.03Yes 665.2322 36.12
Frequency Missing = 53.511888807
PARENTS ATTEND PTA MEETINGS?
Q10 Frequency Percent___________________________________No 862.9061 46.51Yes 992.4902 53.49
Frequency Missing = 39.603675778
The frequencies have been weighted so that theanalysis reflects the distribution of students by grade
level in the district
7/30/2019 2002 _ dallas county _ duncanville isd _ 2002 texas school survey of drug and alcohol use _ elementary report
http://slidepdf.com/reader/full/2002-dallas-county-duncanville-isd-2002-texas-school-survey-of-drug-and 28/43
DuncanvilleSpring 2002
The FREQ Procedure
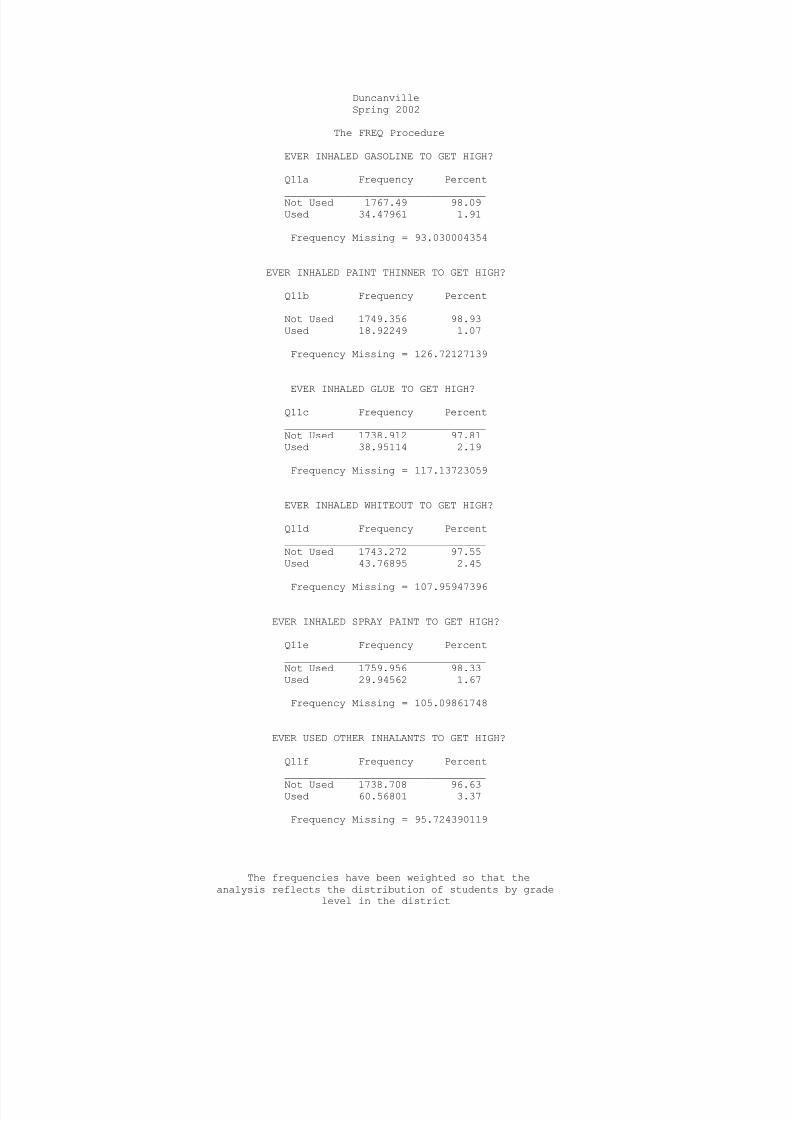
EVER INHALED GASOLINE TO GET HIGH?
Q11a Frequency Percent
_________________________________Not Used 1767.49 98.09Used 34.47961 1.91
Frequency Missing = 93.030004354
EVER INHALED PAINT THINNER TO GET HIGH?
Q11b Frequency Percent_________________________________Not Used 1749.356 98.93Used 18.92249 1.07
Frequency Missing = 126.72127139
EVER INHALED GLUE TO GET HIGH? Q11c Frequency Percent_________________________________Not Used 1738.912 97.81Used 38.95114 2.19
Frequency Missing = 117.13723059
EVER INHALED WHITEOUT TO GET HIGH?
Q11d Frequency Percent_________________________________Not Used 1743.272 97.55Used 43.76895 2.45
Frequency Missing = 107.95947396
EVER INHALED SPRAY PAINT TO GET HIGH?
Q11e Frequency Percent_________________________________Not Used 1759.956 98.33Used 29.94562 1.67
Frequency Missing = 105.09861748
EVER USED OTHER INHALANTS TO GET HIGH?
Q11f Frequency Percent_________________________________
Not Used 1738.708 96.63Used 60.56801 3.37
Frequency Missing = 95.724390119
The frequencies have been weighted so that theanalysis reflects the distribution of students by grade
level in the district

7/30/2019 2002 _ dallas county _ duncanville isd _ 2002 texas school survey of drug and alcohol use _ elementary report
http://slidepdf.com/reader/full/2002-dallas-county-duncanville-isd-2002-texas-school-survey-of-drug-and 29/43
DuncanvilleSpring 2002
The FREQ Procedure
CIGARETTE USE DURING LIFETIME
Q12a Frequency Percent
_______________________________________Never heard of 132.1452 7.21Never used 1585.442 86.481-2 times 91.63559 5.003-10 times 15.63113 0.8511+ times 8.538559 0.47
Frequency Missing = 61.607721242
SNUFF/CHEWING TOBACCO USE IN LIFETIME
Q12b Frequency Percent_______________________________________Never heard of 230.9775 13.00Never used 1525.872 85.901-2 times 15.1884 0.86
3-10 times 1.845375 0.1011+ times 2.423905 0.14
Frequency Missing = 118.69300674
BEER USE DURING LIFETIME
Q12c Frequency Percent_______________________________________Never heard of 52.73622 2.99Never used 1472.984 83.531-2 times 189.1613 10.733-10 times 35.35929 2.0111+ times 13.25057 0.75
Frequency Missing = 131.50841322
WINE COOLER USE DURING LIFETIME
Q12d Frequency Percent_______________________________________Never heard of 266.6008 15.04Never used 1274.509 71.921-2 times 180.4143 10.183-10 times 35.35351 1.9911+ times 15.31153 0.86
Frequency Missing = 122.81095108
The frequencies have been weighted so that theanalysis reflects the distribution of students by grade
level in the district
7/30/2019 2002 _ dallas county _ duncanville isd _ 2002 texas school survey of drug and alcohol use _ elementary report
http://slidepdf.com/reader/full/2002-dallas-county-duncanville-isd-2002-texas-school-survey-of-drug-and 30/43
DuncanvilleSpring 2002
The FREQ Procedure
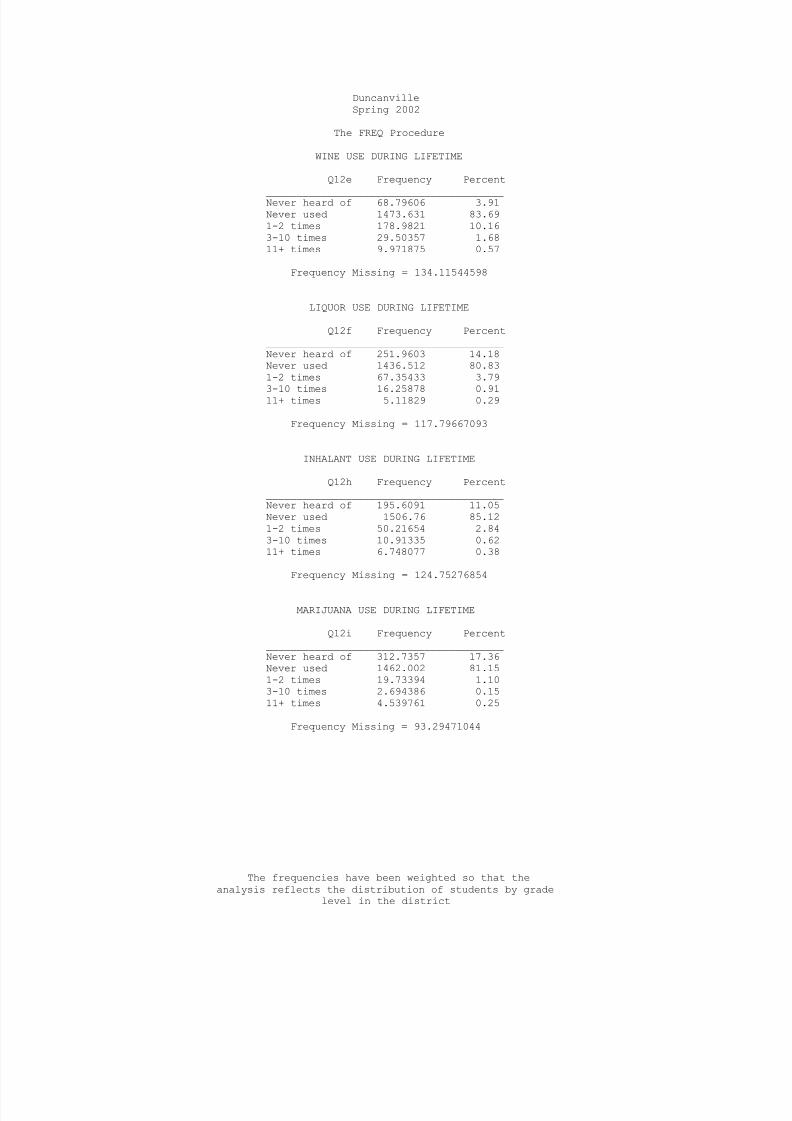
WINE USE DURING LIFETIME
Q12e Frequency Percent
_______________________________________Never heard of 68.79606 3.91Never used 1473.631 83.691-2 times 178.9821 10.163-10 times 29.50357 1.6811+ times 9.971875 0.57
Frequency Missing = 134.11544598
LIQUOR USE DURING LIFETIME
Q12f Frequency Percent_______________________________________Never heard of 251.9603 14.18Never used 1436.512 80.831-2 times 67.35433 3.79
3-10 times 16.25878 0.9111+ times 5.11829 0.29
Frequency Missing = 117.79667093
INHALANT USE DURING LIFETIME
Q12h Frequency Percent_______________________________________Never heard of 195.6091 11.05Never used 1506.76 85.121-2 times 50.21654 2.843-10 times 10.91335 0.6211+ times 6.748077 0.38
Frequency Missing = 124.75276854
MARIJUANA USE DURING LIFETIME
Q12i Frequency Percent_______________________________________Never heard of 312.7357 17.36Never used 1462.002 81.151-2 times 19.73394 1.103-10 times 2.694386 0.1511+ times 4.539761 0.25
Frequency Missing = 93.29471044
The frequencies have been weighted so that theanalysis reflects the distribution of students by grade
level in the district
7/30/2019 2002 _ dallas county _ duncanville isd _ 2002 texas school survey of drug and alcohol use _ elementary report
http://slidepdf.com/reader/full/2002-dallas-county-duncanville-isd-2002-texas-school-survey-of-drug-and 31/43
DuncanvilleSpring 2002
The FREQ Procedure
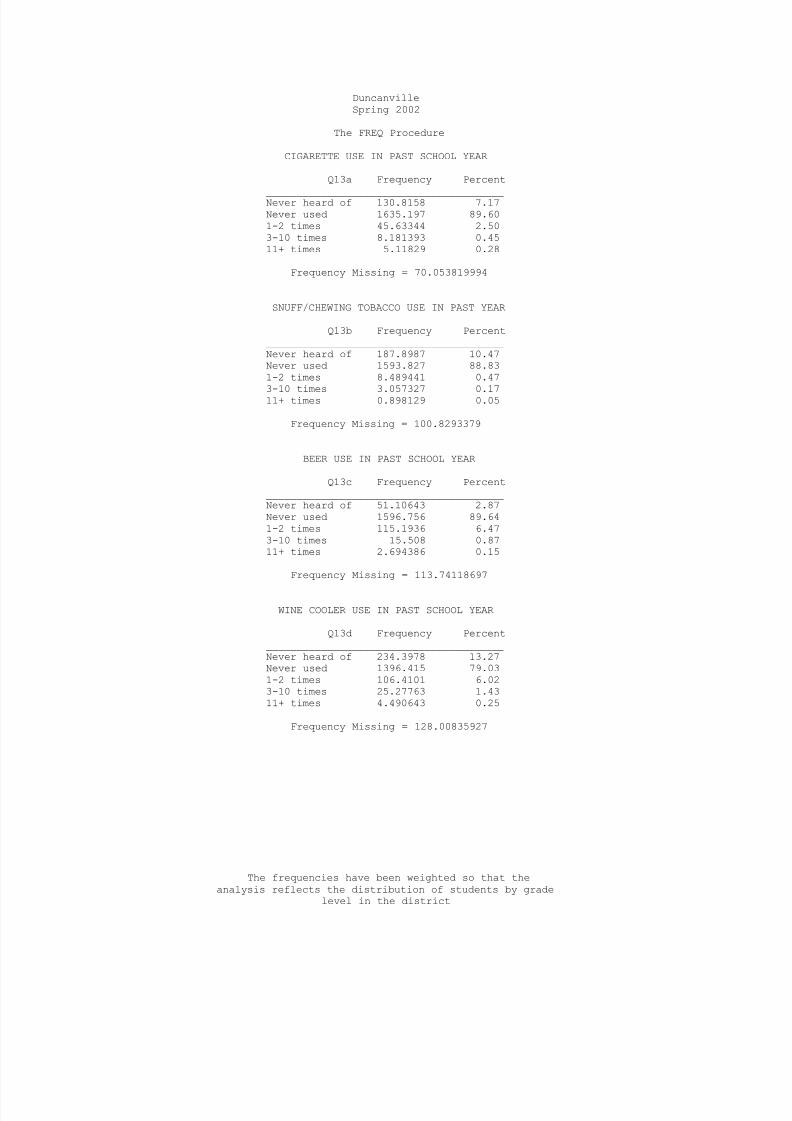
CIGARETTE USE IN PAST SCHOOL YEAR
Q13a Frequency Percent
_______________________________________Never heard of 130.8158 7.17Never used 1635.197 89.601-2 times 45.63344 2.503-10 times 8.181393 0.4511+ times 5.11829 0.28
Frequency Missing = 70.053819994
SNUFF/CHEWING TOBACCO USE IN PAST YEAR
Q13b Frequency Percent_______________________________________Never heard of 187.8987 10.47Never used 1593.827 88.831-2 times 8.489441 0.47
3-10 times 3.057327 0.1711+ times 0.898129 0.05
Frequency Missing = 100.8293379
BEER USE IN PAST SCHOOL YEAR
Q13c Frequency Percent_______________________________________Never heard of 51.10643 2.87Never used 1596.756 89.641-2 times 115.1936 6.473-10 times 15.508 0.8711+ times 2.694386 0.15
Frequency Missing = 113.74118697
WINE COOLER USE IN PAST SCHOOL YEAR
Q13d Frequency Percent_______________________________________Never heard of 234.3978 13.27Never used 1396.415 79.031-2 times 106.4101 6.023-10 times 25.27763 1.4311+ times 4.490643 0.25
Frequency Missing = 128.00835927
The frequencies have been weighted so that theanalysis reflects the distribution of students by grade
level in the district
7/30/2019 2002 _ dallas county _ duncanville isd _ 2002 texas school survey of drug and alcohol use _ elementary report
http://slidepdf.com/reader/full/2002-dallas-county-duncanville-isd-2002-texas-school-survey-of-drug-and 32/43
DuncanvilleSpring 2002
The FREQ Procedure
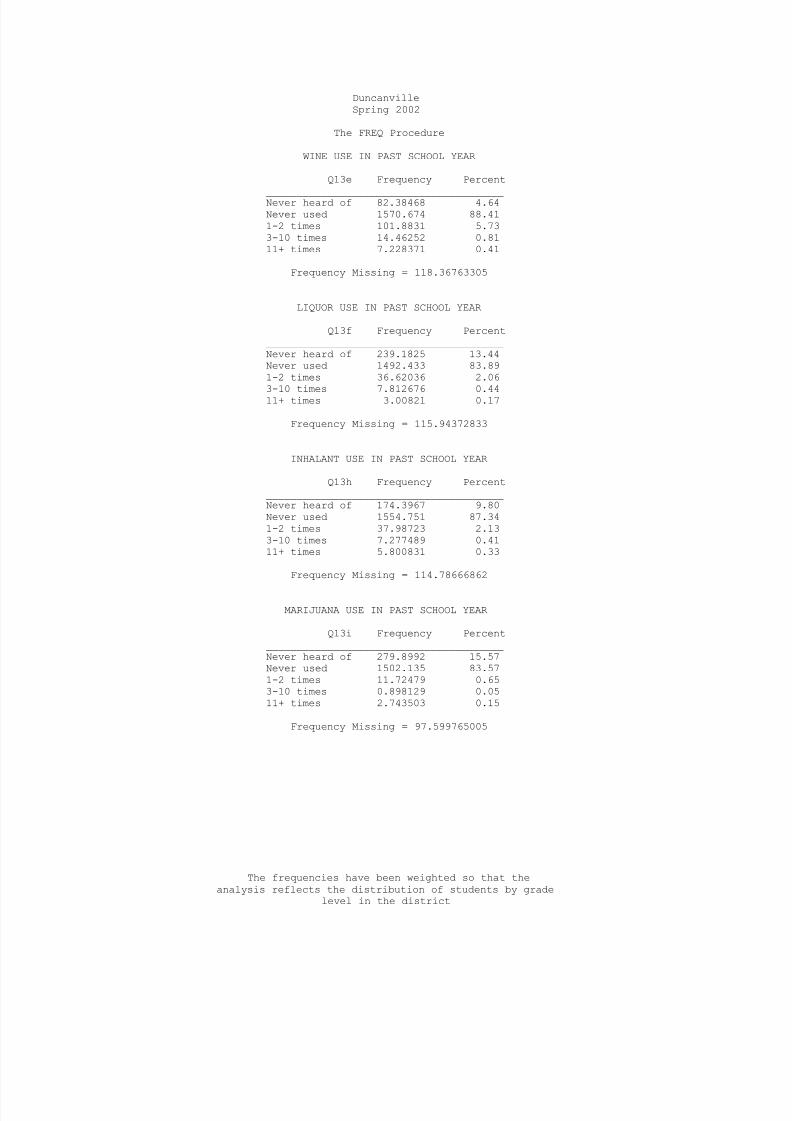
WINE USE IN PAST SCHOOL YEAR
Q13e Frequency Percent
_______________________________________Never heard of 82.38468 4.64Never used 1570.674 88.411-2 times 101.8831 5.733-10 times 14.46252 0.8111+ times 7.228371 0.41
Frequency Missing = 118.36763305
LIQUOR USE IN PAST SCHOOL YEAR
Q13f Frequency Percent_______________________________________Never heard of 239.1825 13.44Never used 1492.433 83.891-2 times 36.62036 2.06
3-10 times 7.812676 0.4411+ times 3.00821 0.17
Frequency Missing = 115.94372833
INHALANT USE IN PAST SCHOOL YEAR
Q13h Frequency Percent_______________________________________Never heard of 174.3967 9.80Never used 1554.751 87.341-2 times 37.98723 2.133-10 times 7.277489 0.4111+ times 5.800831 0.33
Frequency Missing = 114.78666862
MARIJUANA USE IN PAST SCHOOL YEAR
Q13i Frequency Percent_______________________________________Never heard of 279.8992 15.57Never used 1502.135 83.571-2 times 11.72479 0.653-10 times 0.898129 0.0511+ times 2.743503 0.15
Frequency Missing = 97.599765005
The frequencies have been weighted so that theanalysis reflects the distribution of students by grade
level in the district

7/30/2019 2002 _ dallas county _ duncanville isd _ 2002 texas school survey of drug and alcohol use _ elementary report
http://slidepdf.com/reader/full/2002-dallas-county-duncanville-isd-2002-texas-school-survey-of-drug-and 33/43
DuncanvilleSpring 2002
The FREQ Procedure
AGE WHEN FIRST USED CIGARETTES
Q14a Frequency Percent
_________________________________________7 or younger 28.90014 1.618 years old 16.13565 0.909 years old 19.40856 1.08
10 years old 28.96838 1.6111 years old 22.49656 1.2512 or older 7.185029 0.40Never heard/used 1673.026 93.15
Frequency Missing = 98.87995271
AGE WHEN FIRST USED SNUFF/CHEW TOBACCO
Q14b Frequency Percent_________________________________________7 or younger 11.23294 0.64
8 years old 2.110081 0.129 years old 3.739867 0.2110 years old 1.796257 0.1011 years old 4.220162 0.24Never heard/used 1733.712 98.69
Frequency Missing = 138.18825482
AGE WHEN FIRST USED BEER
Q14c Frequency Percent_________________________________________7 or younger 106.373 6.098 years old 35.31528 2.029 years old 47.92087 2.74
10 years old 33.33012 1.91
11 years old 26.71672 1.5312 or older 11.09137 0.63Never heard/used 1485.983 85.07
Frequency Missing = 148.26991499
AGE WHEN FIRST USED WINE COOLERS
Q14d Frequency Percent_________________________________________7 or younger 35.5691 2.048 years old 35.79557 2.069 years old 40.00996 2.30
10 years old 51.2378 2.9411 years old 51.63718 2.9712 or older 10.19324 0.59
Never heard/used 1516.023 87.10
Frequency Missing = 154.53371526
The frequencies have been weighted so that theanalysis reflects the distribution of students by grade
level in the district
7/30/2019 2002 _ dallas county _ duncanville isd _ 2002 texas school survey of drug and alcohol use _ elementary report
http://slidepdf.com/reader/full/2002-dallas-county-duncanville-isd-2002-texas-school-survey-of-drug-and 34/43
DuncanvilleSpring 2002
The FREQ Procedure
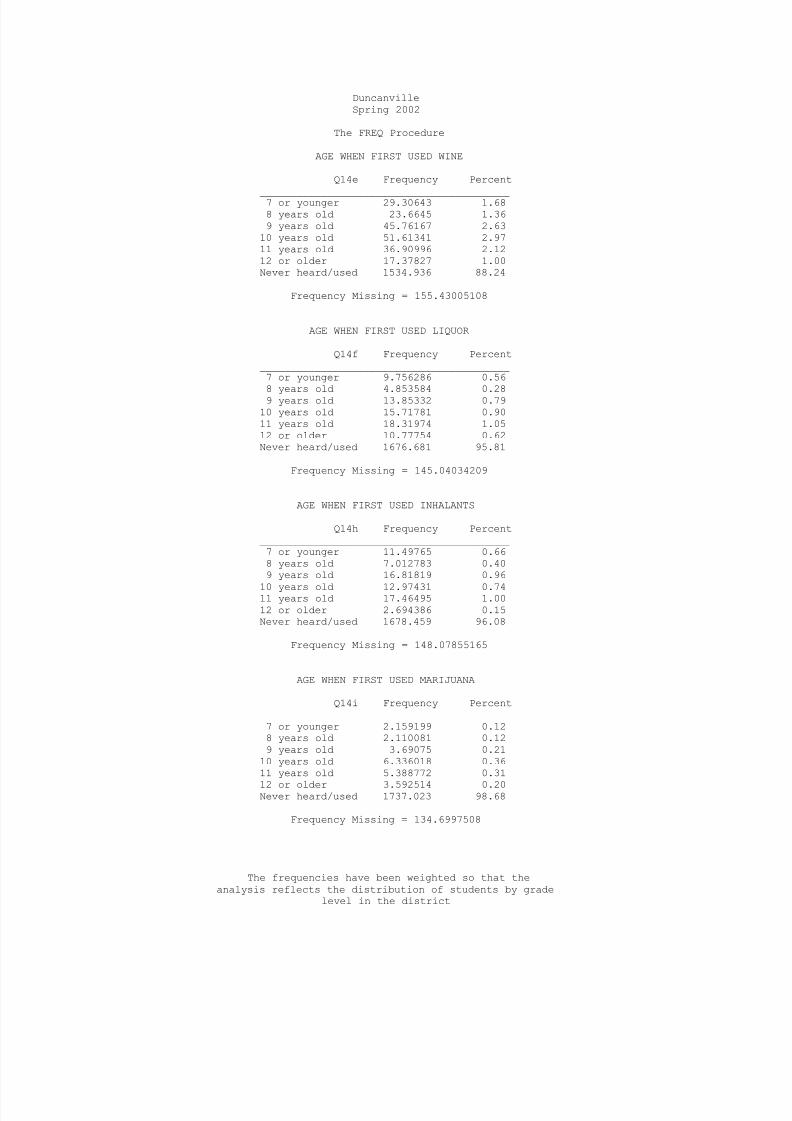
AGE WHEN FIRST USED WINE
Q14e Frequency Percent
_________________________________________7 or younger 29.30643 1.688 years old 23.6645 1.369 years old 45.76167 2.63
10 years old 51.61341 2.9711 years old 36.90996 2.1212 or older 17.37827 1.00Never heard/used 1534.936 88.24
Frequency Missing = 155.43005108
AGE WHEN FIRST USED LIQUOR
Q14f Frequency Percent_________________________________________7 or younger 9.756286 0.56
8 years old 4.853584 0.289 years old 13.85332 0.7910 years old 15.71781 0.9011 years old 18.31974 1.0512 or older 10.77754 0.62Never heard/used 1676.681 95.81
Frequency Missing = 145.04034209
AGE WHEN FIRST USED INHALANTS
Q14h Frequency Percent_________________________________________7 or younger 11.49765 0.668 years old 7.012783 0.409 years old 16.81819 0.96
10 years old 12.97431 0.7411 years old 17.46495 1.0012 or older 2.694386 0.15Never heard/used 1678.459 96.08
Frequency Missing = 148.07855165
AGE WHEN FIRST USED MARIJUANA
Q14i Frequency Percent_________________________________________7 or younger 2.159199 0.128 years old 2.110081 0.129 years old 3.69075 0.21
10 years old 6.336018 0.3611 years old 5.388772 0.31
12 or older 3.592514 0.20Never heard/used 1737.023 98.68
Frequency Missing = 134.6997508
The frequencies have been weighted so that theanalysis reflects the distribution of students by grade
level in the district

7/30/2019 2002 _ dallas county _ duncanville isd _ 2002 texas school survey of drug and alcohol use _ elementary report
http://slidepdf.com/reader/full/2002-dallas-county-duncanville-isd-2002-texas-school-survey-of-drug-and 35/43
DuncanvilleSpring 2002
The FREQ Procedure
CLOSE FRIENDS USE CIGARETTES
Q15a Frequency Percent
_______________________________________Never heard of 81.03294 4.51None 1457.544 81.13Some 239.1069 13.31Most 18.92827 1.05
Frequency Missing = 98.3881083
CLOSE FRIENDS USE SNUFF/CHEWING TOBACCO
Q15b Frequency Percent_______________________________________Never heard of 108.7927 6.21None 1590.243 90.83Some 45.90969 2.62Most 5.849948 0.33
Frequency Missing = 144.20467389
CLOSE FRIENDS USE BEER
Q15c Frequency Percent_______________________________________Never heard of 34.46049 1.98None 1398.878 80.40Some 272.323 15.65Most 34.33803 1.97
Frequency Missing = 155.00066705
CLOSE FRIENDS USE WINE COOLERS
Q15d Frequency Percent
_______________________________________Never heard of 171.5806 9.85None 1323.48 75.97Some 203.4096 11.68Most 43.63314 2.50
Frequency Missing = 152.89636107
CLOSE FRIENDS USE WINE
Q15e Frequency Percent_______________________________________Never heard of 49.73379 2.86None 1478.293 85.00
Some 182.5938 10.50Most 28.58632 1.64
Frequency Missing = 155.79299253
The frequencies have been weighted so that theanalysis reflects the distribution of students by grade
level in the district

7/30/2019 2002 _ dallas county _ duncanville isd _ 2002 texas school survey of drug and alcohol use _ elementary report
http://slidepdf.com/reader/full/2002-dallas-county-duncanville-isd-2002-texas-school-survey-of-drug-and 36/43
DuncanvilleSpring 2002
The FREQ Procedure
CLOSE FRIENDS USE LIQUOR
Q15f Frequency Percent
_______________________________________Never heard of 146.3347 8.43None 1472.958 84.86Some 92.6984 5.34Most 23.73273 1.37
Frequency Missing = 159.27572159
CLOSE FRIENDS USE INHALANTS
Q15h Frequency Percent_______________________________________Never heard of 118.008 6.81None 1491.164 86.01Some 105.9259 6.11Most 18.51621 1.07
Frequency Missing = 161.38580254
CLOSE FRIENDS USE MARIJUANA
Q15i Frequency Percent_______________________________________Never heard of 199.7611 11.46None 1443.076 82.78Some 81.24986 4.66Most 19.24787 1.10
Frequency Missing = 151.66529104
EVER BEEN OFFERED CIGARETTES
Q16a Frequency Percent_______________________________________Never heard of 81.85706 4.56No 1394.32 77.70Yes 318.2761 17.74
Frequency Missing = 100.54730693
EVER BEEN OFFERED SNUFF/CHEWING TOBACCO
Q16b Frequency Percent_______________________________________Never heard of 129.8119 7.40No 1550.026 88.31Yes 75.29524 4.29
Frequency Missing = 139.86715896
The frequencies have been weighted so that theanalysis reflects the distribution of students by grade
level in the district
7/30/2019 2002 _ dallas county _ duncanville isd _ 2002 texas school survey of drug and alcohol use _ elementary report
http://slidepdf.com/reader/full/2002-dallas-county-duncanville-isd-2002-texas-school-survey-of-drug-and 37/43
DuncanvilleSpring 2002
The FREQ Procedure
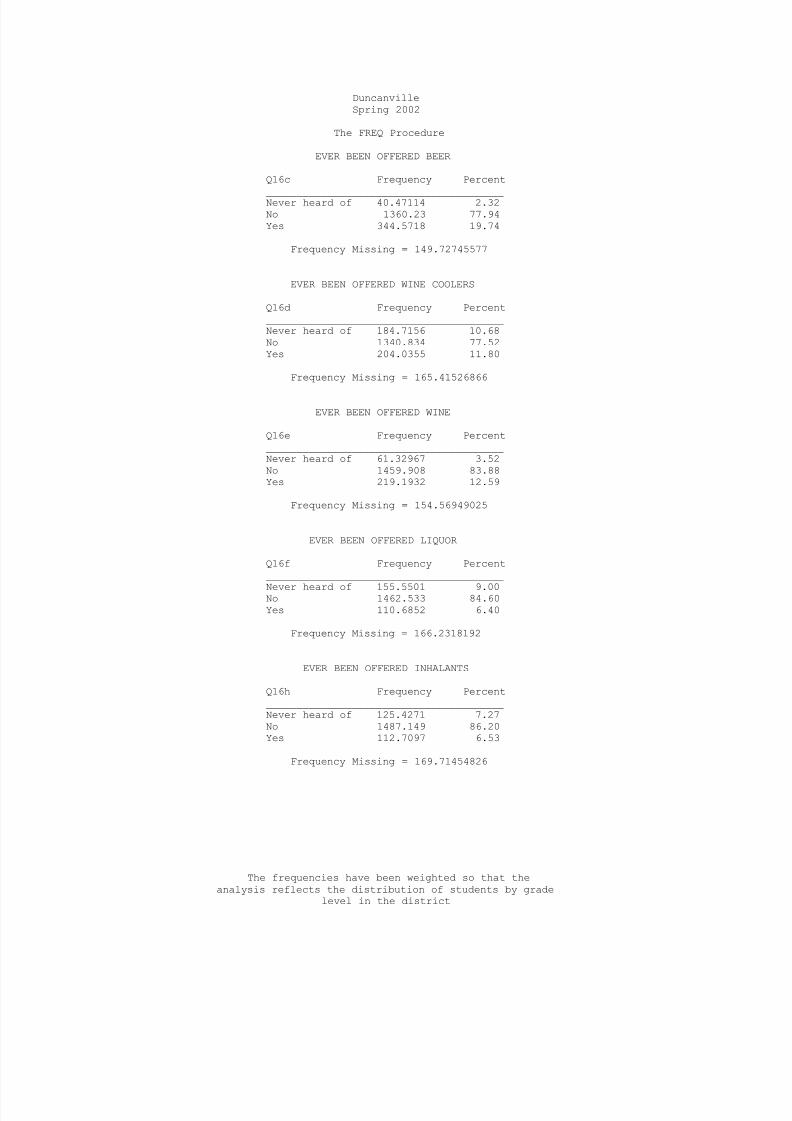
EVER BEEN OFFERED BEER
Q16c Frequency Percent
_______________________________________Never heard of 40.47114 2.32No 1360.23 77.94Yes 344.5718 19.74
Frequency Missing = 149.72745577
EVER BEEN OFFERED WINE COOLERS
Q16d Frequency Percent_______________________________________Never heard of 184.7156 10.68No 1340.834 77.52Yes 204.0355 11.80
Frequency Missing = 165.41526866
EVER BEEN OFFERED WINE
Q16e Frequency Percent_______________________________________Never heard of 61.32967 3.52No 1459.908 83.88Yes 219.1932 12.59
Frequency Missing = 154.56949025
EVER BEEN OFFERED LIQUOR
Q16f Frequency Percent_______________________________________
Never heard of 155.5501 9.00No 1462.533 84.60Yes 110.6852 6.40
Frequency Missing = 166.2318192
EVER BEEN OFFERED INHALANTS
Q16h Frequency Percent_______________________________________Never heard of 125.4271 7.27No 1487.149 86.20Yes 112.7097 6.53
Frequency Missing = 169.71454826
The frequencies have been weighted so that theanalysis reflects the distribution of students by grade
level in the district
7/30/2019 2002 _ dallas county _ duncanville isd _ 2002 texas school survey of drug and alcohol use _ elementary report
http://slidepdf.com/reader/full/2002-dallas-county-duncanville-isd-2002-texas-school-survey-of-drug-and 38/43
DuncanvilleSpring 2002
The FREQ Procedure
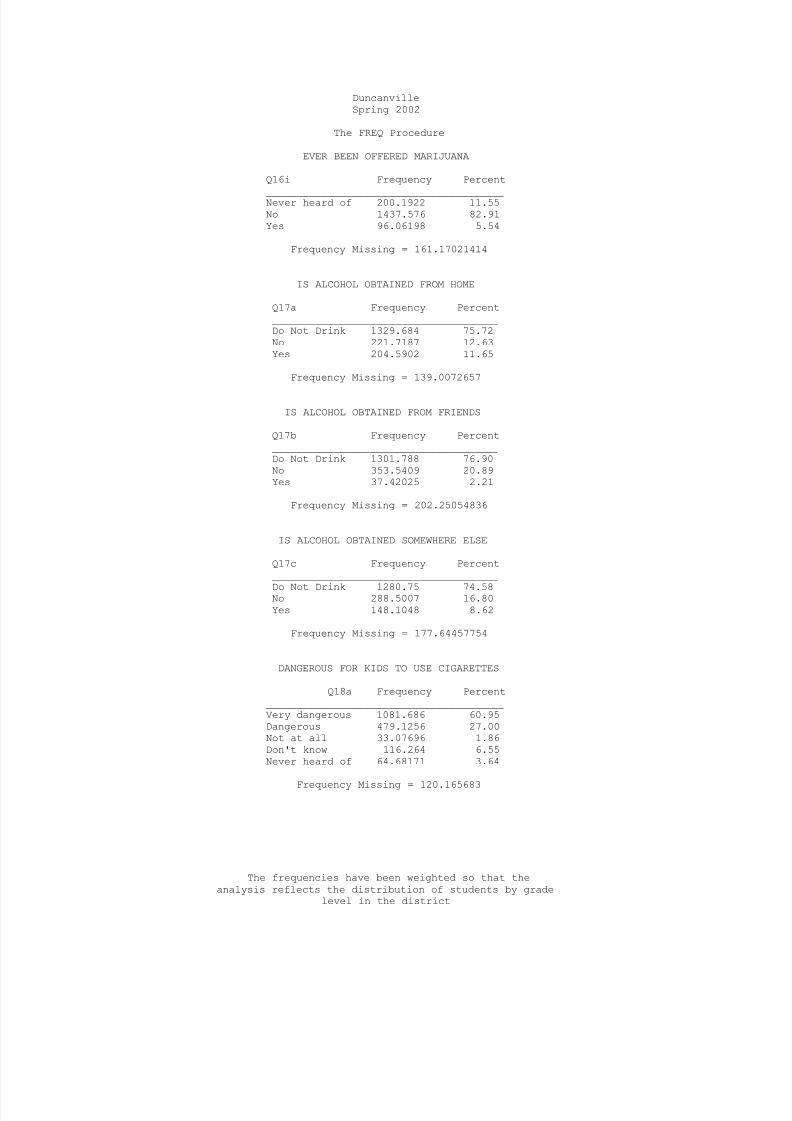
EVER BEEN OFFERED MARIJUANA
Q16i Frequency Percent
_______________________________________Never heard of 200.1922 11.55No 1437.576 82.91Yes 96.06198 5.54
Frequency Missing = 161.17021414
IS ALCOHOL OBTAINED FROM HOME
Q17a Frequency Percent_____________________________________Do Not Drink 1329.684 75.72No 221.7187 12.63Yes 204.5902 11.65
Frequency Missing = 139.0072657
IS ALCOHOL OBTAINED FROM FRIENDS
Q17b Frequency Percent_____________________________________Do Not Drink 1301.788 76.90No 353.5409 20.89Yes 37.42025 2.21
Frequency Missing = 202.25054836
IS ALCOHOL OBTAINED SOMEWHERE ELSE
Q17c Frequency Percent_____________________________________
Do Not Drink 1280.75 74.58No 288.5007 16.80Yes 148.1048 8.62
Frequency Missing = 177.64457754
DANGEROUS FOR KIDS TO USE CIGARETTES
Q18a Frequency Percent_______________________________________Very dangerous 1081.686 60.95Dangerous 479.1256 27.00Not at all 33.07696 1.86Don't know 116.264 6.55Never heard of 64.68171 3.64
Frequency Missing = 120.165683
The frequencies have been weighted so that theanalysis reflects the distribution of students by grade
level in the district
7/30/2019 2002 _ dallas county _ duncanville isd _ 2002 texas school survey of drug and alcohol use _ elementary report
http://slidepdf.com/reader/full/2002-dallas-county-duncanville-isd-2002-texas-school-survey-of-drug-and 39/43
DuncanvilleSpring 2002
The FREQ Procedure
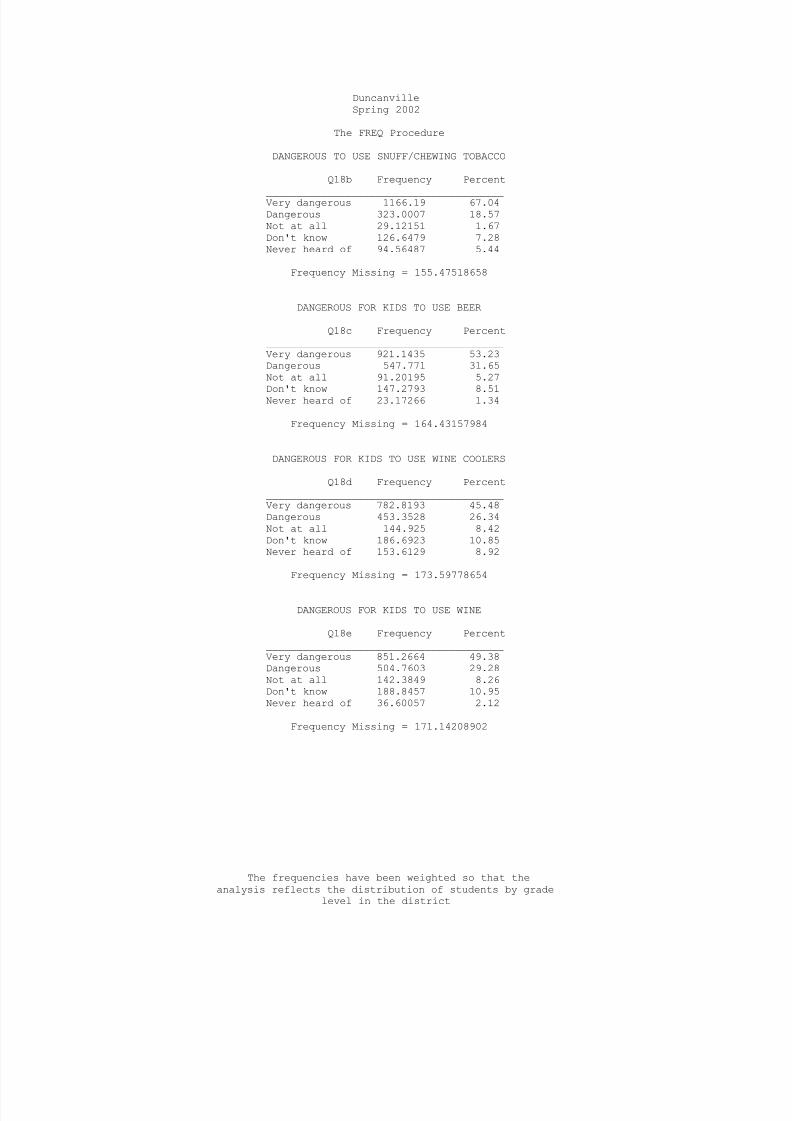
DANGEROUS TO USE SNUFF/CHEWING TOBACCO
Q18b Frequency Percent
_______________________________________Very dangerous 1166.19 67.04Dangerous 323.0007 18.57Not at all 29.12151 1.67Don't know 126.6479 7.28Never heard of 94.56487 5.44
Frequency Missing = 155.47518658
DANGEROUS FOR KIDS TO USE BEER
Q18c Frequency Percent_______________________________________Very dangerous 921.1435 53.23Dangerous 547.771 31.65Not at all 91.20195 5.27
Don't know 147.2793 8.51Never heard of 23.17266 1.34
Frequency Missing = 164.43157984
DANGEROUS FOR KIDS TO USE WINE COOLERS
Q18d Frequency Percent_______________________________________Very dangerous 782.8193 45.48Dangerous 453.3528 26.34Not at all 144.925 8.42Don't know 186.6923 10.85Never heard of 153.6129 8.92
Frequency Missing = 173.59778654
DANGEROUS FOR KIDS TO USE WINE
Q18e Frequency Percent_______________________________________Very dangerous 851.2664 49.38Dangerous 504.7603 29.28Not at all 142.3849 8.26Don't know 188.8457 10.95Never heard of 36.60057 2.12
Frequency Missing = 171.14208902
The frequencies have been weighted so that theanalysis reflects the distribution of students by grade
level in the district
7/30/2019 2002 _ dallas county _ duncanville isd _ 2002 texas school survey of drug and alcohol use _ elementary report
http://slidepdf.com/reader/full/2002-dallas-county-duncanville-isd-2002-texas-school-survey-of-drug-and 40/43
DuncanvilleSpring 2002
The FREQ Procedure
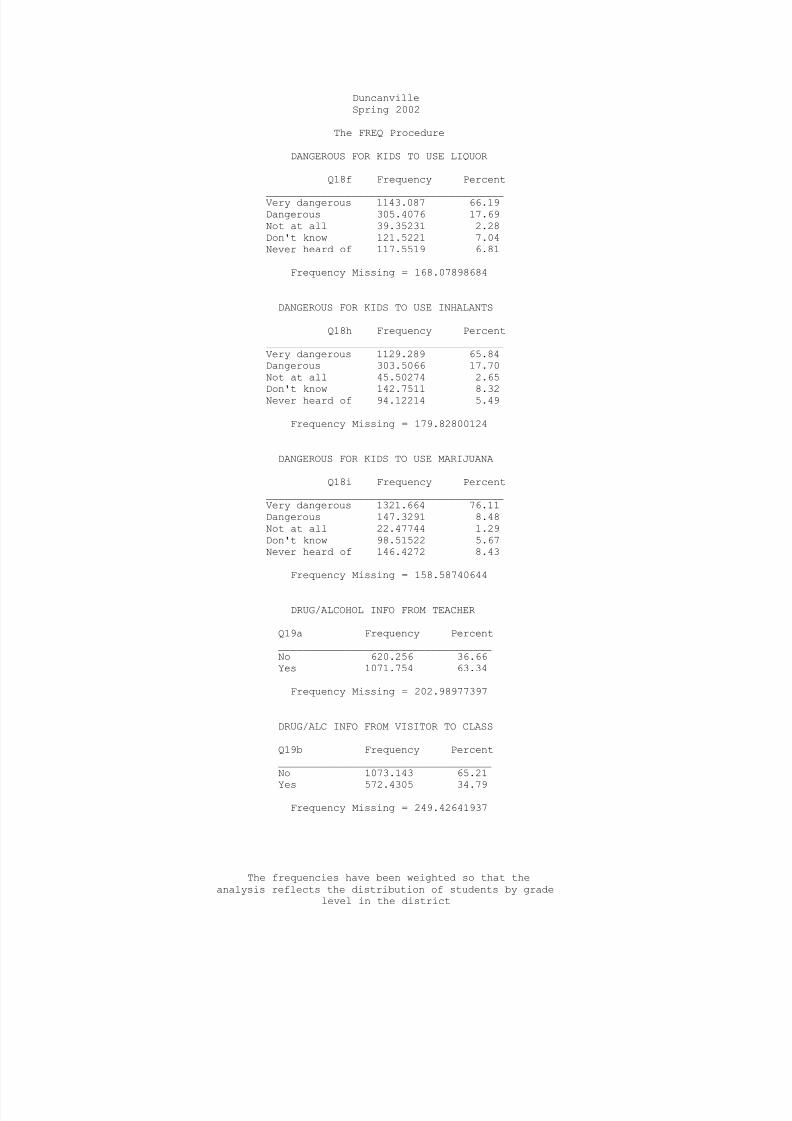
DANGEROUS FOR KIDS TO USE LIQUOR
Q18f Frequency Percent
_______________________________________Very dangerous 1143.087 66.19Dangerous 305.4076 17.69Not at all 39.35231 2.28Don't know 121.5221 7.04Never heard of 117.5519 6.81
Frequency Missing = 168.07898684
DANGEROUS FOR KIDS TO USE INHALANTS
Q18h Frequency Percent_______________________________________Very dangerous 1129.289 65.84Dangerous 303.5066 17.70Not at all 45.50274 2.65
Don't know 142.7511 8.32Never heard of 94.12214 5.49
Frequency Missing = 179.82800124
DANGEROUS FOR KIDS TO USE MARIJUANA
Q18i Frequency Percent_______________________________________Very dangerous 1321.664 76.11Dangerous 147.3291 8.48Not at all 22.47744 1.29Don't know 98.51522 5.67Never heard of 146.4272 8.43
Frequency Missing = 158.58740644
DRUG/ALCOHOL INFO FROM TEACHER
Q19a Frequency Percent___________________________________No 620.256 36.66Yes 1071.754 63.34
Frequency Missing = 202.98977397
DRUG/ALC INFO FROM VISITOR TO CLASS
Q19b Frequency Percent___________________________________No 1073.143 65.21
Yes 572.4305 34.79
Frequency Missing = 249.42641937
The frequencies have been weighted so that theanalysis reflects the distribution of students by grade
level in the district
7/30/2019 2002 _ dallas county _ duncanville isd _ 2002 texas school survey of drug and alcohol use _ elementary report
http://slidepdf.com/reader/full/2002-dallas-county-duncanville-isd-2002-texas-school-survey-of-drug-and 41/43
DuncanvilleSpring 2002
The FREQ Procedure
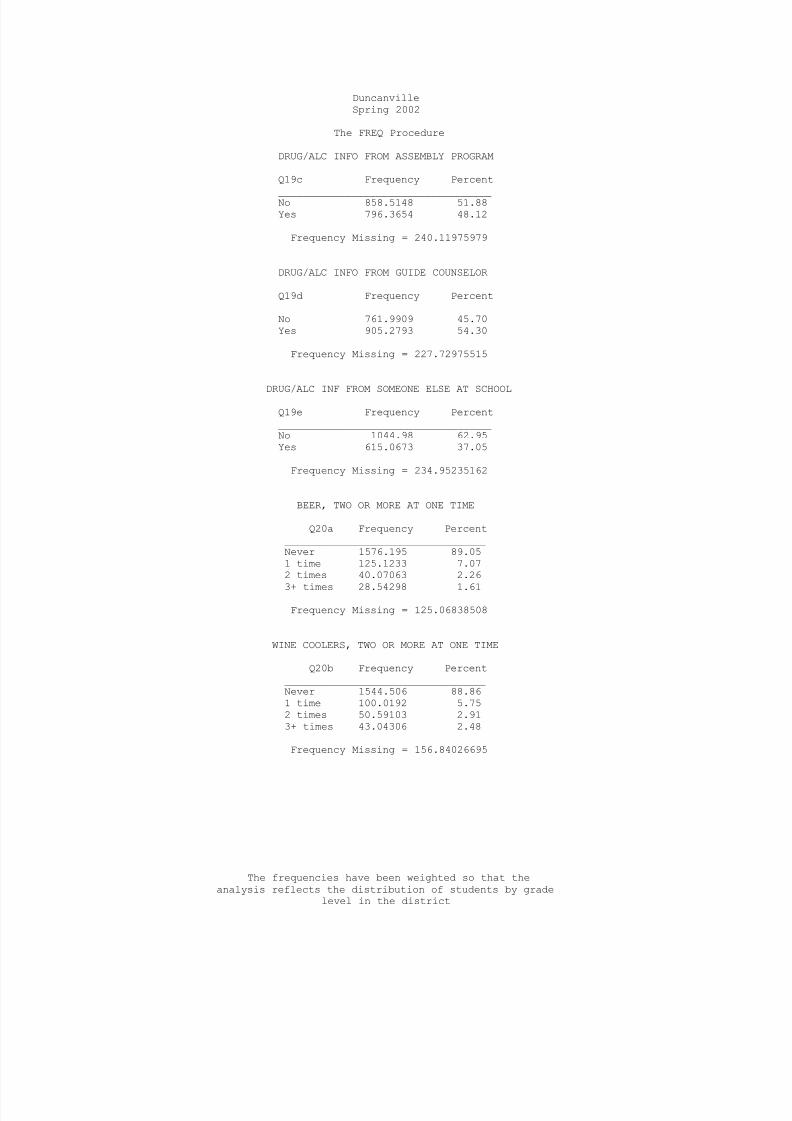
DRUG/ALC INFO FROM ASSEMBLY PROGRAM
Q19c Frequency Percent
___________________________________No 858.5148 51.88Yes 796.3654 48.12
Frequency Missing = 240.11975979
DRUG/ALC INFO FROM GUIDE COUNSELOR
Q19d Frequency Percent___________________________________No 761.9909 45.70Yes 905.2793 54.30
Frequency Missing = 227.72975515
DRUG/ALC INF FROM SOMEONE ELSE AT SCHOOL Q19e Frequency Percent___________________________________No 1044.98 62.95Yes 615.0673 37.05
Frequency Missing = 234.95235162
BEER, TWO OR MORE AT ONE TIME
Q20a Frequency Percent_________________________________Never 1576.195 89.051 time 125.1233 7.072 times 40.07063 2.26
3+ times 28.54298 1.61
Frequency Missing = 125.06838508
WINE COOLERS, TWO OR MORE AT ONE TIME
Q20b Frequency Percent_________________________________Never 1544.506 88.861 time 100.0192 5.752 times 50.59103 2.913+ times 43.04306 2.48
Frequency Missing = 156.84026695
The frequencies have been weighted so that theanalysis reflects the distribution of students by grade
level in the district

7/30/2019 2002 _ dallas county _ duncanville isd _ 2002 texas school survey of drug and alcohol use _ elementary report
http://slidepdf.com/reader/full/2002-dallas-county-duncanville-isd-2002-texas-school-survey-of-drug-and 42/43
DuncanvilleSpring 2002
The FREQ Procedure
WINE, TWO OR MORE AT ONE TIME
Q20c Frequency Percent
_________________________________Never 1536.252 88.431 time 142.2502 8.192 times 34.17156 1.973+ times 24.53263 1.41
Frequency Missing = 157.79328819
LIQUOR, TWO OR MORE AT ONE TIME
Q20d Frequency Percent_________________________________Never 1667.281 96.091 time 31.17669 1.802 times 18.41797 1.063+ times 18.24573 1.05
Frequency Missing = 159.87847651
MISSED SCHOOL WITHOUT PARENT'S CONSENT
Q21 Frequency Percent___________________________________No 1776.927 97.69Yes 41.98424 2.31
Frequency Missing = 76.088689166
SENT TO PRINCIPAL/DEAN SINCE SEPTEMBER
Q22 Frequency Percent
___________________________________No 1234.161 68.17Yes 576.1493 31.83
Frequency Missing = 84.689708711
PARENTS FEEL ABOUT KIDS DRINKING BEER
Q23 Frequency Percent________________________________________Don't like it 1463.722 80.89Don't care 39.70191 2.19Think it's O.K. 10.11923 0.56Don't know 296.0793 16.36
Frequency Missing = 85.37802386
The frequencies have been weighted so that theanalysis reflects the distribution of students by grade
level in the district

7/30/2019 2002 _ dallas county _ duncanville isd _ 2002 texas school survey of drug and alcohol use _ elementary report
http://slidepdf.com/reader/full/2002-dallas-county-duncanville-isd-2002-texas-school-survey-of-drug-and 43/43
DuncanvilleSpring 2002
The FREQ Procedure
PARENTS FEEL ABOUT KIDS USING MARIJUANA
Q24 Frequency Percent
________________________________________Don't like it 1514.725 83.36Don't care 25.0487 1.38Think it's O.K. 3.641632 0.20Don't know 273.5885 15.06
Frequency Missing = 77.996524413
The frequencies have been weighted so that the


