11
Lake County Annual Crop Report 2003

Lake County
Annual Crop Report 2003

COUNTY OF LAKE Department of Agriculture Department of Weights & Measures 883 Lakeport Blvd. Lakeport CA 95453 Phone: (707) 263-0217 FAX: (707) 263-1052
STEVEN HAJIK Agricultural Commissioner
Sealer of Weights & Measures
November 9, 2004 A.G. Kawamura, Secretary California Department of Food and Agriculture And The Honorable Board of Supervisors of Lake County Gentlemen:
It is my pleasure to present the Lake County Agricultural Report for the year 2003 in accordance with sections 2272 and 2279 of the California Agriculture Code. The gross value of Lake County agricultural production for the year 2003 was $58,055,000. This is down 9% from 2002. This decrease is primarily due to declines in the fruit and nut crops. This report represents gross agricultural receipts and does not reflect production costs or net income to the producers. The gross value of winegrapes declined slightly in 2003. While the total tonnage harvested increased, the tons per acre and the price per ton, on the average, decreased slightly. The total planted acreage of winegrapes continued to increase, but at a slower rate. More bearing acres came into production in 2003. In 2003, the gross value of pears decreased 23%. Total production declined by 18%. Yields and prices per ton were down from the previous year as well. Pear acreage was reduced another 260 acres in 2003. The gross value of walnuts declined slightly due to lower yields and less bearing acreage. The average price per ton was up in 2003. With the exception of forest products, there were only slight changes in the gross value of the other commodities. Livestock production, livestock and poultry products and vegetable crops were up slightly. Nursery production and field crops were down slightly. Forest products increased significantly in 2003. The gross value of pears in this report represents the value of the pears after they are packed and processed. The figures do not indicate the value of the pears at the time of harvest or the gross income of the producers. The gross values of all other commodities in this report represent the value of each commodity at the time of harvest. These values indicate the value of the commodities to the producer. I would like to thank our staff Biologists/Inspectors Dana Thibeau, Kris Eutenier and Denise Patrick for their efforts in compiling the information, providing the photographs and working on the lay-out of the 2003 Crop Report. I wish to express my appreciation to the many individuals and organizations who contributed to making this report possible. Respectfully submitted, Steve Hajik

Agricultural Commissioner
CROP BEARINGACRES
NON-BEARINGACRES TOTAL
White 1,990 432 2,422
FRUIT AND NUT ACREAGE
COMMODITY MarketType Year Production
(Tons)Yield
(Tons/Acre)Returns
$/Ton (1) Gross Value (1)
BearingAcreage
2003 10,858 5.5 $847 $9,199,000 1,9902002 11,308 5.3 $999 $11,297,000 2,1322003 15,626 3.7 $1,416 $22,133,000 4,2292002 13,658 4.1 $1,535 $20,965,000 3,3332003 26,483 4.3 $1,183 $31,332,000 6,2192002 24,966 4.6 $1,292 $32,262,000 5,465
2003 19,650 $515 $10,119,0002002 23,930 $586 $14,023,0002003 19,734 $221 $4,364,0002002 24,269 $200 $4,854,0002003 690 $72 $49,4002002 2,765 $112 $309,7002003 4,422 $53 $234,5002002 4,710 $121 $569,9002003 44,496 17.2 $332 $14,767,000 2,5932002 55,674 19.7 $355 $19,756,000 2,8262003 1,525 $664 $1,012,0002002 1,117 $849 $948,3002003 209 $20 $4,2002002 261 $9 $2,3002003 1,734 14.3 $586 $1,016,000 1212002 1,378 9.3 $690 $950,700 1482003 702 $875 $614,7002002 577 $968 $558,5002003 211 $33 $6,9502002 206 $10 $2,0602003 913 18.3 $681 $621,700 502002 783 15.7 $716 $560,600 502003 47,143 17.1 $348 $16,405,000 2,7642002 57,835 19.1 $368 $21,268,000 3,024
2003 518 0.92 $1,016 $526,300 5652002 558 0.97 $960 $535,400 5752003 1,105 0.51 $1,016 $1,123,000 2,1742002 1,401 0.63 $960 $1,345,000 2,2242003 1,623 0.59 $1,016 $1,649,000 2,7392002 1,959 0.70 $960 $1,881,000 2,799
2003 $103,000 1312002 $99,700 129
2003 $49,489,000 11,8532002 $55,510,000 11,417
(1) This is gross value and does not represent net return to the producer.(2) Includes dried pears.(3) Includes apples, peaches, strawberries, melons, and dried fruits.
ALL WINE GRAPES
Reds
Red Pearsother than Bartlett
(Starkrimson)
Winter & Asian
Winter & Asian(Includes Bosc, Comice, Seckel)
By-products
ALL FRUIT& NUT CROPS
By-products
PEARS
FRUIT AND NUT CROPS
ALL WALNUTS
Non-IrrigatedWalnuts
Irrigated Walnuts
WALNUTS
ALL PEARS
Total Reds
Whites
WINE GRAPES
MISCELLANEOUSFRUITS & NUTS (3)
MISCELLANEOUS FRUITS & NUTS
BartlettIncluding Red
Fresh
Cannery
Fresh
Production
BabyFood
Fresh
By-products(2)
Bartlett


TOP TW ENTY GRAPE VARIETIES
VARIETY TO NS $/TON VALUECabernet Sauvignon 8,078 $1,687 $13,629,500Sauvignon B lanc 8,156 $871 $7,106,500Zinfandel 2,905 $822 $2,389,000M erlot 2,246 $996 $2,238,100Chardonnay 1,810 $668 $1,209,600Petite S irah 696 $1,683 $1,171,300Syrah 857 $1,273 $1,090,500Cabernet Franc 503 $1,852 $931,000Petite Verdot 116 $1,800 $209,100Sem illon 225 $831 $186,500M uscat B lanc 193 $867 $167,500Gewerztraminer 187 $800 $149,700M albec 54 $1,754 $94,400Voignier 75 $1,243 $92,800Barbara 52 $1,399 $72,300W hite Riesling 75 $820 $61,400Grenache 20 $1,883 $37,700Pinot Noir 17 $2,100 $35,900Tem pranillo 15 $2,044 $31,500Other (17) 206 $2,078 $427,700TO TAL 26,483 $1,183 $31,332,000
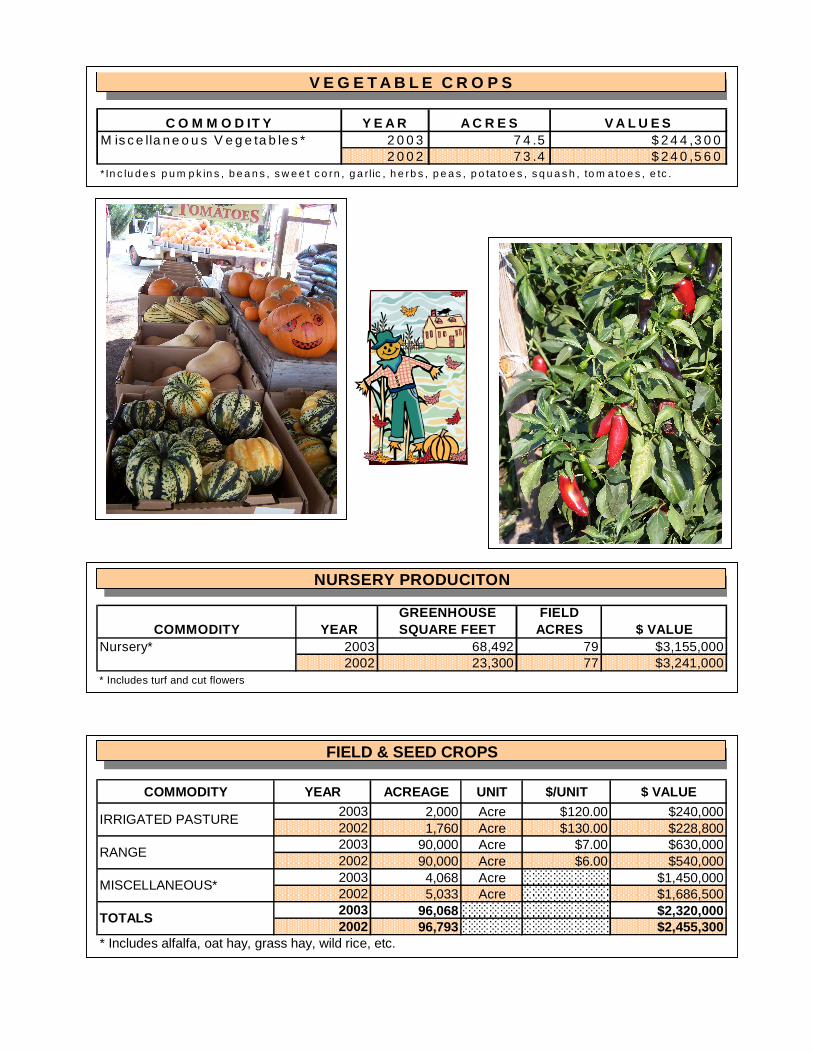
C O M M O D IT Y Y E A R A C R E S V A L U E SM is c e lla n e o u s V e g e ta b le s * 2 0 0 3 7 4 .5 $ 2 4 4 ,3 0 0
2 0 0 2 7 3 .4 $ 2 4 0 ,5 6 0* In c lu d e s p u m p k in s , b e a n s , s w e e t c o rn , g a rlic , h e rb s , p e a s , p o ta to e s , s q u a s h , to m a to e s , e tc .
V E G E T A B L E C R O P S
COMMODITY YEARGREENHOUSE SQUARE FEET
FIELD ACRES $ VALUE
Nursery* 2003 68,492 79 $3,155,0002002 23,300 77 $3,241,000
* Includes turf and cut flowers
NURSERY PRODUCITON
COMMODITY YEAR ACREAGE UNIT $/UNIT $ VALUE2003 2,000 Acre $120.00 $240,0002002 1,760 Acre $130.00 $228,8002003 90,000 Acre $7.00 $630,0002002 90,000 Acre $6.00 $540,0002003 4,068 Acre $1,450,0002002 5,033 Acre $1,686,5002003 96,068 $2,320,0002002 96,793 $2,455,300
* Includes alfalfa, oat hay, grass hay, wild rice, etc.
FIELD & SEED CROPS
TOTALS
IRRIGATED PASTURE
RANGE
MISCELLANEOUS*
Item YEAR M B F (A) Value (B )2003 625 $132,4002002 61 $11,900
TIM BER HARVEST*
T im ber Yie ld
(A ) Q uantity of tim ber cu t and scaled (Thousand Board Feet)(B ) Va lue of tim ber im m ediate ly before cutting * Va lues furnished by the C aliforn ia S ta te Board of Equa lization
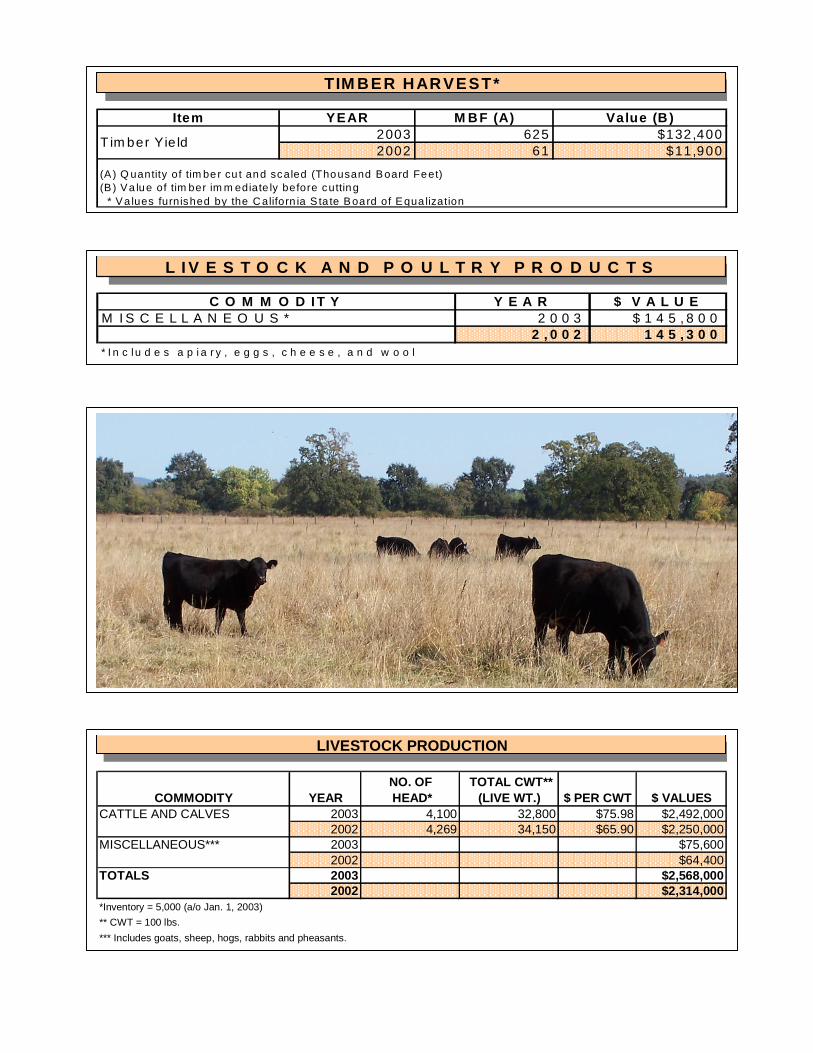
COMMODITY YEARNO. OF HEAD*
TOTAL CWT** (LIVE WT.) $ PER CWT $ VALUES
CATTLE AND CALVES 2003 4,100 32,800 $75.98 $2,492,0002002 4,269 34,150 $65.90 $2,250,000
MISCELLANEOUS*** 2003 $75,6002002 $64,400
TOTALS 2003 $2,568,0002002 $2,314,000
*Inventory = 5,000 (a/o Jan. 1, 2003)** CWT = 100 lbs.*** Includes goats, sheep, hogs, rabbits and pheasants.
LIVESTOCK PRODUCTION
C O M M O D I T Y Y E A R $ V A L U EM I S C E L L A N E O U S * 2 0 0 3 $ 1 4 5 , 8 0 0
2 , 0 0 2 1 4 5 , 3 0 0* I n c lu d e s a p i a r y , e g g s , c h e e s e , a n d w o o l
L I V E S T O C K A N D P O U L T R Y P R O D U C T S

B io lo g ica l C o ntro l is th e d e lib era te u se o f n a tu ra l e ne m ies to s up p re ss o r m a n ag epe s t p o pu la tion s a t a cce p ta b le le ve ls .
P E S T AG E N T /M E C H AN IS M S C O P E O F P R O G R A M
B u ll T h is tle G all F ly2 S ite s , U n k n o w n e s ta b lis hm e nt
Ita lian T h is tle S e e d H ea d W e e vil G en e ra lly d is tr ib u ted
K la m a th W e e d K lam a th W e ed B e etle W id e ly d is tr ib u te d w ith var ia b le p o pu la tion s
Ye llow S ta rth is tle
S e e d H ea d W e e vil G a ll F ly F lo w e r W e e vil H a iry W ee v il a a aa a a aa a a aa a a a P e a co ck F ly
W id e ly d is tr ib u te d 2 S ite s 1 S ite B e co m in g ge n e ra lly d is trib u te d G en e ra lly d is tr ib u ted
R e d G um L erp P s yllid W a sp (P sylla e ph a gu s b liteu s ) 1 S ite
T h e fo llo w in g p es ts w e re u nd e r ac tive co n tro l a n d era d ica tio n d u rin g the ye ar:D a lm a tia n T o a dflax , S co tch T h is tle , P lu m e le ss T h is tle , A rtich o k e T h is tle , P u rp leS ta rth is tle , O b lo ng S p urg e, C an a d a T h is tle , H yd r illa .
P A C K AG E S P R O F ILE D P A C K A G E S IN S P E C T E D P A C K A G E S R E J E C T E D3 3 1 3 1 03 2 4
C R O P S N U M B E R O F F A R M S AC R E SW a ln u ts 60 1 3 2 7W ine G rap e s 8 19 1M isc . F ru it 7 4M isc . V eg e ta b le s 4 7H a y 3 11 0A p ples 2 6P a s tu res 1 71 3P e ars 6 15 4T O T A L 91 2 5 1 2* R e g is te red o rgan ic w ith the L ake C oun ty A gricu ltu ra l C om m iss ioner
O R G AN IC * F AR M IN G S T AT IS T IC S
B IO L O G IC AL C O N T R O L
S U S T A IN A B L E A G R IC U L T U R E R E P O R T
P E S T E R AD IC AT IO N
P E S T E X C L U S IO N
P e st ex c lu s io n in sp e c tio n are co n d uc te d d a ily a t P o s t O ffice s an d the U .P .S . te rm in a l

NURSERY CROPLAND PROGRAM HOURS11 34 101
URBAN TRAPSCROPLAND/NURSERY
TRAPS PROGRAM HOURS112 47 925
URBAN TRAPS PROGRAM HOURS302 1,484
* Includes traps for Mediterranean Fruit Fly, Oriental Fruit Fly, Melon Fly, Gypsy Moth and Japanese Beetle
TRAPS DEPLOYED PROGRAM HOURS50 127
NUMBER OF SHIPMENTS PROGRAM HOURS76 403.5
No positive finds for Exotic Insect Pests, Glassy-W inged Sharpshooter or Vine Mealybug in 2003.
PEST DETECTION
VINE MEALY BUG
GLASSY-WINGED SHARPSHOOTER NURSERY SHIPMENTS
EXOTIC INSECT PESTS*
GLASSY-WINGED SHARPSHOOTER TRAPPING
GLASSY-WINGED SHARPSHOOTER VISUAL INSPECTIONS

COMMODITY CLASS YEAR VALUE2003 $49,489,0002002 $55,510,0002003 $2,568,0002002 $2,315,0002003 $145,8002002 $145,3002003 $3,155,0002002 $3,241,0002003 $244,3002002 $240,6002003 $2,320,0002002 $2,455,3002003 $132,4002002 $11,900
2003 $58,055,0002002 $63,919,000
SUMMARY OF PRODUCTION
LIVESTOCK PRODUCTION
LIVESTOCK & POULTRY PRODUCTS
GRAND TOTAL
NURSERY PRODUCTION
VEGETABLE CROPS
FIELD CROPS
FOREST PRODUCTS
FRUITS AND NUTS
2003 AGRICULTUAL PRODUCTION BY COMMODITY
Livestock4% ($2.6 M)
Nursery5% ($3.2 M)
Field Crops4% ($2.3 M)
Walnuts3% ($1.6 M)
Other 1% ($0.5 M)
Pear28% ($16.4 M)
Wine Grapes55% ($31.3 M)

LAKE COUNTY BOARD OF SUPERVISORS
Ed Robey, District 1 Jeff Smith, District 2
Gary Lewis, District 3 Anthony Farrington, District 4
Rob Brown, District 5
AGRICULTURAL COMMISSIONER
SEALER OF WEIGHTS & MEASURES Steve Hajik
DEPUTY AGRICULTURAL COMMISSIONER
DEPUTY SEALER OF WEIGHTS & MEASURES Chuck Morse
AGRICULTURAL BIOLOGISTS
WEIGHTS & MEASURES INSPECTORS Andrew Tritchler Kristine Eutenier Denise Patrick Dana Thibeau
Leah Rubalcava, Agricultural Aide Ty Polk, Agricultural Aide
CLERICAL STAFF
Jimmie Howe, Department Secretary


