The results relate only to the items tested. The test report should only be reproduced in extenso - in extracts only with a written agreement with this institute. Jernholmen 12 DK-2650 Hvidovre Tel.: +45 36 34 90 00 Fax: +45 36 34 90 01 E-mail: [email protected]www.dift.dk Test report 2003-12-18 File No.: DZ67550f Ref: MPA/DB Encl.: 8 Expanded polystyrene Slabs with thickness 80 mm and density 16 kg/m 3
Transcript
The results relate only to theitems tested.The test report should only bereproduced in extenso- in extracts only with a writtenagreement with this institute.
The tests have been carried out in accordance with EN 13823:2002 for validation of theDanish proposal described in the FRG document RG N333.
5 SAMPLE
Danish Institute of Fire and Security Technology (DIFT) received the following sample:
16 slabs of expanded polystyrene, each with dimensions 1197 x 596 x 80.0 mm.
Density at 20°C (undried): 15.8 kg/m³ at the state of receipt determined by weight andmeasures of the sample.
Three test specimens were prepared from the sample.
A standard mounting of specimen was carried out in accordance with clause 5.2.2 of EN13823 as follows:
File No. DZ67550f
2003-12-18
Page 3 of 6
Thickness ofproduct: 80.0 mm
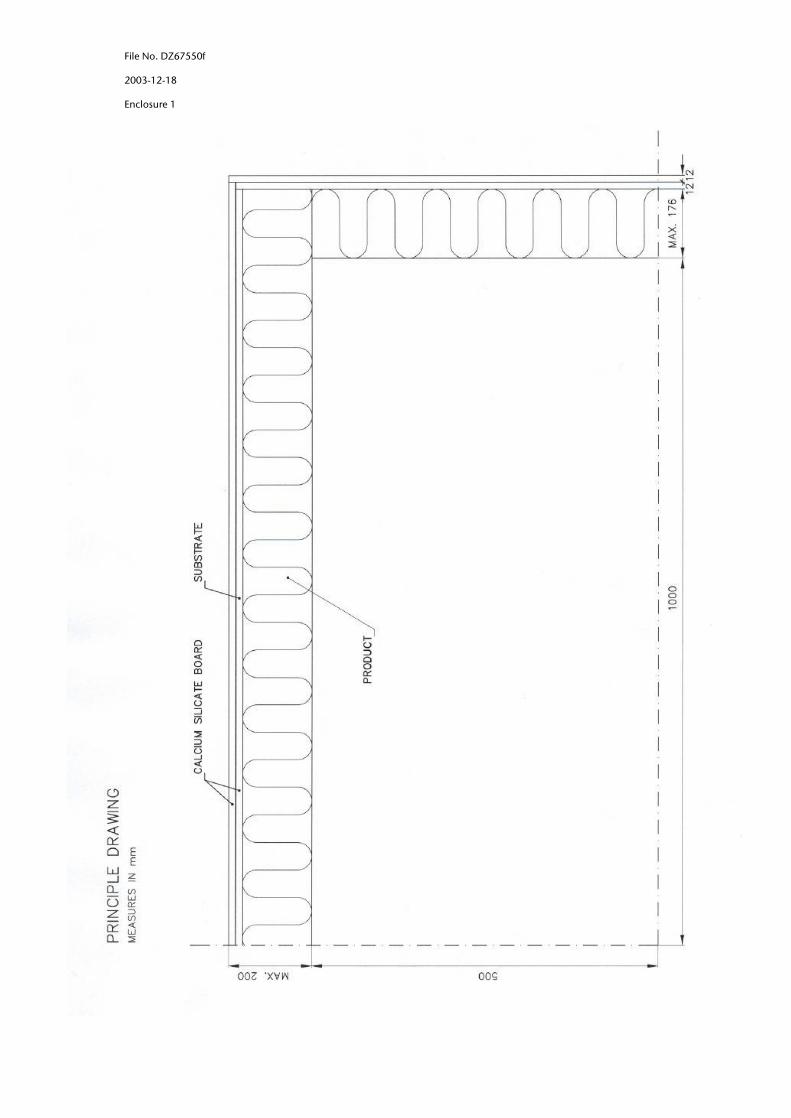
Mounting: Standard mounting option b) in clause 5.2.2 of EN 13823. See enclo-sure 1.
Substrate: 12 mm calcium silicate board, cf. EN 13238.
Fixing means: The slabs were glued to the 12 mm calcium silicate board with ISOFIXUniversalklæber. The applied amount in weight per unit area ofISOFIX Universalklæber in wet and dried condition was determined to1.7 kg/m2 and 0.9 kg/m2, respectively.
ISOFIX Universalklæber is a water glass based adhesive.
Thermocouples: 3 thermocouples were fixed between product and substrate in thefollowing 3 positions on the long wing:
T160: - positioned 160 mm from the upper edge of the burner and200 mm from the corner.
T300: - positioned 300 mm from the upper edge of the burner and200 mm from the corner.
T750: - positioned 750 mm from the upper edge of the burner and200 mm from the corner.
6 CONDITIONING
No conditioning of specimens was conducted.
File No. DZ67550f
2003-12-18
Page 4 of 6
7 TEST METHOD
The tests were performed in accordance with:
EN 13823:2002 Reaction to fire tests for building products �Building products excluding floorings exposed to the thermalattack by a single burning item.
8 TEST RESULTS
Date of test: 2003-12-15
2 tests were performed.
Test F1 was terminated before the nominal exposure period in accordance with clause 8.5b inEN 13823. A third test was not carried out.
During each test the following measurements were made: Volume flow in the exhaust duct,production of carbon dioxide, concentration of oxygen, and production of light-obscuringsmoke. Based on these measurements the rate of heat release and the rate of smoke produc-tion were calculated.
The graphs, enclosure 2-5, show for test F2:
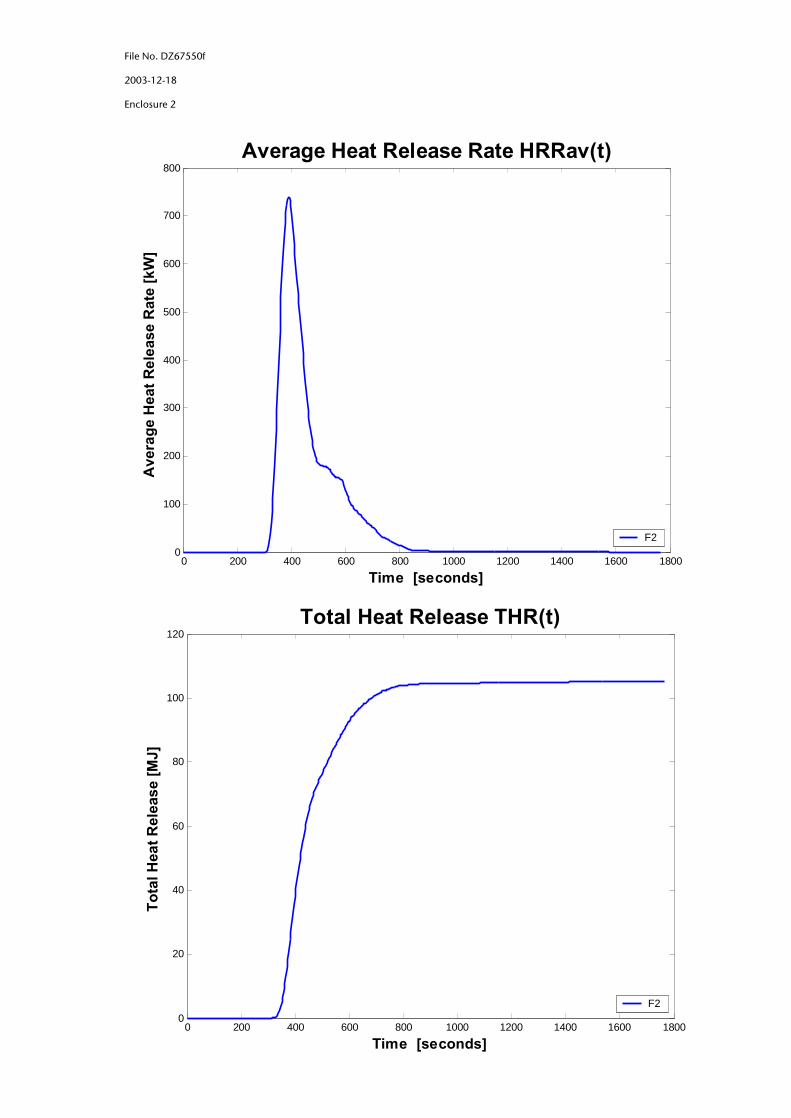
Enclosure 2- Average Heat Release Rate HRRav(t)- Total Heat Release THR (t)
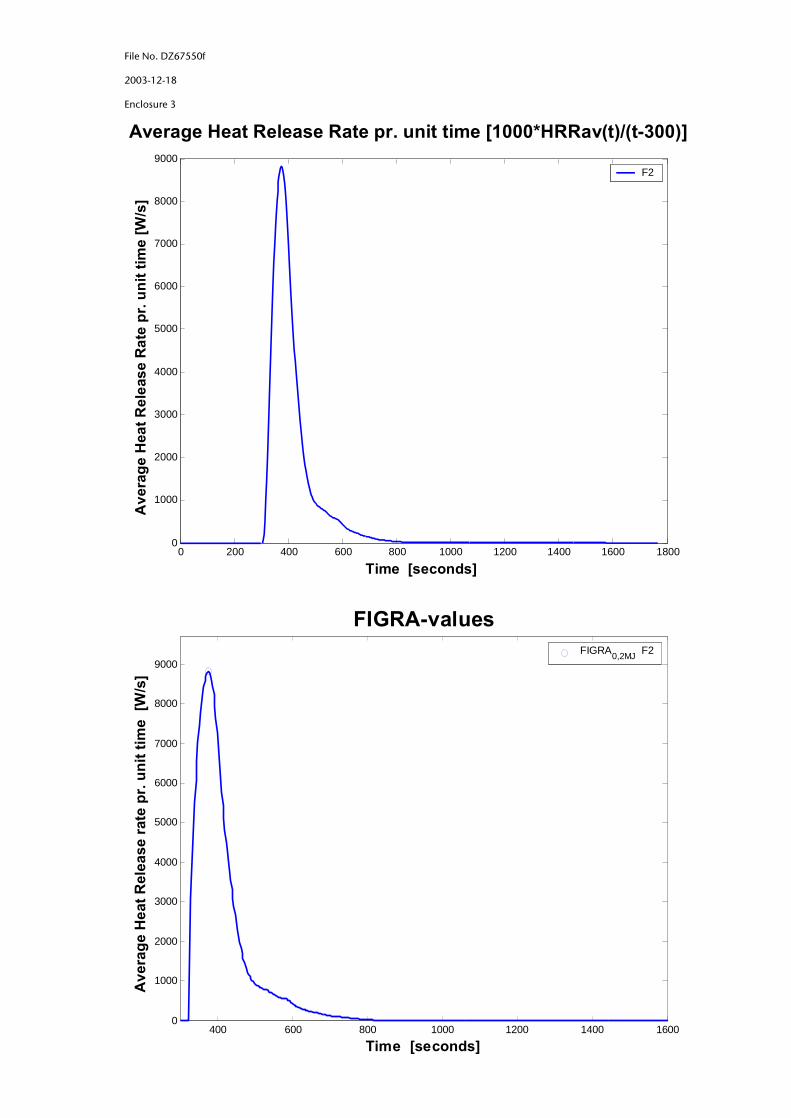
Enclosure 3- Average Heat Release Rate per unit time [1000 x HRRav(t)/(t-300)]- Figra0.2MJ-values
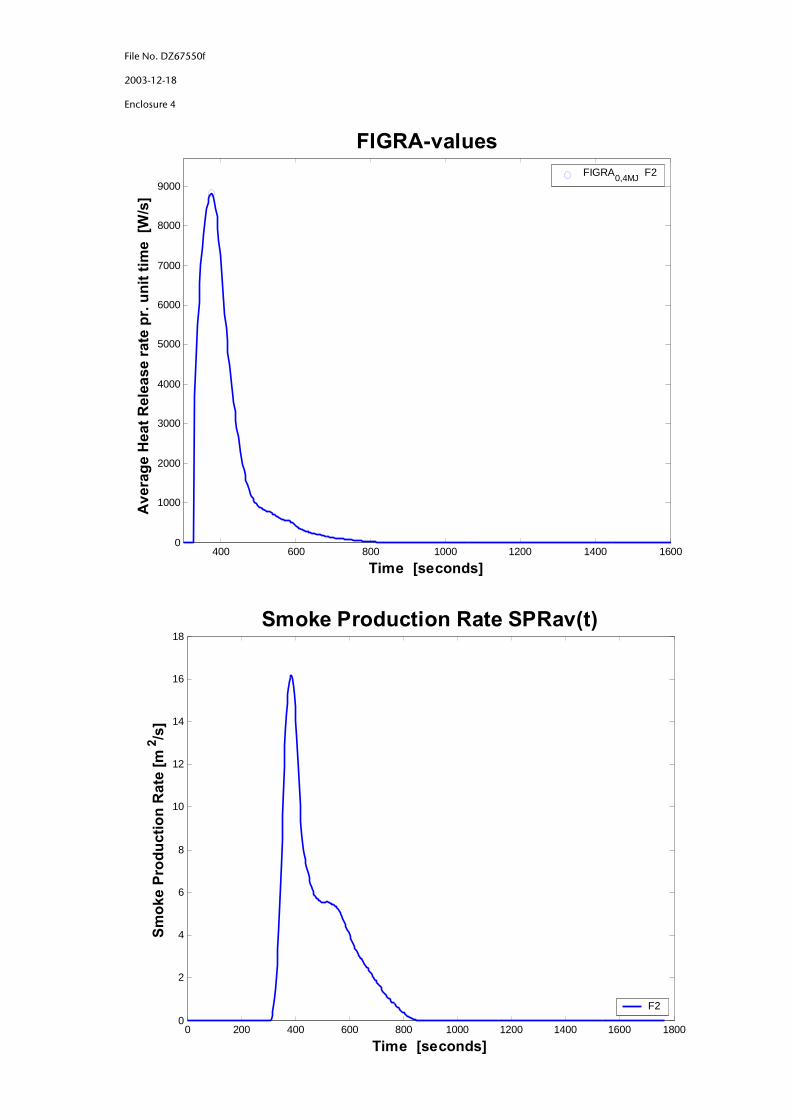
Enclosure 4- Figra0.4 MJ-values- Smoke Production Rate SPRav(t)
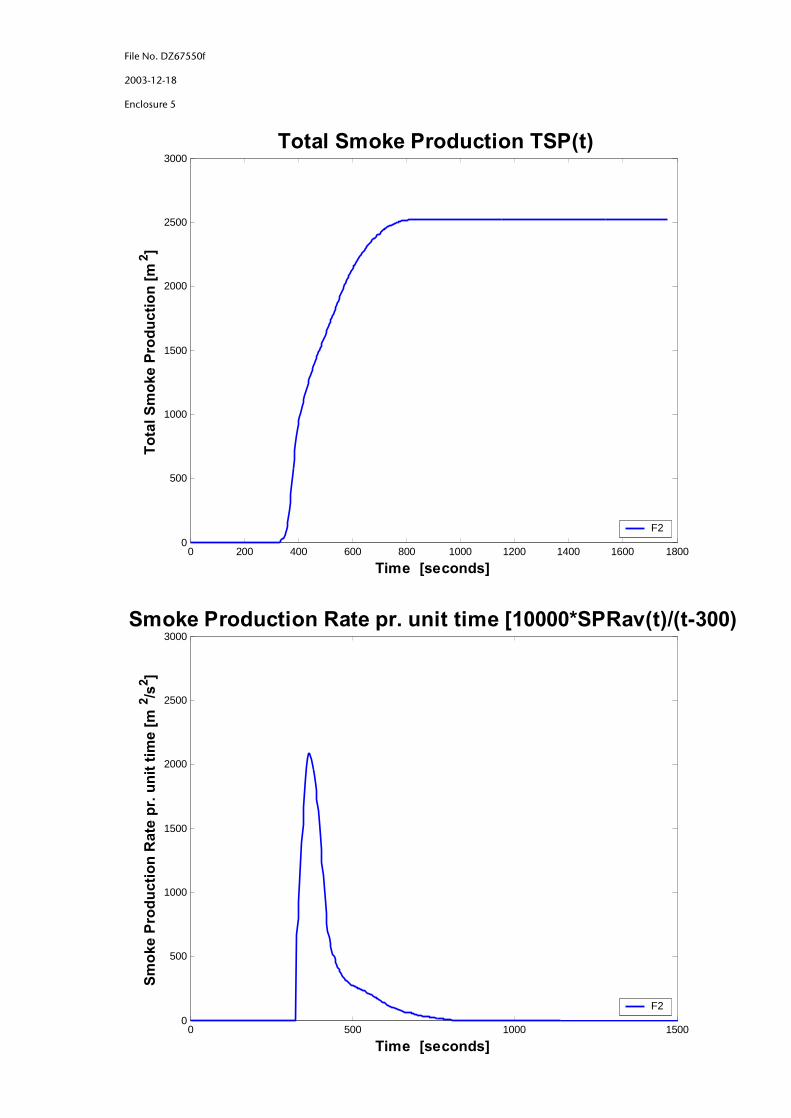
Enclosure 5- Total Smoke Production TSP(t)- Smoke Production Rate per unit time [10000 x SPRav(t)/(t-300)]
The graphs, enclosure 6-7, show the measured temperatures for test F1 and test F2:
Enclosure 6- T160 temperature (temperature measured between product and substrate, 160 mm
from upper edge of the burner and 200 mm from the corner)- T300 temperature (temperature measured between product and substrate, 300 mm
from upper edge of the burner and 200 mm from the corner)
File No. DZ67550f
2003-12-18
Page 5 of 6
Enclosure 7- T750 temperature (temperature measured between product and substrate, 750 mm
from upper edge of the burner and 200 mm from the corner)
FDPf10s: Flaming Droplets/Particles burning less than 10 seconds.FDPf>10s: Flaming Droplets/Particles burning more than 10 seconds.LFS: Lateral Flame Spread on the long wing of the test specimen.
Observations:
Test F1
min:sec00:00-00:15 EPS melts00:15-00:20 Ignition of melt00:40 Calcium silicate board visible2:03 Gas burner stopped
Test F2
min:sec00:00-00:15 EPS melts00:15-00:20 Ignition of melt01:30-01:40 Whole surface of short wing is clear of EPS2:30 LFS>1000 mm3:00 Whole surface of long wing is clear of EPS4:00 Liquid pool fire beyond the half circle, FDP>10s21:00 Gas burner stopped
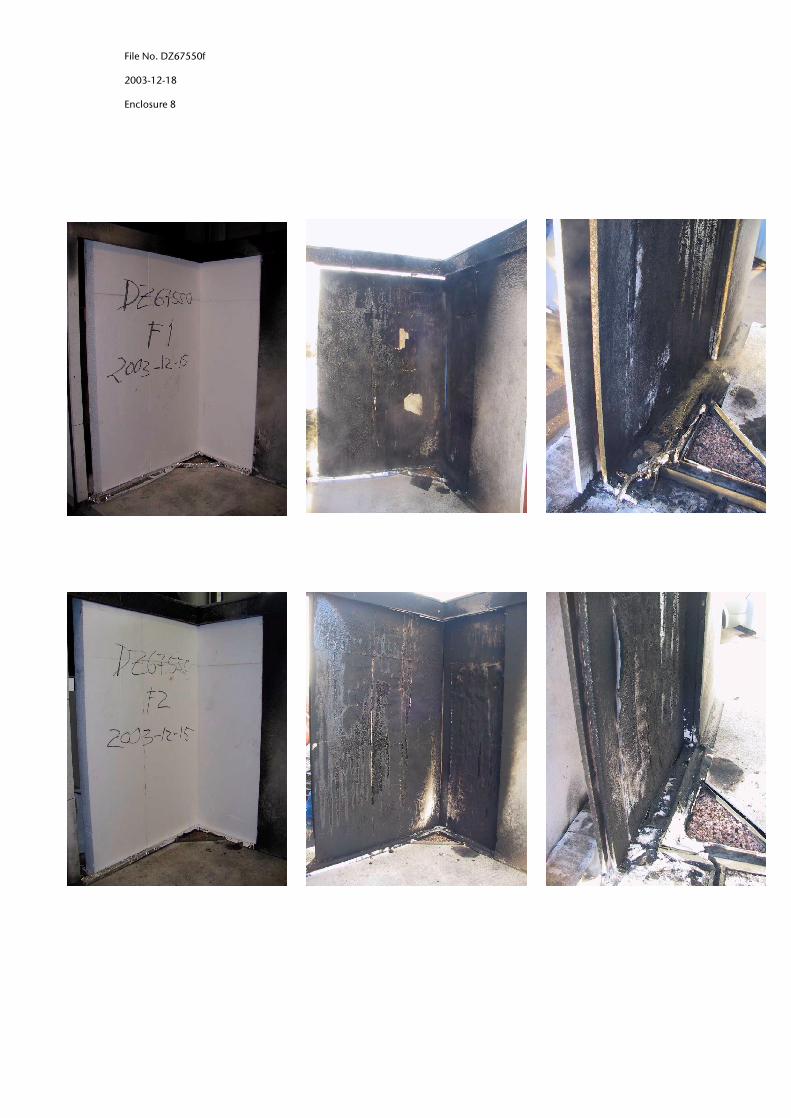
Photographs of the test specimens show the damages, see enclosure 8.
File No. DZ67550f
2003-12-18
Page 6 of 6
9 STATEMENT
The test results relate to the behaviour of the test specimens of a product under the particularconditions of the test; they are not intended to be the sole criterion for assessing the potentialfire hazard of the product in use.
Dan BluhmeHead of Department / Martin Ankjer Pauner
M.Sc.
File No. DZ67550f
2003-12-18
Enclosure 1
File No. DZ67550f
2003-12-18
Enclosure 2
0 200 400 600 800 1000 1200 1400 1600 18000
100
200
300
400
500
600
700
800Average Heat Release Rate HRRav(t)
Time [seconds]
Ave
rage
Hea
t Rel
ease
Rat
e [k
W]
F2
0 200 400 600 800 1000 1200 1400 1600 18000
20
40
60
80
100
120Total Heat Release THR(t)
Time [seconds]
Tota
l Hea
t Rel
ease
[MJ]
F2
File No. DZ67550f
2003-12-18
Enclosure 3
400 600 800 1000 1200 1400 16000
1000
2000
3000
4000
5000
6000
7000
8000
9000
FIGRA-values
Time [seconds]
Ave
rage
Hea
t Rel
ease
rate
pr.
unit
time
[W/s
]
FIGRA0,2MJ
F2
0 200 400 600 800 1000 1200 1400 1600 18000
1000
2000
3000
4000
5000
6000
7000
8000
9000
Average Heat Release Rate pr. unit time [1000*HRRav(t)/(t-300)]
Time [seconds]
Ave
rage
Hea
t Rel
ease
Rat
e pr
. uni
t tim
e [W
/s]
F2
File No. DZ67550f
2003-12-18
Enclosure 4
400 600 800 1000 1200 1400 16000
1000
2000
3000
4000
5000
6000
7000
8000
9000
FIGRA-values
Time [seconds]
Ave
rage
Hea
t Rel
ease
rate
pr.
unit
time
[W/s
]
FIGRA0,4MJ
F2
0 200 400 600 800 1000 1200 1400 1600 18000
2
4
6
8
10
12
14
16
18Smoke Production Rate SPRav(t)
Time [seconds]
Smok
e Pr
oduc
tion
Rat
e [m
2 /s]
F2
File No. DZ67550f
2003-12-18
Enclosure 5
0 200 400 600 800 1000 1200 1400 1600 18000
500
1000
1500
2000
2500
3000 Total Smoke Production TSP(t)
Time [seconds]
Tota
l Sm
oke
Prod
uctio
n [m
2 ]
F2
0 500 1000 15000
500
1000
1500
2000
2500
3000Smoke Production Rate pr. unit time [10000*SPRav(t)/(t-300)