Page 1
©2003 Thomson/South-Western 1
Chapter 16 –Chapter 16 –
Time Series Time Series Analysis and Analysis and Index NumbersIndex Numbers
Slides prepared by Jeff Heyl, Lincoln UniversitySlides prepared by Jeff Heyl, Lincoln University©2003 South-Western/Thomson Learning™
Introduction toIntroduction to Business StatisticsBusiness Statistics, 6e, 6eKvanli, Pavur, KeelingKvanli, Pavur, Keeling
Page 2
©2003 Thomson/South-Western 2
Times Series AnalysisTimes Series Analysis
Time series represents a variable Time series represents a variable observed across timeobserved across time
Components of a time seriesComponents of a time series
Trend (TR)Trend (TR) Seasonal variation (S)Seasonal variation (S) Cyclical variation (C)Cyclical variation (C) Irregular activity (I)Irregular activity (I)
Page 3
©2003 Thomson/South-Western 3
Trend (TR)Trend (TR)
Linear TrendLinear Trend
TR = TR = bb00 + + bb11tt
Quadratic TrendQuadratic Trend
TR = TR = bb00 + + bb11tt + + bb22tt22
Decaying TrendDecaying Trend
TR = TR = bb00 + + bb11 oror TR = TR = bb00 + + bb11ee-1-111
tt
Page 4
©2003 Thomson/South-Western 4
Power ExamplePower Example
Figure 16.1Figure 16.1
300 300 –
200 200 –
100 100 –Po
wer
co
nsu
mp
tio
n (
mil
lio
n k
wh
)P
ow
er c
on
sum
pti
on
(m
illi
on
kw
h)
|19941994
|19951995
|19961996
|19971997
|19981998
|19991999
|20002000
|20012001
t t (time)(time)|19921992
|19931993
Page 5
©2003 Thomson/South-Western 5
Employees ExampleEmployees Example
Figure 16.2Figure 16.2
11.0 11.0 –
10.0 10.0 –
9.0 9.0 –
8.0 8.0 –
7.0 7.0 –
6.0 6.0 –
5.0 5.0 –
4.0 4.0 –
3.0 3.0 –
2.0 2.0 –
1.0 1.0 –
Nu
mb
er o
f em
plo
yees
(th
ou
san
ds)
Nu
mb
er o
f em
plo
yees
(th
ou
san
ds)
|19941994
|19951995
|19961996
|19971997
|19981998
|19991999
|20002000
|20012001
tt
TrendTrend
Page 6
©2003 Thomson/South-Western 6
Linear TrendsLinear Trends
YYtt
tt
(a) Increasing trend(a) Increasing trend
YYtt
tt
(b) decreasing trend(b) decreasing trend
Figure 16.3Figure 16.3
Page 7
©2003 Thomson/South-Western 7
Curvilinear ModelsCurvilinear Models
Figure 16.4Figure 16.4
YYtt
ttbb22 < 0 < 0
(a)(a)
YYtt
ttbb22< 0< 0
(b)(b)
Page 8
©2003 Thomson/South-Western 8
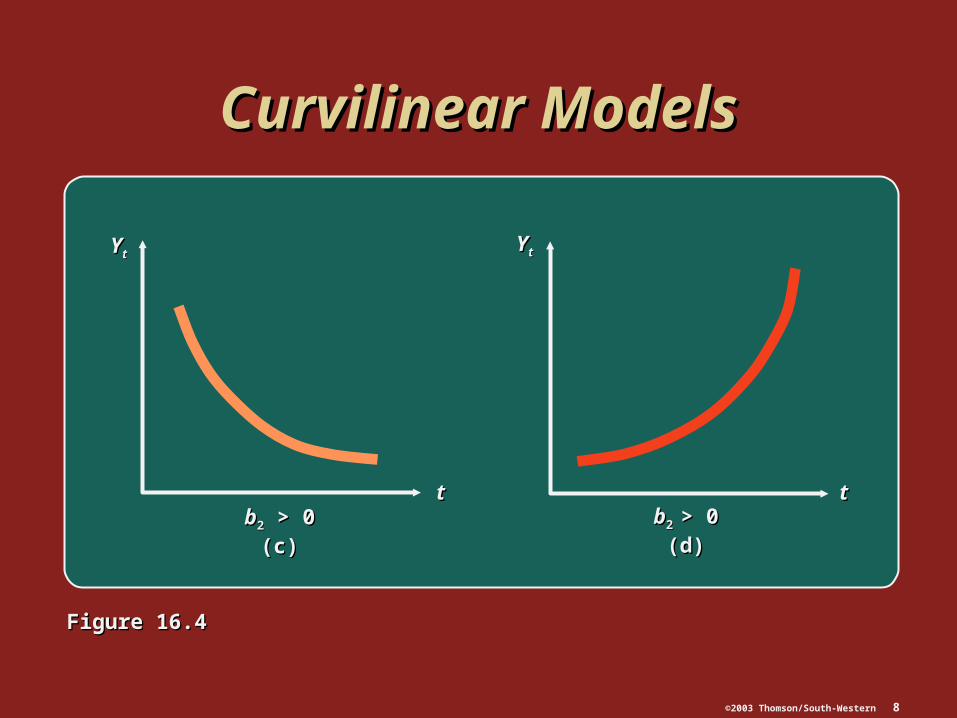
Curvilinear ModelsCurvilinear Models
Figure 16.4Figure 16.4
YYtt
ttbb22 > 0 > 0
(c)(c)
YYtt
ttbb2 2 > 0> 0
(d)(d)
Page 9
©2003 Thomson/South-Western 9
Seasonality (S)Seasonality (S)
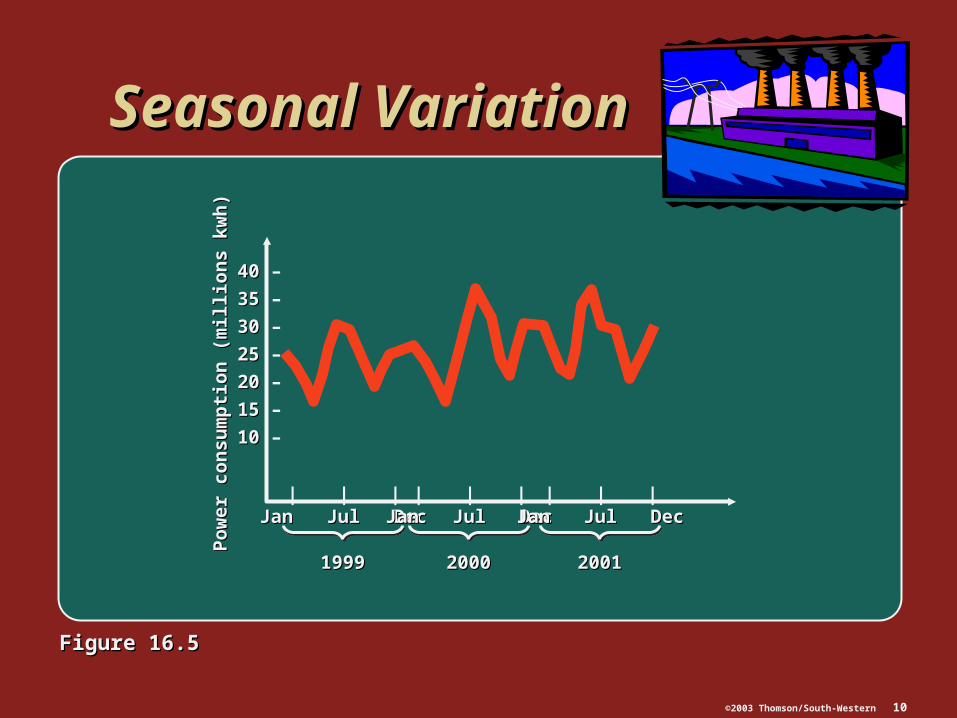
Seasonal variation refers to periodic Seasonal variation refers to periodic increases or decreases that occur within increases or decreases that occur within a calendar year in a time series. The key a calendar year in a time series. The key is that these movements in the time is that these movements in the time series follow the same pattern each yearseries follow the same pattern each year
Page 10
©2003 Thomson/South-Western 10
Seasonal VariationSeasonal Variation
40 40 –
35 35 –
30 30 –
25 25 –
20 20 –
15 15 –
10 10 –
Po
wer
co
nsu
mp
tio
n (
mil
lio
ns
kw
h)
Po
wer
co
nsu
mp
tio
n (
mil
lio
ns
kw
h)
| | | | | | | | |Jan Jul DecJan Jul Dec
19991999
Jan Jul DecJan Jul Dec
20002000
Jan Jul DecJan Jul Dec
20012001
Figure 16.5Figure 16.5
Page 11
©2003 Thomson/South-Western 11
Seasonal VariationSeasonal Variation
Figure 16.6Figure 16.6
4 4 –
3 3 –
2 2 –
1 1 –Sa
les
of
Wil
dc
at
sa
ilb
oa
tsS
ale
s o
f W
ild
ca
t s
ail
bo
ats
(mil
lio
ns
of
do
lla
rs)
(mil
lio
ns
of
do
lla
rs)
|JulyJuly19981998
|JulyJuly19991999
|JulyJuly20002000
|JulyJuly20012001
Linear trendLinear trend
tt
Page 12
©2003 Thomson/South-Western 12
Cyclical Variation (C)Cyclical Variation (C)
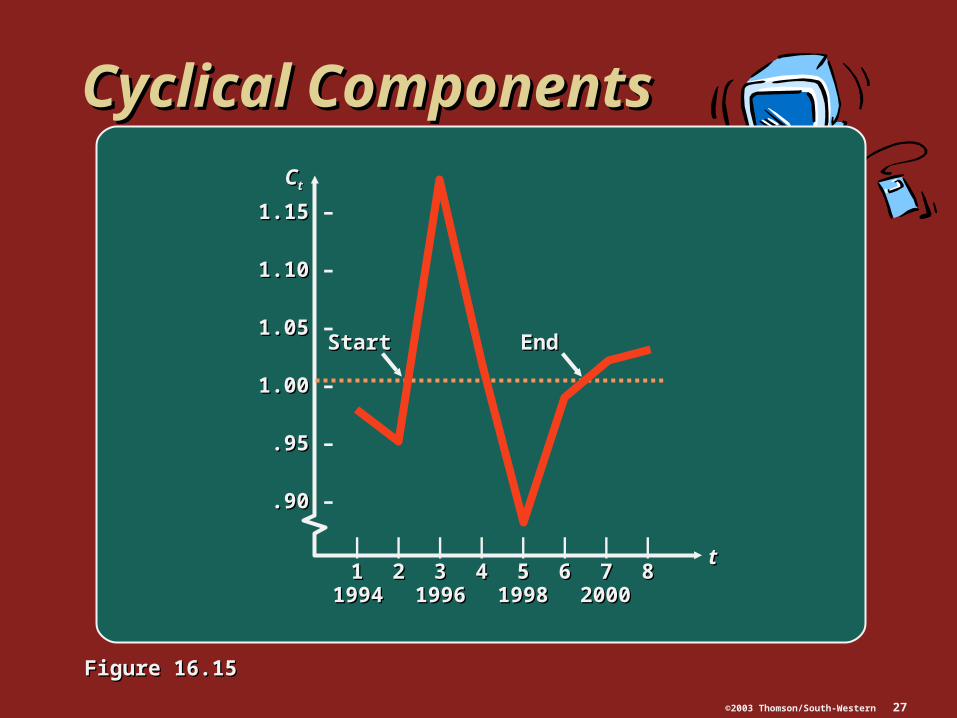
Cyclical variation describes a gradual Cyclical variation describes a gradual cyclical movement about the trend; it is cyclical movement about the trend; it is generally attributable to business and generally attributable to business and economic conditionseconomic conditions
The length of the cycle is the period of The length of the cycle is the period of that cycle and is measured from one that cycle and is measured from one peak to the nextpeak to the next
Page 13
©2003 Thomson/South-Western 13
Cyclical VariationCyclical VariationC
yclic
al a
ctiv
ity
Cyc
lical
act
ivit
y
ZZ11
PP11
VV11
ZZ22PP22
VV22
tt
Figure 16.7Figure 16.7
Page 14
©2003 Thomson/South-Western 14
Textile ExampleTextile Example
4.0 4.0 –
3.5 3.5 –
3.0 3.0 –
2.5 2.5 –
2.0 2.0 –
1.5 1.5 –
1.0 1.0 –
Co
rpo
rate
tax
es
Co
rpo
rate
tax
es
(mil
lio
ns
of
do
llar
s)(m
illi
on
s o
f d
oll
ars)
11 22 33
|19751975
|19851985
|19951995
|20002000
Figure 16.8Figure 16.8
Page 15
©2003 Thomson/South-Western 15
Irregular ActivityIrregular Activity
Irregular activity consists of what is Irregular activity consists of what is “left over” after accounting for the “left over” after accounting for the effect of any trend, seasonality, or effect of any trend, seasonality, or cyclical activitycyclical activity
Page 16
©2003 Thomson/South-Western 16
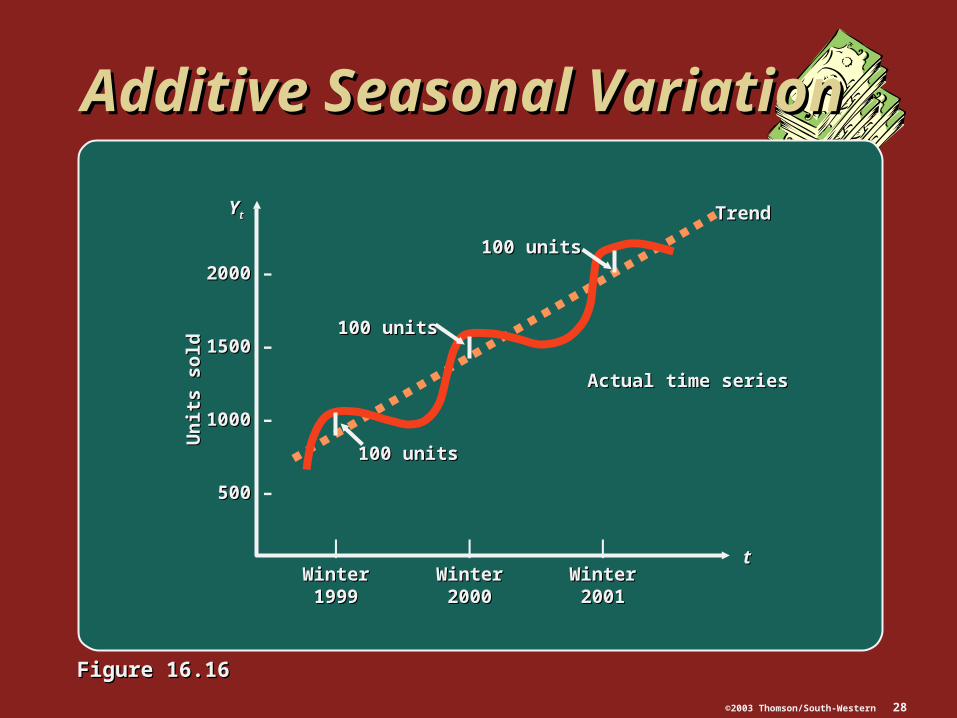
Combining ComponentsCombining Components
Additive StructureAdditive Structure
yytt = TR = TRtt + + SStt + + CCtt + + IItt
Multiplicative StructureMultiplicative Structure
yytt = TR = TRtt • • SStt • • CCtt • • IItt
Page 17
©2003 Thomson/South-Western 17
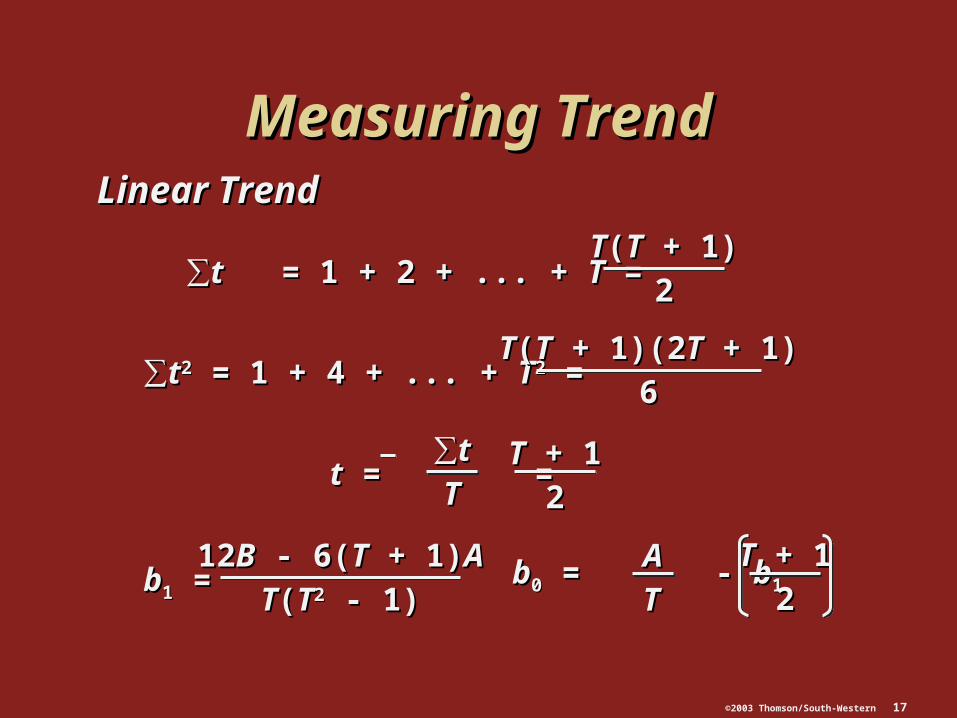
Measuring TrendMeasuring TrendLinear TrendLinear Trend
∑∑tt = 1 + 2 + ... + = 1 + 2 + ... + TT = = TT((TT + 1) + 1)
22
∑∑tt22 = 1 + 4 + ... + = 1 + 4 + ... + TT22 = =TT((TT + 1)(2 + 1)(2TT + 1) + 1)
66
tt = = = =∑∑tt
TTTT + 1 + 1
22
bb11 = =1212BB - 6( - 6(TT + 1) + 1)AA
TT((TT22 - 1) - 1)bb00 = - = - bb11
AA
TTTT + 1 + 1
22
Page 18
©2003 Thomson/South-Western 18
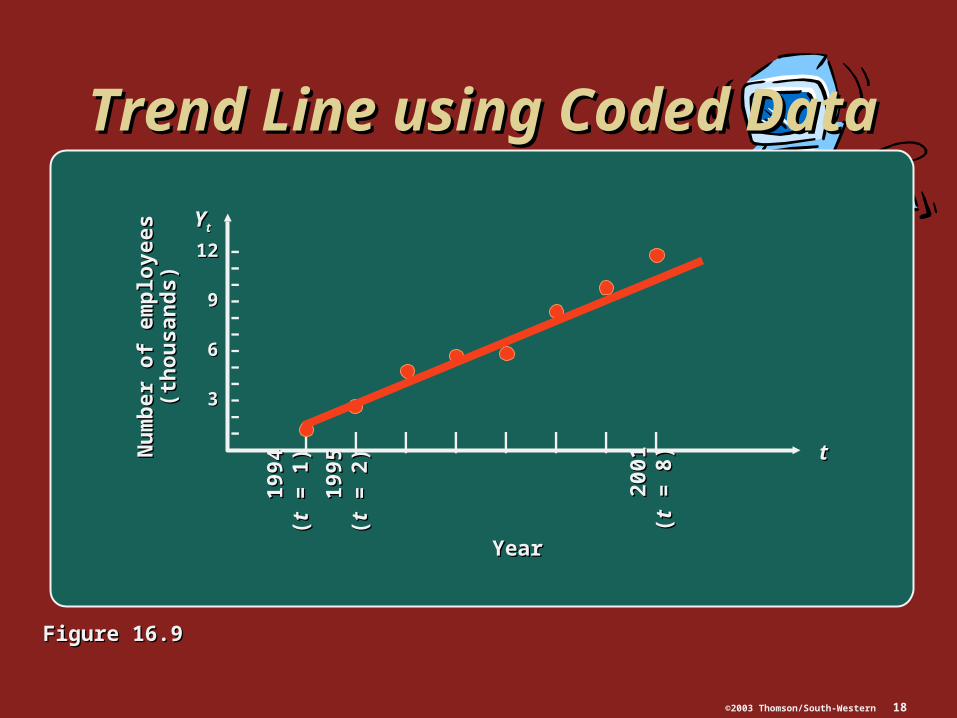
Trend Line using Coded DataTrend Line using Coded Data
12 12 –––
9 9 –––
6 6 –––
3 3 –––– | | | | | | | |
1994
1994
(( tt =
1)
= 1
)
1995
1995
(( tt =
2)
= 2
)
YearYear
2001
2001
(( tt =
8)
= 8
)
Nu
mb
er o
f em
plo
yees
Nu
mb
er o
f em
plo
yees
(th
ou
san
ds)
(th
ou
san
ds)
YYtt
tt
Figure 16.9Figure 16.9
Page 19
©2003 Thomson/South-Western 19
Trend Line using Coded DataTrend Line using Coded Data
12 12 –––
9 9 –––
6 6 –––
3 3 –––– | | | | | | | |
1994
1994
(( tt =
1)
= 1
)
1995
1995
(( tt =
2)
= 2
)
YearYear
2001
2001
(( tt =
8)
= 8
)
Nu
mb
er o
f em
plo
yees
Nu
mb
er o
f em
plo
yees
(th
ou
san
ds)
(th
ou
san
ds)
YYtt
tt
Figure 16.9Figure 16.9
yt = TRt = b0 + b1t
Page 20
©2003 Thomson/South-Western 20
Excel SolutionExcel Solution
Figure 16.10Figure 16.10
Page 21
©2003 Thomson/South-Western 21
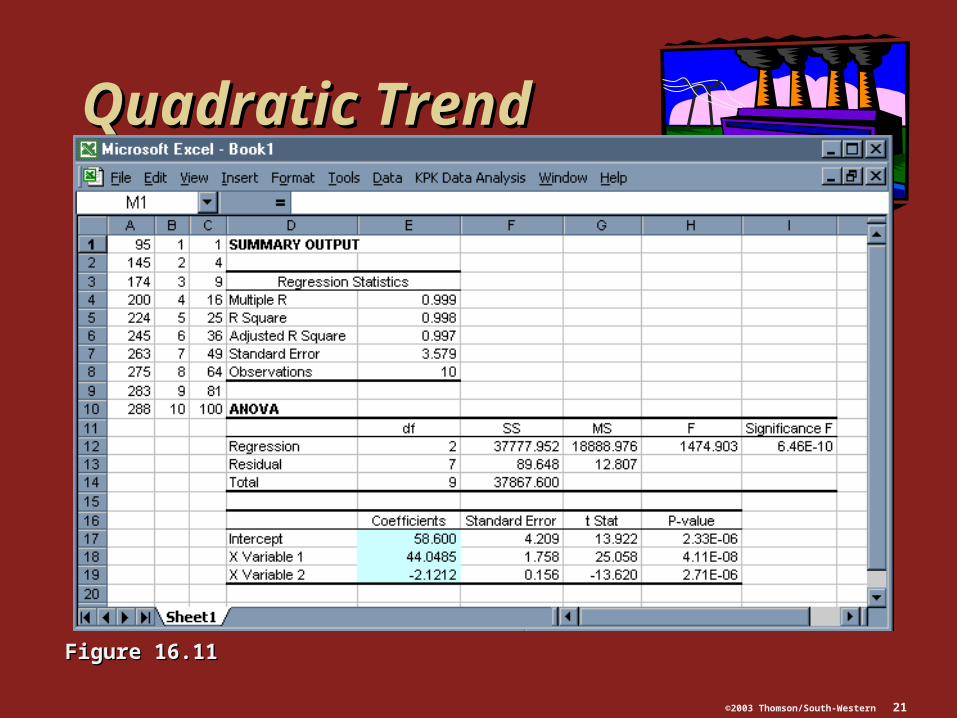
Quadratic TrendQuadratic Trend
Figure 16.11Figure 16.11
Page 22
©2003 Thomson/South-Western 22
Illustration of Quadratic Illustration of Quadratic Trend LinesTrend Lines
YYtt
Time (Time (tt))
tt = - = -bb11
22bb22
YYtt
Time (Time (tt))
tt = - = -bb11
22bb22
AA BB
Figure 16.12Figure 16.12
Page 23
©2003 Thomson/South-Western 23
Measuring Cyclical ActivityMeasuring Cyclical Activity
yytt = TR = TRtt • • CCtt • • IItt
CCtt yytt
yytt
^̂
Page 24
©2003 Thomson/South-Western 24
Complete CycleComplete Cycle
YYtt
1 complete cycle1 complete cycle
TrendTrend
CCtt > 1 > 1
CCtt < 1 < 1
TimeTime
Figure 16.13Figure 16.13
Page 25
©2003 Thomson/South-Western 25
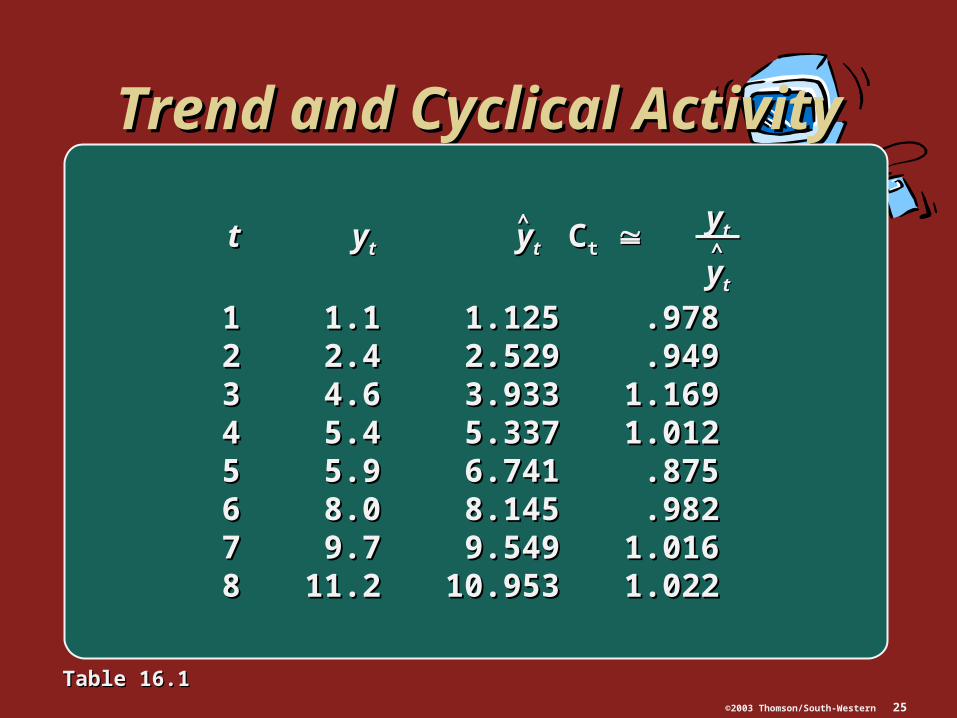
Trend and Cyclical ActivityTrend and Cyclical Activity
tt yyt t yyt t CCtt
11 1.11.1 1.1251.125 .978.97822 2.42.4 2.5292.529 .949.94933 4.64.6 3.9333.933 1.1691.16944 5.45.4 5.3375.337 1.0121.01255 5.95.9 6.7416.741 .875.87566 8.08.0 8.1458.145 .982.98277 9.79.7 9.5499.549 1.0161.01688 11.211.2 10.95310.953 1.0221.022
yytt
yytt
^̂^̂
Table 16.1Table 16.1
Page 26
©2003 Thomson/South-Western 26
Cyclical ActivityCyclical Activity
11.0 11.0 –
10.0 10.0 –
9.0 9.0 –
8.0 8.0 –
7.0 7.0 –
6.0 6.0 –
5.0 5.0 –
4.0 4.0 –
3.0 3.0 –
2.0 2.0 –
1.0 1.0 –
Nu
mb
er o
f em
plo
yees
(th
ou
san
ds)
Nu
mb
er o
f em
plo
yees
(th
ou
san
ds)
|19941994
|19951995
|19961996
|19971997
|19981998
|19991999
|20002000
|20012001
tt
yytt = = -.279 + 1.404-.279 + 1.404tt
(trend line)(trend line)
Actual Actual yytt
YYtt
Figure 16.14Figure 16.14
Page 27
©2003 Thomson/South-Western 27
Cyclical ComponentsCyclical Components
1.15 1.15 –
1.10 1.10 –
1.05 1.05 –
1.00 1.00 –
.95 .95 –
.90 .90 –
StartStart EndEnd
CCtt
tt|11
|22
|33
|44
|55
|66
|77
|88
19941994 19961996 19981998 20002000
Figure 16.15Figure 16.15
Page 28
©2003 Thomson/South-Western 28
Additive Seasonal VariationAdditive Seasonal Variation
100 units100 units
100 units100 units
100 units100 units
TrendTrend
Actual time seriesActual time series
|
WinterWinter19991999
|
WinterWinter20002000
|
WinterWinter20012001
tt
YYtt
2000 2000 –
1500 1500 –
1000 1000 –
500 500 –
Un
its
sold
Un
its
sold
Figure 16.16Figure 16.16
Page 29
©2003 Thomson/South-Western 29
Jetski SalesJetski Sales
700 700 –
600 600 –
500 500 –
400 400 –
300 300 –
200 200 –
100 100 –Sal
es (
ten
s o
f th
ou
san
ds
of
do
llar
s)S
ales
(te
ns
of
tho
usa
nd
s o
f d
oll
ars)
YYtt
TRTRtt = 100 + 20 = 100 + 20tt
Estimated sales Estimated sales using trend and using trend and seasonalityseasonality
tt|
11|
22|
33|
44|
55|
66|
77|
88|
99|
1010|
1111|
1212|
1313|
1414|
1515|
1616|
1717|
1818|
1919|
2020
Figure 16.17Figure 16.17
Page 30
©2003 Thomson/South-Western 30
Heat Pump SalesHeat Pump Sales
Figure 16.18Figure 16.18
100 units100 units
250 units250 units
180 units180 units
TrendTrend
Actual time seriesActual time series
|
WinterWinter19991999
|
WinterWinter20002000
|
WinterWinter20012001
tt
YYtt
2000 2000 –
1500 1500 –
1000 1000 –
500 500 –
Un
its
sold
Un
its
sold
Page 31
©2003 Thomson/South-Western 31
Jetski Sales - Jetski Sales - Multiplicative Season VariationMultiplicative Season Variation
Figure 16.19Figure 16.19
700 700 –
600 600 –
500 500 –
400 400 –
300 300 –
200 200 –
100 100 –Sal
es (
ten
s o
f th
ou
san
ds
of
do
llar
s)S
ales
(te
ns
of
tho
usa
nd
s o
f d
oll
ars)
YYtt
TRTRtt = 100 + 20 = 100 + 20tt
Estimated sales Estimated sales using trend and using trend and seasonalityseasonality
tt|
11|
22|
33|
44|
55|
66|
77|
88|
99|
1010|
1111|
1212|
1313|
1414|
1515|
1616|
1717|
1818|
1919|
2020
Page 32
©2003 Thomson/South-Western 32
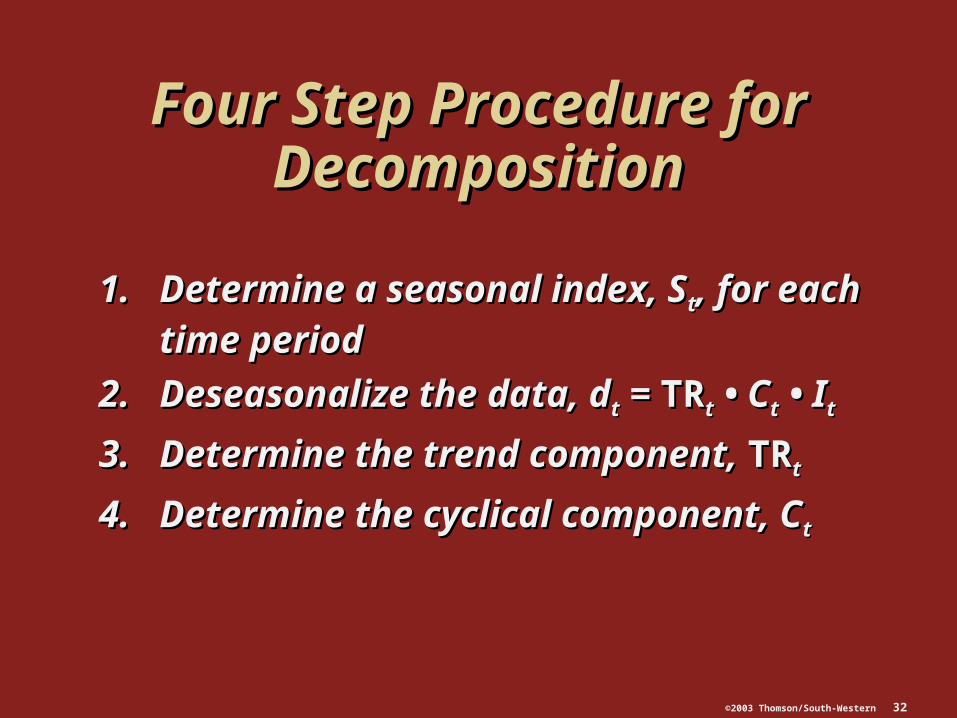
Four Step Procedure for Four Step Procedure for DecompositionDecomposition
1.1. Determine a seasonal index, SDetermine a seasonal index, Stt, for each , for each
time periodtime period
2.2. Deseasonalize the data, dDeseasonalize the data, dtt = = TRTRtt • C • Ctt • I • Itt
3.3. Determine the trend component, Determine the trend component, TRTRtt
4.4. Determine the cyclical component, CDetermine the cyclical component, Ctt
Page 33
©2003 Thomson/South-Western 33
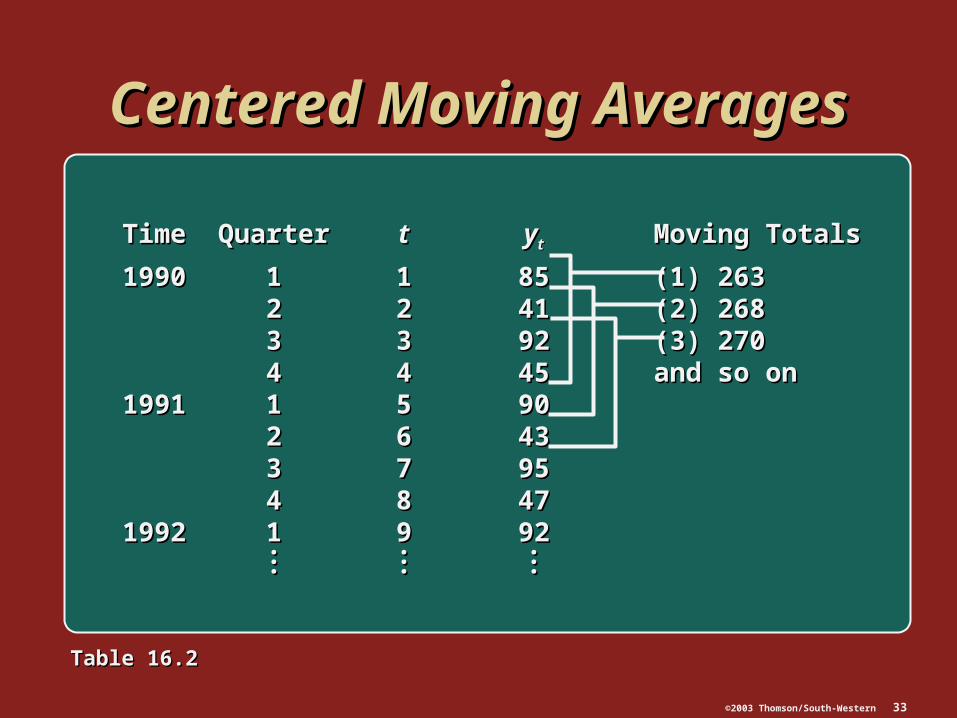
Centered Moving AveragesCentered Moving Averages
TimeTime QuarterQuarter tt yytt Moving TotalsMoving Totals
19901990 11 11 8585 (1) 263(1) 26322 22 4141 (2) 268(2) 26833 33 9292 (3) 270(3) 27044 44 4545 and so onand so on
19911991 11 55 909022 66 434333 77 959544 88 4747
19921992 11 99 9292.. .. .... .. .... .. ..
Table 16.2Table 16.2
Page 34
©2003 Thomson/South-Western 34
Sales Data for Video-CompSales Data for Video-Comp
YearYear Quarter 1Quarter 1 Quarter 2Quarter 2 Quarter 3Quarter 3 Quarter 4Quarter 4
19981998 2020 1212 4747 606019991999 4040 3232 6565 767620002000 5656 5050 8585 10010020012001 7575 7070 101101 123123
Table 16.3Table 16.3
Page 35
©2003 Thomson/South-Western 35
Moving Averages for Video-CompMoving Averages for Video-CompCenteredCentered Ratio toRatio to
MovingMoving MovingMoving MovingMovingYearYear QuarterQuarter tt yytt TotalTotal AverageAverage AverageAverage
19981998 11 11 2020 —— ——22 22 1212 —— —— ——33 33 4747 139139 37.2537.25 1.261.2644 44 6060 159159 42.2542.25 1.421.42
19991999 11 55 4040 179179 47.0047.00 .85.8522 66 3232 197197 51.2551.25 .62.6233 77 6565 213213 55.2555.25 1.181.1844 88 7676 229229 59.2059.20 1.281.28
20002000 11 99 5656 247247 64.2564.25 .87.8722 1010 5050 267267 69.7569.75 .72.7233 1111 8585 291291 75.1375.13 1.131.1344 1212 100100 310310 80.0080.00 1.251.25
20012001 11 1313 7575 330330 84.5084.50 .89.8922 1414 7070 346346 89.3889.38 .78.7833 1515 101101 369369 —— ——44 1616 123123 —— —— ——
Table 16.3Table 16.3
Page 36
©2003 Thomson/South-Western 36
Smoothing a Time SeriesSmoothing a Time Series
120 120 –
100 100 –
80 80 –
60 60 –
40 40 –
20 20 –Sal
es (
nu
mb
er o
f u
nit
s)S
ales
(n
um
ber
of
un
its)
Moving averages Moving averages (no seasonality)(no seasonality)
|
11|
22|
33|
4419981998
|
11|
22|
33|
4419991999
|
11|
22|
33|
4420002000
|
11|
22|
33|
4420012001
tt
YYtt
Quarters by yearQuarters by year
Figure 16.20Figure 16.20
Page 37
©2003 Thomson/South-Western 37
Ratios for Each QuarterRatios for Each Quarter
Quarter 1Quarter 1 Quarter 2Quarter 2 Quarter 3Quarter 3 Quarter 4Quarter 4
1.261.26 1.421.42.85.85 .62.62 1.181.18 1.281.28.87.87 .72.72 1.131.13 1.251.25.89.89 .78.78
TotalTotal 2.612.61 2.122.12 3.573.57 3.953.95AverageAverage 0.8700.870 0.7070.707 1.1901.190 1.3171.317
—— ——
—— ——
Table 16.5Table 16.5
Page 38
©2003 Thomson/South-Western 38
DeseasonalizedDeseasonalizedValuesValues
SeasonalSeasonalYearYear tt YYtt Index (Index (SStt)) ddtt = — = —
YYtt
SStt
19981998 11 2020 .852.852 23.4723.4722 1212 .692.692 17.3417.3433 4747 1.1661.166 40.3140.3144 6060 1.2901.290 46.5146.51
19991999 11 4040 .852.852 46.9546.9522 3232 .692.692 46.2446.2433 6565 1.1661.166 55.7555.7544 7676 1.2901.290 58.9158.91
20002000 11 5656 .852.852 65.7365.7322 5050 .692.692 72.2572.2533 8585 1.1661.166 72.9072.9044 100100 1.2901.290 77.5277.52
20012001 11 7575 .852.852 88.0388.0322 7070 .692.692 101.16101.1633 101101 1.1661.166 86.6286.6244 123123 1.2901.290 95.3595.35
Deseasonalizing Deseasonalizing DataData
Table 16.6Table 16.6
Page 39
©2003 Thomson/South-Western 39
Total U.S. Retail TradeTotal U.S. Retail Trade
19971997 19981998 19991999 20002000JanJan 134.738134.738 139.935139.935 146.613146.613 158.691158.691FebFeb 130.255130.255 135.538135.538 145.121145.121 164.725164.725MarMar 148.497148.497 151.118151.118 165.736165.736 183.875183.875AprApr 145.703145.703 155.820155.820 166.011166.011 178.776178.776MayMay 156.603156.603 162.797162.797 173.496173.496 190.753190.753JunJun 150.915150.915 159.701159.701 171.286171.286 187.868187.868JulJul 153.200153.200 161.541161.541 172.364172.364 182.891182.891AugAug 156.782156.782 162.369162.369 174.788174.788 191.647191.647SepSep 149.407149.407 155.747155.747 169.809169.809 183.229183.229OctOct 157.523157.523 164.528164.528 174.740174.740 186.550186.550NovNov 161.925161.925 169.914169.914 185.347185.347 198.706198.706DecDec 203.117203.117 215.590215.590 238.452238.452 243.255243.255
Table 16.7Table 16.7
Page 40
©2003 Thomson/South-Western 40
Summary of RatiosSummary of Ratios
Month (Period)Month (Period)
JanJan FebFeb MarMar AprApr MayMay JunJun JulJul AugAug SepSep OctOct NovNov DecDec
19971997 0.9930.993 1.0131.013 0.9640.964 1.0131.013 1.0361.036 1.2951.29519981998 0.8880.888 0.8570.857 0.9520.952 0.9790.979 1.0181.018 0.9940.994 1.0001.000 1.0011.001 0.9540.954 1.0021.002 1.0291.029 1.2991.29919991999 0.8780.878 0.8640.864 0.9810.981 0.9760.976 1.0141.014 0.9920.992 0.9900.990 0.9960.996 0.9590.959 0.9800.980 1.0321.032 1.3171.31720002000 0.8710.871 0.8990.899 0.9960.996 0.9630.963 1.0221.022 1.0031.003AverageAverage 0.8790.879 0.8370.837 0.9770.977 0.9730.973 1.0181.018 0.9960.996 0.9940.994 1.0041.004 0.9590.959 0.9980.998 1.0331.033 1.3041.304
Table 16.9Table 16.9
Page 41
©2003 Thomson/South-Western 41
Deseasonalized DataDeseasonalized Data
••••••••••••
•••••••••• ••••••••••••••••••
••
•••• ••••••••••
••••••
•••••••• ••
••••••••••
•• ••••••••••
200 200 –
190 190 –
180 180 –
170 170 –
160 160 –
150 150 –
140 140 –|
00|
1010|
2020|
3030|
4040|
5050
Time (Time (tt))
Des
easo
nal
ized
Val
ues
(D
esea
son
aliz
ed V
alu
es (
ddtt))
Figure 16.21Figure 16.21
Page 42
©2003 Thomson/South-Western 42
Cyclical ComponentsCyclical Components
11 153.349153.349 146.470 - .934(1) = 146.979146.470 - .934(1) = 146.979 1.04331.0433 ——22 149.238149.238 146.470 - .934(2) = 147.913146.470 - .934(2) = 147.913 1.00901.0090 1.0251.02533 152.165152.165 146.470 + .934(3) = 148.847146.470 + .934(3) = 148.847 1.02231.0223 1.0111.01144 149.871149.871 146.470 + .934(4) = 149.782146.470 + .934(4) = 149.782 1.00061.0006 1.0151.01555 153.899153.899 146.470 + .934(5) = 150.716146.470 + .934(5) = 150.716 1.02111.0211 1.0071.00766 151.602151.602 146.470 + .934(6) = 151.650146.470 + .934(6) = 151.650 0.99970.9997 1.0101.010.. .. .. .. .... .. .. .. .... .. .. .. ..
tt ddtt ddtt —(= —(= CCtt • • IItt))ddtt
ddtt
^̂^̂
3-Month3-MonthMovingMoving
Average (Average (CCtt))
Table 16.12Table 16.12
Page 43
©2003 Thomson/South-Western 43
Plot of Cyclical ActivityPlot of Cyclical Activity
Figure 16.22Figure 16.22
1.03 1.03 –
1.02 1.02 –
1.01 1.01 –
1.00 1.00 –
0.99 0.99 –
0.98 0.98 –
0.97 0.97 –|
00|
1010|
2020|
3030|
4040|
5050
Cyc
lical
Co
mp
on
ents
Cyc
lical
Co
mp
on
ents
MonthMonth FebFeb JanJan JanJan JanJanYearYear 19971997 19981998 19991999 20002000
Page 44
©2003 Thomson/South-Western 44
Excel PlotsExcel Plots
Figure 16.23Figure 16.23
Page 45
©2003 Thomson/South-Western 45
Index NumbersIndex Numbers
19851985 19901990 19951995 20002000
WageWage $7.05$7.05 $8.50$8.50 $10.90$10.90 $12.50$12.50
Index (base = 1980)Index (base = 1980) 100100 120.6120.6 154.6154.6 177.3177.3
Table 16.15Table 16.15
Page 46
©2003 Thomson/South-Western 46
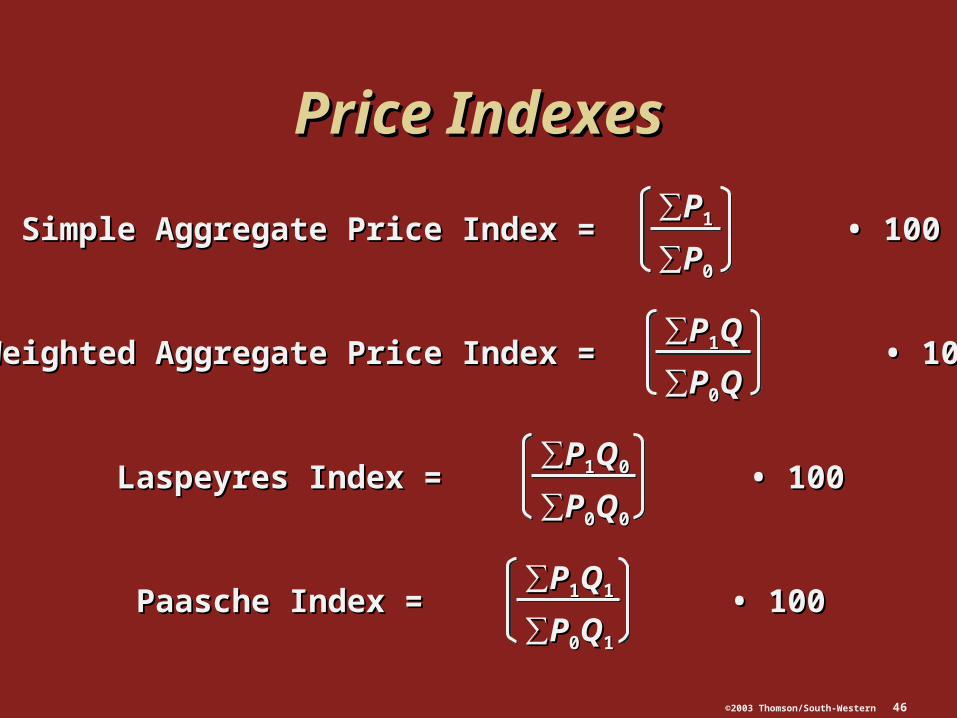
Price IndexesPrice Indexes
Simple Aggregate Price Index = • 100Simple Aggregate Price Index = • 100∑∑PP11
∑∑PP00
Weighted Aggregate Price Index = • 100Weighted Aggregate Price Index = • 100∑∑PP11QQ
∑∑PP00QQ
Laspeyres Index = • 100Laspeyres Index = • 100∑∑PP11QQ00
∑∑PP00QQ00
∑∑PP11QQ11
∑∑PP00QQ11
Paasche Index = • 100Paasche Index = • 100
Page 47
©2003 Thomson/South-Western 47
Prices of Four ItemsPrices of Four Items
ItemItem 19901990 20002000
EggsEggs .75 (doz).75 (doz) 1.351.35
ChickenChicken .95 (lb).95 (lb) 1.791.79
CheeseCheese .89 (lb).89 (lb) 1.851.85
Auto batteryAuto battery $31.00 (each)$31.00 (each) $55.00 (each)$55.00 (each)
Table 16.16Table 16.16
LongLifeLongLife