18
Economics of GMO Technologies Joe Lauer University of Wisconsin Lauer, © 1994-2003 University of Wisconsin – Agronomy
Economics of GMO Technologies
Joe LauerUniversity of Wisconsin
Lauer, © 1994-2003University of Wisconsin – Agronomy

O iOverview
• Describe data set used and calculations• Ranking of transgenic hybrids to the trial averageg g y g• Yield and grower return of transgenic corn hybrids
compared to the:compared to the:Trial averageNormal dent corn hybrid averageNormal dent corn hybrid averageSister lines
• Economics matrix• Economics matrix
Lauer, © 1994-2003University of Wisconsin – Agronomy
http://corn.agronomy.wisc.edu/select/Lauer, © 1994-2003
University of Wisconsin – Agronomy
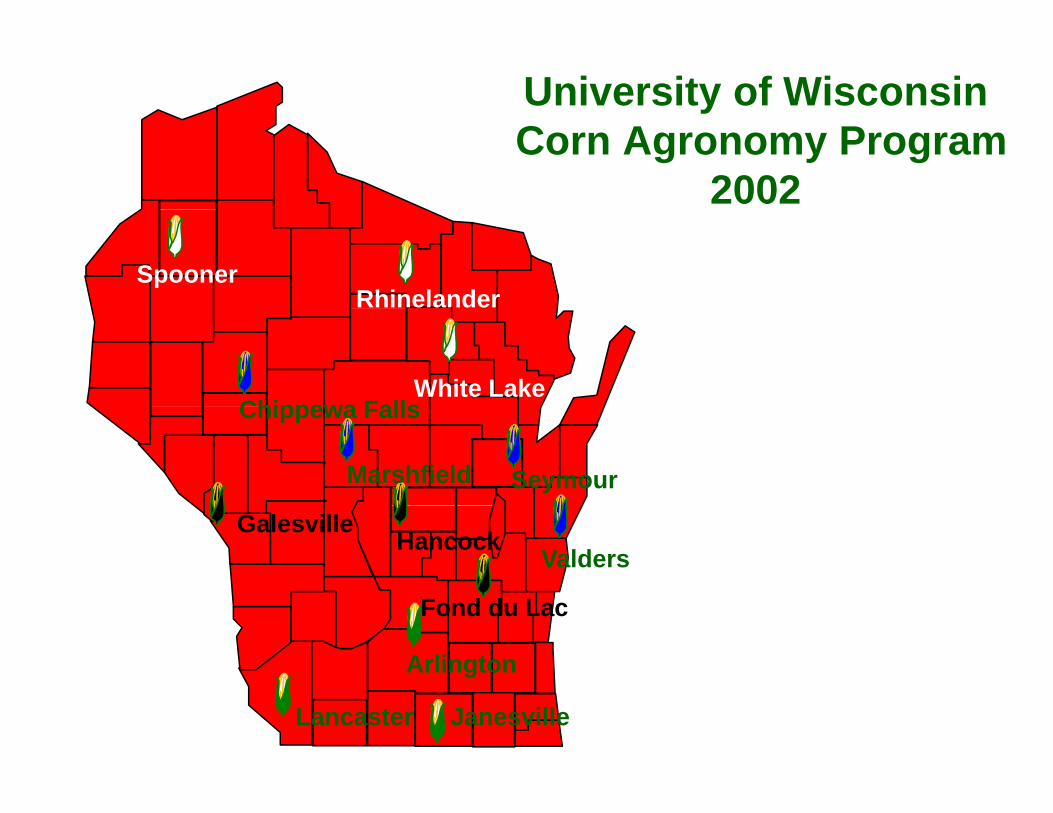
University of WisconsinyCorn Agronomy Program
2002
RhinelanderSpooner
Chippewa FallsWhite Lake
Chippewa Falls
Marshfield Seymour
ValdersHancock
Galesville
Fond du LacFond du Lac
Arlington
JanesvilleLancaster
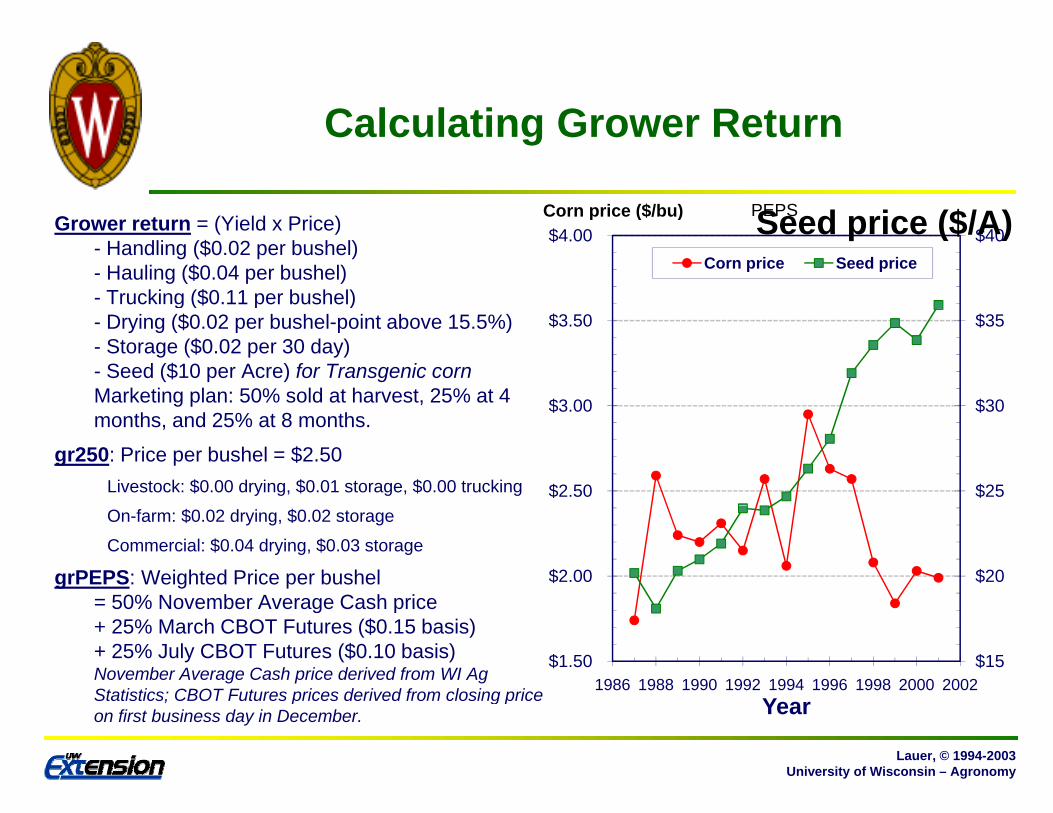
C l l ti G R tCalculating Grower Return
PEPSCorn price ($/bu) S ($/ )Grower return = (Yield x Price) - Handling ($0.02 per bushel) - Hauling ($0.04 per bushel) - Trucking ($0.11 per bushel)
$40 $4.00 Corn price Seed price
PEPSCorn price ($/bu) Seed price ($/A)
g ( p )- Drying ($0.02 per bushel-point above 15.5%) - Storage ($0.02 per 30 day)- Seed ($10 per Acre) for Transgenic cornMarketing plan: 50% sold at harvest, 25% at 4 $30
$35
$3 00
$3.50
months, and 25% at 8 months.
gr250: Price per bushel = $2.50Livestock: $0.00 drying, $0.01 storage, $0.00 trucking $25
$30
$2.50
$3.00
On-farm: $0.02 drying, $0.02 storage
Commercial: $0.04 drying, $0.03 storage
grPEPS: Weighted Price per bushel = 50% November Average Cash price
$20 $2.00 = 50% November Average Cash price + 25% March CBOT Futures ($0.15 basis) + 25% July CBOT Futures ($0.10 basis) November Average Cash price derived from WI Ag Statistics; CBOT Futures prices derived from closing price
$15 $1.50 1986 1988 1990 1992 1994 1996 1998 2000 2002
Year
Lauer, © 1994-2003University of Wisconsin – Agronomy
; p g pon first business day in December. Year

Frequency of Specialty Hybrids YieldingFrequency of Specialty Hybrids Yielding Above Average in the 2002 WI Hybrid Trials
83
100 Frequency above trial average
50
7261
cy (%
)
50 48 47 4439
2937
50
Freq
uenc
29
0
F
00
1998 (n=1611)
1999 (n=1390)
2000 (n=1361)
2001 (n=1266)
2002 (n=949)
Bt (n=420)
Bt,LL (n=58)
Bt,RR (n=104)
IMI (n=7)
LL (n=4)
RR (n=103)
Lauer, © 1994-2003University of Wisconsin – Agronomy
Normal Dent

Frequency of “Bt” Hybrids yielding Above theFrequency of Bt Hybrids yielding Above the Trial Average in the WI Corn Trials
100100
69
55 57 60
70 7265
y (%
)
55 57
50
eque
ncy
Fre
01996 (n=12)1997 (n=52)1998 (n=118)1999 (n=323)2000 (n=321)2001 (n=267)2002 (n=420) Average (n=151
Lauer, © 1994-2003University of Wisconsin – Agronomy
( ) ( ) ( ) ( ) ( ) ( ) ( ) g (

Frequency of “Gene Stack” Hybrids YieldingFrequency of Gene Stack Hybrids Yielding Above the Trial Average in the WI Corn Trials
83 83
100
6761
6671
67 6761 61
cy (%
)
4250
Freq
uenc
F
01998
(n=39)1999
(n=46)2000
(n=72)2001
(n=74)2002
(n=58)Average (n=289)
1999 (n=12)
2000 (n=18)
2001 (n=24)
2002 (n=104)
Average (n=158)
Bt LL Bt RRLauer, © 1994-2003
University of Wisconsin – Agronomy
Bt,LL Bt,RR
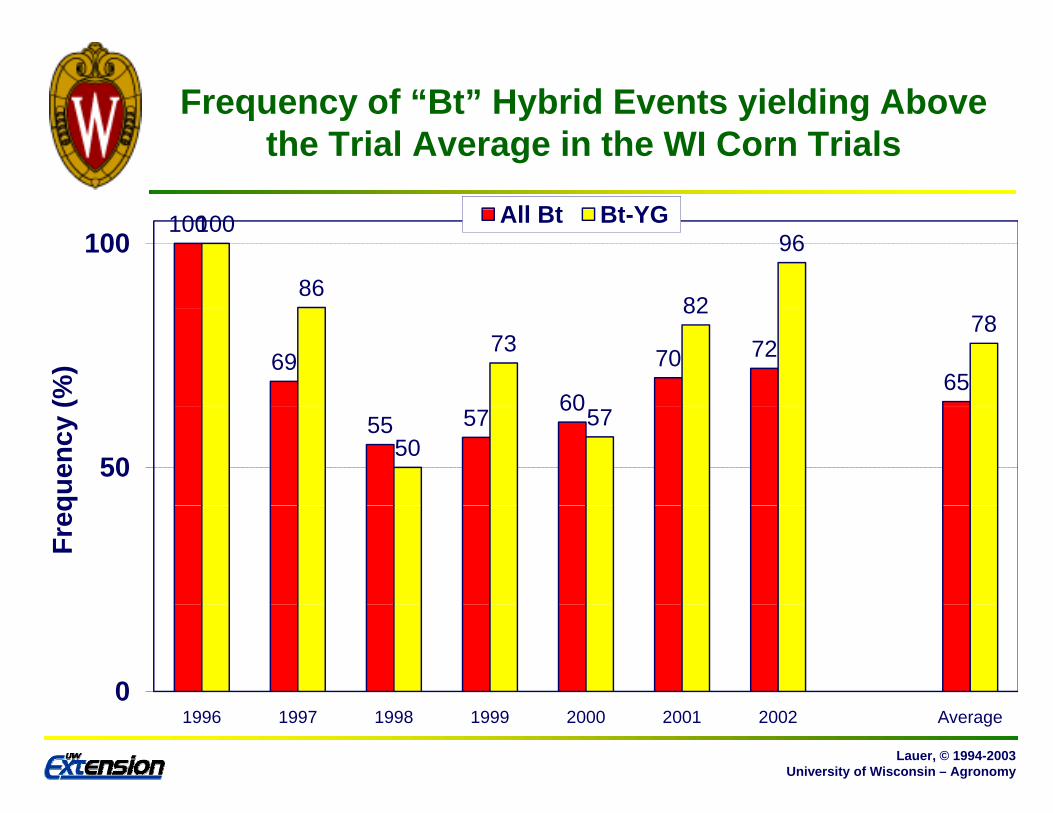
Frequency of “Bt” Hybrid Events yielding AboveFrequency of Bt Hybrid Events yielding Above the Trial Average in the WI Corn Trials
All Bt Bt YG100100
8682
96100All Bt Bt-YG
69
60
70 7265
7382
78
(%)
55 57 60
5057
50
quen
cy
Freq
0
Lauer, © 1994-2003University of Wisconsin – Agronomy
1996 1997 1998 1999 2000 2001 2002 Average

Frequency of “IMI” Hybrids (IT and IR)YieldingFrequency of IMI Hybrids (IT and IR)Yielding Above the Trial Average in the WI Corn Trials
100
62
%)
3947
39 4348
3850
Freq
uenc
y (%
13
25 2530
F
0
13
01992 (n=3)1993 (n=24)1994 (n=28)1995 (n=13)1996 (n=12)1997 (n=15)1998 (n=33)1999 (n=70)2000 (n=21)2001 (n=12)2002 (n=10) Average (n=24
Lauer, © 1994-2003University of Wisconsin – Agronomy
1992 (n 3)1993 (n 24)1994 (n 28)1995 (n 13)1996 (n 12)1997 (n 15)1998 (n 33)1999 (n 70)2000 (n 21)2001 (n 12)2002 (n 10) Average (n 24
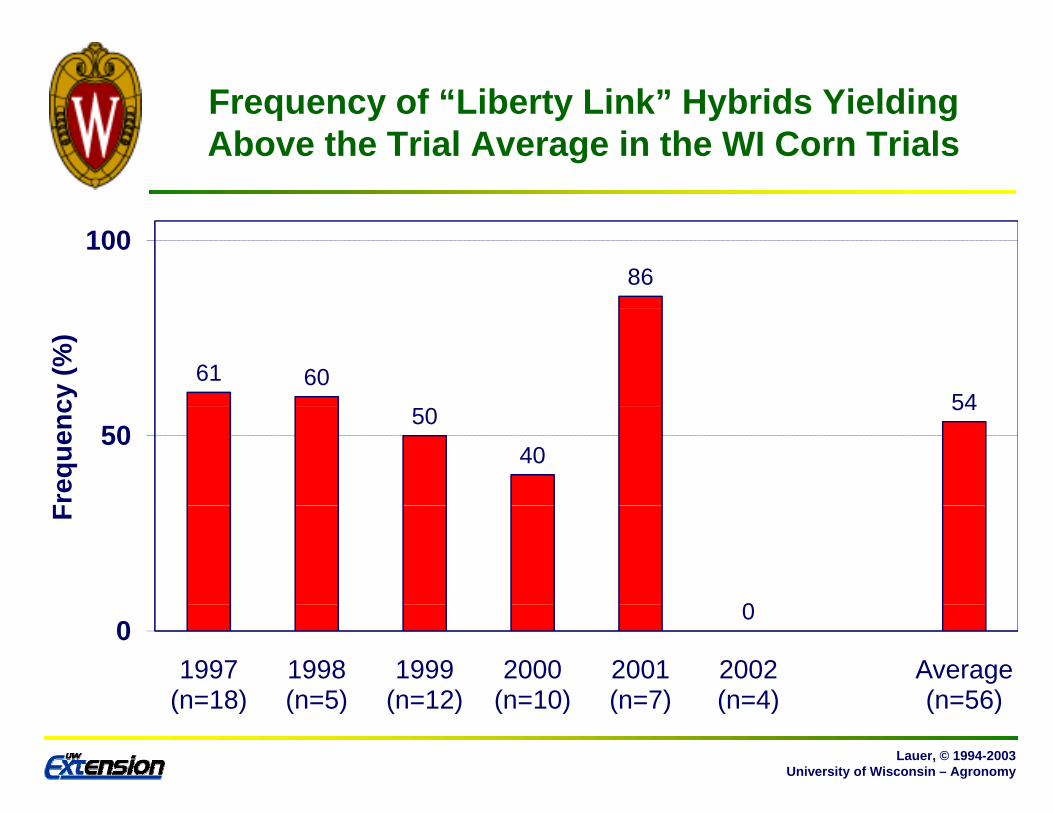
Frequency of “Liberty Link” Hybrids YieldingFrequency of Liberty Link Hybrids Yielding Above the Trial Average in the WI Corn Trials
86100
61 6054cy
(%)
50
40
5450
Freq
uenc
0
F
00
1997 (n=18)
1998 (n=5)
1999 (n=12)
2000 (n=10)
2001 (n=7)
2002 (n=4)
Average (n=56)
Lauer, © 1994-2003University of Wisconsin – Agronomy
(n=18) (n=5) (n=12) (n=10) (n=7) (n=4) (n=56)
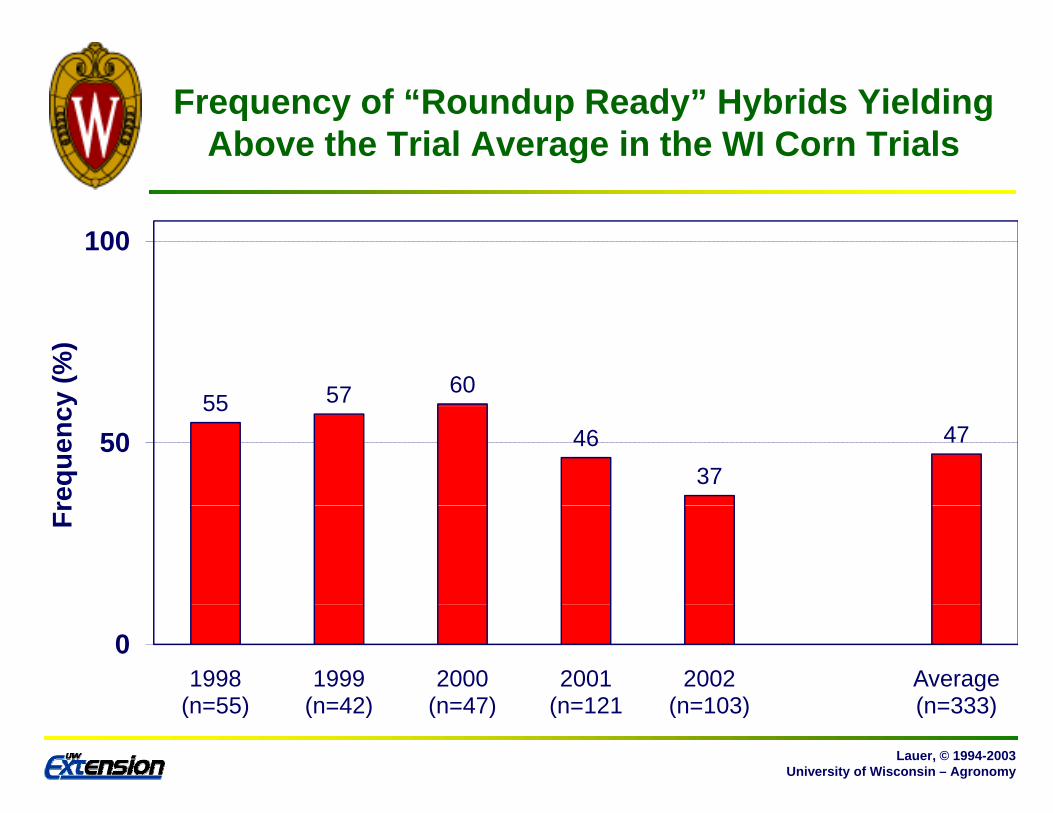
Frequency of “Roundup Ready” Hybrids YieldingFrequency of Roundup Ready Hybrids Yielding Above the Trial Average in the WI Corn Trials
100
55 57 60y (%
)
5546
37
4750
requ
enc
Fr
01998
(n=55)1999
(n=42)2000
(n=47)2001
(n=1212002
(n=103)Average (n=333)
Lauer, © 1994-2003University of Wisconsin – Agronomy
(n=55) (n=42) (n=47) (n=121 (n=103) (n=333)
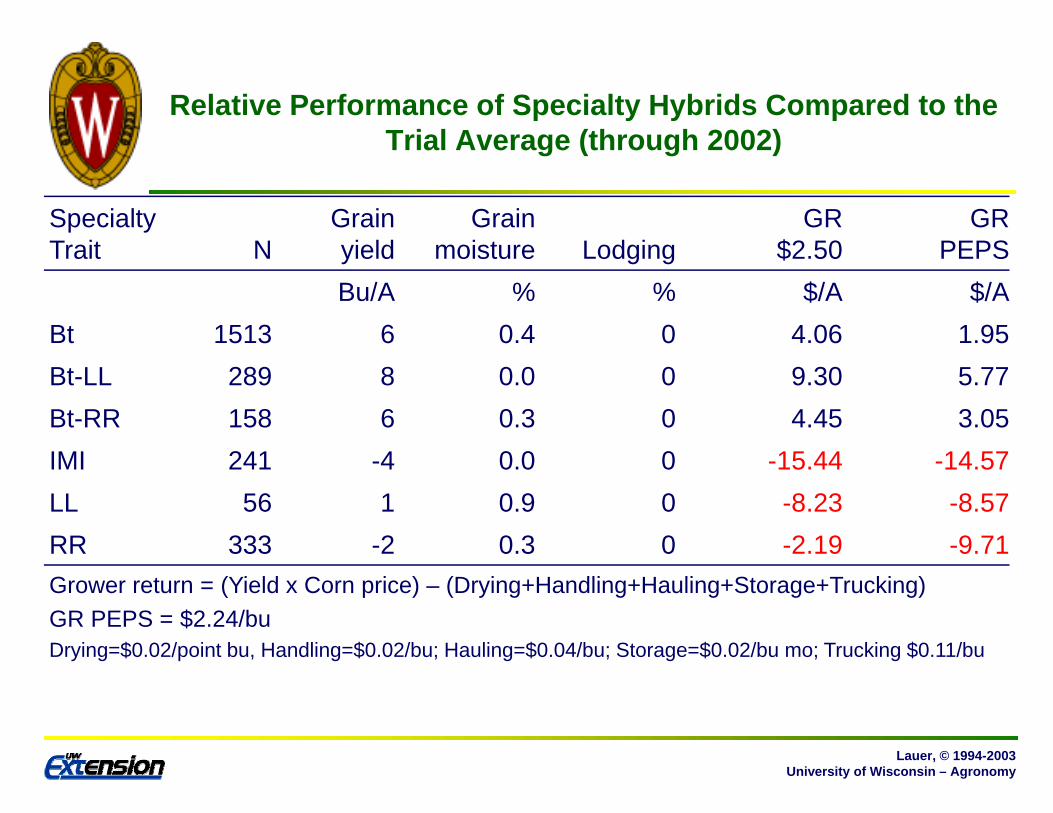
Relative Performance of Specialty Hybrids Compared to theRelative Performance of Specialty Hybrids Compared to the Trial Average (through 2002)
S i lt G i G i GR GRSpecialty Trait N
Grain yield
Grainmoisture Lodging
GR$2.50
GRPEPS
Bu/A % % $/A $/ABt 1513 6 0.4 0 4.06 1.95Bt-LL 289 8 0.0 0 9.30 5.77Bt-RR 158 6 0.3 0 4.45 3.05IMI 241 -4 0.0 0 -15.44 -14.57LL 56 1 0 9 0 -8 23 -8 57LL 56 1 0.9 0 -8.23 -8.57RR 333 -2 0.3 0 -2.19 -9.71Grower return = (Yield x Corn price) – (Drying+Handling+Hauling+Storage+Trucking)GR PEPS = $2.24/buDrying=$0.02/point bu, Handling=$0.02/bu; Hauling=$0.04/bu; Storage=$0.02/bu mo; Trucking $0.11/bu
Lauer, © 1994-2003University of Wisconsin – Agronomy

Relative Performance of Specialty Hybrids Compared to theRelative Performance of Specialty Hybrids Compared to the Average of Normal Corn (through 2002)
S i lt G i G i GR GRSpecialty Trait N
Grain yield
Grainmoisture Lodging
GR$2.50
GRPEPS
Bu/A % % $/A $/ABt 1513 8 0.5 0 4.82 2.03Bt-LL 289 10 0.1 0 9.57 9.81Bt-RR 158 9 0.4 -1 8.16 5.68IMI 241 -3 0.1 0 -16.52 -15.86LL 56 2 1 0 0 -9 64 -10 23LL 56 2 1.0 0 -9.64 -10.23RR 333 0 -0.1 0 -9.09 -9.17Grower return = (Yield x Corn price) – (Drying+Handling+Hauling+Storage+Trucking)GR PEPS = $2.24/buDrying=$0.02/point bu, Handling=$0.02/bu; Hauling=$0.04/bu; Storage=$0.02/bu mo; Trucking $0.11/bu
Lauer, © 1994-2003University of Wisconsin – Agronomy
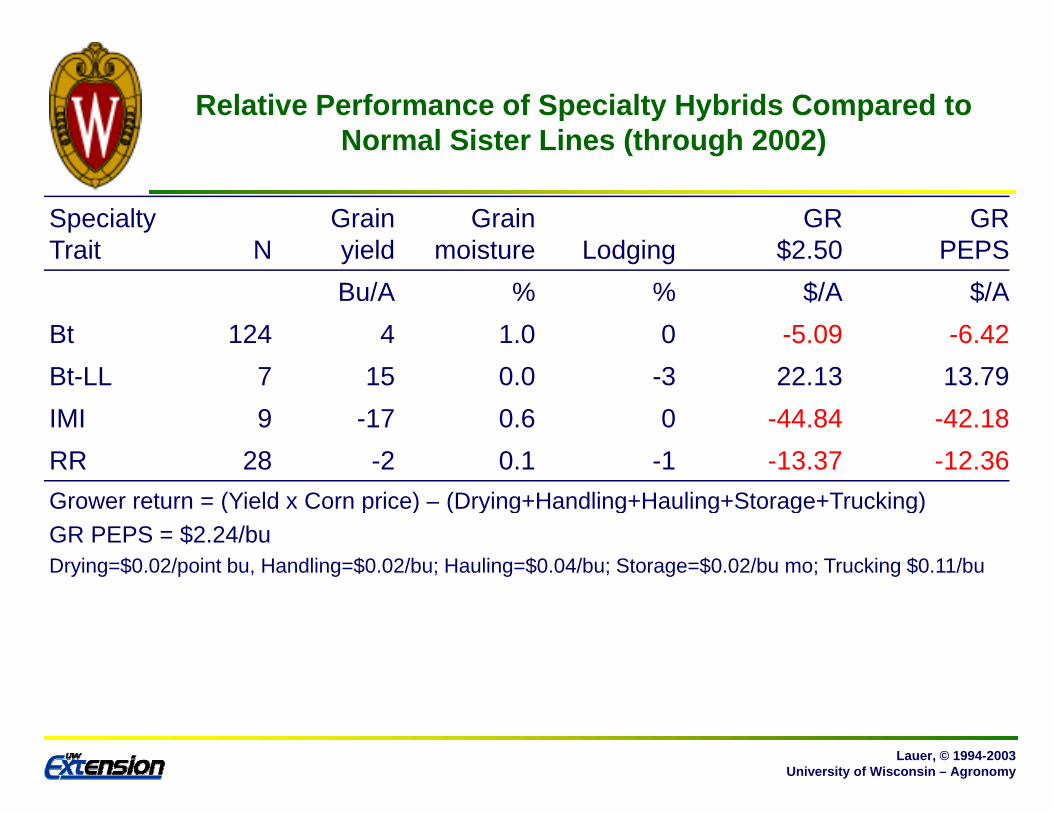
Relative Performance of Specialty Hybrids Compared toRelative Performance of Specialty Hybrids Compared to Normal Sister Lines (through 2002)
S i lt G i G i GR GRSpecialty Trait N
Grain yield
Grainmoisture Lodging
GR$2.50
GRPEPS
Bu/A % % $/A $/ABt 124 4 1.0 0 -5.09 -6.42Bt-LL 7 15 0.0 -3 22.13 13.79IMI 9 -17 0.6 0 -44.84 -42.18RR 28 -2 0.1 -1 -13.37 -12.36Grower return = (Yield x Corn price) – (Drying+Handling+Hauling+Storage+Trucking)Grower return (Yield x Corn price) (Drying+Handling+Hauling+Storage+Trucking)GR PEPS = $2.24/buDrying=$0.02/point bu, Handling=$0.02/bu; Hauling=$0.04/bu; Storage=$0.02/bu mo; Trucking $0.11/bu
Lauer, © 1994-2003University of Wisconsin – Agronomy

Grower return of “Bt” Hybrids Compared toGrower return of Bt Hybrids Compared to Normal Dent Corn Hybrids in the WI Corn Trials
250 PEPS24
22
26gr250 grPEPS
Favors BT18
15
n ($
/A)
9
542er
retu
rn
-2 -2-1-4
0
Gro
we
-9 -8-9 -10-15
Favors Normal
Lauer, © 1994-2003University of Wisconsin – Agronomy
1996 1997 1998 1999 2000 2001 2002 Average
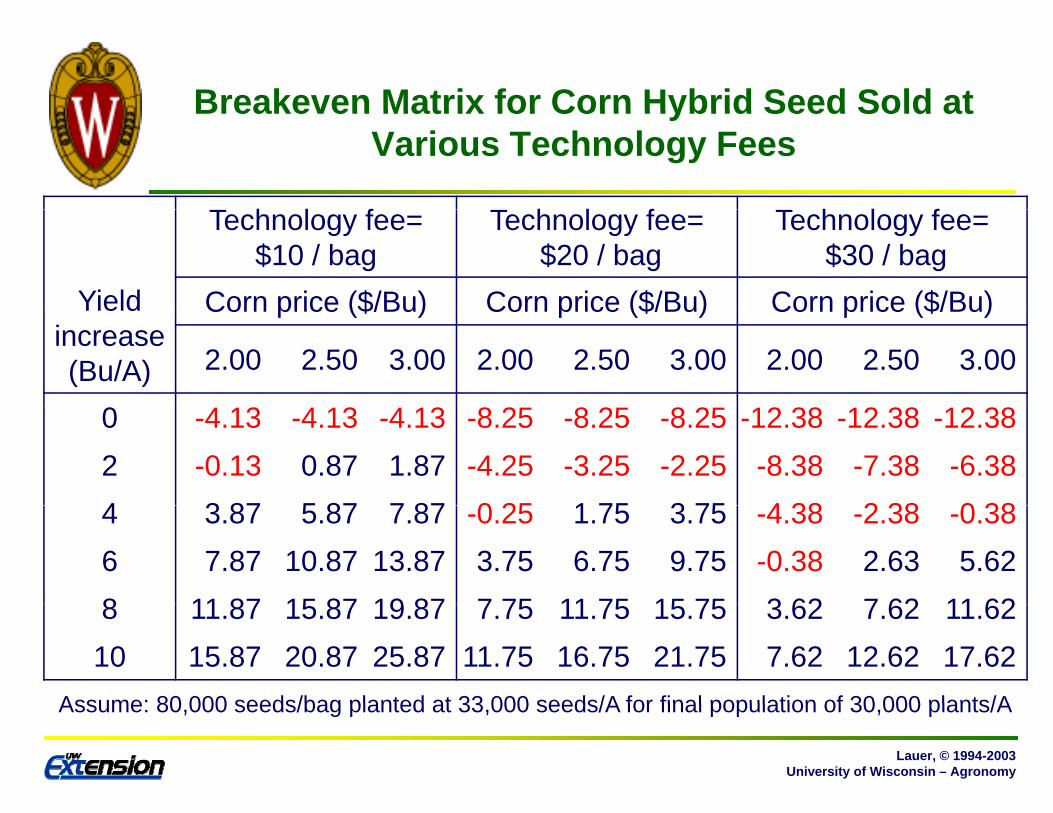
Breakeven Matrix for Corn Hybrid Seed Sold atBreakeven Matrix for Corn Hybrid Seed Sold at Various Technology Fees
T h l f T h l f T h l fTechnology fee= $10 / bag
Technology fee=$20 / bag
Technology fee=$30 / bag
Yield Corn price ($/Bu) Corn price ($/Bu) Corn price ($/Bu)Yield increase (Bu/A)
Corn price ($/Bu) Corn price ($/Bu) Corn price ($/Bu)
2.00 2.50 3.00 2.00 2.50 3.00 2.00 2.50 3.00
0 4 13 4 13 4 13 8 2 8 2 8 2 12 38 12 38 12 380 -4.13 -4.13 -4.13 -8.25 -8.25 -8.25 -12.38 -12.38 -12.382 -0.13 0.87 1.87 -4.25 -3.25 -2.25 -8.38 -7.38 -6.384 3 87 5 87 7 87 0 25 1 75 3 75 4 38 2 38 0 384 3.87 5.87 7.87 -0.25 1.75 3.75 -4.38 -2.38 -0.386 7.87 10.87 13.87 3.75 6.75 9.75 -0.38 2.63 5.628 11 87 15 87 19 87 7 75 11 75 15 75 3 62 7 62 11 628 11.87 15.87 19.87 7.75 11.75 15.75 3.62 7.62 11.6210 15.87 20.87 25.87 11.75 16.75 21.75 7.62 12.62 17.62
Assume: 80 000 seeds/bag planted at 33 000 seeds/A for final population of 30 000 plants/A
Lauer, © 1994-2003University of Wisconsin – Agronomy
Assume: 80,000 seeds/bag planted at 33,000 seeds/A for final population of 30,000 plants/A
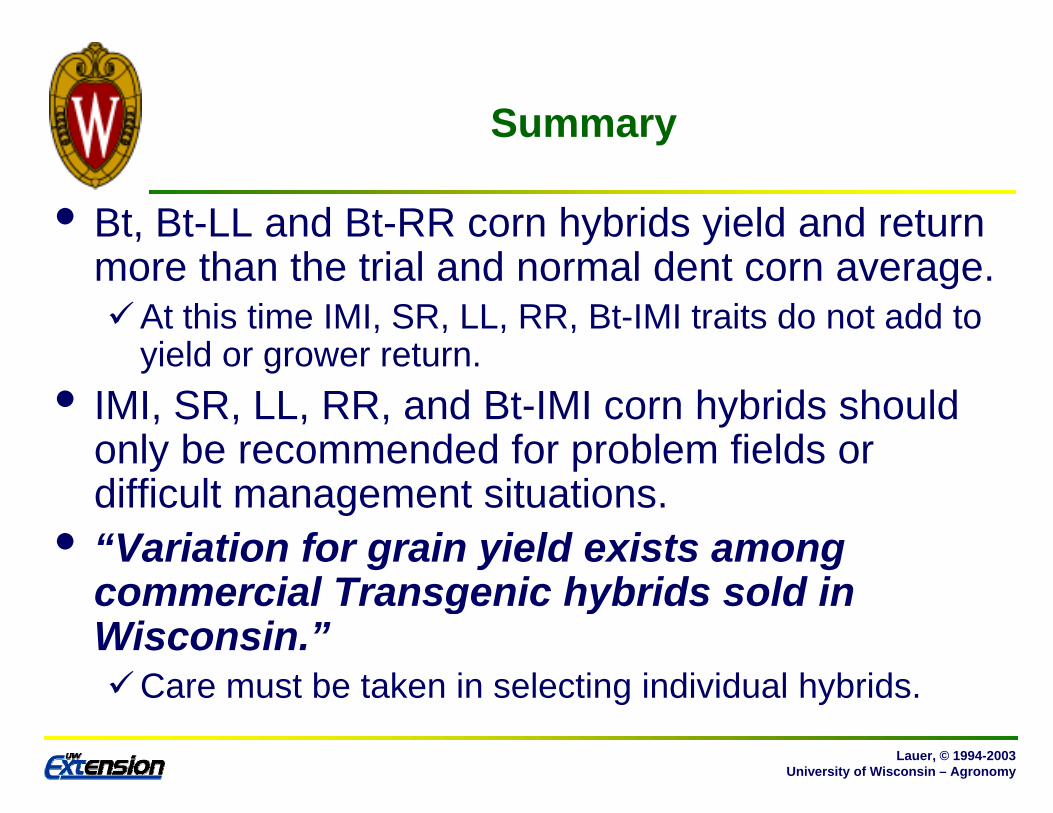
SSummary
• Bt Bt LL d Bt RR h b id i ld d t• Bt, Bt-LL and Bt-RR corn hybrids yield and return more than the trial and normal dent corn average.
At thi ti IMI SR LL RR Bt IMI t it d t dd tAt this time IMI, SR, LL, RR, Bt-IMI traits do not add to yield or grower return.
• IMI SR LL RR and Bt-IMI corn hybrids shouldIMI, SR, LL, RR, and Bt-IMI corn hybrids should only be recommended for problem fields or difficult management situations.difficult management situations.
• “Variation for grain yield exists among commercial Transgenic hybrids sold incommercial Transgenic hybrids sold in Wisconsin.”
Care must be taken in selecting individual hybrids.
Lauer, © 1994-2003University of Wisconsin – Agronomy
g y


