56
Agricultural Drainage Field Day Proceedings of the 2nd Friday, August 19, 2005 University of Minnesota Southwest Research and Outreach Center
- 1 -
Agricultural Drainage Field Day
Proceedings of the 2nd
Friday, August 19, 2005
University of Minnesota Southwest Research and Outreach Center

- 2 -
Contributed papers from the 2nd Agricultural Drainage and Water Quality Field Day 19 August 2005, Lamberton, Minnesota
2nd Agricultural Drainage and Water Quality Field Day
University of Minnesota Southwest Research & Outreach Center
Lamberton, Minnesota 19 August, 2002
Edited by Jeffrey S. Strock University of Minnesota – Southwest Research & Outreach Center, Lamberton Minnesota

- 3 -
FORWARD In the future, there will be larger and fewer farms; arable farm land will decrease; environmental and food safety concerns will be a high priority. Simply put, we will need to grow more food and better food on less land without harming the environment. Changes in agriculture or policy will alter farming practices and science and technology will play an increasingly important role in shaping the future of agriculture. The Agricultural Drainage and Water Quality Field Day is an event to connect researchers, stakeholders, and policy makers. The over arching objectives of the 2nd Agricultural Drainage and Water Quality Field Day were to (1) provide a forum for researchers to share the results of on-going research with shareholders, (2) provide an opportunity for shareholders to participate in educational activities, and (3) provide shareholders an opportunity to provide input into efforts addressing soil, water, and nutrient management issues. The 2nd Agricultural Drainage and Water Quality Field Day was designed to highlight progress on soil and water management research and is an example of inter- institutional and inter-agency collaboration. The proceedings from the Field Day include six papers which discuss research projects conducted by scientists from the University of Minnesota, Iowa State University, North Carolina State University, and the United States Department of Agriculture – Soil Drainage Research Unit. Jeffrey S. Strock, University of Minnesota – Southwest Research and Outreach Center Coordinator of the 2nd Agricultural Drainage and Water Quality Field Day

- 4 -
ACKNOWLEDGMENTS
There are many, too numerous to mention individually, that were instrumental in helping organize, coordinate, and execute this 2nd Agricultural Drainage and Water Quality Field Day. The first and most important thank you is extended to the many participants of the 2nd Agricultural Drainage and Water Quality Field Day. A second expression of gratitude goes to the presenters who helped make this program successful by sharing the results of their research and contributing to this proceedings document. Third, to a sincere thank you goes to those organizations and businesses that brought displays and/or exhibits to the Field Day. Fourth, gratitude is expressed to Gary Sands and Matt Helmers for their help in planning the Field Day. Finally, a heartfelt thank you goes the staff at the Southwest Research and Outreach Center, especially Molly Werner, for helping to coordinate the overall logistics, tours, publicity, and this proceedings document.
DISCLAIMER The information given in this publication is for educational purposes only. Reference to commercial products or trade names is made with the understanding that no discrimination is intended and no endorsement by the University of Minnesota is implied.

- 5 -
CORRESPONDING AUTHORS OF PAPERS Norm Fausey USDA-Agricultural Research Service Soil Drainage Research Unit 590 Woody Hayes Dr. Columbus, OH 43210
Satish Gupta University of Minnesota Department of Soil, Water, & Climate 1991 Upper Buford Circle, Room 439 St. Paul, MN 55108-6028
Ramesh Kanwar Iowa State University Agricultural & Biosystems Engineering 104 Davidson Hall Ames, IA 50011-1010
John Moncrief University of Minnesota Department of Soil, Water, & Climate 1991 Upper Buford Circle, Room 439 St. Paul, MN 55108-6028
Wayne Skaggs North Carolina State University Department of Biosystems and Agricultural Engineering 150 Weaver Labs, Box 7625 Raleigh, NC 27695
Jeffrey Strock University of Minnesota Southwest Research & Outreach Center 223669 130th St. Lamberton, MN 56152

- 6 -
TABLE OF CONTENTS
Articles Page Wrsis: An Innovative Approach To Agricultural Water Treatment And Recycling
Norman Fausey, Barbara Baker, Barry Allred, Larry Brown
7
Antibiotics Losses In Runoff And Drainage From Swine Manure Application
Kuldip Kumar, Yogesh Chander, Satish Gupta, Anita Thompson, Ashok Singh, David Thoma, and Nate Bartholomew
15
Tillage, Crop Rotation And Manure Application Effects On No3-N Leaching And Corn Yields
Ramesh Kanwar
23
Field Evaluation of Gravel Filters For Depressional Areas in Farm Fields
Andry Z. Ranaivoson, John F. Moncrief, and Mark A. Dittrich
31
Agricultural Drainage Management: Effects On Water Conservation, N Loss And Crop Yields
R. Wayne Skaggs, Mohamed A. Youssef and Robert O. Evans
41
Comparison Of Soil Properties And Water Quality In Alternative And Conventional Cropping Systems
Kari Rolf, Jeffrey S. Strock, David J. Mulla
42
Paired Open-Ditch Geometry, Water Quantity And Water Quality Jeffrey S. Strock
50

- 7 -
WRSIS: AN INNOVATIVE APPROACH TO AGRICULTURAL WATER TREATMENT AND RECYCLING
Norman Fausey, Barbara Baker, Barry Allred, Larry Brown
USDA-ARS, Soil Drainage Research Unit, and The Ohio State University Columbus, Ohio
Key words: Wetland, Drainage, Subirrigation
INTRODUCTION
The Wetland Reservoir Subirrigation System Concept A Wetland Reservoir Subirrigation System (WRSIS) is an innovative agricultural water
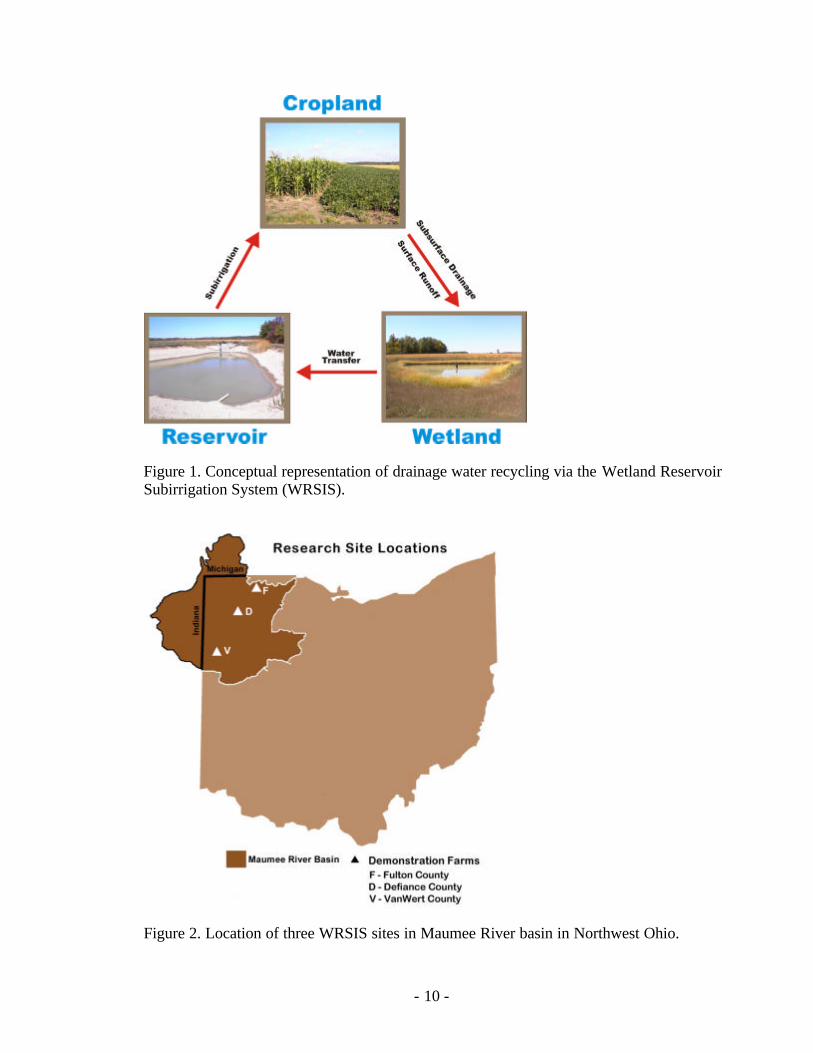
management system (Allred, et al. 2003). WRSIS is comprised of a wetland, a water storage reservoir, and a network of subsurface pipes used at different times to either drain or irrigate crops through the root zone (see Figure 1). The integration of these components allows WRSIS to operate in a closed hydrologic loop mode most of the time, thus minimizing offsite water release. The expected benefits are: increased crop yields on irrigated acres; reduced offsite delivery of nutrients, pesticides, and sediment; increased wetland vegetation and wildlife habitat.
INITIAL DESIGN CONSIDERATIONS Subsurface Drainage/Irrigation System Design Parameters
A high drainage coefficient of 1.5 to 2 inches per day is used. Very rapid drainage is required during critical periods, so 33 to 50% narrower drain spacing is employed compared to conventional subsurface drainage. This evens out the water table between the drainlines during subirrigation and promotes rapid drainage when needed. Not more than 1 foot elevation difference is allowed within each water table management zone. Wetland Design
The wetland is sized to have the capacity to receive and hold surface runoff and subsurface drainage for a 2-year 24-hour storm event from the contributing acres. Adequate retention time is necessary for removal of sediments and nutrients in the wetland. This is controlled by outlet restriction. Storage Reservoir
The reservoir is sized to have the capacity to meet irrigated area crop water needs in 8 out of 10 years. Subirrigation requires more water than surface irrigation (approximately 1-acre ft. annually.)
WRSIS LOCATIONS
Currently, there are three demonstration/research WRSIS sites within the Maumee River Watershed in northwest Ohio. There is one each in Defiance County (D), Fulton County (F), and Van Wert County (V) (see Figure 2). Soils in the Maumee River Watershed are often

- 8 -
deep poorly drained clays with very slow permeability formed from fine textured, calcareous lacustrine sediment in the bed of the former postglacial Lake Maumee. Prior to the installation of the drainage outlet ditch system in the late 1850’s this area was known as the Great Black Swamp. The natural vegetation was predominantly swamp forest, grasses and sedges.
DESIGN CHARACTERISTICS
The Defiance County WRSIS system was constructed in June of 1995 and receives surface runoff from approximately 30 acres and subsurface drainage from two subirrigated fields totaling about 7 acres with either 8 or 16 feet drain spacing (see Figure 3). The wetland surface area is 0.3 acres and it has capacity for 0.6 acre-ft. water. The reservoir surface area is 0.4 acres, with 2.4 acre-ft. storage capacity.
The Fulton County WRSIS system was constructed in the Spring of 1996. This system receives water from 40 acres via subsurface drainage and from approximately 4 acres via surface runoff. There are 20 subirrigated acres with 15 foot drain spacing (see Figure 4). The wetland surface area is 1.4 acres and it has a capacity for 3.2 acre-ft. of water. The reservoir surface area is 1.6 acres, with 7.1 acre-ft. capacity. Water supply is supplemented by pumping from a stream when adequate flow is available.
The Van Wert County WRSIS system was constructed in the Fall of 1996. The system receives runoff water from approximately 60 acres and subsurface drainage from 45 of these acres. There are 30 subirrigated acres (see Figure 5). The wetland surface area is 0.9 acres and it has a capacity for 3 acre-ft. of water. The reservoir surface area is 2 acres, with 11 acre-ft. capacity without pumping and 24 acre-ft. if pumped.
IMPACT OF WRSIS ON WATER QUALITY
Inflows and outflows from each WRSIS constructed wetland are quantified and sampled based on flow rate. Results for individual storm events during 2003 are illustrated in Figures 6, 7, and 8 for Total Filterable Solids, nitrate-Nitrogen, and total Phosphorus, respectively. These results show that this wetland is effective in reducing the pollutant concentrations in the water leaving the wetland.
IMPACT OF WRSIS ON CROP YIELD
An example of the impact of WRSIS subirrigation on crop yields is shown in Figure 9 for the Fulton County site for the period from 1996 through 2002. The uniformity of the yield from year to year for both corn and soybeans is clearly evident and in contrast to the large range in annual yields seen in the non- irrigated yields.
HABITAT DEVELOPMENT
Vegetation within the constructed wetlands (Figure 10) has been allowed to naturally recolonize, with the exception of erosion control seedings along the buffers of the basins. Vegetation surveys performed from 1998-2001 (Luckeydoo, et al 2002, 2004) indicate the presence of the following dominate wetland species:

- 9 -
Salix exigua Nutt., - Willow Echinochloa crusgalli (L.) P. Beauv. – Barnyard grass Scirpus atrovirens Willd. – Bulrush Phalaris arundinaceae L. – Reed canary grass Polygonum persicaria L. – Smartweed Carex vulpinoidea Michx. - Sedge Wetland indicator species made up 45% of the total species present in the three wetlands.
Wildlife surveys were performed in 1999 and 2003. At the Defiance County WRISIS site, total species increased from 80 to 100 species from 1999 to 2003, including evidence of a healthy population of the threatened Blanchard’s Cricket Frog. At the Fulton County WRSIS site, the number of total species increased from 75 to 85 from 1999 to 2003. Dragonflies, indicators of good water quality, were plentiful at each site.
CONCLUSIONS
Subirrigation increased corn and soybean yields by 48% and 40%, respectively during dry growing seasons and 10% and 9% during near average or wetter growing seasons.
In 2003 the wetland at the Defiance County WRSIS location reduced the concentration of Nitrate Nitrogen, Total Filterable Solids, and Total Phosphorus in the water exiting compared to the water entering by 95%, 36% and 31% respectively. (Reductions are based on the average concentration entering from both surface and subsurface sources).
These constructed wetland sites have developed wetland vegetation and provide additional breeding and nesting habitat for wildlife.
REFERENCES Allred, B., Brown, L., Fausey, N., Cooper, R., Clevenger, W., Prill, G., La Barge, G., Thornton, C., Riethman, D., Chester, P., Czartoski, B. Water table management to enhance crop yields in a wetland reservoir subirrigation system. Applied Engineering in Agriculture. 2003. Vol. 19(4). pp. 407-421. Luckeydoo, L., Fausey, N., Brown, L., Davis, C. Early development of vascular vegetation of constructed wetlands in northwest Ohio receiving agricultural waters. Agricultural Ecosystems and the Environment. 2002. V. 88. pp. 89-94. Luckeydoo, L., Fausey, N., Clevenger, B. Vegetation establishment and management guidelines for constructed basins for agricultural water treatment. OSU Extension Publication. Bulletin 909 pp. 1-25. 2004
- 10 -
Figure 1. Conceptual representation of drainage water recycling via the Wetland Reservoir Subirrigation System (WRSIS).
Figure 2. Location of three WRSIS sites in Maumee River basin in Northwest Ohio.

- 11 -
Figure 3. Configuration of the Defiance County WRSIS site.
Figure 4. Configuration of the Fulton County WRSIS site.

- 12 -
Figure 5. Configuration of the Van Wert County WRSIS site.
Figure 6. Total filterable solids concentrations in water entering and leaving the Defiance County WRSIS site wetland for storm events in 2003.

- 13 -
Figure 7. Nitrate-nitrogen concentrations in water entering and leaving the Defiance County WRSIS site wetland for storm events in 2003.
Figure 8. Total phosphorus concentrations in water entering and leaving the Defiance county WRSIS site wetland for storm events in 2003.

- 14 -
Figure 9. Irrigated and non irrigated crop yields at the Fulton County WRSIS site.
Figure 10. Example of vegetation development in a constructed wetland receiving agricultural drainage water 5 years after construction.

- 15 -
ANTIBIOTICS LOSSES IN RUNOFF AND DRAINAGE FROM SWINE MANURE APPLICATION
Kuldip Kumar1, Yogesh Chander1, Satish Gupta*1, Anita Thompson2, Ashok Singh3, David Thoma1, and Nate Bartholomew1 1Department of Soil, Water, & Climate, University of Minnesota 2 Department of Biological Systems Engineering, University of Wisconsin 3Department of Veterinary Population Medicine, University of Minnesota
Key words: Pharmaceuticals, antibiotics, tillage, antibiotic resistance bacteria
EXECUTIVE SUMMARY
This study quantified the effect of land application of antibiotic laced swine manure on
antibiotic losses in surface runoff and tile drainage. Two antibiotics studied are chlortetracycline and tylosin. Field studies showed very little transport of chlortetracycline and tylosin through Webster clay loam soil into tile drainage. There was almost no transport of dissolved chlortetracycline in surface runoff. Only about 0.07% of the applied tylosin was transported as dissolved tylosin in surface runoff. Laboratory studies showed that these two antibiotics are tightly adsorbed by soils and most of the manure-applied antibiotics are remaining in place where they are applied. However, there is some off-site transport of these antibiotics with sediment in runoff water. Screening of soil samples from Lamberton plots showed that generally soil microbes had no resistance to tetracycline but higher resistance to tylosin after 5 years of swine manure application. There was also more diversity in the resistant bacteria from the manure plots than the urea plots. Similar studies are underway on highly erodibile loess soil in southwestern Wisconsin with swine and beef manure and highly permeable sandy outwash soils in Central Minnesota with turkey and hog manure.
INTRODUCTION
Since their discovery, antibiotics have been instrumental in treating infectious diseases that were previously known to kill humans and animals. However, their widespread use as additive in animal feed has raised concerns about the development of antibiotic-resistant microorganisms (Levy, 1992). Increasingly more microorganisms are becoming resistant to multiple antibiotics. A high proportion of the antibiotics added to animal feed are excreted in urine or manure (Kumar et al., 2005). Once excreted in urine and manure, these antibiotics can enter surface and/or ground waters through non-point source pollution from manure-applied fields. The goal of this study was to quantify antibiotics losses from swine manure application both in surface runoff and subsurface drainage.
MATERIALS AND METHODS
The leachate and runoff losses were monitored from a field experiment located at the University of Minnesota Southwest Research and Outreach Center, Lamberton, MN. The soil at the site is a Webster clay loam soil, a common soil series in the Minnesota River Basin. The experiment is a randomized split-plot design with four replications (Fig. 1). The main plots consist of two tillage treatments: (1) fall moldboard plowing followed by two passes of

- 16 -
field cultivation before corn planting (MP); and (2) chisel plowing followed by two passes of field cultivation before corn planting (CP). The subplots are two annually applied nutrient management treatments: fall injected (10 cm depth) liquid swine manure (M) versus spring-applied and incorporated (5 cm depth) urea (U).
The drainage plots are 18.2 m long and 9.1 m wide (Fig. 1). Each plot is isolated to a depth of 1.8 m by trenching around plot borders and installing a 0.3 mm plastic sheet (Zhao et al., 2001, Thoma et al., 2004). A perforated plastic tile drain, 10 cm in diameter, is installed at 1 m depth and 1.5 m away from the plot boundary along its width. This arrangement drains 16.7 m (18.2 m minus 1.5 m) length of the plot, one-half side of tile drains that may be 33.4 m apart. Tile drains empty into a monitoring well. Surface inlets are located at the lowest point in the plots and drain surface runoff also into the monitoring well.
For the 2001-2002 crop year, primary tillage was done October 4, 2001 and subsequently liquid hog manure was injected on November 5, 2001 in half of the plots at 45,794 L/ha. This corresponds to N application of 56 kg/ha. In the remaining half of the plots urea was applied at an equivalent of 161 kg-N/ha just before the secondary tillage. Corn was planted on May 1, 2002 right after secondary tillage. For the 2002-2003 crop year tillage was done on 18 October 2002 and subsequently liquid hog manure was injected on the same day in half of the plots at 36,400 L/ha. Two passes of secondary tillage was done April 23, 2003 and corn planted the same day. For the 2003-2004 crop year manure was applied at 56,000 L/ha on half of the plots on 16 October 2003 after primary tillage. Since the farmer supplying manure for our field experiment was mixing aueromycin (chlortetracycline) and tylosin in swine feed, our characterization was geared towards quantification of chlortetracycline and tylosin. Both surface runoff and subsurface tile drainage are measured with tipping bucket devices that are connected to CR-10 data loggers. Antibiotic analysis in manure sample was done on High Performance Liquid Chromatography (HPLC). Screening of Soil Samples for ARB
The ultimate concern of antibiotic feeding in swine production is the development of antimicrobial resistance in the environment. Since the above laboratory experiment showed that soil-adsorbed antibiotics are biologically active, the next step was to see whether or not swine manure application over the last 5 years at the Lamberton site has imparted any antimicrobial resistance to the soil bacteria. The experiment involved collecting surface samples from both the manure and the urea plots for isolation of soil bacteria. Isola ted bacteria were identified and their resistance to various antibiotics was determined. Surface soil was also collected from a near by field where manure has never been applied. All surface samples were collected on 15 April 2004. Prior to swine manure application, the manure plots had also received solid beef manure for three years. All samples were screened for the presence of antibiotic resistant bacteria using Agar dilution technique as per the NCCLS (1997) standards. Briefly, the procedure involved suspending 1.0 g of the soil sample in 9.0 ml of Buffered peptone water (BPW, pH 7.0), homogenizing the suspension, making ten-fold serial dilutions with BPW and then plating the appropriate dilution on solidified Mueller-Hinton Agar (MHA) medium supplemented with antibiotic. Samples were screened for three different antibiotics namely tetracycline, tylosin, and monensin at concentrations 20.0 µg ml-1, 10.0 µg ml-1, and 6.0 µg ml-1 respectively. For control, samples were simultaneously plated on plate without antibiotic. After inoculation plates were incubated at 370C for 24 hrs and then the number of colony forming units (CFU) were counted in both antibiotic containing plates and the control plates. Percent resistance was calculated as the ratio of the colony forming units in the antibiotic containing plates to the control plates.

- 17 -
Antibiotics Adsorption on Soils Since our field studies showed very little transport of antibiotics in surface runoff or tile
drainage we also conducted experiments to see how these antibiotics react with soils. The antibiotics tested in this experiment were tetracycline, chlortetracycline and tylosin and the soils used were Webster clay loam and Hubbard loamy sand. Adsorption studies were done both in batch and in flow through mode. Batch experiment involved mixing a known amount of soil with a given concentration of antibiotic solution and then measuring the degree of antibiotic adsorption. Flow-through mode involved leaching antibiotics through a soil column. Batch set-up represents the equilibrium conditions whereas flow through set-up simulates transient or non-equilibrium conditions.
RESULTS AND DISCUSSION Antibiotic Concentrations in Manure
Analysis of the 2001 swine manure from the supplier lagoon showed presence of chlortetracycline (5.0 mg/L of manure slurry) and tylosin (5.6 mg/L of manure slurry). At 45,794 L/ha of manure application, this is equivalent to an application of 229 g/ha of chlortetracycline and 256 g/ha of tylosin. Analysis of 2002 swine manure samples showed presence of chlortetracycline (5.47 mg/L of manure slurry) and tylosin (4.52 mg/L of manure slurry) and oxytetracycline (1.31 mg/L of manure slurry). At 36,400 L/ha of manure application, this is equivalent to an application of 199 g/ha of chlortetracycline and 165 g/ha of tylosin and 48 g/ha of oxytetracycline. In 2003, swine manure samples contained 4.45 mg/L of chlortetracycline and 3.0 mg/L of tylosin. At 56,000 L/ha of manure application, this is equivalent to an application of 249 g/ha of chlortetracycline and 168 g/ha of tylosin.
Antibiotic and Nutrient Losses in Runoff and Tile Line Flow None of the surface runoff or tile line samples in 2002 showed any presence of dissolved
chlortetracycline. Furthermore, there was no presence of dissolved tylosin in the tile line water. This is consistent with subsequent laboratory batch adsorption and flow through studies that showed strong tendency of chlortetracycline and tylosin to be adsorbed on the Webster clay loam soil. Dissolved tylosin losses in surface runoff for four major storm events in 2002 were 168 mg/ha for the manure treatment and 41 mg/ha for the urea treatment (Table 1). These amounts translate to tylosin losses of about 0.07% of the tylosin applied in the manure plots. Presence of tylosin in the urea treatment is most likely due to cross contamination of plots by tillage tools or possibly from spillage of liquid swine manure in the border area between plots as we started or finished injecting swine manure in the manure plots. Manure and urea plots were separated by 5 feet of buffer area.
In 2003, virtually there was no loss of dissolved chlortetracycline, oxytetracycline or tylosin in runoff water. We did measure some presence of chlortetracycline in late April in three water samples that were sitting in the tipping buckets after a runoff event. All three samples were from the chisel plow manure plots. Chlortetracycline concentration in these runoff water samples varied from 0.88 to 1.51 µg/L. In mid May 2003, we also detected a presence of chlortetracycline in tile line samples from seven manure plots and two urea plots over three dates. Chlortetracycline concentration in these samples varied from 0.4 to 0.76 µg/L. Since only one sample was taken per day from tile lines, we are uncertain over what flow period these concentrations may apply. Assuming these concentrations apply to the flow over the whole day (since we did not detect this antibiotic in the same plots next day with one

- 18 -
exception), the chlortetracycline losses will be about 16 mg/ha. This is equivalent to 0.008% of the chlortetracycline applied in manure in fall 2002. Residual Antibiotic in Soil After Hog Manure Application
Soil samples were collected in the summer 2003 to determine the residual levels of manure-applied antibiotics in soil. The extraction was done with 0.2 M Na2 EDTA. Tables 2 and 3 show that a majority of manure-applied antibiotics were present in the manure treatment and that too in the surface (0-15 cm) layer. There was some presence of antibiotics in 15-30 cm depth but no presence of antibiotic below 30 cm depth. Presence of antibiotic at 15-30 cm depth was not due to leaching but due to soil mixing during tillage. Presence of antibiotic in the urea plots was also mainly due to cross contamination between plots during tillage. These plots are only 5 feet part and it appears that some of the soil from manure plots may have been brought into the urea plots during cultivation. It is also likely that some spillage of liquid hog manure in area between the plots during injection may have been carried into the urea plots. We allow some spillage in order to achieve uniform manure application rate across the manure plots.
The amount of chlortetracycline and tylosin remaining in the soil varied from 43% to 61% of the amount applied in Fall 2002 (Tables 2 & 3). Since the antibiotic recovery with 0.2 M Na2 EDTA is also around 50%, it appears that most of the manure-applied antibiotics remained in the top 30 cm of soil. The only caveat in this finding is that we are not sure what proportion of the antibiotics we measured in summer 2003 were from fall application in 2002 and what proportion were from previous years applications. Since no samples were collected in previous years, there was no way to partition the contributions between recent and previous years’ applications.
Antibiotic Adsorption by Soils
Batch experiments showed that tetracycline and chlortetracycline are strongly adsorbed than tylosin on both Webster clay loam (Fig. 2) and Hubbard loamy sand (Figs. 3) soils. Among the soils, the Webster clay loam has a higher adsorption capacity than the Hubbard loamy sand. The differences in adsorption between the soil types are due to differences in clay and organic matter content. Webster clay loam is higher in both clay and organic matter contents (34% & 4.4%) than the Hubbard loamy sand (10.4% & 2.2%). For a given soil, chlortetracycline was more tightly adsorbed followed by tetracycline and then tylosin (Figs. 2 & 3). An X-ray diffraction (Fig. 4) of the clay particles showed that clay thickness increased with an increase in clay absorbed chlortetracycline but there was no difference in clay thickness in presence of tylosin. This suggests that chlortetracycline penetrates the inter layers of clay particles whereas tylosin is adsorbed on the clay surface. The implication of this finding is that chlortetracycline will be harder to strip from the clay particles than tylosin, which means lower dissolved chlortetracycline losses in surface runoff.
Figure 5 shows the breakthrough curves of chlortetracycline, tetracycline, tylosin, chlortetracycline in presence of tylosin, and tylosin in presence of chlortetracycline for Hubbard loamy sand. At a given relative concentration, the appearance of tylosin was faster than tetracycline and chlortetracycline. In other words, tylosin is less strongly adsorbed than chlortetracycline and tetracycline. The results in Fig. 5 also show that there is some interaction between tylosin and chlortetracycline for binding site on the clay particles, because both chlortetracycline and tylosin appear earlier in the leachate in the presence of each other compare to when there are presence singly.

- 19 -
Antibiotic Resistance of Soil Microbes After 5 Years of Swine Manure Application Screening of surface soil samples from Lamberton, MN in 2004 showed that there was
prevalence of ARB in plots where manure had been applied for 5 years (Table 4). Isolated bacteria from manure-applied plots had higher resistance to tylosin and monensin antibiotics compared to urea treated plots. However, there was no resistance for tetracycline in soil bacteria from either the manure or the urea plots even after 5 years of swine manure application. Monensin, an ionophore, is mainly used in beef production. We suspect that monensin resistance in our manure plots may have been due to solid manure application previous to swine manure application. The lack of tetracycline resistance in soil bacteria may have possibly been due to strong adsorption of tetracycline by high clay soils. The only other difference between the manure and the urea plots was greater diversity of resistant bacteria in manure plots than the urea plots. Resistant bacteria in manure plots were Pseudomonas sp., Moraxella sp., Ralstonia pickettii, Stenotrophomonas maltophilia, Acinetobacter lwoffii compare to Pseudomonas sp. in both urea plots and the plots where manure has never been applied.
REFERENCES Kumar, K., S.C. Gupta, Y. Chander, and A Singh. 2005. Antibiotics use in agriculture and their impact on the terrestrial environment. Adv. in Agronomy, 87(In press). Levy, S.B. 1992. The antibiotic paraodox: How miracle drugs are destroying the miracle. Plenum Publishing. NCCLS. 1997. Performance Standards for Dilutions Antimicrobial Susceptibility Test for Bacteria that grow Aerobically – Fourth Edition; Approved Standards. NCCLS Document M7-A4. NCCLS, 940 West Valley Road, Suite 1400, Wayne, PA. Thoma, D.P., S. C. Gupta, J.S. Strock, and J.F. Moncrief. 2004. Tillage and nutrient source impacts on water quality from a flat landscape. J. Environ. Qual. 34:1102-1111.
Zhao, S. L., S.C. Gupta, D.R. Huggins, and J.F. Moncrief. 2001. Tillage and nutrient source effects on surface and subsurface water quality at corn planting. J. Environ. Qual. 30: 998-1008.

- 20 -
Table 1: Dissolved tylosin losses via surface runoff in 2002. Event Manure (mg/ha) Urea(mg/ha) 30 July 46.6 0 4 August 4.3 0.8 9 August 113.8 39.5 22 August 3.8 1.2 Total 168.5 41.4 Table 2: Chlortetracycline remaining in the Webster soil at the Surf-n-Sub plots at Lamberton, MN. Treatment 0-15 cm 15-30 cm Total (g/ha)
(% of applied)
MP-U 2.3 0 2.3 (1%)
CP-U 1.8 0 1.8 (0.8%)
MP-M 84.1 15.6 99.7 (43.2%)
CP-U 116.5 25.9 142.2 (61.7%)
MP=Moldboard plow, CP=Chisel plow, M=swine manure, U=urea Table 3: Tylosin remaining in the Webster soil at the Surf-n-Sub plots at Lamberton, MN. Treatment 0-15 cm 15-30 cm Total (g/ha)
(% of applied) MP-U 0.1 0 0.1 (0%) CP-U 1.3 0 1.3 (0.5%) MP-M 76.11 40.5 116.6 (45%) CP-U 90.6 55.8 146.5 (56.5%)
MP=Moldboard plow, CP=Chisel plow, M=swine manure, U=urea Table 4: Effect of swine manure application on percent increase in antimicrobial resistant of soil bacteria in Surf-n-Sub plots at Lamberton, MN. Treatment % Increase in Resistant Bacteria
Tetracycline Tylosin Monensin
Manure 0 34.8 27.0
Urea 0 7.0 6.0
Manure never applied
0 0.3 0.7

- 21 -
Fig. 1: Surf-n-sub plot lay out at the Southwest Research and Outreach Center in Lamberton, MN
Figure 2: Chlortetracycline, tetracycline, and tylosin adsorption isotherm on Webster clay loam.
Figure 3: Chlortetracycline, tetracycline, and tylosin adsorption isotherm on Hubbard loamy sand.
Legend: Primary tile line (Diameter=10.2 cm) Second tile line (Diameter=12.7 cm) Non-porous tile line (Diameter=10.2 cm) Berm and plastic barrier Surface inlet Monitoring wells
19.8 m 9.1 m 1.5 m
1.5 m
1.5 m
18.2 m
7.6 m
3.0 m
MP+M
N
CH+U
CH+M
MP+U
MP+M
MP+M
MP+M MP+U
MP+U MP+U
CH+M CH+M
CH+M CH+U CH+U
CH+U
MP+M: Moldboard plow & Manure MP+U: Moldboard plow & Urea CH+M: Chisel plow & Manure CH+U: Chisel plow & Urea
15 m
Closed
Open
b
b
b
b
b
b
b
b
b
b
b
b
b
b
b b
b
0 30 60 90 120 1500
10000
20000
30000
40000
50000
60000
0 30 60 90 120 150
Am
ou
nt o
f an
tib
ioti
c so
rbed
(mg
/kg
)
Antibiotic equilibrium concentration (mg/L)
0 20 40 60 80 100 120
Chlortetracycline Tetracycline Tylosin
0 30 60 90 1200
10000
20000
30000
40000
Am
ou
nt
of
anti
bio
tic
sorb
ed (
mg
/kg
)
0 30 60 90 120
Antibiotic equilibrium concentration (mg/L)
0 30 60 90 120 150
Chlortetracycline Tetracycline Tylosin

- 22 -
Figure 4. Variation in clay particle thickness as influenced by antibiotic concentration. Increase in clay particle thickness with increased antibiotic chlortetracycline concentration suggests chlortetracycline is moving into clay lattice and thus less available than tylosin. No change in clay particle thickness with tylosin suggests that tylsoin is adsorbed on the surface of clay particles.
Figure 5: Antibiotic breakthrough curves from Hubbard loamy sand.
Pore Volume0 50 100 150 200 250 300
C/C
0
0.0
0.2
0.4
0.6
0.8
1.0
Pore volume
0.0 0.4 0.8 1.2 1.6
C/C
o B
r'
0.0
0.20.4
0.60.8
1.0
Chlortetracycline
Chlortetracycline (with Tylosin)
TetracyclineTylosin
Tylosin (with Chlortetracycline)
Antibiotic concentration (mg/L)
0 200 400 600 800 1000 1200
d (A
o)
14.4
14.8
15.2
15.6
16.0ChlortetracyclineTylosin

- 23 -
TILLAGE, CROP ROTATION AND MANURE APPLICATION EFFECTS ON NO3-N LEACHING AND CORN YIELDS
R.S. Kanwar
Department of Agricultural and Biosystems Engineering Iowa State University, Ames, Iowa 50011
Keywords: Manure, Tillage, Corn, Nitrate, Leaching.
INTRODUCTION
Cropland areas of the Midwest have varying degrees of potential for surface and groundwater contamination. The use of conservation tillage, and cropping and nutrient management systems have the potential to reduce NO3-N leaching to shallow groundwater systems from various landscape activities within agricultural watersheds. Cropping systems designs are becoming more diverse although the past trend has been towards monoculture or continuous row-crop production. Groundwater pollution from non point sources is an important concern in Iowa and other Midwestern states in the USA. Nonpoint source pollution of surface and groundwater bodies with nitrate-nitrogen (NO3-N) has been linked routinely to agricultural production practices.
Tillage and N-management practices influence the water and solute movement through and beyond the root zone. Tillage directly affects the soil physical properties, which control the soil moisture movements within the soil profile. Intensity of tillage ranges from most intensive of conventional tillage to least intensive of no-till (NT) system. Macropores, including cracks, worm burrows, and root holes, are larger in size and form a better connected network of pores in the no-till soil than in the conventionally tilled soils. Crop producers are well aware of nutrient losses in runoff and leaching as an economic/ production issue. Yet despite intensive information programs in many watersheds, and despite the documented practicality and economic benefits of refined manure and fertility management, change in producers’ practices has come slowly. The over application of N-fertilizer can accumulate more NO3-N in the soil profile than the subsequent crops may need and, therefore, makes NO3-N more susceptible to leaching. Soil NO3-N also accumulate during the dry season when nitrification exceeds denitrification, plant uptake, immobilization, leaching and other processes that remove NO3-N from the soil profile The single application of urea ammonium nitrate solution fertilizer (UAN) vs late spring application has both positive and negative effects on the amount of NO3-N leaching. The late spring application of urea ammonium nitrate solution (UAN) fertilizer may offer great potential for increasing crop yield while reducing the NO3-N leaching to groundwater. Few researchers have investigated the integrated effect of single vs late spring application of UAN-fertilizer to corn phase of production under corn after soybean rotation plots when treated with most conventional tillage of chisel plow and least intensive of no-till system. Therefore, we conducted and designed several studies over a period of past 15 years (1990-2005) to evaluate effects of tillage, crop rotations, and several nutrient management systems (UAN and manure) on NO3-N concentrations in subsurface drainage water and crop yields. The objective of this

- 24 -
paper is to report the results of these studies that were conducted in Iowa over the past 15 plus years.
MATERIALS AND METHODS The study site was located at Iowa State University’s Northeast Research Farm near Nashua, Iowa. Soils at the site are Floyd loam (fine-loamy, mixed, mesic aquic Hapludolls), Kenyon loam (fine- loamy, mixed, mesic Typic Hapludolls) and Readlyn loam (fine- loamy, mixed, mesic Aquic Hapludolls). These soils are moderately well to poorly drained and lie over loamy glacial till. This experimental site has 36, one-acre plots with fully documented tillage and cropping history for the past twenty years. In 1979, subsurface drains were installed to all these 36 plots at 95-ft spacing and approximately 4 ft deep. Each 195-ft x 225 ft plot has a drain along the center and along the north-south borders. A 30 ft grass strip isolated the plots on the east and west sides. Center drains were routed to sumps for monitoring subsurface drain flows while border drains isolated plots on the north and south sides. Each sump contained a sump pump with a flow meter. Flow meters are read manually three times per week. Data on flows was collected from approximately mid-March to the beginning of December each year. Water samples were collected from the sumps for NO3-N analyses when flow meters are read three times a week. For water sample collection, subsurface drain sumps are equipped with a state-of-the art sampling system which pumps about 0.02% of the water discharged by the sump pump into the sampling bottle through the orifice tube installed on the sump discharge line. Nitrate-nitrogen in water samples was analyzed spectrophotometrically using a Lachat Model AE ion analyzer. Data on corn yields was collected at harvest and was converted to 15.5% moisture content level.
RESULTS AND DISCUSSION In the first study conducted from 1990 to 1992, the overall objectives were to evaluate the effects of four tillage systems (no-till, chisel plow, ridge till, and moldboard plow) and two crop rotations (continuous corn and corn-soybean rotation) on subsurface drain water quality. The tillage and crop rotations were established in 1979 were the effects of these long-term systems on water quality were evaluated fro 1990 to 1992. Table 1 gives the yearly NO3-N losses with drain water which ranged from 4.8 kg/ha in 1992 to 107.2 kg/ha in 1990. Three year average (1990-92) for NO3-N losses with subsurface drain water were much higher under continuous corn in comparison with the corn-soybean rotation for all tillages. Although NO3-N concentrations were greater under conventional tillage (moldboard plow + disking) than under a no-till system, total NO3-N losses with subsurface drain flow were higher under the no-till and chisel plow systems because of greater volume of water moving through the soil. In the second study that was initiated in 1993 and completed in 1998, alfalfa inter-seeded with berseem and clover was established in 1993 (an extremely wet year) on four plots consisting of non-traditional cropping systems (strip cropping consisting of three strips of corn, soybean, and oats; totally N free treatment consisting of three years of alfalfa then corn-soybean-oat rotation; and traditional corn-soybean rotation system with LSNT practice. Figure 2 gives NO3-N concentrations in subsurface drain water under three systems (strip cropping, alfalfa rotation, and corn-soybean rotation). The results of this study indicate that in 1996 (the last year of this study) and the six-year average, the corn-soybean rotation system resulted in the highest NO3-N concentrations in the

- 25 -
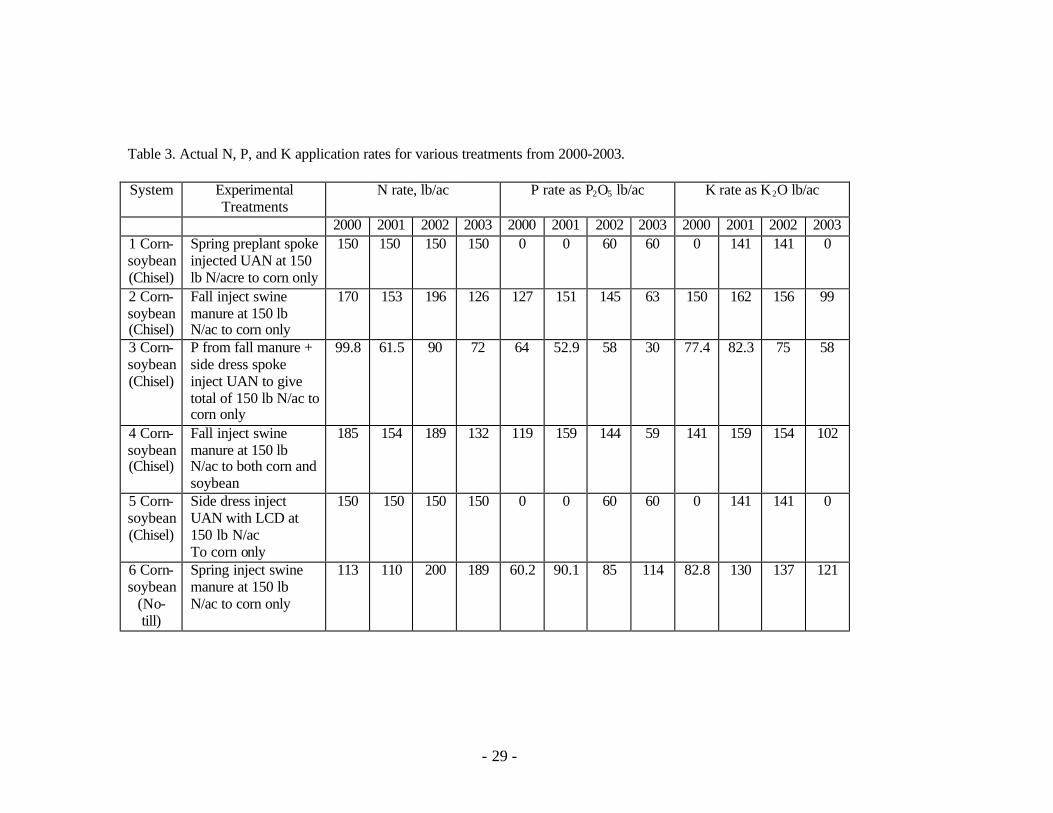
subsurface drain water compared to the rest of the treatments (Figure 2). Data on NO3-N concentration in subsurface drain water indicate that with non-traditional production systems of strip cropping and alfalfa rotations, the NO3-N concentrations in the shallow groundwater can go below the drinking water standard of 10 mg/l. In the alfalfa treatment, alfalfa was grown for three consecutive years (1993-95) and no N-fertilizer was applied to corn in 1996, to soybean in 1997, and to oats in 1998. This also shows the effect of complex interactions among climatic factors, subsurface recharge and drainage effluents, and N-mineralization rates due to root decay on the NO3-N leaching losses with subsurface drainage water. Table 2 gives the six-year average N-application rates, NO3-N concentrations in the subsurface drainage water, and crop yields as a function of different N management systems. Highest six-year average NO3-N concentration of 19.0 mg/l in the drainage water was observed from manure plots under continuous-corn production and the lowest average NO3-N concentrations of 10.2 mg/l was observed from plots with UAN applications under corn-soybean rotation. Manured plots under corn-soybean rotation resulted in six average NO3-N concentrations of 14.2 mg/l. These results indicate that the importance of corn-soybean production system in reducing NO3-N concentrations in shallow groundwater under both UAN and manure applications compared to continuous-corn. Table 2 also shows that average yearly NO3-N concentrations in subsurface drain water in 1993 (first of the experiment) ranged from 8.9 to 11.6 mg/l in corn plots but showed no specific trends; which may reflect the effect of past management practices in these plots. The NO3-N concentrations observed in 1993 from soybean plots were lower and ranged from 5.7 to 11.1 mg/l because no nitrogen was added to these plots in 1993. The NO3-N concentrations in continuous corn plots with manure applications increased from 8.0 mg/l in 1993 to 31.9 mg/l in 1995 and in corn-soybean rotation plots increased from 11.6 mg/l in 1993 to 18.2 mg/l in 1995. This large increase in NO3-N concentration in the subsurface drain water was most likely due to higher manure application rates in 1994 and 1995. Table 2 also gives yearly average corn yields for the six-year period. Three observations can be drawn from the crop yield data given in Table 3. First, the lowest corn yields were obtained from continuous corn plots receiving either manure or UAN fertilizer. Secondly, the highest corn yields were obtained from plots rotated with soybeans, which shows the importance of rotation. Finally, continuous corn production system results in higher NO3-N losses and lowest corn yields. The third study began in 1999 with the main goal of determining the impacts of recommended amounts of swine manure application rates, based on nitrogen and phosphorus uptake requirements of crops, on water quality. Field experiments were initiated in the fall of 1999 to demonstrate the impacts of six nitrogen and phosphorus management systems on crop yields and water quality and were continued through 2005. Table 3 gives the application rates of N, P, and K for va rious experimental treatments in the cropping year of 2000 thru 2003. Figures 1 and 2 summarize experimental results for the years 2000 through 2003. Figure 1 gives four year average NO3-N concentrations in tile water. System #4, with application of 150 lbs-N/ac to both corn and soybean from swine manure resulted in the highest yearly average NO3-N concentration in tile water of 57.2 mg/l in corn plots and 44.7 mg/l in soybean plots. The main reason for this high NO3-N concentration in tile water was due to the fact that these plots were under continuous corn from 1993 to 1998 and received continuous applications of swine manure during the period of third study between 1999 and 2004 years. Also, system 6

- 26 -
with spring application of manure under no-till system resulted in the lowest NO3-N concentrations of 14.0 mg/l in the tile water when compared to other N treatments. This shows that leaching of NO3-N under manure management plots can be managed with the right tillage system and application method and timings. Figure 4 shows that Systems #2 and #4 with fall manure application resulted in the highest corn yields. Figure 2 also gives NO3-N concentrations in corn stalk at harvest. System #4 resulted in the highest average NO3-N concentration in the stalk of 1316 mg/l. This indicates that plant uptake of N will be significantly higher if soil N is higher due to excessive N-applications from swine manure. .
CONCLUSIONS These studies resulted in the following conclusions: 1. Continuous corn plots receiving N from swine manure resulted in significantly higher
NO3-N concentrations in subsurface drain water in comparison with manure plots rotated with soybean. These results clearly indicate that the use of swine manure under corn-soybean rotation has the potential to reduce NO3-N concentrations in subsurface in subsurface drain water with proper manure management. Also, continuous corn plots with manure applications resulted in the highest NO3-N concentrations in the subsurface drain water in comparison with UAN fertilizer applied plots.
2. The excessive application of swine manure to both corn and soybean years will result in higher NO3-N leaching losses to shallow groundwater systems.
3. No-till systems tend to give lower NO3-N concentrations in groundwater compared to chisel plow and other tillage systems, and thus offer the potential to reduce NO3-N leaching if right combinations of cropping and N-management systems can be put on the landscape.
4. The highest corn yields were obtained from plots rotated with soybean under both manure and UAN fertilizer applications whereas, continuous-corn plots resulted in lowest yields.

- 27 -
Table 1. Average yearly NO3-N losses with subsurface drainage water as a function of tillage and crop rotation for three years data (1990-92) NO3-N loss, kg/ha (Kanwar, 1994: Kanwar et. al., 1997).
Year Crop rotation Chisel plow MB plow Ridge-till No-till 1990 1991 1992 Average (1990-92) 1990 1991 1992 Average (1990-92)
Continuous corn -do- -do- -do- Corn-soybean -do- -do- -do-
100.0 76.0 17.0 64.3a 52.4 36.3 15.3 32.1a
58.1 62.7 16.6 45.8a 38.0 35.5 9.1 27.5a
83.4 58.2 10.2 50.6a 30.3 29.4 11.2 23.7a
107.2 61.7 14.9 61.2a 36.5 30.3 4.8 23.9a

- 28 -
Table 2. Impact of swine manure and UAN-fertilizer applications on corn yields and yearly average NO3-N concentrations and losses with subsurface drain water.
Year Cropping systems
N-applications lb/ac kg/ha
Avera-ge NO3-N conc.
(mg/L)
Average NO3-N loss
lb/ac kg/ha
Corn grain yield bu/ac Mg/ha
1993 1994 1995 1996 1997 1998 Six yearly average (1993-98)
CC-Manure CS-Manure CC-Fertilizer CS-Fertilizer CC-Manure CS-Manure CC-Fertilizer CS-Fertilizer CC-Manure CS-Manure CC-Fertilizer CS-Fertilizer CC-Manure CS-Manure CC-Fertilizer CS-Fertilizer CC-Manure CS-Manure CC-Fertilizer CS-Fertilizer CC-Manure CS-Manure CC-Fertilizer CS-Fertilizer CC-Manure CS-Manure CC-Fertilizer CS-Fertilizer
61 73
120 98
233 209 120 98
269 194 120 98
91 74
120 98
92 76
120 98
126 94
120 98
145 120 120 98
68 82
135 110
262 235 135 110
302 218 135 110
102 83
135 110
103 85
135 110
141 106 135 110
163 135 135 110
11.1a 11.6a 11.4a 8.9b
18.0a 8.9b
10.3b 11.4b
31.9a 18.2b 14.4b 15.5b
24.3a 14.5b 7.5c
12.9b
12.2a 11.2a 9.3a
12.5a
21.2a 14.5b 12.9b 12.7b
19.0a 14.2a 11.1b 10.2b
43.0a 31.4a 41.6a 29.2a
8.9a
10.6a 6.9a 2.4a
33.9a 11.5b 14.2b 9.3b
101.a 11.3a 3.3a 5.6a
6.1a 6.7a 3.4a 5.6a
36.3a 35.3a 20.7a 21.0a
23.1a 17.7a 14.9a 12.2b
48.3a 35.3a 46.7a 32.8a
10.1a 11.9a 7.8a 2.7a
38.1a 12.9b 15.9b 10.5b
11.3a 12.7a 3.7a 6.3a
6.8a 7.5a 3.8a 6.3a
40.8a 39.6a 23.3a 23.6a
25.9a 19.9a 16.8a 13.7b
49c 100a 73b 81b
118b 134a 92c
126ab
86c 103a 73c
95ab
126b 137a 111c 140a
121
140b 137b 156a
115c 153a 124b 154a
102b 127a 102b 126a
3.1c 6.3a 4.6b 5.1b
7.4b 8.4a 5.8c
7.9ab
5.4bc 6.5a 4.6c
6.0ab
7.9b 8.6a 7.0c 8.8a
7.6c 8.8b 8.6b 9.8a
7.2c 9.6a 7.8b 9.7a
6.4b 8.0a 6.4b 7.9a
CC-Manure = continuous corn with liquid swine manure application CS-Manure = corn after soybean with liquid swine manure application CC-Fertilizer = continuous corn with UAN-fertilizer application CS-Fertilizer = corn after soybean with UAN-fertilizer application
- 29 -
Table 3. Actual N, P, and K application rates for various treatments from 2000-2003.
System Experimental Treatments
N rate, lb/ac P rate as P2O5 lb/ac K rate as K2O lb/ac
2000 2001 2002 2003 2000 2001 2002 2003 2000 2001 2002 2003 1 Corn-soybean (Chisel)
Spring preplant spoke injected UAN at 150 lb N/acre to corn only
150 150 150 150 0 0 60 60 0 141 141 0
2 Corn-soybean (Chisel)
Fall inject swine manure at 150 lb N/ac to corn only
170 153 196 126 127 151 145 63 150 162 156 99
3 Corn-soybean (Chisel)
P from fall manure + side dress spoke inject UAN to give total of 150 lb N/ac to corn only
99.8 61.5 90 72 64 52.9 58 30 77.4 82.3 75 58
4 Corn-soybean (Chisel)
Fall inject swine manure at 150 lb N/ac to both corn and soybean
185 154 189 132 119 159 144 59 141 159 154 102
5 Corn-soybean (Chisel)
Side dress inject UAN with LCD at 150 lb N/ac To corn only
150 150 150 150 0 0 60 60 0 141 141 0
6 Corn-soybean
(No-till)
Spring inject swine manure at 150 lb N/ac to corn only
113 110 200 189 60.2 90.1 85 114 82.8 130 137 121

- 30 -
Figure 1. Average NO3-N Concentrations in Subsurface Drainage Water as a Function of Six Treatments (2000-
2004)
24.428.2
21
57.2
18.4 17.2
27.7
18.120.7
14.5
44.7
27.222.8
24.7
0
10
20
30
40
50
60
70
1 2 3 4 5 6 overall
Treatments
NO
3-N
(m
g/L)
Corn Soybean
Figure 2. Average Corn Yields and Stalk nitrate tests for 2000-03
168
176173 174
164169
735 723849
1316
713613
100
110
120
130
140
150
160
170
180
190
200
1 2 3 4 5 6
Treatments
Cor
n Y
ield
, bu/
ac
0
500
1000
1500
2000
2500
Stal
k N
O3-
N, p
pm
Corn Yield Stalk Concentration
Low
Marginal
Optimal

- 31 -
FIELD EVALUATION OF GRAVEL FILTERS FOR DEPRESSIONAL AREAS IN FARM FIELDS
Andry Z. Ranaivoson1, John F. Moncrief, and Mark A. Dittrich2
1. Soil, Water, and Climate Department 2. Minnesota Department of Agriculture
Univeristy of Minnesota St. Paul, MN St. Paul, MN
Keywords: Drainage, Corn, Soybean, Rock Inlet, Surface Inlet, Water Quality
EXECUTIVE SUMMARY
Farmers are challenged to remain profitable while also minimizing their impact on the environment. Adoption of practices or structures that help address that environmental challenge will be accelerated if they are voluntary, cost-effective, and practical. This paper presents the findings of a recent study on gravel filters for drain tile inlets, which details why this practice has the potential to help meet this challenge.
Managing water in depressional areas with surface intakes is important for crop production, but can result in downstream impacts to lakes, rivers, and streams. The starting point of a good management strategy is to use conservation tillage to minimize delivery of water to these depressions. Recent research has shown that runoff, sediment, and associated contaminants can be reduced ½ to ¾ with 19% compared to 5% cover after planting averaged over corn-soybean rotation. Previous research has shown that approximately 20% of the sediment bound contaminants that are delivered to the depression by runoff enter an open inlet. The rest settle out in the ephemeral pond during large runoff events.
By replacing an open inlet with a gravel filter, losses of sediment bound contaminants can be further reduced 20-28%. This study has also shown that gravel filters preferentially trap sediment with higher P concentrations. Based on the precipitation during this study considered in a historical climatic context, it is estimated that untilled gravel filters will have a life span of at least ten years. Tilling through gravel filters greatly increases sediment deposition. This reduces water flow but increases sediment filtration due to reduced grave l pore space.

- 32 -
FIELD EVALUATION OF GRAVEL FILTERS FOR DEPRESSIONAL AREAS IN FARM FIELDS
INTRODUCTION
Drainage in the Midwest is important for profitable crop production. However, surface drainage poses a threat to contamination of rivers and lakes by oxygen demanding materials and phosphorus. The challenge is to remove excess water from agricultural fields without contributing excessive loading of pollutants to rivers and lakes.
For years hunters have realized that Minnesota’s prairie-pothole landscapes provide excellent habitat due to the thousands of depressions that collect water ephemerally. Farmers have also realized that drainage of these depressions results in better yields. These depressions are usually drained by a riser pipe at the soil surface that is connected to a system of underground piping leading to drainage ditches or streams.
Research has been conducted in Minnesota since 1995 to investigate the differences in losses of potential pollutants into open surface inlets compared to rock or gravel filters. This publication discusses the research and offers recommendations concerning replacing open inlets with gravel filters.
When the landscape drains to an enclosed depression often a vertical pipe is extended to the surface from subsurface piping to allow runoff water to enter directly to ditches, streams, rivers, and lakes. On Minnesota “prairie pothole” landscapes, soils are generally poorly drained and it is necessary to have surface tile inlets to remove water rapidly enough (usually less than 24 to 48 hrs.) to reduce plant stress. Research in Minnesota has shown that during an intense rainfall only about 15-20% of the particulate contaminants that are delivered to a surface inlet actually enter the inlet (Ginting et al., 2000). The remainder settles out in the pond that forms around the inlet. The 15-20% of contaminants that enter the surface inlet can be further reduced when a gravel filter is used rather than on open inlet.
The best “first line” approach to reduce contaminant delivery through surface inlets is to use crop residue management in the fields to minimize the pollutants that are delivered to the surface inlet. If fields have poor surface drainage and poor internal drainage, crops will respond to primary and secondary tillage that aerate top soil, decrease crop residues, and accelerate surface temperatures to improve seedbed conditions for germination. A study by Ginting et al., 2000 near Lewisville, MN illustrates the effectiveness of a modest amount of soil cover on these landscapes.
A Ph.D thesis was recently completed by Andry Ranaivoson (2004) addressing issues related to replacing open surface inlets with gravel filters. His research focused on field testing the filtration theory for gravel sized rock (1/4 to ¾ inches) and how this gravel filters performed in clay loam soils in Minnesota. The objectives of this study were to: 1) measure the effectiveness of the gravel in trapping of sediment and nutrients, and 2) estimate the longevity of a gravel rock inlet structure.
METHODS AND RESULTS
A perforated plastic pipe covered with a geotextile fabric delivered water that had passed through the gravel to a pipe in a 1500 gallon concrete buried tub, which had three sensors to measure flow.
1. area/velocity sensor based on Dopler shift, measures full pipe flow

- 33 -
2. impeller, measures full pipe flow 3. flume to measure less than full pipe flow. There are automated grab samplers
in the instrument shelter with inlets in the pipe in the tank as well as on the soil surface.
The flow rate of water that has passed through the gravel is measured every minute and that data is stored in a data logger. Every 10 minutes a 10 ml water sample is taken at the soil surface and in the pipe below the gravel. Ten of these small water samples are composited in one liter collection vessels. Samples are then retrieved and brought back to the laboratory for chemical analysis and information is downloaded from the data storage module to determine flow measurements. The data stream provides a detailed picture of the flow and chemistry over the course of the runoff event.
A summary of rainfall runoff events at the LeSueur County site are shown in table 1. In 2002 and 2003 there was no runoff from rainfall at the Watonwan County site. Filtration efficacy: water samples above and below gravel
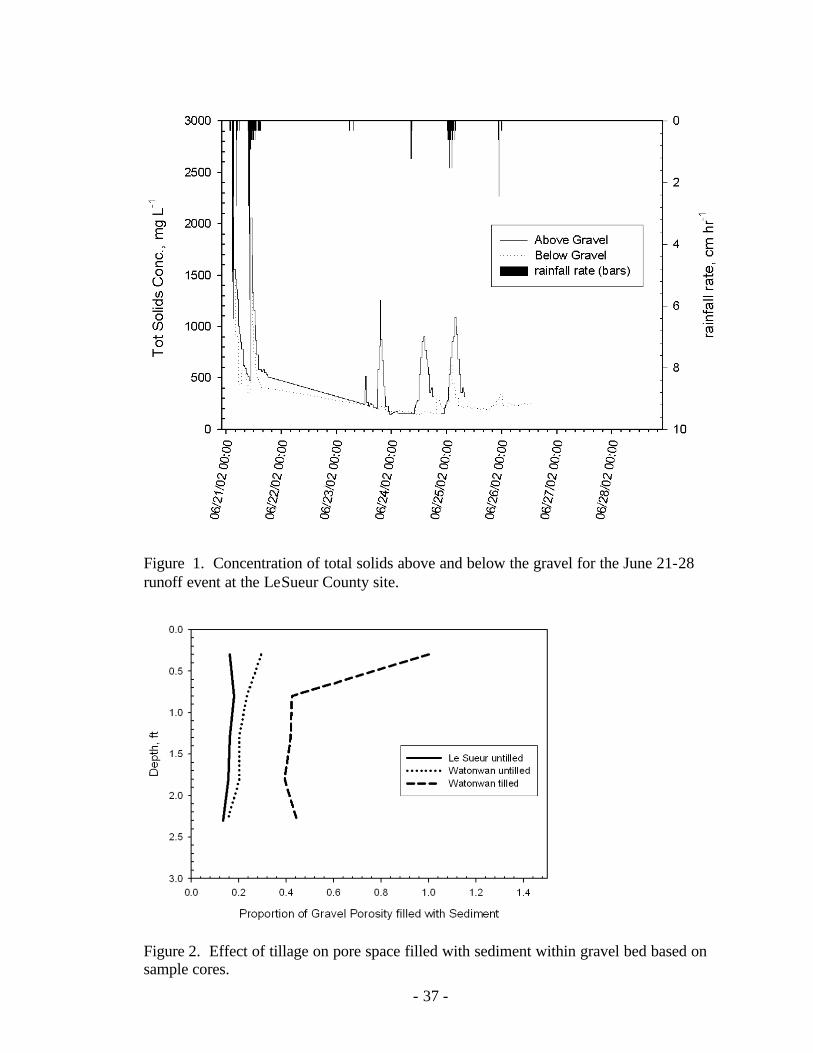
Estimates of filtration effectiveness of the gravel filter were done using two methods. The first method was to take water samples above and below the gravel to estimate concentration differences (example shown in figure 9) of solids in the solution. This graph of total solids concentration vs. time during a significant runoff event in June 2002 shows that most of the filtration occurred when concentrations are greater than ~ 200 mg/L. Most of the delivery of soil occurred during this June thunderstorm when saturated antecedent soil conditions were already present. The crop canopy was not fully developed when this storm event occurred.
The amount of estimated deposition in the gravel filter expressed on a field drainage area basis is shown in table 2. Trapping in the gravel has occurred for the particulate constituents (sediment, particulate P, and Chemical Oxygen Demand-COD). Negative numbers in this table mean that there is more coming out of the bottom of gravel than is going into the top. This is true for soluble P and nitrate nitrogen. There is release of soluble P from the fines already trapped in the gravel. So the total P (sum of soluble and particulate) trapped is reduced somewhat. In this study there was very little nitrate or ammonium in overland flow to the gravel inlet. Nitrate from water flow from the soil at the side wall of the gravel bed (toward the end of a runoff event) is responsible for the negative number for nitrate although the values are very small relative to soil levels.
The trapping efficiency of the gravel for particulate constituents in runoff ranged from 20 to 28% (table 3). This is how much reduction in runoff occurred after passing through the gravel filter. Although the trapping of particulate P was higher than sediment there was an increase in soluble P. This explains why the total P trapping is lower than the particulate. It was also observed that most of the filtration occurred during the first 4-8 hours of runoff when concentrations were the highest (figure 1).
When load contributions of sediment for all of the runoff events were summed, the results from this method showed that 32% of the pore space in the gravel filter was filled (mostly from the June 21, 2003 event). Based on the probability of the occurrence of storms in this study, it was estimated that the gravel filter would have a functional life span of at least 10 years when the surface of the gravel filter is undisturbed by tillage. Filtration efficacy: gravel coring method
The second method of estimation was by taking cores of the gravel filter at the end of the study and separating gravel and soil. The gravel filters were sampled in six inch

- 34 -
increments to a depth of four feet. Sediment that was separated from gravel by sieving and then analyzed for soil test P and total P. The concentrations were then multiplied by the amount of sediment in each core increment to calculate the amount of each form of P deposited throughout the gravel. At the Watonwan County sites, one gravel filter was exposed to tillage and planting, while the other gravel filter was not. This was done to assess the effect of tillage on gravel filter longevity.
As stated earlier, the “above and below” sampling method at the LeSueur County site resulted in an estimate of 32% of the porosity was filled with sediment. The field measurement using the soil coring method suggested that less than 20% of the pore space was filled (figure 2). Recall that at this site gravel was not tilled through.
At the Watonwon County site, about 25% of the pore space was filled with sediment without tillage. In the same field, the tilled gravel filter was completely filled with soil at the surface and there was as very steep vertical gradient. Beyond the one foot depth, 50% of the pore space was filled with sediment. This illustrates the effect of tillage on soil accumulation within the gravel filter. Some have proposed that one could remove the top foot of gravel to rejuvenate a plugged gravel filter. This study suggests that there would be significant accumulation of soil below this depth when gravel is tilled. Soil test P: landscape position and field history
As soil particles are transported across a field the larger ones settle out in small depressions. Since P is largely associated with the smaller particles, the concentration in the sediment increases as it moves down slope (P enrichment). Also, as soil is eroded from higher landscape positions it exposes the underlying material which has a natively lower soil P content. The end result is shown in figure 3 for the LeSueur County site. This figure is a surface map of the field with a soil test P map superimposed on it (5 ppm contours). The soil test P ranges from 15 to 50 ppm from the ridge tops to the depression bottoms. Managing crop residues to hold soil in place helps prevent this type of variability in soil test P. Generally the soil test P at the LeSueur County site is higher than at the Watonwan County field.
The spatial distribution of the soil test P for the Watonwan County site is shown in figure 4. At this site there was an old barn yard near the eastern field boundary that had livestock (dairy) until the late 1960s. The soil test P is very elevated in this area. Soil has a very high capacity to hold P and high levels last for many years. Since this part of the field was in the drainage area of the untilled gravel filter it had a significant influence on the soil P levels in the sediment transported to this gravel filter. The soil test P levels in the rest of the field are fairly uniform Phosphorus distribution in gravel filters
The spatial distribution of soil test concentrations and amounts are shown in figures 5-8. The concentration of P is much higher near the surface of the gravel filter. This suggests that filtration of the soil particles that are carrying the most P are being preferentially filtered out. This trend can be seen with soil test extractable P as well as total P. At the LeSueur County site there was less of a vertical gradient in concentration and deposition. The deposition was the highest at this sight.
The effect of the old farm site at the Watonwan County site, which comprises about a quarter of the drainage area for the untilled gravel inlet, is apparent by the higher soil P concentrations. This can also be seen in the deposition. Although there was much higher sediment deposition in the tilled gravel inlet, concentrations were much lower due

- 35 -
the lower soil test values in the area draining to this inlet. These off setting characteristics resulted in similar P deposition within the gravel with the tilled and untilled sites. If the field had a uniform soil test P deposition would be much higher with tillage.
SUMMARY
• Farmers are challenged to minimize crop stress from too much water by hastening
the drainage from their fields. Their challenge is to accomplish this goal while still minimizing the losses of pollutants.
• One effective and economic method of reducing runoff losses is using crop residues from the previous year’s crop.
• Due to settling only 20% of the sediment delivered to open surface tile inlets actually enter the inlet.
• Gravel filters can further reduce this loss by an additional 20 to 28%. • Based on a historical climatic context it is estimated that untilled gravel filters
will last at lease ten years. • Tilling through gravel filters greatly increases the rate of sediment deposition.
REFERENCES
Ginting, D., J. F. Moncrief, S. C. Gupta. 2000. Runoff, Solids, and Contaminant Losses into Tile Inlets Draining Lacustrine Depressions. J. Environ. Qual. 29:551-560 Ranaivoson, Andry Zo Herve'. 2004. Effect of fall tillage following soybeans and the presence of gravel filters on runoff losses of solids, organic matter, and phosphorus on a field scale. Ph.D. Thesis, University of Minnesota, St. Paul, MN

- 36 -
Table 1 Rainfall events resulting in runoff at the LeSueur County site (inches). Date of Event Rainfall Runoff 6/21/02 to 6/26/02 3.5 1.8 8/3/02 to 8/6/02 3.0 .7 8/21/02 to 8/23/02 3.2 .7 10/4/02 to 10/12/02 2.9 .8 5/9/03 to 5/11/03 2.2 .1 Total 4.1 Table 2. Deposition of various runoff constituents in gravel filter based on concentration differences above and below the gravel.
Table 3. Trapping efficiency of gravel filter for rainfall runoff in 2002 and 2003.
Date Total
SolidsCOD
Total Phosp.
Particulate Phosp.
21-Jun-02 32% 42% 32% 58% 3-Aug-02 25% 24% 7% 20% 21-Aug-02 8% 8% 4% 19% 4-Oct-02 25% 22% 12% 31%
10-May-03 13% 14% 0% 12%
Average 20% 22% 11% 28%
Total Solids (lbs/acre)
COD (lbs/acre)
Soluble P (g acre)
Particulate P (g acre)
Total P (g acre)
NO3-N (g acre)
21-Jun-02 58.5 12.3 -3.2 40.8 37.7 -204.53-Aug-02 6.4 1.6 -1.2 2.9 1.7 -14.9
21-Aug-02 1.5 0.4 -1.4 2.2 0.8 -17.24-Oct-02 7.9 1.8 0.3 4.7 5.0 -38.5
11-May-03 0.3 0.1 -0.1 0.1 0.0 -40.5Total 75 16 -6 51 45 -275
- 37 -
Figure 1. Concentration of total solids above and below the gravel for the June 21-28 runoff event at the LeSueur County site.
Figure 2. Effect of tillage on pore space filled with sediment within gravel bed based on sample cores.

- 38 -
Figure 3. The effect of landscape position on soil test P at the LeSueur County site. The depression in the northeast corner had the gravel filter installed (labeled SI6).
Figure 4. Spatial distribution of Olsen soil test P (ppm, vertical axis) at the Watonwan County site. The x and y axis are in meters. The location of the two gravel filters is shown by the dots. The one closest to the reader was tilled through. The peak on the far side shows the high soil test from an old farm site.
LeSueur Co Soil Test 1999 P (Bray) 0 to 3 inch
SI 6
SI 4
P (Bray)
0 5 10 15 20 25 30 35 40 45 50 55

- 39 -
Figure 5. Distribution of soil test P levels in the trapped soil within the gravel filters (Olsen P at Watonwan and Bray P at LeSueur Counties).
Figure 6. Distribution of soil test extractable P trapped within the gravel filters (Olsen P at Watonwan and Bray P at LeSueur Counties).

- 40 -
Figure 7. Distribution of total P concentrations in the trapped soil within the gravel filters.
Figure 8. Distribution of total P in the trapped soil within the gravel filters.

- 41 -
AGRICULTURAL DRAINAGE MANAGEMENT: EFFECTS ON WATER CONSERVATION, N LOSS AND CROP YIELDS
R. Wayne Skaggs, Mohamed A. Youssef and Robert O. Evans
Department of Biological and Agricultural Engineering, North Carolina State University
Key words: Drainage, Controlled Drainage, Nitrogen, Water Quality
EXECUTIVE SUMMARY
Agricultural drainage management via subirrigation and/or controlled drainage has been practiced in scattered locations for many years. We have conducted research on this practice in North Carolina since the early 1970s. Research on a total of 14 different soils showed that CD reduced drainage volume by 40 to 50% compared to conventional drainage. N loss from these lands was reduced by 40 to 50%. The loss of phosphorus (P) to surface water was also reduced by 25 to 35%. The effect of CD on crop yields was strongly dependent on management. Average response was about a 5% increase in yields when CD is effectively managed. Yield response varied significantly from year-to-year with farmers reporting much greater response to CD in some years than in others. Controlled drainage works best on relatively flat land (<0.5% slope) and on intensive drainage systems (close drain spacings or high soil permeability). Controlled drainage (CD) was accepted by the State of North Carolina as a best management practice (BMP) for reduction of nitrogen (N) loss to surface waters in the 1980s and is cost shared for that purpose. It is currently being practiced on over 300,000 acres of cropland in the state with an estimated total reduction of N entering surface waters of more than 3,000,000 lbs annually.
How will agricultural drainage management work in the Midwest? Large differences in climate, soils, and farming practices make it difficult to estimate the performance based on NC results. However studies conducted in Ohio and Canada indicate that CD can have a similar effect of reducing N loss to surface waters as observed in studies in NC. Additional research is ongoing in the Midwest. In order to determine the relative effect of location and climate on the effectiveness of CD, we conducted a simulation study for a Drummer soil at three locations, Wescea, MN, Urabana, IL, and Plymouth, NC. Results indicated that, other factors remaining constant, CD would be more effective in the North Carolina and Illinois sites, than in Minnesota. The difference is primarily due to the distribution of drainage within the year at the three sites. For both NC and IL most of the drainage occurred during the months of October, November, December, January, February, and early March when drainage is not critical for crop production. Drainage could be controlled and water tables raised during those months without negative effects on crop production. At the MN site, on the other hand, most of the drainage occurred during April through June, when drainage is essential for seedbed preparation, planting and the initial part of the growing season. Thus, there was less opportunity to control drainage at the Minnesota site. CD was still effective in some years, but the distribution of drainage during the year makes management of the system a more critical issue. Results of the 50-year simulations predicted that CD would reduce N losses to surface waters by an average of 18%, 21%, and 13% for the North Carolina, Illinois, and Minnesota sites, respectively.

- 42 -
COMPARISON OF SOIL PROPERTIES AND WATER QUALITY IN ALTERNATIVE AND CONVENTIONAL CROPPING SYSTEMS
Kari Rolf1, Jeffrey S. Strock2, David J. Mulla1
1Department Soil, Water, and Climate, University of Minnesota 2Southwest Research and Outreach Center, University of Minnesota, Lamberton, MN
Keywords: Cropping Systems, Water Quality, Soil Properties, Alternative
EXECUTIVE SUMMARY
Overall, alterna tive management practices improve soil physical properties and provide potential environmental benefits to improve water quality compared with conventional management practices. There were no significant differences in soil organic carbon or clay contents between the alternative and conventional management systems, except for higher clay content in subsoils under conventional management. Bulk density in the A horizons was 3% lower under alternative management practices (1.39 Mg m-3) compared with conventional practices (1.43 Mg m-3). There were no significant differences in field capacity water content (0.375 cm3 cm-3) between alternative and conventional management practices in the A horizon. Saturated hydraulic conductivity (Ks) in the A horizon under alternative management practices was 45.5 cm d-1, 2.5 times faster than under conventional management practices (18.1 cm d-1). Results indicate that the alternative system reduced subsurface drainage discharge by 41% compared with a conventional system. Flow-weighted mean nitrate-nitrogen (N) concentrations during tile flow were 8.2 mg L-1 and 17.2 mg L-1 under alternative and conventional management practices, respectively. Nitrate-N losses in the subsurface drainage water from the alternative system were 3.8 times lower than from the conventional system.
INTRODUCTION
In the 2000 National Water Quality Inventory Report to Congress, 39% of the inventoried rivers and streams in the United States were designated as impaired, and another 8% were threatened for one or more uses (USEPA, 2002). State reports showed that agricultural pollution contributed to 48% of the reported water quality problems in impaired rivers and streams (USEPA, 2002). Section 303(d) of the Clean Water Act requires states develop total maximum daily loads (TMDLs) for all surface waters that exceed water quality standards. Changes to current crop and livestock production systems will be necessary to meet emerging TMDLs.
While previous research has focused on soil spatial variability between landscapes and within soil series (Warrick and Nielsen, 1980; Wilding and Drees, 1983; Wilding, 1985; Mulla and McBratney, 2002), few investigations have compared soil characteristics and water quality from adjacent fields with similar soil series but varying cropping systems and management practices. Studying adjacent fields minimizes the possibility for different soil- forming factors, such as climate and landscape position, to influence soil variability (Reganold, 1988).

- 43 -
This paper will describe the results from comparisons of soil properties and water quality in alternative and conventional cropping systems. Alternative and conventional farming systems differ in their soil and crop management practices. While conventional farming systems aim to maximize crop yield, alternative farming systems focus on sustainability. Conventional management practices rely on the use of inorganic fertilizers, herbicides, and pesticides for crop production and elimination of weeds and insects. In contrast, alternative farming systems focus on natural processes, manures, and green manures for crop production and weed and pest control and use crop rotation as a primary means of management. The objective of this study was to quantify differences between soil properties and nitrogen, phosphorus, and sediment losses through subsurface drainage from alternative and conventional farming practices.
METHODS
This study was conducted at the University of Minnesota Southwest Research and Outreach Center near Lamberton, Minnesota. Soils at the site were formed in glacial till. The study focused primarily on the Webster (Typic Endoaquolls) clay loam, and Normania (Aquic Hapludolls), and Ves (Calcic Hapludolls) loam soils. Webster soils are typically poorly drained and are located at bottom slope positions. Normania soils are moderately well drained and are located on concave midslope areas, while Ves soils are well drained and are located on convex upper slope areas. The research was conducted on adjacent fields containing non-replicated, long-term alternative and conventional management practices, each covering 65 ha (160 acres). Alternative cropping system species included corn, soybean, oat, alfalfa, buckwheat, hairy vetch, rye, native prairie grasses, and other perennial species, while the conventional system consisted mainly of corn and soybean. The experimental areas are drained by subsurface tile drains spaced approximately 55 m (180 feet) apart and 1.2 m (4 feet) below ground surface. The drainage design includes three surface inlets and one rock inlet in the alternative farming system and one rock inlet in the conventional farming system (Figure 1). Soil Collection and Analysis
Soil sampling was conducted across the entire 130 ha (320 acre) site using a grid design with spacings of 133 m (436 feet) in the east/west direction and 159 m (521 feet) in the north/south direction (Figure 2). Thirty soil cores were collected from each of the alternative and conventional management systems in 2002 and 2003 for a total of 60 cores. Soil analyses included: soil texture (sand, silt, and clay), organic carbon content, soil moisture retention, vertical saturated hydraulic conductivity (Ks), and bulk density. Soil analysis was performed by horizon. Soil formation results in the development of distinct horizontal layers or horizons that distinguish one soil from another. The upper most horizon near the soil surface is called the A horizon. This horizon is usually higher in organic matter and darker in color than the lower horizons. The layers underlying the A horizon contain comparatively less organic matter than the horizons near the soil surface. The next lower horizon, called the B horizon, is a zone of accumulation of clays and iron oxides. The C horizon, located below the B horizon, is the least weathered horizon and is often characteristic of the parent material in which the soil developed.

- 44 -
Water Collection and Analysis. Subsurface water quantity and quality data were collected with ISCO 3700 portable samplers (ISCO, Inc., Lincoln, Nebraska). Monitoring systems were installed in 2002 at three locations: the main tile draining the alternative farming system and two tiles draining the conventional system (Figure 1). Surface water runoff was not monitored. Subsurface drainage flow and quality was monitored from the alternative and conventional systems on a continuous basis during periods of flow: April - October 2002, April - July 2003 and April - November 2004. Up to 24 1000-mL volume water samples were collected during storm events to quantify storm nutrient and sediment losses. In addition, one 1000-mL sample was collected weekly to quantify nutrient loss between storm events. All samples were analyzed for nitrate-nitrogen, dissolved reactive phosphorus and total phosphorus, and total solids and total suspended solids when present.
RESULTS
Comparison of Soil Properties in Alternative and Conventional Cropping Systems There were no significant differences in sand and silt content or organic carbon content between alternative and conventiona l management practices for any of the soil horizons (Table 1). There was also no significant difference in clay content between the two management practices in the A horizon. However, clay content was significantly lower under alternative management practices compared with conventional practices in the B and C horizons. Bulk density was significantly lower under alternative management practices for all analyzed soil horizons compared with conventional practices (Table 2). The lower bulk densities under alternative management practices indicate enhanced soil structure, which typically leads to improved soil aeration and ease of root penetration. Reduced bulk density in soils under alternative management practices could be due to increased rooting depth and rooting density that are often associated with alternative crop rotations. Field capacity water content was higher with alternative management practices than conventional practices for the A and C soil horizons, but the difference was significant for the C horizon only (Table 2). The lack of a significant difference in the A horizon field capacity water content indicates that following free drainage, under initially wet soil conditions, the alternative and conventional management systems would not have significantly different water contents. The significantly higher field capacity water content in the C horizon with alternative management practices indicates that when the water table is below the tile drain, soils with alternative management practices will require more infiltrated water to raise the water table above the tile drain before drainage is initiated compared with conventional practices. Saturated hydraulic conductivity in the A horizon of soils was significantly faster under alternative management practices compared with conventional practices (Table 2). Faster surface soil Ks would be expected to lead to greater infiltration and less surface runoff for alternative management practices compared with conventional practices. In contrast to significantly faster Ks in surface soils, subsurface soils exhibited slower Ks values under alternative management practices compared with conventional practices; however, the differences were not significant (Table 2).

- 45 -
Comparison of Water Quality in Alternative and Conventional Cropping Systems Below average rainfall occurred in 2003 and above average rainfall in 2004. Overall, rainfall during the 2002 sampling season was relatively close to the 40-year cumulative average. Through the end of June, typically the period when most of the nitrate-N losses in subsurface drainage occur, cumulative rainfall patterns did not differ significantly between 2002 and 2003. Cumulative precipitation through the end of June was significantly greater in 2004 than in previous years, and there was a large increase in precipitation during September of 2004, relative to the previous years. Flow-weighted mean nitrate-nitrogen concentrations (FWMNC) under alternative farming system were less than the 10 mg L-1 drinking water standard for all three sampling seasons, while the conventional farming system exceeded the drinking water standard throughout the study (Table 3). This indicates that under similar climatic conditions, there is a higher risk of polluting drinking water sources from conventional farming practices in comparison to the risks from alternative farming practices. Flow-weighted mean dissolved reactive phosphorus (DRP) and total phosphorus (TP) concentrations in subsurface drainage were less than 0.1 mg L-1 throughout the study period (Table 3). These results agree with the long-accepted assumption that agricultural phosphorus contributions to surface water pollution from subsurface drainage losses are negligible. Alternative farming practices have a greater impact on reducing water loss in average and wet years (2002 and 2004, respectively) compared with dry years (2003) (Table 4). Drainage as a percent of precipitation was 21.9% versus 28.4% in 2002, 16.0% versus 17.5% in 2003 and 13.7% versus 32.0% in 2004 under alternative and conventional farming practices, respectively. These results show that subsurface drainage represents a greater proportion of precipitation received under conventional farming practices in comparison with alternative practices. This is a consequence of greater field capacity water content in the C horizon under the alternative management system. Perennial species in alternative crop rotations exhibit higher evapotranspiration rates over a longer period of time in comparison with corn and soybean crops in a conventional cropping system, thereby reducing the amount of water lost through subsurface drainage.
Annual nitrate-N yields were less in subsurface drainage under alternative farming practices in comparison with conventional practices in all years (Table 4). The reduced yield of nitrate-N under alternative versus conventional management is likely due to a combination of fertilizer source and rate for the two systems. Animal manures and legumes in rotation were used to provide nitrogen to the soil under alternative farming practices, while synthetic fertilizers were used in the conventional system. Animal manures release nitrate-N more slowly than synthetic fertilizers. A slow release of nitrate-N may allow for more nitrogen uptake by plants in alternative farming practices compared with conventional practices, reducing the amount of nitrate-N leached from the soil. Phosphorus losses from agriculture are primarily associated with surface runoff, as phosphorus readily adsorbs to sediment that is lost in soil erosion. In view of this, large losses in phosphorus through subsurface drainage were not expected in this study. Consistent with this expectation, annual yields of dissolved reactive phosphorus and total phosphorus were minimal and not considered a concern for surface water pollution. As surface runoff of nutrients and sediment in surface flows entering tile inlets were not measured, sediment concentrations in surface flow entering tile inlets could not be

- 46 -
separated from sediment concentrations in subsurface drainage. As a result, the sediment data cannot be interpreted with any degree of confidence.
SUMMARY
In 2002, there were 22.73 million acres of crop land in Minnesota (NASS, 2002). Corn and soybean were grown on 14.4 million acres while certified organic production occurred on 43,375 acres. Clearly alternative/organic production systems account for only a minute sector of current agricultural production in Minnesota. However, the benefits of adopting alternative production practices and/or increasing crop diversity on soil and water quality cannot be ignored.
REFERENCES
National Agricultural Statistics Service. 2002. 2002 Census of Agriculture. USDA-NASS, Washington, D.C. Mulla, D.J. and A.B. McBratney. 2002. Soil spatial variability. p. 343-373. In A.W. Warrick (ed.) Soil physics companion. CRC Press, Boca Raton, FL. Reganold, J.P. 1988. Comparison of soil properties as influenced by organic and conventional farming systems. Am. J. Alt. Ag. 3(4):144-155. United States Environmental Protection Agency. 2002. National water quality inventory 2000 report. EPA-841-R-02-001. USEPA, Washington, DC. Warrick, A.W. and D.R. Nielsen. 1980. Spatial variability of soil physical properties in the field. p. 319-344. In D. Hillel (ed.) Applications of soil physics. Academic Press, New York, NY. Wilding, L.P. 1985. Spatial variability: its documentation, accommodation and implication to soil surveys. p:166-189. In D.R. Nielsen and J. Bouma (eds.) Soil spatial variability: Proceedings of a workshop of the ISSS and the SSSA, Centre for Agricultural Publishing and Documentation, Wageningen, the Netherlands. Wilding, L.P. and L.R. Drees. 1983. Spatial variability and pedology. p. 83-116. In L.P. Wilding, N.E. Smeck, and G.F. Hall (eds.) Pedogenesis and soil taxonomy I. Concepts and interactions. Developments in soil science IIA. Elsevier Science Publishers B.V., Amsterdam, The Netherlands.

- 47 -
Table 1. Median, minimum, and maximum values for soil texture and organic carbon at different horizons under alternative (AL) and conventional (CN) management practices.
Soil property
Sand content Silt content Clay content Organic carbon Statistic AL CN AL CN AL CN AL CN
% A horizon
Median 35.7 37.0 33.7 31.8 30.3 31.4 2.3 2.2 B horizon
Median 37.4 37.4 31.6 31.0 29.2** 32.6** 0.7 0.6 C horizon
Median 38.7 36.1 35.3 32.9 27.6** 29.7** 0.0 0.1 **Significant at the 0.01 probability level. Table 2. Median, minimum, and maximum values for soil physical properties at different horizons under alternative (AL) and conventional (CN) management practices.
Soil physical property
Bulk density Saturated hydraulic
conductivity Field capacity water content
Wilting point water content
Statistic AL CN AL CN AL CN AL CN Mg m-3 cm d-1 cm3 cm-3 cm3 cm-3
A horizon Median 1.39** 1.43** 45.5** 18.1** 0.38 0.37 0.20** 0.23**
B horizon Median 1.44** 1.48** 123.7 166.5 0.34 0.35 0.16** 0.19**
C horizon Median 1.50** 1.57** 57.2 71.9 0.36** 0.35** 0.19* 0.20* * Significant at the 0.05 probability level.

- 48 -
Table 3. Total drainage (cm) and nitrate-nitrogen (NO3),dissolved reactive phosphorus (DRP), total phosphorus (TP), total suspended solids (TSS) and total solids (TS) daily mean yields in (kg ha-1) in subsurface drainage from alternative (AL) and conventional (CN) management practices for sampling seasons April 13 – August 27, 2002, May 1 – July 11, 2003 and May 23 – November 11, 2004.
†NS = Parameter not sampled because sediment was not observed.
Table 4. Daily flow-weighted mean concentrations (mg L-1) for nitrate-nitrogen (NO3), dissolved reactive phophorus (DRP), total phosphorus (TP), total suspended solids (TSS) and total solids (TS) in subsurface drainage from alternative (AL) and conventional (CN) management practices.
†Within column and year, daily flow-weighted mean concentrations followed by the same letter are not significantly different at the 0.05 probability level. Values not followed by a letter were not statistically analyzed to due a small number of samples. ‡NS = Parameter not sampled because sediment was not observed.
Water Quality Parameters Management
Practice Drainage NO3 DRP TP TSS TS 2002
AL 9.01 6.27 0.01 0.02 NS† NS CN 11.70 17.16 0.02 0.03 NS NS
2003 AL 3.36 2.88 0.01 0.01 NS NS CN 3.97 5.71 0.00 0.01 NS NS
2004 AL 8.18 8.34 0.06 0.08 8.73 68.52 CN 19.08 42.95 0.15 0.19 11.42 139.39
Water Quality Parameter Management
Practice NO3 DRP TP TSS TS 2002
AL 7.01a† 0.011a 0.03a NS‡ NS CN 17.01b 0.014b 0.03a NS NS
2003 AL 7.76a 0.02a 0.03a NS NS CN 14.74b 0.02a 0.03a NS NS
2004 AL 9.78a 0.04a 0.06a 148.3 4710.9 CN 19.98b 0.07b 0.09b 24.6 1009.6

- 49 -
Figure 1. Subsurface drainage design for the alternative and conventional fields.
Figure 2. Soil sample locations and soil series boundaries within the alternative and conventional management practices.

- 50 -
PAIRED OPEN-DITCH GEOMETRY, WATER QUANTITY AND WATER QUALITY
Jeffrey S. Strock
Southwest Research and Outreach Center, University of Minnesota Lamberton, MN
Keywords: Ditch, Drainage, Water Quantity, Water Quality
EXECUTIVE SUMMARY
The Minnesota River carries a considerable amount of sediment, phosphorus, and nitrogen from central and southwest Minnesota to the Mississippi River. Strategies to improve water quality often involve adoption of agricultural Best Management Practices (BMP’s), participation in state and federal conservation programs, and monitoring water quality to track changes in pollutant loads over time. Despite these efforts, some water bodies still do not meet water quality standards. An undeveloped potentially worthwhile strategy for improving water quality in Minnesota is the use of open-ditches for treatment of drainage runoff. Sediment and nutrient loading reduction may be achieved through a variety of treatment methods and/or drainage ditch modification. Construction of two side-by-side, 200 m long, drainage ditches at the University of Minnesota - Southwest Research and Outreach Center (SWROC), Lamberton, MN are providing research data that will be used to identify the effectiveness of open-ditches to reduce sediment and nutrients from runoff and drainage in an agricultural landscape.
INTRODUCTION
Nutrient losses to surface waters are of great concern nationally and regionally. In the 2000 National Water Quality Inventory Report to Congress, 39% of the inventoried rivers and streams in the United States were designated as impaired, and another 8% were threatened for one or more uses (USEPA, 2002). It was stated that agriculture was the leading source of pollution in assessed streams and rivers. State reports showed that agricultural pollution contributed to 48% of the reported water quality problems in impaired rivers and streams (USEPA, 2002).
Eutrophication, caused by inputs of nitrogen and phosphorus, is a common problem in lakes and rivers (Carpenter et al., 1998). Eutrophication causes increased growth of algae and nuisance aquatic plants that interfere with use of the water resource for fisheries, recreation, industry, agriculture, and drinking. Oxygen depletion caused by decomposition of nuisance plants causes fish kills. Eutrophication is also a factor in the loss of aquatic biodiversity. Phosphorus toxicity is indirect and caused by toxic algal blooms or anoxic conditions stimulated by phosphorus pollution. In contrast, nitrogen as nitrate in water is toxic to humans and other mammals. Nitrate in water is toxic at high concentrations and has been linked to methemoglobinemia in infants and toxic effects on livestock (Amdur et al., 1991).

- 51 -
Subsurface drainage systems have been installed on over 15 million hectares of U.S. crop land (Pavelis, 1987). In watersheds where artificial drainage is practiced, surface and subsurface runoff from agricultural lands is often carried by a network of open-ditches that function as headwater streams. According to Helland (1999), Minnesota has more than 43,000 km of open ditches that act to transport excess water, nutrients, sediment, pathogens, and pesticides from agricultural fields to small streams and larger rivers. Little is known about how these modifications alter the capacity of streams to retain nutrients or other potential water pollutants.
This paper will describe the design of a pair of drainage ditches and the research objectives for meeting water quality goals. The research objectives of this project are to: 1) evaluate the biogeochemical mechanisms and processes that control nitrogen and phosphorus cycling to and through open-ditch ecosystems (relative to natural streams) and how these mechanisms and processes vary spatially and temporally; and 2) evaluate the effectiveness of open-ditch management strategies (including natural and artificial carbon supplements) to reduce nitrogen and phosphorus loading from agricultural runoff.
METHODS
The study area is located at the University of Minnesota Southwest Research and Outreach Center near Lamberton, MN. The drainage area consists of a 106-ha watershed. The area contributing water from surface runoff to the open-ditches is 73 ha, and the area contributing water from subsurface tile drainage is 59 ha. Of the total area contributing water from subsurface drainage, 33 ha lies outside the boundary of the total area contributing surface runoff (Figure 1). An open-ditch research facility incorporating a paired design was constructed in 2002 (Figure 2). A 200-m reach of existing drainage channel was converted into a system of four parallel channels: two inner experimental open-ditch channels, and two outer overflow/diversion buffer channels that accommodate larger flows and divert direct surface water runoff. The two open-ditch channels allow for the evaluation of various performance characteristics of the channels using a statistically paired design.
Ditch Design The open-ditch channels, while smaller in length than typical drainage channels, were designed with geometries similar to that of drainage channels in the region (Table 1). A 25-yr, 24-hr (122 mm) design rainfall was selected for the experimental channels: the two channels split the design flow equally. The two experimental channels combined have a 1.4- m3/s design capacity. The outer overflow/diversion channels add an additional 1 m3/s of capacity to accommodate (with the research channels) the estimated 100-yr, 24-hr (152 mm) peak runoff from the contributing watershed. A mixing reservoir at the head of the channels provides a small storage volume (4.4 m3) for surface and subsurface runoff to mix prior to entering the experimental channels. Water enters the mixing reservoir as surface runoff from two vegetated grassed waterways and as subsurface runoff from three subsurface drainage pipes. Water control and measurement devices were installed at both upstream and downstream ends of the experimental channels. Water control is achieved by manipulating the incoming water surface elevation with vertical baffles in a 80-cm W 100-cm D 152-cm H Water Level Control Structure (Agri-Drain, Adair, IA). Used on the upstream end, these structures enable adjustment of the overall flowrate entering the channels. On the downstream end,

- 52 -
the structures (with a 244-cm height) allow researchers to create ponding effects and variable flow velocities through the channels. Measurement of channel flowrates is accomplished with 61 cm circular flume. These flumes were designed to be installed in-line, or at the end of pipe sections. Bubblers are used to measure height of water flowing through the flume. Flowrate is determined as a function of the measured water height, using rating curves for the flume. Physical Analyses: Water flow is seasonal with higher flows from April through June when spring snowmelt combines with spring rainfall and seasonally high subsurface drainage flow. Discharge from the ditch facility is monitored cont inuously. Storm event samples and weekly grab samples are collected to monitor water quality. This report only includes discharge data colleted for the east and west channels for the period 18 May to 1 July 2004. Ditch morphology is a result of construction design and maintenance, but also responds to natural fluvial processes. Longitudinal profiles along the horizontal length of each open-ditch were made every 3 m. In addition, eight longitudinal cross-sections were measured in each open-ditch. These cross-sections were located at 4.6, 11.5, 32.0, 57.9, 93.4, 128.6, 151.4, and 175.6 m from the outlet pipe on the North ditch, and at 4.4, 11.3, 31.7, 57.7, 89.5, 128.2, 154.6, and 180.8 m from the outlet pipe in the South ditch. Chemical Analyses: Nitrogen and phosphorus are the main compounds of interest in this study. The processes that control nitrogen and phosphorus in aquatic environments include a combination of physical and chemical processes. Once in an aquatic ecosystem, such as a ditch, nitrogen and phosphorus are highly chemically and biologically active, undergoing numerous transformations and moving between the particulate and dissolved phases, between the benthic sediment and water column, and between the biotic and abiotic environment. In the water column and benthic sediments, nitrogen and phosphorus are subject to deposition and resuspension, sorption and desorption, diffusion, and uptake. Beginning in 2004, water samples were collected during base- and storm-flow periods. These samples were analyzed for nutrient concentrations including nitrate plus nitrite, ammonium-N, dissolved reactive phosphorus and total phosphorus and analyzed according to standard analytical methods. Total solids and total suspended solids are also measured. Water temperature, pH, specific conductance, oxidation-reduction potential, and dissolved oxygen were also measured.
RESULTS Hydrology and Drainage Precipitation frequency, intensity, duration, and seasonal variation are important factors affecting hydrology and the loss of nutrients and sediment. Above average rainfall occurred in 2004 and, at the time this paper was written, average rainfall occurred for 2005. Cumulative precipitation through the end of June was significantly greater in 2004 than in previous years, and there was a large increase in precipitation during September of 2004, relative to the previous years. There were nine precipitation events in 2004 that caused an increase in the hydrograph (Figure 3). Initially dry soil conditions in spring 2004, coupled with frequent

- 53 -
but low intensity precipitation events resulted in relatively low surface runoff and erosion during 2004. Dry soil conditions also delayed water discharge from subsurface drainage until late May 2004. An unusually large precipitation event during September 2004 caused a large increase in the hydrograph. At the time this paper was written, there were eight precipitation events in 2005 that caused an increase in the hydrograph (Figure 3). Wet soil condition in spring 2005 and near normal precipitation resulted in water discharge from subsurface drainage in early April 2005. Baseflow during 2005 was greater than 2004 due to wet soil conditions and greater soil water available for drainage. Discharge from the east channel was 2.3 times great than discharge from the west channel. This difference is attributed to ground water contributions to the east channel. Ground water contributions to the east channel will be quantified using piezometers installed in autumn 2005. Nitrogen Flow-weighted mean nitrate-N concentrations for 2004 were east channel = 22 mg L-
1, and west channel = 24 mg L-1. Nitrate-N losses in the discharge water from the east channel was 2 times lower than from the west channel (Table 1). Similar flow-weighted mean nitrate-N concentrations between the channels suggests that there is no dilution effect as a result of ground water flow into the east channel. Analysis for ammonium-N, dissolved reactive phosphorus, total phosphorus, total solids, and total suspended solids have been completed for 2004 but are not included in this report.
Channel morphology A longitudinal transect of each channel confirmed differences in open-ditch channel bottom elevation (Figure 4). Open-ditch channel bottom elevation and gradient of the two open-ditch channels is similar. Near the end of both open-ditches the channel bottom gradient increases to the outlet pipe. The original cross-section shape of both open-ditches was trapezoidal. The cross-sections of both channels near the head end of the open-ditches generally exhibited a trapezoidal shape whereas cross-sections of both channels near the open-ditch outlets tended to exhibit a parabolic shaped channel (Figure 4). The parabolic shape coincided with the area of increased gradient in the channel bottom.
SUMMARY
Open-ditches are a common means of conveying excess drainage water from agricultural land in Minnesota. These ditches are necessary for maintaining strong agricultural production but they have the potential to lead to loading of excess sediment and nutrients to surface waters. Agricultural best management practices such as filter strips, conservation tillage and nutrient and residue management planning are currently practiced to minimizing agricultural impacts on water quantity and quality. Other approaches such as open-ditch management of water flow, vegetation, and/or management of the ditch geometry have the potential to further help agricultural and environmental managers protect Minnesota’s water resource.

- 54 -
REFERENCES
Amdur, M.O., J.Dull, and E.D. Klassen (ed.). 1991. Casarett and Doull’s toxicology. 4th Edition. Pergamon Press. NY, NY. Carpenter, S.R., N.F. Caraco, D. L. Correll, R.W. Howarth, A.N. Sharpley, and V.H. Smith. 1998. Nonpoint pollution of surface waters with phosphorus and nitrogen. Ecol. Appl. 8:559-568. Helland, J. 1999. The drainage issue. Minnesota House of Representatives, House Research Department. http://www.house.leg.state.mn.us/hrd/pubs/drainage.pdf Pavelis, G.A. 1987. Economic survey of farm drainage. In G.A. Pavelis (ed.) Farm drainage in the United States: History, status, and prospects. USDA-ERS, Misc. Publ. No. 1455:110-136. United States Environmental Protection Agency. 2002. National water quality inventory 2000 report. EPA-841-R-02-001. USEPA, Washington, DC.
Figure 1. Drainage ditch research facility
East channel West channel

- 55 -
Date
Jan May Sep Jan May Sep Jan
Q (m
3 s-1)
0.00
0.05
0.10
0.15
0.20
0.25
Pre
cipi
tatio
n (m
m)
0
20
40
60
80
100
Figure 2. Drainage system and boundaries.
Figure 3. Precipitation and hydrographs for 2004 and 2005 (east channel inlet).

- 56 -
Table 1. Discharge and nitrate-N 18 May to 1 July 2004. Drainage NO3-N inch mg/L lb/ac East channel 2.1 21.5† 18.1 West channel 0.9 24.2 8.7
† Flow-Weighted Mean Nitrogen Concentration
Distance (m)
1020 1022 1024 1026 1028 1030
Rel
ativ
e el
evat
ion
(m)
996.5
997.0
997.5
998.0
998.5
999.0
999.5
x-section 7, 153 mEast channel
Distance (m)
1058 1060 1062 1064 1066 1068
Rel
ativ
e el
evat
ion
(m)
997.0
997.5
998.0
998.5
999.0
999.5
x-section 1; 5 mEast channel
Distance (m)
0 20 40 60 80 100 120 140 160 180 200
Rel
ativ
e E
leva
tion
(m)
996.9
997.0
997.1
997.2
997.3
997.4
West channelEast channelEast channel cross-sectionWest channel cross section
Figure 4. East and west channel morphology, autumn 2004.


