Please refer to the end of this report for definitions of terms, U.S.-dollar translation methodology, Page 1 and other important disclosures. Fourth quarter (1) January - December (1) 2005 2004 % Var. 2005 2004 % Var. Net sales 3,963 2,002 98% 15,321 8,149 88% Gross profit 1,363 863 58% 6,050 3,563 70% Operating income 507 414 22% 2,487 1,852 34% Majority net income 244 334 (27%) 2,112 1,307 62% EBITDA 901 582 55% 3,557 2,538 40% Free cash flow 325 200 63% 2,013 1,478 36% Net debt 8,665 5,588 55% Net debt/EBITDA 2.4 2.2 Interest coverage 6.8 6.8 Earnings per ADR 0.69 0.99 (30%) 6.10 3.93 55% Average ADRs outstanding 352.4 339.2 4% 346.0 332.9 4% In millions of U.S. dollars, except ratios and per-ADR amounts. Average ADRs outstanding are presented in millions of ADRs. 2005 FOURTH QUARTER AND FULL-YEAR RESULTS Stock Listing Information NYSE (ADR) Ticker: CX MEXICAN STOCK EXCHANGE Ticker: CEMEX.CPO Ratio of CEMEX.CPO to CX= 10:1 Investor Relations In the United States 1 877 7CX NYSE In Mexico 52 (81) 8888 4292 E-Mail [email protected]www.cemex.com Consolidated net sales grew to US$3,963 million, representing an increase of 98% over those of fourth quarter 2004, mainly as a result of the RMC acquisition. Sales increased in most of our markets due to higher cement, ready-mix, and aggregates volumes and a better pricing environment. The infrastructure and residential sectors continue to be the main drivers of cement and ready-mix demand in most of our markets. Cost of goods sold and selling, general, and administrative expenses (SG&A) increased 128% and 91%, respectively, versus the fourth quarter of last year due mainly to the acquisition of RMC. We have mitigated higher energy and electricity costs with our energy program. The aggregate cost of energy and electricity per ton of cement produced for our portfolio increased 12% in 2005 versus 2004. EBITDA was US$901 million, an increase of 55% over that of fourth quarter 2004, despite worse-than- expected negative impact from seasonality in Europe and several unexpected end-of-year adjustments due to first-time consolidation of RMC. EBITDA margin decreased from 29.1% in fourth quarter 2004 to 22.7% in fourth quarter 2005. The margin was positively affected by higher average volumes and better pricing conditions in most markets – compensating for higher energy costs - but also reflects the change in the product mix as a result of the RMC acquisition. The increase in the depreciation and amortization expense in the fourth versus the previous quarters was due mainly to the one-time adjustment resulting from the incremental value of property, plant and equipment, and intangible assets other than goodwill, resulting from the fair-value allocation of the purchase price paid in the acquisition of RMC. Gain (loss) on financial instruments for the quarter was a gain of US$19 million, resulting mainly from our cross-currency and interest-rate swaps. Other expenses, net increased 47% to US$281 million. This includes the one-time impact of the change in the pension fund plans from defined benefit to defined contribution and liability management expenses. Majority net income for the quarter decreased 27%, from US$334 million in fourth quarter 2004 to US$244 million, and increased 62% for the full year, reaching US$2,112 million. The decrease in majority net income for the quarter comes mainly from the increased depreciation and amortization expense as well as higher other expenses, net, both explained above. Net debt at the end of the fourth quarter was US$8,665 million, representing reductions of US$235 million during the quarter and US$1,770 million since the end of the first quarter 2005. The net-debt- to-EBITDA ratio improved to 2.4 times from 2.6 times at the end of third quarter 2005. Interest coverage reached 6.8 times during the quarter, the same ratio as in the same quarter last year, and is up from 6.5 times in third quarter 2005. (1) Results for fourth quarter 2004 do not include the effect of the RMC acquisition.
Transcript
1555555 Please refer to the end of this report for definitions of terms, U.S.-dollar translation methodology, Page 1 and other important disclosures.
Fourth quarter (1) January - December (1) 2005 2004 % Var. 2005 2004 % Var. Net sales 3,963 2,002 98% 15,321 8,149 88% Gross profit 1,363 863 58% 6,050 3,563 70% Operating income 507 414 22% 2,487 1,852 34% Majority net income 244 334 (27%) 2,112 1,307 62% EBITDA 901 582 55% 3,557 2,538 40% Free cash flow 325 200 63% 2,013 1,478 36% Net debt 8,665 5,588 55% Net debt/EBITDA 2.4 2.2 Interest coverage 6.8 6.8 Earnings per ADR 0.69 0.99 (30%) 6.10 3.93 55% Average ADRs outstanding 352.4 339.2 4% 346.0 332.9 4% In millions of U.S. dollars, except ratios and per-ADR amounts. Average ADRs outstanding are presented in millions of ADRs.
2005 FOURTH QUARTER AND FULL-YEAR RESULTS
Stock Listing Information NYSE (ADR) Ticker: CX MEXICAN STOCK EXCHANGE Ticker: CEMEX.CPO Ratio of CEMEX.CPO to CX= 10:1
Investor Relations
In the United States 1 877 7CX NYSE In Mexico 52 (81) 8888 4292 E-Mail [email protected] www.cemex.com
Consolidated net sales grew to US$3,963 million, representing an increase of 98% over those of fourth quarter 2004, mainly as a result of the RMC acquisition. Sales increased in most of our markets due to higher cement, ready-mix, and aggregates volumes and a better pricing environment. The infrastructure and residential sectors continue to be the main drivers of cement and ready-mix demand in most of our markets.
Cost of goods sold and selling, general, and administrative expenses (SG&A) increased 128% and 91%, respectively, versus the fourth quarter of last year due mainly to the acquisition of RMC. We have mitigated higher energy and electricity costs with our energy program. The aggregate cost of energy and electricity per ton of cement produced for our portfolio increased 12% in 2005 versus 2004.
EBITDA was US$901 million, an increase of 55% over that of fourth quarter 2004, despite worse-than-expected negative impact from seasonality in Europe and several unexpected end-of-year adjustments due to first-time consolidation of RMC. EBITDA margin decreased from 29.1% in fourth quarter 2004 to 22.7% in fourth quarter 2005. The margin was positively affected by higher average volumes and better pricing conditions in most markets – compensating for higher energy costs - but also reflects the change in the product mix as a result of the RMC acquisition.
The increase in the depreciation and amortization expense in the fourth versus the previous quarters was due mainly to the one-time adjustment resulting from the incremental value of property, plant and equipment, and intangible assets other than goodwill, resulting from the fair-value allocation of the purchase price paid in the acquisition of RMC.
Gain (loss) on financial instruments for the quarter was a gain of US$19 million, resulting mainly from our cross-currency and interest-rate swaps.
Other expenses, net increased 47% to US$281 million. This includes the one-time impact of the change in the pension fund plans from defined benefit to defined contribution and liability management expenses.
Majority net income for the quarter decreased 27%, from US$334 million in fourth quarter 2004 to US$244 million, and increased 62% for the full year, reaching US$2,112 million. The decrease in majority net income for the quarter comes mainly from the increased depreciation and amortization expense as well as higher other expenses, net, both explained above.
Net debt at the end of the fourth quarter was US$8,665 million, representing reductions of US$235 million during the quarter and US$1,770 million since the end of the first quarter 2005. The net-debt-to-EBITDA ratio improved to 2.4 times from 2.6 times at the end of third quarter 2005. Interest coverage reached 6.8 times during the quarter, the same ratio as in the same quarter last year, and is up from 6.5 times in third quarter 2005. (1) Results for fourth quarter 2004 do not include the effect of the RMC acquisition.
Please refer to the end of this report for definitions of terms, U.S.-dollar translation methodology, Page 2 and other important disclosures.
EBITDA and Free Cash Flow(1)
Results for fourth quarter and full-year 2004 do not include the effect of the RMC acquisition.
During the quarter, free cash flow of US$325 million plus US$200 million in proceeds from the termination of our equity forwards in September were used primarily to reduce net debt by US$235 million, US$145 million for a prepaid equity forward to cover some of the outstanding stock options, and the balance was used to fund several investments and for liability management initiatives.
Debt-Related Information
(1) EBITDA and free cash flow (calculated as set forth above) are presented herein because CEMEX believes that they are widely accepted as financial indicators of its
ability to internally fund capital expenditures and to service or incur debt. EBITDA and free cash flow should not be considered as indicators of CEMEX’s financial performance, as alternatives to cash flow, as measures of liquidity, or as being comparable to other similarly titled measures of other companies. EBITDA is reconciled above to operating income, which CEMEX considers to be the most comparable measure as determined under generally accepted accounting principles in Mexico (Mexican GAAP). Free cash flow is reconciled to EBITDA. CEMEX is not required to prepare a statement of cash flows under Mexican accounting principles and, as such, does not have such Mexican-GAAP cash-flow measures to present as comparable to EBITDA or free cash flow.
(2) During 2004, the Mexican Institute of Public Accountants issued Bulletin C-10, “Derivative Financial Instruments and Hedging Activities”, which became effective beginning January 1, 2005. Bulletin C-10 details and supplements issues related to the accounting of derivative financial instruments. Among other aspects, Bulletin C-10 precludes the presentation of two financial instruments as If they were a single instrument (synthetic presentation). For this reason, beginning this year, CEMEX recognizes the assets and liabilities resulting from the fair value of cross-currency swaps (“CCS”) separately from the financial debt, and such debt is presented in the currencies originally negotiated. Starting in 2001, CEMEX has effectively changed the original profile of interest rates and currencies of financial debt associated to CCS, and accordingly, until December 31, 2004, financial debt subject to these instruments was presented in the currencies negotiated in the CCS, through the recognition within debt of a portion of the assets or liabilities resulting from the fair value of such CCS. This reclassification has no impact on stockholders’ equity or net income. For presentation purposes in the table above, net debt includes the fair value of CCS associated with debt.
Fourth quarter January – December 2005 2004 % Var. 2005 2004 % Var. Operating income 507 414 22% 2,487 1,852 34% + Depreciation and operating amortization 394 168 1,070 686 EBITDA 901 582 55% 3,557 2,538 40% - Net financial expense 114 92 487 349 - Capital expenditures 312 192 785 434 - Change in working capital 2 18 9 86 - Taxes paid 147 71 256 139 - Other cash items (net) (0) 9 7 52 Free cash flow 325 200 63% 2,013 1,478 36% In millions of U.S. dollars.
Fourth quarter Third quarter Fourth quarter 2005 2004 % Var. 2005 2005 2004 Total debt (2) 9,478 5,931 60% 9,596 Currency denomination Short-term 13% 18% 13% U.S. dollar 72% 56% Long-term 87% 82% 87% Euro 21% 14% Cash and cash equivalents 601 342 76% 512 British pound 2% 14% Fair value of cross-currency swaps (2) 212 N/A 184 Yen 5% 15% Net debt (2) 8,665 5,588 55% 8,900 Other 0% 1% Interest expense 123 98 26% 141 Interest rate Interest coverage 6.8 6.8 6.5 Fixed 53% 62% Net debt/EBITDA 2.4 2.2 2.6 Variable 47% 38% In millions of U.S. dollars, except ratios.
Please refer to the end of this report for definitions of terms, U.S.-dollar translation methodology, Page 3 and other important disclosures.
Equity-Related Information One CEMEX ADR represents ten CEMEX CPOs. The following amounts are expressed in CPO terms and reflect the two-for-one stock split effective July 1, 2005.
Beginning-of-quarter CPO-equivalent units outstanding 3,522,892,653 Exercise of stock options not hedged 326,815 Less increase (decrease) in the number of CPOs held in subsidiaries (757,890) End-of-quarter CPO-equivalent units outstanding 3,523,977,358 Outstanding units equal total shares issued by CEMEX less shares held in subsidiaries.
Employee long-term compensation plans (1) (2) As of December 31, 2005, executives had outstanding options on a total of 60,057,395 CPOs, with a weighted-average strike price of US$3.24 per CPO (equivalent to US$32.42 per ADR). Starting in 2005, CEMEX began offering executives a stock-ownership program. The plan’s goal is to move CEMEX’s long-term incentives from stock options to programs based on restricted stock. As of December 31, 2005, our executives held 101,832,693 restricted CPOs, representing 2.9% of our total CPOs outstanding.
Derivative Instruments CEMEX periodically utilizes derivative financial instruments such as interest-rate and currency swaps, currency forwards and options, and equity derivatives in order to execute its corporate financing strategy and to hedge other obligations as they arise. The following table shows the notional amount for each type of derivative instrument and the aggregate fair market value for all of CEMEX’s derivative instruments as of the last day of each quarter presented.
The estimated aggregate fair market value represents the approximate settlement result as of the valuation date, based upon quoted market prices and estimated settlement costs, which fluctuate over time. Fair market values and notional amounts do not represent amounts of cash currently exchanged between the parties; cash amounts will be determined upon termination of the contracts considering the notional amounts and quoted market prices as well as other derivative items as of the settlement date. Fair market values should not be viewed in isolation but rather in relation to the fair market values of the underlying hedge transactions and the overall reduction in CEMEX’s exposure to the risks being hedged. Note: Mexican GAAP ("Bulletin C-2") requires companies to recognize all derivative financial instruments in the balance sheet as assets or liabilities, at their estimated fair market value, with changes in such fair market values recorded on the income statement. The exceptions to the general rule until December 31, 2004, as they pertained to CEMEX, occurred when transactions were entered into for cash-flow hedging purposes. In such cases, changes in the fair market value of the related derivative instruments were recognized temporarily in equity and were reclassified into earnings as the inverse effects of the underlying hedged items flowed through the income statement. Beginning in 2005, new Bulletin C-10, “Derivative Financial Instruments and Hedging Activities”, establishes the framework for hedge accounting and overrides Bulletin C-2 in this respect; however, in respect to cash-flow hedges, the new rules are the same as those applied by CEMEX since 2001. CEMEX has recognized increases in assets and liabilities, which resulted in a net asset of US$433 million, arising from the fair market value recognition of its derivatives portfolio as of December 31, 2005. The notional amounts of derivatives substantially match the amounts of underlying assets, liabilities, or equity transactions on which the derivatives are being entered into. (1) Until September 27, 2005, the date of pricing of our non-dilutive equity offering and the liquidation of the equity forward contracts that hedged our executive stock-
option programs, CEMEX accrued a liability representing the intrinsic value of the stock options. Resulting from the elimination of the economic hedge and given that the potential future appreciation of the stock options is currently not hedged through equity forwards, CEMEX has decided, for purposes of determining its obligations under the stock-option programs, to move from intrinsic value to fair value.
(2) As of December 31, 2005, CEMEX had recognized a net liability related to our stock-option programs of approximately US$102 million. This liability includes the fair value of the options for US$250 million, net of an investment in a derivative financial instrument of approximately US$148 million that guarantees us the receipt of cash equivalent to the appreciation of our CPO market price over 25 million CPOs, in order to meet our obligations under our executive stock-option programs. As of December 31, 2005, approximately US$97 million of our net liability corresponds to the time value of the stock options.
(3) Notional amounts and fair market values at the end of fourth quarter 2004 do not include the effect of the RMC acquisition.
Fourth quarter (3) Third quarter
Notional amounts 2005 2004 2005 Equity (not prepaid) (1) 0 1,157 0 Foreign-exchange 5,427 6,016 4,106 Interest-rate 2,884 2,118 3,487 Estimated aggregate fair market value 433 97 304 In millions of U.S. dollars.
Please refer to the end of this report for definitions of terms, U.S.-dollar translation methodology, Page 4 and other important disclosures.
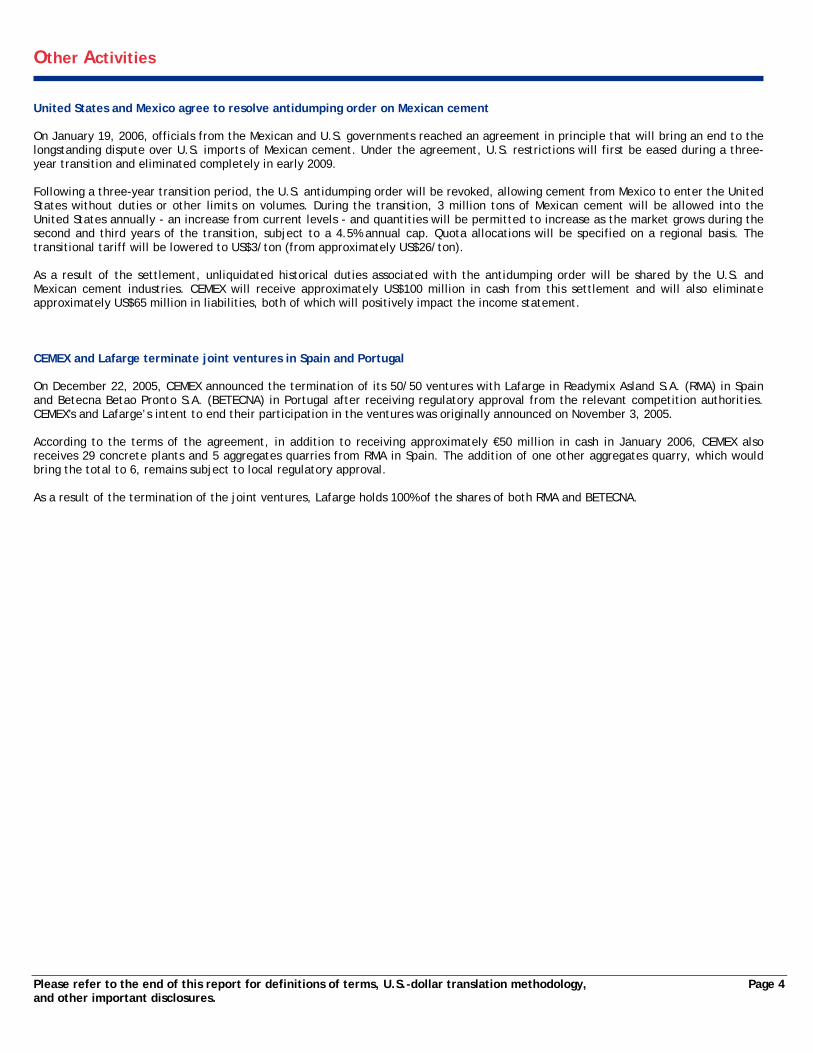
Other Activities United States and Mexico agree to resolve antidumping order on Mexican cement On January 19, 2006, officials from the Mexican and U.S. governments reached an agreement in principle that will bring an end to the longstanding dispute over U.S. imports of Mexican cement. Under the agreement, U.S. restrictions will first be eased during a three-year transition and eliminated completely in early 2009. Following a three-year transition period, the U.S. antidumping order will be revoked, allowing cement from Mexico to enter the United States without duties or other limits on volumes. During the transition, 3 million tons of Mexican cement will be allowed into the United States annually - an increase from current levels - and quantities will be permitted to increase as the market grows during the second and third years of the transition, subject to a 4.5% annual cap. Quota allocations will be specified on a regional basis. The transitional tariff will be lowered to US$3/ton (from approximately US$26/ton). As a result of the settlement, unliquidated historical duties associated with the antidumping order will be shared by the U.S. and Mexican cement industries. CEMEX will receive approximately US$100 million in cash from this settlement and will also eliminate approximately US$65 million in liabilities, both of which will positively impact the income statement. CEMEX and Lafarge terminate joint ventures in Spain and Portugal On December 22, 2005, CEMEX announced the termination of its 50/50 ventures with Lafarge in Readymix Asland S.A. (RMA) in Spain and Betecna Betao Pronto S.A. (BETECNA) in Portugal after receiving regulatory approval from the relevant competition authorities. CEMEX's and Lafarge’s intent to end their participation in the ventures was originally announced on November 3, 2005. According to the terms of the agreement, in addition to receiving approximately €50 million in cash in January 2006, CEMEX also receives 29 concrete plants and 5 aggregates quarries from RMA in Spain. The addition of one other aggregates quarry, which would bring the total to 6, remains subject to local regulatory approval. As a result of the termination of the joint ventures, Lafarge holds 100% of the shares of both RMA and BETECNA.
Please refer to the end of this report for definitions of terms, U.S.-dollar translation methodology, Page 5 and other important disclosures.
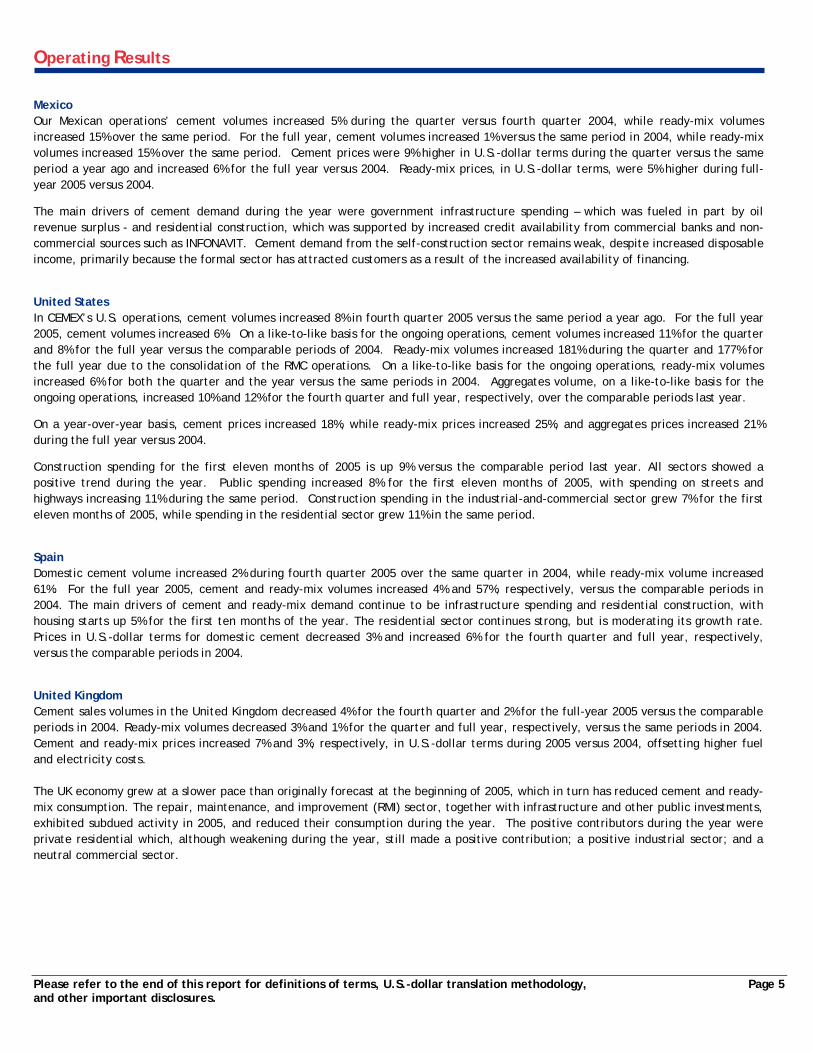
Operating Results Mexico Our Mexican operations’ cement volumes increased 5% during the quarter versus fourth quarter 2004, while ready-mix volumes increased 15% over the same period. For the full year, cement volumes increased 1% versus the same period in 2004, while ready-mix volumes increased 15% over the same period. Cement prices were 9% higher in U.S.-dollar terms during the quarter versus the same period a year ago and increased 6% for the full year versus 2004. Ready-mix prices, in U.S.-dollar terms, were 5% higher during full-year 2005 versus 2004.
The main drivers of cement demand during the year were government infrastructure spending – which was fueled in part by oil revenue surplus - and residential construction, which was supported by increased credit availability from commercial banks and non-commercial sources such as INFONAVIT. Cement demand from the self-construction sector remains weak, despite increased disposable income, primarily because the formal sector has attracted customers as a result of the increased availability of financing.
United States In CEMEX’s U.S. operations, cement volumes increased 8% in fourth quarter 2005 versus the same period a year ago. For the full year 2005, cement volumes increased 6%. On a like-to-like basis for the ongoing operations, cement volumes increased 11% for the quarter and 8% for the full year versus the comparable periods of 2004. Ready-mix volumes increased 181% during the quarter and 177% for the full year due to the consolidation of the RMC operations. On a like-to-like basis for the ongoing operations, ready-mix volumes increased 6% for both the quarter and the year versus the same periods in 2004. Aggregates volume, on a like-to-like basis for the ongoing operations, increased 10% and 12% for the fourth quarter and full year, respectively, over the comparable periods last year.
On a year-over-year basis, cement prices increased 18%, while ready-mix prices increased 25%, and aggregates prices increased 21% during the full year versus 2004.
Construction spending for the first eleven months of 2005 is up 9% versus the comparable period last year. All sectors showed a positive trend during the year. Public spending increased 8% for the first eleven months of 2005, with spending on streets and highways increasing 11% during the same period. Construction spending in the industrial-and-commercial sector grew 7% for the first eleven months of 2005, while spending in the residential sector grew 11% in the same period.
Spain Domestic cement volume increased 2% during fourth quarter 2005 over the same quarter in 2004, while ready-mix volume increased 61%. For the full year 2005, cement and ready-mix volumes increased 4% and 57%, respectively, versus the comparable periods in 2004. The main drivers of cement and ready-mix demand continue to be infrastructure spending and residential construction, with housing starts up 5% for the first ten months of the year. The residential sector continues strong, but is moderating its growth rate. Prices in U.S.-dollar terms for domestic cement decreased 3% and increased 6% for the fourth quarter and full year, respectively, versus the comparable periods in 2004.
United Kingdom Cement sales volumes in the United Kingdom decreased 4% for the fourth quarter and 2% for the full-year 2005 versus the comparable periods in 2004. Ready-mix volumes decreased 3% and 1% for the quarter and full year, respectively, versus the same periods in 2004. Cement and ready-mix prices increased 7% and 3%, respectively, in U.S.-dollar terms during 2005 versus 2004, offsetting higher fuel and electricity costs. The UK economy grew at a slower pace than originally forecast at the beginning of 2005, which in turn has reduced cement and ready-mix consumption. The repair, maintenance, and improvement (RMI) sector, together with infrastructure and other public investments, exhibited subdued activity in 2005, and reduced their consumption during the year. The positive contributors during the year were private residential which, although weakening during the year, still made a positive contribution; a positive industrial sector; and a neutral commercial sector.
Please refer to the end of this report for definitions of terms, U.S.-dollar translation methodology, Page 6 and other important disclosures.
Operating Results Rest of Europe In France, ready-mix volumes increased 6% in the fourth quarter and 6% during the full-year 2005 year versus the same periods of 2004. Aggregates volumes increased 5% and 1% in the fourth quarter and for the full year 2005, respectively, versus the comparable periods in 2004. Prices of ready-mix in U.S.-dollar terms increased 3% during the full year versus 2004. Low interest rates and tax incentives have increased the demand for house construction. In Germany, private and public consumption is still weak, and unemployment remains high. The public-works sector declined in 2005 due to high public debt and limited investments. The market for new residential buildings also dropped in 2005, mainly because of the speculative housing boom in 2004 driven by government housing subsidies. The nonresidential sector increased slightly during the year mainly as a result of activity in retail and store buildings. Cement sales volumes for the quarter declined 8% versus the comparable period of 2004. We are partially offsetting the decline in domestic volumes by increasing our exports from Germany – up 26% in full-year 2005. Ready-mix volumes declined 12% during in 2005 versus 2004. Cement prices in Germany increased 23% in U.S.-dollar terms for the full year versus the same period in 2004. South/Central America and Caribbean Domestic cement volumes in the region increased 23% in the quarter and 19% during the full year versus the same periods of 2004. The Venezuelan economy continues to recover, and with it construction spending. The main sectors contributing to increased cement demand are the infrastructure – fueled by increased oil revenues - and residential (both self-construction and government-sponsored housing) sectors. For the quarter, cement volumes in Venezuela increased 35% versus fourth quarter 2004. In Colombia, cement volumes grew 25% and 33% during the quarter and full year, respectively, driven mainly by demand in the self-construction sector, which was fueled by stable employment and increased real wages. Public-works spending also showed growth during the year. Africa and Middle East Domestic cement volumes for our operations in Egypt increased 23% during the year as construction activity remains high. The main drivers are the demand for housing and infrastructure as well as oil revenues, which are driving public and private investments. Tourism infrastructure has started to increase as well. Overall, the region’s domestic cement volumes during the quarter increased 33% versus the same period in 2004, while average prices in U.S.-dollar terms increased 19%. Asia In aggregate, our cement volumes in the region decreased 3% during the quarter and increased 2% during the full year 2005 versus the same periods of last year. Cement demand in the Philippines declined during the year as a result of political uncertainty translating into a negative construction environment. In Thailand, cement volume enjoyed a mid-single-digit increase during the year driven mainly by housing activity. We saw positive results in Bangladesh during the year as a result of different efficiency initiatives. Average cement prices for our operations in the region increased 10% in U.S.-dollar terms during the full-year 2005 versus 2004.
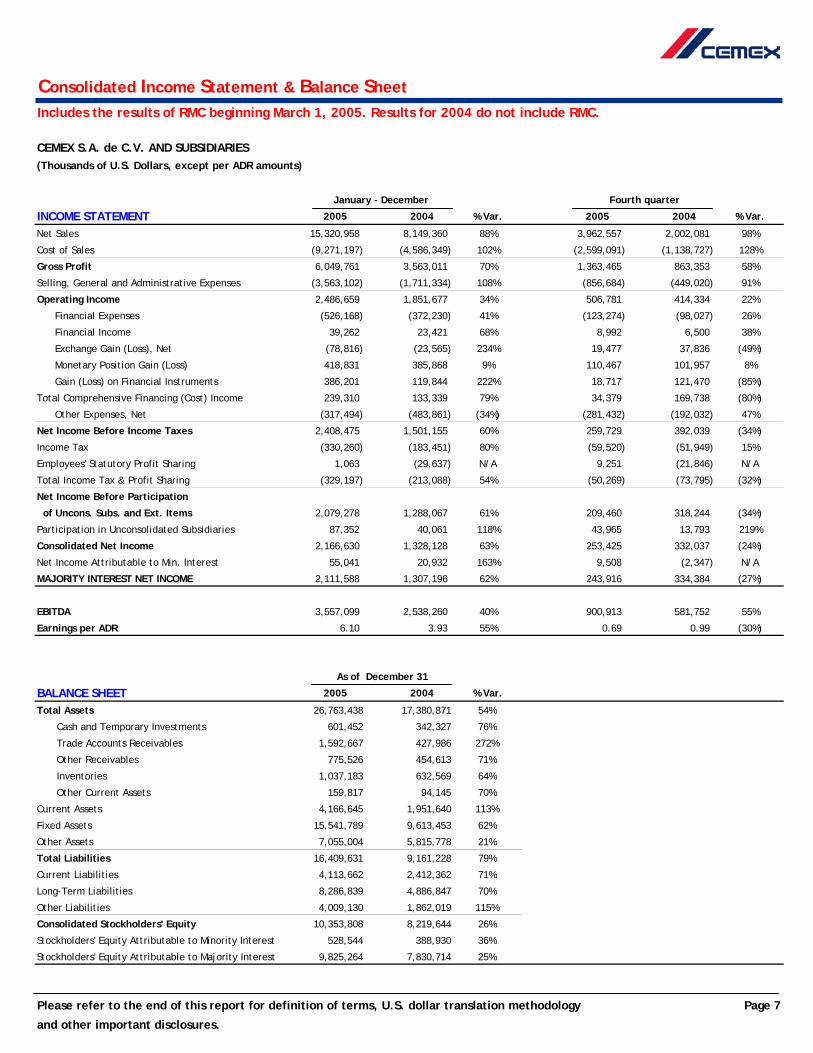
Consolidated Income Statement & Balance SheetIncludes the results of RMC beginning March 1, 2005. Results for 2004 do not include RMC.
CEMEX S.A. de C.V. AND SUBSIDIARIES(Thousands of U.S. Dollars, except per ADR amounts)
January - December Fourth quarter
INCOME STATEMENT 2005 2004 % Var. 2005 2004 % Var.
Net Sales 15,320,958 8,149,360 88% 3,962,557 2,002,081 98%
Cost of Sales (9,271,197) (4,586,349) 102% (2,599,091) (1,138,727) 128%
Stockholders' Equity Attributable to Minority Interest 5,613,142 4,155,040 35%
Stockholders' Equity Attributable to Majority Interest 104,344,294 83,657,550 25%
Please refer to the end of this report for definition of terms, U.S. dollar translation methodology Page 8
and other important disclosures.
Operating Summary per Country
Includes the results of RMC beginning March 1, 2005. Results for 2004 do not include RMC.
In thousands of U.S. dollars
January - December Fourth quarter
NET SALES 2005 2004 % Var. 2005 2004 % Var.
Mexico 3,176,301 2,920,055 9% 817,247 720,645 13%U.S.A. 4,040,181 1,959,174 106% 1,042,993 503,260 107%Spain 1,486,216 1,358,543 9% 370,196 336,071 10%United Kingdom 1,526,993 N/A N/A 416,012 N/A N/ARest of Europe 2,673,293 N/A N/A 749,485 N/A N/ASouth / Central America and Caribbean 1,315,849 1,246,945 6% 326,588 290,781 12%Africa and Middle East 534,572 190,734 180% 145,433 46,503 213%Asia 297,077 194,813 52% 77,603 47,559 63%Others and intercompany eliminations 270,476 279,096 (3%) 17,001 57,262 (70%)TOTAL 15,320,958 8,149,360 88% 3,962,557 2,002,081 98%
GROSS PROFITMexico 1,722,226 1,657,077 4% 434,622 399,685 9%U.S.A. 1,543,589 658,869 134% 396,977 180,107 120%Spain 542,057 503,246 8% 128,336 127,821 0%United Kingdom 472,106 N/A N/A 101,336 N/A N/ARest of Europe 943,385 N/A N/A 150,973 N/A N/ASouth / Central America and Caribbean 443,920 552,495 (20%) 102,093 118,326 (14%)Africa and Middle East 192,762 99,651 93% 42,497 23,931 78%Asia 99,918 83,253 20% 25,264 20,466 23%Others and intercompany eliminations 89,797 8,420 967% (18,632) (6,982) 167%TOTAL 6,049,761 3,563,011 70% 1,363,465 863,353 58%
OPERATING INCOMEMexico 1,124,185 1,105,934 2% 282,335 242,583 16%U.S.A. 741,086 302,707 145% 151,990 87,350 74%Spain 358,828 331,522 8% 86,947 78,953 10%United Kingdom 52,000 N/A N/A (18,968) N/A N/ARest of Europe 188,320 N/A N/A (841) N/A N/ASouth / Central America and Caribbean 251,142 378,430 (34%) 60,430 72,734 (17%)Africa and Middle East 112,310 57,613 95% 31,837 12,123 163%Asia 39,038 29,479 32% 8,744 6,950 26%Others and intercompany eliminations (380,250) (354,009) 7% (95,694) (86,359) 11%TOTAL 2,486,659 1,851,677 34% 506,781 414,334 22%
Due to the standardization effort currently underway in the RMC operations, some expenses have been reclassified between cost of salesand SG&A during the quarter and the full year. This reclassification is being done only in the new operations, and has no effect on operating income or EBITDA.
Please refer to the end of this report for definition of terms, U.S. dollar translation methodology Page 9
and other important disclosures.
Operating Summary per Country
Includes the results of RMC beginning March 1, 2005. Results for 2004 do not include RMC.
EBITDA in thousands of US dollars. EBITDA margin as a percentage of net sales
January - December Fourth quarter
EBITDA 2005 2004 % Var. 2005 2004 % Var.
Mexico 1,279,948 1,263,745 1% 319,396 281,814 13%U.S.A. 1,015,088 462,189 120% 270,376 129,653 109%Spain 437,730 417,973 5% 107,300 100,396 7%United Kingdom 147,371 N/A N/A 27,229 N/A N/ARest of Europe 352,168 N/A N/A 87,855 N/A N/ASouth / Central America and Caribbean 381,663 496,836 (23%) 93,040 102,816 (10%)Africa and Middle East 148,324 87,147 70% 37,296 18,886 97%Asia 60,042 54,937 9% 13,799 12,241 13%Others and intercompany eliminations (265,234) (244,567) 8% (55,377) (64,056) (14%)TOTAL 3,557,099 2,538,260 40% 900,913 581,752 55%
EBITDA MARGINMexico 40.3% 43.3% 39.1% 39.1%U.S.A. 25.1% 23.6% 25.9% 25.8%Spain 29.5% 30.8% 29.0% 29.9%United Kingdom 9.7% N/A 6.5% N/ARest of Europe 13.2% N/A 11.7% N/ASouth / Central America and Caribbean 29.0% 39.8% 28.5% 35.4%Africa and Middle East 27.7% 45.7% 25.6% 40.6%Asia 20.2% 28.2% 17.8% 25.7%CONSOLIDATED MARGIN 23.2% 31.1% 22.7% 29.1%
Due to the standardization effort currently underway in the RMC operations, some expenses have been reclassified between cost of salesand SG&A during the quarter and the full year. This reclassification is being done only in the new operations, and has no effect on operating income or EBITDA.
Please refer to the end of this report for definition of terms, U.S. dollar translation methodology Page 10
and other important disclosures.
Volume Summary
Includes the results of RMC beginning March 1, 2005. Results for 2004 do not include RMC.
Consolidated volume summaryCement and aggregates: Thousands of metric tons
January - December Fourth quarter Fourth quarter 2005 Vs.
DOMESTIC CEMENT VOLUME 2005 Vs. 2004 2005 Vs. 2004 Third quarter 2005
Mexico 1% 5% 4% U.S.A. 6% 8% (9%)Spain 4% 2% 0% United Kingdom N/A N/A (10%)Rest of Europe N/A N/A (20%)South / Central America and Caribbean 19% 23% 5% Africa and Middle East 23% 33% (14%)Asia 2% (3%) (6%)
READY-MIX VOLUMEMexico 15% 15% 4% U.S.A. 177% 181% (18%)Spain 57% 61% (3%)United Kingdom N/A N/A (9%)Rest of Europe N/A N/A (9%)South / Central America and Caribbean 31% 55% (4%)Africa and Middle East N/A N/A N/AAsia N/A N/A N/A
AGGREGATES VOLUMEMexico 4% 12% 12% U.S.A. 112% 121% (12%)Spain 70% 78% (10%)United Kingdom N/A N/A (10%)Rest of Europe N/A N/A (13%)South / Central America and Caribbean 22% 22% (13%)Africa and Middle East N/A N/A N/AAsia N/A N/A N/A
1) Includes only the month of March in first quarter 2005 for RMC operations.
Please refer to the end of this report for definition of terms, U.S. dollar translation methodology Page 11
and other important disclosures.
January - December
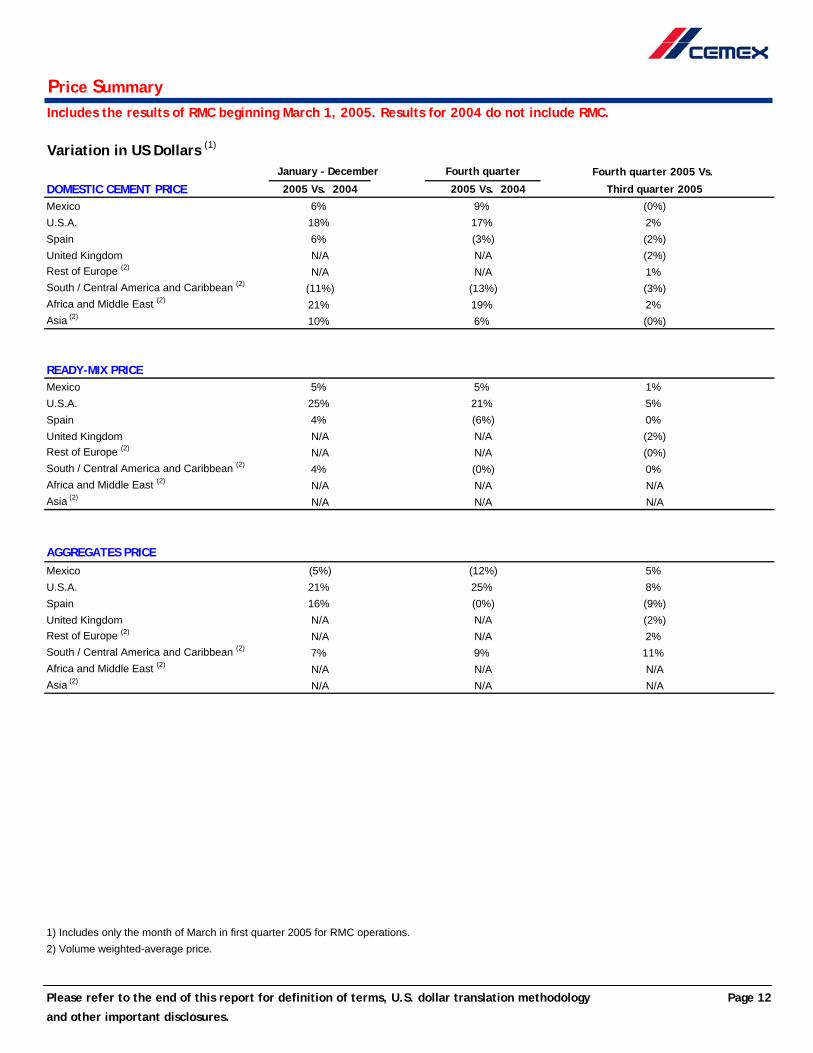
Price SummaryIncludes the results of RMC beginning March 1, 2005. Results for 2004 do not include RMC.
Variation in US Dollars (1)
January - December Fourth quarter Fourth quarter 2005 Vs.
DOMESTIC CEMENT PRICE 2005 Vs. 2004 2005 Vs. 2004 Third quarter 2005
Mexico 6% 9% (0%)U.S.A. 18% 17% 2% Spain 6% (3%) (2%)United Kingdom N/A N/A (2%)Rest of Europe (2) N/A N/A 1% South / Central America and Caribbean (2) (11%) (13%) (3%)Africa and Middle East (2) 21% 19% 2% Asia (2) 10% 6% (0%)
READY-MIX PRICEMexico 5% 5% 1% U.S.A. 25% 21% 5% Spain 4% (6%) 0% United Kingdom N/A N/A (2%)Rest of Europe (2) N/A N/A (0%)South / Central America and Caribbean (2) 4% (0%) 0% Africa and Middle East (2) N/A N/A N/AAsia (2) N/A N/A N/A
AGGREGATES PRICEMexico (5%) (12%) 5% U.S.A. 21% 25% 8% Spain 16% (0%) (9%)United Kingdom N/A N/A (2%)Rest of Europe (2) N/A N/A 2% South / Central America and Caribbean (2) 7% 9% 11% Africa and Middle East (2) N/A N/A N/AAsia (2) N/A N/A N/A
1) Includes only the month of March in first quarter 2005 for RMC operations.2) Volume weighted-average price.
Please refer to the end of this report for definition of terms, U.S. dollar translation methodology Page 12
and other important disclosures.
Price SummaryIncludes the results of RMC beginning March 1, 2005. Results for 2004 do not include RMC.
Variation in Local Currency (1)
January - December Fourth quarter Fourth quarter 2005 Vs.
DOMESTIC CEMENT PRICE 2005 Vs. 2004 2005 Vs. 2004 Third quarter 2005Mexico (2) (2%) (1%) (2%)U.S.A. 18% 17% 2% Spain 6% 7% (0%)United Kingdom N/A N/A (0%)
1) Includes only the month of March in first quarter 2005 for RMC operations.2) In constant Mexican pesos as of December 31, 2005.
Please refer to the end of this report for definition of terms, U.S. dollar translation methodology Page 13
and other important disclosures.
Page 14
Definition of Terms and Disclosures Methodology for consolidation and presentation of results
CEMEX consolidates its results in Mexican pesos under Mexican generally accepted accounting principles (GAAP). For the reader’s convenience, U.S. dollar amounts for the consolidated entity are calculated by converting the constant Mexican peso amounts at the end of each quarter using the period-end MXN/USD exchange rate for each quarter. The exchange rates used to convert results for fourth quarter 2005, third quarter 2005, and fourth quarter 2004 are 10.62, 10.76, and 11.14 Mexican pesos per U.S. dollar, respectively. CEMEX’s weighted-average inflation factor between December 31, 2004, and December 31, 2005, was -4.1%.
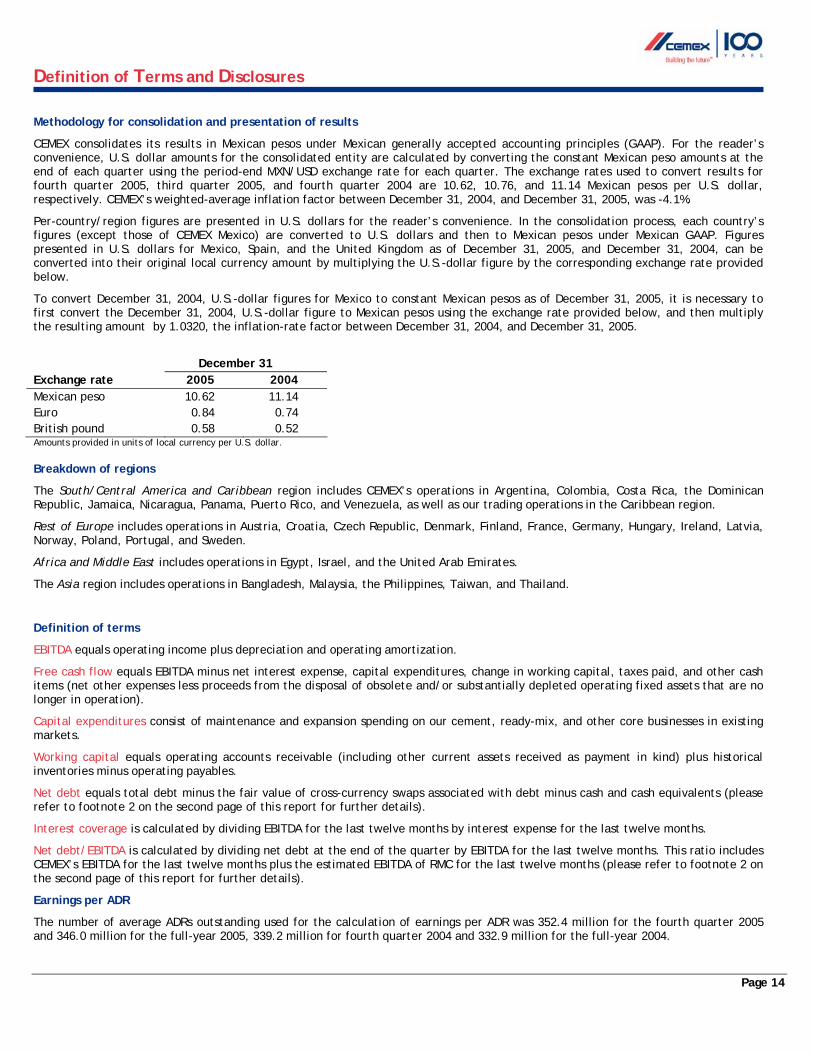
Per-country/region figures are presented in U.S. dollars for the reader’s convenience. In the consolidation process, each country’s figures (except those of CEMEX Mexico) are converted to U.S. dollars and then to Mexican pesos under Mexican GAAP. Figures presented in U.S. dollars for Mexico, Spain, and the United Kingdom as of December 31, 2005, and December 31, 2004, can be converted into their original local currency amount by multiplying the U.S.-dollar figure by the corresponding exchange rate provided below.
To convert December 31, 2004, U.S.-dollar figures for Mexico to constant Mexican pesos as of December 31, 2005, it is necessary to first convert the December 31, 2004, U.S.-dollar figure to Mexican pesos using the exchange rate provided below, and then multiply the resulting amount by 1.0320, the inflation-rate factor between December 31, 2004, and December 31, 2005.
December 31 Exchange rate 2005 2004 Mexican peso 10.62 11.14 Euro 0.84 0.74 British pound 0.58 0.52 Amounts provided in units of local currency per U.S. dollar. Breakdown of regions
The South/Central America and Caribbean region includes CEMEX’s operations in Argentina, Colombia, Costa Rica, the Dominican Republic, Jamaica, Nicaragua, Panama, Puerto Rico, and Venezuela, as well as our trading operations in the Caribbean region.
Rest of Europe includes operations in Austria, Croatia, Czech Republic, Denmark, Finland, France, Germany, Hungary, Ireland, Latvia, Norway, Poland, Portugal, and Sweden.
Africa and Middle East includes operations in Egypt, Israel, and the United Arab Emirates.
The Asia region includes operations in Bangladesh, Malaysia, the Philippines, Taiwan, and Thailand.
Definition of terms
EBITDA equals operating income plus depreciation and operating amortization.
Free cash flow equals EBITDA minus net interest expense, capital expenditures, change in working capital, taxes paid, and other cash items (net other expenses less proceeds from the disposal of obsolete and/or substantially depleted operating fixed assets that are no longer in operation).
Capital expenditures consist of maintenance and expansion spending on our cement, ready-mix, and other core businesses in existing markets.
Working capital equals operating accounts receivable (including other current assets received as payment in kind) plus historical inventories minus operating payables.
Net debt equals total debt minus the fair value of cross-currency swaps associated with debt minus cash and cash equivalents (please refer to footnote 2 on the second page of this report for further details).
Interest coverage is calculated by dividing EBITDA for the last twelve months by interest expense for the last twelve months.
Net debt/EBITDA is calculated by dividing net debt at the end of the quarter by EBITDA for the last twelve months. This ratio includes CEMEX’s EBITDA for the last twelve months plus the estimated EBITDA of RMC for the last twelve months (please refer to footnote 2 on the second page of this report for further details).
Earnings per ADR
The number of average ADRs outstanding used for the calculation of earnings per ADR was 352.4 million for the fourth quarter 2005 and 346.0 million for the full-year 2005, 339.2 million for fourth quarter 2004 and 332.9 million for the full-year 2004.
Page 15
Definition of Terms and Disclosures Effect of the purchase of RMC on our financial statements The acquisition of RMC was concluded on March 1, 2005. The processes to allocate the purchase price paid for RMC’s shares of approximately US$4.2 billion, including other direct purchase costs and the proceeds from the sale of some assets, to the fair values of the assets acquired and liabilities assumed, began during March 2005 concurrent with the assumption of control by CEMEX and was undertaken through the year. As of December 31, 2005, CEMEX is close to complete the overall process in terms of determining the fair values of the net assets of RMC, including acquired intangible assets. Therefore, as of December 31, 2005, the difference between the purchase price paid and the fair values of RMC's net assets as of March 1, 2005, which represented a goodwill of approximately US$1.2 billion, is a reasonable estimate of the final amount that would prevail after completion of the allocation process during the first quarter of 2006. At this stage, our only pending issue is to conclude if any portion of goodwill should be further allocated to other intangible assets. As most of the fair value adjustments were determined during the fourth quarter of 2005, the increase in the depreciation and amortization expense in the fourth quarter versus the previous quarters was mainly due to the incremental value of Property, Plant and Equipment and Intangible Assets, others than goodwill, resulting from the fair value allocation of the purchase price paid in the acquisition of RMC.