23
2005 Jordan Reservoir Report Rivers and Reservoirs Monitoring Program Field Operations Division Environmental Indicators Section Aquatic Assessment Unit January 6, 2009

2005 Jordan Reservoir Report Rivers and Reservoirs Monitoring Program
Field Operations Division Environmental Indicators Section
Aquatic Assessment Unit January 6, 2009

Rivers and Reservoirs Monitoring Program
2005
Jordan Reservoir Coosa River Basin
Alabama Department of Environmental Management Field Operations Division
Environmental Indicators Section Aquatic Assessment Unit
January 2009
22000055 RRRRMMPP:: CCoooossaa BBaassiinn RReeppoorrtt 2
Table of Contents
LIST OF FIGURES ...................................................................................................................... 4
LIST OF TABLES ........................................................................................................................ 5
INTRODUCTION......................................................................................................................... 6
METHODS .................................................................................................................................... 6
RESULTS ...................................................................................................................................... 9
REFERENCES ............................................................................................................................ 19
APPENDIX .................................................................................................................................. 21
22000055 RRRRMMPP:: CCoooossaa BBaassiinn RReeppoorrtt 3

22000055 RRRRMMPP:: CCoooossaa BBaassiinn RReeppoorrtt 4
LIST OF FIGURES
Figure 1. Jordan Reservoir with 2005 sampling locations. ...................................................... 7
Figure 2. Mean total nitrogen (TN), mean total phosphorus (TP), mean chlorophyll a (Chl a) and mean total suspended solids (TSS) of all stations in Jordan Reservoir, April-October 2005. .................................................................................................................... 11
Figure 3. Total nitrogen (TN), total phosphorus (TP), chlorophyll a (Chl a) and total suspended solids (TSS) of the upper station in Jordan Reservoir, April-October 2005................................................................................................................................ 12
Figure 4. Total nitrogen (TN), total phosphorus (TP), chlorophyll a (Chl a) and total suspended solids (TSS) of the lower station in Jordan Reservoir, April-October 2005............................................................................................................................................... 13
Figure 5. Growing season mean chlorophyll a concentrations of mainstem Jordan Reservoir, 1997 through 2005. ................................................................................................... 14
Figure 6. Depth profiles of dissolved oxygen (DO) and temperature (Temp) in Jordan Reservoir, June-September 2005. ................................................................................. 15
Figure 7. DO concentrations at 5 ft. for Jordan Reservoir tributaries collected April-October 2005. .................................................................................................................... 16
Figure 8. Monthly TSI values for mainstem and tributary stations using chlorophyll a concentrations and the Carlson’s Trophic State Index calculation, April-October 2005............................................................................................................................................... 17
Figure 9. Trophic State Index values from critical period sampling (August sampling only) from 1985 to 2005.............................................................................................. 18

LIST OF TABLES
Table 1. Descriptions for the monitoring stations in 2005 for Jordan Reservoir. ................. 8
Table 2. Algal growth potential test results (expressed as mean Maximum Standing Crop (MSC) or dry weights of Selenastrum capricornutum in mg/L) and limiting nutrient status from 2000 and 2005. .......................................................................................... 14
Appendix Table 1. Summary of water quality data collected April-October, 2005. ........... 22
22000055 RRRRMMPP:: CCoooossaa BBaassiinn RReeppoorrtt 5

INTRODUCTION
The Alabama Department of Environmental Management (ADEM) monitored Jordan Reservoir
as part of the 2005 assessment of the Alabama, Coosa, and Tallapoosa (ACT) River basins under
the Rivers and Reservoirs Monitoring Program (RRMP). Implemented in 1990, the objectives of
this program were to provide data that can be used to assess current water quality conditions,
identify trends in water quality conditions, and to develop Total Maximum Daily Loads
(TMDLs) and water quality criteria.
ADEM has classified Jordan Reservoir as a public water supply (PWS)/swimming (S)/fish &
wildlife (F&W) waterbody. It must maintain all state water quality standards for swimmable
waters, public water supply use, and to support the propagation of fish and wildlife. After
evaluation, Jordan was determined to meet the criteria of all of its use classifications, making it
the only reservoir of the Coosa River chain not on the Section §303(d) of the Clean Water Act
List of Impaired Waterbodies (303(d) list).
The purpose of this report is to summarize data collected at five stations in Jordan Reservoir
during the 2005 sampling season and to evaluate trends in mean lake trophic status and nutrient
concentrations using ADEM’s 20 year dataset. Monthly and mean concentrations of nutrients
(total nitrogen (TN); total phosphorus (TP)), algal biomass/productivity (chlorophyll a (chl a);
algal growth potential testing (AGPT)), sediment (total suspended solids (TSS)), and trophic
state (Carlson’s trophic state index (TSI)) are compared to ADEM’s historical data.
METHODS
Sampling stations were determined using historical data and previous assessments [Fig. 1].
Specific location information can be found in Table 1. Water quality assessments were
conducted at monthly intervals April-October. Jordan Reservoir was sampled in the dam forebay
with an additional station added in the transitional area of the upper reservoir. Three tributary
embayment stations were established in the largest embayments.
22000055 RRRRMMPP:: CCoooossaa BBaassiinn RReeppoorrtt 6

Jordan ReservoirEst. 1928
6,800 acres
JORE-5
JORE-4
JORE-3
JORE-2
JORE-1
0 0.7 1.4 2.1 2.80.35Miles
E
Figure 1. Jordan Reservoir with 2005 sampling locations. A description of each sampling location is provided in Table 1.
22000055 RRRRMMPP:: CCoooossaa BBaassiinn RReeppoorrtt 7

Table 1. Descriptions for the monitoring stations in 2005 for Jordan Reservoir.
Jordan Reservoir
Sub- watershed
County Station Number
Report Designation
WaterbodyName
Station Description
Latitude Longitude
Lower Coosa (0315-0107) 0901 Elmore JORE-1** Lower Coosa R Lower reservoir. Deepest point, main river channel, dam forebay . 32.6213 -86.2595
0901 Elmore JORE-2 Upper Coosa R Upper reservoir. Deepest point, main river channel, upstream of the Weoka Creek / Coosa River confluence.
32.6783 -86.3338
0903 Elmore JORE-3 Shoal Cr. Shoal Cr Deepest point, main creek channel, Shoal Creek embayment, immediately upstream of the Elmore County Rd. 23 bridge.
32.6542 -86.3277
0905 Elmore JORE-4 Weoka Cr. Weoka Cr Deepest point, main creek channel, Weoka Creek embayment, approximately 0.5 miles upstream of lake confluence.
32.6664 -86.3006
0906 Elmore JORE-5 Sofkahatchee Cr.
Sofkahatchee Cr
Deepest point, main creek channel, Sofkahatchee Creek embayment, approximately 0.5 miles upstream of lake confluence.
32.6372 -86.2645
8
**Growing season mean Chl a criteria will be established at this station in 2010
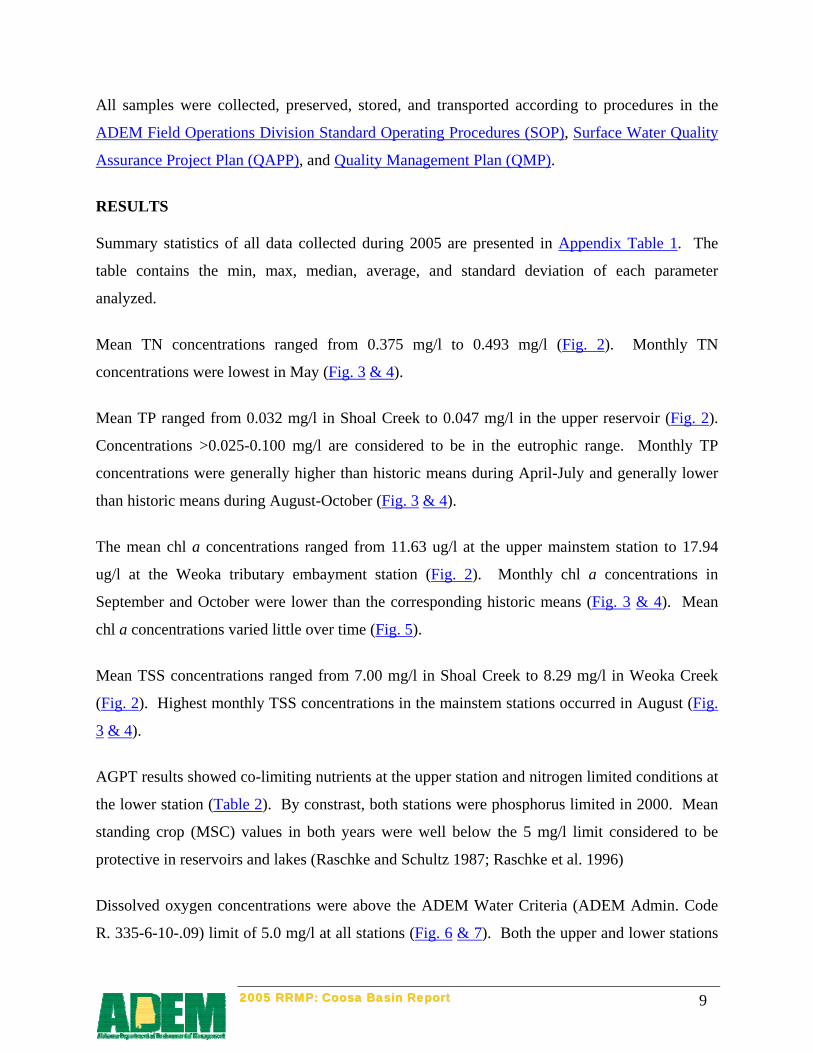
All samples were collected, preserved, stored, and transported according to procedures in the
ADEM Field Operations Division Standard Operating Procedures (SOP), Surface Water Quality
Assurance Project Plan (QAPP), and Quality Management Plan (QMP).
RESULTS
Summary statistics of all data collected during 2005 are presented in Appendix Table 1. The
table contains the min, max, median, average, and standard deviation of each parameter
analyzed.
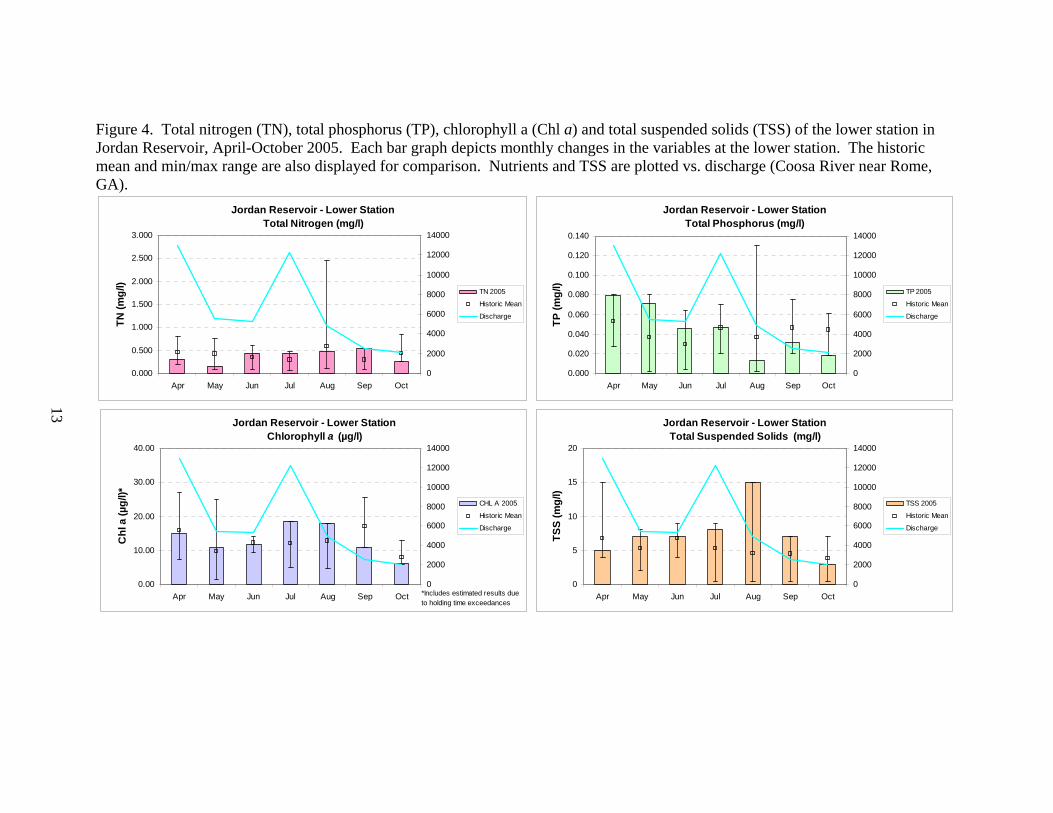
Mean TN concentrations ranged from 0.375 mg/l to 0.493 mg/l (Fig. 2). Monthly TN
concentrations were lowest in May (Fig. 3 & 4).
Mean TP ranged from 0.032 mg/l in Shoal Creek to 0.047 mg/l in the upper reservoir (Fig. 2).
Concentrations >0.025-0.100 mg/l are considered to be in the eutrophic range. Monthly TP
concentrations were generally higher than historic means during April-July and generally lower
than historic means during August-October (Fig. 3 & 4).
The mean chl a concentrations ranged from 11.63 ug/l at the upper mainstem station to 17.94
ug/l at the Weoka tributary embayment station (Fig. 2). Monthly chl a concentrations in
September and October were lower than the corresponding historic means (Fig. 3 & 4). Mean
chl a concentrations varied little over time (Fig. 5).
Mean TSS concentrations ranged from 7.00 mg/l in Shoal Creek to 8.29 mg/l in Weoka Creek
(Fig. 2). Highest monthly TSS concentrations in the mainstem stations occurred in August (Fig.
3 & 4).
AGPT results showed co-limiting nutrients at the upper station and nitrogen limited conditions at
the lower station (Table 2). By constrast, both stations were phosphorus limited in 2000. Mean
standing crop (MSC) values in both years were well below the 5 mg/l limit considered to be
protective in reservoirs and lakes (Raschke and Schultz 1987; Raschke et al. 1996)
Dissolved oxygen concentrations were above the ADEM Water Criteria (ADEM Admin. Code
R. 335-6-10-.09) limit of 5.0 mg/l at all stations (Fig. 6 & 7). Both the upper and lower stations
22000055 RRRRMMPP:: CCoooossaa BBaassiinn RReeppoorrtt 9

22000055 RRRRMMPP:: CCoooossaa BBaassiinn RReeppoorrtt 10
were stratified in most months June-September. Dissolved oxygen concentrations in tributaries
generally declined April-October (Fig. 7).
Carlson’s TSI was calculated from corrected chl a concentrations. Values for the mainstem
stations and tributaries were mostly eutrophic, with the exception of May values (Fig. 8).
August TSI values calculated from data collected at mainstem stations, 1985-2005, are presented
in Fig. 9. August TSI values have remained relatively stable in the mid-eutrophic range since
1998.
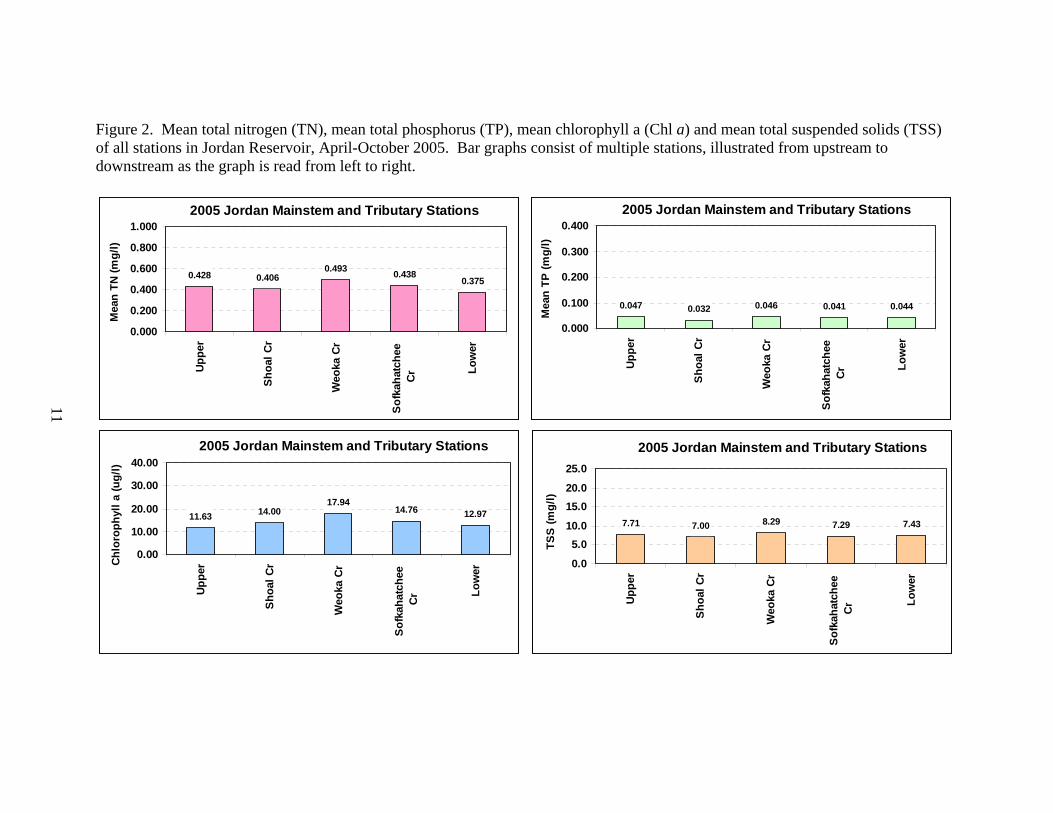
Figure 2. Mean total nitrogen (TN), mean total phosphorus (TP), mean chlorophyll a (Chl a) and mean total suspended solids (TSS) of all stations in Jordan Reservoir, April-October 2005. Bar graphs consist of multiple stations, illustrated from upstream to downstream as the graph is read from left to right.
2005 Jordan Mainstem and Tributary Stations
0.428 0.4060.493 0.438
0.375
0.000
0.200
0.400
0.600
0.800
1.000
Upp
er
Shoa
l Cr
Weo
ka C
r
Sof
kaha
tche
eC
r Low
er
Mea
n TN
(mg/
l)
2005 Jordan Mainstem and Tributary Stations
0.047 0.0440.0460.032 0.041
0.000
0.100
0.200
0.300
0.400
Upp
er
Sho
al C
r
Weo
ka C
r
Sofk
ahat
chee
Cr Lo
wer
Mea
n TP
(mg/
l)
2005 Jordan Mainstem and Tributary Stations
17.9414.76 12.9714.0011.63
0.00
10.00
20.00
30.00
40.00
Uppe
r
Shoa
l Cr
Weo
ka C
r
Sof
kaha
tche
eC
r Low
er
Chl
orop
hyll
a (u
g/l)
2005 Jordan Mainstem and Tributary Stations
8.29 7.29 7.437.007.71
0.0
5.010.0
15.020.0
25.0
Upp
er
Shoa
l Cr
Weo
ka C
r
Sof
kaha
tche
eC
r Low
er
TSS
(mg/
l)
11

Figure 3. Total nitrogen (TN), total phosphorus (TP), chlorophyll a (Chl a) and total suspended solids (TSS) of the upper station in Jordan Reservoir, April-October 2005. Each bar graph depicts monthly changes in the variables at the upper station. The historic mean and min/max range are also displayed for comparison. Nutrients and TSS are plotted vs. discharge (Coosa River near Rome, GA).
Jordan Reservoir - Upper Station
Total Nitrogen (mg/l)
0.000
0.500
1.000
1.500
2.000
2.500
3.000
Apr May Jun Jul Aug Sep Oct
TN (m
g/l)
0
2000
4000
6000
8000
10000
12000
14000
TN 2005
Historic Mean
Discharge
Jordan Reservoir - Upper StationTotal Phosphorus (mg/l)
0.000
0.020
0.040
0.060
0.080
0.100
0.120
0.140
Apr May Jun Jul Aug Sep Oct
TP (m
g/l)
0
2000
4000
6000
8000
10000
12000
14000
TP 2005
Historic Mean
Discharge
Jordan Reservoir - Upper StationChlorophyll a (µg/l)
0.00
10.00
20.00
30.00
40.00
Apr May Jun Jul Aug Sep Oct
Chl
a (µ
g/l)*
0
2000
4000
6000
8000
10000
12000
14000
CHL A 2005
Historic Mean
Discharge
*Includes estimated results due to holding time exceedances
Jordan Reservoir - Upper StationTotal Suspended Solids (mg/l)
0
5
10
15
20
Apr May Jun Jul Aug Sep Oct
TSS
(mg/
l)
0
2000
4000
6000
8000
10000
12000
14000
TSS 2005
Historic Mean
Discharge
12
13
Jordan Reservoir - Lower StationTotal Nitrogen (mg/l)
0.000
0.500
1.000
1.500
2.000
2.500
3.000
Apr May Jun Jul Aug Sep Oct
TN (m
g/l)
0
2000
4000
6000
8000
10000
12000
14000
TN 2005
Historic Mean
Discharge
Jordan Reservoir - Lower StationTotal Phosphorus (mg/l)
0.000
0.020
0.040
0.060
0.080
0.100
0.120
0.140
Apr May Jun Jul Aug Sep Oct
TP (m
g/l)
0
2000
4000
6000
8000
10000
12000
14000
TP 2005
Historic Mean
Discharge
Jordan Reservoir - Lower StationChlorophyll a (µg/l)
0.00
10.00
20.00
30.00
40.00
Apr May Jun Jul Aug Sep Oct
Chl
a (µ
g/l)*
0
2000
4000
6000
8000
10000
12000
14000
CHL A 2005
Historic Mean
Discharge
*Includes estimated results due to holding time exceedances
Jordan Reservoir - Lower StationTotal Suspended Solids (mg/l)
0
5
10
15
20
Apr May Jun Jul Aug Sep Oct
TSS
(mg/
l)
0
2000
4000
6000
8000
10000
12000
14000
TSS 2005
Historic Mean
Discharge
Figure 4. Total nitrogen (TN), total phosphorus (TP), chlorophyll a (Chl a) and total suspended solids (TSS) of the lower station in Jordan Reservoir, April-October 2005. Each bar graph depicts monthly changes in the variables at the lower station. The historic mean and min/max range are also displayed for comparison. Nutrients and TSS are plotted vs. discharge (Coosa River near Rome, GA).
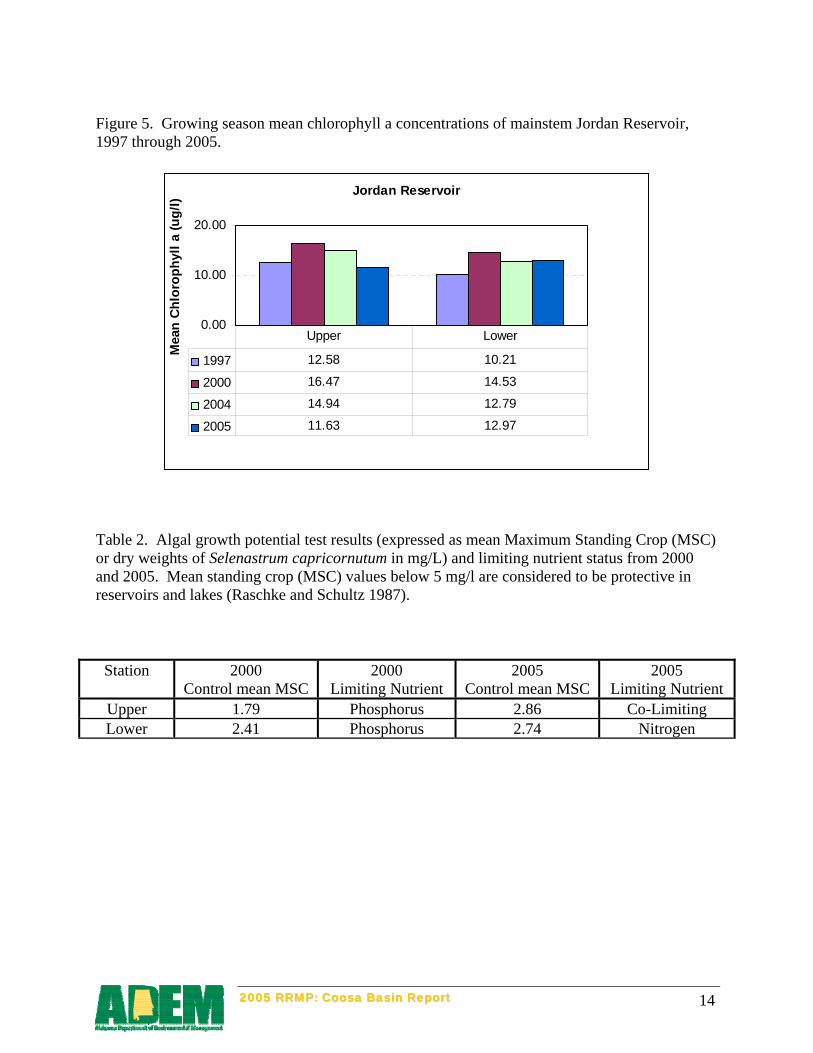
Figure 5. Growing season mean chlorophyll a concentrations of mainstem Jordan Reservoir, 1997 through 2005.
Jordan Reservoir
0.00
10.00
20.00
Mea
n C
hlor
ophy
ll a
(ug/
l)
1997 12.58 10.21
2000 16.47 14.53
2004 14.94 12.79
2005 11.63 12.97
Upper Lower
Table 2. Algal growth potential test results (expressed as mean Maximum Standing Crop (MSC) or dry weights of Selenastrum capricornutum in mg/L) and limiting nutrient status from 2000 and 2005. Mean standing crop (MSC) values below 5 mg/l are considered to be protective in reservoirs and lakes (Raschke and Schultz 1987).
Station 2000
Control mean MSC 2000
Limiting Nutrient 2005
Control mean MSC 2005
Limiting Nutrient Upper 1.79 Phosphorus 2.86 Co-Limiting Lower 2.41 Phosphorus 2.74 Nitrogen
22000055 RRRRMMPP:: CCoooossaa BBaassiinn RReeppoorrtt 14
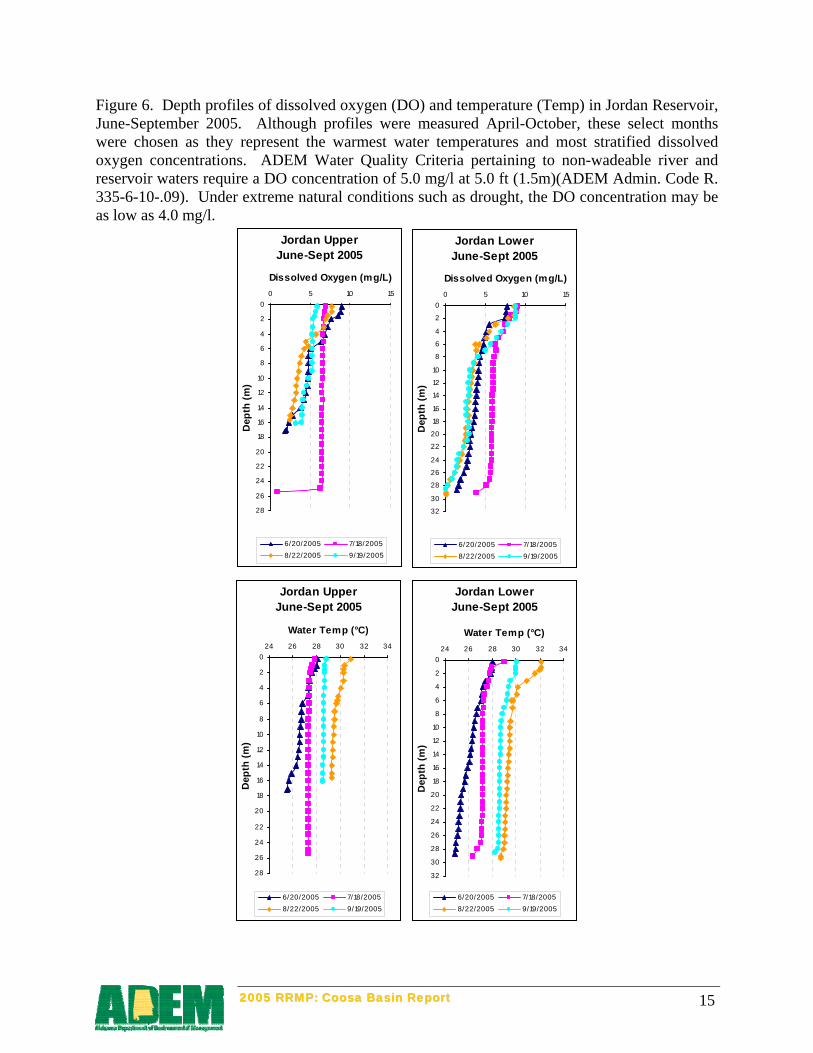
Figure 6. Depth profiles of dissolved oxygen (DO) and temperature (Temp) in Jordan Reservoir, June-September 2005. Although profiles were measured April-October, these select months were chosen as they represent the warmest water temperatures and most stratified dissolved oxygen concentrations. ADEM Water Quality Criteria pertaining to non-wadeable river and reservoir waters require a DO concentration of 5.0 mg/l at 5.0 ft (1.5m)(ADEM Admin. Code R. 335-6-10-.09). Under extreme natural conditions such as drought, the DO concentration may be as low as 4.0 mg/l.
Jordan LowerJune-Sept 2005
0
2
4
6
8
10
12
14
16
18
20
22
24
26
28
30
32
0 5 10 15
Dissolved Oxygen (mg/L)
Dep
th (m
)
6/20/2005 7/18/20058/22/2005 9/19/2005
Jordan LowerJune-Sept 2005
0
2
4
6
8
10
12
14
16
18
20
22
24
26
28
30
32
24 26 28 30 32 34
Water Temp (°C)
Dep
th (m
)
6/20/2005 7/18/20058/22/2005 9/19/2005
Jordan UpperJune-Sept 2005
0
2
4
6
8
10
12
14
16
18
20
22
24
26
28
0 5 10 15
Dissolved Oxygen (mg/L)
Dep
th (m
)
6/20/2005 7/18/20058/22/2005 9/19/2005
Jordan UpperJune-Sept 2005
0
2
4
6
8
10
12
14
16
18
20
22
24
26
28
24 26 28 30 32 34
Water Temp (°C)
Dep
th (m
)
6/20/2005 7/18/20058/22/2005 9/19/2005
22000055 RRRRMMPP:: CCoooossaa BBaassiinn RReeppoorrtt 15

Figure 7. DO concentrations at 5 ft. for Jordan Reservoir tributaries collected April-October 2005. For tributary embayments, which are typically not as deep as mainstem stations and usually maintain a mixed water column throughout the season, profiles were collected but only the monthly DO concentrations at a depth of 5ft (1.5m) are graphed. ADEM Water Quality Criteria pertaining to reservoir waters require a DO concentration of 5.0 mg/l at this depth (ADEM 2005).
Jordan Reservoir Tributaries
0.00
5.00
10.00
15.00
April May June July Aug Sep Oct
2005
DO a
t 5' (
mg/
l)
Shoal Cr
Weoka Cr
Sofkahatchee Cr
22000055 RRRRMMPP:: CCoooossaa BBaassiinn RReeppoorrtt 16

Figure 8. Monthly TSI values for mainstem and tributary stations using chlorophyll a concentrations and the Carlson’s Trophic State Index calculation, April-October 2005.
Jordan Reservoir
2030
405060
7080
Apr May Jun Jul Aug Sep Oct
2005
TSI Upper
Low er
Oligotrophic
Mesotrophic
Eutrophic
Hypereutrophic
Jordan Reservoir Tributaries
20
30
4050
60
70
80
April May June July Aug Sep Oct2005
TSI
Shoal Cr
Weoka Cr
Sofkahatchee Cr
Oligotrophic
Mesotrophic
EutrophicHypereutrophic
22000055 RRRRMMPP:: CCoooossaa BBaassiinn RReeppoorrtt 17
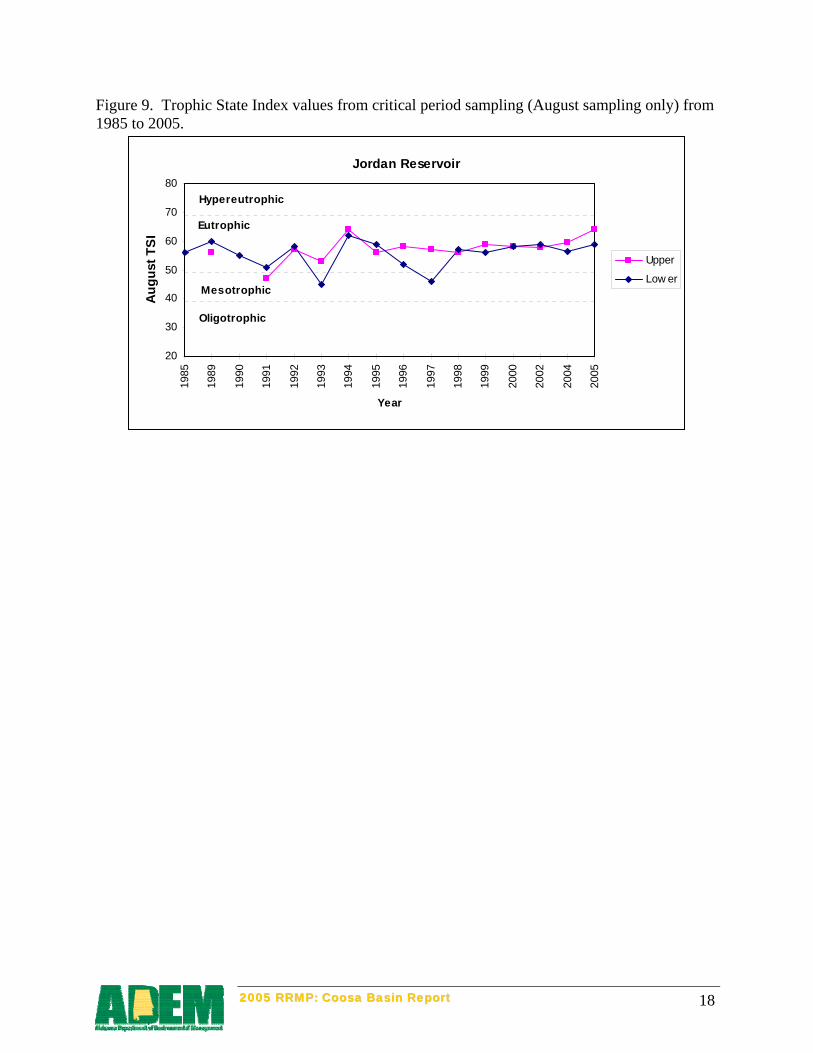
Figure 9. Trophic State Index values from critical period sampling (August sampling only) from 1985 to 2005.
Jordan Reservoir
20
30
40
50
60
70
8019
85
1989
1990
1991
1992
1993
1994
1995
1996
1997
1998
1999
2000
2002
2004
2005
Year
Aug
ust T
SI
Upper
Low er
Hypereutrophic
Eutrophic
Mesotrophic
Oligotrophic
22000055 RRRRMMPP:: CCoooossaa BBaassiinn RReeppoorrtt 18

REFERENCES
ADEM. 2008 (as amended). Standard Operating Procedures #2041 In Situ Surface Water Quality Field Measurements-Temperature, Alabama Department of Environmental Management (ADEM), Montgomery, AL.
ADEM. 2008 (as amended). Standard Operating Procedures #2042 In Situ Surface Water Quality Field Measurements-pH, Alabama Department of Environmental Management (ADEM), Montgomery, AL.
ADEM. 2008 (as amended). Standard Operating Procedures #2043 In Situ Surface Water Quality Field Measurements–Conductivity, Alabama Department of Environmental Management (ADEM), Montgomery, AL.
ADEM. 2007 (as amended). Standard Operating Procedures #2044 In Situ Surface Water Quality Field Measurements–Turbidity, Alabama Department of Environmental Management (ADEM), Montgomery, AL.
ADEM. 2008 (as amended). Standard Operating Procedures #2045 In Situ Surface Water Quality Field Measurements–Dissolved Oxygen, Alabama Department of Environmental Management (ADEM), Montgomery, AL.
ADEM. 2007 (as amended). Standard Operating Procedures #2046 Photic Zone Measurement and Visibility Determination, Alabama Department of Environmental Management (ADEM), Montgomery, AL.
ADEM. 2007 (as amended). Standard Operating Procedures #2061 General Surface Water Sample Collection, Alabama Department of Environmental Management (ADEM), Montgomery, AL.
ADEM. 2007 (as amended). Standard Operating Procedures #2062 Dissolved Reactive Phosphorus (DRP) Surface Water Sample Collection and Field Processing, Alabama Department of Environmental Management (ADEM), Montgomery, AL.
ADEM. 2007 (as amended). Standard Operating Procedures #2063 Water Column Chlorophyll a Sample Collection and Field Processing, Alabama Department of Environmental Management (ADEM), Montgomery, AL.
Alabama Department of Environmental Management Water Division (ADEM Admin. Code R. 335-6-10-.09). 2005. Specific Water Quality Criteria. Water Quality Program. Chapter 10. Volume 1. Division 335-6.
Alabama Department of Environmental Management Water Division (ADEM Admin. Code R. 335-6-10-.11). 2005. Water Quality Criteria Applicable to Specific Lakes. Water Quality Program. Chapter 10. Volume 1. Division 335-6.
22000055 RRRRMMPP:: CCoooossaa BBaassiinn RReeppoorrtt 19

22000055 RRRRMMPP:: CCoooossaa BBaassiinn RReeppoorrtt 20
American Public Health Association, American Water Works Association and Water Pollution Control Federation. 1998. Standard methods for the examination of water and wastewater. 20th edition. APHA, Washington, D.C.
Carlson, R.E. 1977. A trophic state index. Limnology and Oceanography. 22(2):361-369.
Lind, O.T. 1979. Handbook of common methods in limnology. The C.V. Mosby Co., St. Louis, Missouri. 199 pp.
Raschke, R.L. and D.A. Schultz. 1987. The use of the algal growth potential test for data assessment. Journal of Water Pollution Control Federation 59(4):222-227.
Raschke, R. L., H. S. Howard, J. R. Maudsley, and R. J. Lewis. 1996. The Ecological Condition of Small Streams in the Savannah River Basin: A REMAP Progress Report. EPA Region 4, Science and Ecosystem Support Division, Ecological Assessment Branch, Athens, GA.
U.S. Environmental Protection Agency. 1990. The lake and reservoir restoration guidance manual. 2nd edition. EPA-440/4-90-006. U.S.E.P.A. Office of Water. Washington, D.C. 326 pp.
Welch, E.B. 1992. Ecological Effects of Wastewater. 2nd edition. Chapman and Hall Publishers. London, England. 425 pp.
Wetzel, R.G. 1983. Limnology. 2nd edition. Saunders College Publishing. Philadelphia, Pennsylvania. 858 pp.

APPENDIX
22000055 RRRRMMPP:: CCoooossaa BBaassiinn RReeppoorrtt 21
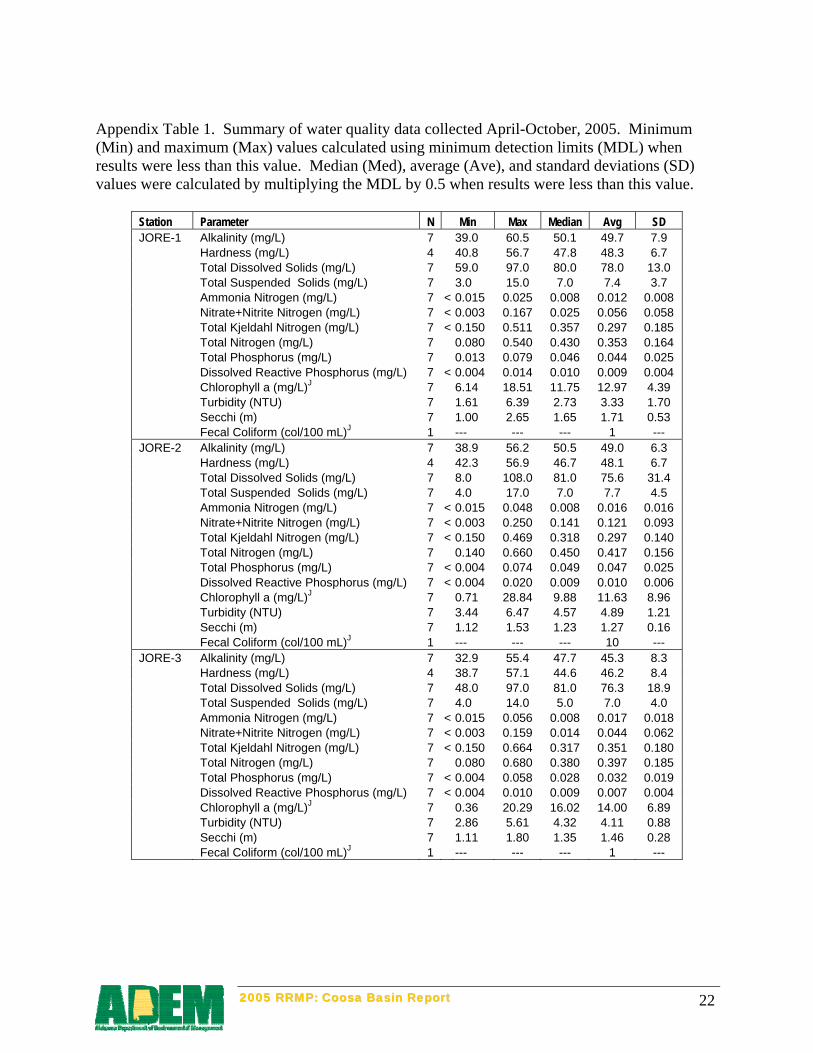
Appendix Table 1. Summary of water quality data collected April-October, 2005. Minimum (Min) and maximum (Max) values calculated using minimum detection limits (MDL) when results were less than this value. Median (Med), average (Ave), and standard deviations (SD) values were calculated by multiplying the MDL by 0.5 when results were less than this value.
Station Parameter N Min Max Median Avg SD JORE-1 Alkalinity (mg/L) 7 39.0 60.5 50.1 49.7 7.9 Hardness (mg/L) 4 40.8 56.7 47.8 48.3 6.7 Total Dissolved Solids (mg/L) 7 59.0 97.0 80.0 78.0 13.0 Total Suspended Solids (mg/L) 7 3.0 15.0 7.0 7.4 3.7 Ammonia Nitrogen (mg/L) 7 < 0.015 0.025 0.008 0.012 0.008 Nitrate+Nitrite Nitrogen (mg/L) 7 < 0.003 0.167 0.025 0.056 0.058 Total Kjeldahl Nitrogen (mg/L) 7 < 0.150 0.511 0.357 0.297 0.185 Total Nitrogen (mg/L) 7 0.080 0.540 0.430 0.353 0.164 Total Phosphorus (mg/L) 7 0.013 0.079 0.046 0.044 0.025 Dissolved Reactive Phosphorus (mg/L) 7 < 0.004 0.014 0.010 0.009 0.004 Chlorophyll a (mg/L)J 7 6.14 18.51 11.75 12.97 4.39 Turbidity (NTU) 7 1.61 6.39 2.73 3.33 1.70 Secchi (m) 7 1.00 2.65 1.65 1.71 0.53 Fecal Coliform (col/100 mL)J 1 --- --- --- 1 --- JORE-2 Alkalinity (mg/L) 7 38.9 56.2 50.5 49.0 6.3 Hardness (mg/L) 4 42.3 56.9 46.7 48.1 6.7 Total Dissolved Solids (mg/L) 7 8.0 108.0 81.0 75.6 31.4 Total Suspended Solids (mg/L) 7 4.0 17.0 7.0 7.7 4.5 Ammonia Nitrogen (mg/L) 7 < 0.015 0.048 0.008 0.016 0.016 Nitrate+Nitrite Nitrogen (mg/L) 7 < 0.003 0.250 0.141 0.121 0.093 Total Kjeldahl Nitrogen (mg/L) 7 < 0.150 0.469 0.318 0.297 0.140 Total Nitrogen (mg/L) 7 0.140 0.660 0.450 0.417 0.156 Total Phosphorus (mg/L) 7 < 0.004 0.074 0.049 0.047 0.025 Dissolved Reactive Phosphorus (mg/L) 7 < 0.004 0.020 0.009 0.010 0.006 Chlorophyll a (mg/L)J 7 0.71 28.84 9.88 11.63 8.96 Turbidity (NTU) 7 3.44 6.47 4.57 4.89 1.21 Secchi (m) 7 1.12 1.53 1.23 1.27 0.16 Fecal Coliform (col/100 mL)J 1 --- --- --- 10 --- JORE-3 Alkalinity (mg/L) 7 32.9 55.4 47.7 45.3 8.3 Hardness (mg/L) 4 38.7 57.1 44.6 46.2 8.4 Total Dissolved Solids (mg/L) 7 48.0 97.0 81.0 76.3 18.9 Total Suspended Solids (mg/L) 7 4.0 14.0 5.0 7.0 4.0 Ammonia Nitrogen (mg/L) 7 < 0.015 0.056 0.008 0.017 0.018 Nitrate+Nitrite Nitrogen (mg/L) 7 < 0.003 0.159 0.014 0.044 0.062 Total Kjeldahl Nitrogen (mg/L) 7 < 0.150 0.664 0.317 0.351 0.180 Total Nitrogen (mg/L) 7 0.080 0.680 0.380 0.397 0.185 Total Phosphorus (mg/L) 7 < 0.004 0.058 0.028 0.032 0.019 Dissolved Reactive Phosphorus (mg/L) 7 < 0.004 0.010 0.009 0.007 0.004 Chlorophyll a (mg/L)J 7 0.36 20.29 16.02 14.00 6.89 Turbidity (NTU) 7 2.86 5.61 4.32 4.11 0.88 Secchi (m) 7 1.11 1.80 1.35 1.46 0.28 Fecal Coliform (col/100 mL)J 1 --- --- --- 1 ---
22000055 RRRRMMPP:: CCoooossaa BBaassiinn RReeppoorrtt 22

22000055 RRRRMMPP:: CCoooossaa BBaassiinn RReeppoorrtt 23
Station Parameter N Min Max Median Avg SD JORE-4 Alkalinity (mg/L) 7 34.8 53.1 45.4 43.9 6.8 Hardness (mg/L) 4 38.1 56.6 41.7 44.5 8.2 Total Dissolved Solids (mg/L) 7 29.0 96.0 73.0 69.3 22.4 Total Suspended Solids (mg/L) 7 4.0 14.0 8.0 8.3 3.3 Ammonia Nitrogen (mg/L) 7 < 0.015 0.072 0.008 0.025 0.026 Nitrate+Nitrite Nitrogen (mg/L) 7 < 0.003 0.131 0.011 0.027 0.047 Total Kjeldahl Nitrogen (mg/L) 7 0.178 1.044 0.423 0.466 0.288 Total Nitrogen (mg/L) 7 0.180 1.060 0.430 0.494 0.287 Total Phosphorus (mg/L) 7 < 0.004 0.083 0.046 0.046 0.028 Dissolved Reactive Phosphorus (mg/L) 7 < 0.004 0.014 0.006 0.006 0.004 Chlorophyll a (mg/L)J 7 5.34 30.26 18.16 17.94 7.21 Turbidity (NTU) 7 2.81 5.54 4.55 4.31 0.96 Secchi (m) 6 1.19 1.66 1.31 1.21 0.56 Fecal Coliform (col/100 mL) 1 --- --- --- 46 --- JORE-5 Alkalinity (mg/L) 7 36.8 52.7 46.5 46.5 6.0 Hardness (mg/L) 4 39.6 57.4 44.6 46.5 8.6 Total Dissolved Solids (mg/L) 7 45.0 103.0 84.0 75.3 20.6 Total Suspended Solids (mg/L) 7 4.0 10.0 8.0 7.3 2.4 Ammonia Nitrogen (mg/L) 7 < 0.015 0.058 0.008 0.015 0.019 Nitrate+Nitrite Nitrogen (mg/L) 7 < 0.003 0.099 0.014 0.029 0.034 Total Kjeldahl Nitrogen (mg/L) 7 0.218 0.778 0.433 0.409 0.194 Total Nitrogen (mg/L) 7 0.220 0.810 0.450 0.439 0.212 Total Phosphorus (mg/L) 7 < 0.004 0.081 0.049 0.041 0.028 Dissolved Reactive Phosphorus (mg/L) 7 0.005 0.016 0.007 0.008 0.004 Chlorophyll a (mg/L)J 7 2.67 23.14 14.42 14.76 7.45 Turbidity (NTU) 7 1.83 5.12 2.82 3.04 1.16 Secchi (m) 7 1.27 2.01 1.61 1.63 0.29 Fecal Coliform (col/100 mL) 1 --- --- --- 25 --- J=one or more of the values provided are estimated; < = Actual value is less than the detection limit;


