56
2005 Annual Report
| Date post: | 14-Jan-2017 |
| Category: |
Documents |
| Upload: | mark-stevens |
| View: | 43 times |
| Download: | 0 times |

2005 Annual Report
TA B L E OF CO N T E N TS
1 Financial Highlights
2 Letter to Shareholders
6 Professional Services Division
8 Information Technology Services Division
10 Revenue Mix
11 Discussion of the Company
18 Selected Financial Data
19 Management’s Discussion and Analysis of
Financial Condition and Results of Operations
27 Quantitative and Qualitative DisclosuresAbout Market Risk
28 Financial Statements and Supplementary Data
51 Reconciliation of Non-GAAP Financial
Measure to GAAP Financial Measure
52 Common Stock Data and Other Information
53 Board of Directors, MPS Group Executives,and Business Unit Presidents
OU R BU S I N E S S
MPS Group, Inc. is a leading provider of
staffing, consulting, and solutions in the
disciplines of information technology,
accounting and finance, law, engineering,
and health care. MPS Group delivers its
services to businesses and government
entities in virtually all industries
throughout the United States, Canada,
the United Kingdom, and Europe.
A Fortune 1000 company with
headquarters in Jacksonville, Florida,
MPS Group trades on the New York
Stock Exchange (NYSE:MPS).

1MPS Group
2005 F I N A N C I A L HIG H L IG H TS
(dollar amounts in thousands except per share amounts)
Year 2005 2004 2003
Revenue $ 1,684,699 $ 1,426,842 $ 1,096,030
Cost of revenue 1,242,331 1,066,055 808,890
Gross profit 442,368 360,787 287,140
Operating expenses 355,382 308,654 251,339
Operating income $ 86,986 $ 52,133 $ 35,801
Income from continuing operations $ 59,597 $ 35,420 $ 21,835
Diluted income per common share from continuing operations (EPS) $ 0.56 $ 0.33 $ 0.21
RE V E N U E EPSEBITDA
EBITDA is a non-GAAP financial measure representing earnings before interest, taxes, depreciation, and amortization. See page 51 for a schedulereconciling EBITDA used above and in the letter to shareholders to the most comparable GAAP financial measure.
OPERATING MARGINGR O S S M A R G I N

2 MPS Group
OOne year ago I wrote to you about our plans to grow, strengthen, and diversify our business.
Thanks to the exceptional efforts of our consultants, staff, and leadership team, in 2005 we made
outstanding progress toward these goals.
Timothy D. Payne, President and Chief Executive Officer
TO OU R SH A R E HOL D E R S :
2005 YE A R I N RE V I E W
Total company revenues increased 18% to $1.685 billion for the
year. Revenues from our professional services businesses—which
provide staffing and recruiting services in the disciplines of accounting
and finance, law, engineering, and health care—rose 26%. At the
same time, our information technology (IT) businesses, which
provide IT staffing, IT solutions, and work force solutions, posted
an 11% increase in revenues as we balanced growth with more
selectivity in our client relationships.
Earnings growth was very strong in 2005 with diluted net income
per common share of $0.56, up 70% from 2004. EBITDA grew to
$102 million, an increase of 50% versus the prior year. Operating
income surpassed $86 million, up 67% compared with 2004. Our
ability to grow the bottom line faster than the top demonstrates
our strong operating leverage.
2005 AT A GL A N C E
Revenue GrossProfit
OperatingIncome
3MPS Group
Our balance sheet and overall financial position continued
to strengthen as well in 2005. For the year, we generated
more than $90 million in cash flow from operations. At
the close of 2005, we had $143 million in cash on hand
with no long-term debt and an untapped credit facility
of $150 million. Our financial strength should enable us
to continue to execute our growth strategy.
Overall, we were very pleased with our financial
performance in 2005.
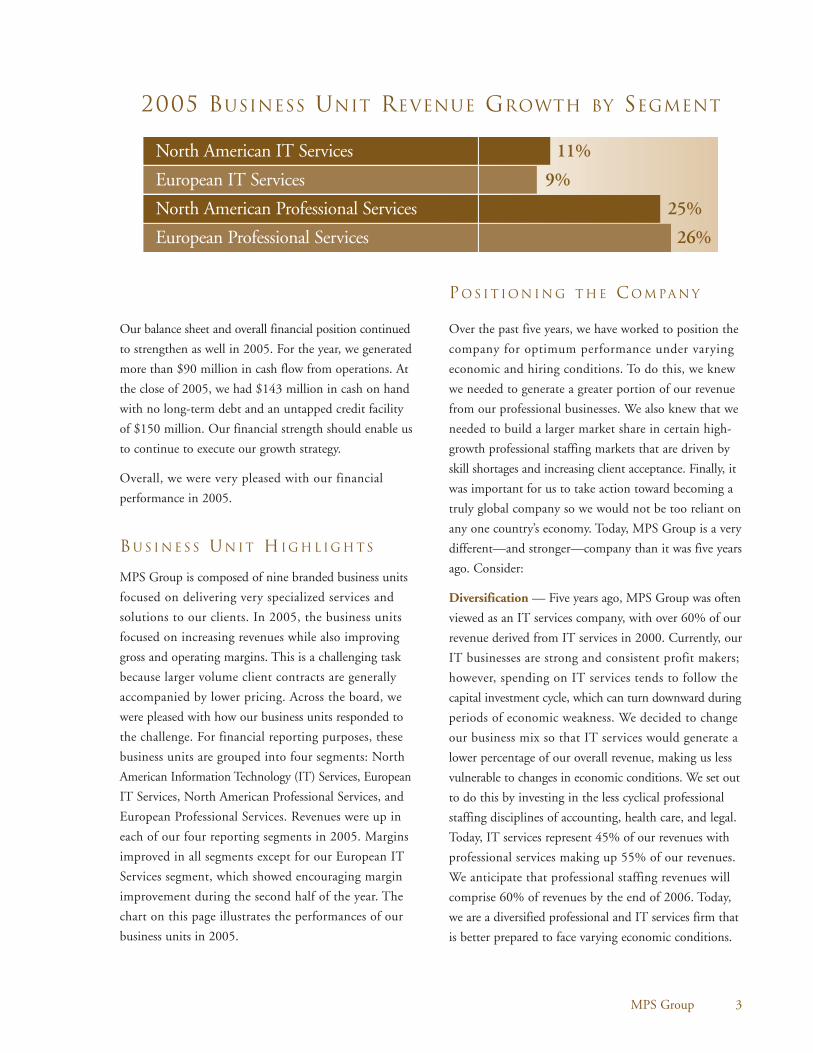
BU S I N E S S UN I T HIG H L IG H TS
MPS Group is composed of nine branded business units
focused on delivering very specialized services and
solutions to our clients. In 2005, the business units
focused on increasing revenues while also improving
gross and operating margins. This is a challenging task
because larger volume client contracts are generally
accompanied by lower pricing. Across the board, we
were pleased with how our business units responded to
the challenge. For financial reporting purposes, these
business units are grouped into four segments: North
American Information Technology (IT) Services, European
IT Services, North American Professional Services, and
European Professional Services. Revenues were up in
each of our four reporting segments in 2005. Margins
improved in all segments except for our European IT
Services segment, which showed encouraging margin
improvement during the second half of the year. The
chart on this page illustrates the performances of our
business units in 2005.
PO S I T IO N I N G T H E CO M PA N Y
Over the past five years, we have worked to position the
company for optimum performance under varying
economic and hiring conditions. To do this, we knew
we needed to generate a greater portion of our revenue
from our professional businesses. We also knew that we
needed to build a larger market share in certain high-
growth professional staffing markets that are driven by
skill shortages and increasing client acceptance. Finally, it
was important for us to take action toward becoming a
truly global company so we would not be too reliant on
any one country’s economy. Today, MPS Group is a very
different—and stronger—company than it was five years
ago. Consider:
Diversification — Five years ago, MPS Group was often
viewed as an IT services company, with over 60% of our
revenue derived from IT services in 2000. Currently, our
IT businesses are strong and consistent profit makers;
however, spending on IT services tends to follow the
capital investment cycle, which can turn downward during
periods of economic weakness. We decided to change
our business mix so that IT services would generate a
lower percentage of our overall revenue, making us less
vulnerable to changes in economic conditions. We set out
to do this by investing in the less cyclical professional
staffing disciplines of accounting, health care, and legal.
Today, IT services represent 45% of our revenues with
professional services making up 55% of our revenues.
We anticipate that professional staffing revenues will
comprise 60% of revenues by the end of 2006. Today,
we are a diversified professional and IT services firm that
is better prepared to face varying economic conditions.
2005 BUSINESS UNIT REVENUE GROWTH BY SEGMENT
North American IT Services 11%
European IT Services 9%
North American Professional Services 25%
European Professional Services 26%

4 MPS Group
Acceptance — The market for staffing specialties tends
to go through several clearly identifiable phases. The key
to maximizing growth is to be properly positioned when
clients enter the “acceptance” phase, which means they
begin using temporary professionals for roles previously
confined to full-time workers. Ten years ago, it was fairly
uncommon for law firms and corporate legal departments
to use temporary lawyers and paralegals. Five years ago, we
believed that acceptance of temporary legal professionals
would soon be on the rise, so we made investments in
this area of our business. Since 2002, our legal staffing
business has more than tripled, and we anticipate 2006
legal revenues of over $150 million. We think other areas
are ripe for increasing client acceptance, such as pharmacy,
school therapy, and marketing. We will continue to seek out
new staffing markets that are entering the acceptance phase.
Skill Shortages — Demand for specialty staffing services
is frequently driven by skill shortages, which often can be
attributed to a variety of factors. These factors include
declining graduation rates, an aging work force, and
changes in government regulation. The first two factors
have combined to create both acute and long-term
shortages of both health care professionals and
accountants. Adding to these shortages are increases in
government regulation. For example, states such as
California have passed legislation mandating a lower
nurse-to-patient ratio. And in the wake of widespread
accounting scandals, the Sarbanes-Oxley Act stoked
demand for accountants that already were in short
supply. Over the past several years, we have focused
on building our health care and accounting staffing
businesses to meet what we believe will be a period of
long-term strong demand. We entered the health care
staffing market in 2002 and have rapidly grown this
business, with revenues approaching $100 million
expected in 2006. We also made investments to grow
our accounting staffing business in both North America
and Europe. We anticipate that revenues from our global
accounting staffing operations will exceed $500 million
in 2006. We will continue to seek growth opportunities
driven by professional skill shortages.
International — Five years ago, only $429 million of
our revenues were derived from business outside the
United States. While the United States is perhaps the
world’s most vibrant market for specialty staffing services,
we saw the opportunity to enhance our growth potential
through international expansion. As a result, in 2005 we
generated revenues of $637 million from outside the
United States, an increase of 48% from 2000. We now
operate in 10 countries: Belgium, Canada, England,
Germany, Hungary, Luxembourg, Netherlands, Poland,
Scotland, and the United States. While our presence is
still small in many of these countries, we now have new
sources of growth and greater geographic diversity. We will
continue to focus on growing our current international
business while expanding into countries with favorable
conditions for growth.
MPS Group now is more diverse, better positioned in
key growth markets, and better positioned for
international expansion.
FU T U R E OF SPE C I A LT Y STA F F I N G
While we are pleased with how we have positioned the
company, our future growth and prosperity will depend
on the overall strength of the markets for specialty
staffing. We believe demographics, liberalization of labor
laws, and a growing utilization of contingent labor all
add up to a bright future for our industry.
Demographics — By 2008, the so-called “baby boomers”
will begin to retire from the work force. This highly
trained, well-educated group will be replaced by a much
smaller generation, leading many experts to believe that a
“skilled-worker gap” will materialize. It has been estimated
that by 2020 the United States alone may face a shortfall
of 14 million skilled workers, and many other countries
are facing similar potential shortfalls. Should this scenario
materialize, long-term demand for knowledge workers
will be strong, particularly in highly skilled professions
such as health care, accounting, information technology,
and engineering.

5MPS Group
Labor Practices — Unlike the United States, Canada,
and the United Kingdom, many countries traditionally
have had labor laws and practices that discourage the
use of contingent labor. For example, the utilization of
contingent labor in Germany is only 1%, compared with
3% in the United Kingdom. Many countries, particularly
in Europe, now are examining their labor laws and
considering liberalization policies that could lead to
greater use of professional contingent labor. We believe
that if this trend toward liberalization of labor laws and
practices continues, it will help create new opportunities
for expansion in Europe and beyond.
Contingent Labor Growth — In countries that already
have flexible labor environments, utilization of contingent
labor is on the rise for different reasons. From the employer
standpoint, contingent workers allow for just-in-time
delivery of critical skill sets and allow for variable staff
costs that can fluctuate with business conditions. From
the employee standpoint, a growing number of profes-
sionals prefer working on a contingent basis due to
family requirements, the need for a flexible work schedule,
or simply the desire for variety. In 1975, the percentage
of temporary workers within the overall United States
work force was less than one-half of 1%. Today, that
percentage is approaching an all-time high of about 2%.
The United States Bureau of Labor Statistics estimates
that 1.8 million contingent worker positions will be
added to the U.S. economy between 2002 and 2012.
This trend toward increasing utilization of contingent
labor is a positive development for MPS Group.
We believe these three trends create a favorable
environment for specialty staffing providers such as
MPS Group—and will do so for many years to come.
SUM M A RY
We anticipate another strong performance for MPS Group
in 2006. Our financial position is sound, with no long-
term debt and $143 million in cash reserves. The growth
and performance of our branded business units in 2005
was attributable to the talents, creativity, and drive of our
people, who we consider to be the best in our industry.
We also are positive about the changes our business has
undergone in recent years and believe we are better
positioned for optimum performance under varying
economic conditions. The future appears bright for our
industry in the coming years.
In closing, I would like express to each client how much
we value our business relationship with you. To our
people, thank you for your hard work and your many
contributions to our success. Finally, thank you, our
shareholders, for the trust and support you have placed
in us through your investment in MPS Group.
TI M OT H Y D. PAY N E
PR E S I D E N T A N D CH I E F E X E C U T I V E OF F IC E R
April 14, 2006
6 MPS Group
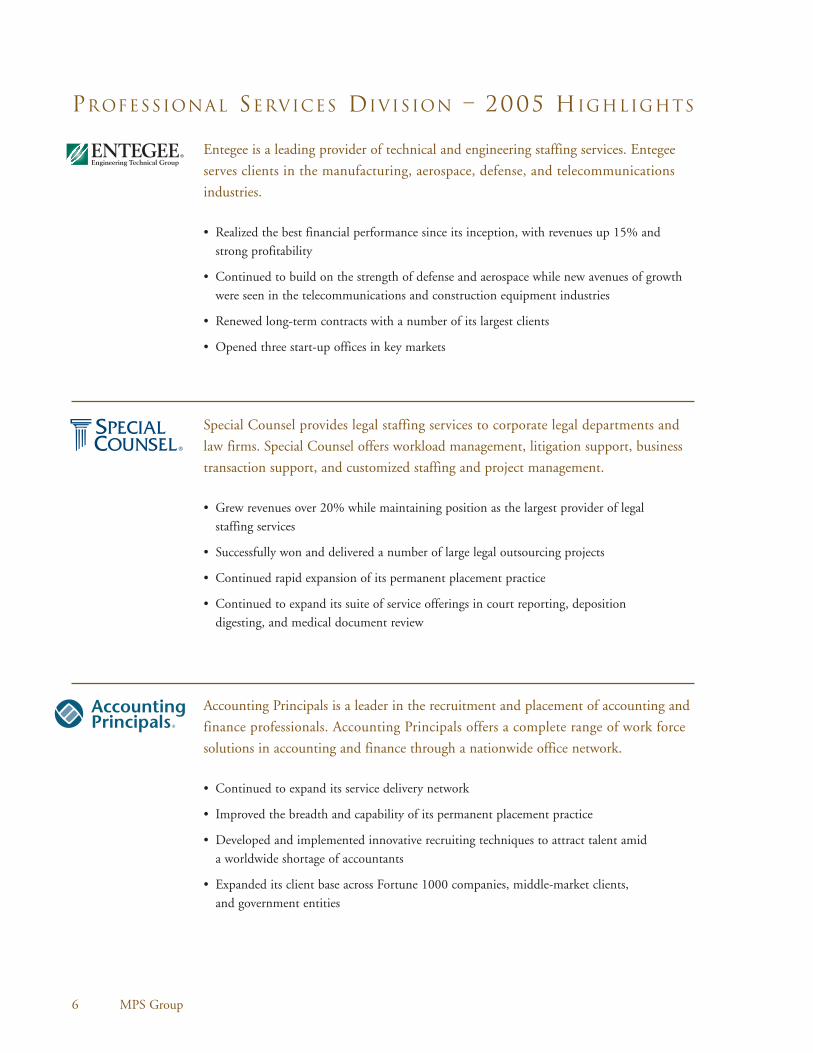
Accounting Principals is a leader in the recruitment and placement of accounting and
finance professionals. Accounting Principals offers a complete range of work force
solutions in accounting and finance through a nationwide office network.
• Continued to expand its service delivery network
• Improved the breadth and capability of its permanent placement practice
• Developed and implemented innovative recruiting techniques to attract talent amid a worldwide shortage of accountants
• Expanded its client base across Fortune 1000 companies, middle-market clients, and government entities
Entegee is a leading provider of technical and engineering staffing services. Entegee
serves clients in the manufacturing, aerospace, defense, and telecommunications
industries.
• Realized the best financial performance since its inception, with revenues up 15% and strong profitability
• Continued to build on the strength of defense and aerospace while new avenues of growthwere seen in the telecommunications and construction equipment industries
• Renewed long-term contracts with a number of its largest clients
• Opened three start-up offices in key markets
Special Counsel provides legal staffing services to corporate legal departments and
law firms. Special Counsel offers workload management, litigation support, business
transaction support, and customized staffing and project management.
• Grew revenues over 20% while maintaining position as the largest provider of legal staffing services
• Successfully won and delivered a number of large legal outsourcing projects
• Continued rapid expansion of its permanent placement practice
• Continued to expand its suite of service offerings in court reporting, deposition digesting, and medical document review
PROFESSIONAL SERVICES DIVISION – 2005 HIGHLIGHTS
7MPS Group
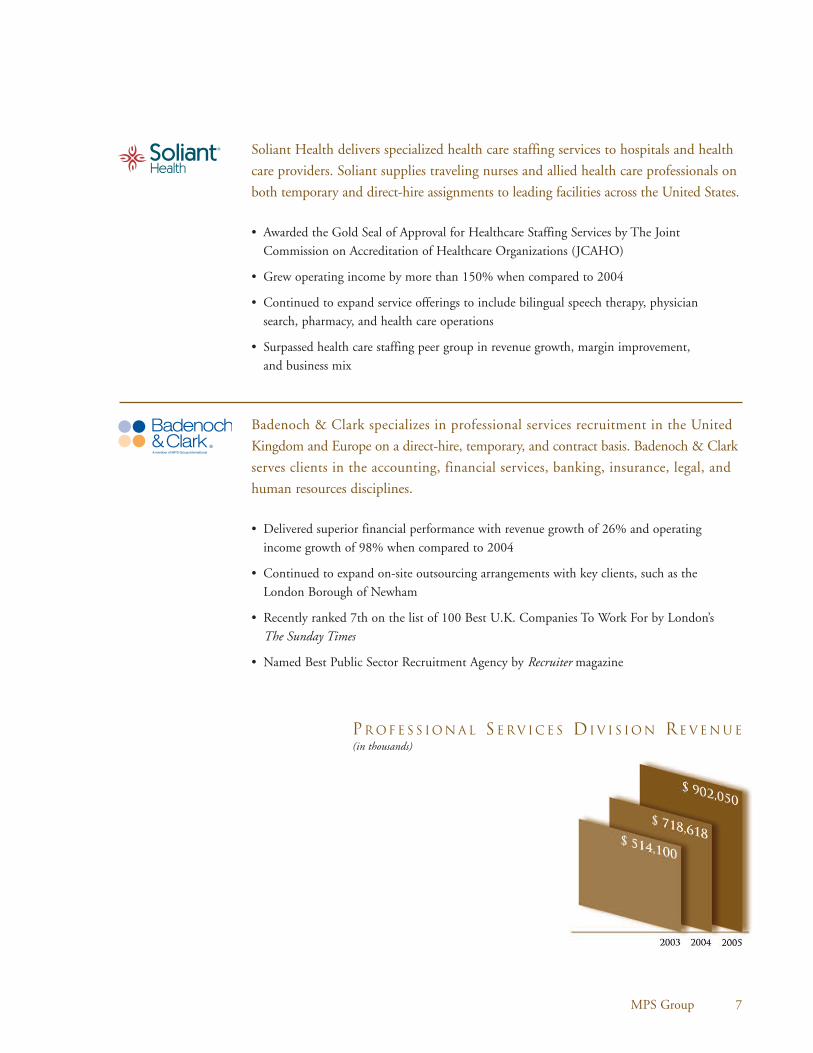
Soliant Health delivers specialized health care staffing services to hospitals and health
care providers. Soliant supplies traveling nurses and allied health care professionals on
both temporary and direct-hire assignments to leading facilities across the United States.
• Awarded the Gold Seal of Approval for Healthcare Staffing Services by The JointCommission on Accreditation of Healthcare Organizations (JCAHO)
• Grew operating income by more than 150% when compared to 2004
• Continued to expand service offerings to include bilingual speech therapy, physician search, pharmacy, and health care operations
• Surpassed health care staffing peer group in revenue growth, margin improvement, and business mix
Badenoch & Clark specializes in professional services recruitment in the United
Kingdom and Europe on a direct-hire, temporary, and contract basis. Badenoch & Clark
serves clients in the accounting, financial services, banking, insurance, legal, and
human resources disciplines.
• Delivered superior financial performance with revenue growth of 26% and operatingincome growth of 98% when compared to 2004
• Continued to expand on-site outsourcing arrangements with key clients, such as the
London Borough of Newham
• Recently ranked 7th on the list of 100 Best U.K. Companies To Work For by London’s The Sunday Times
• Named Best Public Sector Recruitment Agency by Recruiter magazine
PR OF E S S IO N A L SE RV IC E S DI V I S IO N RE V E N U E(in thousands)
8 MPS Group
Modis is one of North America’s leading providers of information technology (IT)
staffing services and solutions including contract, contract-to-hire, direct hire, and
project management. Modis serves more than 1,000 clients in virtually every industry.
• Grew revenues by over 10% on an organic basis
• Grew permanent placement fees by over 100%
• Named one of the top 500 IT solutions providers by VARBusiness magazine
• Maintained its position as a leading provider to the Fortune 1000 while significantly expanding its footprint among middle-market companies
Beeline delivers solutions that automate work force acquisition, management, and
analytics to help organizations streamline the process of recruiting, hiring, procuring,
and managing full-time and contingent work forces.
• Processed over $2 billion in labor spending through its leading Web-based, contingent laborprocurement application
• Continued to build its client base of Fortune 1000 companies
• Successfully delivered a next generation application built upon the Microsoft.NETarchitecture
• Significantly grew its international client base
Idea Integration provides technology solutions and systems integration services. Idea
Integration specializes in application development, digital data management,
business intelligence, infrastructure and security, and interactive marketing.
• Grew market share across its service delivery network with sharp gains in the southeastern
United States
• Experienced strong increases in project activity among state and local government clients
• Named one of the top 50 interactive agencies by AdWeek magazine
• Awarded two Manager Excellence Awards by Microsoft
IT SE RV IC E S DI V I S IO N – 2005 HIGHLIGHTS

9MPS Group
Modis International is one of Europe’s largest and most respected providers of IT
staffing services and solutions. Modis International serves FTSE 1000 companies
and government entities in the United Kingdom and continental Europe.
• Improved margins in second half of year by focusing efforts on higher-margin clients andhigher-margin services
• Expanded European footprint to seven countries with the establishment of operations in Scotland
• Won significant contract to provide full-time IT professionals to the United Kingdom’sNational Health Service
• Won competitive bids to secure renewals with a number of key clients
INFORMATION TECHNOLOGY SERVICES DIVISION REVENUE(in thousands)

NORTH AMERICAN
IN F OR M AT IO N
TE C H N OLO G Y :
IT SE RV IC E S 25%
IT SOL U T IO N S 4%
WOR K FOR C E
AU TO M AT IO N 1%
10 MPS Group
NORT H A M E R IC A N PR OF E S S IO N A L SE RV IC E S :
HE A LT H CA R E 4%
ACCOUNTING AND FINANCE 5.5%
LE G A L 8%
EN G I N E E R I N G 14 .5%
NORT H A M E R IC A 62%
UN I T E D KI N G D O M 35%
CO N T I N E N TA L EU R OPE 3%
EU R OPE A N
IN F OR M AT IO N
TE C H N OLO G Y 16%
EU R OPE A N
PR OF E S S IO N A L
SE RV IC E S 22%
2005 RE V E N U E BY GE O G R A PH IC AR E A
2005 RE V E N U E BY SE G M E N T

MPS Group 11
FORWARD-LOOKING STATEMENTS
This Annual Report to Shareholders contains forward-looking statements that are subject to certain risks,uncertainties or assumptions and may be affected bycertain factors, including but not limited to the specificfactors discussed below, under “Risk Factors,” “Marketfor Registrant’s Common Equity, Related StockholderMatters and Issuer Purchases of Equity Securities,” and“Management’s Discussion and Analysis of FinancialCondition and Results of Operations—Liquidity andCapital Resources.” In some cases, you can identifyforward-looking statements by terminology such as“may,” “should,” “could,” “expects,” “plans,” “indicates,”“projects,” “anticipates,” “believes,” “estimates,” “appears,”“predicts,” “potential,” “continues,” “can,” “hopes,”“perhaps,” “would,” or “become,” or the negative ofthese terms or other comparable terminology. Inaddition, except for historical facts, all informationprovided below, under “Quantitative and QualitativeDisclosures About Market Risk” should be considered
forward-looking statements. Should one or more ofthese risks, uncertainties or other factors materialize,or should underlying assumptions prove incorrect,actual results, performance or achievements of theCompany may vary materially from any future results,performance or achievements expressed or implied bysuch forward-looking statements.
Forward-looking statements are based on beliefs andassumptions of the Company’s management and oninformation currently available to such management.Forward looking statements speak only as of the datethey are made, and the Company undertakes noobligation to publicly update any of them in light ofnew information or future events. Undue reliance shouldnot be placed on such forward-looking statements,which are based on current expectations. Forward-looking statements are not guarantees of performance.
IN T R OD U C T IO N
MPS Group, Inc. is a leading provider of businessservices with over 190 offices throughout the UnitedStates, Canada, the United Kingdom, and continentalEurope. We deliver specialty staffing, consulting andbusiness solutions to virtually all industries in thefollowing disciplines, through the following primarybrands:
BR A N D(S ) DI S C I P L I N E
Information Technology (IT) Services
Accounting and Finance
Engineering
Legal
IT Solutions
Health Care
Work Force Automation
Our strategy is to focus on increasing revenue andprofits, through a combination of internal growth andacquisitions, primarily within our core disciplines and,to a lesser extent, expansion into new specialties.
Specifically, we aim to maintain a leadership positionin our IT-related disciplines, while growing ourprofessional-related disciplines both organically andthrough acquisitions, which should result in theProfessional Services Division providing a largeroverall percentage contribution to our total revenues.
The key elements to our internal growth strategyinclude:
• increasing penetration of existing markets andcustomer segments,
• expanding current specialties into new andcontiguous geographic markets,
• concentrating on skill areas that value high levelsof service, and
• identifying and adding new practice areas.
While we look to strengthen relationships with ourclients, we are not dependent upon a single customeror a limited number of customers.
Pursuant to our acquisition strategy, we acquiredeleven businesses from 2003 to 2005: four legal staffingbusinesses acquired in February of 2003, August of2003, August of 2004, and October of 2004; threehealth care staffing businesses acquired in February of2004, March of 2004, and September of 2005; fouraccounting and finance staffing businesses acquired inFebruary of 2004, July of 2004, October of 2004, andSeptember of 2005; and two IT Solutions businesses,acquired in July of 2005 and September of 2005. Theaccounting and financing business and IT solutions

business acquired in September of 2005 were part ofthe same acquisition. The businesses acquired in 2005,2004, and 2003, had a combined annualized revenue of$25 million, $95 million, and $22 million at acquisitiondate, respectively.
In addition, we look to focus our efforts intensely onour core businesses. Toward this end, we have divestedcertain businesses we deemed not central to our strategy,including the 2003 sale of our outplacement unit, andthe 2004 sale of our retained executive search unit. Wefeel we are able to execute and profit from our internalgrowth and acquisition strategies due to our strongmanagement team, our integrated and scalable backoffice support services, and to the continued develop-ment of our strategic management information systems.
In all of our markets and disciplines, we encounteraggressive and capable competition, with a number offirms offering services similar to ours on a national,regional or local basis. Our ability to compete success-fully depends on our reputation, pricing and quality ofservice provided, our understanding of clients’ specificjob requirements, and our ability to provide qualifiedpersonnel in a timely manner.
The Company was incorporated under the laws of theState of Florida in 1992 under the name AccustaffIncorporated, and changed its name to MPS Group,
Inc. in 2002. Our principal executive offices are locatedin Jacksonville, Florida. Strategically, our operations arecoordinated primarily from facilities in Jacksonville,Florida, and London, England, and to a lesser extent,Burlington, Massachusetts. Both of our Jacksonvilleand London facilities provide support and centralizedservices to our offices in the administrative, marketing,public relations, accounting, training and legal areas.Regional and local office managers are responsible formost activities of their offices, including sales, localand regional marketing and recruitment.
SE G M E N TS
We present the financial results of our operationsunder our four reporting segments: North AmericanProfessional services, European Professional services,North American IT services and European IT services.In addition, we have both a Professional services and anIT services division. The Professional services divisionis comprised of both the North American Professionalservices segment and the European Professional servicessegment. The IT services division is comprised ofboth the North American IT services segment andthe European IT services segment. The table belowhighlights the percentage contribution of revenue andgross profit from our four segments for 2005 and 2004:
12 MPS Group
Professional Services division Our Professional services division provides specializedstaffing and recruiting in the disciplines of accounting,finance staffing, law, engineering and healthcare forvarying periods of time to companies or other organiza-tions (including government agencies) that have a needfor such personnel, but are unable to, or choose not to,engage certain personnel as their own employees.Businesses increasingly view the use of temporaryemployees as a means of controlling personnel costsand converting the nature of such costs from fixed tovariable. Examples of client needs for staffing solutionsinclude the need for specialized or highly-skilledpersonnel for the completion of a specific project orsubproject, substitution for regular employees duringvacation or sick leave, and staffing of high turnoverpositions or during seasonal peaks.
We operate this division under a variable cost businessmodel whereby revenue and cost of revenue are primarilyrecognized and incurred on a time-and-materialsbasis. The vast majority of the billable consultants arecompensated on an hourly basis only for the hourswhich are billed to our clients.
Clients also hire our skilled consultants on a permanentbasis, whether it is from a conversion of a temporaryassignment to, or a direct placement of, a full-timeposition. We earn a one-time fee for these services.These fees represent approximately 6% of this division’srevenue.
2005 2004 2005 2004Revenue Revenue Gross Profit Gross Profit
North American Professional Services 31.9% 30.1% 36.3% 34.3%European Professional Services 21.6% 20.3% 23.5% 22.3%
Professional Services Division 53.5% 50.4% 59.8% 56.6%
North American IT Services 30.3% 32.2% 32.1% 34.3%European IT Services 16.2% 17.4% 8.1% 9.1%
IT Services Division 46.5% 49.6% 40.2% 43.4%
North American Segments 62.2% 62.3% 68.4% 68.6%European Segments 37.8% 37.7% 31.6% 31.4%
Additional financial information relating to our segments can be found in Footnote 15 to the Consolidated Financial Statements.

The principal national and international competitorsof our Professional services division include RobertHalf International Inc., Resources Connection, Inc.,Spherion Corporation, Kelly Law Registry, AjilonConsulting (a wholly owned subsidiary of Adecco SA),Michael Page International, Robert Walters PLC,Hays PLC, Cross Country Healthcare, Inc., and CDICorporation.
North American Professional Services segment Our North American Professional services segment goesto market under the primary brands and operating unitsEntegee, Special Counsel, Accounting Principals, andSoliant Health. The demands of our clients (the need forconfidentiality, accuracy and reliability, cost-effectiveness,and frequent peak workload periods) are similar amongthe businesses within this segment.
Entegee provides technical and engineering strategicworkforce solutions. From on-site managementconsulting and in-house project services to temporaryand direct placement, Entegee combines industryknowledge and experience to fill highly skilledtechnical and engineering positions. These positionsinclude, but are not limited to, engineers, designers,drafters, inspectors and assemblers. Entegee operatesthrough a domestic network of national practicebranches with offices in 10 markets, and employsapproximately 2,700 billable consultants. Entegeealso provides engineering and drafting design servicesthrough two company-owned centers that utilizestate-of-the-art computer technology. Its primaryclients include government and defense contractors,manufacturing and engineering companies.
Special Counsel staffs temporary and full-timeemployees in attorney, paralegal, legal administrativeand legal secretarial positions for workload manage-ment, litigation support, business transaction support,pre-litigation and document management support, aswell as medical document review, deposition digesting,court reporting and other trial-related services.Special Counsel has a network of 37 offices acrossthe United States, and employs approximately 1,700billable consultants. Its primary clients are Fortune1000 companies and law firms.
Accounting Principals specializes in placing temporaryand full-time employees in accounting and financepositions. Accounting Principals has a network of40 offices across the United States, and employsapproximately 1,400 billable consultants.
In 2005, we expanded Accounting Principals’geographic footprint with the acquisition of PacioliCompanies in September. Pacioli Companies provideshigh-end accounting candidates to clients primarilylocated in the Minneapolis, St. Paul, Minnesota area.
Soliant Health specializes primarily in placingtraveling healthcare professionals, in the areas ofnursing, physical and occupational therapy, alongwith imaging technicians. Soliant Health employsapproximately 700 consultants, and its clients includehospitals and healthcare providers across theUnited States.
In 2005, we expanded Soliant Health’s service linewith the acquisition of Bilingual Therapies inSeptember. Bilingual Therapies provides bilingualand monolingual Speech Language Pathologists(SLPs) to school systems throughout the country.Bilingual Therapies is the national market leader inthe placement of bilingual SLPs.
Dispositions In 2003, we sold certain operating assets and transferredcertain operating liabilities of our outplacement unit.The decision to sell our outplacement unit was inkeeping with our long-term strategy of focusing onour core businesses. As a result of the sale of ouroutplacement unit and in accordance with GenerallyAccepted Accounting Principles (GAAP), ourConsolidated Financial Statements and Management’sDiscussion and Analysis of Financial Condition andResults of Operations report the results of operationsof this unit as Discontinued Operations for all periodspresented. In 2004, we sold certain assets and transferredcertain liabilities of our retained executive search brand.
European Professional Services segment Since 1980, our European professional services business,Badenoch & Clark, has specialized in placing temporary,full-time, contract and interim recruitment employeesin accounting and finance, financial services, legal,human resources, and marketing positions. Badenoch& Clark has 19 offices across the United Kingdom andan office in Luxembourg. Badenoch & Clark employsapproximately 4,200 billable consultants.
IT Services division Our IT services division provides specialty staffing,consulting and business solutions under the brands/operating units Modis, Modis International, IdeaIntegration and Beeline. We utilize the brand Modisin both our North American and European segments;however, the overall business culture distinguishes theoperation of these two segments.
We operate this division primarily under a variable costbusiness model whereby revenue and cost of revenueare primarily recognized and incurred on a time-and-materials basis. The vast majority of the billable con-sultants are compensated on an hourly basis only for thehours which are billed to our clients. Approximately1% of this division’s revenue is generated from fees forclients directly hiring our consultants.
13MPS Group

The principal national and international competitors ofour IT services division include Keane, Inc., ComputerHorizons Corp., Comsys IT Partners, Inc., CIBER,Inc., Computer People (a division of Ajilon Group),Hays PLC, Elan, Lorien PLC, and Sapient Corporation.In addition, we may compete against the internalmanagement information services and IT departmentsof our clients and potential clients.
North American IT Services segment Modis specializes in the placement of IT contractconsultants for IT project support and staffing,recruitment of full-time positions, project-basedsolutions, supplier management solutions, and on-siterecruiting support for application development, systemsintegration, and enterprise application integration.Modis has a network of 44 offices across the UnitedStates, and employs approximately 3,700 billableconsultants. Its primary clients are Fortune 1000companies.
Idea Integration specializes in Web design anddevelopment, information management solutions,wireless workflow applications, portal solutions, andenterprise resource management. Idea utilizes bothsalaried and hourly consultants to deliver solutionsprimarily under time-and-materials contracts and toa lesser extent under fixed-fee contracts. It operatesin certain markets across the United States and itsclients include Fortune 1000 companies, governmentand middle-market companies.
In 2005, we expanded Idea Integration’s geographicfootprint with the acquisitions of two IT solutionsbusinesses: Encore Development in July and PacioliCompanies in September. Encore Development is aFlorida-based IT solutions company specializing inMicrosoft development capabilities with clientsprimarily located in northeast Florida. PacioliCompanies provides IT programmers, statisticalanalysts, modelers, architects, and implementers toclients using SAS Software.
Beeline is our software-based human capitalmanagement services solution that automates theacquisition and management of both full-time andcontingent workers. Beeline operates primarily inthe United States and its’ clients are principallyFortune 1000 companies.
Beeline maintains a full-time staff to support itsoperations and seeks to collect a service charge basedupon the usage of this service. Subsequent to the initialstart up costs and time, minimal cost and resourcesare required for the usage of Beeline’s services.
European IT Services segment Our European IT services segment is comprised ofModis International. Modis International, headquar-tered in the United Kingdom, specializes in providingIT contract consultants throughout the UnitedKingdom and certain continental European markets.Modis International has been in operation for over 30years. It has 11 offices across the United Kingdom, andan office each in Belgium, Germany, and the Netherlands.It employs approximately 2,100 billable consultants.
EM P LO Y E E S
MPS employs approximately 16,800 consultants andapproximately 2,600 full-time staff employees. Approx-imately 250 of the employees work at corporateheadquarters.
As described below, in most jurisdictions, we, as theemployer of the consultants or as otherwise requiredby applicable law, are responsible for employmentadministration. This administration includes collectionof withholding taxes, employer contributions for socialsecurity or its equivalent outside the United States,unemployment tax, maintaining workers’ compensationand fidelity and liability insurance, and other govern-mental requirements imposed on employers. Full-timeemployees are covered by life and disability insuranceand receive health insurance and other benefits.
GO V E R N M E N T RE G U L AT IO N S
Outside of the United States and Canada, the staffingservices industry is closely regulated. These regulationsdiffer among countries but generally may regulate:(i) the relationship between us and our temporaryemployees; (ii) registration, licensing, record keeping,and reporting requirements; and (iii) types of operationspermitted. Regulation within the United States andCanada has not materially impacted our operations.
In many countries, including the United States and theUnited Kingdom, staffing services firms are consideredthe legal employers of the temporary consultants whilethe consultant is on assignment with a company client.Therefore, laws regulating the employer/employeerelationship, such as tax withholding or reporting,social security or retirement, anti-discrimination, andworkers’ compensation, govern us. In other countries,staffing services firms, while not the direct legalemployer of the consultant, are still responsible forcollecting taxes and social security deductions andtransmitting such amounts to the taxing authorities.
14 MPS Group

IN T E L L E C T UA L PR OPE RT Y
We seek to protect our intellectual property throughcopyright, trade secret and trademark law and throughcontractual non-disclosure restrictions. Our servicesoften involve the development of work and materialsfor specific client engagements, the ownership of whichis frequently assigned to the client. We do at times, andwhen appropriate, negotiate to retain the ownership orcontinued use of development tools or know howcreated or generated by us for a client in the deliveryof our services, which we may then license or use inthe delivery of our services to other clients.
SE A S O N A L I T Y
Our quarterly operating results are affected by thenumber of billing days in the quarter and the seasonalityof our customers’ businesses. Demand for our serviceshas historically been lower during the calendar year-end, as a result of holidays, through February of thefollowing year. Extreme weather conditions may alsoaffect demand in the early part of the year as certainof our clients’ facilities are located in geographic areassubject to closure or reduced hours due to inclementweather. In addition, we experience an increase in ourcost of sales and a corresponding decrease in grossprofit and gross margin in the first fiscal quarter ofeach year, as a result of certain U.S. state and federalemployment tax resets.
ACCESS TO COMPANY INFORMATION
Our common stock is listed on the New York StockExchange (‘NYSE’) under the ticker symbol ‘MPS’.Our Internet address is www.mpsgroup.com. We makeavailable through our Internet website our annualreports on Form 10-K, quarterly reports on Form 10-Q,and current reports on Form 8-K, as soon as reasonablypracticable after filing such material with, or furnishingit to, the Securities and Exchange Commission. Theinformation contained on our website, or on other web-sites linked to our website, is not part of this document.
RI S K FA C TOR S
Our results of operations and financial condition can beadversely affected by numerous risks and uncertainties.The most important of these risks and uncertaintiesare detailed below. You should carefully consider therisk factors detailed below in conjunction with theother information contained in this document. Shouldany of these risks actually materialize, our business,financial condition, and future prospects could benegatively impacted.
Demand for our services is affected by the economicclimate in the industries and markets we serve. Thedemand for our services, in particular our staffingservices, is highly dependent upon the state of economyand upon the staffing needs of our clients. Any negativevariation in the economic condition of the UnitedStates, United Kingdom or of any of the other foreigncountries in which we do business, may severely reducethe demand for our services and thereby significantlydecrease our revenues and profits.
Our market is highly competitive with low barriers toentry. Our industry is intensely competitive and highlyfragmented, and the barriers to entry are quite low.There are many competitors, and new ones are enteringthe market constantly. In addition, some of these com-petitors have greater resources than us. Competitionarises locally, regionally, nationally, internationally andin certain cases from remote locations, particularlyfrom offshore locations such as India and China.
Certain of our contracts are awarded on the basis ofcompetitive proposals, which can be periodically re-bidby the client. There can be no assurance that existingcontracts will be renewed on satisfactory terms or thatadditional or replacement contracts will be awarded tous. In addition, long-term contracts form a negligibleportion of our revenue. There can be no assurance wewill be able to retain clients or market share in thefuture. Nor can there be any assurance that we will, inlight of competitive pressures, be able to remain profitableor, if profitable, maintain our current profit margins.
Our business requires a qualified candidate pool,which we may not be able to recruit or maintain. Ourstaffing services consist of the placement of individualsseeking employment in specialized IT and professionalpositions. Some of these sectors are characterized by ashortage of qualified candidates. There can be noassurance that suitable candidates for employmentwill continue to be available or will continue to seekemployment through us. Candidates generally seektemporary or regular positions through multiple sources,including us and our competitors. Any shortage ofqualified candidates could materially adversely affect us.
Our business depends on key personnel, includingexecutive officers, local managers and field personnel.We are engaged in a services business. As such, oursuccess or failure is highly dependent upon the perfor-mance of our management personnel and employees,rather than upon technology or upon tangible assets(of which we have few). There can be no assurancethat we will be able to attract and retain the personnelthat are essential to our success.
15MPS Group

We have to comply with existing governmentregulation and are exposed to increased regulation ofthe workplace. Our business is subject to regulation orlicensing in many states and in certain foreign countries.There can be no assurance we will be able to continueto obtain all necessary licenses or approvals or that thecost of compliance will not prove to be material in thefuture. Any inability to comply with governmentregulation or licensing requirements, or increase in thecost of compliance, could materially adversely affectus. Additionally, our staffing services entail employingindividuals on a temporary basis and placing suchindividuals in clients’ workplaces. Increased governmentregulation of the workplace or of the employer-employeerelationship could materially adversely affect us.
We are exposed to claims and costs, liabilities andlitigation arising from the delivery of our services.Our recruiting services involve our referring candidatesto clients for potential employment, and our staffingservices entail employing or retaining individuals on atemporary basis and placing such individuals in clients’workplaces. Our recruiting services entail a risk ofliability to our clients and others, contractually andotherwise, arising from allegations of inadequatebackground checks, inadequate credentialing of ournursing and healthcare workers, and negligent referralof candidates to our clients. Our staffing services entaila risk of liability to our clients and others, contractuallyand otherwise, arising from various workplace events,often beyond our control, including allegations of errorsand omissions, injury to property or persons, ormisappropriation or theft of property or proprietaryinformation allegedly caused or contributed to by ourtemporary workers. Our staffing services also entail arisk of employment and co-employment liability, toeither or both our clients and our temporary workers,arising from allegations by our temporary workers ofdiscrimination, harassment, inadequate workplaceconditions, or entitlement to employee benefits or payfrom clients to which they are assigned. The Companymaintains insurance with respect to many of theaforementioned claims. While such claims have nothistorically had a material adverse effect upon theCompany, there can be no assurance that the Companywill continue to be able to obtain insurance at a costthat does not have a material adverse effect upon theCompany or that such claims (whether by reason ofthe Company not having insurance or by reason ofsuch claims being outside the scope of the Company’sinsurance) will not have a material adverse effect uponthe Company.
We have acquired, and may continue to acquire,companies, and these acquisitions could disrupt ourbusiness or adversely affect our earnings. We haveacquired several companies and may continue to acquire
companies in the future. Entering into an acquisitionentails many risks, any of which could harm ourbusiness, including failure to successfully integrate theacquired company with our existing business, alienationor impairment of relationships with substantialcustomers or key employees of the acquired businessor our existing business, and assumption of liabilitiesof the acquired business. Any acquisition that weconsummate also may have an adverse affect on ourliquidity or earnings and may be dilutive to our earnings.Adverse business conditions or developments sufferedby or associated with any business we acquire additionallycould result in impairment to the goodwill or intangibleassets associated with the acquired business, and arelated write down of the value of these assets, andadversely affect our earnings.
The price of our common stock may fluctuatesignificantly. The market price for our common stockcan fluctuate as a result of a variety of factors, includingthe factors listed above, many of which are beyond ourcontrol. These factors include: actual or anticipatedvariations in quarterly operating results; announcementsof new services by our competitors or us; announce-ments relating to strategic relationships or acquisitions;changes in financial estimates or other statements bysecurities analysts; and other changes in generaleconomic conditions. Because of this, we may fail tomeet or exceed the expectations of our shareholders orof our securities analysts, and the market price for ourcommon stock could fluctuate as a result.
UN R E S OLV E D STA F F CO M M E N TS
There are no unresolved comments from the Staff ofthe Securities and Exchange Commission concerningour periodic or current reports under the SecuritiesExchange Act of 1934.
PR OPE RT I E S
Our corporate headquarters, located in Jacksonville,Florida, is on lease through 2012. Our business servicesare conducted through more than 190 offices locatedin the United States, Canada, the United Kingdom,and continental Europe. Almost all of our offices areon lease, with the terms of an average office leasebeing from three to six years.
We believe our facilities are generally adequate for ourneeds and do not anticipate difficulty replacing suchfacilities or locating additional facilities, if needed.Additional information on lease commitments can befound in Footnote 6 to the Consolidated FinancialStatements.
16 MPS Group
LE G A L PR O C E E D I N G S
We are a party to a number of lawsuits and claimsarising out of the ordinary conduct of our business. Inthe opinion of management, based on the advice ofin-house and external legal counsel, the lawsuits andclaims pending are not likely to have a material adverseeffect on us, our financial position, our results ofoperations, or our cash flows.
SU B M I S S IO N OF M AT T E R S TO AVOT E OF SE C U R I T Y HOL D E R S
No matters were submitted to a vote of securityholders during the fourth quarter of 2005.
17MPS Group
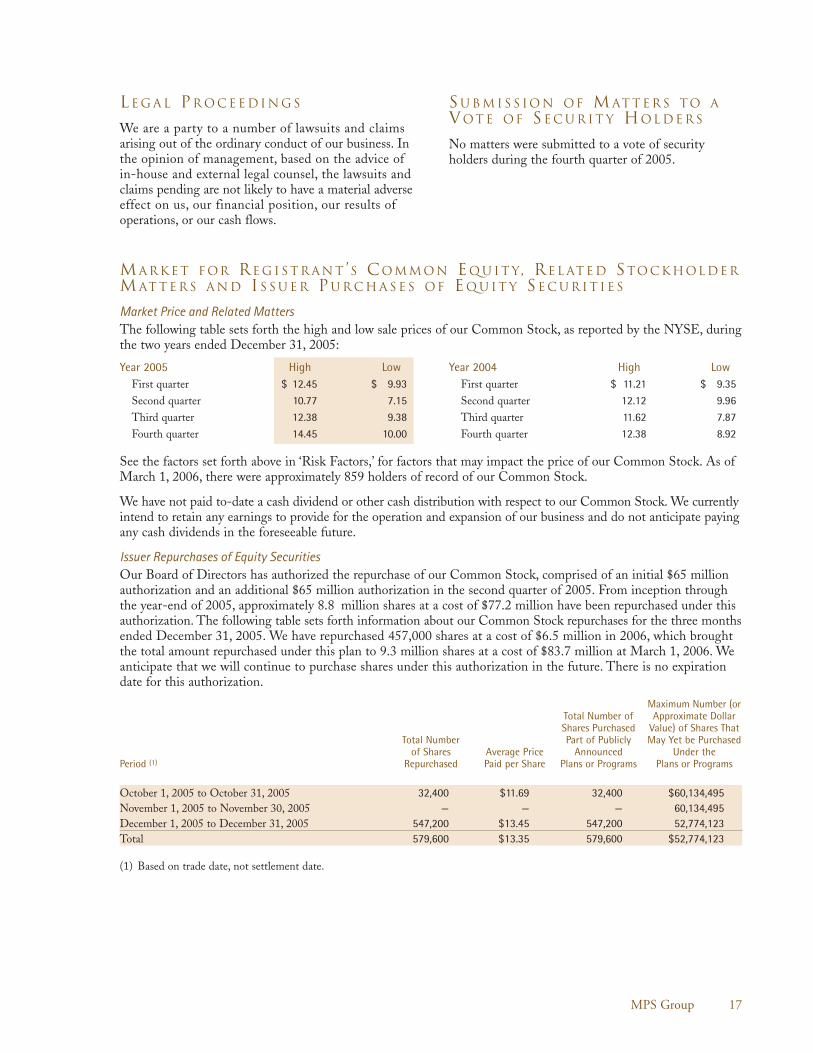
MA R K E T F OR RE G I S T R A N T ’S COM M ON EQ U I T Y, RE L AT E D STO C K HOL DE RM AT T E R S A N D IS S U E R PU R C H A S E S OF EQ U I T Y SE C U R I T I E S
Market Price and Related Matters The following table sets forth the high and low sale prices of our Common Stock, as reported by the NYSE, duringthe two years ended December 31, 2005:
See the factors set forth above in ‘Risk Factors,’ for factors that may impact the price of our Common Stock. As ofMarch 1, 2006, there were approximately 859 holders of record of our Common Stock.
We have not paid to-date a cash dividend or other cash distribution with respect to our Common Stock. We currentlyintend to retain any earnings to provide for the operation and expansion of our business and do not anticipate payingany cash dividends in the foreseeable future.
Issuer Repurchases of Equity Securities Our Board of Directors has authorized the repurchase of our Common Stock, comprised of an initial $65 millionauthorization and an additional $65 million authorization in the second quarter of 2005. From inception throughthe year-end of 2005, approximately 8.8 million shares at a cost of $77.2 million have been repurchased under thisauthorization. The following table sets forth information about our Common Stock repurchases for the three monthsended December 31, 2005. We have repurchased 457,000 shares at a cost of $6.5 million in 2006, which broughtthe total amount repurchased under this plan to 9.3 million shares at a cost of $83.7 million at March 1, 2006. Weanticipate that we will continue to purchase shares under this authorization in the future. There is no expirationdate for this authorization.
Maximum Number (orTotal Number of Approximate DollarShares Purchased Value) of Shares That
Total Number Part of Publicly May Yet be Purchasedof Shares Average Price Announced Under the
Period (1) Repurchased Paid per Share Plans or Programs Plans or Programs
October 1, 2005 to October 31, 2005 32,400 $11.69 32,400 $60,134,495November 1, 2005 to November 30, 2005 — — — 60,134,495December 1, 2005 to December 31, 2005 547,200 $13.45 547,200 52,774,123Total 579,600 $13.35 579,600 $52,774,123
(1) Based on trade date, not settlement date.
Year 2005 High LowFirst quarter $ 12.45 $ 9.93
Second quarter 10.77 7.15
Third quarter 12.38 9.38
Fourth quarter 14.45 10.00
Year 2004 High LowFirst quarter $ 11.21 $ 9.35
Second quarter 12.12 9.96
Third quarter 11.62 7.87
Fourth quarter 12.38 8.92

SE L E C T E D FI N A N C I A L DATA(in thousands, except per share amounts)
Years Ended 12-31-2005 12-31-2004 12-31-2003 12-31-2002 12-31-2001
Consolidated Statements of Operations data:Revenue $ 1,684,699 $ 1,426,842 $ 1,096,030 $ 1,119,156 $ 1,500,615Cost of revenue 1,242,331 1,066,055 808,890 834,318 1,105,781Gross profit 442,368 360,787 287,140 284,838 394,834Operating expenses 355,382 309,551 251,623 255,929 342,918Amortization of goodwill (1) — — — — 37,312Impairment of investment — — — 16,165 —Exit costs (recapture) — ( 897 ) ( 284 ) 8,967 —Operating income 86,986 52,133 35,801 3,777 14,604Other income (expense), net 3,799 1,437 553 ( 3,947 ) ( 9,199 )Income (loss) from continuing operations
before income taxes and cumulativeeffect of accounting change 90,785 53,570 36,354 ( 170 ) 5,405
Provision for income taxes 31,188 18,150 14,519 13,832 3,102Income (loss) from continuing
operations before cumulativeeffect of accounting change 59,597 35,420 21,835 ( 14,002 ) 2,303
Discontinued operations: (2)
Income (loss) from discontinuedoperations, net of tax — — ( 2,395 ) 1,410 6,040
Loss on sale of discontinuedoperations, net of tax — — ( 20,675 ) — —
Income (loss) before cumulativeeffect of accounting change 59,597 35,420 ( 1,235 ) ( 12,592 ) 8,343
Cumulative effect of accountingchange, net of tax (1) — — — ( 553,712 ) —
Net income (loss) $ 59,597 $ 35,420 $ ( 1,235 ) $ ( 566,304 ) $ 8,343
Basic income (loss) per common share:From continuing operations $ 0.59 $ 0.34 $ 0.21 $ ( 0.14 ) $ 0.02From discontinued operations $ — $ — $ ( 0.02 ) $ 0.01 $ 0.06From sale of discontinued operations $ — $ — $ ( 0.20 ) $ — $ —From accounting change $ — $ — $ — $ ( 5.49 ) $ —
Basic income (loss) per common share $ 0.59 $ 0.34 $ ( 0.01 ) $ (5.62 ) $ 0.09
Diluted income (loss) per common share:From continuing operations $ 0.56 $ 0.33 $ 0.21 $ (0.14 ) $ 0.02From discontinued operations $ — $ — $ (0.02 ) $ 0.01 $ 0.06From sale of discontinued operations $ — $ — $ (0.20 ) $ — $ —From accounting change $ — $ — $ — $ (5.49 ) $ —
Diluted income (loss) per common share $ 0.56 $ 0.33 $ (0.01 ) $ (5.62 ) $ 0.08
Basic average common shares outstanding 101,719 102,804 101,680 100,833 97,868
Diluted average common shares outstanding 105,832 106,842 104,518 100,833 98,178
18 MPS Group

December 31, 2005 2004 2003 2002 2001(in thousands)
Consolidated Balance Sheet data:Working capital $ 279,859 $ 232,133 $ 216,879 $ 171,154 $ 200,887Total assets 1,028,006 954,604 893,151 892,974 1,533,863Long term debt — — — — 101,000Stockholders’ equity (1) 876,040 835,663 793,462 781,559 1,310,811
(1) The Company recognized an impairment loss associated with its adoption of Statement of Financial Accounting Standards (SFAS)No. 142 “Goodwill and Other Intangible Assets,” effective January 1, 2002. This loss was recorded as a Cumulative Effect of AccountingChange, and reduced Stockholders’ Equity. In addition, SFAS No. 142 discontinued the periodic amortization of goodwill.
(2) The income (loss) from discontinued operations for the periods presented above and the 2003 loss on sale related to the discontinuedoutplacement unit, sold in December 2003.
19MPS Group
MA N A G E M E N T ’S DI S C U S S ION A N DANALYSIS OF FINANCIAL CONDITIONA N D RE S U LTS OF OPE R AT IO N S
MPS Group, Inc. is a leading provider of businessservices with over 190 offices throughout the UnitedStates, Canada, the United Kingdom, and continentalEurope. The Company delivers specialty staffing,consulting and business solutions to virtually allindustries in the following disciplines and through thefollowing primary brands:
Brand(s) DisciplineModis® Information Technology (IT)
ServicesBadenoch & Clark®, Accounting and FinanceAccounting Principals®Entegee® EngineeringSpecial Counsel® LegalIdea Integration® IT SolutionsSoliant Health® Health CareBeeline® Work Force Automation
The Company presents the financial results of theabove brands under its four reporting segments: NorthAmerican Professional services, European Professionalservices, North American IT services and EuropeanIT services.
Non-GAAP Financial Measures From time to time we may measure certain financialinformation on a ‘constant currency’ basis. Such constantcurrency financial data is not a U.S. generally acceptedaccounting principles (‘GAAP’) financial measure.Constant currency removes from financial data theimpact of changes in exchange rates between the U.S.dollar and the functional currencies of our foreignsubsidiaries, by translating the current period financialdata into U.S. dollars using the same foreign currency
exchange rates that were used to translate the financialdata for the previous period. We believe presentingcertain results on a constant currency basis is useful toinvestors because it allows a more meaningful comparisonof the performance of our foreign operations fromperiod to period. Additionally, certain internal reportingand compensation targets are based on constant currencyfinancial data for our various foreign subsidiaries.However, constant currency measures should not beconsidered in isolation or as an alternative to financialmeasures that reflect current period exchange rates, orto other financial measures calculated and presentedin accordance with GAAP.
From 2003 to 2005, we acquired eleven businesses forour North American professional services segment:four legal staffing businesses acquired in February of2003, August of 2003, August of 2004, and Octoberof 2004; three health care staffing businesses acquiredin February of 2004, March of 2004, and Septemberof 2005; and four accounting and finance staffingbusinesses acquired in February of 2004, July of 2004,October of 2004, and September of 2005. In addition,we acquired two IT solutions businesses, in July andSeptember of 2005, in our North American IT Servicessegment. The accounting and finance staffing businessand the IT solutions business acquired in Septemberof 2005 were part of the same acquisition. From timeto time we may measure certain financial informationexcluding the effect of acquisitions. Such financialdata that excludes the effect of businesses we acquire isnot a GAAP financial measure. We believe presentingsome results excluding the effects of businesses weacquire is helpful to investors because it permits acomparison of the performance of our core internaloperations from period to period. Additionally, certaininternal reporting and compensation targets are basedon the performance of core internal operations. Theeffect of a business we acquire is generally excludedfor only the first 12 months following the acquisition

date. Subsequent to this, a business is considered to beintegrated for reporting purposes. Again however, suchmeasures should be considered only in conjunctionwith the correlative measures that include the resultsfrom acquisitions, as calculated and presented inaccordance with GAAP.
Additionally, from time to time we may use EBITDAto measure results of operations. EBITDA is a non-GAAP financial measure that is defined as earningsbefore interest, taxes, depreciation and amortization.We believe EBITDA is a meaningful measure ofoperating performance as it gives management a consis-tent measurement tool for evaluating the operatingactivities of the business as a whole, as well as, thevarious operating units, before the effect of investingactivities, interest and taxes. In addition, we believeEBITDA provides useful information to investors,analysts, lenders, and other interested parties becauseit excludes transactions that management considersunrelated to core business operations, thereby helpinginterested parties to more meaningfully evaluate, trendand analyze the operating performance of our business.We also use EBITDA for certain internal reportingpurposes, and certain compensation targets may bebased on EBITDA. Finally, certain covenants in ourdebt facility are based on EBITDA performancemeasures. EBITDA, as with all non-GAAP financialmeasures, should be considered only in conjunction withthe comparable measures, as calculated and presentedin accordance with GAAP, including net income.
Discontinued Operations In December 2003, we sold certain operating assets andtransferred certain operating liabilities of our outplace-ment unit. As a result of the sale of this unit and inaccordance with GAAP, the Consolidated FinancialStatements and Management’s Discussion and Analysisof Financial Condition and Results of Operationsreport the results of operations of our outplacementunit as Discontinued Operations for all periodspresented. In 2003, this unit generated $21.0 millionin revenue and had a $3.7 million loss before incometaxes. We recorded contract termination costs of$705,000 in 2003 as a result of the sale. Additionalinformation can be found in Footnote 2 to theConsolidated Financial Statements.
Critical Accounting Policies We prepare our financial statements in conformitywith accounting principles generally accepted in theUnited States of America. Associated with this, webelieve the following are our most critical accountingpolicies in that they are the most important to theportrayal of our financial condition and results andrequire management’s most difficult, subjective orcomplex judgments.
Revenue Recognition We recognize substantially all revenue at the timeservices are provided, and on a time and materials basis.In most cases, the consultant is our employee and allcosts of employing the worker are our responsibilityand are included in cost of revenue. Revenuesgenerated when we permanently place an individualwith a client are recorded at the time of start.
In addition and to a lesser extent, we are involved infixed price or lump-sum engagements. The services werender under the relevant contracts generally requireperformance spanning more than one accountingperiod. We recognize revenue for these engagementsunder the proportional performance accounting model.
Allowance for Doubtful Accounts We regularly monitor and assess our risk of not collectingamounts we are owed by our customers. This evaluationis based upon a variety of factors including: an analysisof amounts current and past due along with relevanthistory and facts particular to the customer. Based uponthe results of this analysis, we record an allowance foruncollectible accounts for this risk. This analysis requiresus to make significant estimates, and changes in factsand circumstances could result in material changes inthe allowance for doubtful accounts.
Income Taxes The provision for income taxes is based on incomebefore taxes as reported in the Consolidated Statementsof Operations. Deferred tax assets and liabilities arerecognized for the expected future tax consequences ofevents that have been included in the financial state-ments or tax returns. Under this method, deferred taxassets and liabilities are determined based on thedifferences between the financial statement carryingamounts and the tax basis of assets and liabilitiesusing enacted tax rates in effect for the year in whichthe differences are expected to reverse. An assessmentis made as to whether or not a valuation allowance isrequired to offset deferred tax assets. This assessmentincludes anticipating future income.
Significant management judgment is required indetermining the provision for income taxes, deferredtax assets and liabilities and any valuation allowancerecorded against our deferred tax assets. Managementevaluates all available evidence to determine whetherit is more likely than not that some portion or all ofthe deferred income tax assets will not be realized. Theestablishment and amount of a valuation allowancerequires significant estimates and judgment and canmaterially affect our results of operations. Our effectivetax rate may vary from period to period based, forexample, on changes in estimated taxable income orloss, changes to the valuation allowance, changes to
20 MPS Group
federal, state or foreign tax laws, completion of federal,state or foreign audits, deductibility of certain costs andexpenses by jurisdiction, and as a result of acquisitions.
We have future tax deductions associated with tax-deductible goodwill. Our tax basis in tax-deductiblegoodwill will be deducted in our income tax returns,generating $338.9 million of future tax deductions overthe next 15 years. In addition, we have a net deferredtax asset as of December 31, 2005 and 2004. Thecomponents of our net deferred tax assets as well asother information on income taxes can be found inFootnote 7 to the Consolidated Financial Statements.
Stock Option Plans We have historically issued stock options to employeesand directors as an integral part of our compensationprograms. U.S. GAAP allowed alternative methods ofaccounting for these plans. We have chosen to accountfor our stock option plans under Accounting PrinciplesBoard Opinion No. 25, Accounting for Stock Issued toEmployees (“APB 25”). Under APB 25, the intrinsicvalue of the options is used to record compensationexpense and, as a result, no compensation expenserelated to stock options is included in determining netincome and net income per share in the ConsolidatedFinancial Statements. Restricted stock grants areaccounted for in accordance with APB 25, whichmandates that restricted stock grants with performanceconditions be calculated using the intrinsic value. Asrequired by SFAS No. 148, Accounting for Stock-BasedCompensation—Transition and Disclosure (“SFAS 148”),calculations of pro forma net income (loss) and netincome (loss) per share, computed in accordance withthe method prescribed by SFAS No. 123, Accounting forStock-Based Compensation (“SFAS 123”), are set forth inFootnote 2 to the Consolidated Financial Statements.
We are required to adopt SFAS No. 123 (revised 2004),Share-Based Payment (“SFAS 123R”) beginning withthe first quarter of 2006. SFAS 123R requires allshare-based payments to employees, including grantsof employee stock options, to be recognized in thefinancial statements based on their fair values. The proforma disclosures previously permitted under SFASNo. 123 no longer will be an alternative to financialstatement recognition. Upon adoption of SFAS 123R,we will be required to recognize compensation on allshare-based grants made on or after January 1, 2006,and for the unvested portion of share-based grantsmade prior to January 1, 2006.
Impairment of Tangible and Intangible Assets For acquisitions, we allocate the excess of cost overthe fair market value of the net tangible assets first toidentifiable intangible assets, if any, and then togoodwill. In connection with SFAS No. 142, Goodwilland Other Intangible Assets, we are required to performgoodwill impairment reviews, at least annually, utilizinga fair-value approach.
We performed valuation testing during the fourthquarters of 2003, 2004 and 2005 (our designatedtiming of the annual impairment test under SFASNo. 142) and did not incur any impairment. We plan toperform our next annual impairment review during thefourth quarter of 2006. An impairment review prior toour next scheduled annual review may be required ifcertain events occur, including lower than forecastedearnings levels for various reporting units. In addition,changes to other assumptions could significantly impactour estimate of the fair value of our reporting units.Such a change may result in a goodwill impairmentcharge, which could have a significant impact on thereportable segments that include the related reportingunits and the Consolidated Financial Statements.
We used an equally blended value of a discounted cashflow analysis and market comparables to arrive at fairvalue for SFAS No. 142. For the discounted cash flowanalysis, significant assumptions included expectedfuture revenue growth rates, reporting unit profitmargins, working capital levels and a discount rate.The revenue growth rates and reporting unit profitmargins are based, in part, on its expectation of animproving economic environment. Market comparablesincluded a comparison of the market ratios and per-formance fundamentals from comparable companies.The use of these measurement criteria is consistentwith the underlying concepts used in determining thefair value of a company or reportable unit under themarket approach. The market ratios we used refer tothe multiples of revenue and earnings of comparablecompanies and the performance fundamentals refer tothe consideration of the effects of the differences in theoperating metrics, ie. growth rates, operating margins,gross margins, etc. on our value versus the comparablecompanies. Additional information on Goodwill canbe found in Footnote 5 to the Consolidated FinancialStatements.
We amortize the cost of identifiable intangible assets(either through acquisition or as part of intellectualproperty) over their estimated useful lives unless suchlives are deemed indefinite. We review our long-livedassets and identifiable intangibles for impairmentwhenever events or changes in circumstances indicatethat the carrying amount of the asset may not berecoverable. In performing the review for recoverability,
21MPS Group

we estimate the future cash flows expected to resultfrom the use of the asset and its eventual disposition.If the sum of the expected future cash flows (undis-counted and without interest charges) is less than thecarrying amount of the asset, an impairment loss isrecognized. Otherwise, an impairment loss is notrecognized. Measurement of an impairment loss forlong-lived assets and identifiable intangibles would bebased on the fair value of the asset.
E X E C U T I V E SUM M A RY
We believe that economic conditions strengthenedduring 2004 and 2005, both in the United States andabroad, which had a favorable impact on both MPSand our industry. For 2004 and 2005, we were able togrow revenue in all of our segments. In addition to theimproved macroeconomic conditions, we believe thisrevenue growth is attributable to recent investments wehave made in our business including investments inadditional sales and recruiting staff, acquisitions, newservice offerings, and new office openings. Specificallyin 2004 and 2005, we acquired nine businesses for ourNorth American Professional Services segment(together, the ‘Professional Acquisitions’): two legalstaffing businesses acquired in August and October of2004; three health care staffing businesses acquired inFebruary of 2004, March of 2004, and September of2005; and four accounting and finance staffingbusinesses acquired in February of 2004, July of 2004,October of 2004, and September of 2005. In addition,we acquired two IT services solutions businesses forour North American IT segment (together, the ‘ITAcquisitions’), in July and September of 2005. Whilewe continue to believe we will experience future revenuegrowth, we expect our revenue to continue to beimpacted by general macroeconomic conditions in 2006.
Our consolidated revenue increased 18.1% and ouroperating income increased 67.0% from 2004. Directhire fees increased 44% from 2004, and now represent4.0% of revenue, up from 3.3% in 2004. In addition,we continued to diversify, with revenue from ourProfessional Services division now representing 54% ofconsolidated revenue in 2005 compared to 50% in 2004.For 2006, we will continue to look for opportunities toincrease gross margin along with increasing operatingleverage within each segment. Specifically, within theEuropean IT services segment, our lowest gross marginsegment, we are realizing the positive margin impactfrom scaling back relationships with certain low-margin,high-volume clients in order to focus on higher-marginclients. In addition, we have a foundation for growthwith $143 million of cash on hand at year-end, a $150million credit facility with no outstanding borrowings,no long-term debt, and working capital of $280 million.
The following detailed analysis of operations shouldbe read in conjunction with the 2005 ConsolidatedFinancial Statements and related footnotes includedelsewhere in this Annual Report.
Results of Operations for the Three Years EndedDecember 31, 2005 Consolidated revenue was $1,684.7 million, $1,426.8million, and $1,096.0 million in 2005, 2004 and 2003,respectively, increasing by 18.1% and 30.2% in 2005and 2004, respectively.
Consolidated gross profit was $442.4 million, $360.8million, and $287.1 million in 2005, 2004 and 2003,respectively, increasing by 22.6% and by 25.7% in 2005and 2004, respectively. The consolidated gross marginwas 26.3%, 25.3% and 26.2% in 2005, 2004 and 2003,respectively.
Consolidated operating expenses were $355.4 million,$308.7 million, and $251.3 million, in 2005, 2004 and2003, respectively, increasing by 15.1% and 22.8% in2005 and 2004, respectively. General and administrative(G&A) expenses, which are included in operatingexpenses, were $340.1 million, $293.8 million, and$234.6 million, in 2005, 2004 and 2003, respectively,increasing by 15.8% and 25.2% in 2005 and 2004,respectively.
Consolidated operating income was $87.0 million,$52.1 million, and $35.8 million in 2005, 2004 and2003, respectively, increasing by 67.0% and 45.5% in2005 and 2004, respectively. Operating income as apercentage of revenue was 5.2%, 3.7% and 3.3% in2005, 2004 and 2003, respectively.
SE G M E N TS
Professional Services division North American Professional Services segment Revenue in our North American Professional servicessegment was $537.3 million, $429.6 million, and$315.8 million, for 2005, 2004 and 2003, respectively,increasing by 25.1% and by 36.0% in 2005 and 2004,respectively. Professional Acquisitions contributed$47.5 million, $60.6 million, and $19.6 million inrevenue in 2005, 2004 and 2003, respectively. Thefollowing contributed to the increase in revenue forboth 2005 and 2004: we executed on our acquisitionstrategy; we made considerable investments in sales andrecruiting staff; and we introduced additional serviceofferings. We completed nine acquisitions from 2003to 2005, and between these acquisitions and internalstaff investments, we increased our staff headcount by51% from 2003. The internal staff investments were inanticipation of increased demand and were coupled with
22 MPS Group

the added service offerings to our Special Counsel,Accounting Principals, and Soliant Health businessesin 2004.
Revenue contribution in the North AmericanProfessional services specialties for 2005, 2004 and2003 was as follows:
2005 2004 2003 Entegee 45.7% 49.6% 56.9%Special Counsel 24.1 24.5 24.8Accounting Principals 17.6 13.3 9.6Soliant Health 12.6 11.7 6.2Other 0.0 0.9 2.5
Gross profit in our North American Professional servicessegment was $160.4 million, $123.8 million, and$89.1 million, for 2005, 2004 and 2003, respectively,increasing by 29.6% and by 38.9% in 2005 and 2004,respectively. Professional Acquisitions contributed$17.0 million, $19.7 million, and $6.1 million in grossprofit in 2005, 2004 and 2003, respectively. Gross marginin our North American Professional services segmentwas 29.9%, 28.8% and 28.2% in 2005, 2004 and 2003,respectively. The increase in gross margin in 2005 wasdue primarily to an increase in direct hire fees, and to alesser extent, improved gross margins from the segment’sstaffing services. The increase in gross margin in 2004was due primarily to an increase in direct hire fees.Direct hire fees, which generate higher margin, increasedto 5.6% of the segment’s revenue in 2005, from 4.5%and 3.6% in 2004 and 2003, respectively.
G&A expenses in our North American Professionalservices segment were $110.8 million, $88.4 million, and$69.3 million, in 2005, 2004 and 2003, respectively,increasing by 25.3% and by 27.6% in 2005 and 2004,respectively. As a percentage of revenue, G&A expenseswere 20.6% for 2005 and 2004, and 21.9% for 2003.The increase in G&A expenses for both 2005 and 2004was due primarily to the increase in compensationexpense related to the increases in the segment’srevenue, our investment in additional sales andrecruiting personnel, and additional G&A fromProfessional Acquisitions.
Operating income was $44.5 million, $30.9 million, and$16.0 million in 2005, 2004 and 2003, respectively,increasing by 44.0% and by 93.1% in 2005 and 2004,respectively. Operating income as a percentage ofrevenue was 8.3%, 7.2% and 5.1% in 2005, 2004 and2003, respectively.
European Professional Services segment Revenue in our European Professional services segmentwas $364.8 million, $289.1 million, and $198.3 million,for 2005, 2004 and 2003, respectively, increasing by26.2% and by 45.8% in 2005 and 2004, respectively.Changes in foreign currency exchange rates reducedrevenue by $2.7 million from 2004 to 2005, andcontributed $31.2 million in revenue from 2003 to 2004.The increase in revenue for both 2005 and 2004 wasdue to both an overall improvement of the economicenvironment and our investment in sales and recruitingpersonnel across our service lines. Specifically, weincreased our staff headcount by 30% from 2003 inanticipation of increased demand.
Gross profit in our European Professional servicessegment was $104.3 million, $80.4 million, and $58.2million, in 2005, 2004 and 2003, respectively, increasingby 29.7% and by 38.1% in 2005 and 2004, respectively.Changes in foreign currency exchange rates reducedgross profit $770,000 from 2004 to 2005, and con-tributed $8.7 million from 2003 to 2004. Gross marginin our European Professional services segment was28.6%, 27.8%, and 29.4% in 2005, 2004 and 2003,respectively. The increase in gross margin in 2005 wasdue to a combination of improved gross margins fromthe segment’s staffing services as we were better able tomanage the bill and pay rate spread, and an increase indirect hires. Direct hire fees increased to 7.6% of thesegment’s revenue in 2005, from 7.3% in 2004. Thedecrease in gross margin in 2004 was due to a shift inthe mix of services provided by this segment along withthe increased competition for candidates. We were ableto increase our bill rates in 2004 from our 2003 levels.However, the increased competition for candidates ledto a greater increase in pay rates, and therefore adecrease in the bill and pay rate spread in 2004.
G&A expenses in our European Professional servicessegment were $76.3 million, $65.6 million, and$44.6 million, in 2005, 2004 and 2003, respectively,increasing by 16.3% and by 47.1% in 2005 and 2004,respectively. As a percentage of revenue, G&A expenseswere 20.9%, 22.7%, and 22.5%, for 2005, 2004 and2003, respectively. The increase in G&A expenses forboth 2005 and 2004 was due primarily to the increasein compensation expense related to the increases in thesegment’s revenue, and our investment in additionalsales and recruiting personnel. In addition, the increasein G&A expenses in 2004 was due to the effect ofchanges in foreign currency exchange rates.
Operating income was $26.1 million, $13.2 million, and$12.5 million in 2005, 2004 and 2003, respectively,increasing by 97.7% and 5.6% in 2005 and 2004,respectively. Operating income as a percentage ofrevenue was 7.2%, 4.6% and 6.3% in 2005, 2004 and2003, respectively.
23MPS Group

IT Services division North American IT Services segment Revenue in our North American IT services segmentwas $510.5 million, $459.5 million, and $401.2 million,for 2005, 2004 and 2003, respectively, increasing by11.1% and 14.5% in 2005 and 2004, respectively. ITAcquisitions contributed $4.8 million in revenue in2005. The increase in revenue in both 2005 and 2004was due to a combination of increased spending on ITinitiatives by our clients and our investment in salesand recruiting staff. Between internal staff investmentsand our two acquisitions, we increased our staffheadcount by 26% from 2003.
Revenue from this segment in 2003 was adverselyimpacted by the diminished demand for IT-relatedservices. Specifically, our customers in 2003 continuedto experience a constrained ability to spend on ITinitiatives due to uncertainties relating to the economy.
Revenue within the North American IT services segmentis generated primarily from Modis, as it generated85.4%, 82.8% and 81.5% of the segment’s revenue for2005, 2004 and 2003, respectively. Idea Integrationand Beeline are responsible for the remainder of thissegment’s revenue.
Gross profit in our North American IT services segmentwas $142.2 million, $123.8 million, and $112.8 million,in 2005, 2004 and 2003, respectively, increasing by14.9% and 9.8% in 2005 and 2004, respectively. ITAcquisitions contributed $1.4 million in gross profit in2005. Gross margin in our North American IT servicessegment was 27.9%, 26.9%, and 28.1% in 2005, 2004and 2003, respectively.
The increase in gross margin in 2005 was due to acombination of the following: improved gross marginsfrom Modis’ staffing services as we were better able tomanage the bill and pay rate spread; an increase in ourrevenue from middle market clients; an increase indirect hires; and higher utilization of Idea Integration’ssalaried consultants. Direct hire fees increased to 1.1%of the segment’s revenue in 2005, from 0.6% in 2004.The decrease in gross margin in 2004 was due primarilyto lower utilization of Idea Integration’s salaried con-sultants and to Modis’ increased presence on nationalvendor lists. Revenue from clients with national vendorlists tends to generate a lower gross margin due to theseclients’ buying power. Modis was able to stabilize grossmargin in the second half of 2004 and into 2005 byincreasing our proportion of revenue from middle marketclients, which tend to generate a higher gross margin.
G&A expenses in our North American IT servicessegment were $98.1 million, $87.2 million, and $78.7million, in 2005, 2004 and 2003, respectively, increasingby 12.5% and 10.8% in 2005 and 2004, respectively.
As a percentage of revenue, G&A expenses were19.2%, 19.0%, and 19.6%, for 2005, 2004 and 2003,respectively. The increase in G&A expenses for both2005 and 2004, was due primarily to the increase incompensation expense related to this segment’s increasesin revenue, and our investment in additional sales andrecruiting personnel.
Operating income was $37.3 million, $28.0 million, and$23.2 million in 2005, 2004 and 2003, respectively,increasing by 33.2% in 2005 and by 20.7% in 2004.Operating income as a percentage of revenue was 7.3%,6.1% and 5.8% in 2005, 2004 and 2003, respectively.
European IT Services segment Revenue in our European IT services segment was$272.2 million, $248.8 million, and $180.7 million, for2005, 2004 and 2003, respectively, increasing by 9.4%and 37.7% in 2005 and 2004, respectively. Changes inforeign currency exchange rates reduced revenue by$2.0 million from 2004 to 2005, and contributed $26.9million in revenue from 2003 to 2004. The increase inrevenue in 2005 and 2004 was due to increased spendingon IT initiatives by our UK market clients. Our revenuegrowth in 2005 was curtailed as we scaled backrelationships with certain low-margin, high-volumeclients. For 2006, we expect revenue growth to slow orpossibly decline compared to 2005, as we continue toconcentrate on higher-margin clients. While we expectthis to have a negative impact on revenue, we do notexpect it to have a material adverse impact on thissegment’s operating income.
Gross profit in our European IT services segment was$35.5 million, $32.8 million, $27.0 million, in 2005,2004 and 2003, respectively, increasing by 8.2% and21.5% in 2005 and 2004, respectively. Changes inforeign currency exchange rates reduced gross profitby $262,000 from 2004 to 2005, and contributed $3.5million in gross profit from 2003 to 2004. Gross marginin our European IT services segment was 13.0%, 13.2%,and 14.9% in 2005, 2004 and 2003, respectively. Thedecrease in gross margin in both 2005 and 2004 wasdue primarily to a higher proportion of the segment’sgrowth being in the UK market, compared to thecontinental European market, and to a lesser extent, ashift in the mix of services provided by the segment.Our gross margins from revenue generated in the UKmarket are generally lower than those in the continentalEuropean market. However, we are realizing thepositive margin impact from scaling back relationshipswith certain low-margin, high-volume clients in orderto focus on higher-margin clients.
G&A expenses in our European IT services segmentwere $29.5 million, $29.2 million, and $22.9 million,in 2005, 2004 and 2003, respectively, increasing by1.0% and 27.5% in 2005 and 2004, respectively. As a
24 MPS Group

25MPS Group
percentage of revenue, G&A expenses were 10.8%,11.7%, and 12.7%, for 2005, 2004 and 2003, respectively.The increase in G&A expenses in 2005 was dueprimarily to the increase in compensation expenserelated to the increases in the segment’s revenue. Theincrease in G&A expenses in 2004 was due to acombination of the increase in compensation expenserelated to the increases in the segment’s revenue, andthe effect of exchange rates.
Operating income was $4.5 million, $2.4 million, and$2.9 million in 2005, 2004 and 2003, respectively,increasing by 87.5% in 2005 and decreasing by 17.2%in 2004. Operating income as a percentage of revenuewas 1.7%, 1.0% and 1.6% in 2005, 2004 and 2003,respectively.
Corporate expenses and recaptures Included in consolidated operating expenses for 2004and 2003, was an $897,000 and a $284,000 recapture,respectively, for exit costs incurred in 2002. These exitcosts recaptures related to the settlement of certainabandoned office space. Changes to the local real estateeconomy where we have this abandoned real estate, andother factors originally unforeseen to us, allowed us theopportunity to either settle or find acceptable subleasingopportunities earlier than or for more than what weoriginally anticipated.
Unallocated corporate expenses pertain to certainfunctions, such as executive management, accounting,administration, tax, and treasury that are not attributableto our operating units. Unallocated corporate expensewas $25.4 million, $23.3 million and $19.1 million, in2005, 2004 and 2003, respectively, increasing 9.0% and22.0% in 2005 and 2004, respectively. As a percentageof revenue, unallocated corporate expense was 1.5%,1.6% and 1.7%, for 2005, 2004 and 2003, respectively.The increase in unallocated corporate expense in both2005 and 2004 was due primarily to a combination ofthe following: expenses related to the adoption of andcompliance with the internal control requirementsmandated by Section 404 of the Sarbanes-Oxley Actof 2002 and the standards of the Public CompanyAccounting Oversight Board; higher incentive executivecompensation based on the Company’s improvedfinancial performance; and an increase in non-cashcompensation expense from our use of restricted stock.
Consolidated other income, net, was $3.8 million,$1.4 million, and $553,000 in 2005, 2004 and 2003,respectively. Other income, net, primarily includesinterest income related to our investments and cash onhand, net of interest expense related to notes issued inconnection with acquisitions and fees and interest onour credit facility.
The consolidated income tax provision was $31.2million, $18.2 million, and $14.5 million in 2005, 2004and 2003, respectively. The effective tax rate was 34.4%,33.9%, and 39.9%, for 2005, 2004 and 2003, respectively.Included in the 2005 income tax provision was $3.3million of tax benefits due primarily to certain state taxbenefits and benefits associated with the settlement ofcertain state income tax audits. We were required torecord certain state tax benefits associated with valuationallowances recorded in prior years related to certainstate operating loss carryforwards. Included in the 2004income tax provision was a $1.3 million tax benefitassociated with the settlement of a state income tax audit.
Consolidated income from continuing operations was$59.6 million, $35.4 million and $21.8 million, in 2005,2004 and 2003, respectively. The exit costs recaptures in2003 and 2004, had 0.1% impact on operating incomeas a percentage of revenue in each of those years.
LIQUIDITY AND CAPITAL RESOURCES
Changes to our liquidity during 2005, 2004 and 2003are due primarily to the net effect of (i) funds generatedby operations and stock option exercises, and (ii) fundsused for acquisitions, repurchases of common stock andcapital expenditures. We expect this to continue for 2006.
In 2005, cash of $91.9 million provided from operatingactivities, exceeded the $55.4 million used in investingand financing activities, and the effect of exchange rates.Our net increase of cash in 2005 was due primarily to ahigher level of cash provided by operations and less cashspent on acquisitions. In 2004, cash of $71.3 millionused in both investing and financing activities exceededthe $53.0 million of cash provided from operatingactivities and the effect of exchange rates. In 2003, cashof $72.8 million provided from operating activities,financing activities, and the effect of exchange rates,exceeded the $14.9 million of cash used for investingactivities. The below table highlights working capitaland cash and cash equivalents as of December 31, 2005and 2004, respectively:(dollar amounts in millions)
December 31, 2005 2004
Working capital $ 279.9 $ 232.1Cash and cash equivalents 143.0 106.5
For 2005, 2004, and 2003, we generated $91.9 million,$50.7 million, and $65.4 million of cash flow fromoperations, respectively. The increase in cash flow fromoperations in 2005 was due primarily to our increasedlevel of income. The decrease in cash flow from oper-ations in 2004, was due primarily to the use of working

26 MPS Group
capital to support our revenue growth. This growthincreased the cash needed to fund accounts receivable,as we collect receivables within an average of 50 days,while primarily paying our employees on a weekly basis.
For 2005, we used $25.5 million of cash for investingactivities, including $17.7 million, net of cash acquired,used for the Professional Acquisitions and IT Acquisi-tions and $11.5 million used for capital expenditures,net of $3.7 million generated from the sale of certainassets within our North American IT Services segment.
For 2004, we used $57.3 million of cash for investingactivities, including $50.2 million, net of cash acquired,used for Professional Acquisitions and $9.6 millionused for capital expenditures. These uses were partiallyoffset by $2.4 million generated from the sale of certainassets of our executive search brand.
For 2003, we used $14.9 million of cash for investingactivities, including $15.9 million, net of cash acquired,used for acquisitions and $6.9 million used for capitalexpenditures, net of $7.9 million generated from thesale of the Company’s discontinued outplacement unit.
For 2005, we used $25.7 million of cash for financingactivities, primarily $37.3 million used for the repurchaseof common stock and $2.5 million used for repaymentson indebtedness, net of $14.7 million generated fromstock option exercises.
For 2004, we used $14.0 million of cash for financingactivities, primarily $30.9 million used for the repurchaseof common stock, net of $18.3 million generated fromstock option exercises.
For 2003, we generated $2.7 million of cash fromfinancing activities, primarily from $10.9 million ofstock option exercises, net of $7.6 million used for therepurchase of common stock.
Our Board of Directors has authorized the repurchase ofour Common Stock, comprised of an initial $65 millionauthorization and an additional $65 million authori-zation in the second quarter of 2005. We repurchased3.8 million shares at a cost of $37.3 million in 2005,which brought the total amount repurchased under thisplan to 8.8 million shares at a cost of $77.2 million atDecember 31, 2005. We have repurchased 457,000 sharesat a cost of $6.5 million in 2006, which brought thetotal amount repurchased under this plan to 9.3 millionshares at a cost of $83.7 million at March 1, 2006. Weanticipate that we will continue to purchase shares underthis authorization in the future. There is no expirationdate for this authorization.
We anticipate that capital expenditures for furniture andequipment, including improvements to our managementinformation and operating systems, during the nexttwelve months, will be approximately $10 to $15 million.
While there can be no assurance in this regard, webelieve that funds provided by operations, availableborrowings under the credit facility, and current amountsof cash will be sufficient to meet our presently antici-pated needs for working capital, capital expenditures,repurchases of common stock and acquisitions for atleast the next 12 months.
Indebtedness, Contractual Obligations, and Commercial Commitments of the Company The following are contractual cash obligations and other commercial commitments at December 31, 2005:(in thousands)
Payments Due by PeriodTotal Less than 1 Year 1–3 Years 4–5 Years After 5 Years
Contractual cash obligations
Operating leases $ 51,843 $ 13,085 $ 27,732 $ 7,629 $ 3,397Other 1,250 1,250 — — —Total contractual cash obligations $ 53,093 $ 14,335 $ 27,732 $ 7,629 $ 3,397
Amount of Commitment Expiration per PeriodTotal Less than 1 Year 1–3 Years 4–5 Years After 5 Years
Commercial Commitments
Standby letters of credit $ 7,064 $ 7,064 $ — $ — $ —Total commercial commitments $ 7,064 $ 7,064 $ — $ — $ —

27MPS Group
In 2003, the Company closed on a $150 millionrevolving credit facility syndicated to a group of leadingfinancial institutions. The credit facility contains certainfinancial and non-financial covenants relating to theCompany’s operations, including maintaining certainfinancial ratios. Repayment of the credit facility isguaranteed by substantially all of the subsidiaries ofthe Company. The facility expires in November 2006.At December 31, 2005 and March 1, 2006, there wereno borrowings outstanding under this facility, otherthan $7.1 million of standby letters of credit for certainoperational matters.
New Accounting Pronouncements In December 2004, the FASB issued SFAS 123R, whichreplaces SFAS No. 123 and supercedes APB OpinionNo. 25. SFAS 123R requires all share-based payments toemployees, including grants of employee stock options,to be recognized in the financial statements based ontheir fair values. The pro forma disclosures previouslypermitted under SFAS No. 123 no longer will be analternative to financial statement recognition. TheCompany is required to adopt SFAS 123R beginningwith the first quarter of 2006. Upon adoption, theCompany will be required to recognize compensation onall share-based grants made on or after January 1, 2006,and for the unvested portion of share-based grantsmade prior to January 1, 2006.
The Company has elected to apply the modifiedprospective transition method to all past awardsoutstanding and unvested as of the effective date ofJanuary 1, 2006, and will recognize the associatedexpense over the remaining vesting period based onthe fair values previously determined and disclosed aspart of its pro-forma disclosures. Thus, the Companywill not restate the results of prior periods. TheCompany expects the effects of applying the modifiedprospective transition method to outstanding andunvested awards as of the effective date to be immaterial.However, the Company is still evaluating the potentialimpact of subsequent awards. Subsequent awards mayhave a material impact on the Company’s ConsolidatedStatements of Operations.
In May 2005, the FASB issued SFAS No. 154,Accounting Changes and Error Corrections — aReplacement of APB Opinion No. 20 and FASBStatement No. 3 (“SFAS 154”). SFAS 154 requiresretrospective application to prior period financialstatements of changes in accounting principle, unless itis impracticable to determine either the period-specificeffects or the cumulative effect of the change. SFAS 154also redefines “restatement” as the revising of previouslyissued financial statements to reflect the correction ofan error. This statement is effective for accounting
changes and corrections of errors made in fiscal yearsbeginning after December 15, 2005. Management doesnot expect the adoption of SFAS 154 to have a materialeffect on the Company’s Consolidated Balance Sheetsor Statements of Operations.
QUA N T I TAT I V E A N D QUA L I TAT I V EDISCLOSURES ABOUT MARKET RISK
The following assessment of our market risks does notinclude uncertainties that are either nonfinancial ornonquantifiable, such as political, economic, tax andcredit risks.
Our exposure to market risk for changes in interest ratesrelates primarily to debt obligations under the creditfacility and to our investments. We have an investmentportfolio consisting of cash and cash equivalentsincluding deposits in banks, money market funds, andshort-term investments with maturities of 90 days orless. We are adverse to principal loss and seek to preserveour invested funds by placing these funds with highcredit quality issuers. We evaluate our invested fundsto respond appropriately to a reduction in the creditrating of any investment issuer or guarantor.
We are exposed to the impact of foreign currencyfluctuations. Changes in foreign currency exchangerates impact translations of foreign denominated assetsand liabilities into U.S. dollars and future earnings andcash flows from transactions denominated in differentcurrencies. Our international operations generatedapproximately 38% of 2005 consolidated revenue,approximately 97% of which was from the UnitedKingdom. As of December 31, 2005, we have notentered into any foreign currency derivative instruments.
Our international operations transact business in theirfunctional currency. As a result, fluctuations in thevalue of foreign currencies against the U.S. dollar havean impact on reported results. Revenues and expensesdenominated in foreign currencies are translated intoU.S. dollars at monthly average exchange ratesprevailing during the period. Consequently, as the valueof the U.S. dollar changes relative to the currencies ofour non-U.S. markets, our reported results vary.
Fluctuations in exchange rates impact the U.S. dollaramount of Stockholders’ Equity. The assets andliabilities of our non-U.S. subsidiaries are translatedinto U.S. dollars at the exchange rate in effect at theend of a reporting period. The resulting translationadjustments are recorded in Stockholders’ Equity, as acomponent of Accumulated Other ComprehensiveIncome, in our Consolidated Balance Sheets.

28 MPS Group
We are exposed to minimal price fluctuations on equitymutual funds that are contained within our company-owned life insurance. The cash surrender value of thecompany-owned life insurance was $9.3 million atDecember 31, 2005, and is included in ‘Other assets,net’ in the consolidated Balance Sheets. Changes to thecash surrender value are recognized in ‘Other income,net’ on our Consolidated Statements of Operations.This company-owned life insurance is intended to beused to settle our obligations of deferred compensation.Therefore, a corresponding employee liability isincluded in ‘Other’ in the Liabilities section of theConsolidated Balance Sheets.
FI N A N C I A L STAT E M E N TS A N DSU P P L E M E N TA RY DATA
Consolidated Financial Statements: The followingconsolidated financial statements are included in thisAnnual Report:
Report of Independent Registered CertifiedPublic Accounting Firm 29
Management’s Report on Internal Controlover Financial Reporting 31
Consolidated Balance Sheets at December 31,2005 and 2004 32
Consolidated Statements of Operations for theyears ended December 31, 2005, 2004 and 2003 33
Consolidated Statements of Stockholders’ Equityfor the years ended December 31, 2005, 2004and 2003 34
Consolidated Statements of Cash Flows for theyears ended December 31, 2005, 2004 and 2003 35
Notes to Consolidated Financial Statements 37
Schedule II—Valuation & Qualifying Accounts 51
Reconciliation of Non-GAAP FinancialMeasure to GAAP Financial Measure 51

29MPS Group
RE P ORT OF IN D E PE N D E N T RE G I S T E R E D CE RT I F I E D PU B L ICAC C O U N T I N G FI R M
To the Board of Directors and Stockholders of MPS Group, Inc.
We have completed integrated audits of MPS Group, Inc’s December 31, 2005 and 2004 consolidated financialstatements and of its internal control over financial reporting as of December 31, 2005, and an audit of itsDecember 31, 2003 consolidated financial statements in accordance with the standards of the Public CompanyAccounting Oversight Board (United States). Our opinions, based on our audits, are presented below.
Consolidated financial statements and financial statement schedule In our opinion, the consolidated financial statements listed in the accompanying index present fairly, in all materialrespects, the financial position of MPS Group, Inc and its subsidiaries at December 31, 2005 and 2004, and theresults of their operations and their cash flows for each of the three years in the period ended December 31, 2005in conformity with accounting principles generally accepted in the United States of America. In addition, in ouropinion, the financial statement schedule listed in the accompanying index present fairly, in all material respects, theinformation set forth therein when read in conjunction with the related consolidated financial statements. Thesefinancial statements and financial statement schedule are the responsibility of the Company’s management. Ourresponsibility is to express an opinion on these financial statements and financial statement schedule based on ouraudits. We conducted our audits of these statements in accordance with the standards of the Public CompanyAccounting Oversight Board (United States). Those standards require that we plan and perform the audit to obtainreasonable assurance about whether the financial statements are free of material misstatement. An audit of financialstatements includes examining, on a test basis, evidence supporting the amounts and disclosures in the financialstatements, assessing the accounting principles used and significant estimates made by management, and evaluatingthe overall financial statement presentation. We believe that our audits provide a reasonable basis for our opinion.
Internal control over financial reporting Also, in our opinion, management’s assessment, included in Management’s Report on Internal Control over FinancialReporting appearing under Item 9A, that the Company maintained effective internal control over financial reportingas of December 31, 2005 based on criteria established in Internal Control - Integrated Framework issued by theCommittee of Sponsoring Organizations of the Treadway Commission (COSO), is fairly stated, in all materialrespects, based on those criteria. Furthermore, in our opinion, the Company maintained, in all material respects,effective internal control over financial reporting as of December 31, 2005, based on criteria established in InternalControl - Integrated Framework issued by the COSO. The Company’s management is responsible for maintainingeffective internal control over financial reporting and for its assessment of the effectiveness of internal control overfinancial reporting. Our responsibility is to express opinions on management’s assessment and on the effectivenessof the Company’s internal control over financial reporting based on our audit. We conducted our audit of internalcontrol over financial reporting in accordance with the standards of the Public Company Accounting OversightBoard (United States). Those standards require that we plan and perform the audit to obtain reasonable assuranceabout whether effective internal control over financial reporting was maintained in all material respects. An audit ofinternal control over financial reporting includes obtaining an understanding of internal control over financialreporting, evaluating management’s assessment, testing and evaluating the design and operating effectiveness ofinternal control, and performing such other procedures as we consider necessary in the circumstances. We believethat our audit provides a reasonable basis for our opinions.

30 MPS Group
A company’s internal control over financial reporting is a process designed to provide reasonable assurance regardingthe reliability of financial reporting and the preparation of financial statements for external purposes in accordancewith generally accepted accounting principles. A company’s internal control over financial reporting includes thosepolicies and procedures that (i) pertain to the maintenance of records that, in reasonable detail, accurately and fairlyreflect the transactions and dispositions of the assets of the company; (ii) provide reasonable assurance that transactionsare recorded as necessary to permit preparation of financial statements in accordance with generally acceptedaccounting principles, and that receipts and expenditures of the company are being made only in accordance withauthorizations of management and directors of the company; and (iii) provide reasonable assurance regardingprevention or timely detection of unauthorized acquisition, use, or disposition of the company’s assets that couldhave a material effect on the financial statements.
Because of its inherent limitations, internal control over financial reporting may not prevent or detect misstatements.Also, projections of any evaluation of effectiveness to future periods are subject to the risk that controls may becomeinadequate because of changes in conditions, or that the degree of compliance with the policies or procedures maydeteriorate.
PricewaterhouseCoopers LLP
Jacksonville, Florida
March 14, 2006
31MPS Group
M A N A G E M E N T ’S RE P ORT O N IN T E R N A L CO N T R OL O V E R FI N A N C I A LRE P ORT I N G
Management of MPS Group, Inc. is responsible for establishing and maintaining adequate internal control over financialreporting, as such term is defined in Rules 13a-15(f ) and 15d-15(f ) under the Securities Exchange Act of 1934.
Because of its inherent limitations, internal control over financial reporting may not prevent or detect misstatements.Also, projections of any evaluation of effectiveness to future periods are subject to the risk that controls may becomeinadequate because of changes in conditions, or that the degree of compliance with the policies or procedures maydeteriorate.
Management assessed the effectiveness of the Company’s internal control over financial reporting as of December 31,2005. In making this assessment, management used the criteria set forth in Internal Control–Integrated Frameworkissued by the Committee of Sponsoring Organizations of the Treadway Commission.
Based on that assessment, management concluded that the Company’s internal control over financial reporting waseffective as of December 31, 2005.
Management’s assessment of the effectiveness of the Company’s internal control over financial reporting has beenaudited by PricewaterhouseCoopers LLP, an independent registered certified public accounting firm, as stated intheir report which is included herein.

32 MPS Group
MPS GR O U P, IN C . A N D SU B S I D I A R I E S
CO N S OL I D AT E D BA L A N C E SH E E TS(dollar amounts in thousands)
As of 12-31-2005 12-31-2004
AssetsCurrent assets:
Cash and cash equivalents $ 142,951 $ 106,497Accounts receivable, net of allowance of $11,872 and $9,836 244,506 209,512Prepaid expenses 7,131 6,405Deferred income taxes 5,749 836Other 16,091 15,532
Total current assets 416,428 338,782Furniture, equipment, and leasehold improvements, net 24,542 26,878Goodwill, net 545,363 529,292Deferred income taxes 27,277 48,518Other assets, net 14,396 11,134
Total assets $ 1,028,006 $ 954,604
Liabilities and Stockholders’ EquityCurrent liabilities:
Accounts payable and accrued expenses $ 65,869 $ 51,944Accrued payroll and related taxes 58,711 45,353Income taxes payable 11,989 9,352
Total current liabilities 136,569 106,649Other 15,397 12,292
Total liabilities 151,966 118,941Commitments and contingencies (Note 6 and 7)Stockholders’ equity:
Preferred stock, $.01 par value; 10,000,000 shares authorized; no shares issued — —Common stock, $.01 par value; 400,000,000 shares authorized;
111,169,227 and 108,434,541 shares issued, respectively 1,112 1,085Additional contributed capital 687,661 664,440Retained earnings 257,563 197,966Accumulated other comprehensive income 11,560 18,497Deferred stock compensation ( 4,630 ) ( 6,383 )Treasury stock, at cost (8,834,114 and 5,078,514 shares, respectively) ( 77,226 ) ( 39,942 )
Total stockholders’ equity 876,040 835,663Total liabilities and stockholders’ equity $ 1,028,006 $ 954,604
See accompanying notes to consolidated financial statements.

MPS GR O U P, IN C . A N D SU B S I D I A R I E S
CO N S OL I D AT E D STAT E M E N TS OF OPE R AT IO N S(dollar amounts in thousands except per share amounts)
Years Ended 12-31-2005 12-31-2004 12-31-2003
Revenue $ 1,684,699 $ 1,426,842 $ 1,096,030Cost of revenue 1,242,331 1,066,055 808,890
Gross profit 442,368 360,787 287,140Operating expenses:
General and administrative 340,065 293,776 234,614Depreciation and intangibles amortization 15,317 15,775 17,009Exit recapture — ( 897 ) ( 284 )
Total operating expenses 355,382 308,654 251,339Operating income 86,986 52,133 35,801Other income, net 3,799 1,437 553Income from continuing operations before income taxes 90,785 53,570 36,354Provision for income taxes 31,188 18,150 14,519Income from continuing operations 59,597 35,420 21,835Discontinued operations:
Loss from discontinued operations (net of a $1,289 income tax benefit) — — ( 2,395 )Loss on disposition of discontinued operations (net of a
$11,133 income tax benefit) — — ( 20,675 )Net income (loss) $ 59,597 $ 35,420 $ ( 1,235 )
Basic net income (loss) per common share:Income from continuing operations $ 0.59 $ 0.34 $ 0.21Loss from discontinued operations, net of tax — — ( 0.02 )Loss on disposition of discontinued operations, net of tax — — ( 0.20 )
Basic net income (loss) per common share $ 0.59 $ 0.34 $ ( 0.01 )Average common shares outstanding, basic 101,719 102,804 101,680
Diluted net income (loss) per common share:Income from continuing operations $ 0.56 $ 0.33 $ 0.21Loss from discontinued operations, net of tax — — ( 0.02 )Loss on disposition of discontinued operations, net of tax — — ( 0.20 )
Diluted net income (loss) per common share $ 0.56 $ 0.33 $ ( 0.01 )Average common shares outstanding, diluted 105,832 106,842 104,518
See accompanying notes to consolidated financial statements.
33MPS Group
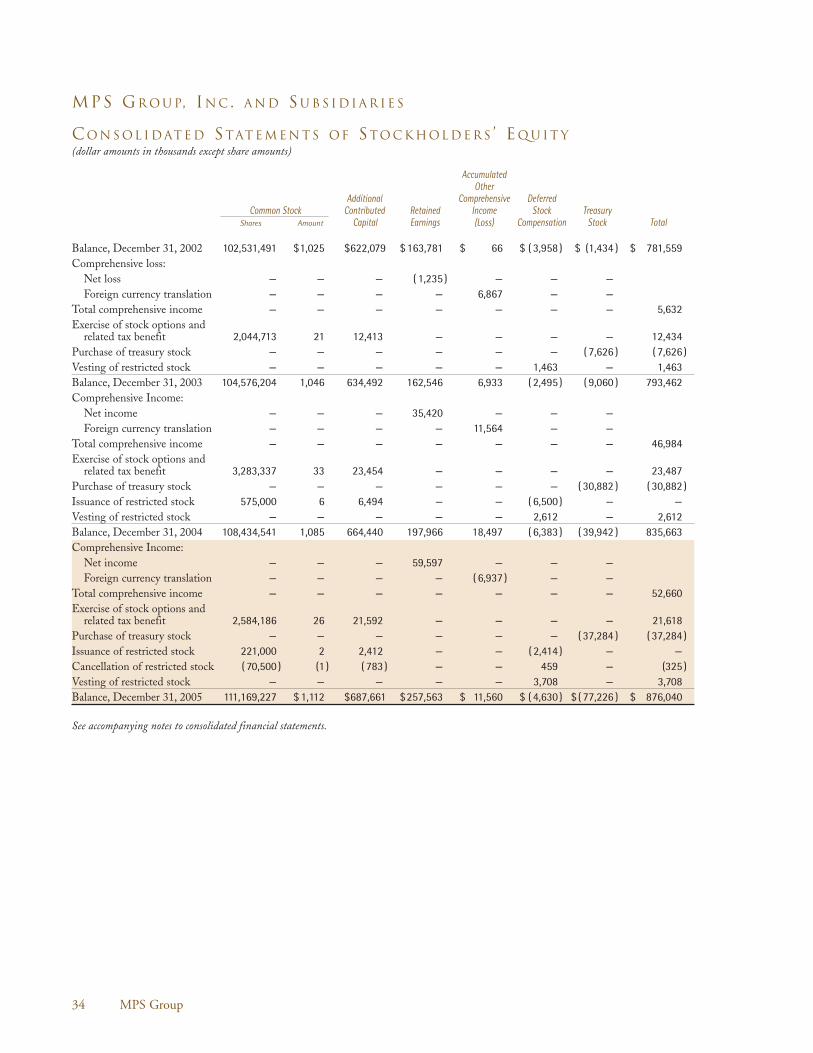
34 MPS Group
MPS GR O U P, IN C . A N D SU B S I D I A R I E S
CO N S OL I D AT E D STAT E M E N TS OF STO C K HOL D E R S ’ EQ U I T Y(dollar amounts in thousands except share amounts)
AccumulatedOther
Additional Comprehensive DeferredCommon Stock Contributed Retained Income Stock Treasury
Shares Amount Capital Earnings (Loss) Compensation Stock Total
Balance, December 31, 2002 102,531,491 $1,025 $622,079 $163,781 $ 66 $ ( 3,958 ) $ (1,434 ) $ 781,559Comprehensive loss:
Net loss — — — ( 1,235 ) — — —Foreign currency translation — — — — 6,867 — —
Total comprehensive income — — — — — — — 5,632Exercise of stock options and
related tax benefit 2,044,713 21 12,413 — — — — 12,434Purchase of treasury stock — — — — — — ( 7,626 ) ( 7,626 )Vesting of restricted stock — — — — — 1,463 — 1,463Balance, December 31, 2003 104,576,204 1,046 634,492 162,546 6,933 ( 2,495 ) ( 9,060 ) 793,462Comprehensive Income:
Net income — — — 35,420 — — —Foreign currency translation — — — — 11,564 — —
Total comprehensive income — — — — — — — 46,984Exercise of stock options and
related tax benefit 3,283,337 33 23,454 — — — — 23,487Purchase of treasury stock — — — — — — ( 30,882 ) ( 30,882 )Issuance of restricted stock 575,000 6 6,494 — — ( 6,500 ) — —Vesting of restricted stock — — — — — 2,612 — 2,612Balance, December 31, 2004 108,434,541 1,085 664,440 197,966 18,497 ( 6,383 ) ( 39,942 ) 835,663Comprehensive Income:
Net income — — — 59,597 — — —Foreign currency translation — — — — ( 6,937 ) — —
Total comprehensive income — — — — — — — 52,660Exercise of stock options and
related tax benefit 2,584,186 26 21,592 — — — — 21,618Purchase of treasury stock — — — — — — ( 37,284 ) ( 37,284 )Issuance of restricted stock 221,000 2 2,412 — — ( 2,414 ) — —Cancellation of restricted stock ( 70,500 ) (1 ) ( 783 ) — — 459 — (325 )Vesting of restricted stock — — — — — 3,708 — 3,708Balance, December 31, 2005 111,169,227 $ 1,112 $687,661 $257,563 $ 11,560 $ ( 4,630 ) $( 77,226 ) $ 876,040
See accompanying notes to consolidated financial statements.

35MPS Group
MPS GR O U P, IN C . A N D SU B S I D I A R I E S
CO N S OL I D AT E D STAT E M E N TS OF CA S H FLO W S(dollar amounts in thousands)
Years Ended 12-31-2005 12-31-2004 (1) 12-31-2003 (1)
Cash flows from operating activities:Net income (loss) $ 59,597 $ 35,420 $ ( 1,235 )Adjustments to net income (loss) to net cash provided by operating activities:
Discontinued operations — 437 18,083Exit recapture — ( 897 ) ( 284 )Deferred income taxes 22,697 19,256 6,284Deferred compensation, net of cancellations 3,383 2,612 1,465Depreciation and identified intangibles amortization 15,317 15,755 17,009Changes in assets and liabilities, net of acquisitions:
Accounts receivable ( 42,615 ) ( 43,757 ) 31,235Prepaid expenses and other assets ( 676 ) 480 ( 1,712 )Accounts payable and accrued expenses 21,586 20,461 ( 4,841 )Accrued payroll and related taxes 14,775 5,148 2,204Other, net ( 2,166 ) ( 4,253 ) ( 2,857 )
Net cash provided by operating activities 91,898 50,662 65,351Cash flows from investing activities of continuing operations:
Discontinued operation — — 7,886Proceeds from sale of assets 3,674 2,442 —Purchase of furniture, equipment, and leasehold improvements,
net of disposals ( 11,480 ) (9,565 ) ( 6,880 )Purchase of businesses, net of cash acquired ( 17,714 ) ( 50,223 ) ( 15,864 )
Net cash used in investing activities ( 25,520 ) ( 57,346 ) ( 14,858 )Cash flows from financing activities:
Repurchases of common stock ( 37,284 ) ( 30,882 ) ( 7,626 )Discount realized on employee stock purchase plan ( 572 ) ( 433 ) ( 389 )Proceeds from stock options exercised 14,687 18,251 10,867Repayments on indebtedness ( 2,553 ) ( 893 ) ( 163 )
Net cash provided by (used in) financing activities ( 25,722 ) ( 13,957 ) 2,689Effect of exchange rate changes on cash and cash equivalents ( 4,202 ) 2,308 4,714Net increase (decrease) in cash and cash equivalents 36,454 ( 18,333 ) 57,896Cash and cash equivalents, beginning of year 106,497 124,830 66,934Cash and cash equivalents, end of year $ 142,951 $ 106,497 $ 124,830
(1) In 2005, we have revised our 2004 and 2003 Consolidated Statements of Cash Flows to separately disclose the operating andinvesting portions of the cash flows attributable to our discontinued operations within the respective categories. We had previouslyreported these amounts separately from cash flows from operating activities of continuing operations and from cash flows frominvesting activities of continuing operations.
See accompanying notes to consolidated financial statements.

MPS GR O U P, IN C . A N D SU B S I D I A R I E S
(dollar amounts in thousands)
Years Ended 12-31-2005 12-31-2004 12-31-2003
Supplemental Cash Flow InformationInterest paid $ 600 $ 598 $ 1,234Income taxes paid (refunded) 4,861 5,106 ( 3,838 )
Non-Cash Investing and Financing ActivitiesThe Company completed three acquisitions in 2005, seven acquisitions in 2004and two acquisitions in 2003. In connection with the acquisitions, liabilitieswere assumed as follows:
Fair value of assets acquired $ 18,003 $ 59,816 $ 18,839Cash paid ( 15,250 ) ( 48,201 ) ( 16,322 )Liabilities assumed $ 2,753 $ 11,615 $ 2,517
36 MPS Group
37MPS Group
NOT E S TO CO N S OL I D AT E D FI N A N C I A L STAT E M E N TS
1 . DE S C R I P T IO N OF BU S I N E S S
MPS Group, Inc. (MPS or the Company) (New York Stock Exchange symbol: MPS) is a leading provider of businessservices with over 190 offices throughout the United States, Canada, the United Kingdom, and continental Europe.The Company delivers specialty staffing, consulting and business solutions to virtually all industries in the followingdisciplines and through the following primary brands:
Brand(s) DisciplineModis® Information Technology (IT) ServicesBadenoch & Clark®, Accounting Principals® Accounting and FinanceEntegee® EngineeringSpecial Counsel® LegalIdea Integration® IT SolutionsSoliant Health® Health CareBeeline® Work Force Automation
The Company presents the financial results of the above brands under its four reporting segments: North AmericanProfessional services, European Professional services, North American IT services and European IT services.
2 . SUM M A RY OF SIG N I F IC A N T AC C O U N T I N G POL IC I E S
Basis of Presentation and Consolidation The consolidated financial statements include the accounts of the Company and its wholly owned subsidiaries. Allmaterial intercompany transactions have been eliminated in the accompanying consolidated financial statements.
Cash and Cash Equivalents Cash and cash equivalents include deposits in banks, money market funds, and short-term investments withmaturities of 90 days or less.
Furniture, Equipment, and Leasehold Improvements Furniture, equipment, and leasehold improvements are recorded at cost less accumulated depreciation and amortization.Depreciation of furniture and equipment is computed using the straight-line method over the estimated useful livesof the related assets. The Company has developed a proprietary software package, which allows the Company toimplement imaging, time capture, and data-warehouse reporting. The costs associated with the development of thisproprietary software package have been capitalized, and are being amortized over a five-year period. See Footnote13 to the Consolidated Financial Statements.
In accordance with Statements of Financial Accounting Standards (‘SFAS’) No. 144, Accounting for the Impairmentor Disposal of Long-Lived Assets, the Company evaluates the recoverability of its carrying value of property andequipment whenever events or changes in circumstances indicate that the carrying amount may not be recoverable.Carrying value write-downs and gains and losses on disposition of property and equipment are reflected in theConsolidated Statements of Operations.
Goodwill and Other Identifiable Intangible Assets For acquisitions, the Company allocates the excess of cost over the fair market value of the net tangible assets first toidentifiable intangible assets, if any, and then to goodwill. In connection with SFAS No. 142, Goodwill and OtherIntangible Assets, the Company is required to perform goodwill impairment reviews, at least annually, utilizing afair-value approach.
The Company performed valuation testing during the fourth quarters of 2003, 2004 and 2005 (its designated timingof the annual impairment test under SFAS No. 142) and did not incur any impairment. The Company plans toperform its next annual impairment review during the fourth quarter of 2006. An impairment review prior to itsnext scheduled annual review may be required if certain events occur, including lower than forecasted earnings

38 MPS Group
levels for various reporting units. In addition, changes to other assumptions could significantly impact the Company’sestimate of the fair value of its reporting units. Such a change may result in a goodwill impairment charge, whichcould have a significant impact on the reportable segments that include the related reporting units and theConsolidated Financial Statements.
The Company used an equally blended value of a discounted cash flow analysis and market comparables to arrive atfair value for SFAS No. 142. For the discounted cash flow analysis, significant assumptions included expected futurerevenue growth rates, reporting unit profit margins, working capital levels and a discount rate. The revenue growthrates and reporting unit profit margins are based, in part, on its expectation of an improving economic environment.Market comparables included a comparison of the market ratios and performance fundamentals from comparablecompanies. The use of these measurement criteria is consistent with the underlying concepts used in determiningthe fair value of a company or reportable unit under the market approach. The market ratios the Company usedrefer to the multiples of revenue and earnings of comparable companies and the performance fundamentals refer tothe consideration of the effects of the differences in the operating metrics, ie. growth rates, operating margins, grossmargins, etc. on its value versus the comparable companies.
From 2003 to 2005, the Company acquired twelve businesses: four legal staffing businesses acquired in February of2003, August of 2003, August of 2004, and October of 2004; three health care staffing businesses acquired in Februaryof 2004, March of 2004, and September of 2005; four accounting staffing businesses acquired in February of 2004,July of 2004, October of 2004, and September of 2005; and two IT solutions businesses acquired in July of 2005 andSeptember of 2005. The accounting and finance staffing and the IT solutions business acquired in 2005 were part ofthe same acquisition. These acquisitions were recorded in accordance with the provisions of SFAS No. 141 BusinessCombinations. See Footnote 3 (Business Combinations) and Footnote 5 (Goodwill And Other Identifiable IntangibleAssets) to the Consolidated Financial Statements.
Revenue Recognition The Company recognizes substantially all revenue at the time services are provided and is recorded on a time andmaterials basis. In most cases, the consultant is the Company’s employee and all costs of employing the worker arethe responsibility of the Company and are included in cost of revenue. Revenues generated when the Companypermanently places an individual with a client are recorded at the time of start.
In addition and to a lesser extent, the Company is involved in fixed price or lump-sum engagements. The servicesrendered by the Company under the relevant contracts generally require performance spanning more than oneaccounting period. The Company recognizes revenue for these engagements under the proportional performanceaccounting model.
Foreign Operations The financial position and operating results of foreign operations are consolidated using the local currency as thefunctional currency. These operating results are considered to be permanently invested in foreign operations. Localcurrency assets and liabilities are translated at the rate of exchange to the U.S. dollar on the balance sheet date, andthe local currency revenues and expenses are translated at average rates of exchange to the U.S. dollar during the period.
Stock-Based Compensation During December 2002, the FASB issued SFAS No. 148, Accounting for Stock-Based Compensation—Transition andDisclosure, which provides for alternative methods of transition for a voluntary change to the fair-value-basedmethod of accounting for stock-based compensation. In addition, SFAS No. 148 amended the disclosure requirementsof SFAS No. 123, Accounting for Stock-Based Compensation, to require more prominent disclosure in both annualand interim financial statements about the method of accounting for stock-based employee compensation and theeffect of the method used on reported results.

39MPS Group
The Company accounts for its employee and director stock option plans in accordance with APB Opinion No. 25,Accounting for Stock Issued to Employees, and related Interpretations. The Company measures compensation expensefor employee and director stock options as the aggregate difference between the market value of its common stockand exercise prices of the options on the date that both the number of shares the grantee is entitled to receive andthe exercise prices are known. Compensation expense associated with restricted stock grants is equal to the marketvalue of the shares on the date of grant and is recorded pro rata over the required holding period. If the Companyhad elected to recognize compensation cost for all outstanding options granted by the Company, by applying thefair value recognition provisions of SFAS No. 148 to stock-based employee compensation, net income (loss) andearnings (loss) per share would have been reduced to the pro forma amounts indicated below.(dollar amounts in thousands except per share amounts)
Years 2005 2004 2003
Net income (loss)As reported $ 59,597 $ 35,420 $ ( 1,235 )
Total stock-based employee compensation expense determined under fairvalue based method for all awards, net of related tax effects ( 9,794 ) ( 2,705 ) ( 4,796 )
Pro forma $ 49,803 $ 32,715 $ ( 6,031 )
Basic net income (loss) per common shareAs reported $ 0.59 $ 0.34 $ ( 0.01 )Pro forma $ 0.49 $ 0.32 $ ( 0.06 )
Diluted net income (loss) per common shareAs reported $ 0.56 $ 0.33 $ ( 0.01 )Pro forma $ 0.47 $ 0.31 $ ( 0.06 )
The fair value of each option grant is estimated on the date of grant using the Black Scholes option-pricing model withthe following assumptions used for grants in 2005, 2004 and 2003, respectively: risk-free interest rate of 3.8%, 3.8%and 3.8%; expected volatility of 70%, 70% and 70%; and expected lives of 5 years, 5 years and 5 years. The weightedaverage fair values of options granted during 2005, 2004 and 2003 were $5.48, $7.48 and $5.44 per share, respectively.
Income Taxes The provision for income taxes is based on income before taxes as reported in the accompanying ConsolidatedStatements of Operations. Deferred tax assets and liabilities are recognized for the expected future tax consequencesof events that have been included in the financial statements or tax returns. Under this method, deferred tax assetsand liabilities are determined based on the differences between the financial statement carrying amounts and thetax basis of assets and liabilities using enacted tax rates in effect for the year in which the differences are expected toreverse. An assessment is made as to whether or not a valuation allowance is required to offset deferred tax assets.This assessment includes anticipating future taxable income.
The Company is subject to periodic review by federal, foreign, state and local taxing authorities in the ordinarycourse of business. As a result, tax contingencies have been recorded for such items, including amounts related tocurrent audits. These contingencies are adjusted as expected results differ from what was recorded. See Footnote 7to the Consolidated Financial Statements.
Net Income (Loss) per Common Share The consolidated financial statements include ‘basic’ and ‘diluted’ per share information. Basic net income per commonshare information is calculated by dividing net income by the weighted average number of common shares outstanding.Diluted net income per common share information is calculated by also considering the impact of potential commonstock equivalents on both net income and the weighted average number of common shares outstanding. Theweighted average number of common shares used in the basic earnings per common share computations were 101.7million, 102.8 million, and 101.7 million in 2005, 2004 and 2003, respectively. The only difference in the computationof basic and diluted earnings per common share is the inclusion of 4.1 million, 4.0 million and of 2.8 million potentialcommon shares in 2005, 2004 and 2003, respectively. See Footnote 10 to the Consolidated Financial Statements.
40 MPS Group
Excess Real Estate Obligations In 2002, management determined that the Company would not be able to utilize certain vacated office space, thuseliminating the economic benefit associated with that space. As a result, the Company recorded a $9.0 million chargefor contract termination costs. The following table summarizes the activity of the charge for contract terminationcosts from origination through December 31, 2005 by reportable segment:(dollar amounts in thousands)
Professional Services IT ServicesNorth America Europe North America Europe Total
Balance as of December 31, 2002 $ 431 $ — $ 8,536 $ — $ 8,967Costs paid or otherwise settled during 2003 ( 223 ) — ( 4,051 ) — ( 4,274 )Amounts recaptured during 2003 ( 39 ) — ( 245 ) — ( 284 )Balance as of December 31, 2003 $ 169 — 4,240 — 4,409Costs paid or otherwise settled during 2004 (169 ) — ( 1,870 ) — ( 2,039 )Amounts recaptured during 2004 — — ( 897 ) — ( 897 )Balance as of December 31, 2004 $ — $ — $ 1,473 $ — $ 1,473Costs paid or otherwise settled during 2005 — — ( 576 ) — ( 576 )Balance as of December 31, 2005 $ — $ — $ 897 $ — $ 897
As a result of the sale of its outplacement unit, the Company recorded $705,000 of contract termination costs in 2003,which is included in ‘Loss on disposition of discontinued operations, net of tax’ on the Company’s ConsolidatedStatement of Operations.
The aforementioned charges (recapture) were recorded in accordance with SFAS No. 146, “Accounting for CostsAssociated with Exit or Disposal Activities,” which requires that a liability for a cost associated with an exit or disposalactivity be recognized, at fair value, when the liability is incurred rather than at the time an entity commits to a plan.
Discontinued Operations In December 2003, the Company sold certain operating assets and transferred certain operating liabilities of itsoutplacement unit for $8.0 million in cash while retaining the working capital of the business of approximately $2.0million. The initial after-tax loss on the sale was $20.7 million. The Company recorded the disposition in accordancewith SFAS No. 144, Accounting for the Impairment or Disposal of Long-Lived Assets.
In 2003, this unit generated $21.0 million in revenue and had a $3.7 million loss before income taxes. The remainingnet liabilities of $328,000 at December 31, 2004, which were primarily comprised of $347,000 of contract terminationcosts, were included in the line item ‘Other’ in the Liabilities section of the Company’s Consolidated Balance Sheet.
Cash Flows Management has revised the Company’s 2004 and 2003 Consolidated Statements of Cash Flows to separatelydisclose the operating and investing portions of the cash flows attributable to discontinued operations within therespective categories. We had previously reported these amounts separately from cash flows from operating activitiesof continuing operations and from cash flows from investing activities of continuing operations.
Pervasiveness of Estimates The preparation of financial statements in conformity with generally accepted accounting principles requiresmanagement to make estimates and assumptions that affect the reported amount of assets and liabilities anddisclosure of contingent assets and liabilities at the date of the financial statements and the reported amounts ofrevenue and expenses during the reporting period. Although management believes these estimates and assumptionsare adequate, actual results may differ from the estimates and assumptions used.
New Accounting Pronouncements In December 2004, the FASB issued SFAS No. 123 (revised 2004), Share-Based Payment (“SFAS 123R”), whichreplaces SFAS No. 123 and supercedes APB Opinion No. 25. SFAS 123R requires all share-based payments toemployees, including grants of employee stock options, to be recognized in the financial statements based on theirfair values. The pro forma disclosures previously permitted under SFAS No. 123 no longer will be an alternative tofinancial statement recognition. The Company is required to adopt SFAS 123R beginning with the first quarter of2006. Upon adoption, the Company will be required to recognize compensation on all share-based grants made onor after January 1, 2006, and for the unvested portion of share-based grants made prior to January 1, 2006.
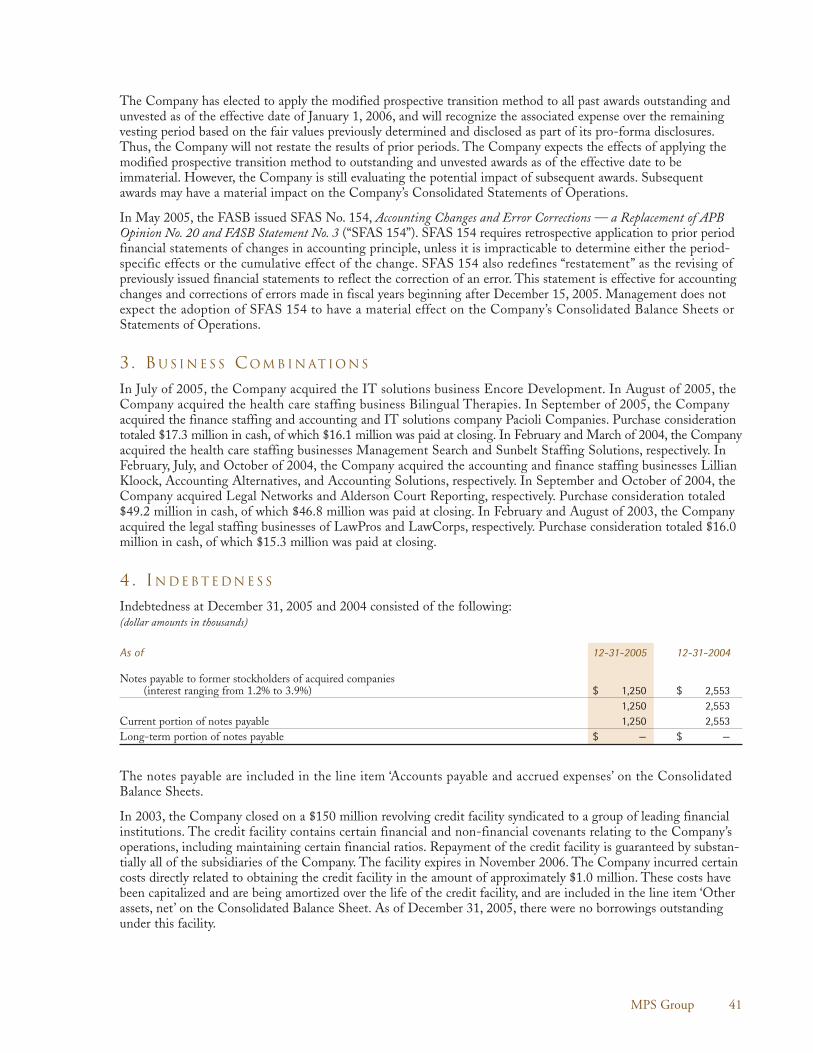
41MPS Group
The Company has elected to apply the modified prospective transition method to all past awards outstanding andunvested as of the effective date of January 1, 2006, and will recognize the associated expense over the remainingvesting period based on the fair values previously determined and disclosed as part of its pro-forma disclosures.Thus, the Company will not restate the results of prior periods. The Company expects the effects of applying themodified prospective transition method to outstanding and unvested awards as of the effective date to beimmaterial. However, the Company is still evaluating the potential impact of subsequent awards. Subsequentawards may have a material impact on the Company’s Consolidated Statements of Operations.
In May 2005, the FASB issued SFAS No. 154, Accounting Changes and Error Corrections — a Replacement of APBOpinion No. 20 and FASB Statement No. 3 (“SFAS 154”). SFAS 154 requires retrospective application to prior periodfinancial statements of changes in accounting principle, unless it is impracticable to determine either the period-specific effects or the cumulative effect of the change. SFAS 154 also redefines “restatement” as the revising ofpreviously issued financial statements to reflect the correction of an error. This statement is effective for accountingchanges and corrections of errors made in fiscal years beginning after December 15, 2005. Management does notexpect the adoption of SFAS 154 to have a material effect on the Company’s Consolidated Balance Sheets orStatements of Operations.
3 . BU S I N E S S CO M B I N AT IO N S
In July of 2005, the Company acquired the IT solutions business Encore Development. In August of 2005, theCompany acquired the health care staffing business Bilingual Therapies. In September of 2005, the Companyacquired the finance staffing and accounting and IT solutions company Pacioli Companies. Purchase considerationtotaled $17.3 million in cash, of which $16.1 million was paid at closing. In February and March of 2004, the Companyacquired the health care staffing businesses Management Search and Sunbelt Staffing Solutions, respectively. InFebruary, July, and October of 2004, the Company acquired the accounting and finance staffing businesses LillianKloock, Accounting Alternatives, and Accounting Solutions, respectively. In September and October of 2004, theCompany acquired Legal Networks and Alderson Court Reporting, respectively. Purchase consideration totaled$49.2 million in cash, of which $46.8 million was paid at closing. In February and August of 2003, the Companyacquired the legal staffing businesses of LawPros and LawCorps, respectively. Purchase consideration totaled $16.0million in cash, of which $15.3 million was paid at closing.
4. IN D E B T E D N E S S
Indebtedness at December 31, 2005 and 2004 consisted of the following:(dollar amounts in thousands)
As of 12-31-2005 12-31-2004
Notes payable to former stockholders of acquired companies(interest ranging from 1.2% to 3.9%) $ 1,250 $ 2,553
1,250 2,553Current portion of notes payable 1,250 2,553Long-term portion of notes payable $ — $ —
The notes payable are included in the line item ‘Accounts payable and accrued expenses’ on the ConsolidatedBalance Sheets.
In 2003, the Company closed on a $150 million revolving credit facility syndicated to a group of leading financialinstitutions. The credit facility contains certain financial and non-financial covenants relating to the Company’soperations, including maintaining certain financial ratios. Repayment of the credit facility is guaranteed by substan-tially all of the subsidiaries of the Company. The facility expires in November 2006. The Company incurred certaincosts directly related to obtaining the credit facility in the amount of approximately $1.0 million. These costs havebeen capitalized and are being amortized over the life of the credit facility, and are included in the line item ‘Otherassets, net’ on the Consolidated Balance Sheet. As of December 31, 2005, there were no borrowings outstandingunder this facility.

42 MPS Group
5 . GO OD W I L L A N D OT H E R ID E N T I F I A B L E IN TA N G I B L E AS S E TS
The changes in the carrying amount of goodwill for 2005 and 2004, are as follows:(dollar amounts in thousands)
Professional Services IT ServicesNorth America Europe North America Europe Total
Balance as of December 31, 2003 $ 110,144 $ 102,173 $ 244,758 $ 29,555 $ 486,6302004 acquisitions 42,662 — — — 42,662
Balance as of December 31, 2004 152,806 102,173 244,758 29,555 529,2922005 acquisitions 10,843 — 4,252 — 15,095Effect of foreign currency exchange rates — 2,374 — 698 3,072Reduction of goodwill as a result of the
disposition of certain assets in theIT solutions unit — — ( 2,096 ) — ( 2,096 )
Balance as of December 31, 2005 $ 163,649 $ 104,547 $ 246,914 $ 30,253 $ 545,363
The Company allocated the purchase price of acquisitions in accordance with SFAS No. 141 Business Combinations.At December 31, 2005 and 2004, there was $2.6 million, and $3.6 million, respectively, of identifiable intangibleassets on the Company’s Consolidated Balance Sheets relating to the Company’s acquisitions in 2004 and 2005.Identifiable intangible assets relate to the value of the acquired business’ customer relationships at the date of theacquisition and trade names.
6 . CO M M I TM E N TS A N D CO N T I N G E N C I E S
Rent expense, primarily for office premises, was $24.0 million, $19.8 million, and $23.4 million, for 2005, 2004 and2003, respectively. The Company leases office space under various noncancelable operating leases. The following isa schedule of future minimum lease payments with terms in excess of one year:(dollar amounts in thousands)
Year
2006 $ 13,0852007 11,6062008 8,8462009 7,2802010 5,532Thereafter 5,494
$ 51,843
In addition, as of December 31, 2005, the Company had future purchase commitments of approximately $6.1 millionover the next three years, related primarily to telecom service agreements, software licenses and subscriptions, andcomputer hardware and software maintenance agreements.
The Company is a party to a number of lawsuits and claims arising out of the ordinary conduct of its business. In theopinion of management, based on the advice of in-house and external legal counsel, the lawsuits and claims pendingare not likely to have a material adverse effect on the Company, its financial position, its results of operations, or itscash flows.

7 . IN C O M E TA X E S
A comparative analysis of the provision for income taxes from continuing operations is as follows:(dollar amounts in thousands)
Years 2005 2004 2003
Current:Federal $ 214 $ ( 2,914 ) $ 7,050State 834 ( 858 ) 611International 7,443 2,666 574
8,491 ( 1,106 ) 8,235Deferred:
Federal 25,433 18,618 6,267State ( 2,335 ) 93 114International ( 401 ) 545 ( 97 )
22,697 19,256 6,284$ 31,188 $ 18,150 $ 14,519
The difference between the actual income tax provision and the tax provision computed by applying the statutoryfederal income tax rate to income from continuing operations before provision for income taxes is attributable tothe following :(dollar amounts in thousands)
Years 2005 2004 2003Amount Percentage Amount Percentage Amount Percentage
Tax computed using the federal statutory rate $ 31,775 35.0 % $ 18,750 35.0 % $ 12,724 35.0 %State income taxes, net of federal income tax effect ( 1,501 ) ( 1.7 )% ( 765 ) ( 1.4 )% 725 2.0 %Non-deductible meals 2,434 2.7 % 1,865 3.5 % 1,246 3.4 %Foreign tax rate differential ( 1,112 ) ( 1.2 )% ( 142 ) (0.3 )% ( 77 ) ( 0.2 )%Other permanent differences ( 408 ) ( 0.4 )% ( 1,558 ) (2.9 )% ( 99 ) ( 0.3 )%
$ 31,188 34.4 % $ 18,150 33.9 % $ 14,519 39.9 %
The components of the deferred tax assets and liabilities recorded in the accompanying consolidated balance sheetsare as follows:(dollar amounts in thousands)
Years 2005 2004
Gross deferred tax assets:Other employee benefits $ 1,815 $ 1,111Allowance for doubtful accounts receivable 2,488 1,578Foreign tax credit carryforward 20,687 19,954Net operating loss carryforward 17,953 27,943Capital loss carryforward 3,661 3,661Deferred compensation 3,197 2,992Equity based compensation 2,842 875Amortization of goodwill 6,223 22,151Other 4,537 2,934
Total gross deferred tax assets 63,403 83,199Valuation allowance ( 27,765 ) ( 30,887 )
Total gross deferred tax assets, net of valuation allowance 35,638 52,312Gross deferred tax liabilities:
Other ( 2,612 ) ( 2,958 )Net deferred tax asset $ 33,026 $ 49,354
43MPS Group
Recognition of deferred tax assets is based on management’s belief that it is more likely than not that the tax benefitassociated with temporary differences, operating loss carryforwards and tax credits will be utilized. A valuationallowance is recorded for those deferred tax assets for which it is more likely than not that realization will not occur.
The Company utilized a significant portion of its Federal net operating loss in 2005, reducing the related deferredtax asset to $7.9 million from $15.7 million in 2004. The remaining Federal net operating loss carryforward willexpire in 2024.
The Company’s valuation allowance at December 31, 2005, consisted of $15.5 million in foreign tax credit carryforwards,$8.6 million in state net operating loss carryforwards, and $3.7 million for a capital loss carryforward. The valuationallowance at December 31, 2004, consisted of $15.0 million in foreign tax credit carryforwards, $12.2 million instate net operating loss carryforwards, and $3.7 million for a capital loss carryforward.
In addition to deferred tax expense, the Company’s deferred tax asset changed in 2005 for the net tax benefit of stockoptions and foreign currency recorded in equity in the amount of $6.4 million.
The Company is subject to periodic review by federal, foreign, state and local taxing authorities in the ordinary courseof business. As a result, tax contingencies have been recorded for such items, including amounts related to currentaudits. These contingencies are adjusted as expected results differ from what was recorded.
Federal income taxes were not provided for on income from foreign subsidiaries (except for Canada), since they areconsidered to be permanently invested. If these earnings were remitted, foreign tax credits would substantially offsetany resulting federal income tax.
8. EM P LO Y E E BE N E F I TS
Profit Sharing Plans The Company has a qualified contributory 401(k) profit sharing plan which covers all full-time employees over agetwenty-one with over 90 days of employment and 375 hours of service. The Company made matching contributionsof approximately $2.6 million, $0.5 million and $2.1 million, net of forfeitures, to the profit sharing plan for 2005,2004 and 2003, respectively. Under the terms of the profit sharing plan, the Company will match at least 25% ofemployee contributions up to the first 5% of total eligible compensation, as defined in the various profit sharingplans. For 2005, the Company matched 50% of employee contributions up to the aforementioned limit.
The Company has assumed many 401(k) plans of acquired subsidiaries. From time to time, the Company mergesthese plans into the Company’s plan. Company contributions relating to these merged plans are included in theaforementioned total.
Deferred Compensation Plan The Company also has a non-qualified deferred compensation plan for its highly compensated employees. Whilethe deferred compensation plan provides for matching contributions, the Company did not match employee deferralsfor 2005, 2004 and 2003. The Company looks to invest the assets of the deferred compensation plan based on aportfolio designed to achieve the most desirable balance between investment return and asset protection by investingin equities of high quality companies and in high quality fixed income securities. As of December 31, 2005 and 2004,the liability to the employees for amounts deferred, which is included in ‘Other’ in the Liabilities section of theConsolidated Balance Sheets, was $9.2 million and $8.5 million, respectively.
In the beginning of 2002, the Company purchased insurance on the lives of its highly compensated employees. Thiscompany-owned life insurance is intended to be used to settle the Company’s obligations of deferred compensation.The cash surrender value of the company-owned life insurance is included in ‘Other assets, net’ in the ConsolidatedBalance Sheets.
44 MPS Group

9 . STO C K HOL D E R S ’ EQ U I T Y
Stock Repurchase Plan The Company’s Board of Directors had authorized the repurchase of up to $130 million of the Company’s CommonStock. Beginning in the third quarter of 2002 through the end of 2005, 8.8 million shares at a cost of $77.2 millionhave been repurchased under this authorization.
Incentive Employee Stock Plan In 2004, the Company replaced the 1995 Stock Option Plan with the 2004 Equity Plan (Employee Plan). Under theCompany’s Employee Plan, participants may be granted stock options (incentive and nonqualified), stock appreciationrights, restricted stock, restricted stock units, and performance shares. The total number of shares available for awardunder the Employee Plan is 5.7 million, comprised of 4.5 million newly authorized shares and 1.2 million unusedshares allocated from the 1995 Plan, plus lapsed or cancelled awards or options from grants outstanding at the timeof shareholder approval under the 1995 Plan. The Employee Plan, among other things, requires the exercise priceof nonqualified stock options to not be less than 100% of the fair market value of the stock on the date the optionis granted, and defines a director to comply with Rule 16b-3 of the Securities Exchange Act of 1934, as amendedand with Section 162(m) of the Internal Revenue Code of 1986, as amended, and prohibits the Company fromreducing the exercise price of outstanding options (repricing) without first receiving shareholder approval. In 2005,the Company issued 2.6 million options under the Employee Plan at an average exercise price of $8.91. In 2004, theCompany did not issue any shares under this plan.
Non-Employee Director Stock Plan In 2004, the Company adopted the 2004 Non-Employee Director Equity Incentive Plan (Director Plan). It replacedthe Amended and Restated Non-Employee Director Stock Option Plan (Prior Director Plan) that expired inDecember 2003. Under the Director Plan, non-employee directors may be granted stock options, stock appreciationrights, restricted stock, and restricted stock units. The total number of shares that may be awarded under the DirectorPlan is 570,000, plus lapsed or cancelled awards or options from grants outstanding at the time of shareholderapproval under the prior Director Plan. The Director Plan allows each non-employee director to purchase 60,000shares at an exercise price equal to the fair market value at the date of the grant upon election to the Board, whichbecomes exercisable ratably over a five-year period. In addition, the Director Plan provides for an annual issuance ofnon-qualified options to purchase 20,000 shares to each director, upon reelection, at an exercise price equal to thefair market value at the date of grant, which become exercisable ratably over a three-year period. Both sets of optionsexpire ten years from the date of the grant. The Board of Directors are also able to grant additional options to non-employee directors from time to time as the Board determines in its discretion as well as replace one option withone-half of a share of restricted stock. In 2005, the Company issued 320,000 options at an average exercise price of$10.60 under this plan. In 2004, the Company did not issue any options under this plan.
Under the Prior Director Plan, in 2003 the Company granted 260,000 options at an average exercise price of $7.82.
The following table summarizes the Company’s Stock Option Plans:Weighted
Range of AverageShares Exercise Prices Exercise Price
Balance, December 31, 2002 14,373,183 $ 1.25 - $ 33.38 $ 6.12Granted 429,000 $ 5.29 - $ 9.14 $ 7.00Exercised ( 2,044,713 ) $ 1.25 - $ 9.88 $ 5.23Canceled ( 957,412 ) $ 3.63 - $ 33.38 $ 9.73
Balance, December 31, 2003 11,800,058 $ 3.56 - $ 22.88 $ 6.10Granted 165,000 $ 11.72 - $ 11.72 $11.73Exercised ( 3,283,337 ) $ 3.56 - $ 11.13 $ 5.73Canceled ( 767,560 ) $ 3.63 - $ 17.38 $ 6.16
Balance, December 31, 2004 7,914,161 $ 3.56 - $ 22.88 $ 6.26Granted 2,895,000 $ 8.39 - $ 13.46 $ 9.10Exercised ( 2,584,186 ) $ 3.63 - $ 13.67 $ 5.67Canceled ( 151,026 ) $ 3.69 - $ 17.38 $ 8.27
Balance, December 31, 2005 8,073,949 $ 3.56 - $ 22.88 $ 7.43
45MPS Group

The following table summarizes information about stock options outstanding at December 31, 2005:
Outstanding ExercisableWeighted WeightedAverage Average
Average Exercise ExerciseRange of Exercise Prices Shares Life (1) Price Shares Price
$ 3.56 – $ 5.24 2,180,841 6.00 $ 4.53 2,179,341 $ 4.53$ 5.25 – $ 6.96 2,111,189 5.77 6.05 1,925,943 6.04$ 6.97 – $ 8.39 2,011,181 9.21 8.37 505,681 8.30$ 8.40 – $ 11.13 1,235,613 8.09 10.29 1,105,283 10.34$ 11.14 – $ 22.88 535,125 4.71 14.54 500,125 14.62Total 8,073,949 6.97 $ 7.43 6,216,373 $ 7.15
(1) Average contractual life remaining in years.
At year-end 2004, options with a weighted average exercise price of $6.33 were exercisable on 7.9 million shares; atyear-end 2003, options with an average exercise price of $6.35 were exercisable on 8.1 million shares.
During 2005 and 2004, the Company’s Board of Directors issued restricted stock grants of 150,000 shares each yearto the Company’s President and Chief Executive Officer, and grants of 71,000 shares and 425,000 shares to othermembers of management in 2005 and 2004, respectively. The Company recorded $2.4 million and $6.5 million inStockholders’ equity for deferred compensation in 2005 and 2004, respectively. The Company recorded $3.4 million,$2.6 million and $1.5 million of compensation expense, net of cancellations, in 2005, 2004 and 2003, respectively, forthe vesting of these grants. The deferred compensation is amortized on a straight line basis over the vesting periodof the grants. There were no restricted stock grants in 2003.
The Company has an employee stock purchase plan (ESPP), which provides that eligible employees may contributeup to 10% of their base earnings toward the quarterly purchase of the Company’s Common Stock. The employee’spurchase price is 85% of the lesser of the fair market value of the stock on the first business day or the last businessday of the quarterly offering period. No compensation expense is recorded in connection with the ESPP in 2005,2004 and 2003. The total number of shares issuable under the ESPP is 1.0 million. During 2005, 2004 and 2003,the Company issued the following stock under the ESPP:
Purchase PriceYear # of Shares High Low
2005 153,251 $ 12.76 $ 8.802004 189,667 $ 11.14 $ 8.342003 201,008 $ 9.49 $ 5.20
Since inception of the ESPP, 899,940 shares have been purchased, leaving 100,060 shares available for future issuances.
46 MPS Group
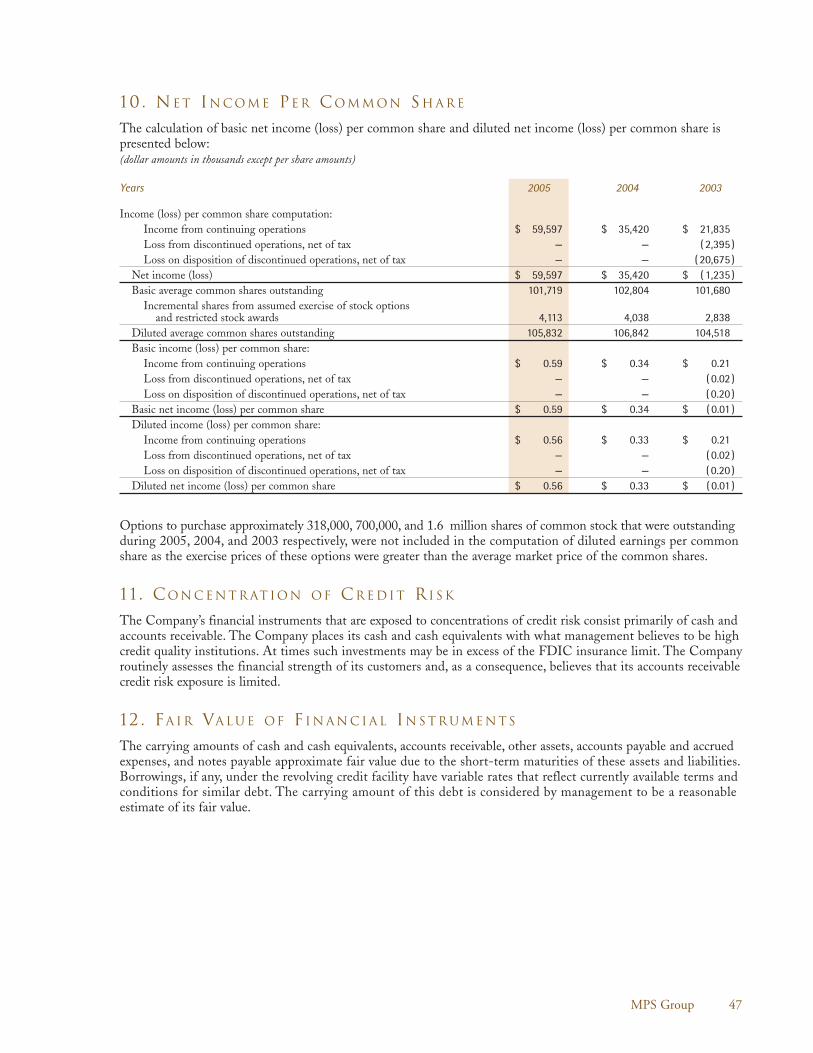
47MPS Group
10 . NE T IN C O M E PE R CO M M O N SH A R E
The calculation of basic net income (loss) per common share and diluted net income (loss) per common share ispresented below:(dollar amounts in thousands except per share amounts)
Years 2005 2004 2003
Income (loss) per common share computation:Income from continuing operations $ 59,597 $ 35,420 $ 21,835Loss from discontinued operations, net of tax — — ( 2,395 )Loss on disposition of discontinued operations, net of tax — — ( 20,675 )
Net income (loss) $ 59,597 $ 35,420 $ ( 1,235 )Basic average common shares outstanding 101,719 102,804 101,680
Incremental shares from assumed exercise of stock optionsand restricted stock awards 4,113 4,038 2,838
Diluted average common shares outstanding 105,832 106,842 104,518Basic income (loss) per common share:
Income from continuing operations $ 0.59 $ 0.34 $ 0.21Loss from discontinued operations, net of tax — — ( 0.02 )Loss on disposition of discontinued operations, net of tax — — ( 0.20 )
Basic net income (loss) per common share $ 0.59 $ 0.34 $ ( 0.01 )Diluted income (loss) per common share:
Income from continuing operations $ 0.56 $ 0.33 $ 0.21Loss from discontinued operations, net of tax — — ( 0.02 )Loss on disposition of discontinued operations, net of tax — — ( 0.20 )
Diluted net income (loss) per common share $ 0.56 $ 0.33 $ ( 0.01 )
Options to purchase approximately 318,000, 700,000, and 1.6 million shares of common stock that were outstandingduring 2005, 2004, and 2003 respectively, were not included in the computation of diluted earnings per commonshare as the exercise prices of these options were greater than the average market price of the common shares.
11 . CO N C E N T R AT IO N OF CR E D I T RI S K
The Company’s financial instruments that are exposed to concentrations of credit risk consist primarily of cash andaccounts receivable. The Company places its cash and cash equivalents with what management believes to be highcredit quality institutions. At times such investments may be in excess of the FDIC insurance limit. The Companyroutinely assesses the financial strength of its customers and, as a consequence, believes that its accounts receivablecredit risk exposure is limited.
12 . FA I R VA L U E OF FI N A N C I A L IN S T R UM E N TS
The carrying amounts of cash and cash equivalents, accounts receivable, other assets, accounts payable and accruedexpenses, and notes payable approximate fair value due to the short-term maturities of these assets and liabilities.Borrowings, if any, under the revolving credit facility have variable rates that reflect currently available terms andconditions for similar debt. The carrying amount of this debt is considered by management to be a reasonableestimate of its fair value.

13 . FU R N I T U R E , EQ U I P M E N T, A N D LE A S E HOL D IM P R O V E M E N TS
A summary of furniture, equipment, and leasehold improvements at December 31, 2005 and 2004 is as follows:(dollar amounts in thousands)
EstimatedUseful Life
in Years 2005 2004
Furniture, equipment, and leasehold improvements 5-15/lease term $ 81,333 $ 95,930Software 3 4,373 8,566Software development 5 12,428 24,378
98,134 128,874Accumulated depreciation and amortization 73,592 101,996
Total furniture, equipment, and leasehold improvements, net $ 24,542 $ 26,878
Total depreciation and amortization expense on furniture, equipment, and leasehold improvements was $12.7 million,$13.6 million, and $16.1 million for 2005, 2004 and 2003, respectively.
14 . QUA RT E R LY FI N A N C I A L DATA (UN A U D I T E D)
For the Three Months EndedFor the Year
Ended3-31-2005 6-30-2005 9-30-2005 12-31-2005 12-31-2005
Revenue $ 407,709 $ 424,836 $ 426,961 $ 425,193 $ 1,684,699Gross profit $ 101,934 $ 110,919 $ 113,945 $ 115,570 $ 442,368Net income $ 9,349 $ 13,111 $ 17,121 $ 20,016 $ 59,597Basic net income per common share $ 0.09 $ 0.13 $ 0.17 $ 0.20 $ 0.59Diluted net income per common share $ 0.09 $ 0.12 $ 0.16 $ 0.19 $ 0.56
For the Three Months EndedFor the Year
Ended3-31-2004 6-30-2004 9-30-2004 12-31-2004 12-31-2004
Revenue $ 310,481 $ 333,245 $ 362,332 $ 420,784 $ 1,426,842Gross profit $ 78,235 $ 85,156 $ 91,673 $ 105,723 $ 360,787Net income $ 5,322 $ 9,344 $ 9,446 $ 11,308 $ 35,420Basic net income per common share $ 0.05 $ 0.09 $ 0.09 $ 0.11 $ 0.34Diluted net income per common share $ 0.05 $ 0.09 $ 0.09 $ 0.11 $ 0.33
48 MPS Group
(dollar amounts in thousands exceptper common share amounts)

15 . SE G M E N T RE P ORT I N G
The Company discloses segment information in accordance with SFAS No. 131, Disclosure About Segments of anEnterprise and Related Information, which requires companies to report selected segment information on a quarterlybasis and to report certain entity-wide disclosures about products and services, major customers, and the materialcountries in which the entity holds assets and reports revenues.
The Company has four reportable segments: North American Professional services, European Professional services,North American IT services, and European IT services. The Company’s reportable segments offer different services,have different client bases, experience differing economic characteristics, and are managed separately as each requiresdifferent resources and marketing strategies. The North American Professional services segment provides specializedstaffing and recruiting in the disciplines of accounting, finance, law, engineering and healthcare in North America.The European Professional services segment provides specialized staffing and recruiting for accounting, financialservices, legal, human resources, not-for-profit and public-sector positions in Europe, principally in the UnitedKingdom. The North American IT services segment offers value-added solutions such as IT project support andstaffing, recruitment of full-time positions, project-based solutions, supplier management solutions, on-site recruitingsupport, IT strategy consulting, design and branding, application development, and integration in North America.The European IT services segment provides value-added solutions such as IT project support and staffing, andrecruitment of full-time positions specialized staffing and solutions in Europe, principally in the United Kingdom.
The North American Professional services division’s results for 2005 include the results from the acquisitions of threehealth care staffing businesses acquired by the Company in February of 2004, March of 2004, and September of 2005;four legal staffing businesses acquired in February of 2003, August of 2003, September of 2004, and October of 2004;and four accounting and finance staffing businesses acquired in February of 2004, July of 2004, October of 2004, andSeptember of 2005. The North American IT services division’s results for 2005 include the results from the acquisitionsof two IT solutions businesses acquired by the Company in July and September of 2005. The accounting and financestaffing business and IT solutions business acquired in September of 2005 were part of the same acquisition.
The Company evaluates segment performance based on revenues, gross profit, and income from continuing operationsbefore provision for income taxes. The Company does not allocate income taxes, interest or unusual items to thesegments. In addition, the Company does not report total assets by segment.
The accounting policies of the segments are consistent with those described in the summary of significant accountingpolicies in Note 2 to the Consolidated Financial Statements and all intersegment sales and transfers are eliminated.
No one customer represents more than 5% of the Company’s overall revenue. Therefore, the Company does notbelieve it has a material reliance on any one customer as the Company is able to provide services to numerousFortune 1000 and other leading businesses.
49MPS Group

The following tables summarize performance, accounts receivable, net, and long-lived assets by segment, andrevenue by geographic location:(dollar amounts in thousands)
Years 2005 2004 2003
RevenueNorth American Professional services $ 537,257 $ 429,560 $ 315,754European Professional services 364,793 289,058 198,346North American IT services 510,499 459,470 401,193European IT services 272,150 248,754 180,737
Total revenue $ 1,684,699 $ 1,426,842 $ 1,096,030Gross profit
North American Professional services $ 160,400 $ 123,783 $ 89,127European Professional services 104,320 80,402 58,238North American IT services 142,192 123,757 112,780European IT services 35,456 32,845 26,995
Total gross profit $ 442,368 $ 360,787 $ 287,140Income from continuing operations before provision for income taxes
North American Professional services $ 44,469 $ 30,937 $ 16,012European Professional services 26,120 13,192 12,450North American IT services 37,324 28,022 23,214European IT services 4,485 2,401 2,944
112,398 74,552 54,620Corporate expenses (1) ( 25,412 ) ( 23,316 ) ( 19,103 )Recapture (2) — 897 284Other income, net 3,799 1,437 553Total income from continuing operations before provision for income taxes $ 90,785 $ 53,570 $ 36,354
Geographic AreasRevenue
North America $ 1,047,756 $ 889,030 $ 716,947Europe 636,943 537,812 379,083
Total revenue $ 1,684,699 $ 1,426,842 $ 1,096,030
As of 12-31-2005 12-31-2004
Accounts receivable, netNorth American Professional services $ 75,783 $ 60,623European Professional services 42,237 32,433North American IT services 89,155 78,367European IT services 37,331 38,089
Total accounts receivable, net $ 244,506 $ 209,512Long-lived assets
North American Professional services $ 166,319 $ 154,412European Professional services 108,210 105,542North American IT services 255,506 253,378European IT services 35,421 35,904
565,456 549,236Corporate 4,449 6,934
Total long-lived assets $ 569,905 $ 556,170
(1) Corporate expenses include unallocated expenses not directly related to the segments’ operations.
(2) 2004 and 2003 include a $897,000 and a $284,000 recapture, respectively, relating to the settlement of abandoned real estateassociated with exit costs incurred in 2002.
50 MPS Group

SC H E D U L E II—VA L UAT IO N A N D QUA L I F Y I N G AC C O U N TS(dollar amounts in thousands)
Balance atBeginning of Charged to Translation Balance at
Period Expenses Write-offs Deductions Adjustments End of Period
Year Ended December 31, 2003Allowance for doubtful
accounts receivable $ 16,919 1,505 ( 6,104 ) — 579 $ 12,899Deferred tax valuation allowance $ 25,050 2,121 — — — $ 27,171
Year Ended December 31, 2004Allowance for doubtful
accounts receivable $ 12,899 3,271 ( 6,715 ) — 381 $ 9,836Deferred tax valuation allowance $ 27,171 3,716 — — — $ 30,887
Year Ended December 31, 2005Allowance for doubtful
accounts receivable $ 9,836 4,178 ( 1,498 ) — ( 644 ) $ 11,872Deferred tax valuation allowance $ 30,887 ( 1,181 ) — ( 1,941 ) — $ 27,765
RE C O N C I L I AT IO N OF NO N-GAAP FI N A N C I A L ME A S U R E TO GAAPFI N A N C I A L ME A S U R E(dollar amounts in thousands)
Years 2005 2004 2003
EBITDA $ 102,303 $ 67,011 $ 52,526Exit recapture — 897 284Depreciation and intangibles amortization ( 15,317 ) ( 15,775 ) ( 17,009 )Operating income 86,986 52,133 35,801Other income, net 3,799 1,437 553Provision for income taxes ( 31,188 ) ( 18,150 ) ( 14,519 )Income from continuing operations 59,597 35,420 21,835Discontinued operations:
Loss from discontinued operations, net of income tax benefit — — ( 2,395 )Loss on disposition of discontinued operations, net of income tax benefit — — ( 20,675 )
Net income (loss) $ 59,597 $ 35,420 $ ( 1,235 )
51MPS Group

52 MPS Group
RE Q U E S T F OR IN F OR M AT IO N
Upon written request, we will furnish shareholders,without charge, copies of quarterly information,additional copies of this Annual Report, and copies ofour Form 10-K (without exhibits) as filed with theSecurities and Exchange Commission for fiscal yearended December 31, 2005. Requests should bedirected to:
MPS Group, Inc.Investor Relations Department1 Independent DriveJacksonville, Florida [email protected]
The certifications of our Chief Executive and ChiefFinancial Officers required by Section 302 of theSarbanes-Oxley Act of 2002, which address, amongother things, the content of our Annual Report onForm 10-K, appear as exhibits to the Form 10-K.
Pursuant to the requirements of the New York StockExchange, in 2005 our Chief Executive Officercertified to the NYSE that he was not aware of anyviolation by MPS Group, Inc. of the NYSE’scorporate governance listing standards.
COR P OR AT E HE A D Q UA RT E R S
1 Independent DriveJacksonville, Florida 32202-5060(904) 360-2000
CO M M O N STO C K DATA
MPS Group, Inc.’s common stock is traded on theNew York Stock Exchange under the symbol MPS.As of March 31, 2006, MPS Group, Inc. had approxi-mately 19,457 shareholders. Of that total, 957 werestockholders of record and approximately 18,500 heldtheir stock in nominee name.
The Company currently intends to retain any earningsfor the operation and expansion of its business anddoes not anticipate paying any cash dividends in thefuture. See “Market for Registrant’s Common Equity,Related Stockholder Matters and Issuer Purchases ofEquity Securities” on page 17 for more informationon our common stock.
TRANSFER AGENT AND REGISTRAR
SunTrust Bank, AtlantaP.O. Box 4625Atlanta, Georgia 30302(404) 588-7815
LE G A L CO U N S E L
Kilpatrick Stockton LLPAtlanta, Georgia
IN D E PE N D E N T AU D I TOR S
PricewaterhouseCoopers LLPJacksonville, Florida
This Annual Report to shareholders contains forward-looking statements that are subject to certain risks,uncertainties, or assumptions and may be affected by certain other factors including but not limited to the factorsdescribed on page 15 of this Annual Report.
Other products or company names mentioned herein may be trademarks, service marks, or trade names of theirrespective companies.
Copyright © 2006 MPS Group, Inc.® All rights reserved.

BOA R D OF DI R E C TOR S
Derek E. DewanChairman of the Board — MPS Group, Inc.
Michael D. AbneyRetired Chief Financial Officer and
Senior Vice President — MPS Group, Inc.
T. Wayne Davis 1, 2, 3
President and Chairman —Tine W. Davis Family — WD Charities, Inc.
William M. Isaac 1, 2
Chairman — The Secura Group and Secura BurnettFormer Chairman — FDIC
John R. Kennedy 1, 2, 3
Retired President and Chief Executive Officer —Federal Paper Board Company, Inc.
Arthur B. Laffer, Ph.D. 2, 3
Chairman — Laffer Associates
Darla D. Moore 3
Partner and Executive Vice President — Rainwater, Inc.
Timothy D. PaynePresident and Chief Executive Officer —
MPS Group, Inc.
Peter J. Tanous 1, 2
President — Lynx Investment Advisory, Inc.
1 Member of the Corporate Governance and Nominating Committee2 Member of the Audit Committee3 Member of the Compensation Committee
MPS GR O U P E X E C U T I V E S
Timothy D. PaynePresident and Chief Executive Officer
Robert P. CrouchSenior Vice President and Chief Financial Officer
Richard L. WhiteSenior Vice President and Chief Information Officer
Gregory D. HollandSenior Vice President, Chief Legal Officer, and Secretary
Tyra H. TutorSenior Vice President, Corporate Development
Thomas M. BurkeVice President, Human Resources
John W. MelbourneVice President, International Operations
BU S I N E S S UN I T PR E S I D E N TS
Modis, John P. Cullen
Badenoch & Clark, Neil L. Wilson
Modis International, Paul F. Chapman
Entegee, Robert L. Cecchini
Special Counsel, John L. Marshall III
Accounting Principals
Soliant Health, David K. Alexander
Idea Integration, James D. Albert
Beeline, Richard L. White

1 Independent Drive • Jacksonville, Florida 32202
Phone 904-360-2000 • Fax 904-360-2521
www.mpsgroup.com


