13
2005 OBP Biennial Peer Review Biomass Storage for the Refining Industry Corey W. Radtke Biomass Feedstock Interface Platform November 14, 2005

2005 OBP Biennial Peer Review
Biomass Storage for the Refining Industry
Corey W. RadtkeBiomass Feedstock Interface Platform
November 14, 2005

Overview
Work Objective
• Objective – Decrease 2005 cost to $35/dry ton by 2015 for the purpose reducing sugar cost by almost 2 cents per lb, for all Billion Ton Vision Feedstocks
• Budget – About $2M per year from 2004 -2006• Current Partners – National Laboratories, Universities, Equipment Industry• Developing Partners – Agribusiness Commodity Companies, Regional
Feedstock Centers Partnerships, Feedstock Interface to Biorefining Partners
$0.00
$0.02
$0.04
$0.06
$0.08
$0.10
$0.12
$53 $45 $35Feedstock Cost ($ per dry ton)
Min
imum
Sug
ar S
ellin
g Pr
ice
($ p
er lb
Sug
ars)
Note: Sugar conversion cost estimate reductions based on the 2005 post-enzyme subcontract conversion case.
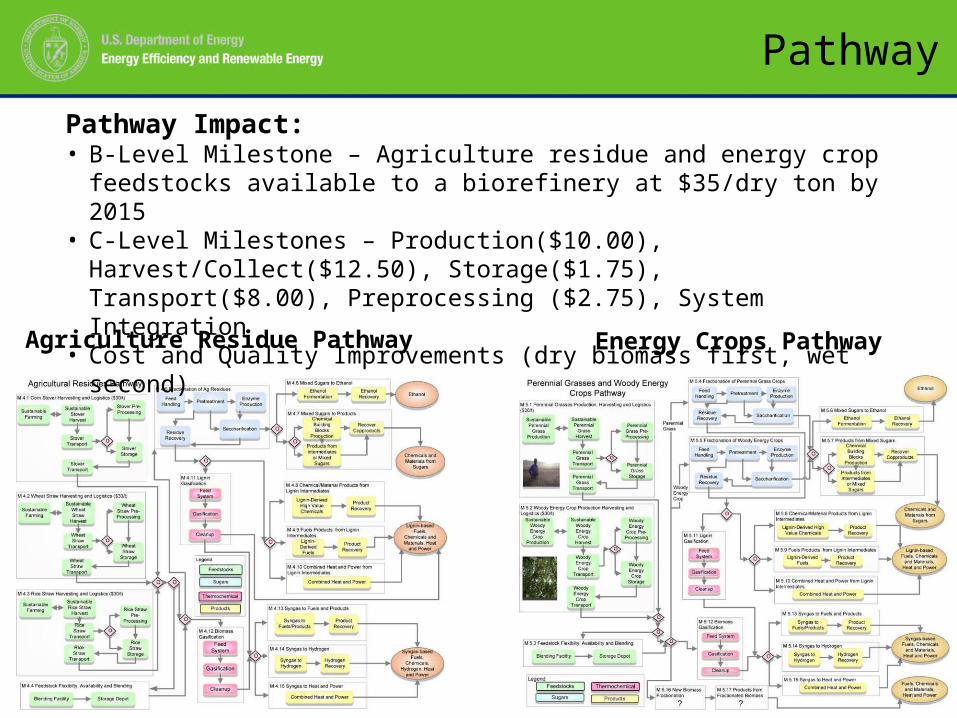
Pathway
Agriculture Residue Pathway Energy Crops Pathway
Pathway Impact:• B-Level Milestone – Agriculture residue and energy crop feedstocks available
to a biorefinery at $35/dry ton by 2015• C-Level Milestones – Production($10.00), Harvest/Collect($12.50),
Storage($1.75), Transport($8.00), Preprocessing ($2.75), System Integration• Cost and Quality Improvements (dry biomass first, wet second)

Approach
1. DOE Multi-Year Technical Plan Barriers for Feedstock Supply can be grouped into:
• Cost - $35 / try ton (Operational and Capital Costs)• Quality – dockage, composition, conversion efficiency
(selective harvest, fractional milling, in-storage fractional conversion)
• Quantity – biomass types (Billion Ton Study)2. Develop preprocessing based feedstock supply systems
that interface biorefining conversion processes to feedstock resources:
• Corn Stover• Cereal Straw• Switchgrass

Interim Stage Gate Overview
Feedstock Interface Core R&D
Ag Residue Processing R&D Energy Crop Processing R&D Feedstock Supply Chain Analysis
Harvest & Collection
Preprocessing
Storage
Feedstock Harvest & Collection Assembly System
Classification of Biomass Physical Properties in Preprocessing
Multi-Component Harvesting Equipment for Sugars
Virtual Engineering Tools for Airstream Separation
Biomass Structure Task
Post-Harvest Physiology of Biomass Storage
Collection, Commercial Processing, and Utilization of Corn Stover
Native Grass Utilization Project
Biomass Power for Rural Development Chariton Valley
Switchgrass Project
UT Switchgrass Project
Biomass Supply Systems & Logistics
Supply Forecast & Analysis
Production
Harvesting Collection
Storage
Preprocessing
Systems Integration
Transportation

Summarized Reviewer Comments
Complete INL-Storage portion of Stategate Reviewer’s Comments from FY05 review:
•Stage Placement•Data Collection
•Well Leveraged across several projects to get useful baseline data•Very important as we all agree that storage is inevitable •Appears that there is a method for statically relevant data, important to make sure that happens
•Need to consider how the results can be applied to other systems•How can learnings be applied to multiple types of storage for the same site, e.g., different periods of time•Comment for all three storage projects [other storage projects at review]
•Need to keep in mind the clear vision for how the material will get to the pile•There are three ensiling projects ISU/BMAP/Imperial that are all doing similar activities - INL should coordinate these project.

DOE Response
• Storage Research, FY05• Please comment on the DOE response to the reviewers comments
• Projected was extended beyond a baseline data collection action, and into an assessment of feedstock quality through wet and dry systems.
• Investigation was performed in manner to ensure findings extend to other feedstocks and storage methods.
• Harvest and assembly are included as part of an overall Feedstock Assembly write-up, putting the Storage section findings in overall context of biomass cost and quality as delivered to a Biorefinery.
• Coordinating with Imperial project as appropriate to AOP.

DOE Response
• Storage Research, FY05; Key Findings of Dry Storage SystemsLoaf Totals
Dry Mass in (ton) 15.2Dry Mass out (ton) 13.1Dry Mass Loss (ton) 2.1Dry Mass Loss (%) 14.0% Moisture in 5.8±0.39% Moisture out 18.70
Standing Loaves% of total Dry Mass 89.8% Moisture 15.4±4.4
Fallen Material% of total Dry Mass 10.2% Moisture 61.5±7.8
Chop in out difference % differenceTotal Mass (tons) 42.68 48.47 5.79 13.6
% Moisture 10.7±1.2 24.2±18.3 13.5 126DM (tons) 38.1 36.7 1.4 3.67
Bale in out in - out % differenceTotal Mass (tons) 23.910 24.485 0.575 2.4
% Moisture 8.7±0.48 11.6±3.53 2.9 33DM (tons) 21.830 21.645 0.19 0.85
•Bales and chopped pile stored outdoors for 1-yearrevealed 0.85% and 3.67% dry matter losses, respectively
•Loaves showed 14% dry matter loss, due to mechanical loss and research nature (lack of practice) using of this form of storage
DOE Response
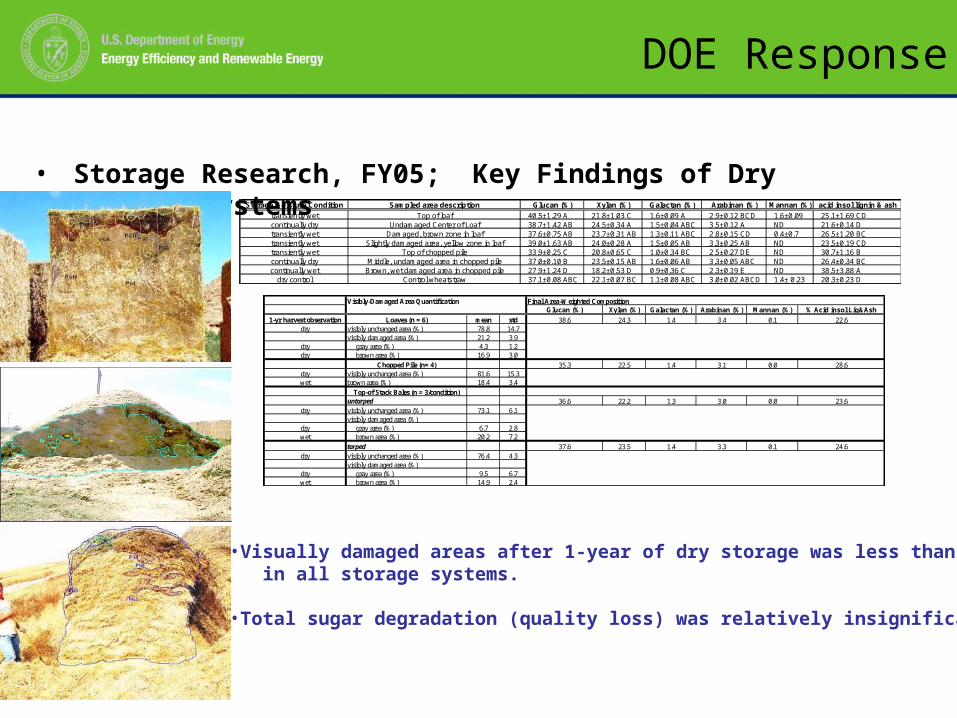
• Storage Research, FY05; Key Findings of Dry Storage Systems
•Visually damaged areas after 1-year of dry storage was less than 25% in all storage systems.
•Total sugar degradation (quality loss) was relatively insignificant.
Storage Moisture Condition Sampled area description Glucan (%) Xylan (%) Galactan (%) Arabinan (%) Mannan (%) acid insol lignin & ashtransiently wet Top of loaf 40.5±1.29 A 21.8±1.03 C 1.6±0.09 A 2.9±0.12 BCD 1.6±0.09 25.1±1.69 CDcontinually dry Undamaged Center of Loaf 38.7±1.42 AB 24.5±0.34 A 1.5±0.04 ABC 3.5±0.12 A ND 21.6±0.14 Dtransiently wet Damaged, brown zone in loaf 37.6±0.75 AB 23.7±0.31 AB 1.3±0.11 ABC 2.8±0.15 CD 0.4±0.7 26.5±1.20 BCtransiently wet Slightly damaged area, yellow zone in loaf 39.0±1.63 AB 24.0±0.28 A 1.5±0.05 AB 3.3±0.25 AB ND 23.5±0.19 CDtransiently wet Top of chopped pile 33.9±0.25 C 20.8±0.65 C 1.0±0.34 BC 2.5±0.27 DE ND 30.7±1.16 Bcontinually dry Middle, undamaged area in chopped pile 37.0±0.10 B 23.5±0.15 AB 1.6±0.06 AB 3.3±0.05 ABC ND 26.4±0.34 BCcontinually wet Brown, wet damaged area in chopped pile 27.9±1.24 D 18.2±0.53 D 0.9±0.36 C 2.3±0.19 E ND 38.5±3.88 A
dry control Control wheatstraw 37.1±0.08 ABC 22.1±0.07 BC 1.1±0.08 ABC 3.0±0.02 ABCD 1.4± 0.23 20.3±0.23 D
Visibly-Damaged Area Quantification Final Area-Weighted CompositionGlucan (%) Xylan (%) Galactan (%) Arabinan (%) Mannan (%) % Acid insol Lig&Ash
1-yr harvest observation Loaves (n = 6) mean std 38.6 24.3 1.4 3.4 0.1 22.6dry visibly unchanged area (%) 78.8 14.7
visibly damaged area (%) 21.2 3.9dry gray area (%) 4.3 1.2dry brown area (%) 16.9 3.0
Chopped Pile (n= 4) 35.3 22.5 1.4 3.1 0.0 28.6dry visibly unchanged area (%) 81.6 15.3wet brown area (%) 18.4 3.4
Top-of Stack Bales (n = 3/condition)untarped 36.6 22.2 1.3 3.0 0.0 23.6
dry visibly unchanged area (%) 73.1 6.1visibly damaged area (%)
dry gray area (%) 6.7 2.8wet brown area (%) 20.2 7.2
tarped 37.6 23.5 1.4 3.3 0.1 24.6dry visibly unchanged area (%) 76.4 4.3
visibly damaged area (%)dry gray area (%) 9.5 6.7wet brown area (%) 14.9 2.4
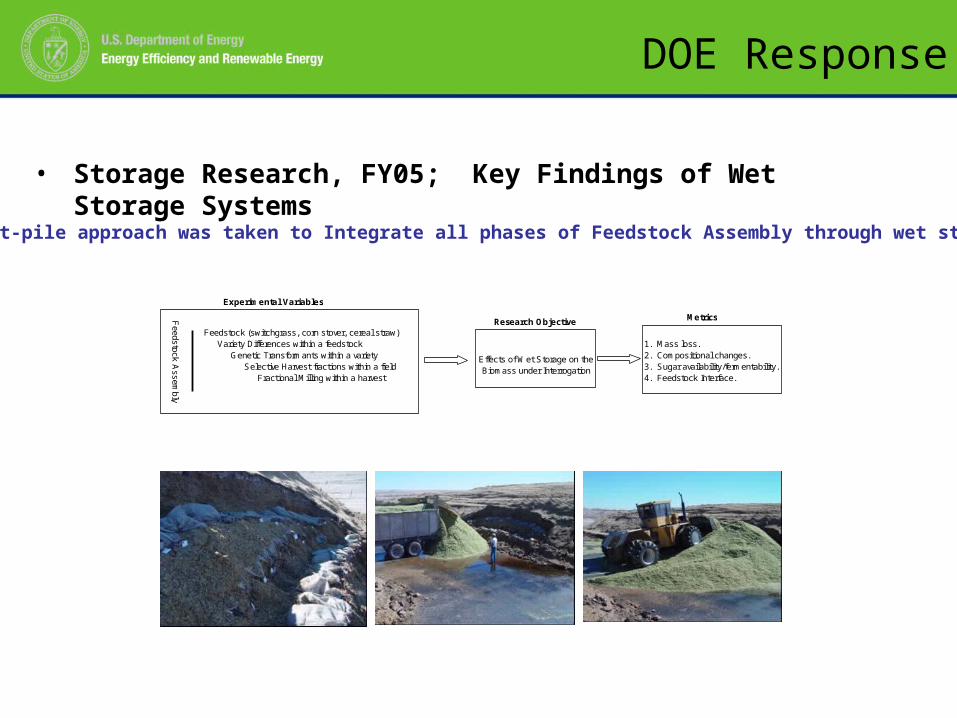
DOE Response
• Storage Research, FY05; Key Findings of Wet Storage Systems
•A host-pile approach was taken to Integrate all phases of Feedstock Assembly through wet storage
Feedstock (switchgrass, corn stover, cereal straw) Variety Differences within a feedstock Genetic Transformants within a variety Selective Harvest fractions within a field Fractional Milling within a harvest
Effects of Wet Storage on the Biomass under Interrogation
Experimental Variables
Feedstock Assem
bly
Research Objective
1. Mass loss.2. Compositional changes.3. Sugar availability/fermentability.4. Feedstock Interface.
Metrics

DOE Response• Storage Research, FY05; Key Findings of Wet Storage Systems
•Wet stored corn stover was tested for effects of treatment additives on Biorefinery-specific parameters•About 5% glucan was lost from stover stored in every treatment.•Some evidence for in-storage pretreatment of corn stover was found (this was baseline, not an optimization activity)
treatment sampled depth (ft) pH (INL) pH (Midwest Labs) % moisture lactic acid (% DM) acetic acid (% DM) NDF (Midwest Labs) ADF (Midwest Labs)(geo) mean (geo) mean mean±std mean±std mean±std mean±std mean±std
inoculated 2 4.4 4.3 57.9±3.73 1.31±0.37 0.29±0.059 29.5±0.78 19.7±0.55inoculated 6 4.8 4.6 55.7±0.55 1.17±0.21 0.22±0.21 29.7±1.77 19.9±1.93inoculated 12 4.3 4.7 59.6±3.73 3.54±1.95 0.00 26.9±0.59 17.3±0.83molasses 2 4.5 4.6 56.1±3.30 1.42±0.95 0.89±0.53 22.8±2.60 13.4±1.74molasses 6 4.7 4.7 58.4±3.31 2.33±1.86 0.00 27.2±0.38 17.5±1.14molasses 12 4.3 4.5 54.5±3.46 3.67±1.10 0.00 27.4±2.24 19.3±2.04
water control 2 4.4 4.7 56.2±3.56 2.16±0.95 0.00 28.8±0.57 18.2±0.21water control 6 4.8 4.5 61.0±0.78 3.40±0.80 0.00 27.6±1.50 17.2±0.44water control 12 4.3 4.3 55.1±5.24 4.88±0.37 0.00 25.9±0.20 16.7±1.29
EtOH_sol Sucrose H2O_ext_oth Glucan Xylan Galactan Arabinan Mannan Lignin_p_cor Struc_inorg Ext_inorg Protein Acetyl Uronic_acid Total GH NH total sugar/lignin ratioTime Zero 3.34 0.21 5.79 34.54 21.10 1.53 3.02 0.62 12.50 0.48 3.58 3.71 2.32 3.58 95.22 0.98 0.52 4.88
0.06 0.18 3.15 0.61 1.55 0.12 0.20 0.20 0.91 0.49 0.13 0.51 0.40 0.26 4.05 na na na
Water 4.17 0.66 16.25 29.29 14.44 1.33 2.52 0.29 11.29 0.99 5.69 6.50 1.61 2.44 97.41 2.04 0.60 4.300.14 0.36 0.92 0.25 0.65 0.14 0.20 0.04 0.39 0.85 0.07 0.23 0.05 0.11 1.72 na na na
Inoculated 3.73 0.00 14.50 30.97 16.43 1.37 2.60 0.50 12.84 0.09 5.82 6.19 1.54 2.85 97.92 2.05 0.94 4.040.24 0.00 0.76 0.40 0.43 0.08 0.09 0.05 0.39 0.15 0.41 0.43 0.15 0.04 1.54 na na na
Molasses 3.90 0.08 15.08 30.10 15.74 1.45 2.81 0.45 12.00 0.00 5.87 6.29 1.54 2.73 97.04 2.17 0.75 4.220.13 0.13 1.29 0.58 0.45 0.12 0.25 0.03 0.58 0.00 0.41 0.42 0.15 0.04 1.68 na na na
Acid Zone 3.24 0.07 17.19 26.18 8.51 1.79 2.01 0.48 15.85 4.99 7.44 8.36 0.13 1.81 98.04 4.06 1.99 2.46

DOE Response• Storage Research, FY05; Key Findings of Wet Storage Systems
•Ethanol production from readily available sugars in storage, or “Fractional Conversion” was identified as an impact item for future research•Necessary to marry with appropriate pretreatment infrastructure for recovery•Ungulate mimetic – overall, the process intensity for ethanol conversion may be proportional to the recalcitrance of the feedstock
0
5
1015
20
25
30
3540
45
50
1 2 3 4 5 6 7 8 9 10 11 12 13 14 15 16 17
[Ethanol] (% of Dry Matter in Silage)
[Eth
anol
] (g
allo
ns/D
M-to
n in
sila
ge)
0
20
40
60
80
100
120
140
160
% o
f $35
/ton
targ
et(a
ssum
es $
1.20
/gal
lon)
currently insome silage
approx. fermentation max
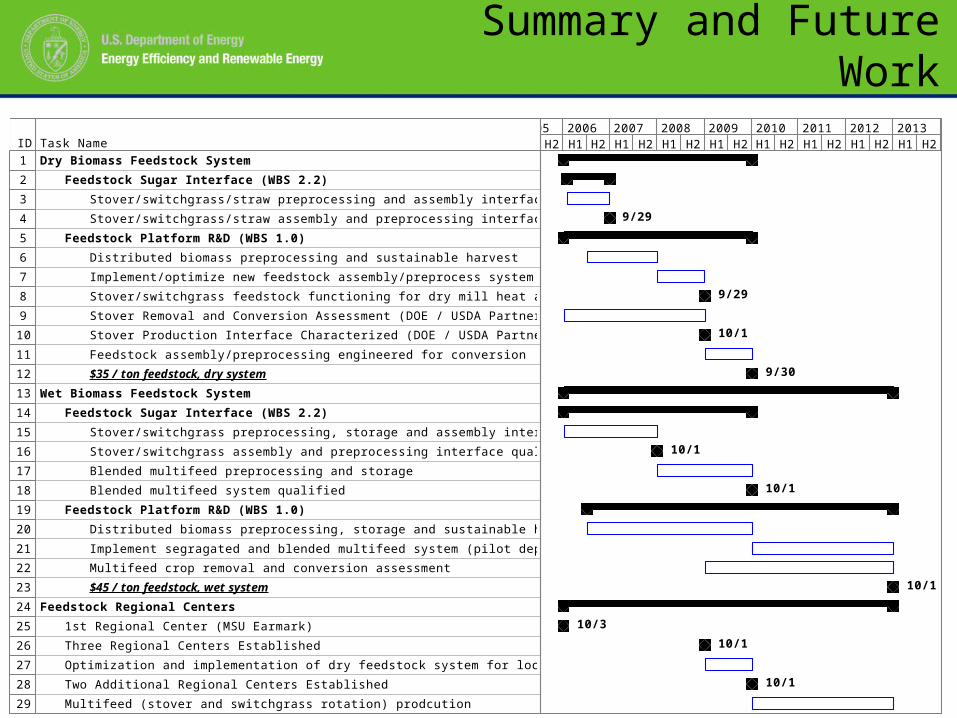
Summary and Future Work
ID Task Name1 Dry Biomass Feedstock System2 Feedstock Sugar Interface (WBS 2.2)3 Stover/switchgrass/straw preprocessing and assembly interface to conversion
4 Stover/switchgrass/straw assembly and preprocessing interface qualified
5 Feedstock Platform R&D (WBS 1.0)6 Distributed biomass preprocessing and sustainable harvest
7 Implement/optimize new feedstock assembly/preprocess system
8 Stover/switchgrass feedstock functioning for dry mill heat and power
9 Stover Removal and Conversion Assessment (DOE / USDA Partnership)
10 Stover Production Interface Characterized (DOE / USDA Partnership)
11 Feedstock assembly/preprocessing engineered for conversion
12 $35 / ton feedstock, dry system13 Wet Biomass Feedstock System14 Feedstock Sugar Interface (WBS 2.2)15 Stover/switchgrass preprocessing, storage and assembly interface to conversion
16 Stover/switchgrass assembly and preprocessing interface qualified
17 Blended multifeed preprocessing and storage
18 Blended multifeed system qualified
19 Feedstock Platform R&D (WBS 1.0)20 Distributed biomass preprocessing, storage and sustainable harvest
21 Implement segragated and blended multifeed system (pilot depot concept)
22 Multifeed crop removal and conversion assessment
23 $45 / ton feedstock, wet system24 Feedstock Regional Centers25 1st Regional Center (MSU Earmark)
26 Three Regional Centers Established
27 Optimization and implementation of dry feedstock system for local markets
28 Two Additional Regional Centers Established
29 Multifeed (stover and switchgrass rotation) prodcution
9/29
9/29
10/1
9/30
10/1
10/1
10/1
10/310/1
10/1
H2 H1 H2 H1 H2 H1 H2 H1 H2 H1 H2 H1 H2 H1 H2 H1 H2 H12005 2006 2007 2008 2009 2010 2011 2012 2013 2014


