Page 1
2005 TLI/WERCWarehouse Benchmarking Report
Edward H. Frazelle, Ph.D.President & CEO, Logistics Resources International
www.LRIConsulting.comDirector, Logistics Management Series, Georgia Tech
www.tli.gatech.edu
2005 TLI/WERC Warehouse Benchmarking Survey - Edward H. Frazelle, Ph.D.
Page 2
2005 TLI/WERC Warehouse Benchmarking Survey - © Edward H. Frazelle, Ph.D. 2
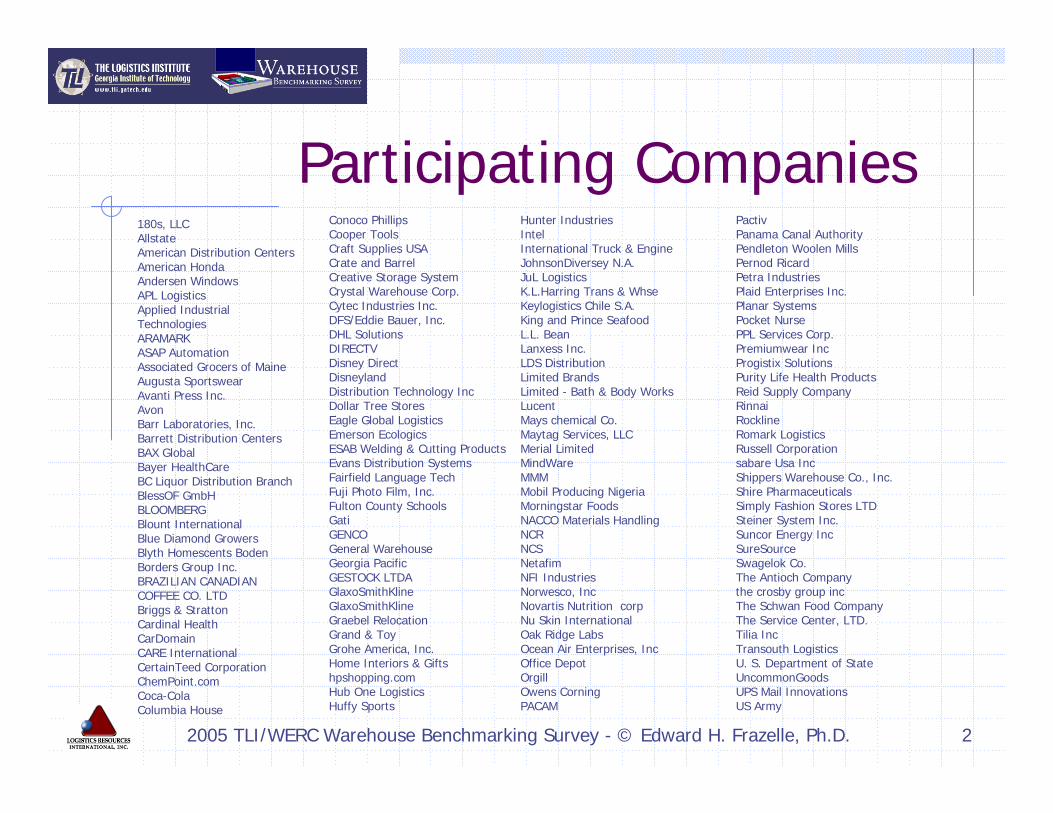
Participating CompaniesConoco Phillips Cooper ToolsCraft Supplies USACrate and BarrelCreative Storage SystemCrystal Warehouse Corp.Cytec Industries Inc.DFS/Eddie Bauer, Inc.DHL SolutionsDIRECTVDisney Direct DisneylandDistribution Technology IncDollar Tree StoresEagle Global LogisticsEmerson EcologicsESAB Welding & Cutting ProductsEvans Distribution SystemsFairfield Language TechFuji Photo Film, Inc.Fulton County SchoolsGatiGENCOGeneral WarehouseGeorgia PacificGESTOCK LTDAGlaxoSmithKlineGlaxoSmithKline Graebel RelocationGrand & ToyGrohe America, Inc.Home Interiors & Giftshpshopping.comHub One LogisticsHuffy Sports
Hunter IndustriesIntelInternational Truck & EngineJohnsonDiversey N.A.JuL LogisticsK.L.Harring Trans & WhseKeylogistics Chile S.A.King and Prince SeafoodL.L. BeanLanxess Inc.LDS DistributionLimited BrandsLimited - Bath & Body WorksLucentMays chemical Co.Maytag Services, LLCMerial LimitedMindWareMMMMobil Producing NigeriaMorningstar FoodsNACCO Materials HandlingNCRNCSNetafimNFI IndustriesNorwesco, IncNovartis Nutrition corpNu Skin InternationalOak Ridge LabsOcean Air Enterprises, IncOffice DepotOrgillOwens CorningPACAM
PactivPanama Canal AuthorityPendleton Woolen MillsPernod RicardPetra IndustriesPlaid Enterprises Inc.Planar SystemsPocket NursePPL Services Corp.Premiumwear IncProgistix Solutions Purity Life Health ProductsReid Supply CompanyRinnaiRocklineRomark LogisticsRussell Corporationsabare Usa IncShippers Warehouse Co., Inc.Shire PharmaceuticalsSimply Fashion Stores LTDSteiner System Inc.Suncor Energy IncSureSourceSwagelok Co.The Antioch Companythe crosby group incThe Schwan Food CompanyThe Service Center, LTD.Tilia IncTransouth LogisticsU. S. Department of StateUncommonGoodsUPS Mail InnovationsUS Army
180s, LLCAllstateAmerican Distribution CentersAmerican HondaAndersen WindowsAPL LogisticsApplied Industrial TechnologiesARAMARK ASAP Automation Associated Grocers of MaineAugusta SportswearAvanti Press Inc.AvonBarr Laboratories, Inc.Barrett Distribution CentersBAX GlobalBayer HealthCareBC Liquor Distribution BranchBlessOF GmbHBLOOMBERGBlount InternationalBlue Diamond GrowersBlyth Homescents BodenBorders Group Inc.BRAZILIAN CANADIAN COFFEE CO. LTDBriggs & StrattonCardinal HealthCarDomainCARE InternationalCertainTeed CorporationChemPoint.comCoca-ColaColumbia House
Page 3
2005 TLI/WERC Warehouse Benchmarking Survey - © Edward H. Frazelle, Ph.D. 3
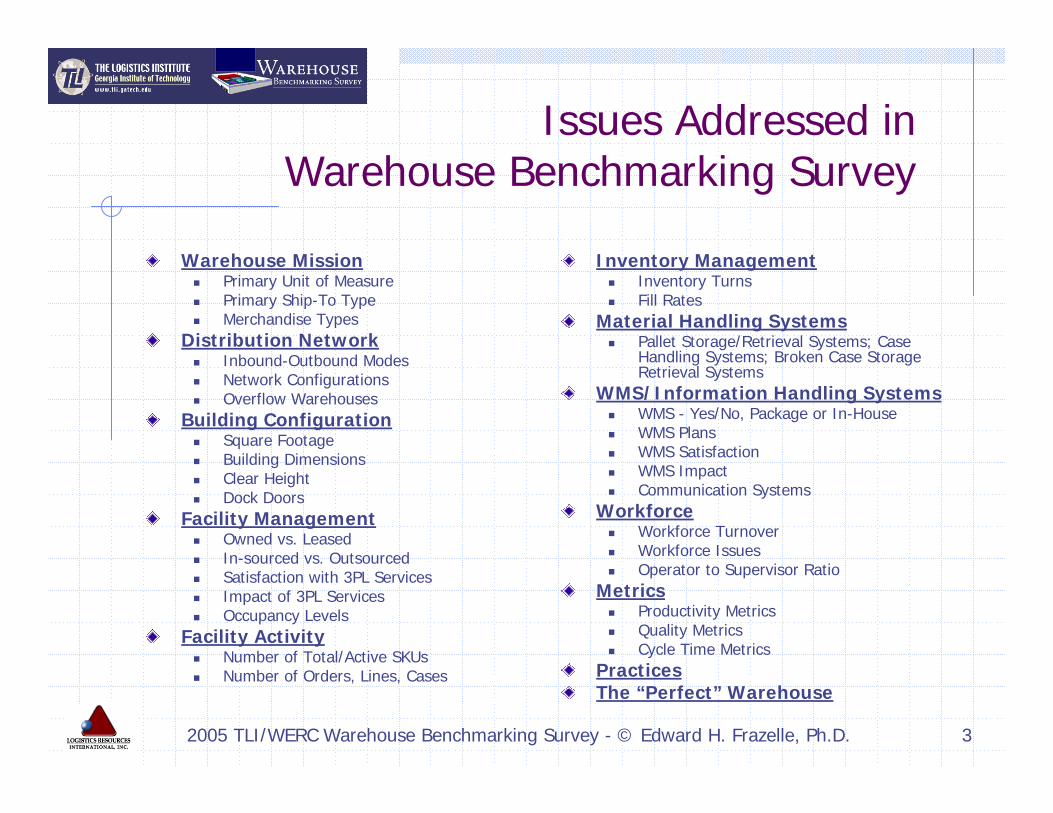
Issues Addressed in Warehouse Benchmarking Survey
Warehouse MissionPrimary Unit of MeasurePrimary Ship-To TypeMerchandise Types
Distribution NetworkInbound-Outbound ModesNetwork ConfigurationsOverflow Warehouses
Building ConfigurationSquare FootageBuilding DimensionsClear HeightDock Doors
Facility ManagementOwned vs. LeasedIn-sourced vs. OutsourcedSatisfaction with 3PL ServicesImpact of 3PL ServicesOccupancy Levels
Facility ActivityNumber of Total/Active SKUsNumber of Orders, Lines, Cases
Inventory ManagementInventory TurnsFill Rates
Material Handling SystemsPallet Storage/Retrieval Systems; Case Handling Systems; Broken Case Storage Retrieval Systems
WMS/Information Handling SystemsWMS - Yes/No, Package or In-HouseWMS PlansWMS SatisfactionWMS ImpactCommunication Systems
WorkforceWorkforce TurnoverWorkforce IssuesOperator to Supervisor Ratio
MetricsProductivity MetricsQuality MetricsCycle Time Metrics
PracticesThe “Perfect” Warehouse
Page 4
2005 TLI/WERC Warehouse Benchmarking Survey - © Edward H. Frazelle, Ph.D. 4
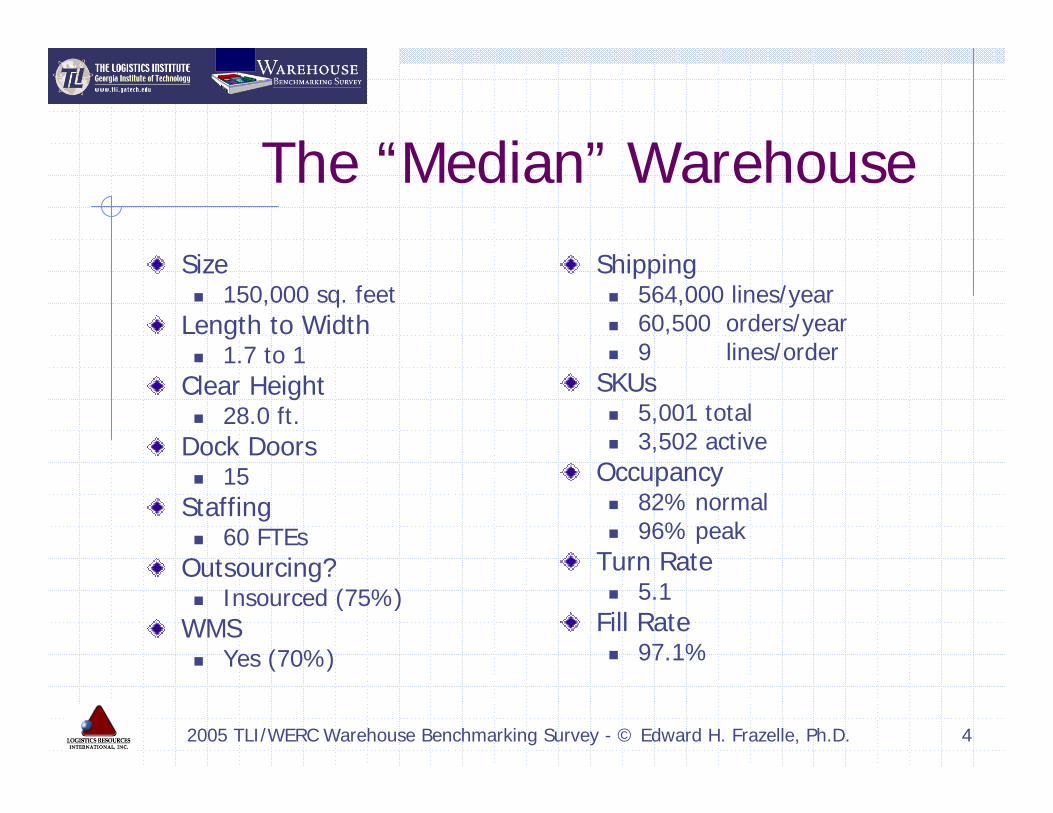
The “Median” WarehouseSize
150,000 sq. feetLength to Width
1.7 to 1Clear Height
28.0 ft.Dock Doors
15Staffing
60 FTEsOutsourcing?
Insourced (75%)WMS
Yes (70%)
Shipping564,000 lines/year60,500 orders/year9 lines/order
SKUs5,001 total3,502 active
Occupancy82% normal96% peak
Turn Rate 5.1
Fill Rate97.1%
Page 5
2005 TLI/WERC Warehouse Benchmarking Survey - © Edward H. Frazelle, Ph.D. 5
Warehouse Quality Index (WQI)
Warehouse Quality Index =Shipping Accuracy x Inventory AccuracyShipping Accuracy =% Order Lines Shipped without ErrorsInventory Accuracy =% Warehouse Locations without DiscrepanciesAll warehouses were ranked based their WQI and a WQI rank % calculated as the ratio of the rank to the total warehouses. Those warehouses with lower WQI rank %s have the highest quality performance.
Page 6
2005 TLI/WERC Warehouse Benchmarking Survey - © Edward H. Frazelle, Ph.D. 6
Warehouse Productivity Rank %
All warehouses were classified as piece shipping or case shipping warehouses.All piece shipping warehouses were ranked based on their productivity performance calculated as the ratio of the annual number of order lines shipped to the annual total person-hours expended in the warehouse. The warehouse with the highest productivity received the rank of 1; the warehouse with the second highest productivity received the rank of 2; and so on. The warehouse productivity rank % is the ranking divided by the number of warehouses in the classification with legitimate responses in the survey. The LOWER the RANK %, the HIGHER THE PRODUCTIVITY.All case shipping warehouses were ranked based on their productivity performance calculated as the ratio of the annual number of cases shipped to the annual total person-hours expended in the warehouse. The warehouse productivity rank % is the ranking divided by the number of warehouses in the classification with legitimate responses in the survey. The LOWER the RANK %, the HIGHER THE PRODUCTIVITY.
Page 7
2005 TLI/WERC Warehouse Benchmarking Survey - © Edward H. Frazelle, Ph.D. 7
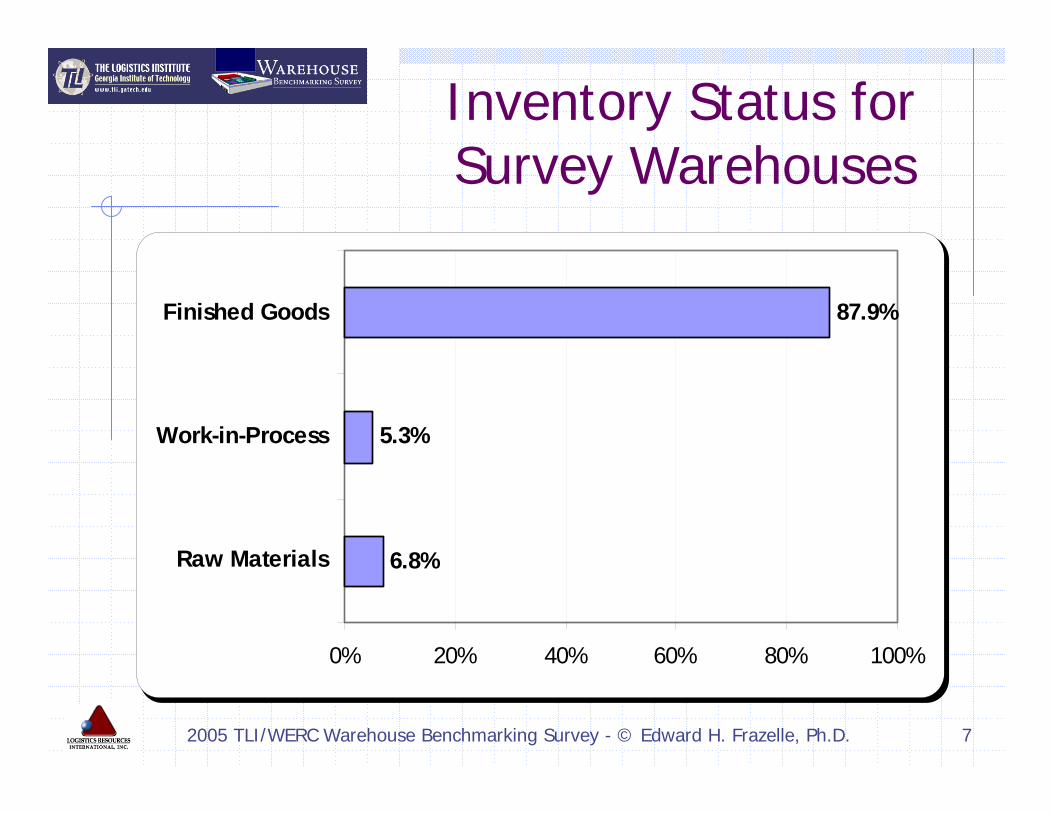
Inventory Status for Survey Warehouses
6.8%
5.3%
87.9%
0% 20% 40% 60% 80% 100%
Raw Materials
Work-in-Process
Finished Goods
Page 8
2005 TLI/WERC Warehouse Benchmarking Survey - © Edward H. Frazelle, Ph.D. 8
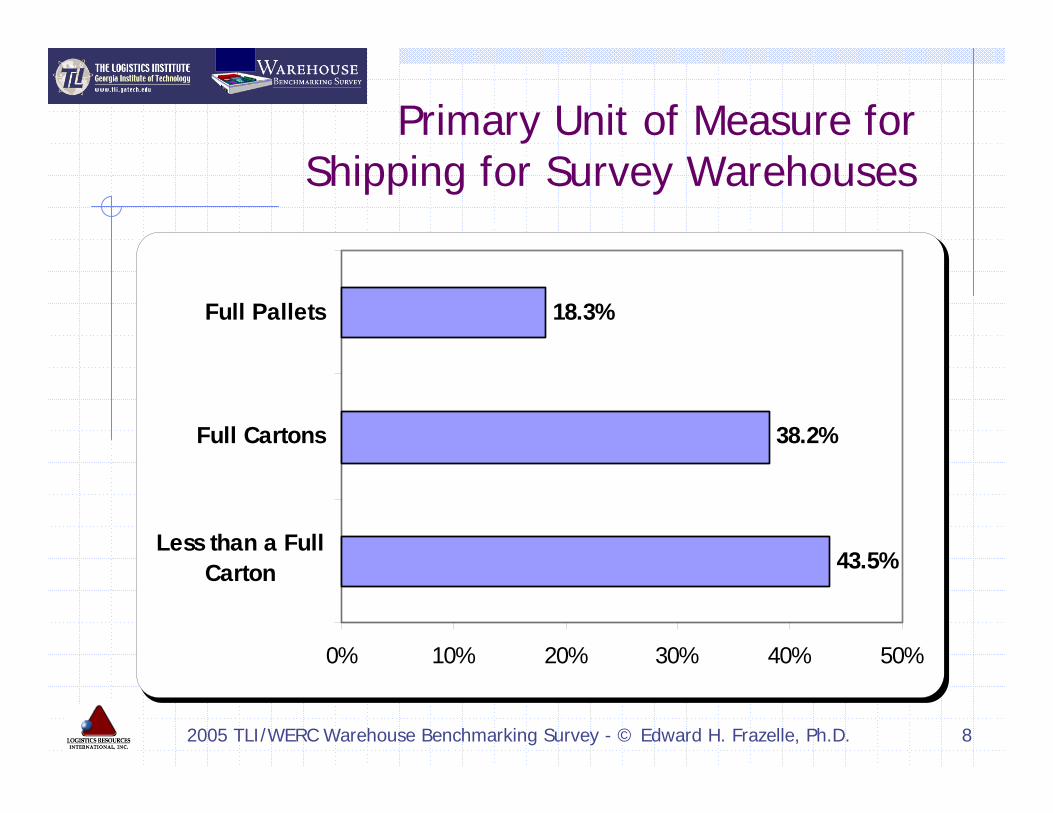
Primary Unit of Measure for Shipping for Survey Warehouses
43.5%
38.2%
18.3%
0% 10% 20% 30% 40% 50%
Less than a FullCarton
Full Cartons
Full Pallets
Page 9
2005 TLI/WERC Warehouse Benchmarking Survey - © Edward H. Frazelle, Ph.D. 9
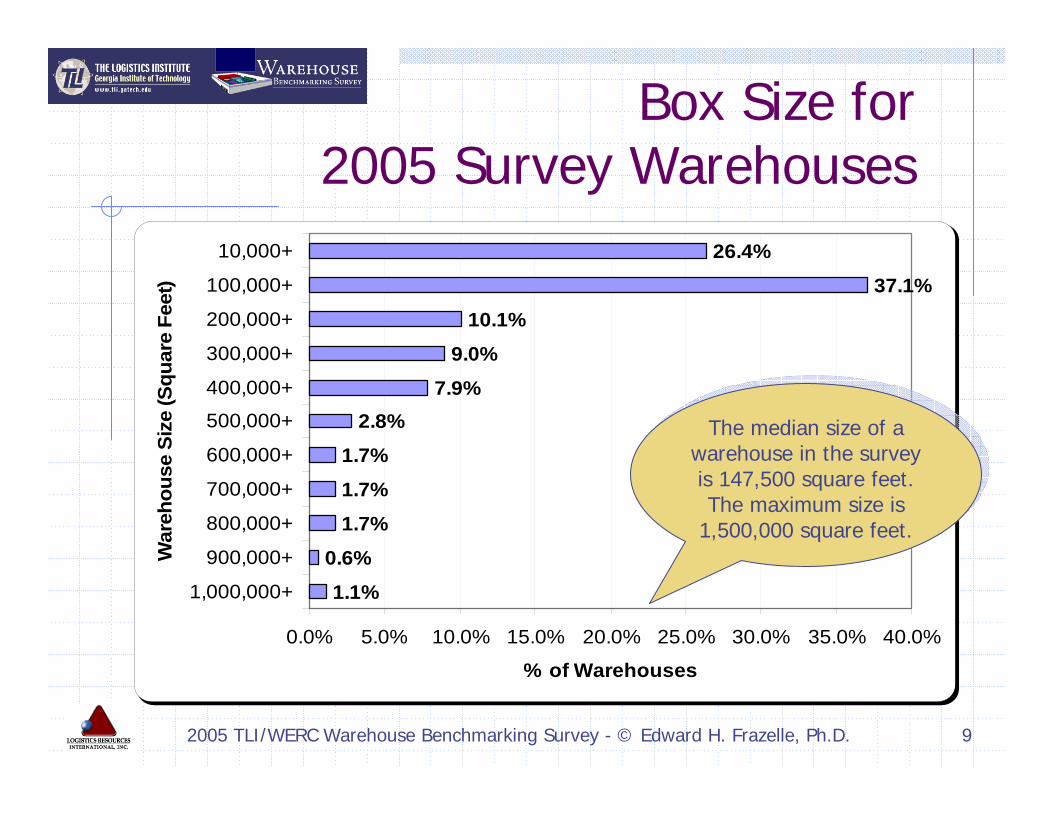
1.1%
0.6%
1.7%
1.7%
1.7%
2.8%7.9%
9.0%
10.1%
37.1%
26.4%
0.0% 5.0% 10.0% 15.0% 20.0% 25.0% 30.0% 35.0% 40.0%
1,000,000+
900,000+
800,000+
700,000+
600,000+
500,000+
400,000+
300,000+
200,000+
100,000+
10,000+
War
ehou
se S
ize
(Squ
are
Feet
)
% of Warehouses
Box Size for 2005 Survey Warehouses
The median size of a warehouse in the survey is 147,500 square feet. The maximum size is
1,500,000 square feet.
The median size of a warehouse in the survey is 147,500 square feet. The maximum size is
1,500,000 square feet.
Page 10
2005 TLI/WERC Warehouse Benchmarking Survey - © Edward H. Frazelle, Ph.D. 10
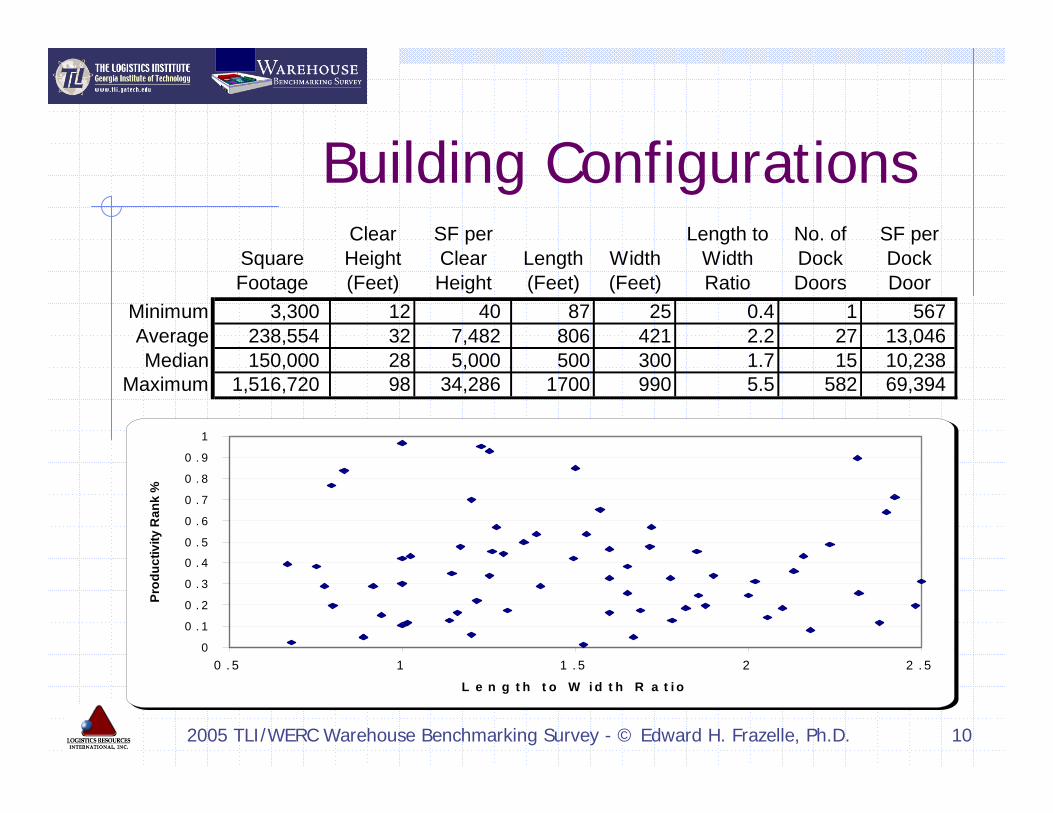
Building ConfigurationsSquare Footage
Clear Height (Feet)
SF per Clear Height
Length (Feet)
Width (Feet)
Length to Width Ratio
No. of Dock Doors
SF per Dock Door
Minimum 3,300 12 40 87 25 0.4 1 567 Average 238,554 32 7,482 806 421 2.2 27 13,046 Median 150,000 28 5,000 500 300 1.7 15 10,238
Maximum 1,516,720 98 34,286 1700 990 5.5 582 69,394
0
0 . 1
0 . 2
0 . 3
0 . 4
0 . 5
0 . 6
0 . 7
0 . 8
0 . 9
1
0 . 5 1 1 . 5 2 2 . 5
L e n g t h t o W i d t h R a t i o
Prod
uctiv
ity R
ank
%
Page 11
2005 TLI/WERC Warehouse Benchmarking Survey - © Edward H. Frazelle, Ph.D. 11
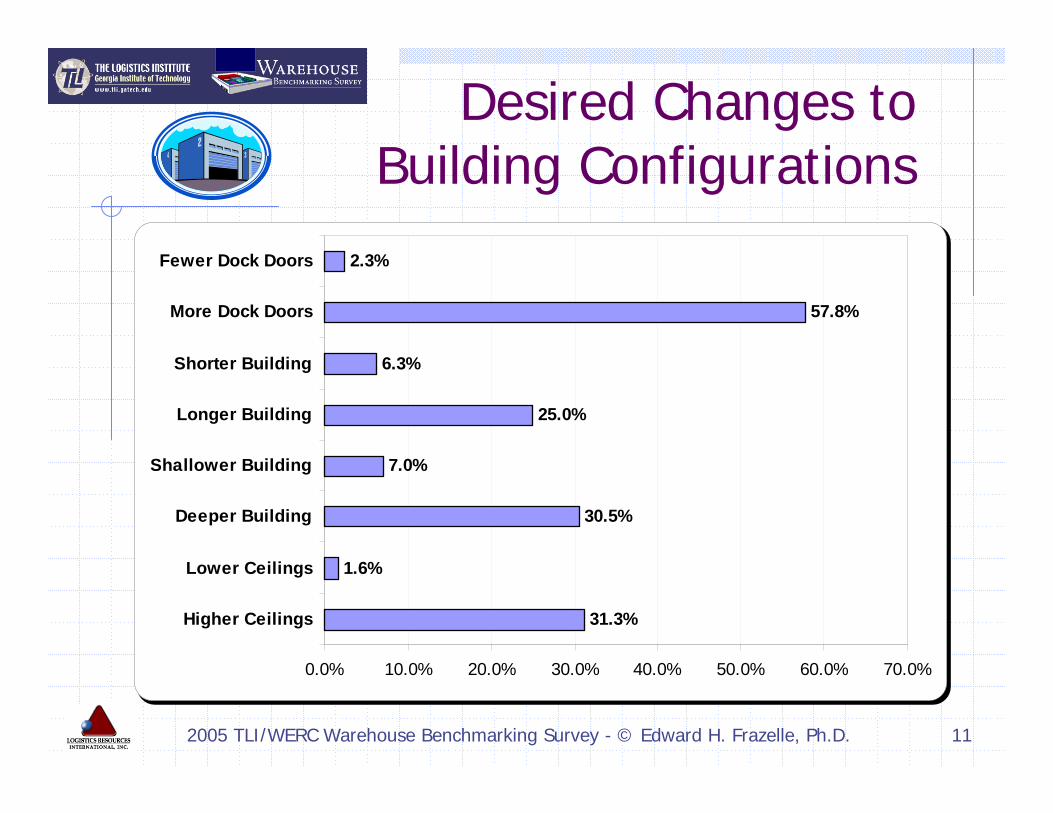
Desired Changes to Building Configurations
31.3%
1.6%
30.5%
7.0%
25.0%
6.3%
57.8%
2.3%
0.0% 10.0% 20.0% 30.0% 40.0% 50.0% 60.0% 70.0%
Higher Ceilings
Lower Ceilings
Deeper Building
Shallower Building
Longer Building
Shorter Building
More Dock Doors
Fewer Dock Doors
Page 12
2005 TLI/WERC Warehouse Benchmarking Survey - © Edward H. Frazelle, Ph.D. 12
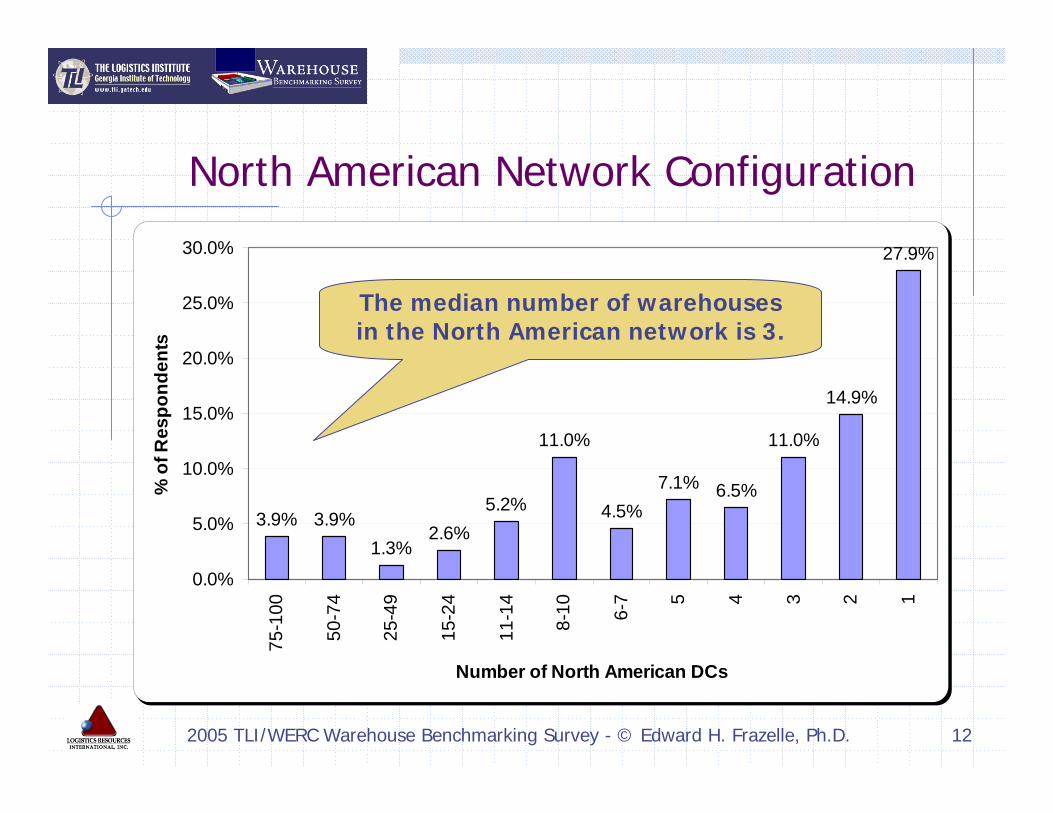
North American Network Configuration
3.9% 3.9%1.3%
2.6%5.2%
11.0%
4.5%7.1% 6.5%
11.0%
14.9%
27.9%
0.0%
5.0%
10.0%
15.0%
20.0%
25.0%
30.0%75
-100
50-7
4
25-4
9
15-2
4
11-1
4
8-10 6-
7 5 4 3 2 1
Number of North American DCs
% o
f Res
pond
ents
The median number of warehouses in the North American network is 3.
Page 13
2005 TLI/WERC Warehouse Benchmarking Survey - © Edward H. Frazelle, Ph.D. 13
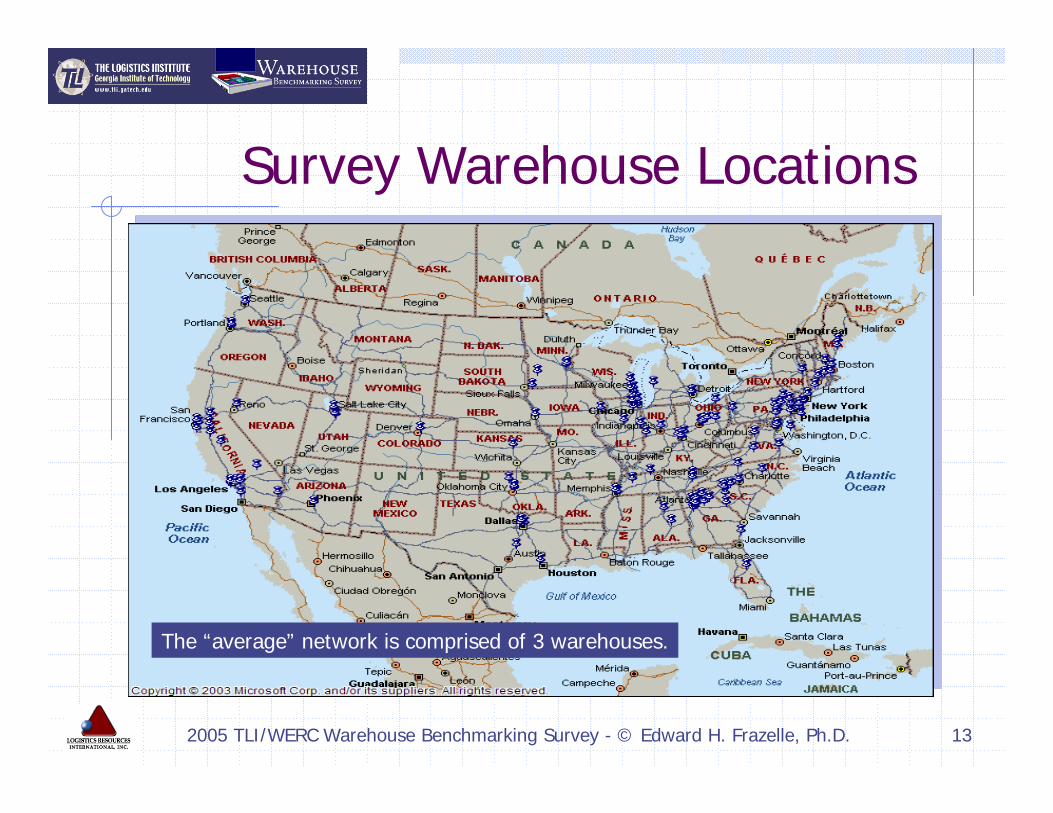
Survey Warehouse Locations
The “average” network is comprised of 3 warehouses.
Page 14
2005 TLI/WERC Warehouse Benchmarking Survey - © Edward H. Frazelle, Ph.D. 14
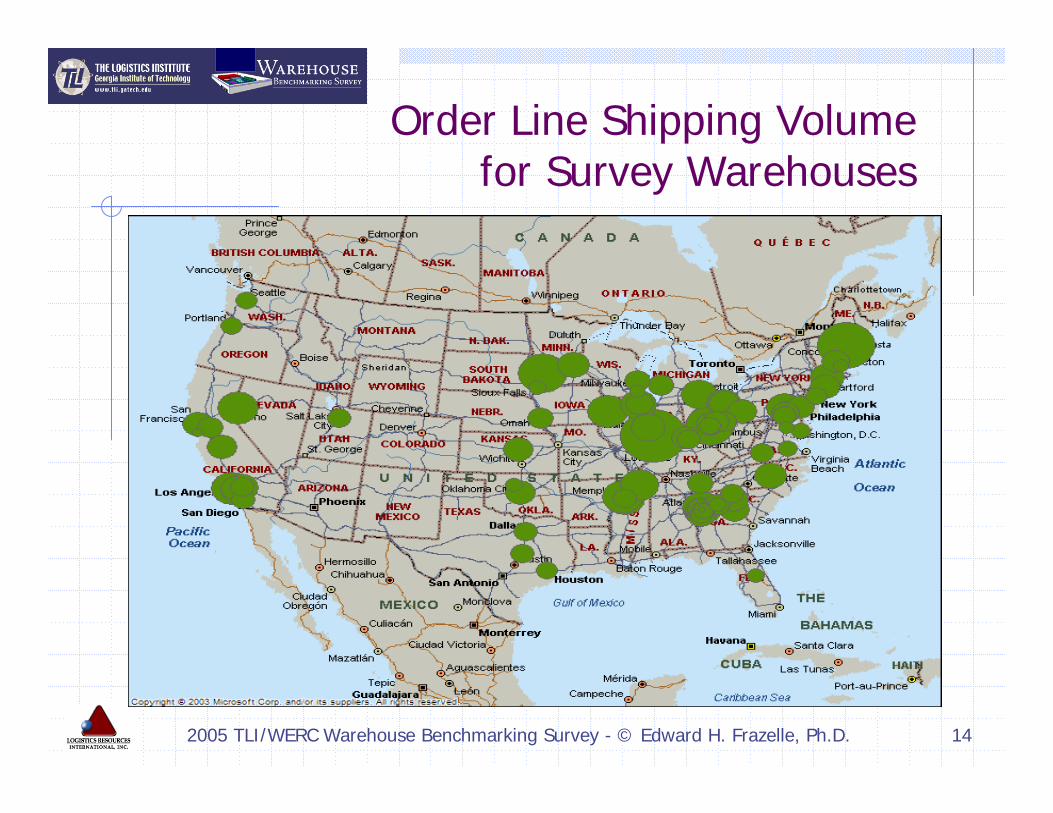
Order Line Shipping Volume for Survey Warehouses
Page 15
2005 TLI/WERC Warehouse Benchmarking Survey - © Edward H. Frazelle, Ph.D. 15
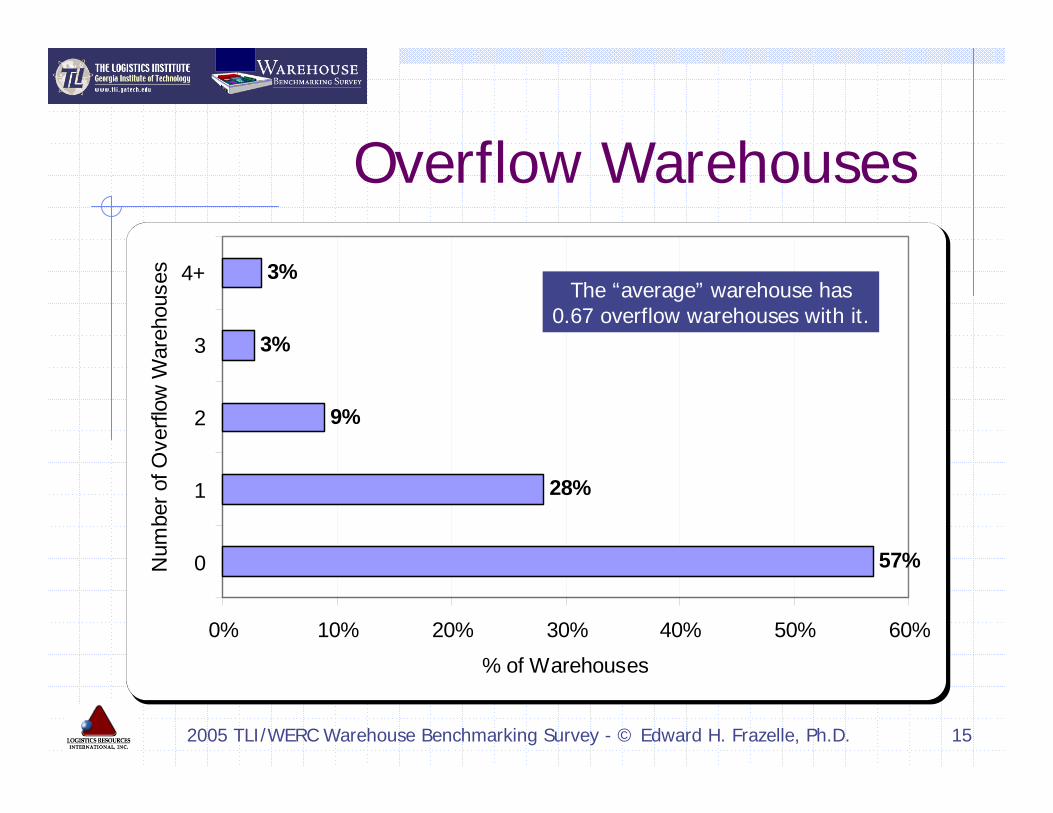
Overflow Warehouses
57%
28%
9%
3%
3%
0% 10% 20% 30% 40% 50% 60%
0
1
2
3
4+
Num
ber o
f Ove
rflow
War
ehou
ses
% of Warehouses
The “average” warehouse has0.67 overflow warehouses with it.
Page 16
2005 TLI/WERC Warehouse Benchmarking Survey - © Edward H. Frazelle, Ph.D. 16
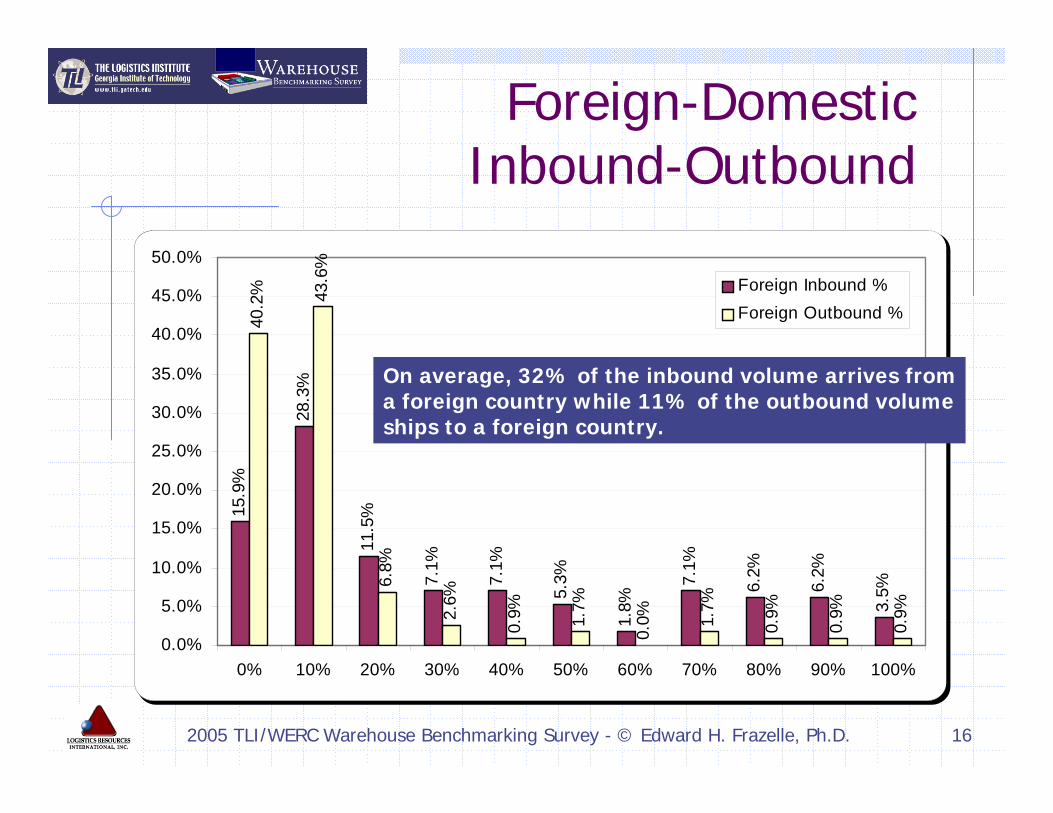
Foreign-Domestic Inbound-Outbound
15.9
%
28.3
%
11.5
%
7.1%
7.1%
5.3%
1.8%
7.1%
6.2%
6.2%
3.5%
40.2
% 43.6
%
6.8%
2.6%
0.9% 1.7%
0.0% 1.
7%
0.9%
0.9%
0.9%
0.0%
5.0%
10.0%
15.0%
20.0%
25.0%
30.0%
35.0%
40.0%
45.0%
50.0%
0% 10% 20% 30% 40% 50% 60% 70% 80% 90% 100%
Foreign Inbound %Foreign Outbound %
On average, 32% of the inbound volume arrives froma foreign country while 11% of the outbound volumeships to a foreign country.
Page 17
2005 TLI/WERC Warehouse Benchmarking Survey - © Edward H. Frazelle, Ph.D. 17
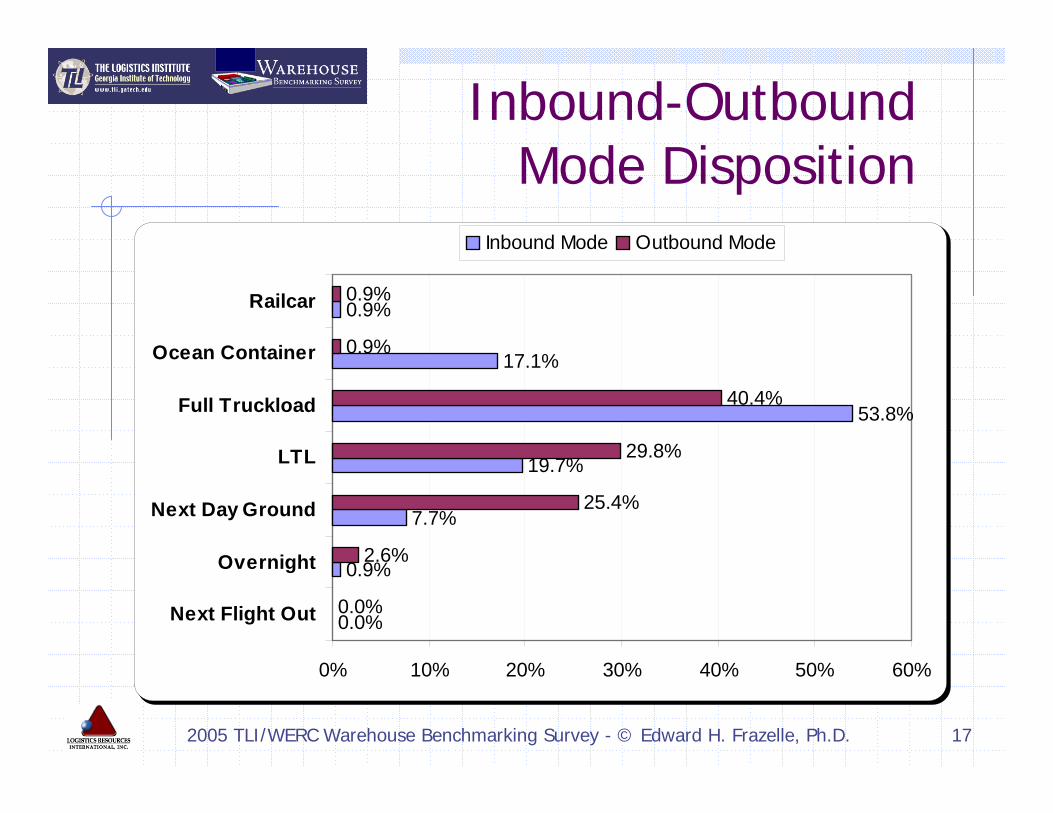
Inbound-Outbound Mode Disposition
0.0%
0.9%
7.7%
19.7%
53.8%
17.1%
0.9%
0.0%
2.6%
25.4%
29.8%
40.4%
0.9%
0.9%
0% 10% 20% 30% 40% 50% 60%
Next Flight Out
Overnight
Next Day Ground
LTL
Full Truckload
Ocean Container
Railcar
Inbound Mode Outbound Mode
Page 18
2005 TLI/WERC Warehouse Benchmarking Survey - © Edward H. Frazelle, Ph.D. 18
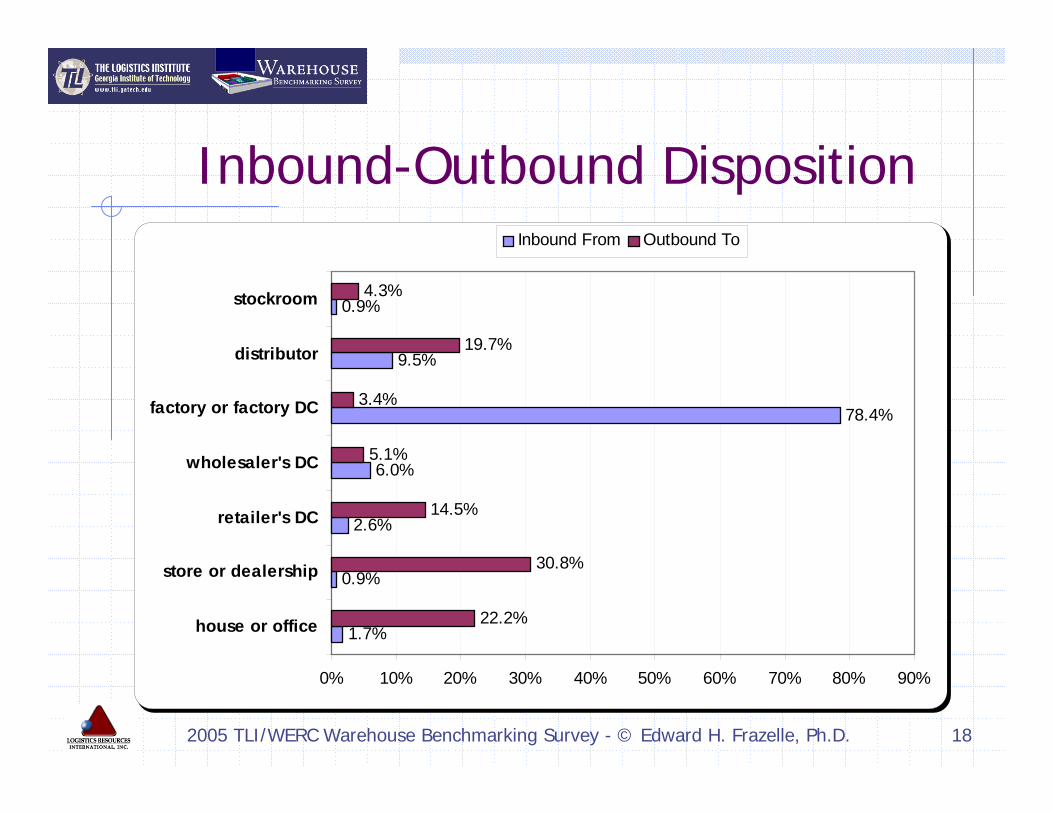
Inbound-Outbound Disposition
1.7%
0.9%
2.6%
6.0%
78.4%
9.5%
0.9%
22.2%
30.8%
14.5%
5.1%
3.4%
19.7%
4.3%
0% 10% 20% 30% 40% 50% 60% 70% 80% 90%
house or office
store or dealership
retailer's DC
wholesaler's DC
factory or factory DC
distributor
stockroom
Inbound From Outbound To
Page 19
2005 TLI/WERC Warehouse Benchmarking Survey - © Edward H. Frazelle, Ph.D. 19
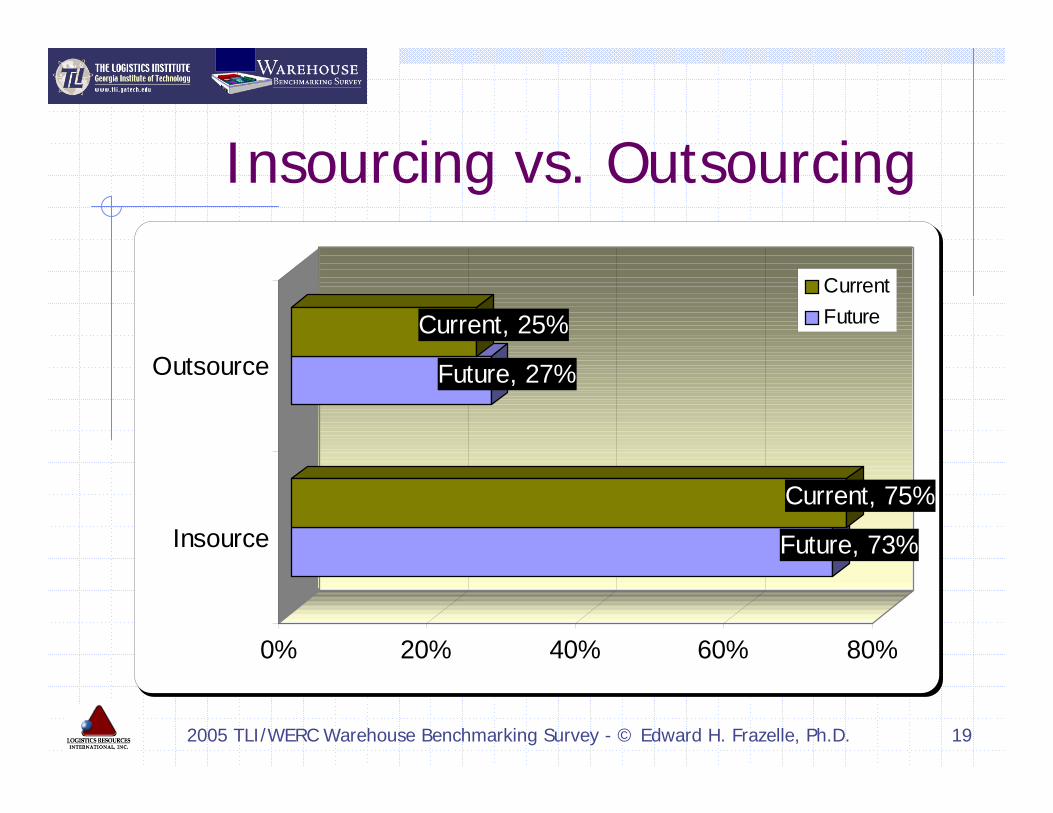
Insourcing vs. Outsourcing
Future, 73%
Current, 75%
Future, 27%
Current, 25%
0% 20% 40% 60% 80%
Insource
Outsource
CurrentFuture
Page 20
2005 TLI/WERC Warehouse Benchmarking Survey - © Edward H. Frazelle, Ph.D. 20
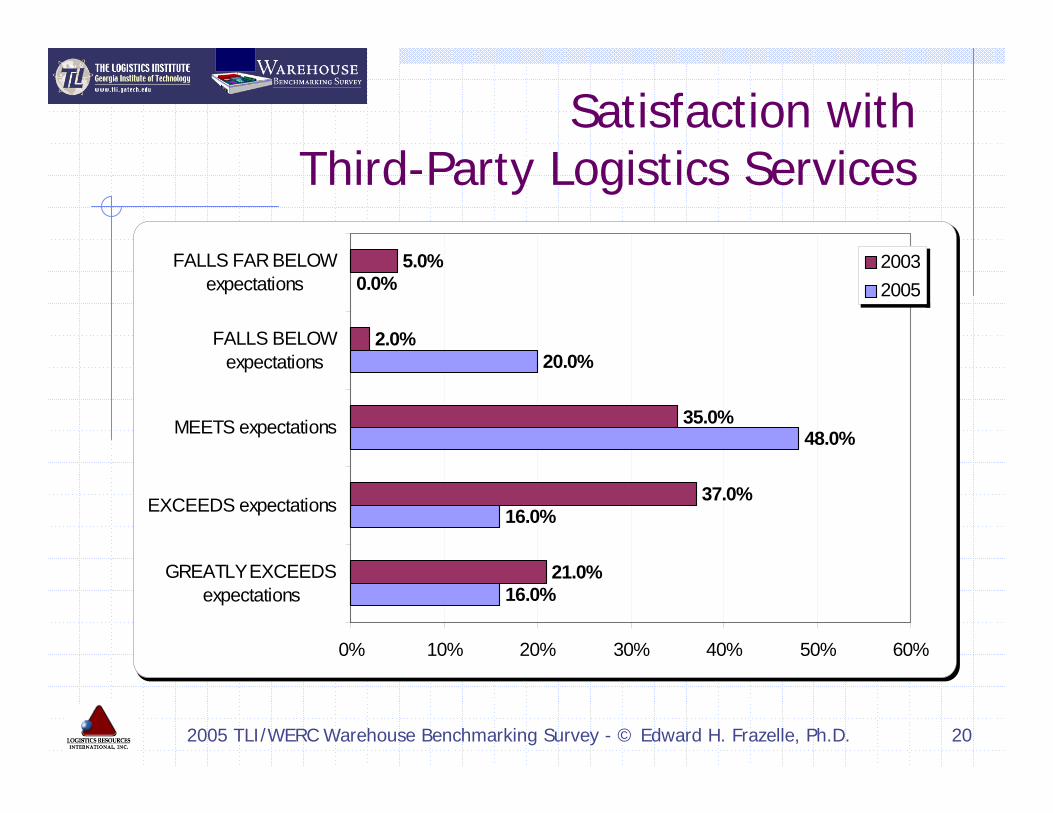
Satisfaction with Third-Party Logistics Services
16.0%
16.0%
48.0%
20.0%
0.0%
21.0%
37.0%
35.0%
2.0%
5.0%
0% 10% 20% 30% 40% 50% 60%
GREATLY EXCEEDSexpectations
EXCEEDS expectations
MEETS expectations
FALLS BELOWexpectations
FALLS FAR BELOWexpectations
20032005
Page 21
2005 TLI/WERC Warehouse Benchmarking Survey - © Edward H. Frazelle, Ph.D. 21
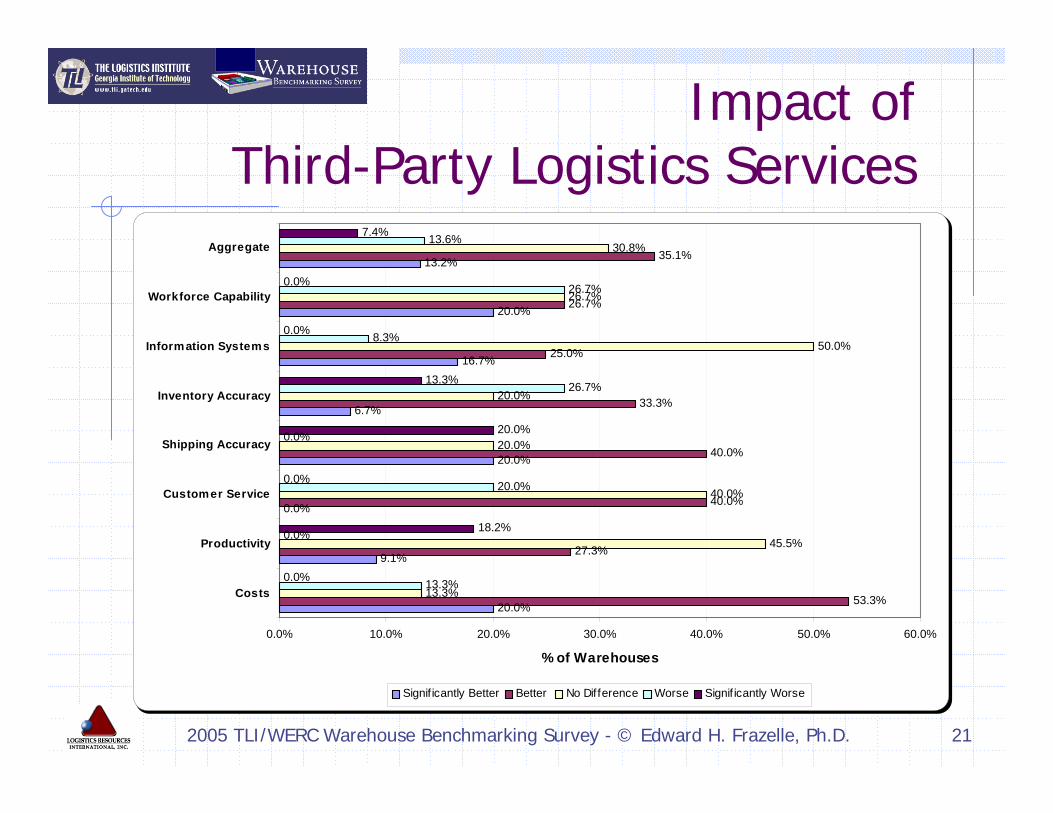
Impact of Third-Party Logistics Services
20.0%
9.1%
0.0%
20.0%
6.7%
16.7%
20.0%
13.2%
53.3%
27.3%
40.0%
40.0%
33.3%
25.0%
26.7%
35.1%
13.3%
45.5%
40.0%
20.0%
20.0%
50.0%
26.7%
30.8%
13.3%
0.0%
20.0%
0.0%
26.7%
8.3%
26.7%
13.6%
0.0%
18.2%
0.0%
20.0%
13.3%
0.0%
0.0%
7.4%
0.0% 10.0% 20.0% 30.0% 40.0% 50.0% 60.0%
Costs
Productivity
Customer Service
Shipping Accuracy
Inventory Accuracy
Information Systems
Workforce Capability
Aggregate
% of Warehouses
Signif icantly Better Better No Dif ference Worse Signif icantly Worse
Page 22
2005 TLI/WERC Warehouse Benchmarking Survey - © Edward H. Frazelle, Ph.D. 22
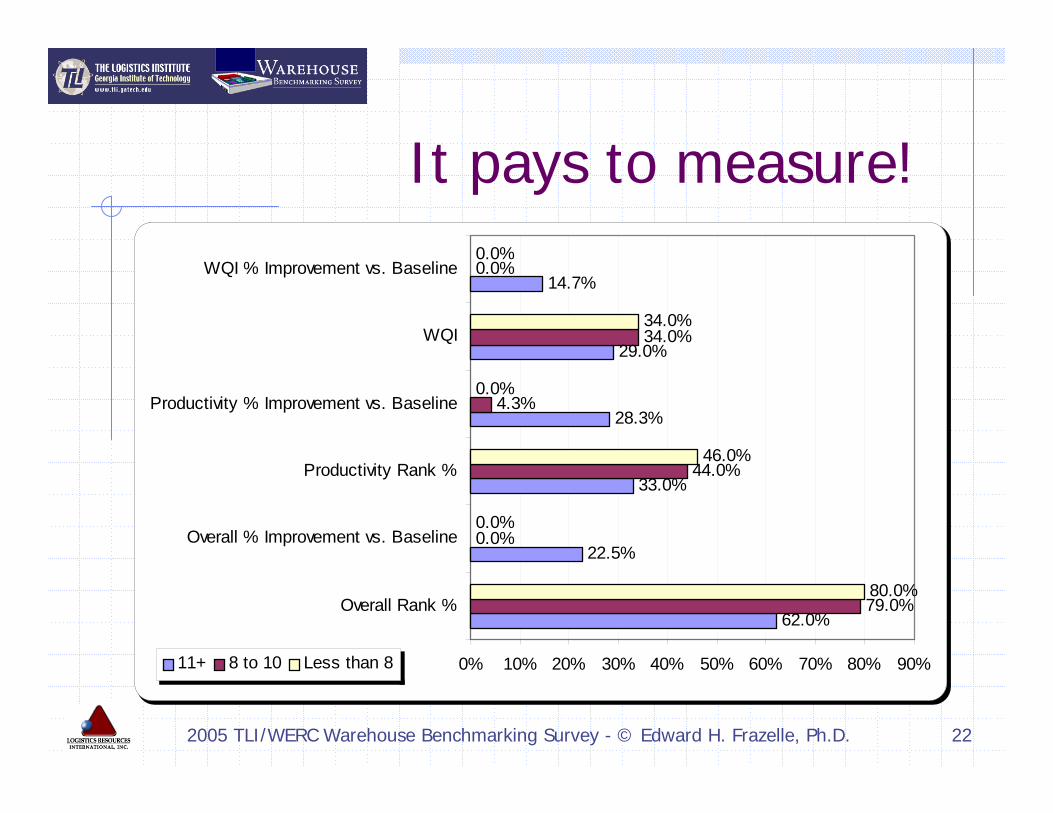
It pays to measure!
62.0%
22.5%
33.0%
28.3%
29.0%
14.7%
79.0%
0.0%
44.0%
4.3%
34.0%
0.0%
80.0%
0.0%
46.0%
0.0%
34.0%
0.0%
0% 10% 20% 30% 40% 50% 60% 70% 80% 90%
Overall Rank %
Overall % Improvement vs. Baseline
Productivity Rank %
Productivity % Improvement vs. Baseline
WQI
WQI % Improvement vs. Baseline
11+ 8 to 10 Less than 8
Page 23
2005 TLI/WERC Warehouse Benchmarking Survey - © Edward H. Frazelle, Ph.D. 23
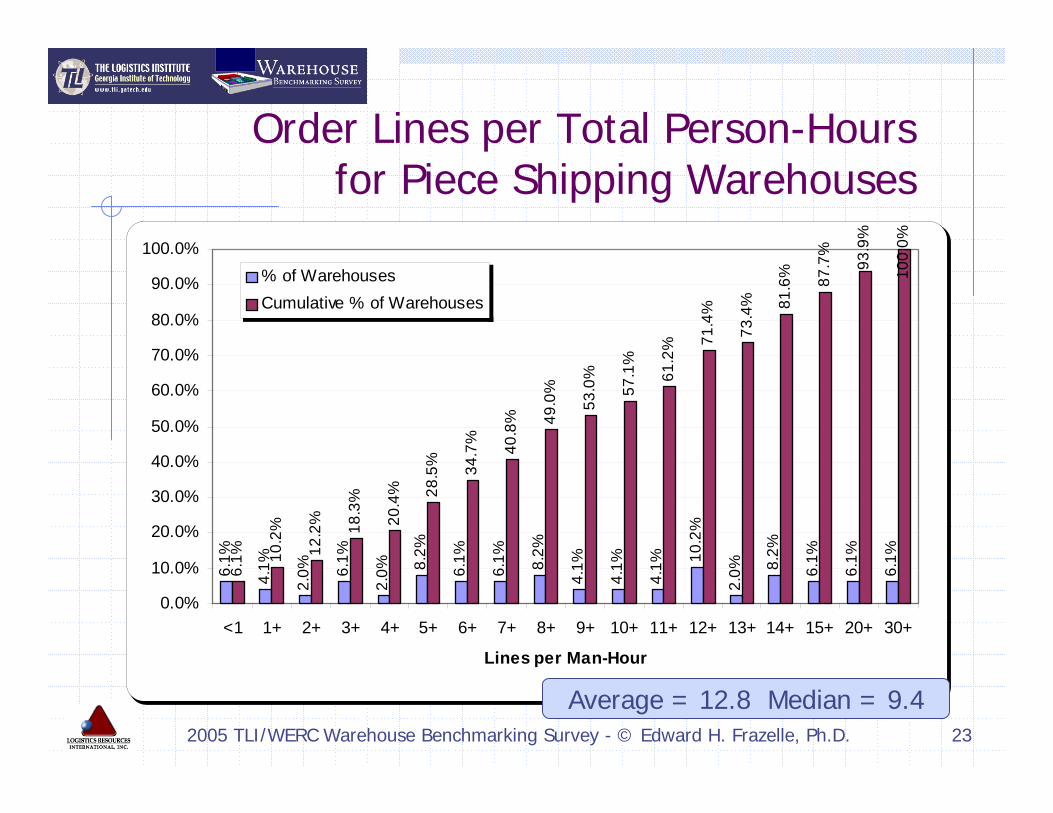
6.1%
4.1%
2.0% 6.
1%
2.0% 8.
2%
6.1%
6.1% 8.2%
4.1%
4.1%
4.1% 10
.2%
2.0% 8.
2%
6.1%
6.1%
6.1%
6.1% 10
.2%
12.2
% 18.3
%
20.4
% 28.5
% 34.7
% 40.8
% 49.0
%
53.0
%
57.1
%
61.2
% 71.4
%
73.4
% 81.6
% 87.7
%
93.9
%
100.
0%
0.0%
10.0%
20.0%
30.0%
40.0%
50.0%
60.0%
70.0%
80.0%
90.0%
100.0%
<1 1+ 2+ 3+ 4+ 5+ 6+ 7+ 8+ 9+ 10+ 11+ 12+ 13+ 14+ 15+ 20+ 30+
Lines per Man-Hour
% of WarehousesCumulative % of Warehouses
Order Lines per Total Person-Hours for Piece Shipping Warehouses
Average = 12.8 Median = 9.4
Page 24
2005 TLI/WERC Warehouse Benchmarking Survey - © Edward H. Frazelle, Ph.D. 24
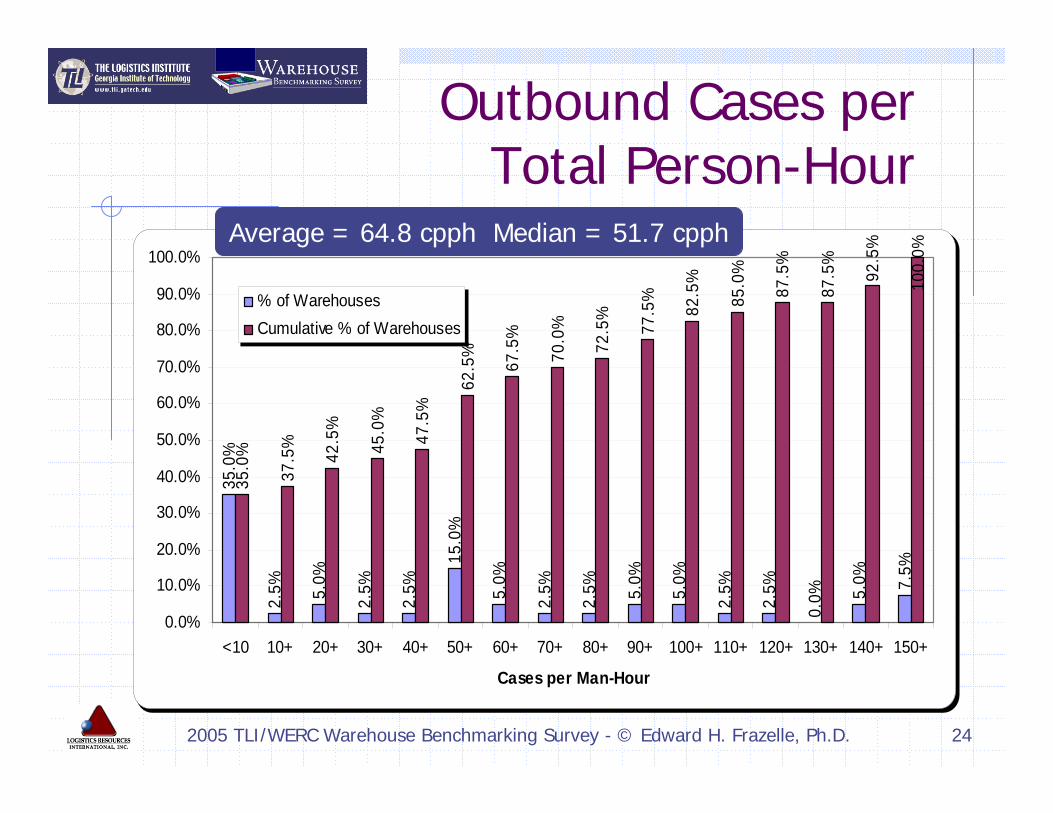
35.0
%
2.5% 5.
0%
2.5%
2.5%
15.0
%
5.0%
2.5%
2.5% 5.
0%
5.0%
2.5%
2.5%
0.0% 5.
0% 7.5%
35.0
%
37.5
%
42.5
%
45.0
%
47.5
%
62.5
%
67.5
%
70.0
%
72.5
%
77.5
%
82.5
%
85.0
%
87.5
%
87.5
%
92.5
%
100.
0%
0.0%
10.0%
20.0%
30.0%
40.0%
50.0%
60.0%
70.0%
80.0%
90.0%
100.0%
<10 10+ 20+ 30+ 40+ 50+ 60+ 70+ 80+ 90+ 100+ 110+ 120+ 130+ 140+ 150+
Cases per Man-Hour
% of WarehousesCumulative % of Warehouses
Outbound Cases per Total Person-Hour
Average = 64.8 cpph Median = 51.7 cpph
Page 25
2005 TLI/WERC Warehouse Benchmarking Survey - © Edward H. Frazelle, Ph.D. 25
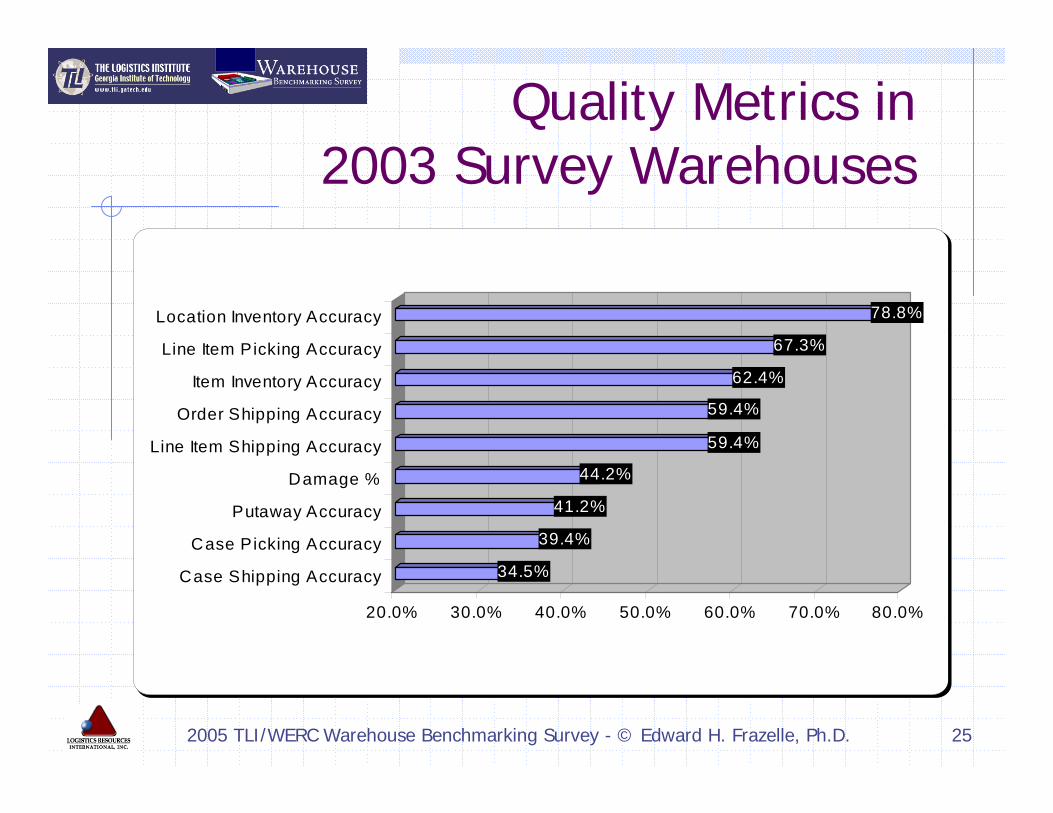
Quality Metrics in 2003 Survey Warehouses
34.5%
39.4%
41.2%
44.2%
59.4%
59.4%
62.4%
67.3%
78.8%
20.0% 30.0% 40.0% 50.0% 60.0% 70.0% 80.0%
Case Shipping Accuracy
Case Picking Accuracy
Putaway Accuracy
Damage %
Line Item Shipping Accuracy
Order Shipping Accuracy
Item Inventory Accuracy
Line Item Picking Accuracy
Location Inventory Accuracy
Page 26
2005 TLI/WERC Warehouse Benchmarking Survey - © Edward H. Frazelle, Ph.D. 26
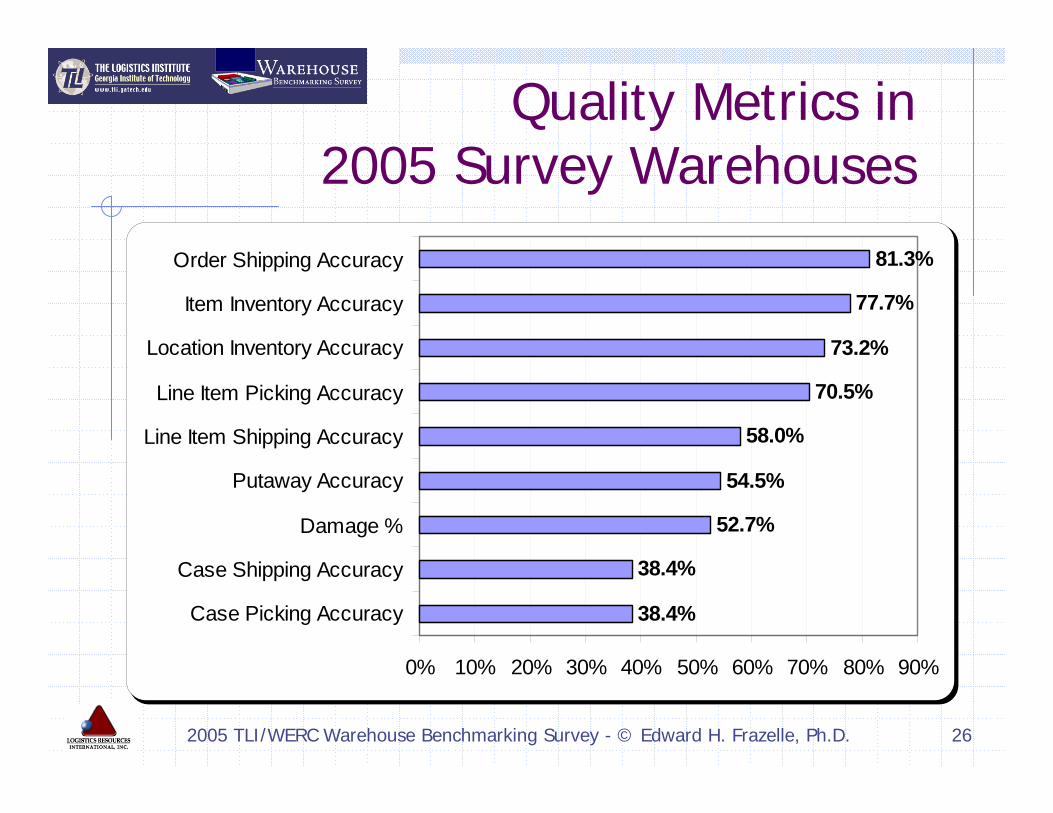
Quality Metrics in 2005 Survey Warehouses
38.4%
38.4%
52.7%
54.5%
58.0%
70.5%
73.2%
77.7%
81.3%
0% 10% 20% 30% 40% 50% 60% 70% 80% 90%
Case Picking Accuracy
Case Shipping Accuracy
Damage %
Putaway Accuracy
Line Item Shipping Accuracy
Line Item Picking Accuracy
Location Inventory Accuracy
Item Inventory Accuracy
Order Shipping Accuracy
Page 27
2005 TLI/WERC Warehouse Benchmarking Survey - © Edward H. Frazelle, Ph.D. 27
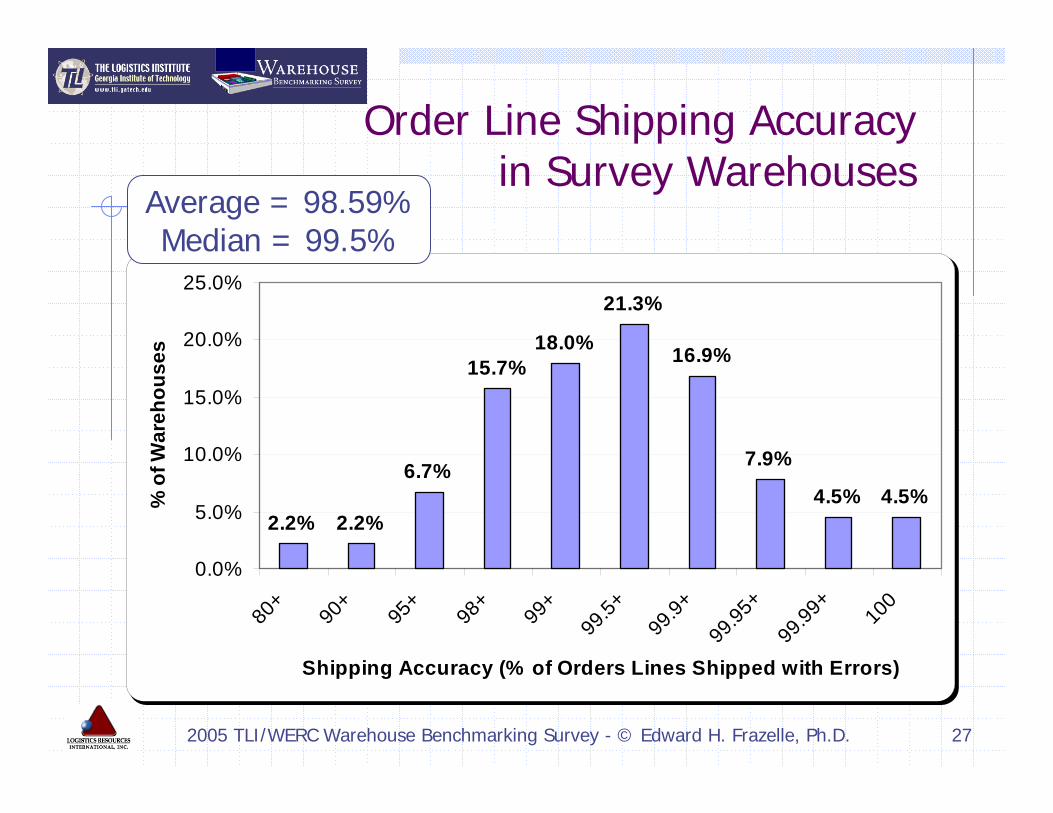
Order Line Shipping Accuracy in Survey Warehouses
2.2% 2.2%
6.7%
15.7%18.0%
21.3%
16.9%
7.9%
4.5% 4.5%
0.0%
5.0%
10.0%
15.0%
20.0%
25.0%
80+
90+
95+
98+
99+
99.5+
99.9+
99.95
+99
.99+
100
Shipping Accuracy (% of Orders Lines Shipped with Errors)
% o
f War
ehou
ses
Average = 98.59%Median = 99.5%
Page 28
2005 TLI/WERC Warehouse Benchmarking Survey - © Edward H. Frazelle, Ph.D. 28
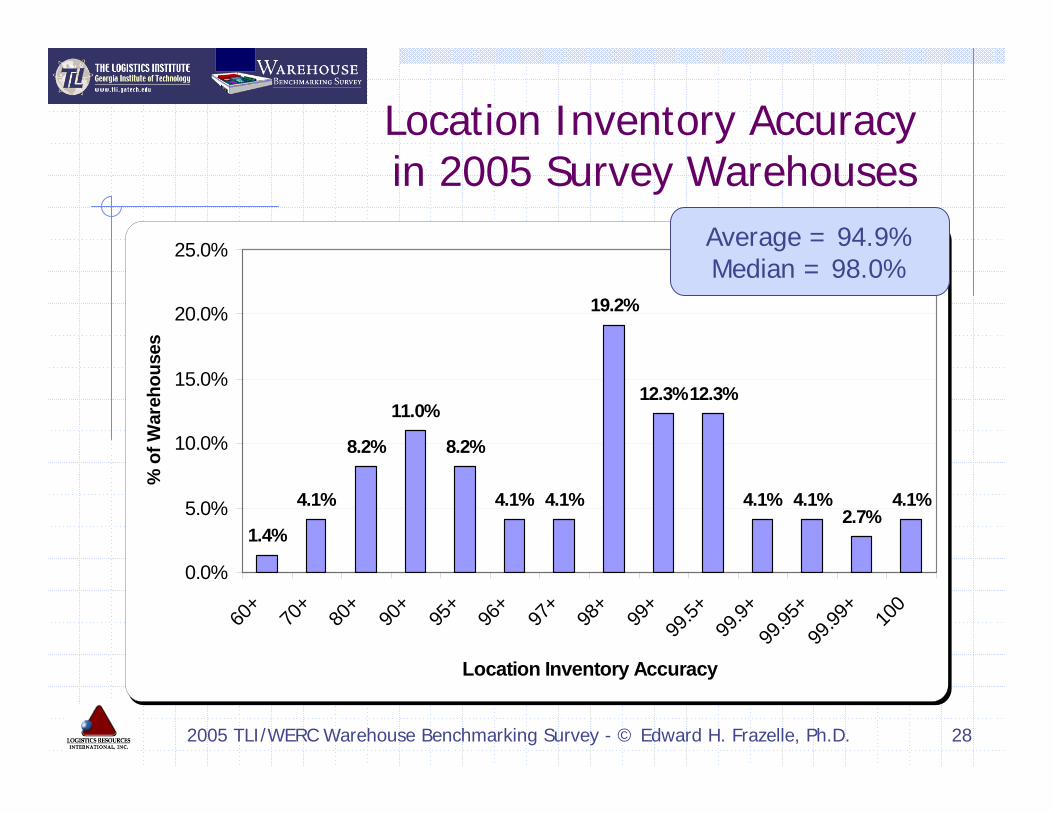
Location Inventory Accuracy in 2005 Survey Warehouses
1.4%
4.1%
8.2%
11.0%
8.2%
4.1% 4.1%
19.2%
12.3%12.3%
4.1% 4.1%2.7%
4.1%
0.0%
5.0%
10.0%
15.0%
20.0%
25.0%
60+
70+
80+
90+
95+
96+
97+
98+
99+
99.5+
99.9+
99.95
+99
.99+
100
Location Inventory Accuracy
% o
f War
ehou
ses
Average = 94.9%Median = 98.0%
Page 29
2005 TLI/WERC Warehouse Benchmarking Survey - © Edward H. Frazelle, Ph.D. 29
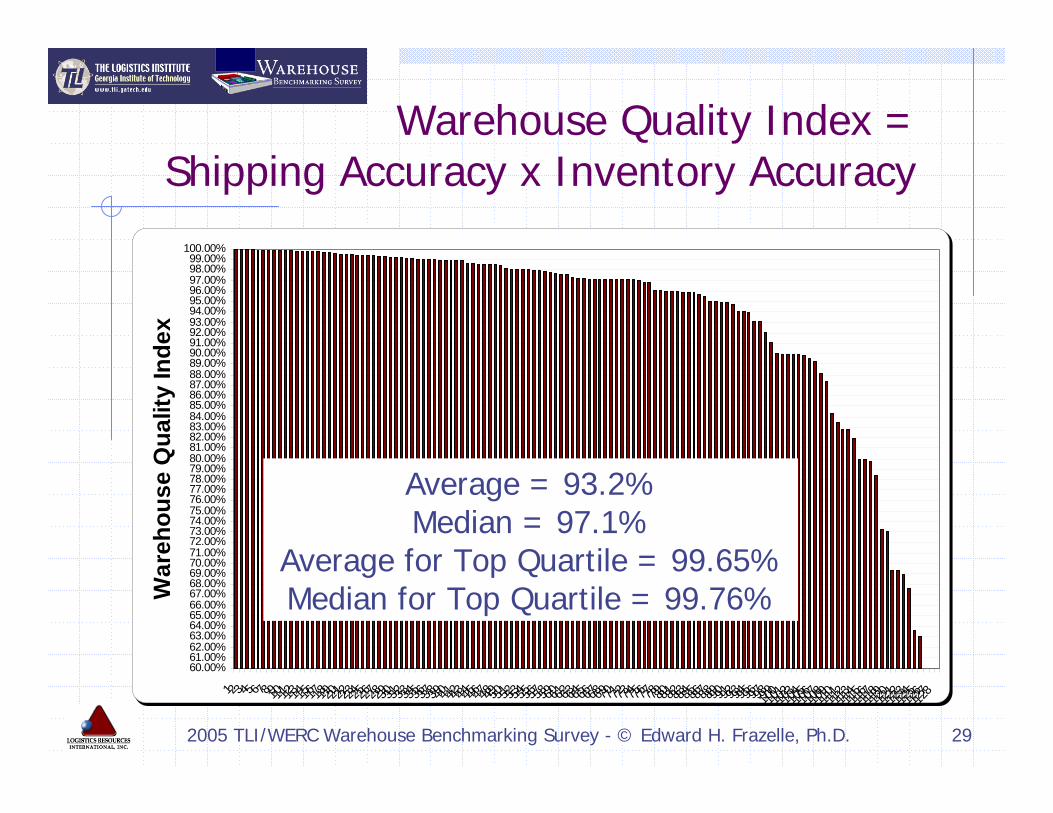
Warehouse Quality Index =Shipping Accuracy x Inventory Accuracy
60.00%61.00%62.00%63.00%64.00%65.00%66.00%67.00%68.00%69.00%70.00%71.00%72.00%73.00%74.00%75.00%76.00%77.00%78.00%79.00%80.00%81.00%82.00%83.00%84.00%85.00%86.00%87.00%88.00%89.00%90.00%91.00%92.00%93.00%94.00%95.00%96.00%97.00%98.00%99.00%
100.00%
123456789101112131415161718192021222324252627282930313233343536373839404142434445464748495051525354555657585960616263646566676869707172737475767778798081828384858687888990919293949596979899100
101
102
103
104
105
106
107
108
109
110
111
112
113
114
115
116
117
118
119
120
121
122
123
124
125
126
127
128
War
ehou
se Q
ualit
y In
dex
Average = 93.2%Median = 97.1%
Average for Top Quartile = 99.65%Median for Top Quartile = 99.76%
Page 30
2005 TLI/WERC Warehouse Benchmarking Survey - © Edward H. Frazelle, Ph.D. 30
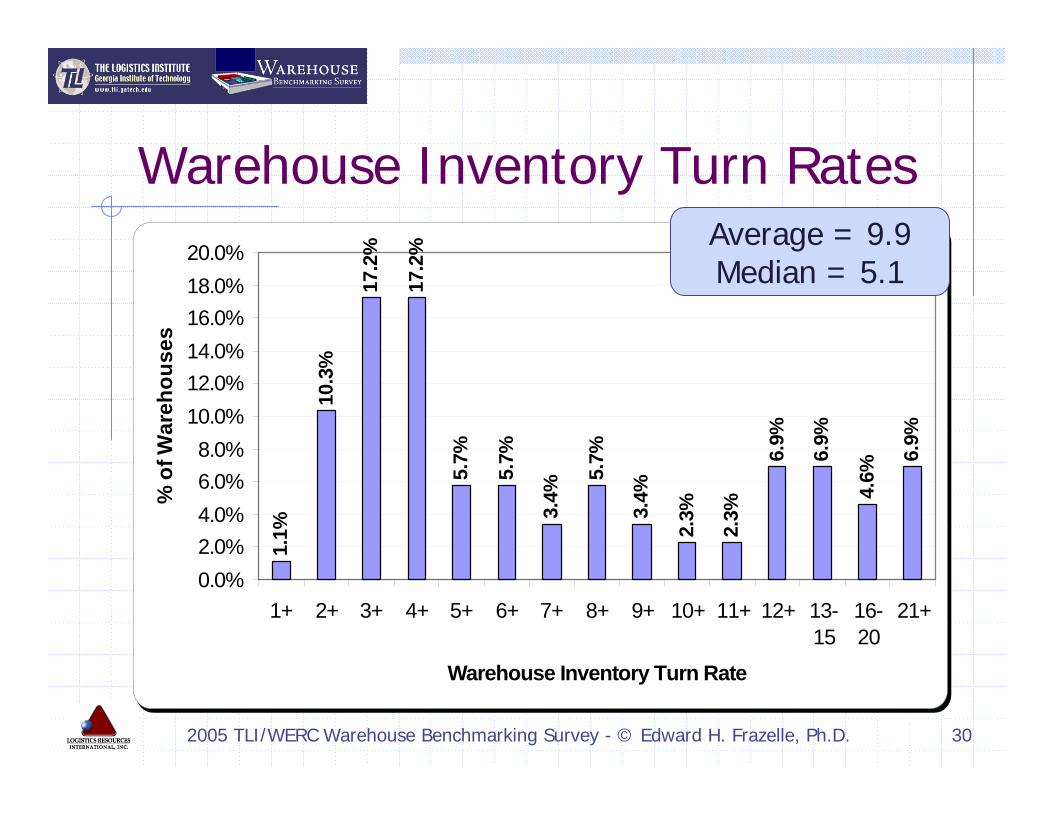
Warehouse Inventory Turn Rates
1.1%
10.3
%
17.2
%
17.2
%
5.7%
5.7%
3.4%
5.7%
3.4%
2.3%
2.3%
6.9%
6.9%
4.6%
6.9%
0.0%2.0%4.0%6.0%8.0%
10.0%12.0%14.0%16.0%18.0%20.0%
1+ 2+ 3+ 4+ 5+ 6+ 7+ 8+ 9+ 10+ 11+ 12+ 13-15
16-20
21+
Warehouse Inventory Turn Rate
% o
f War
ehou
ses
Average = 9.9Median = 5.1
Page 31
2005 TLI/WERC Warehouse Benchmarking Survey - © Edward H. Frazelle, Ph.D. 31
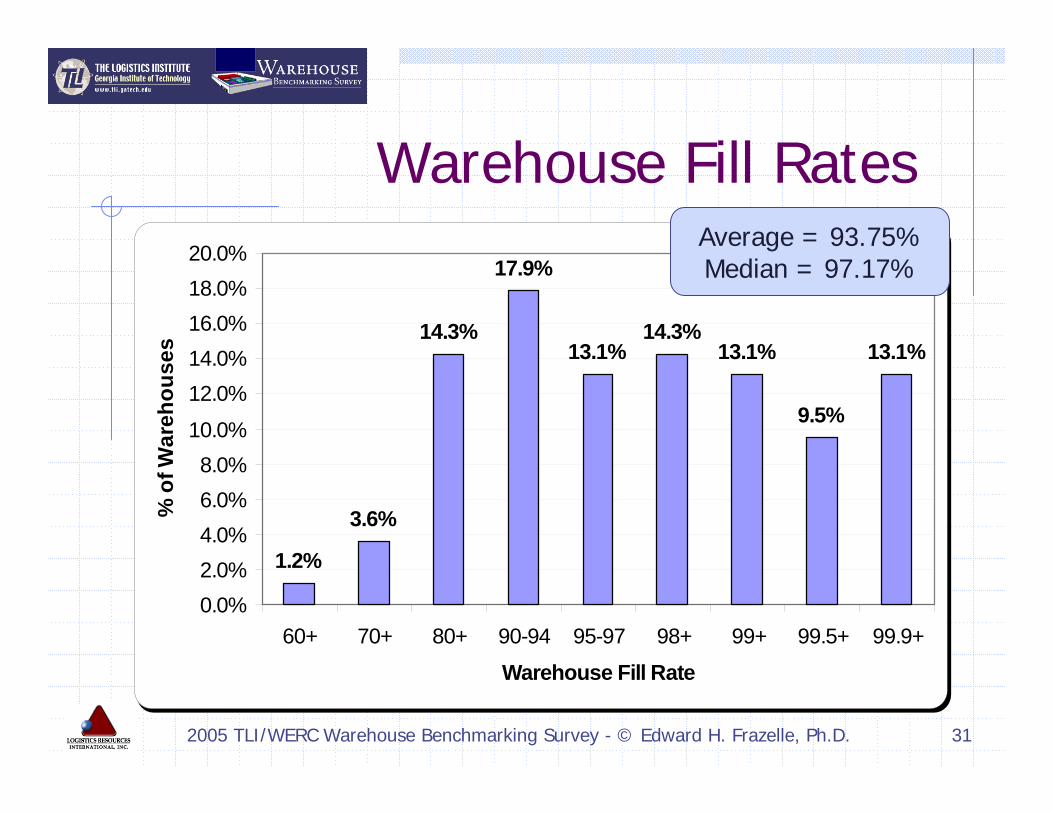
Warehouse Fill Rates
1.2%
3.6%
14.3%
17.9%
13.1%14.3%
13.1%
9.5%
13.1%
0.0%2.0%4.0%6.0%8.0%
10.0%
12.0%14.0%16.0%18.0%20.0%
60+ 70+ 80+ 90-94 95-97 98+ 99+ 99.5+ 99.9+
Warehouse Fill Rate
% o
f War
ehou
ses
Average = 93.75%Median = 97.17%
Page 32
2005 TLI/WERC Warehouse Benchmarking Survey - © Edward H. Frazelle, Ph.D. 32
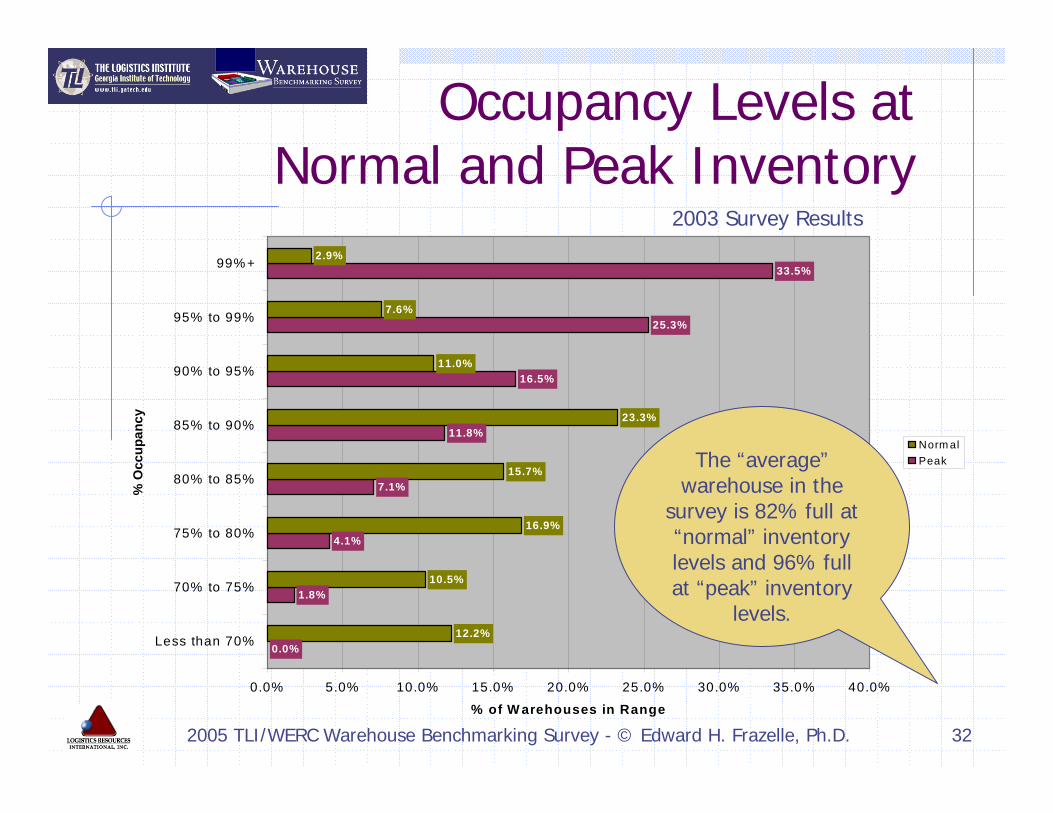
Occupancy Levels at Normal and Peak Inventory
0.0%
1.8%
4.1%
7.1%
11.8%
16.5%
25.3%
33.5%
12.2%
10.5%
16.9%
15.7%
23.3%
11.0%
7.6%
2.9%
0.0% 5.0% 10.0% 15.0% 20.0% 25.0% 30.0% 35.0% 40.0%
Less than 70%
70% to 75%
75% to 80%
80% to 85%
85% to 90%
90% to 95%
95% to 99%
99%+
% O
ccup
ancy
% of W arehouses in Range
Norm alPeakThe “average”
warehouse in the survey is 82% full at “normal” inventory levels and 96% full at “peak” inventory
levels.
2003 Survey Results
Page 33
2005 TLI/WERC Warehouse Benchmarking Survey - © Edward H. Frazelle, Ph.D. 33
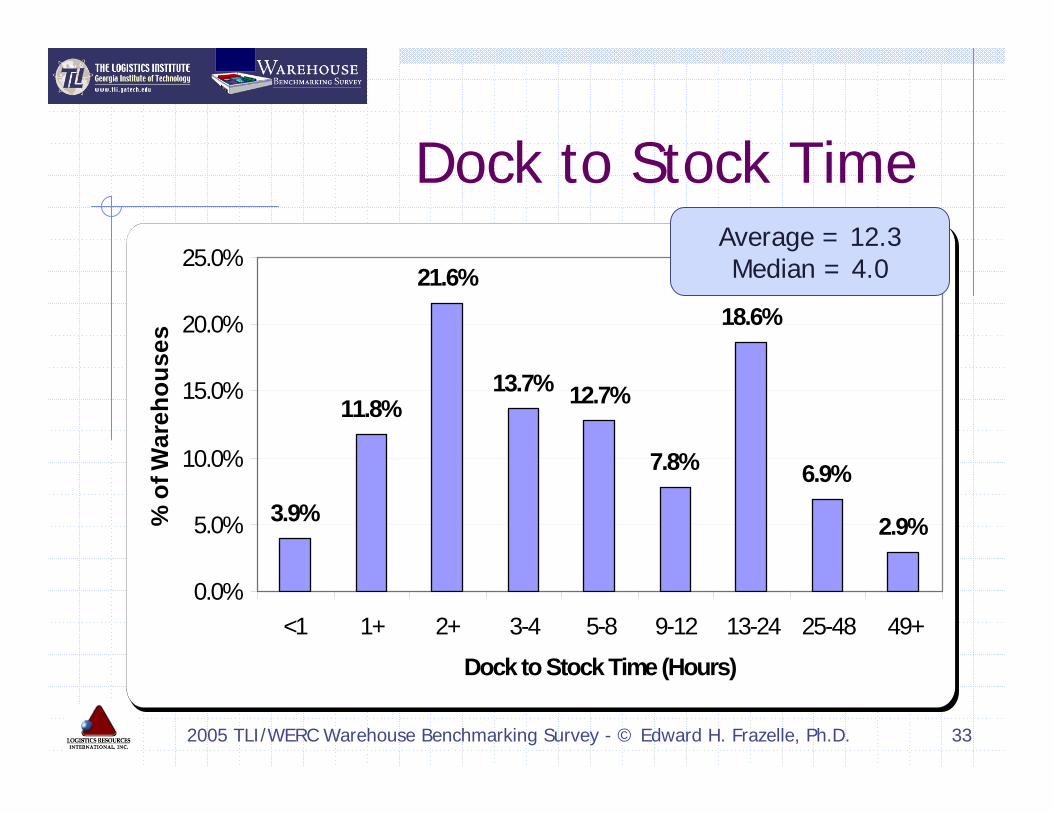
Dock to Stock Time
3.9%
11.8%
21.6%
13.7% 12.7%
7.8%
18.6%
6.9%
2.9%
0.0%
5.0%
10.0%
15.0%
20.0%
25.0%
<1 1+ 2+ 3-4 5-8 9-12 13-24 25-48 49+
Dock to Stock Time (Hours)
% o
f War
ehou
ses
Average = 12.3Median = 4.0
Page 34
2005 TLI/WERC Warehouse Benchmarking Survey - © Edward H. Frazelle, Ph.D. 34
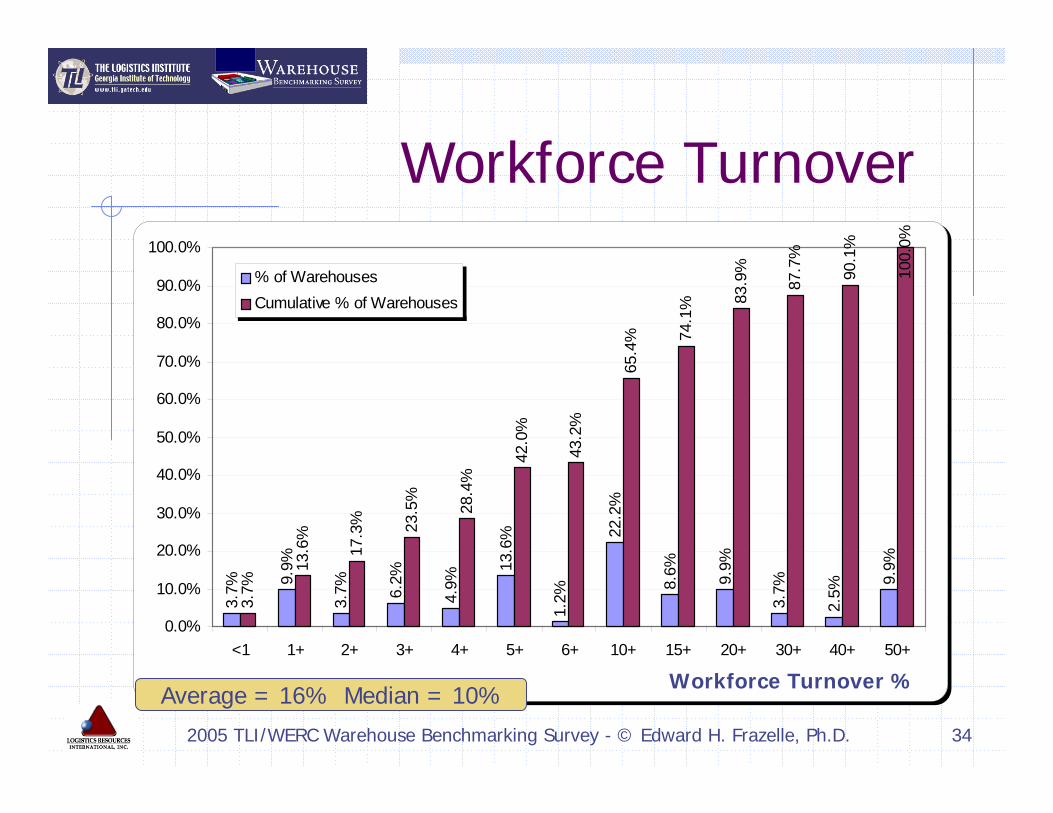
3.7% 9.
9%
3.7% 6.
2%
4.9%
13.6
%
1.2%
22.2
%
8.6% 9.9%
3.7%
2.5%
9.9%
3.7%
13.6
%
17.3
% 23.5
%
28.4
%
42.0
%
43.2
%
65.4
% 74.1
% 83.9
%
87.7
%
90.1
%
100.
0%
0.0%
10.0%
20.0%
30.0%
40.0%
50.0%
60.0%
70.0%
80.0%
90.0%
100.0%
<1 1+ 2+ 3+ 4+ 5+ 6+ 10+ 15+ 20+ 30+ 40+ 50+
% of WarehousesCumulative % of Warehouses
Workforce Turnover
Average = 16% Median = 10%Workforce Turnover %
Page 35
2005 TLI/WERC Warehouse Benchmarking Survey - © Edward H. Frazelle, Ph.D. 35
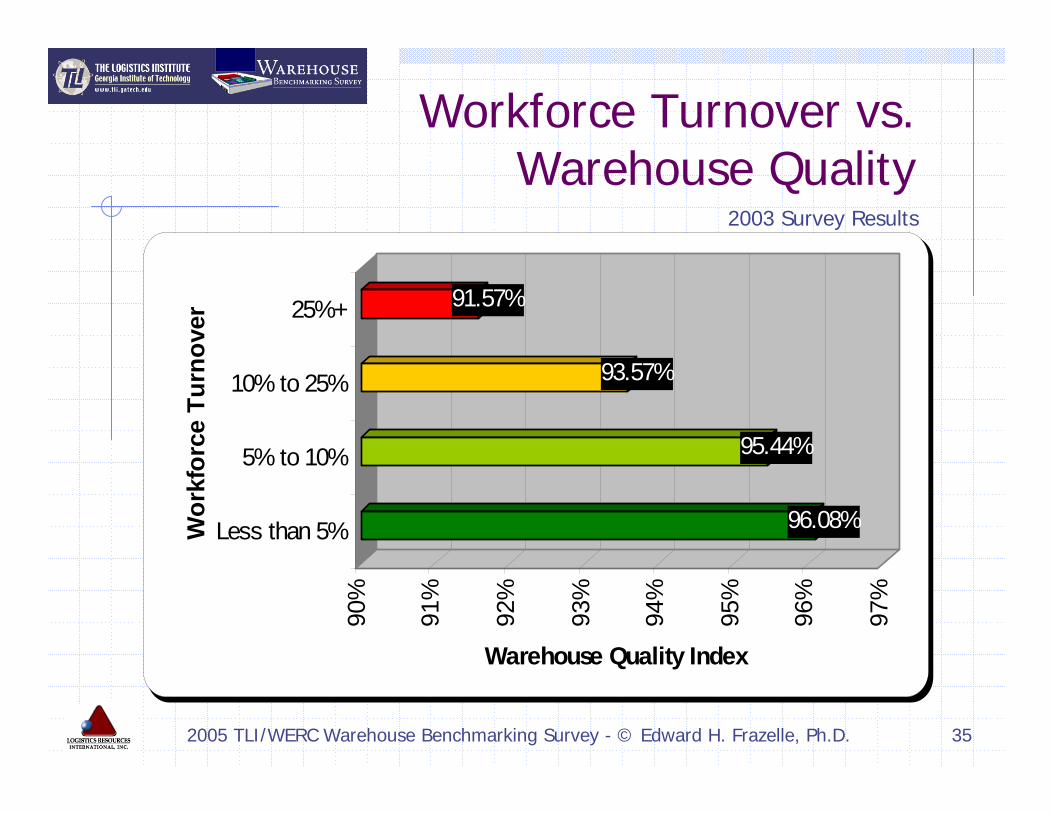
Workforce Turnover vs. Warehouse Quality
96.08%
95.44%
93.57%
91.57%
90%
91%
92%
93%
94%
95%
96%
97%
Warehouse Quality Index
Less than 5%
5% to 10%
10% to 25%
25%+
Wor
kfor
ce T
urno
ver
2003 Survey Results
Page 36
2005 TLI/WERC Warehouse Benchmarking Survey - © Edward H. Frazelle, Ph.D. 36
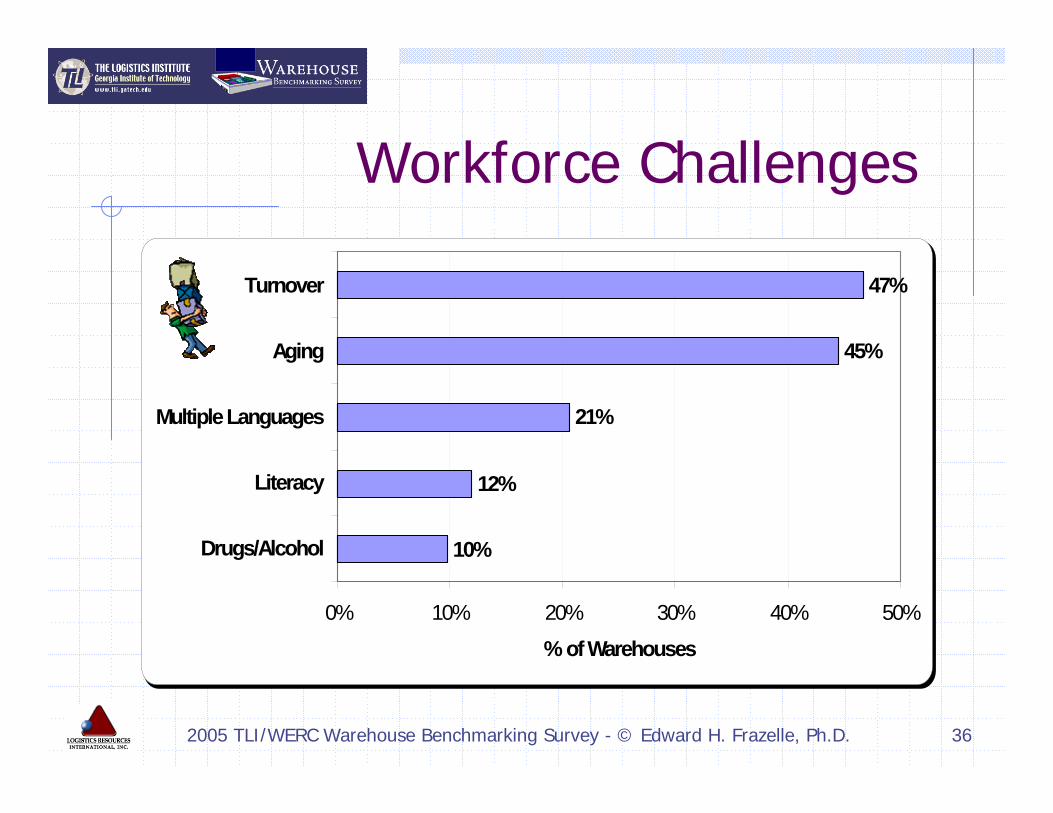
Workforce Challenges
10%
12%
21%
45%
47%
0% 10% 20% 30% 40% 50%
Drugs/Alcohol
Literacy
Multiple Languages
Aging
Turnover
% of Warehouses
Page 37
2005 TLI/WERC Warehouse Benchmarking Survey - © Edward H. Frazelle, Ph.D. 37
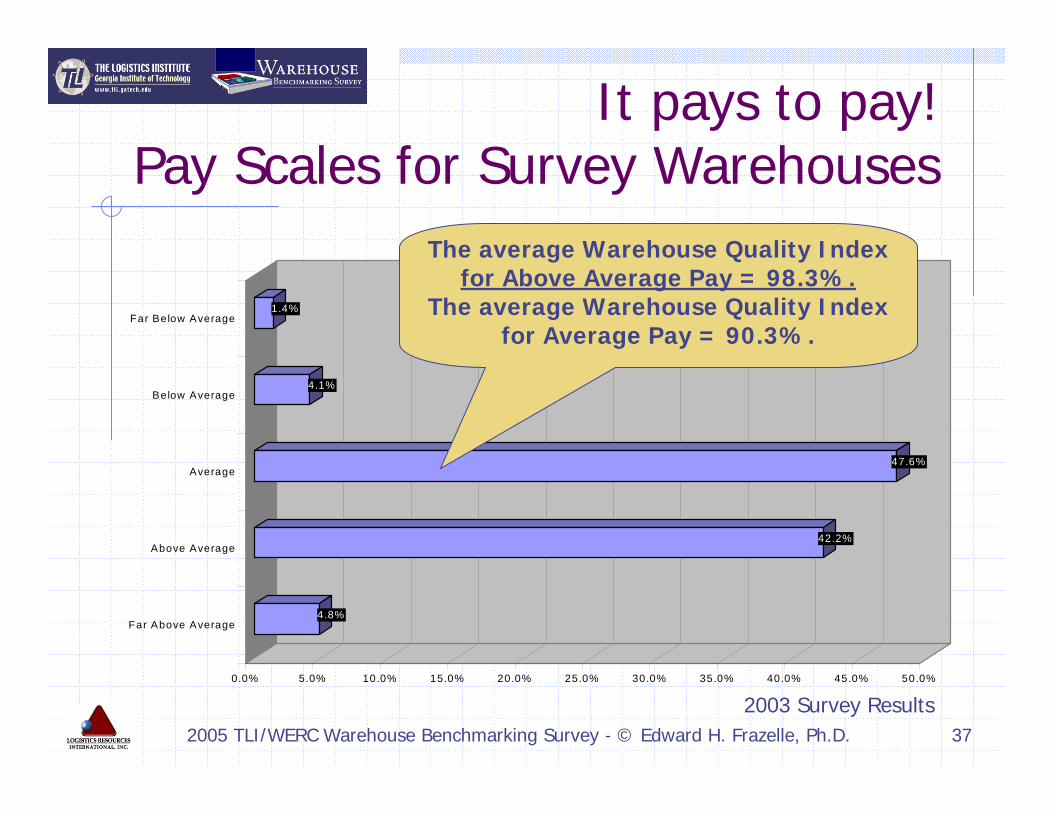
It pays to pay!Pay Scales for Survey Warehouses
4.8%
42.2%
47.6%
4.1%
1.4%
0.0% 5.0% 10.0% 15.0% 20.0% 25.0% 30.0% 35.0% 40.0% 45.0% 50.0%
Far Above Average
Above Average
Average
Below Average
Far Below Average
The average Warehouse Quality Index for Above Average Pay = 98.3%.
The average Warehouse Quality Index for Average Pay = 90.3%.
2003 Survey Results
Page 38
2005 TLI/WERC Warehouse Benchmarking Survey - © Edward H. Frazelle, Ph.D. 38
0%
10%
20%
30%
40%
50%
60%
70%
80%
0% 10% 20% 30% 40% 50% 60% 70% 80% 90% 100%% of Warehouses
% o
f War
ehou
se W
orki
ng H
ours
Full-Time Staff - Regular Hours Full-Time Staff - Overtime HoursPart-Time Staff - Regular Hours Part-Time Staff - Overtime Hours
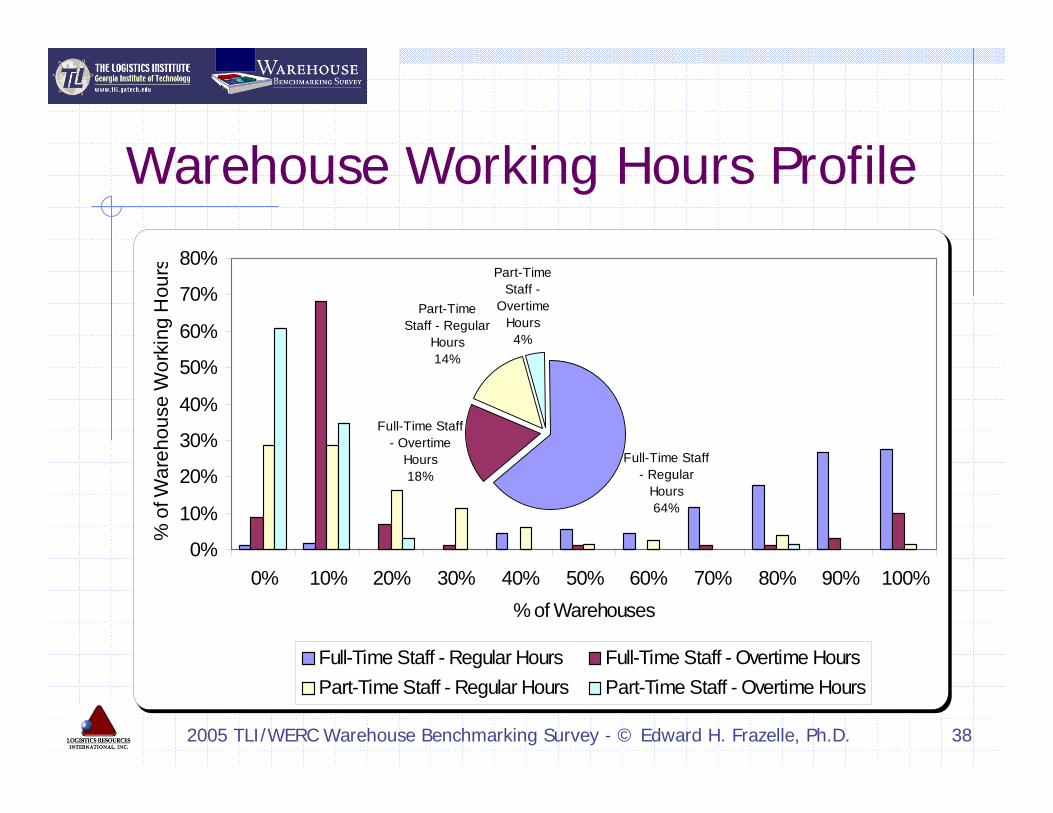
Warehouse Working Hours Profile
Full-Time Staff - Regular
Hours64%
Full-Time Staff - Overtime
Hours18%
Part-Time Staff - Regular
Hours14%
Part-Time Staff -
Overtime Hours
4%
Page 39
2005 TLI/WERC Warehouse Benchmarking Survey - © Edward H. Frazelle, Ph.D. 39
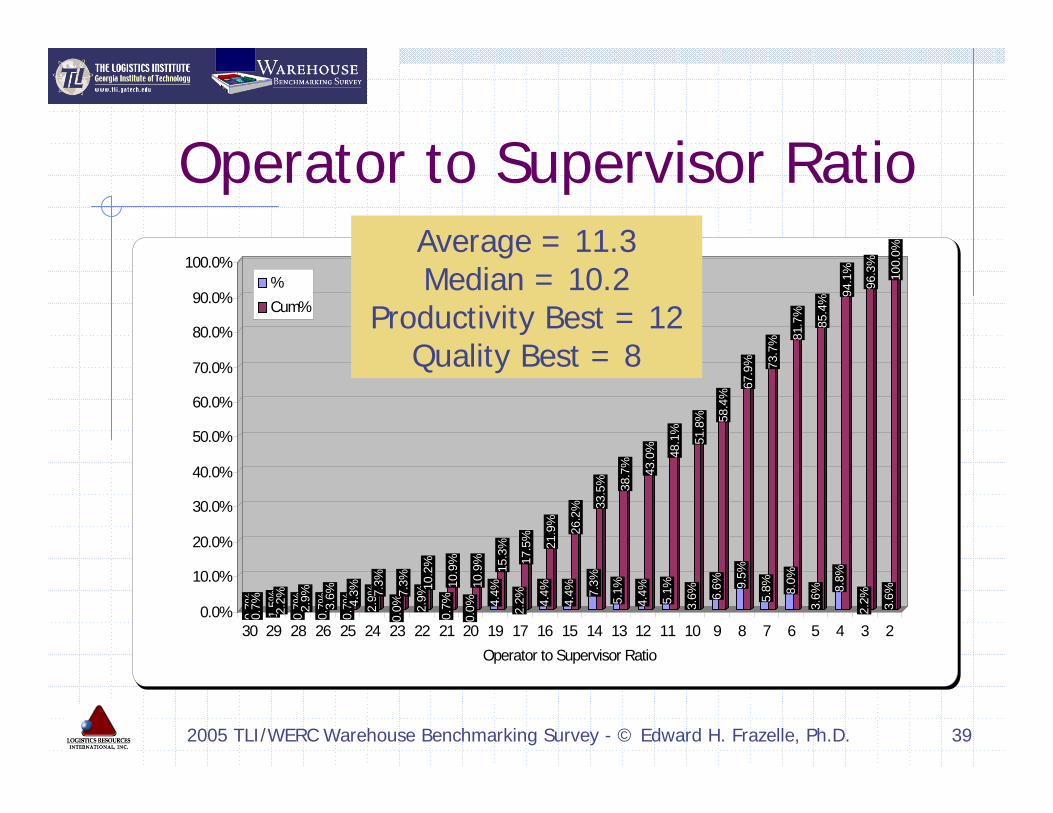
Operator to Supervisor Ratio0.
7%0.
7% 1.5% 2.2%
0.7% 2.
9%0.
7% 3.6%
0.7% 4.
3%2.
9% 7.3%
0.0%
7.3%
2.9%
10.2
%0.
7%10
.9%
0.0%
10.9
%4.
4%15
.3%
2.2%
17.5
%4.
4%21
.9%
4.4%
26.2
%7.
3%33
.5%
5.1%
38.7
%4.
4%43
.0%
5.1%
48.1
%3.
6%51
.8%
6.6%
58.4
%9.
5%67
.9%
5.8%
73.7
%8.
0%81
.7%
3.6%
85.4
%8.
8%94
.1%
2.2%
96.3
%3.
6%10
0.0%
0.0%
10.0%
20.0%
30.0%
40.0%
50.0%
60.0%
70.0%
80.0%
90.0%
100.0%
30 29 28 26 25 24 23 22 21 20 19 17 16 15 14 13 12 11 10 9 8 7 6 5 4 3 2Operator to Supervisor Ratio
%Cum%
Average = 11.3Median = 10.2
Productivity Best = 12Quality Best = 8
Page 40
2005 TLI/WERC Warehouse Benchmarking Survey - © Edward H. Frazelle, Ph.D. 40
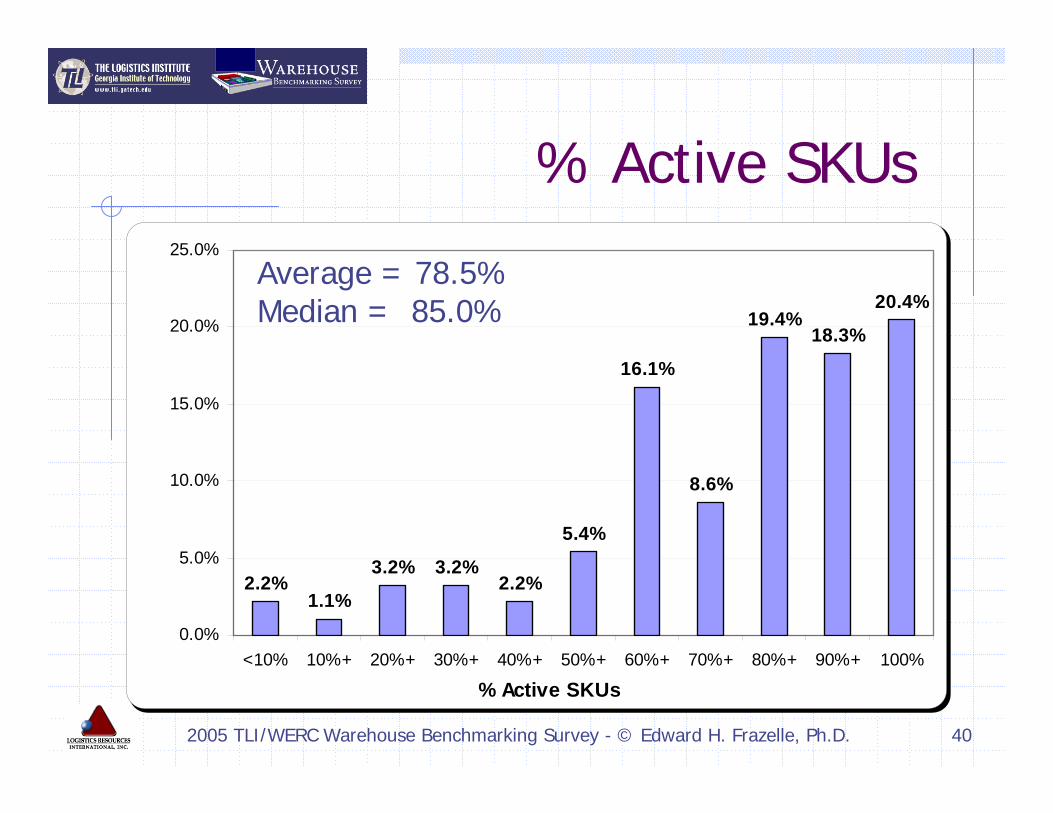
2.2%1.1%
3.2% 3.2%2.2%
5.4%
16.1%
8.6%
19.4%18.3%
20.4%
0.0%
5.0%
10.0%
15.0%
20.0%
25.0%
<10% 10%+ 20%+ 30%+ 40%+ 50%+ 60%+ 70%+ 80%+ 90%+ 100%
% Active SKUs
% Active SKUs
Average = 78.5%Median = 85.0%
Page 41
2005 TLI/WERC Warehouse Benchmarking Survey - © Edward H. Frazelle, Ph.D. 41
4.4%
4.4%
4.4% 6.6%
6.6%
6.6%
4.4%
3.3% 8.
8%
3.3%
0.0% 2.2% 8.
8% 9.9%
6.6%
4.4%
3.3% 4.4% 7.
7%
4.4% 8.
8% 13.2
% 19.8
% 26.4
% 33.0
%
37.4
%
40.7
% 49.5
%
52.8
%
52.8
%
54.9
% 63.7
% 73.6
% 80.2
%
84.6
%
87.9
%
92.3
%
100.
0%
0.0%
10.0%
20.0%
30.0%
40.0%
50.0%
60.0%
70.0%
80.0%
90.0%
100.0%
<1 1+ 5+ 10+
20+
30+
40+
50+
60+
70+
80+
90+
100+
200+
300+
400+
500+
1000
+20
00+
Annual Lines Shipped per SKU
% of WarehousesCumulative % of Warehouses
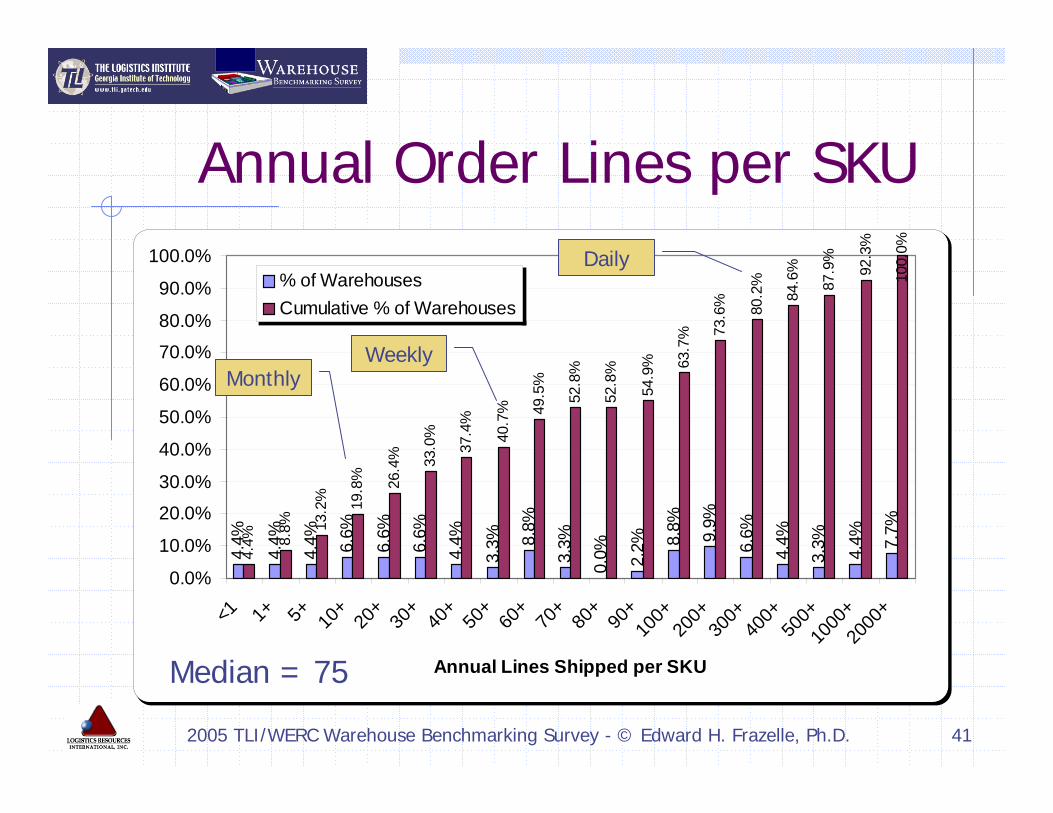
Annual Order Lines per SKU
Median = 75
WeeklyMonthly
Daily
Page 42
2005 TLI/WERC Warehouse Benchmarking Survey - © Edward H. Frazelle, Ph.D. 42
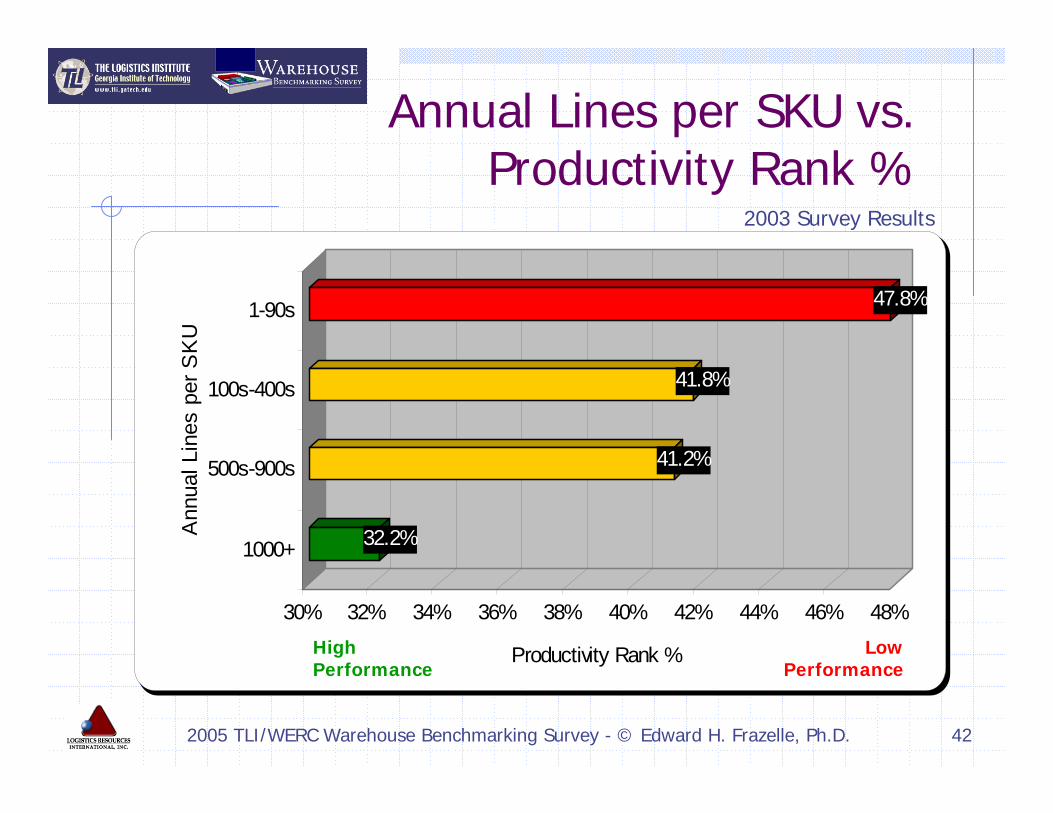
Annual Lines per SKU vs. Productivity Rank %
32.2%
41.2%
41.8%
47.8%
30% 32% 34% 36% 38% 40% 42% 44% 46% 48%
Productivity Rank %
1000+
500s-900s
100s-400s
1-90s
Ann
ual L
ines
per
SK
U
HighPerformance
LowPerformance
2003 Survey Results
Page 43
2005 TLI/WERC Warehouse Benchmarking Survey - © Edward H. Frazelle, Ph.D. 43
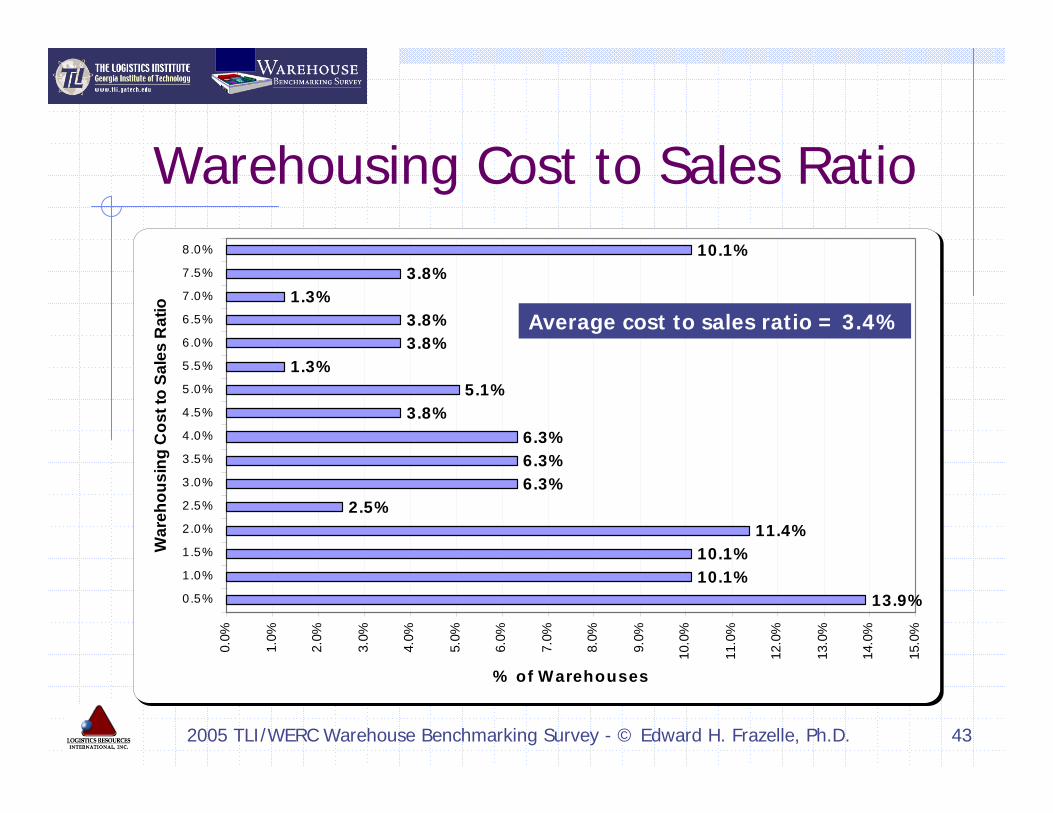
Warehousing Cost to Sales Ratio
13.9%10.1%10.1%
11.4%2.5%
6.3%6.3%6.3%
3.8%5.1%
1.3%3.8%3.8%
1.3%3.8%
10.1%0.
0%
1.0%
2.0%
3.0%
4.0%
5.0%
6.0%
7.0%
8.0%
9.0%
10.0
%
11.0
%
12.0
%
13.0
%
14.0
%
15.0
%
0 .5%
1.0%
1.5%
2.0%
2.5%
3.0%
3.5%
4.0%
4.5%
5.0%
5.5%
6.0%
6.5%
7.0%
7.5%
8.0%
War
ehou
sing
Cos
t to
Sale
s R
atio
% of Warehouses
Average cost to sales ratio = 3.4%
Page 44
2005 TLI/WERC Warehouse Benchmarking Survey - © Edward H. Frazelle, Ph.D. 44
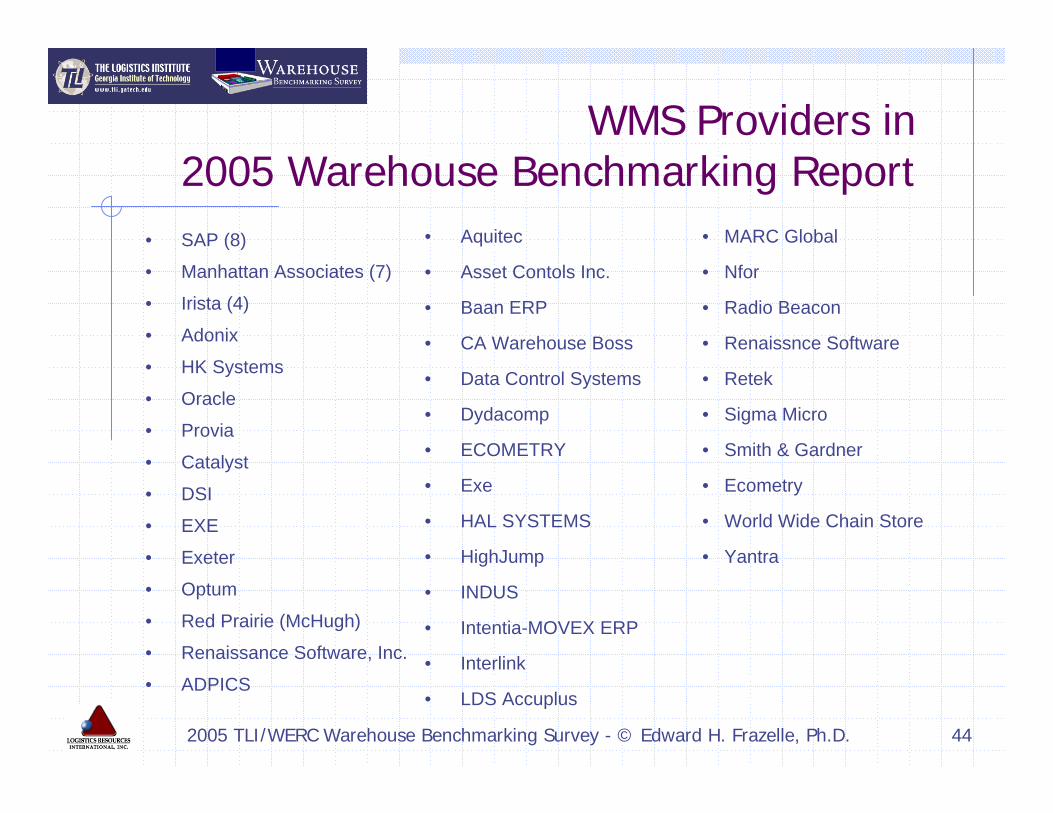
WMS Providers in 2005 Warehouse Benchmarking Report
• Aquitec
• Asset Contols Inc.
• Baan ERP
• CA Warehouse Boss
• Data Control Systems
• Dydacomp
• ECOMETRY
• Exe
• HAL SYSTEMS
• HighJump
• INDUS
• Intentia-MOVEX ERP
• Interlink
• LDS Accuplus• ADPICS
• Renaissance Software, Inc.
• Red Prairie (McHugh)
• Optum
• Exeter
• EXE
• DSI
• Catalyst
• Provia
• Oracle
• HK Systems
• Adonix
• Irista (4)
• Manhattan Associates (7)
• SAP (8) • MARC Global
• Nfor
• Radio Beacon
• Renaissnce Software
• Retek
• Sigma Micro
• Smith & Gardner
• Ecometry
• World Wide Chain Store
• Yantra
Page 45
2005 TLI/WERC Warehouse Benchmarking Survey - © Edward H. Frazelle, Ph.D. 45
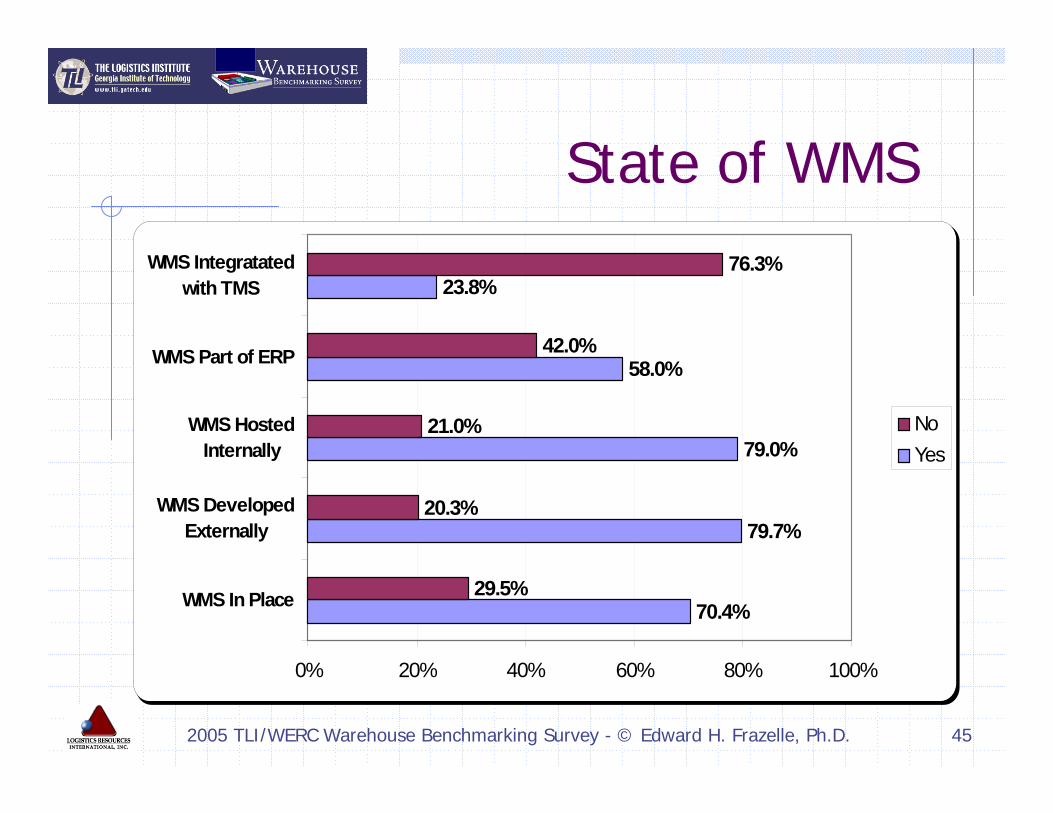
State of WMS
70.4%
79.7%
79.0%
58.0%
23.8%
29.5%
20.3%
21.0%
42.0%
76.3%
0% 20% 40% 60% 80% 100%
WMS In Place
WMS DevelopedExternally
WMS HostedInternally
WMS Part of ERP
WMS Integratatedwith TMS
NoYes
Page 46
2005 TLI/WERC Warehouse Benchmarking Survey - © Edward H. Frazelle, Ph.D. 46
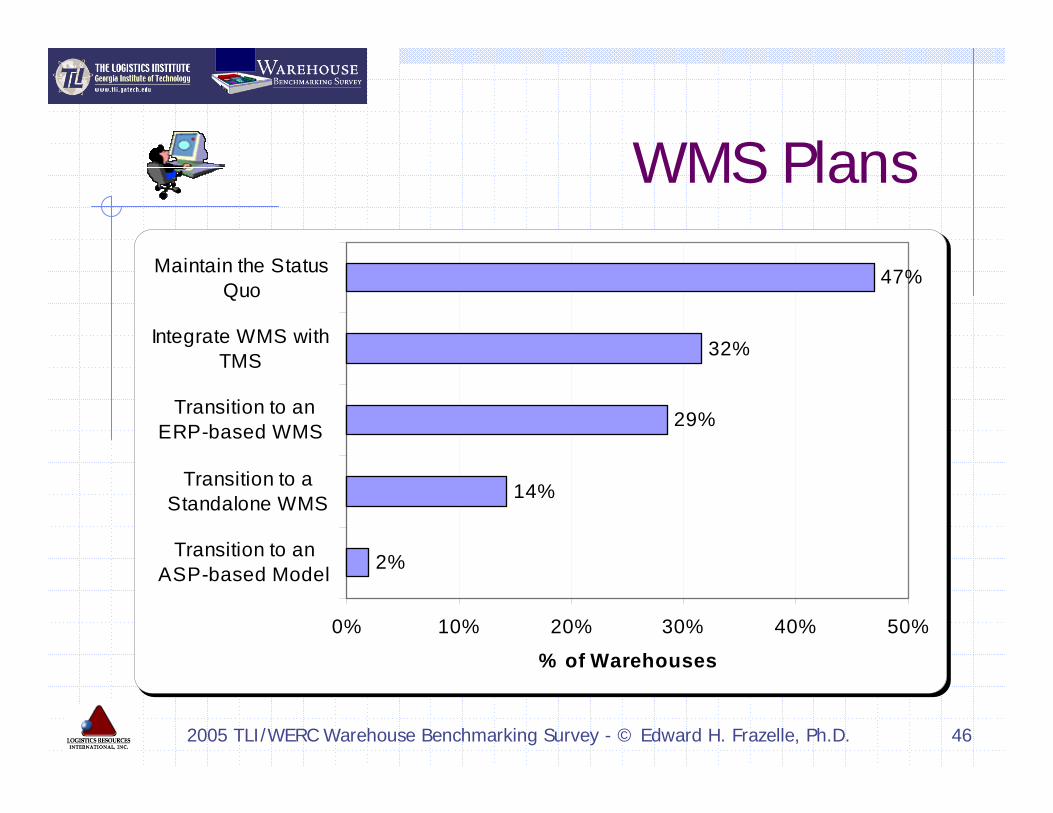
WMS Plans
2%
14%
29%
32%
47%
0% 10% 20% 30% 40% 50%
Transition to anASP-based Model
Transition to aStandalone WMS
Transition to anERP-based WMS
Integrate WMS withTMS
Maintain the StatusQuo
% of Warehouses
Page 47
2005 TLI/WERC Warehouse Benchmarking Survey - © Edward H. Frazelle, Ph.D. 47
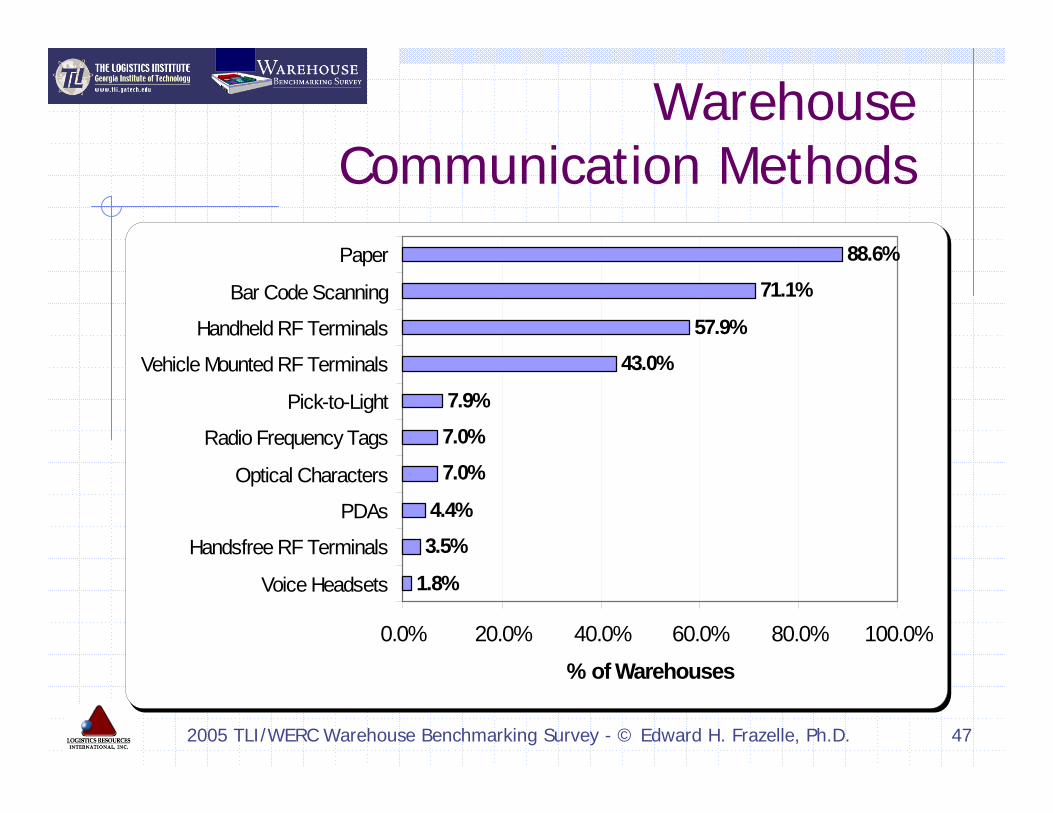
Warehouse Communication Methods
1.8%
3.5%4.4%
7.0%7.0%
7.9%
43.0%57.9%
71.1%88.6%
0.0% 20.0% 40.0% 60.0% 80.0% 100.0%
Voice Headsets
Handsfree RF Terminals
PDAs
Optical Characters
Radio Frequency Tags
Pick-to-Light
Vehicle Mounted RF Terminals
Handheld RF Terminals
Bar Code Scanning
Paper
% of Warehouses
Page 48
2005 TLI/WERC Warehouse Benchmarking Survey - © Edward H. Frazelle, Ph.D. 48
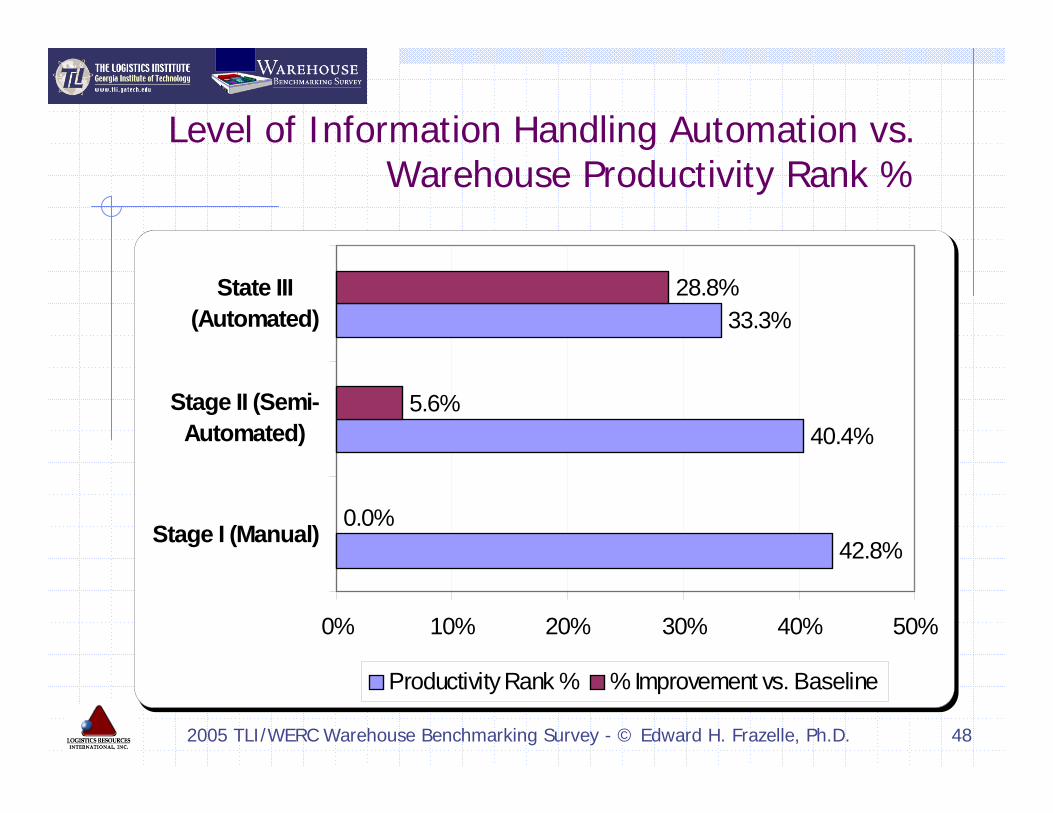
Level of Information Handling Automation vs. Warehouse Productivity Rank %
42.8%
40.4%
33.3%
0.0%
5.6%
28.8%
0% 10% 20% 30% 40% 50%
Stage I (Manual)
Stage II (Semi-Automated)
State III(Automated)
Productivity Rank % % Improvement vs. Baseline
Page 49
2005 TLI/WERC Warehouse Benchmarking Survey - © Edward H. Frazelle, Ph.D. 49
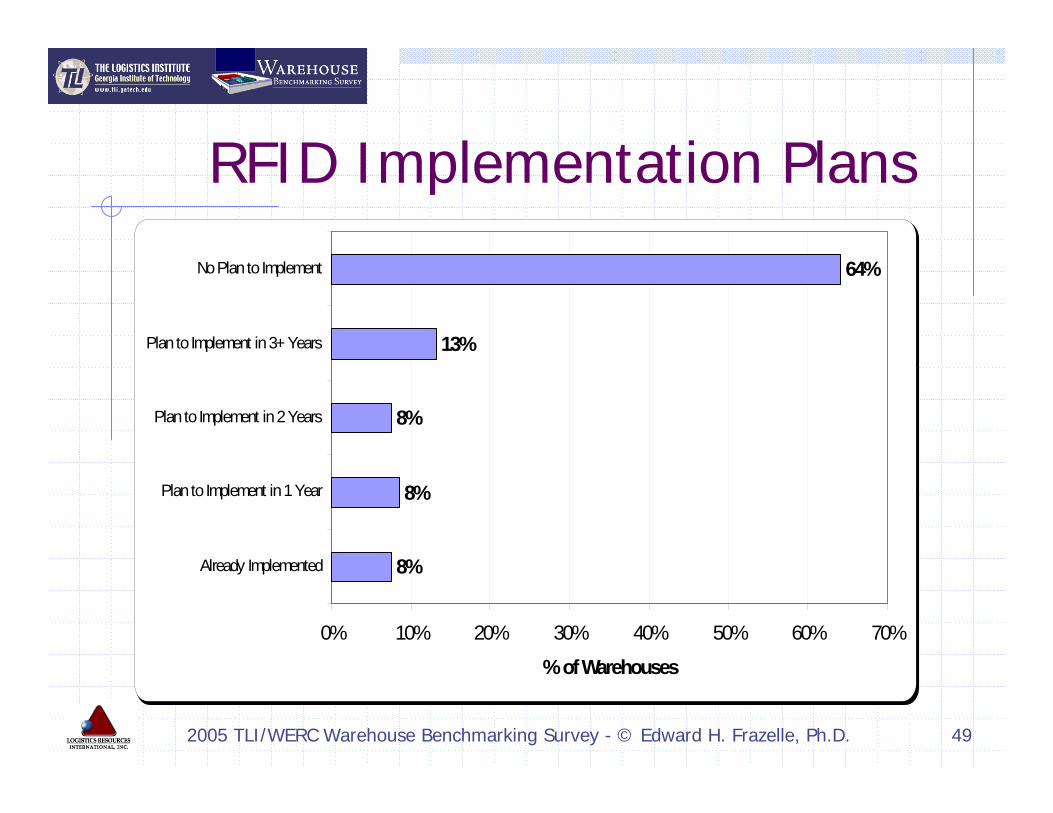
RFID Implementation Plans
8%
8%
8%
13%
64%
0% 10% 20% 30% 40% 50% 60% 70%
Already Implemented
Plan to Implement in 1 Year
Plan to Implement in 2 Years
Plan to Implement in 3+ Years
No Plan to Implement
% of Warehouses
Page 50
2005 TLI/WERC Warehouse Benchmarking Survey - © Edward H. Frazelle, Ph.D. 50
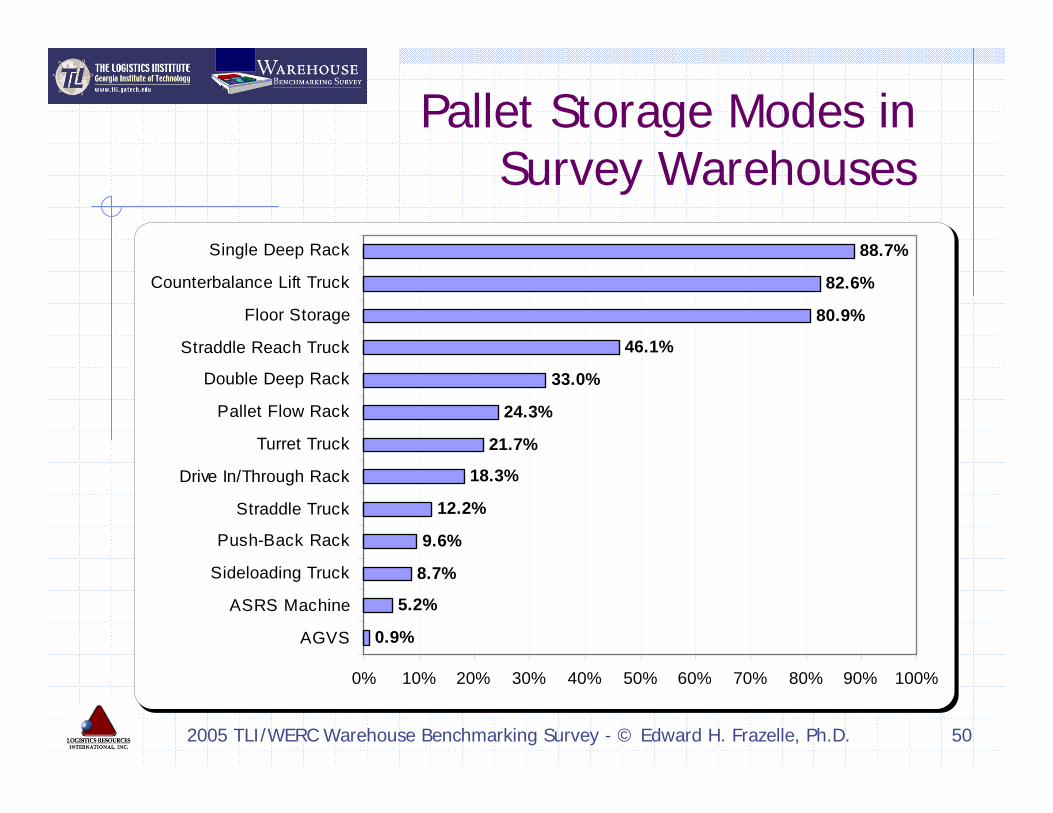
Pallet Storage Modes in Survey Warehouses
0.9%
5.2%
8.7%
9.6%
12.2%
18.3%
21.7%
24.3%
33.0%
46.1%
80.9%
82.6%
88.7%
0% 10% 20% 30% 40% 50% 60% 70% 80% 90% 100%
AGVS
ASRS Machine
Sideloading Truck
Push-Back Rack
Straddle Truck
Drive In/Through Rack
Turret Truck
Pallet Flow Rack
Double Deep Rack
Straddle Reach Truck
Floor Storage
Counterbalance Lift Truck
Single Deep Rack
Page 51
2005 TLI/WERC Warehouse Benchmarking Survey - © Edward H. Frazelle, Ph.D. 51
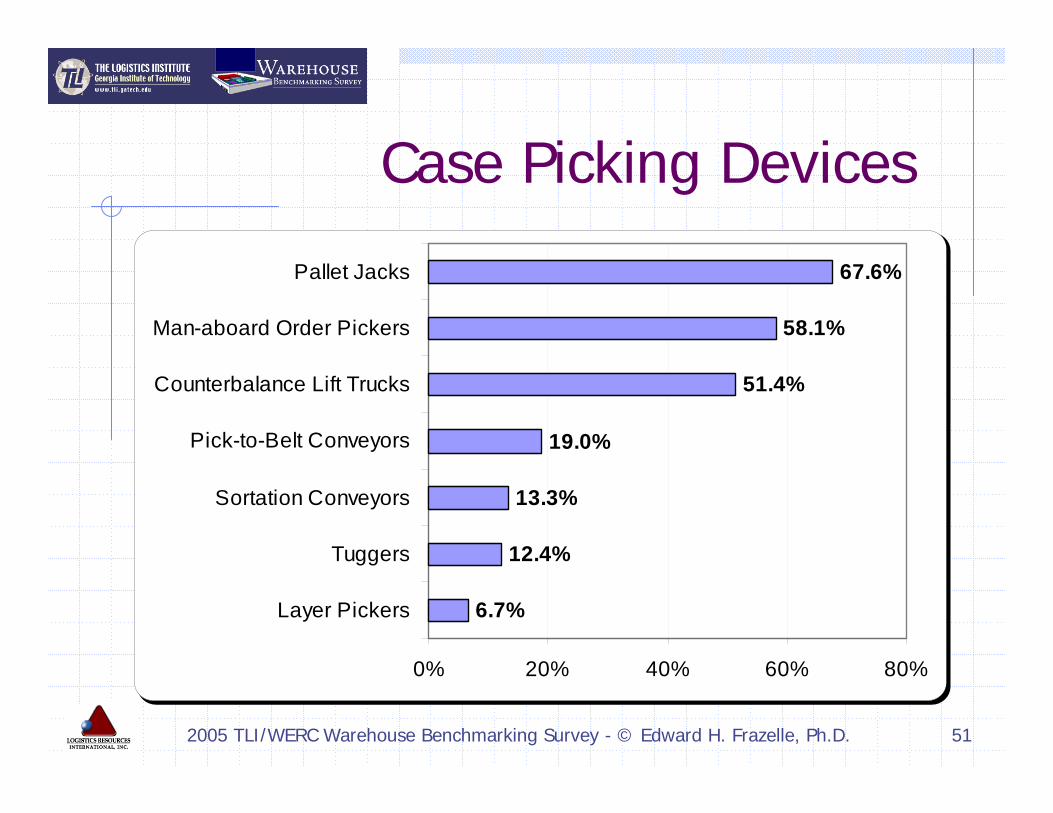
Case Picking Devices
6.7%
12.4%
13.3%
19.0%
51.4%
58.1%
67.6%
0% 20% 40% 60% 80%
Layer Pickers
Tuggers
Sortation Conveyors
Pick-to-Belt Conveyors
Counterbalance Lift Trucks
Man-aboard Order Pickers
Pallet Jacks
Page 52
2005 TLI/WERC Warehouse Benchmarking Survey - © Edward H. Frazelle, Ph.D. 52
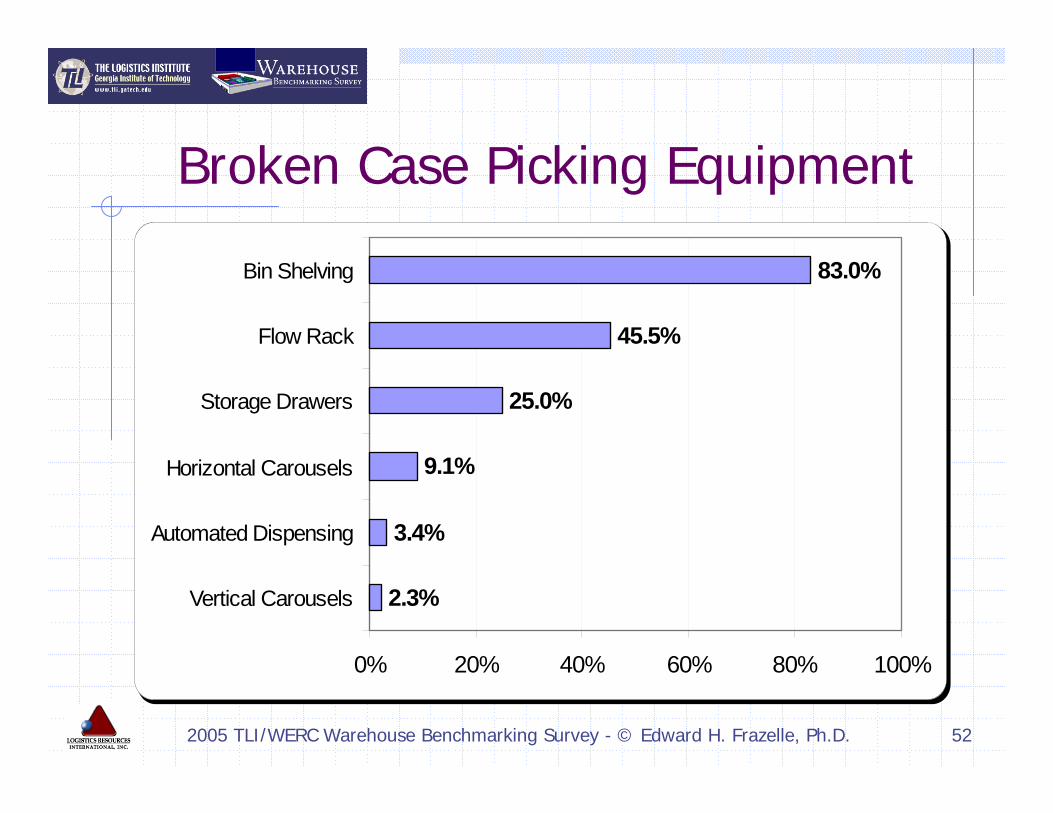
Broken Case Picking Equipment
2.3%
3.4%
9.1%
25.0%
45.5%
83.0%
0% 20% 40% 60% 80% 100%
Vertical Carousels
Automated Dispensing
Horizontal Carousels
Storage Drawers
Flow Rack
Bin Shelving
Page 53
2005 TLI/WERC Warehouse Benchmarking Survey - © Edward H. Frazelle, Ph.D. 53
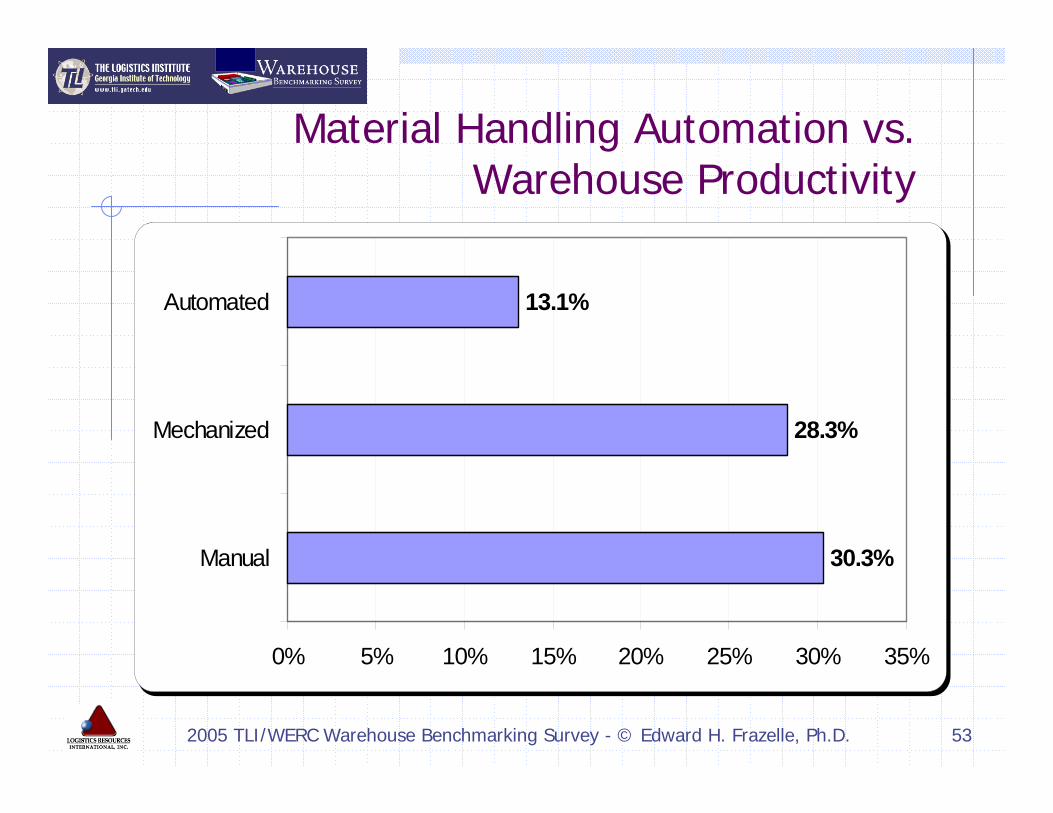
Material Handling Automation vs. Warehouse Productivity
30.3%
28.3%
13.1%
0% 5% 10% 15% 20% 25% 30% 35%
Manual
Mechanized
Automated
Page 54
2005 TLI/WERC Warehouse Benchmarking Survey - © Edward H. Frazelle, Ph.D. 54
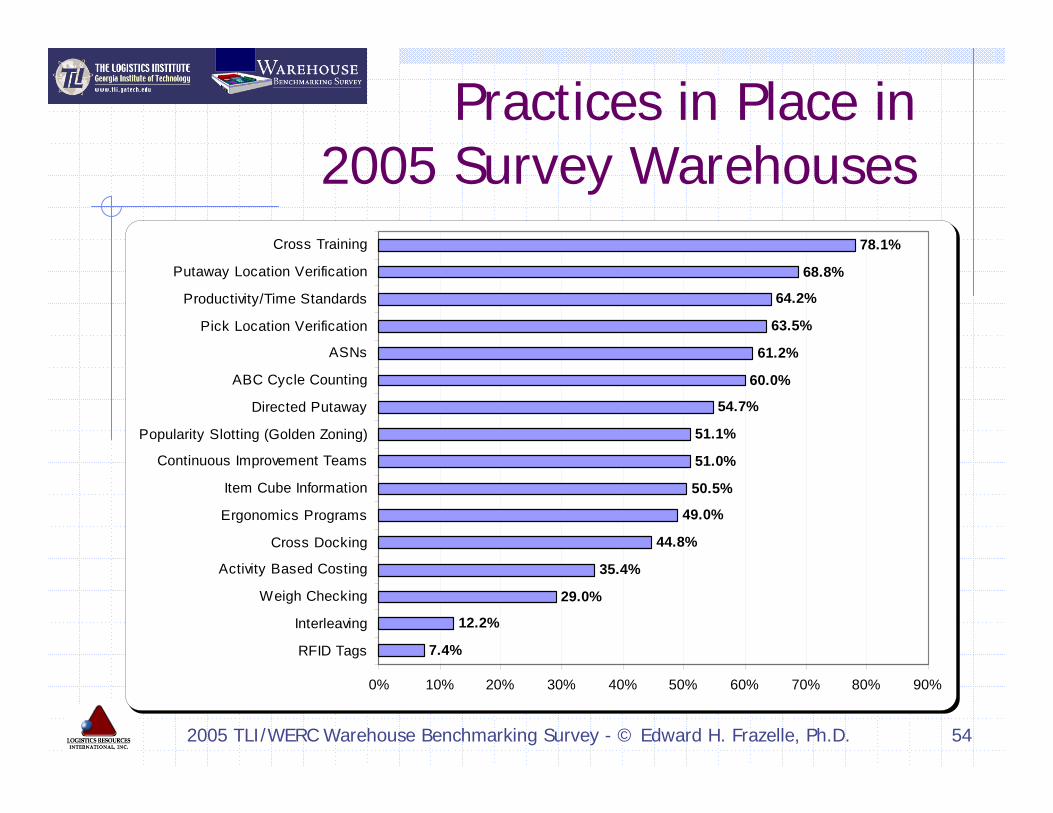
Practices in Place in 2005 Survey Warehouses
7.4%
12.2%
29.0%
35.4%
44.8%
49.0%
50.5%
51.0%
51.1%
54.7%
60.0%
61.2%
63.5%
64.2%
68.8%
78.1%
0% 10% 20% 30% 40% 50% 60% 70% 80% 90%
RFID Tags
Interleaving
Weigh Checking
Activity Based Costing
Cross Docking
Ergonomics Programs
Item Cube Information
Continuous Improvement Teams
Popularity Slotting (Golden Zoning)
Directed Putaway
ABC Cycle Counting
ASNs
Pick Location Verification
Productivity/Time Standards
Putaway Location Verification
Cross Training
Page 55
2005 TLI/WERC Warehouse Benchmarking Survey - © Edward H. Frazelle, Ph.D. 55
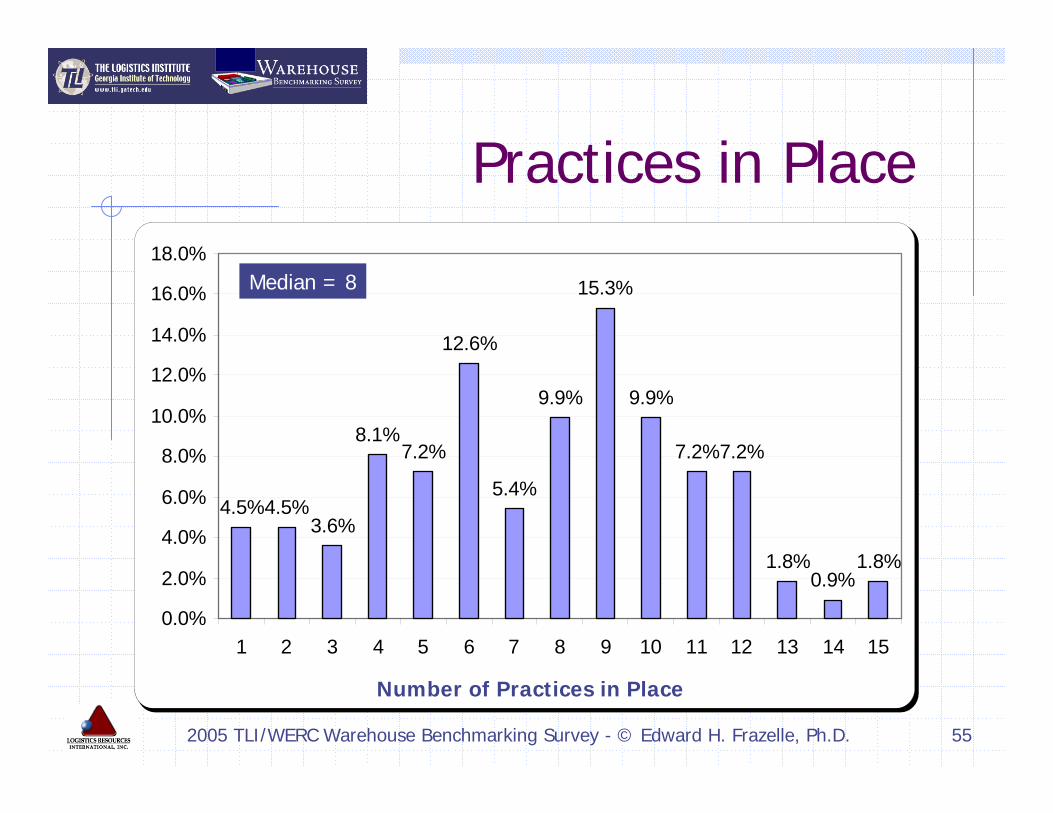
Practices in Place
4.5%4.5%3.6%
8.1%7.2%
12.6%
5.4%
9.9%
15.3%
9.9%
7.2%7.2%
1.8%0.9%
1.8%
0.0%
2.0%
4.0%
6.0%
8.0%
10.0%
12.0%
14.0%
16.0%
18.0%
1 2 3 4 5 6 7 8 9 10 11 12 13 14 15
Number of Practices in Place
Median = 8
Page 56
2005 TLI/WERC Warehouse Benchmarking Survey - © Edward H. Frazelle, Ph.D. 56
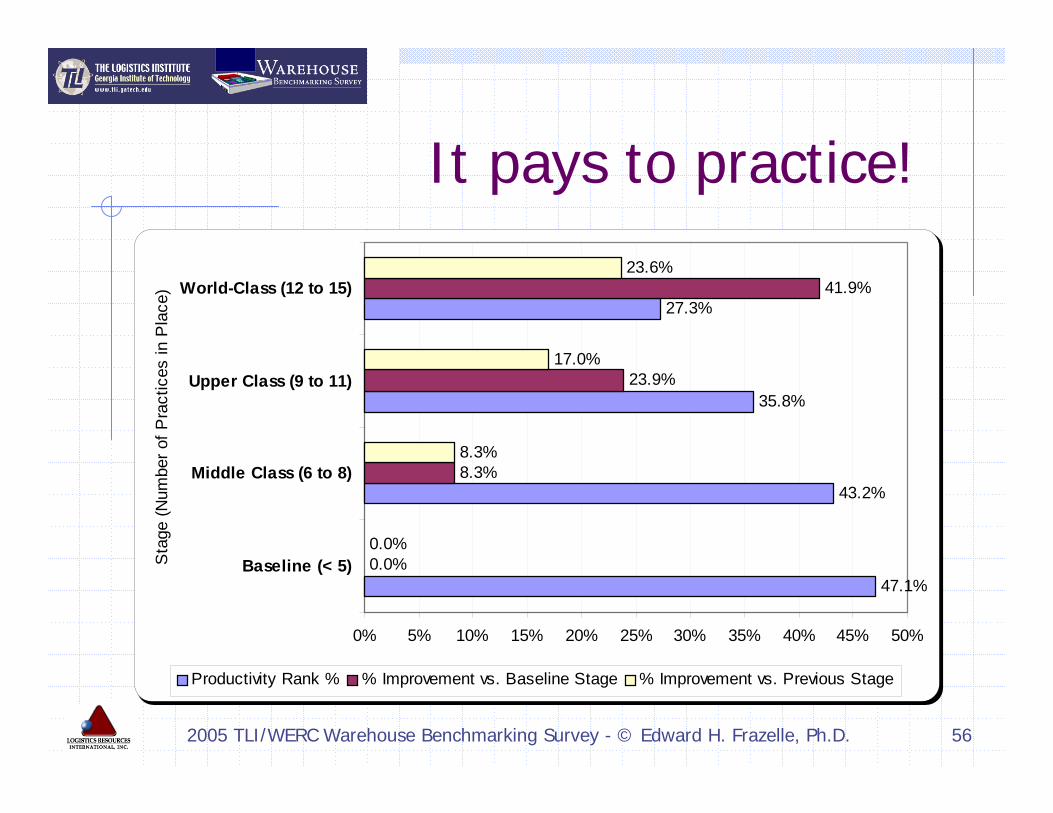
It pays to practice!
47.1%
43.2%
35.8%
27.3%
0.0%
8.3%
23.9%
41.9%
0.0%
8.3%
17.0%
23.6%
0% 5% 10% 15% 20% 25% 30% 35% 40% 45% 50%
Baseline (< 5)
Middle Class (6 to 8)
Upper Class (9 to 11)
World-Class (12 to 15)
Sta
ge (N
umbe
r of P
ract
ices
in P
lace
)
Productivity Rank % % Improvement vs. Baseline Stage % Improvement vs. Previous Stage
Page 57
2005 TLI/WERC Warehouse Benchmarking Survey - © Edward H. Frazelle, Ph.D. 57
The “Perfect” WarehouseA building 600 feet long, 300 feet wide, 30 feet clear with 180,000 square feet in a rapidly appreciating area inside a freetrade zone within 24 hour delivery of all U.S. zip codes, in close proximity to a highly skilled and motivated workforce, and within walking distance of a major U.S. port.The building is 80% occupied during “normal” inventory levels and 90% occupied during “peak” inventory levels.The operation is a hybrid insource-outsource model with the perfect outsource provider(s) chosen to perform those activities inside the warehouse that SHOULD BE outsourced.The operation is supported by a WMS provided by an ASP enabling all world-class warehousing practices and integrating with a wide variety of paperless communication devices chosen perfectly to meet the unique needs of each activity within the warehouse.
Page 58
2005 TLI/WERC Warehouse Benchmarking Survey - © Edward H. Frazelle, Ph.D. 58
The “Perfect” Warehouse
The workforce is cross-trained with an operator to supervisor ratio of 8 where QUALITY is the key success driver and 12 where PRODUCTIVITY is the key success driver and where operators are delighted with average to above-average pay.The SKUs would be highly active, yielding 1000+ hits per year on average.An APPROPRIATE level of material handling technology is in place, each device chosen to perfectly match the handling requirements of the task.A holistic set of financial, productivity, quality and cycle time metrics work together to motivate and maintain world-class warehouse performance.
Page 59
2005 TLI/WERC Warehouse Benchmarking Survey - © Edward H. Frazelle, Ph.D. 59
Contact Information
The Logistics Institute at Georgia Techwww.tli.gatech.edu
Logistics Resources Internationalwww.LRIConsulting.com
Edward H. Frazelle, [email protected]