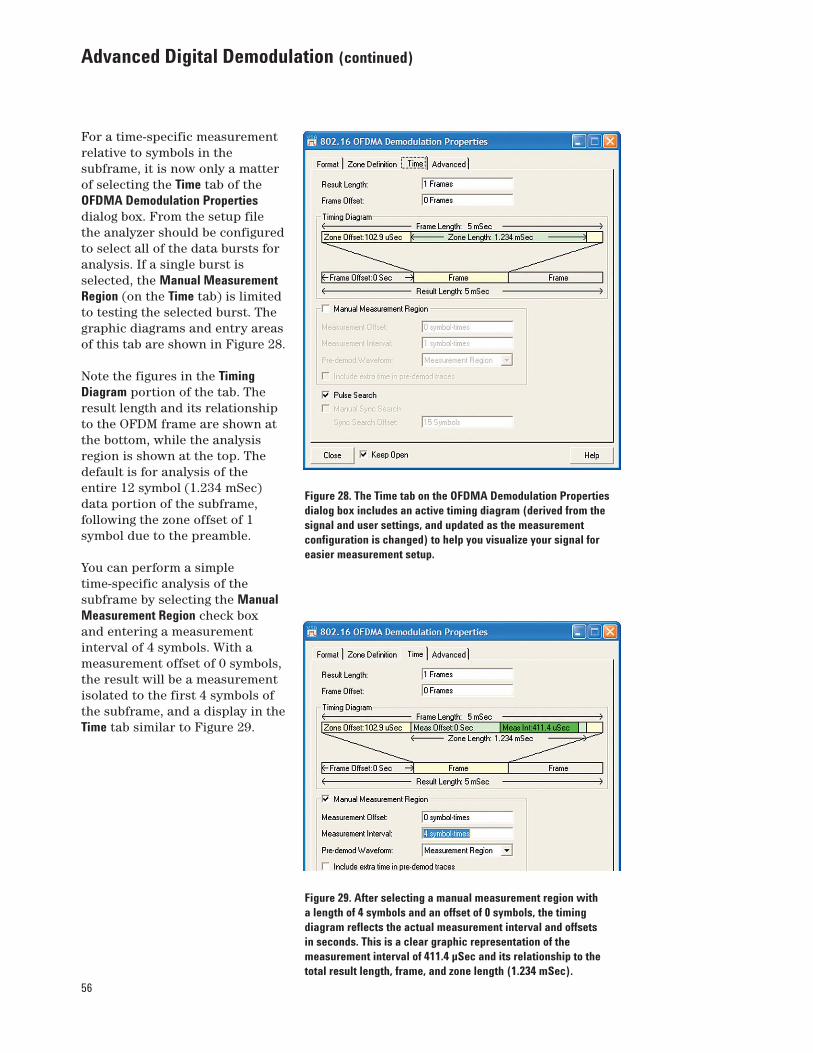
IEEE 802.16e WiMAX OFDMA Signal Measurements and Troubleshooting Application Note 1578 Introduction This application note is a guide to effective measurement and troubleshooting of IEEE 802.16e OFDMA “Mobile WiMAX” signals, components, and systems. The most distinctive term used to describe this new technology is OFDMA or orthogonal frequency division multiple access, and therefore we will use the term OFDMA in this note as a compact reference to the signal and its associated standard. This note provides a broad overview of measurement and troubleshooting approaches for OFDMA signals, and is not limited to digital demodulation or modulation quality analysis. Indeed, we will show that some of the most productive types of analysis for OFDMA signals are generally grouped under the heading of time domain and frequency domain or “vector” signal analysis. Though the measurements and principles discussed here would apply to any OFDMA measurements, they are described with specific reference to the 89600 vector signal analysis (VSA) software and Option B7Y IEEE 802.16 OFDMA modulation analysis. This software can analyze signals from a wide variety of sources including spectrum analyzers, modular VXI hardware, oscilloscopes, logic analyzers (for data already in digitized form), and design/simulation software such as ADS. The IEEE 802.16e OFDMA standard is a complex and extensive one, with many more specifics than can be covered in a note of this type. This note will focus on a general process for the most effective measurements, with examples of some typical problems you may find, paired with the measurement and troubleshooting techniques and displays to help you most efficiently find and fix these problems. Since the focus of this note is measurement and troubleshooting techniques, some other topics, such as hardware configurations and step-by-step measurement instructions, will be covered in other documents. Please consult the “Other Resources” summary below and the “References” section at the end of this note.
Transcript
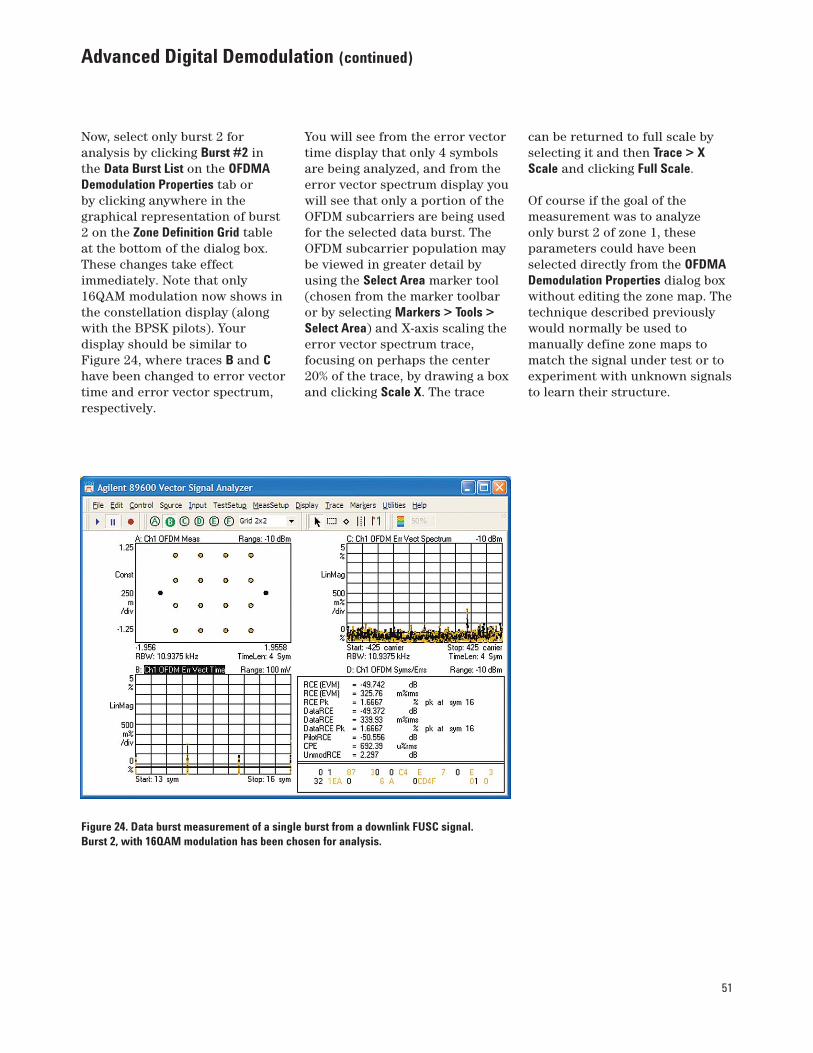
IEEE 802.16e WiMAX OFDMA SignalMeasurements and Troubleshooting
Application Note 1578
Introduction
This application note is a guide to effective measurement andtroubleshooting of IEEE 802.16eOFDMA “Mobile WiMAX” signals,components, and systems. Themost distinctive term used todescribe this new technology isOFDMA or orthogonal frequencydivision multiple access, andtherefore we will use the termOFDMA in this note as a compactreference to the signal and itsassociated standard.
This note provides a broadoverview of measurement andtroubleshooting approaches forOFDMA signals, and is notlimited to digital demodulation or modulation quality analysis.Indeed, we will show that some of the most productive types ofanalysis for OFDMA signals are
generally grouped under theheading of time domain andfrequency domain or “vector”signal analysis.
Though the measurements and principles discussed herewould apply to any OFDMAmeasurements, they aredescribed with specific referenceto the 89600 vector signalanalysis (VSA) software andOption B7Y IEEE 802.16 OFDMAmodulation analysis. Thissoftware can analyze signals from a wide variety of sourcesincluding spectrum analyzers,modular VXI hardware,oscilloscopes, logic analyzers (fordata already in digitized form),and design/simulation softwaresuch as ADS.
The IEEE 802.16e OFDMAstandard is a complex and
extensive one, with many morespecifics than can be covered in a note of this type. This note willfocus on a general process for themost effective measurements,with examples of some typicalproblems you may find, pairedwith the measurement andtroubleshooting techniques and displays to help you most efficiently find and fix these problems.
Since the focus of this note is measurement andtroubleshooting techniques, someother topics, such as hardwareconfigurations and step-by-stepmeasurement instructions, will be covered in other documents.Please consult the “OtherResources” summary below andthe “References” section at theend of this note.
The focus of this application note is on measurement andtroubleshooting techniques andexamples. For more informationon products, configurations, andstep-by-step instructions, pleaseconsult the following additionalresources. The locations andliterature numbers for thesedocuments are listed in the“References” section at the end of this note.
Free demo CD89601A VSA software with optionB7Y 802.16 “OFDMA modulationanalysis” in free trial licensemode. The software includesexample OFDMA signals andextensive help text withmeasurement tutorials. This isavailable by ordering publicationnumber 5980-1989E.
OFDMA, WiMAX and other OFDMtechnical referencesTech Online IEEE 802.16e OFDMAwebcast (archived – originalpresentation September 2005)http://seminar2.techonline.com/s/agilent_sep1505 or go towww.agilent.com/find/wimax foran archived version)
Effects of Physical LayerImpairments on OFDM Systems,Published in RF Design, May 2002
Other resources
Product Web site
For the most up-to-date andcomplete application and productinformation, please visit ourproduct Web site at: www.agilent.com/find/wimax
Related Literature
Publication Title Publication Type Publication Number
Step-by-step instructions and measurement examples
Agilent 89600 Series Vector Signal Analysis Self-Guided Demonstration 5989-2383ENSoftware for IEEE 802.16 OFDMA Evaluation and Troubleshooting
Vector signal analyzer product information
Agilent 89600 Series Vector Signal Analysis Technical Overview 5989-1679ENSoftware 89601A/89601AN/89601N12
Agilent 89600 Series Vector Signal Analysis Data Sheet 5989-1786ENSoftware 89601A/89601AN/89601N12
Hardware Measurement Platforms for Data Sheet 5989-1753ENthe Agilent 89600 Series Vector Signal Analysis Software
OFDMA, WiMAX and other OFDM technical references
Agilent WiMAX Signal Analysis; Part 1: Application Note 5989-3037ENMaking Frequency and Time Measurements
Agilent WiMAX Signal Analysis; Part 2: Application Note 5989-3038ENDemodulating and Troubleshooting the Subframe
Agilent WiMAX Signal Analysis; Part 3: Application Note 5989-3039EN Troubleshooting Symbols and Improving Demodulation
4
Measurement and Troubleshooting Sequence
When measuring andtroubleshooting digitallymodulated systems, it is tempting to go directly to digital demodulation and themeasurement tools provided in that operational mode ofanalyzers such as the 89600Series VSAs. We have learnedfrom experience that it is usuallybetter to follow a measurementsequence instead: one that begins with basic spectrummeasurements and continueswith vector (combined frequencyand time) measurements, beforeswitching to digital demodulationand modulation analysis asshown in Table 1.
This is the sequence we will usein this application note. Thesequence of measurements isespecially useful because itimproves the chance that you willfind important signal problems at the earliest stages of design. In particular, the time and
frequency domain measurementsat the beginning of the sequenceprovide for the measurement andverification of many signalparameters (including manyassociated with the digitalmodulation itself) withoutperforming digital demodulation.This is an advantage in somedevelopment situations wheredemodulation is not yet availableor is in some way questionable. In addition, some importantmeasurements such as spectraloccupancy and CCDF aretypically not performed in ademodulation mode.
It is certainly useful to make avariety of modulation analysismeasurements on a system inquestion, watching for things thatlook wrong or questionable. Youcan find many problems that way.However, some important defectsare not apparent in demodulationresults, or may manifestthemselves differently from one
demodulator to another. Insituations such as this, you canwaste a great deal of time onunproductive measurementapproaches or demodulationresults that are difficult tointerpret. The danger of missingfundamental problems isparticularly acute in applicationssuch as IEEE 802.16 OFDMA dueto the complexity of the signaland the possibility thatdemodulation will fail due torelatively subtle problems such as PRBS errors or incorrectdefinition of data bursts.Therefore, it is important toisolate problems as early aspossible in the measurement andtroubleshooting process and toeliminate the maximum numberof simple signal problems beforeattempting digital demodulation.This is especially true whenworking on baseband DSPoperations to create signals withcorrect modulation, pilotconfiguration, etc.
Frequency,frequency and time
Basicdigital demod
Advanced andspecific demod
Get basics right,find major problems
Signal quality numbers, constellation, basic error vector measurements
Find specific problems and causes
Table 1. A suggested measurement sequence for troubleshooting and performance verification.
5
Time and Frequency Domain (Vector) Measurements
Frequency,frequency and time
Basicdigital demod
Advanced andspecific demod
Get basics right,find major problems
Signal quality numbers, constellation, basic error vector measurements
Find specific problems and causes
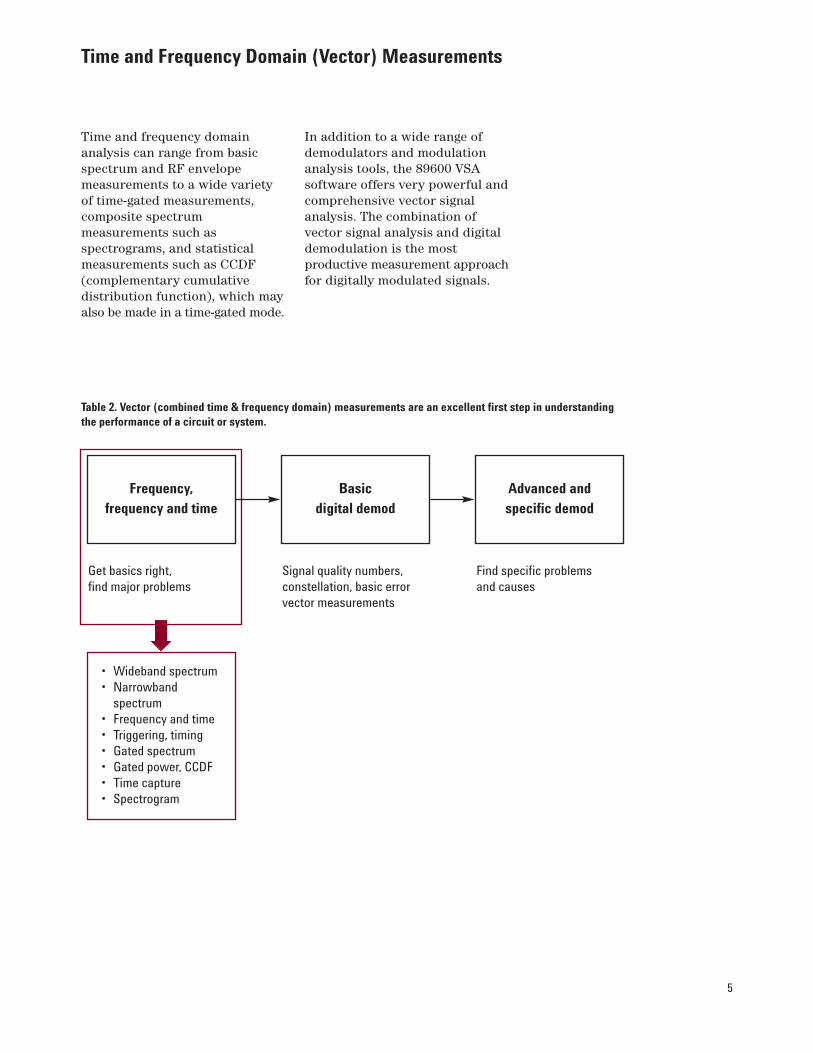
Table 2. Vector (combined time & frequency domain) measurements are an excellent first step in understandingthe performance of a circuit or system.
• Wideband spectrum • Narrowband
spectrum • Frequency and time • Triggering, timing • Gated spectrum • Gated power, CCDF • Time capture • Spectrogram
Time and frequency domainanalysis can range from basicspectrum and RF envelopemeasurements to a wide varietyof time-gated measurements,composite spectrummeasurements such asspectrograms, and statisticalmeasurements such as CCDF(complementary cumulativedistribution function), which mayalso be made in a time-gated mode.
In addition to a wide range ofdemodulators and modulationanalysis tools, the 89600 VSAsoftware offers very powerful andcomprehensive vector signalanalysis. The combination ofvector signal analysis and digitaldemodulation is the mostproductive measurement approachfor digitally modulated signals.
6
Time and Frequency Domain (Vector) Measurements (continued)
Getting basics right and findingmajor problems
Our approach begins withfrequency (basic spectrum)measurements and progresses to vector measurements thatcombine frequency and timedomain analysis. You can learn a great deal about digitallymodulated signals before usingdigital demodulation, and someimportant signal characteristicsnot readily visible during digitaldemodulation.
Some examples of problems withdigitally modulated signals whichcan be found through vectoranalysis include malformed ortruncated training sequences(which can cause compatibilityissues even if digital modulationis successful) and improperamplitude or ranging (which may disguise itself as digitalmodulation problems such astiming errors). Even someproblems which arise in thedigital modulation process itselfmay be seen more readily in the vector (and not digitaldemodulation) mode.
Vector analysis also provides agood opportunity to set triggeringand pulse search length tooptimum values. This ensures, for example, that a “pulse notfound” message during digitaldemodulation actually indicates a signal problem and not just a setup problem or variations in signal amplitude due tomodulation. Attaching clearmeanings to errors reported bythe analyzer enhances the valueof the analyzer’s results andmakes the analysis itself morecomprehensive.
Time-varying signals require goodcoordination of time domain andfrequency domain measurements.Typically you can measure and verify the time domaincharacteristics, and then usetime-related factors such astriggers and gating to make thedesired frequency domainmeasurements.
The situation is particularlydemanding for signals such asWiMAX OFDMA because thesignal changes characteristics inseveral significant ways, even
during a single RF burst orsubframe. For example, thepreamble of a downlink subframemay have higher power than therest of the subframe, and thatsame preamble will have differentspectral characteristics andpower statistics from the rest ofthe subframe. Indeed, differentOFDM symbols within the burstare also likely to have differentspectral and power characteristics,including power statistics such aspeak/average power ratio.
It is easiest to see thesecharacteristics and how they aremeasured through the use ofexamples. The following exampleswill be presented in a sequencewhich promotes an orderlyapproach to measurements andtroubleshooting, and whichenhances the chance thatproblems will be found at theearliest possible stage.
7
Time and Frequency Domain (Vector) Measurements (continued)
Using an example recorded signal
An excellent example signal forboth vector and modulationanalysis is provided with the89600 VSA software as arecording under the file namei80216e_DL10MHz.sdf (the path tothe recordings is usuallyc:\Program Files\Agilent\89600VSA\Help\Signals\). This OFDMAdownlink recording includesslightly more than 5 RF bursts(downlink subframes) which havea burst length of 2.37 mSec and arepetition interval of 5 mSec.
When playback is first initiated in the 89600 VSA, the analyzer isset to the center frequency andfrequency span used when therecording was made (thoughthese can be changed later). Theanalyzer defaults to a two-tracedisplay of frequency domain(spectrum) and 90% time domain (RF envelope) where the spectrum measurementcorresponds to the time recordshown in RF envelope form. The analyzer also defaults to afrequency resolution (FFT size) of801 points and a playback overlapof 90%. The overlap figure sets the analyzer to construct eachsuccessive time record inplayback by concatenating thelast 90% of the previous timerecord with 10% “new” data fromthe next segment in the recordingfile. In this way the effectiveplayback speed of the recordingcan be adjusted, with 0% overlapyielding a fast playback and99.99% yielding a very slowplayback.
Setting up basic measurements
The measurements describedhere will illustrate the generalmeasurement approach andprovide specific examples ofOFDMA analysis. While detailedstep-by-step instructions will notbe provided in this applicationnote (instead, see the 896000 VSAhelp text and Option B7Ydemonstration guide describedabove), many of the menu anddialog choices will be listed.
Demonstration software note:The measurements made herewill use the OFDMA examplesignal recordings provided withrev. 6.20 (or later) of the 89600vector signal analyzer software.You may obtain this softwarefrom Agilent Technologies, installit in a user PC, and operate it in ademonstration/training licensemode without the need to purchasethe software or contact Agilent toobtain a permanent license. Thisdemonstration/training license is available each time thesoftware is started, and thedemonstration/training licensecapability does not expire. Thedemonstration/training licenseprovides full access to theanalyzer’s detailed help facility,digital modulation tutorials, anddemonstration videos.
8
Time and Frequency Domain (Vector) Measurements (continued)
Setting up triggering
Untriggered analysis of framed orbursted signals such as OFDMA isgenerally clumsy and unproductive.It is usually vital to measurespecific portions of the signal,and this generally requires acombination of triggering andpositive or negative trigger delay.Where an external frame triggeris not used, the analyzer canconstruct its own magnitude or IF trigger from the input signalitself. When measuring signalswith significant amplitudevariation due to modulation (thiscertainly applies to OFDMA!), the amplitude (RF envelope)variations can cause false triggersduring a burst. Therefore triggerholdoff is also an importantparameter to set, though theactual holdoff value is not criticalfor the purpose of avoiding falsetriggering due to modulation. Anyvalue that is well in excess of thetemporary minima caused bymodulation will work well; 1 µSecis a good value to begin with.
Trigger holdoff has one otherimportant use for framed signalssuch as OFDMA. Where a signal iscomposed of different bursts(such as uplink and downlink)and where the inter-burst timingvaries, holdoff can be used withIF triggering to select a triggerpoint which is unique in an RFburst sequence. For example,there may be one inter-burstinterval which is longer than allothers, and this may be repeatedonce in each complete frame.Using a trigger holdoff valuewhich is shorter than the longestinter-burst interval but is longerthan the other intervals will yielda single valid trigger at a specificpoint in each frame. Positive andnegative trigger delay can then beused to select any portion of thesignal for measurement, referencedto this unique trigger point.
All of these trigger capabilitiesare available whether the signal is“live” (from input hardware) or
from a recording. Triggers basedon the recorded signal aregrouped under the Playback Triggertab of the Input menu.
While these trigger capabilitiescan be used in the digitaldemodulation mode as well, typicaldemodulation measurements aremade with the “pulse search”functions specific to ademodulation type. These pulsesearch functions are in someways more advanced than thetriggering described here. Themost common exception to thispractice occurs when pulsesearch is unsuccessful orunreliable in demodulationoperations, perhaps leading toquestions about the validity ofthe pulses constructed by thesystem. In cases such as this thenormal triggering and holdofffunctions can help identifydefective bursts.
9
Time and Frequency Domain (Vector) Measurements (continued)
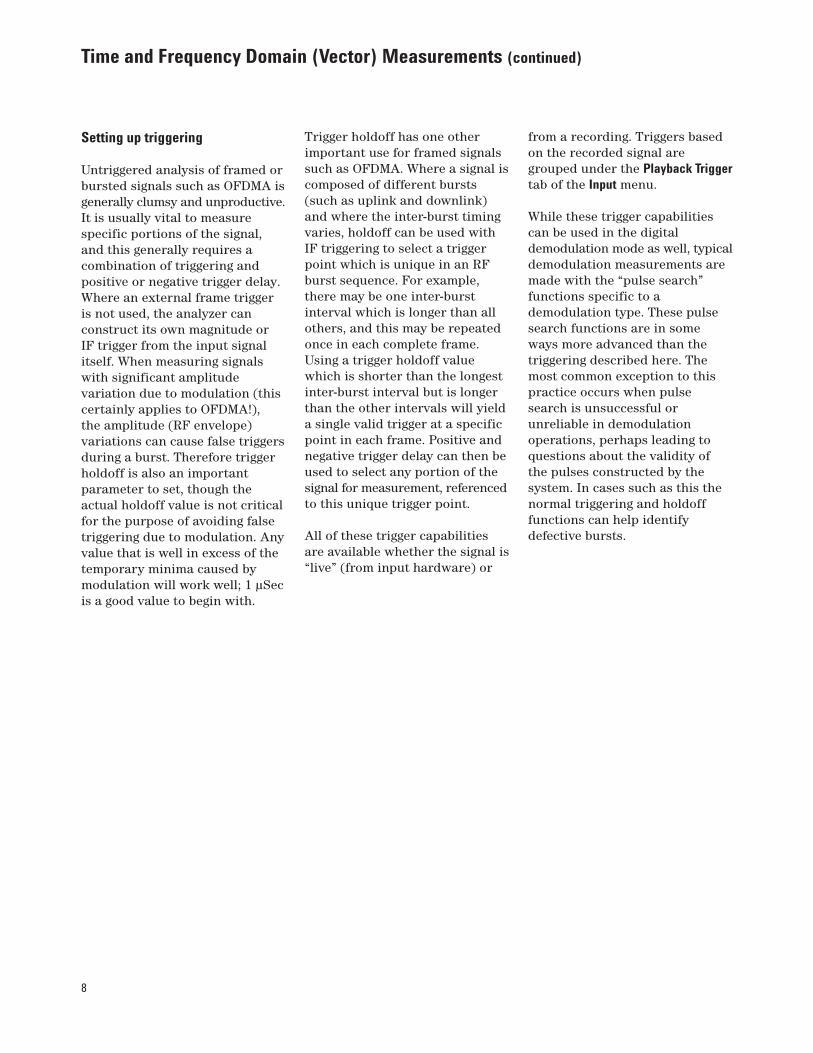
Figure 1. Triggered measurement of spectrum and RF envelope with negative triggerdelay, showing leading edge of burst. Horizontal dashed line on RF envelope showstrigger level.
When making triggeredmeasurements on RF bursts, a good practice is to begin bysetting a negative or pre-triggerdelay of approximately 10% of the time record. Then choose anappropriate trigger holdoff valueand adjust trigger level until astable measurement is producedin the frequency and time domain.For the following measurementson the i80216e_DL10MHz.sdfrecorded signal, a trigger level of10 mV, a trigger holdoff of 1 µSec,and a pre-trigger delay of –3 µSecworks well. See Figure 1.
10
Time and Frequency Domain (Vector) Measurements (continued)
Basic measurements of the preamble
With the measurement stabilized,you can configure the analyzer to determine some basic signalparameters. Measuring thepreamble of this downlink signalis a good place to begin, as thecharacteristics of this portion of the subframe are stable andwell-defined. Since the preambleis 1 OFDM symbol time in lengthand may have a different powerlevel than the rest of thesubframe, it makes sense to set a time record length of about 2.5 times the OFDM symbollength, or about 250 µSec.
Given a particular frequency span (and resulting sample rate),FFT size, and RBW/windowconfiguration there is a limit onthe maximum length of a timerecord. For the 20 MHz span and 801 point FFT size of theanalyzer's default configuration,this maximum time length isabout 40 µSec. Since the desiredlength for this measurement is250 µSec and since maximumtime length and number of FFTpoints scale linearly, we need anFFT length approximately 6 timeslonger than the default 801points. The ResBW tab of theMeasSetup menu provides aFrequency Points setting, and weshould thus select a number of6401 or greater from the binarysequence in the drop-down list.
11
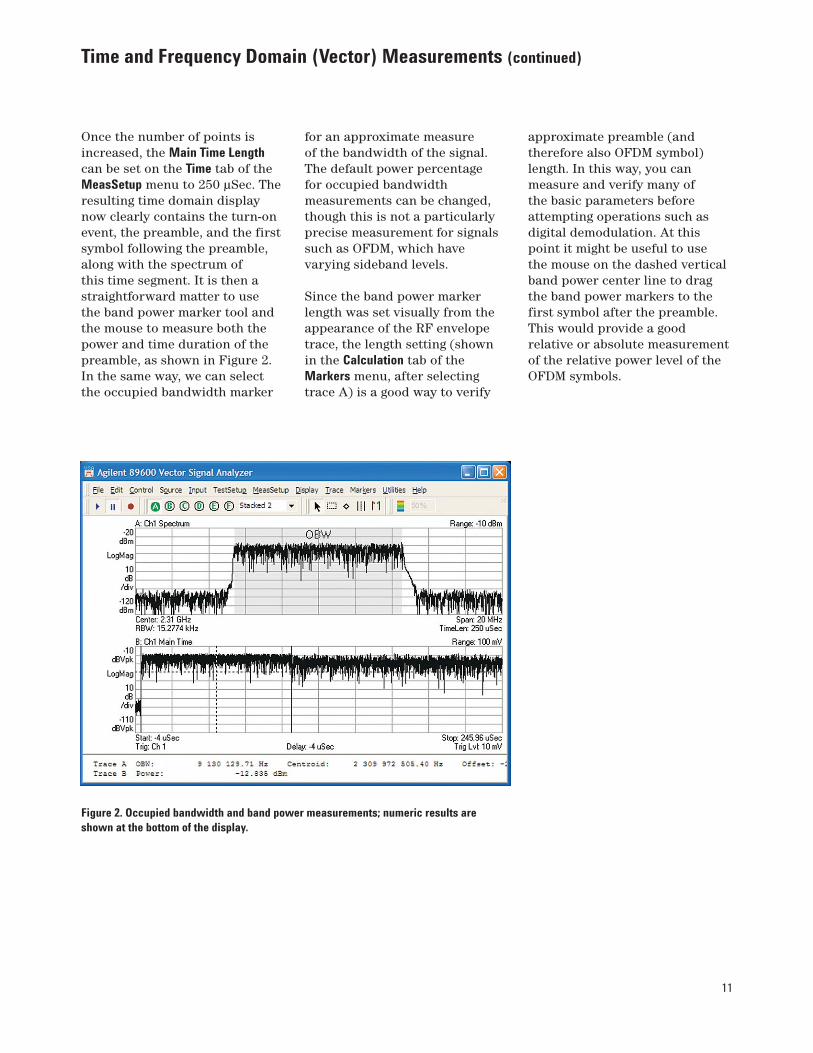
Figure 2. Occupied bandwidth and band power measurements; numeric results areshown at the bottom of the display.
Once the number of points isincreased, the Main Time Lengthcan be set on the Time tab of theMeasSetup menu to 250 µSec. Theresulting time domain displaynow clearly contains the turn-onevent, the preamble, and the firstsymbol following the preamble,along with the spectrum of this time segment. It is then astraightforward matter to use the band power marker tool andthe mouse to measure both thepower and time duration of thepreamble, as shown in Figure 2.In the same way, we can selectthe occupied bandwidth marker
Time and Frequency Domain (Vector) Measurements (continued)
for an approximate measure of the bandwidth of the signal.The default power percentage for occupied bandwidthmeasurements can be changed,though this is not a particularlyprecise measurement for signalssuch as OFDM, which havevarying sideband levels.
Since the band power markerlength was set visually from theappearance of the RF envelopetrace, the length setting (shown in the Calculation tab of theMarkers menu, after selectingtrace A) is a good way to verify
approximate preamble (andtherefore also OFDM symbol)length. In this way, you canmeasure and verify many of the basic parameters beforeattempting operations such asdigital demodulation. At thispoint it might be useful to use the mouse on the dashed verticalband power center line to dragthe band power markers to thefirst symbol after the preamble.This would provide a goodrelative or absolute measurementof the relative power level of theOFDM symbols.
12
Time and Frequency Domain (Vector) Measurements (continued)
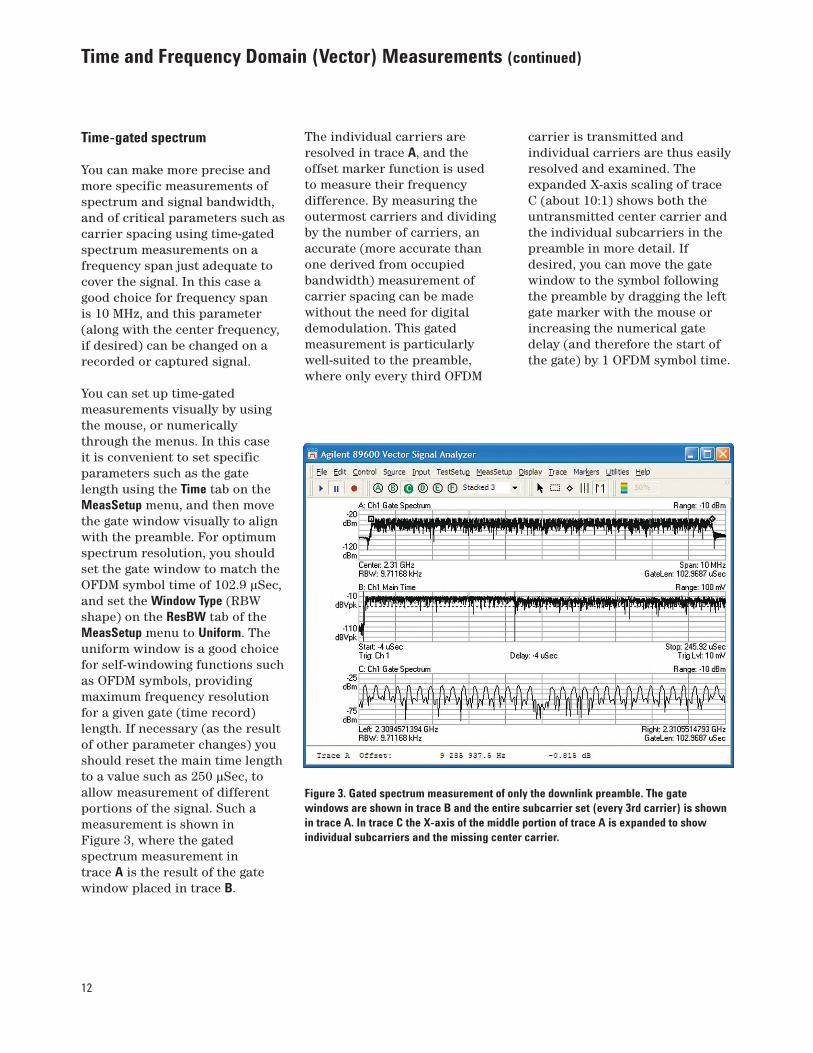
Figure 3. Gated spectrum measurement of only the downlink preamble. The gatewindows are shown in trace B and the entire subcarrier set (every 3rd carrier) is shownin trace A. In trace C the X-axis of the middle portion of trace A is expanded to showindividual subcarriers and the missing center carrier.
Time-gated spectrum
You can make more precise andmore specific measurements ofspectrum and signal bandwidth,and of critical parameters such ascarrier spacing using time-gatedspectrum measurements on afrequency span just adequate tocover the signal. In this case agood choice for frequency span is 10 MHz, and this parameter(along with the center frequency,if desired) can be changed on arecorded or captured signal.
You can set up time-gatedmeasurements visually by usingthe mouse, or numericallythrough the menus. In this case it is convenient to set specificparameters such as the gatelength using the Time tab on theMeasSetup menu, and then movethe gate window visually to alignwith the preamble. For optimumspectrum resolution, you shouldset the gate window to match theOFDM symbol time of 102.9 µSec,and set the Window Type (RBWshape) on the ResBW tab of theMeasSetup menu to Uniform. Theuniform window is a good choicefor self-windowing functions suchas OFDM symbols, providingmaximum frequency resolutionfor a given gate (time record)length. If necessary (as the resultof other parameter changes) youshould reset the main time lengthto a value such as 250 µSec, toallow measurement of differentportions of the signal. Such ameasurement is shown inFigure 3, where the gatedspectrum measurement in trace A is the result of the gatewindow placed in trace B.
The individual carriers areresolved in trace A, and the offset marker function is used to measure their frequencydifference. By measuring theoutermost carriers and dividingby the number of carriers, anaccurate (more accurate than one derived from occupiedbandwidth) measurement ofcarrier spacing can be madewithout the need for digitaldemodulation. This gatedmeasurement is particularlywell-suited to the preamble,where only every third OFDM
carrier is transmitted andindividual carriers are thus easilyresolved and examined. Theexpanded X-axis scaling of traceC (about 10:1) shows both theuntransmitted center carrier andthe individual subcarriers in thepreamble in more detail. Ifdesired, you can move the gatewindow to the symbol followingthe preamble by dragging the leftgate marker with the mouse orincreasing the numerical gatedelay (and therefore the start ofthe gate) by 1 OFDM symbol time.
13
Time and Frequency Domain (Vector) Measurements (continued)
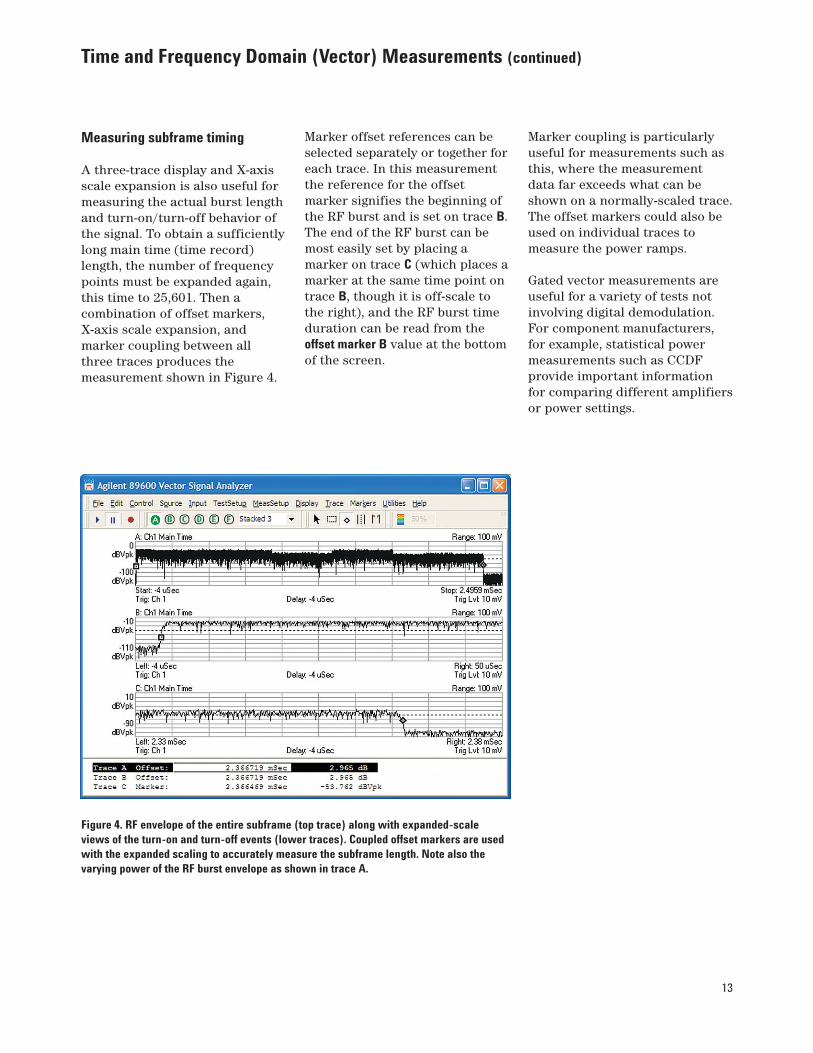
Figure 4. RF envelope of the entire subframe (top trace) along with expanded-scaleviews of the turn-on and turn-off events (lower traces). Coupled offset markers are usedwith the expanded scaling to accurately measure the subframe length. Note also thevarying power of the RF burst envelope as shown in trace A.
Measuring subframe timing
A three-trace display and X-axisscale expansion is also useful formeasuring the actual burst lengthand turn-on/turn-off behavior ofthe signal. To obtain a sufficientlylong main time (time record)length, the number of frequencypoints must be expanded again,this time to 25,601. Then acombination of offset markers,X-axis scale expansion, andmarker coupling between allthree traces produces themeasurement shown in Figure 4.
Marker offset references can beselected separately or together foreach trace. In this measurementthe reference for the offsetmarker signifies the beginning ofthe RF burst and is set on trace B.The end of the RF burst can bemost easily set by placing amarker on trace C (which places amarker at the same time point ontrace B, though it is off-scale tothe right), and the RF burst timeduration can be read from theoffset marker B value at the bottomof the screen.
Marker coupling is particularlyuseful for measurements such asthis, where the measurementdata far exceeds what can beshown on a normally-scaled trace.The offset markers could also beused on individual traces tomeasure the power ramps.
Gated vector measurements areuseful for a variety of tests notinvolving digital demodulation.For component manufacturers,for example, statistical powermeasurements such as CCDFprovide important informationfor comparing different amplifiersor power settings.
14
Time and Frequency Domain (Vector) Measurements (continued)
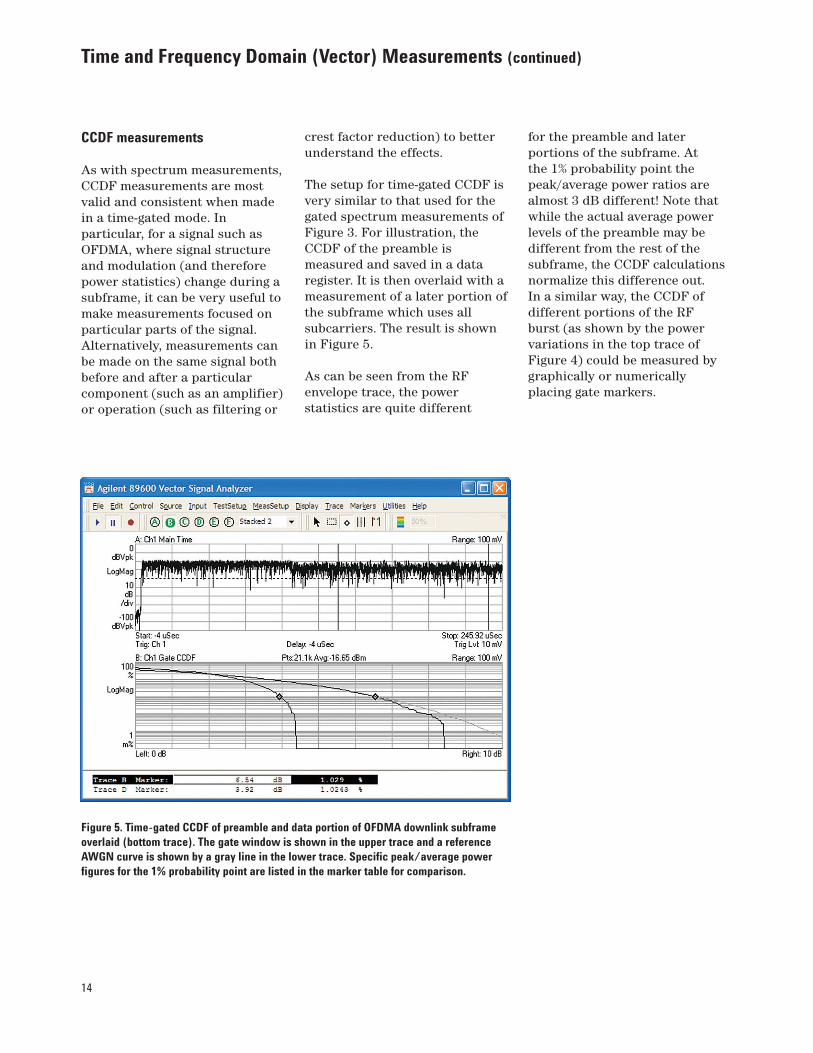
Figure 5. Time-gated CCDF of preamble and data portion of OFDMA downlink subframeoverlaid (bottom trace). The gate window is shown in the upper trace and a referenceAWGN curve is shown by a gray line in the lower trace. Specific peak/average powerfigures for the 1% probability point are listed in the marker table for comparison.
CCDF measurements
As with spectrum measurements,CCDF measurements are mostvalid and consistent when madein a time-gated mode. Inparticular, for a signal such asOFDMA, where signal structureand modulation (and thereforepower statistics) change during asubframe, it can be very useful tomake measurements focused onparticular parts of the signal.Alternatively, measurements canbe made on the same signal bothbefore and after a particularcomponent (such as an amplifier)or operation (such as filtering or
crest factor reduction) to betterunderstand the effects.
The setup for time-gated CCDF isvery similar to that used for thegated spectrum measurements ofFigure 3. For illustration, theCCDF of the preamble ismeasured and saved in a dataregister. It is then overlaid with ameasurement of a later portion ofthe subframe which uses allsubcarriers. The result is shownin Figure 5.
As can be seen from the RFenvelope trace, the powerstatistics are quite different
for the preamble and laterportions of the subframe. At the 1% probability point thepeak/average power ratios arealmost 3 dB different! Note thatwhile the actual average powerlevels of the preamble may bedifferent from the rest of thesubframe, the CCDF calculationsnormalize this difference out. In a similar way, the CCDF ofdifferent portions of the RF burst (as shown by the powervariations in the top trace ofFigure 4) could be measured bygraphically or numericallyplacing gate markers.
15
Time and Frequency Domain (Vector) Measurements (continued)
Spectrograms
With a comparatively widebandwidth, long time length, and large number of carriers, an OFDMA subframe typicallycontains a large amount of data.Most time and frequency domaindisplays, however, contain alimited amount of information.Spectrograms are an excellentway to present a large amount ofspectral information on a singlescreen by using color as anadditional information axis. To do this, each individual spectrummeasurement is reduced to onepixel row in height, and amplitudeis encoded as a color or brightnessvalue. By stacking successivespectrum measurements, theY-axis of the display is a timeaxis. In this way hundreds ofspectrum measurements can bepresented on a single display,enhancing the visibility of subtlespectral effects.
Spectrograms are particularlyuseful when made from signalrecordings, since the analyzer is in a real-time analysis modeduring recording and playback,
ensuring that the measurementdata is contiguous and no signalsare missed. In addition, theadjustable overlap parameteravailable for playback allows you to adjust the time intervalrepresented by successivespectrum measurements (andtherefore the vertical time scaleof the spectrogram) as needed tooptimize the measurement.
Spectrograms coveringbandwidths much wider than the OFDMA channel can be usefulfor detecting interference andunderstanding band usage. Forthe purposes of this applicationnote, however, we will discuss theuse of a time-gated spectrogramof the downlink subframepreviously analyzed. The setup isessentially the same as the gatedspectrum measurements inFigure 3, with a 1 symbol gatelength and a uniform windowshape. Triggering (specificallyPlayback Triggering) should be switched off for thesespectrogram measurements andMax Overlap for this example timecapture should be set to 98-99%.
16
Time and Frequency Domain (Vector) Measurements (continued)
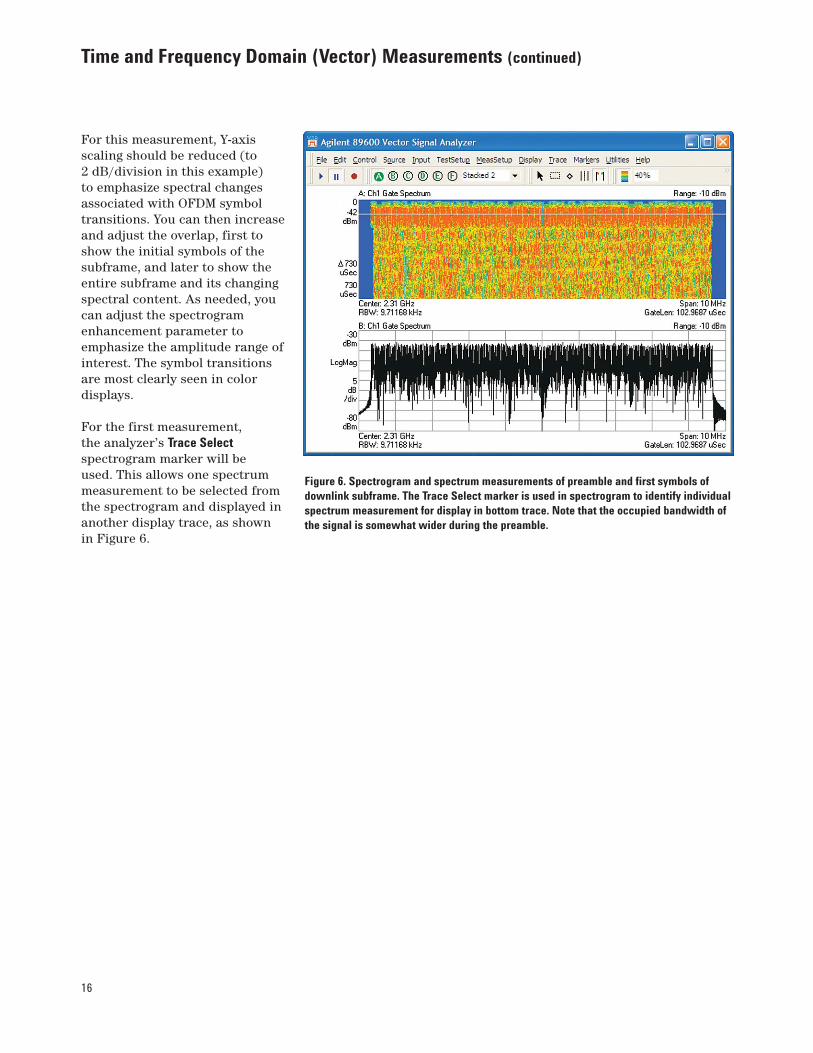
For this measurement, Y-axisscaling should be reduced (to2 dB/division in this example) to emphasize spectral changesassociated with OFDM symboltransitions. You can then increaseand adjust the overlap, first toshow the initial symbols of thesubframe, and later to show theentire subframe and its changingspectral content. As needed, youcan adjust the spectrogramenhancement parameter toemphasize the amplitude range ofinterest. The symbol transitionsare most clearly seen in colordisplays.
For the first measurement, the analyzer’s Trace Selectspectrogram marker will be used. This allows one spectrummeasurement to be selected fromthe spectrogram and displayed inanother display trace, as shownin Figure 6.
Figure 6. Spectrogram and spectrum measurements of preamble and first symbols ofdownlink subframe. The Trace Select marker is used in spectrogram to identify individualspectrum measurement for display in bottom trace. Note that the occupied bandwidth ofthe signal is somewhat wider during the preamble.
17
Time and Frequency Domain (Vector) Measurements (continued)
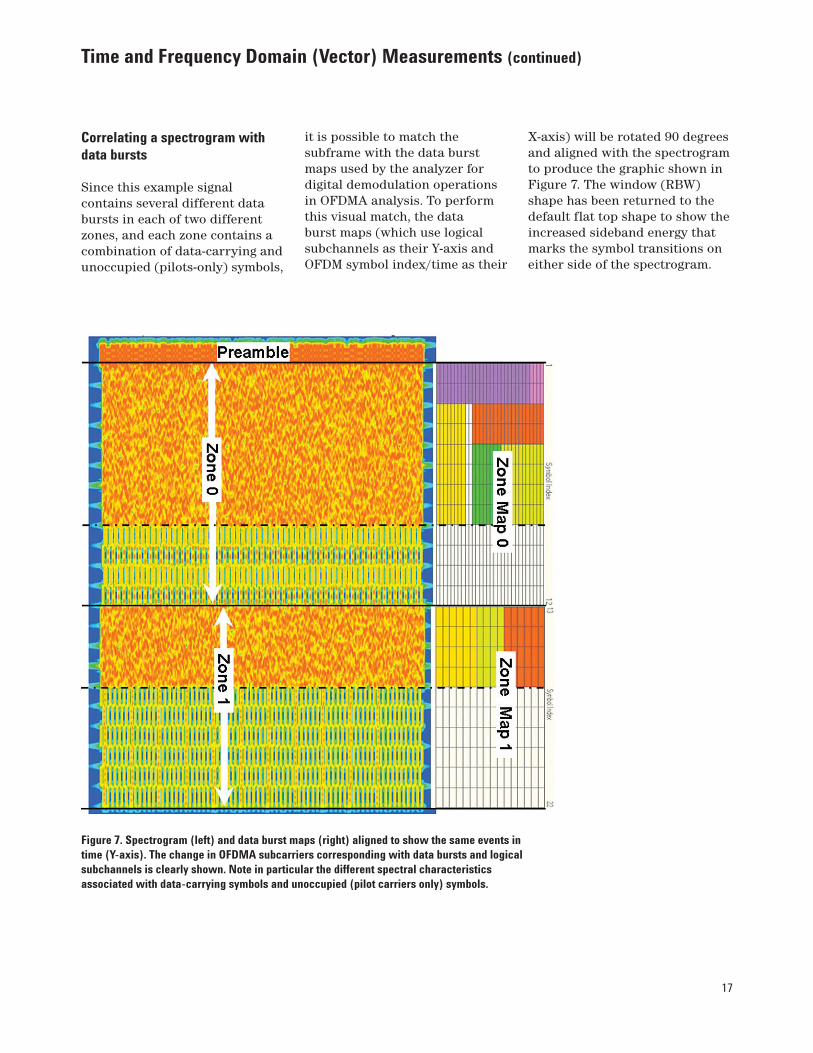
Correlating a spectrogram withdata bursts
Since this example signalcontains several different databursts in each of two differentzones, and each zone contains acombination of data-carrying andunoccupied (pilots-only) symbols,
it is possible to match thesubframe with the data burstmaps used by the analyzer fordigital demodulation operationsin OFDMA analysis. To performthis visual match, the data burst maps (which use logicalsubchannels as their Y-axis andOFDM symbol index/time as their
X-axis) will be rotated 90 degreesand aligned with the spectrogramto produce the graphic shown inFigure 7. The window (RBW)shape has been returned to thedefault flat top shape to show theincreased sideband energy thatmarks the symbol transitions oneither side of the spectrogram.
Figure 7. Spectrogram (left) and data burst maps (right) aligned to show the same events intime (Y-axis). The change in OFDMA subcarriers corresponding with data bursts and logicalsubchannels is clearly shown. Note in particular the different spectral characteristicsassociated with data-carrying symbols and unoccupied (pilot carriers only) symbols.
18
Time and Frequency Domain (Vector) Measurements (continued)
Vector measurements summary
As the examples here show, youcan understand, measure, andverify many of the most importantcharacteristics of the OFDMAsignal before performing digitalmodulation analysis. Indeed, theuse of vector time and frequencydomain analysis to more fullyunderstand the signal and itscharacteristics will improvedigital modulation analysis andmay reveal to you problems orimpairments which wouldotherwise remain obscure.
By adjusting the spectrogramparameters, the structure of thesubframe and its data bursts isrevealed. Even the timing of theindividual symbol transitions can be seen by the temporaryincrease in sidelobe energy at the left and right edges of thespectrogram. Especially distinctspectral changes are obvious in the latter part of each zone,where the data bursts have endedand only pilot subcarriers aretransmitted. The changingsubcarrier numbers of thesepilots from symbol to symbol arealso shown in the spectrogram.With X-axis scaling and thespectrogram’s Trace Selectfunction, you could see details of pilot and subcarrier behavioron a symbol-by-symbol basis. Ingeneral, the use of the uniformwindow (Figure 3 above) providesthe best frequency resolution forresolving OFDM subcarriers, andthe flat top and Gaussian windowsprovide the dynamic range toreveal the symbol transitions.
19
Frequency,frequency and time
Basicdigital demod
Advanced andspecific demod
Get basics right,find major problems
Signal quality numbers, constellation, basic error vector measurements
Find specific problems and causes
Table 3. Basic digital demodulation measurements verify proper modulation and quantify the main errorparameters such as EVM vs. symbol and subcarrier.
• Set up demod anddisplays
• Constellation • Error summary • Error vector
spectrum • Error vector time • Cross-domain and
cross-measurementlinks
• Parameteradjustment
• More time capture
Basic Digital Demodulation
The goal of basic digitaldemodulation is successful andvalid demodulation of the signal(a “locked” demodulation resultwith correctly detected symbolstates, etc.). This demodulationwill produce a wide variety of valid modulation qualitymeasurements plus basic errordisplays primarily in terms oftime (or OFDM symbol) andfrequency (or OFDM subcarrier).
The information gained duringinitial vector measurementsenhances the reliability of digitaldemodulation measurements andthe insight provided by them.
For some measurement tasks,especially design verification,basic digital demodulation will besufficient. The error summarytable provides a completenumeric summary of signalquality and the magnitude ofmajor error types. A large amountof measurement data is availableat this stage and you can performsignificant troubleshooting aswell. Error vector time andfrequency measurements, inparticular, are an excellent way tobegin tracking down potentialproblem sources.
One powerful technique (oftenoverlooked, and not available inmany other product solutions) is to use marker coupling to link error measurementsacross different domains. Errorsources may be invisible in onemeasurement type and obvious inanother. This is particularly truein multicarrier formats such asOFDMA, and we will discusssome examples of the use ofmarker coupling in this note.
20
Basic Digital Demodulation (continued)
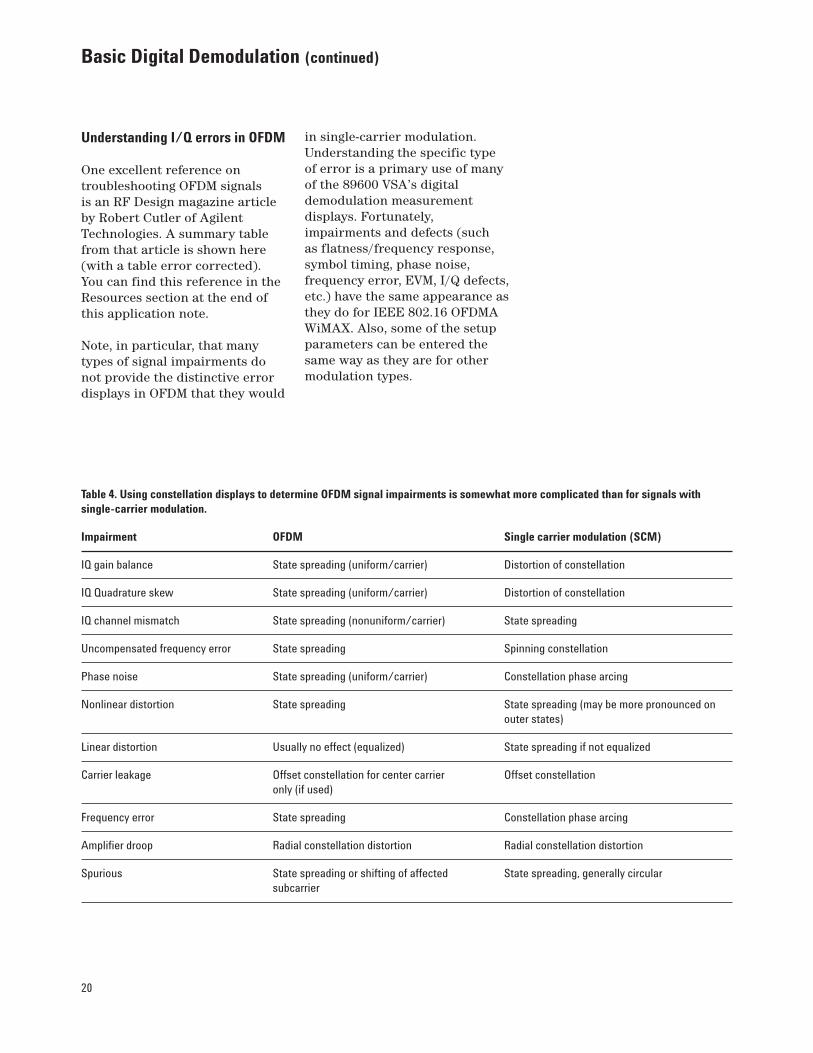
Understanding I/Q errors in OFDM
One excellent reference ontroubleshooting OFDM signals is an RF Design magazine articleby Robert Cutler of AgilentTechnologies. A summary tablefrom that article is shown here(with a table error corrected).You can find this reference in theResources section at the end ofthis application note.
Note, in particular, that manytypes of signal impairments donot provide the distinctive errordisplays in OFDM that they would
in single-carrier modulation.Understanding the specific typeof error is a primary use of manyof the 89600 VSA’s digitaldemodulation measurementdisplays. Fortunately,impairments and defects (such as flatness/frequency response,symbol timing, phase noise,frequency error, EVM, I/Q defects,etc.) have the same appearance asthey do for IEEE 802.16 OFDMAWiMAX. Also, some of the setupparameters can be entered thesame way as they are for othermodulation types.
Table 4. Using constellation displays to determine OFDM signal impairments is somewhat more complicated than for signals withsingle-carrier modulation.
Impairment OFDM Single carrier modulation (SCM)
IQ gain balance State spreading (uniform/carrier) Distortion of constellation
IQ Quadrature skew State spreading (uniform/carrier) Distortion of constellation
IQ channel mismatch State spreading (nonuniform/carrier) State spreading
Uncompensated frequency error State spreading Spinning constellation
Phase noise State spreading (uniform/carrier) Constellation phase arcing
Nonlinear distortion State spreading State spreading (may be more pronounced on outer states)
Linear distortion Usually no effect (equalized) State spreading if not equalized
Carrier leakage Offset constellation for center carrier Offset constellationonly (if used)
Frequency error State spreading Constellation phase arcing
Spurious State spreading or shifting of affected State spreading, generally circularsubcarrier
21
Basic Digital Demodulation (continued)
Capturing a signal for analysis
To make accurate demodulationmeasurements, the analyzer setupmust match the signal. Thismatching process may involvesome experimentation withdemodulator settings andcharacteristics, and the use of the89600 VSA's time capture can bevery helpful in this effort. Bycapturing one or more examplesof the signal for repeatedplayback, you can be assured thatany changes in the demodulationresult (including bothsuccess/failure of demodulationand changes in measured signalquality) are the results of theintended setup changes and not a consequence of changes in thesignal itself. This approach reducesthe number of variables in signalanalysis and troubleshooting and improves the chances forconsistent and meaningfulresults. The use of time capturefiles has additional benefits,allowing you to archive signals forfuture comparisons and providingan easy method to distributesignals to different design teams.
In the 89600 VSA, time captureoperations primarily require the setting of analyzer centerfrequency and span, and selectionof a capture length. Generally afrequency span of 1.2 to 1.5 timesthe nominal bandwidth issufficient. The center frequencyneed not be exact, as you canchange both center frequency andspan after signal capture. You canset the length of the time capturein terms of samples (expressed as a number of time records) ortime. For signals such as thosedescribed here, a capture of one tofive frames should be sufficient.The time capture operation canbe a triggered event, and it isuseful to trigger on the risingedge of the burst, with a negative(pre-trigger) delay of 5 to 50% ofthe burst length. Trigger holdoff,if necessary, should be set asdescribed previously in the vector measurements section ofthis note.
22
Basic Digital Demodulation (continued)
Two types of demodulationmeasurements
When analyzing OFDMA signalswith the 89600 VSA software, thereare two types of demodulationmeasurements to make: “uniform”mode and “data burst” mode. In auniform mode measurement, theanalyzer assumes that the signalwill have only one type ofmodulation and one power levelthroughout the permutation zoneto be analyzed. In “data burst”analysis, the analyzerdemodulates the signal accordingto a subchannel-by-symbol (or“slot”) “zone definition” grid thatthe user creates or provides inthe form of a setup file. This gridindicates the type of modulationused for each logical subchanneland each symbol of the subframe,allowing the analyzer todemodulate and display theindividual data bursts, eitherseparately or together, and toproduce a Data Burst Info summaryresults table, which will bedescribed later in this note.
One good approach for gettingdemodulation working andmaking modulation errormeasurements with the minimumamount of difficulty is to limit the complexity of the signal. An excellent way to limit thecomplexity of the signal is to usea “uniform” signal. As used in thisnote, the uniform signal is limitedto a single modulation type anduses all logical subchannels (andtherefore all subcarriers) for the
entire subframe. The power of theuniform signal remains constantfor each symbol in the subframe.In addition, the pilots (relative towhich the signal is demodulated)are easy to find.
This simplified signal is not anappropriate one for normalsystem operation, since one of thelimitations on its complexity is itslack of a QPSK-modulated framecontrol header (FCH).
The uniform signal offers benefitsfor both signal creation andsignal analysis. On the creationend, the uniform signal can becreated in the same way thatsimpler OFDM signals are,reducing the chance for DSP orother errors in signal creationwhich might be confused witherrors in modulation analysis(parameter) setup, demodulationalgorithms, etc.
Since the uniform signal isgenerally representative of othersignals in terms of spectrum andpower statistics, it is a good testsignal for testing part or all of the RF signal chain. The uniformsignal is spectrally correct and usually correct for powerstatistics as well: these statisticsshould approach the AWGNcurve. While downlink signals canchange power during a subframe,for a single OFDM symbol, theCCDF power statistics should besimilar between uniform andnonuniform signals.
23
Basic Digital Demodulation (continued)
Downlink modulation qualitymeasurements of a uniform signal
This downlink analysis will usethe example downlink recordingi80216e_DLPuscUniformQ64.sdfsupplied with the 89600 VSAsoftware. Many importantcharacteristics of this signal can be determined using thetechniques described previouslyin the vector measurementssection of this note. For example,the signal is 22 OFDM symboltimes long in total, including 20symbols of 64QAM data plus thepreamble. This uniform signaloccupies all of the slots in thezone, which means that all of the OFDM subcarriers are activethroughout the subframe and aremodulated with 64QAM (exceptfor the pilots, which aremodulated with BPSK).
As described above, it is generallyhelpful to make the vector (timeenvelope and spectrum or gatedspectrum) measurements on asignal before setting up toperform digital demodulation.Accordingly, it is assumed herethat the signal has no grossuncorrected defects that could beseen in vector mode, and whichcould be expected to preventdigital demodulation.
Whether entered directly orderived from the vectormeasurements describedpreviously, it is assumed that the signal analyzer’s amplitudeparameters (attenuation or inputrange), frequency parameters
(center, span) and triggerconditions (external/internal andtrigger level delay and holdoff, ifnecessary) have been correctlyset. In many cases the VSA’spulse search capability willeliminate the need for triggeringand for selecting parametersincluding holdoff.
Set the center frequency to themost accurate value known or derived from previousmeasurements. The analyzer will calculate the precise centerfrequency of the signal during thedemodulation process, and theanalyzer will also report the error in the error summary table.In general, the demodulationalgorithms should operate well on OFDMA signals where theselected center frequency isaccurate to within about one halfof the OFDM carrier spacing. Ifyou suspect a configuration errorlarger than this value, you canconfigure the 89600 VSA softwarefor a larger demodulation carrierlock range by selecting the ExtendFrequency Lock Range check box inthe Advanced tab of the OFDMADemodulation Properties dialog box.This expanded lock range is onlyavailable for uplink signals, dueto their lack of a preamble. Oncea more accurate center frequencyis derived from a lockeddemodulation measurement, thatfrequency should be selected asthe analyzer center frequency,and you should clear the ExtendFrequency Lock Range box to yieldthe most stable and accuratedemodulation results.
Recall that when using recordedsignals with the 89600 VSA, youcan change the analyzer's centerfrequency and span during anystage or mode of analysis – evenafter the recording is made. Thisis true so long as the desiredanalysis span is contained fullywithin the original recording span.
The default demodulationsettings for the 89600 VSAinclude a pulse search function,so triggering is not usuallynecessary for pulsed signals suchas most OFDMA downlink anduplink signals. However, if thesignal under test includes bothuplink and downlink signals,and/or if the intent is to measurea specific RF burst among others,you would normally use triggering.This triggering can be internaltriggering, where a combinationof trigger level, negative/positivetrigger delay, and trigger holdoffare used to select the desired RFburst. Alternatively, you can useexternal triggering when anexternal trigger signal is available.Both negative and positive triggerdelay are available for this triggertype, and they can be used tomeasure a specific burst even ifthe trigger is not coincident withthe burst. Indeed, you wouldordinarily use external triggeringto examine the relationshipbetween a supplied trigger signaland RF burst power (vectormode) or between a suppliedtrigger and data modulation(digital demodulation mode).
24
Basic Digital Demodulation (continued)
Figure 8. The Format tab of the Demodulation Properties dialogbox is where the IEEE 802.16e standard and the maindemodulation properties are selected.
The first step in digitaldemodulation is to select thedemodulation mode. You do thisfrom the analyzer’s MeasSetup >Demodulator > Broadband WirelessAccess menu sequence, where802.16 OFDMA is chosen. The nextstep is to bring up the 802.16OFDMA Demodulation Propertiesdialog box (MeasSetup > DemodProperties) and its four tabs,beginning with the Format tab, as shown in Figure 8.
The Format tab contains adrop-down list used to select the applicable standard. Thisselection should be the firstaction you take in setting updigital demodulation. Selectingthe standard configures certainproperties of the demodulator, as described in detail in theanalyzer’s online Help facility.Next to this box is the Preset toStandard button, and it isgenerally a good idea to use thisbutton once the standard isselected. There are very manymeasurement configuration anddemodulation parameters to setwhen performing OFDMAdemodulation, and this buttonwill reset most of them, reducingthe chance that parametersspecific to a prior measurementwill be incompatible with thecurrent one.
The 89600 VSA software supportstwo standards: the approvedIEEE 802.16e OFDMA standard,plus an additional proposedstandard (Corrigendum 1, Draft2), useful for troubleshootingsystems developed earlier. Thereare 3 pre-set profiles to choosefrom: 5 MHz, 10 MHz, and WiBro.To examine our current signal,i80216e_DLPuscUniformQ64.sdf,select the 10 MHz profile.
For this measurement we want touse the “uniform zone analysis”
mode and not “data burstanalysis.” Note that the currentdefinition of the standard presetdoes select the data burstanalysis mode. This setting needsto be changed, and you can dothis by clearing the Data BurstAnalysis box on the Zone Definitiontab of the Demod Properties dialogbox. On the right side of theFormat tab, select the appropriatesubframe, either Uplink orDownlink. Note that this section ofthe application note describes adownlink measurement.
25
Basic Digital Demodulation (continued)
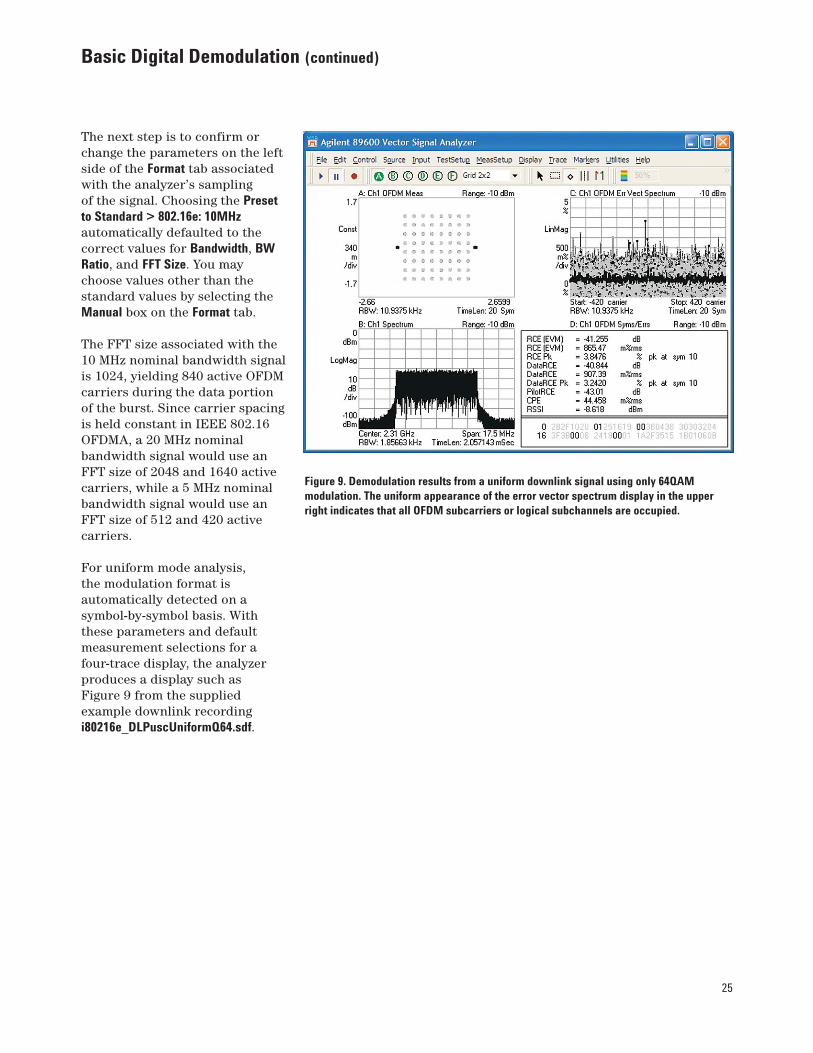
Figure 9. Demodulation results from a uniform downlink signal using only 64QAMmodulation. The uniform appearance of the error vector spectrum display in the upperright indicates that all OFDM subcarriers or logical subchannels are occupied.
The next step is to confirm orchange the parameters on the leftside of the Format tab associatedwith the analyzer’s sampling of the signal. Choosing the Presetto Standard > 802.16e: 10MHzautomatically defaulted to thecorrect values for Bandwidth, BWRatio, and FFT Size. You maychoose values other than thestandard values by selecting theManual box on the Format tab.
The FFT size associated with the10 MHz nominal bandwidth signalis 1024, yielding 840 active OFDMcarriers during the data portionof the burst. Since carrier spacingis held constant in IEEE 802.16OFDMA, a 20 MHz nominalbandwidth signal would use anFFT size of 2048 and 1640 activecarriers, while a 5 MHz nominalbandwidth signal would use anFFT size of 512 and 420 activecarriers.
For uniform mode analysis, the modulation format isautomatically detected on asymbol-by-symbol basis. Withthese parameters and defaultmeasurement selections for afour-trace display, the analyzerproduces a display such asFigure 9 from the suppliedexample downlink recordingi80216e_DLPuscUniformQ64.sdf.
26
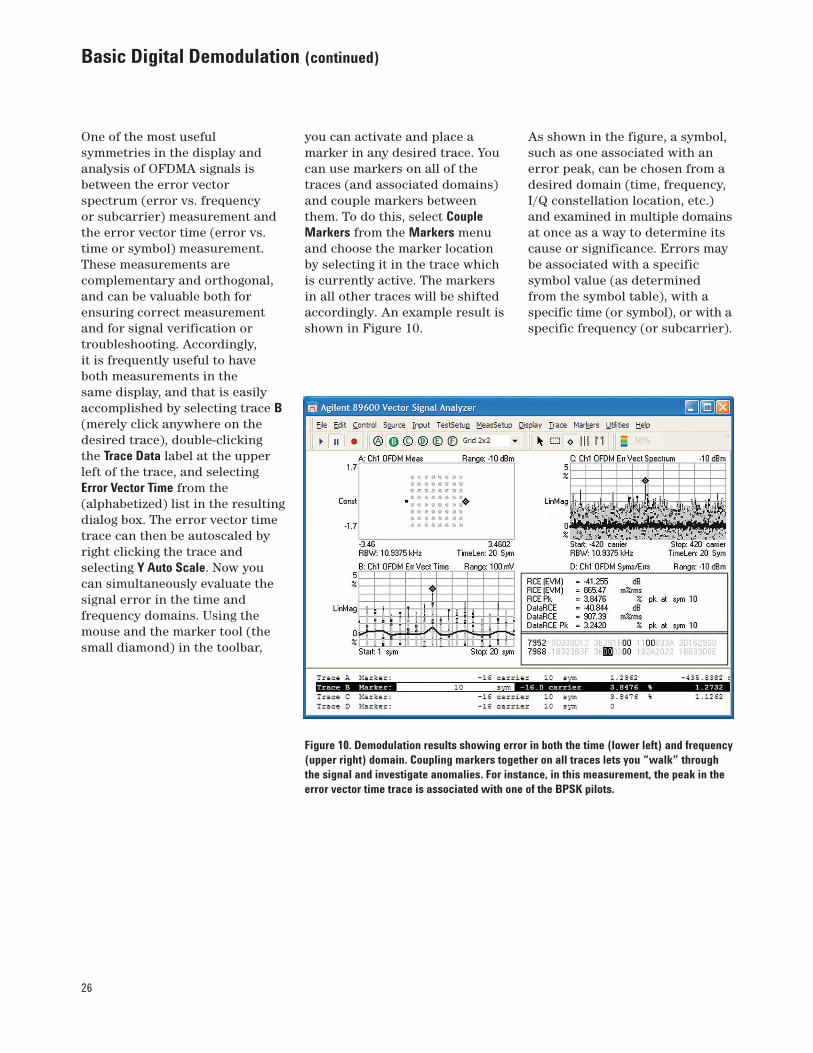
Figure 10. Demodulation results showing error in both the time (lower left) and frequency(upper right) domain. Coupling markers together on all traces lets you “walk” throughthe signal and investigate anomalies. For instance, in this measurement, the peak in theerror vector time trace is associated with one of the BPSK pilots.
As shown in the figure, a symbol,such as one associated with anerror peak, can be chosen from adesired domain (time, frequency,I/Q constellation location, etc.)and examined in multiple domainsat once as a way to determine itscause or significance. Errors maybe associated with a specificsymbol value (as determinedfrom the symbol table), with aspecific time (or symbol), or with aspecific frequency (or subcarrier).
One of the most usefulsymmetries in the display andanalysis of OFDMA signals isbetween the error vectorspectrum (error vs. frequency or subcarrier) measurement andthe error vector time (error vs.time or symbol) measurement.These measurements arecomplementary and orthogonal,and can be valuable both forensuring correct measurementand for signal verification ortroubleshooting. Accordingly, it is frequently useful to haveboth measurements in the same display, and that is easilyaccomplished by selecting trace B(merely click anywhere on thedesired trace), double-clicking the Trace Data label at the upperleft of the trace, and selectingError Vector Time from the(alphabetized) list in the resultingdialog box. The error vector timetrace can then be autoscaled byright clicking the trace andselecting Y Auto Scale. Now youcan simultaneously evaluate thesignal error in the time andfrequency domains. Using themouse and the marker tool (thesmall diamond) in the toolbar,
you can activate and place amarker in any desired trace. Youcan use markers on all of thetraces (and associated domains)and couple markers betweenthem. To do this, select CoupleMarkers from the Markers menuand choose the marker locationby selecting it in the trace whichis currently active. The markersin all other traces will be shiftedaccordingly. An example result isshown in Figure 10.
Basic Digital Demodulation (continued)
27
Basic Digital Demodulation (continued)
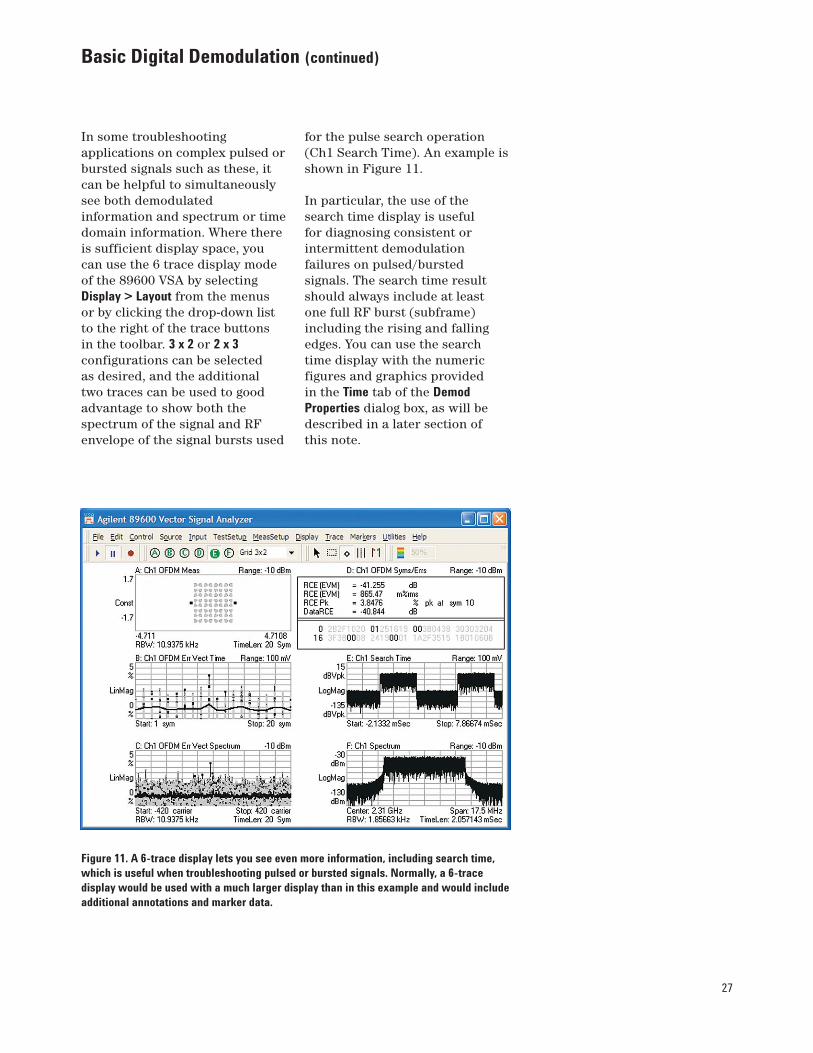
Figure 11. A 6-trace display lets you see even more information, including search time,which is useful when troubleshooting pulsed or bursted signals. Normally, a 6-tracedisplay would be used with a much larger display than in this example and would includeadditional annotations and marker data.
In some troubleshootingapplications on complex pulsed orbursted signals such as these, itcan be helpful to simultaneouslysee both demodulatedinformation and spectrum or timedomain information. Where thereis sufficient display space, youcan use the 6 trace display modeof the 89600 VSA by selectingDisplay > Layout from the menusor by clicking the drop-down listto the right of the trace buttons in the toolbar. 3 x 2 or 2 x 3configurations can be selected as desired, and the additional two traces can be used to goodadvantage to show both thespectrum of the signal and RFenvelope of the signal bursts used
for the pulse search operation(Ch1 Search Time). An example isshown in Figure 11.
In particular, the use of thesearch time display is useful for diagnosing consistent orintermittent demodulationfailures on pulsed/burstedsignals. The search time resultshould always include at leastone full RF burst (subframe)including the rising and fallingedges. You can use the searchtime display with the numericfigures and graphics provided in the Time tab of the DemodProperties dialog box, as will bedescribed in a later section of this note.
28
Basic Digital Demodulation (continued)
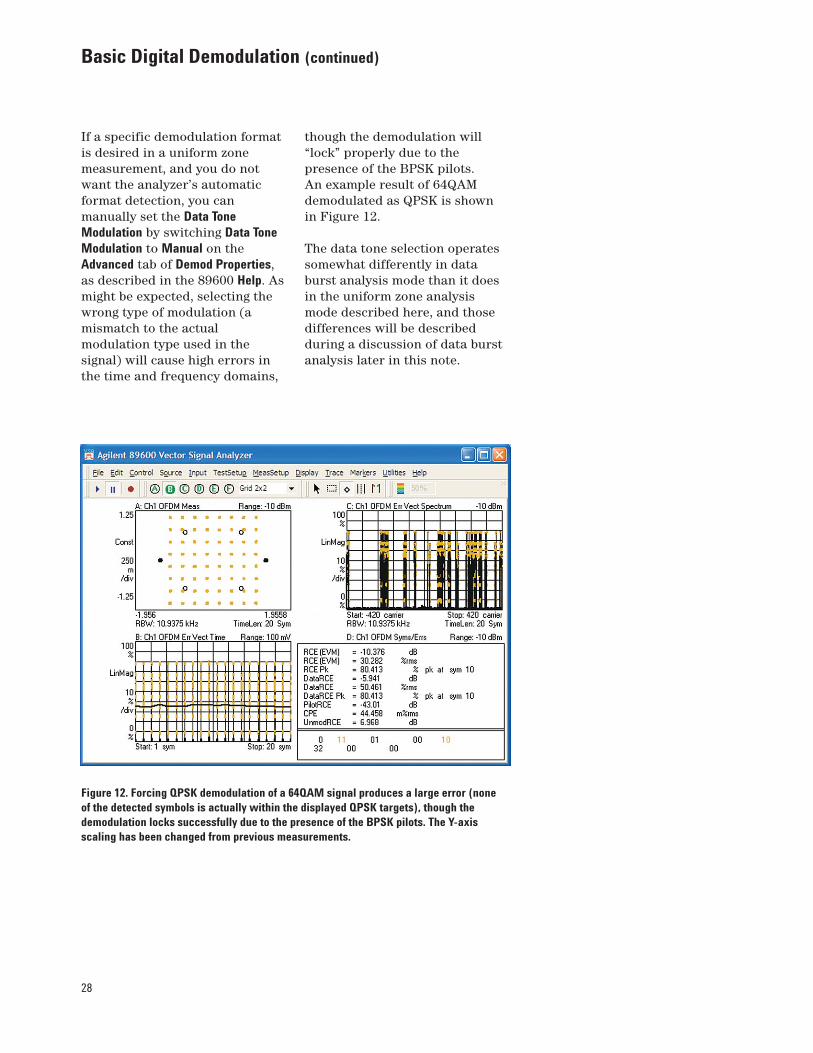
Figure 12. Forcing QPSK demodulation of a 64QAM signal produces a large error (noneof the detected symbols is actually within the displayed QPSK targets), though thedemodulation locks successfully due to the presence of the BPSK pilots. The Y-axisscaling has been changed from previous measurements.
If a specific demodulation formatis desired in a uniform zonemeasurement, and you do notwant the analyzer’s automaticformat detection, you canmanually set the Data ToneModulation by switching Data ToneModulation to Manual on theAdvanced tab of Demod Properties,as described in the 89600 Help. Asmight be expected, selecting thewrong type of modulation (amismatch to the actualmodulation type used in thesignal) will cause high errors inthe time and frequency domains,
though the demodulation will“lock” properly due to thepresence of the BPSK pilots. An example result of 64QAMdemodulated as QPSK is shown in Figure 12.
The data tone selection operatessomewhat differently in databurst analysis mode than it doesin the uniform zone analysismode described here, and thosedifferences will be describedduring a discussion of data burstanalysis later in this note.
29
Basic Digital Demodulation (continued)
Downlink modulation qualitymeasurements of a burst(nonuniform) signal
The next discussion of digitaldemodulation of a downlinksignal will use the exampledownlink recordingi80216e_DL10MHz.sdf, suppliedwith the 89600 VSA software.
Prior to recalling any signal, it isa good idea to use File > Preset >Preset Setup to place the analyzerin a known state.
This new signal contains twozones (i.e., it is not a uniformsignal) and is 23 symbol times in length. The first zone is PUSCand has an FCH (frame controlheader), DL-MAP, UL-MAP, andthree data bursts: one each ofQPSK, 16QAM, and 64QAM. Itoccupies 12 symbols, though nodata bursts occupy the last 4symbols. The second zone isFUSC and contains three databursts: one each of QPSK,16QAM, and 64QAM. They occupythe first 4 symbols of the 10
symbol FUSC zone, leaving thelast 6 symbols unoccupied. Notethat you can see any of theseunoccupied symbols on the time trace. The total downlinksubframe is then 22 symbols plusthe preamble.
This discussion will describe databurst analysis, using the ZoneDefinition Map file supplied withthe signal recording as part of thenormal 89600 VSA softwareinstallation.
Remember, from our previousdiscussion, that it is generallyhelpful to make vector (timeenvelope and spectrum or gatedspectrum) measurements on asignal before setting up toperform digital demodulation.Once successfully completed, youcan continue with moreconfidence.
As with the previous measurement,digital demodulation begins with selection of the digitaldemodulation mode in the 89600VSA and use of the Preset to
Standard > 802.16e: 10 MHz in theDemod Properties dialog box’sFormat tab. In this case we wantto perform data burst analysis, sowe will not change the results ofthe preset operation in this area.
The selection of the DownlinkSubframe and the Preset to Standardoperation on the Format tabcauses the synchronization to failwith this example signal becauseit uses a nonzero preamble index.Changing the Use Preamble Indexto 14 (which can be determinedby experimentation with differentvalues) will correct this. Note that the SyncCorr value on theSyms/Errs table changes from0.04 to 0.98 after correcting thisvalue. After this setup you will bemeasuring only the FCH (framecontrol header) data burst.Without using a map file orotherwise defining data bursts,the only burst whose modulationand location is known (by theanalyzer, from the standard) isthe FCH.
30
Basic Digital Demodulation (continued)
Figure 13. Measurement of a downlink PUSC signal. As indicated by the constellationdisplay and color-coding, this measurement only includes the BPSK pilots and theQPSK FCH. The color coding of the data bursts is consistent across all traces.
You can verify this by examiningthe constellation display, whereonly QPSK and BPSK modulationare present. Note that in thedefault color coding configurationfor the 89600 VSA, the BPSK pilotsymbols are shown in white (thedefault has been changed here forclarity in monochrome printing),and the QPSK FCH symbols areshown in pink as in Figure 13.
31
Basic Digital Demodulation (continued)
OFDMA Signal Maps
The IEEE 802.16 OFDMA signal structure is very complex. The analyzer setupmust match the setup of the transmitted signal. There are three ways to do thisin the analyzer.
The first, and easiest, is to recall an Agilent N7615A Signal Studio for 802.16OFDMA setup file. To do this, simply go to the 89600 VSA tool bar and selectFile > Recall > Recall Signal Studio Setup. This provides the analyzer with azone definition map matching the signal created with the N7615A SignalStudio for 802.16 OFDMA. Thus, you only need to create the signal definition once.
The second way is to use the Zone Definition Grid. The Zone Definition Grid isa dynamic graphical user interface used to create uplink and downlink zonedefinitions. You specify the data burst signal characteristics (name, data tonemodulation, symbol length/offset, etc.) and then use the mouse to map thedata burst region within the zone area of the Zone Definition Grid. When youhave defined all the data bursts for the zone, you can save the completed zonedefinition to a map file.
The third way is to use a Map File. A Map File contains zone definitions in afile (.omf extension) to simplify making measurements of frequently usedsignals. You can Create, Edit, Delete, Export, and Import map files. Map filescan save very complicated OFDMA frame analysis zone definitions, whichmake them a time-saving and accurate method to repeat a measurement. Also, map files are ideal for recreating the identical measurement made byother users.
32
Basic Digital Demodulation (continued)
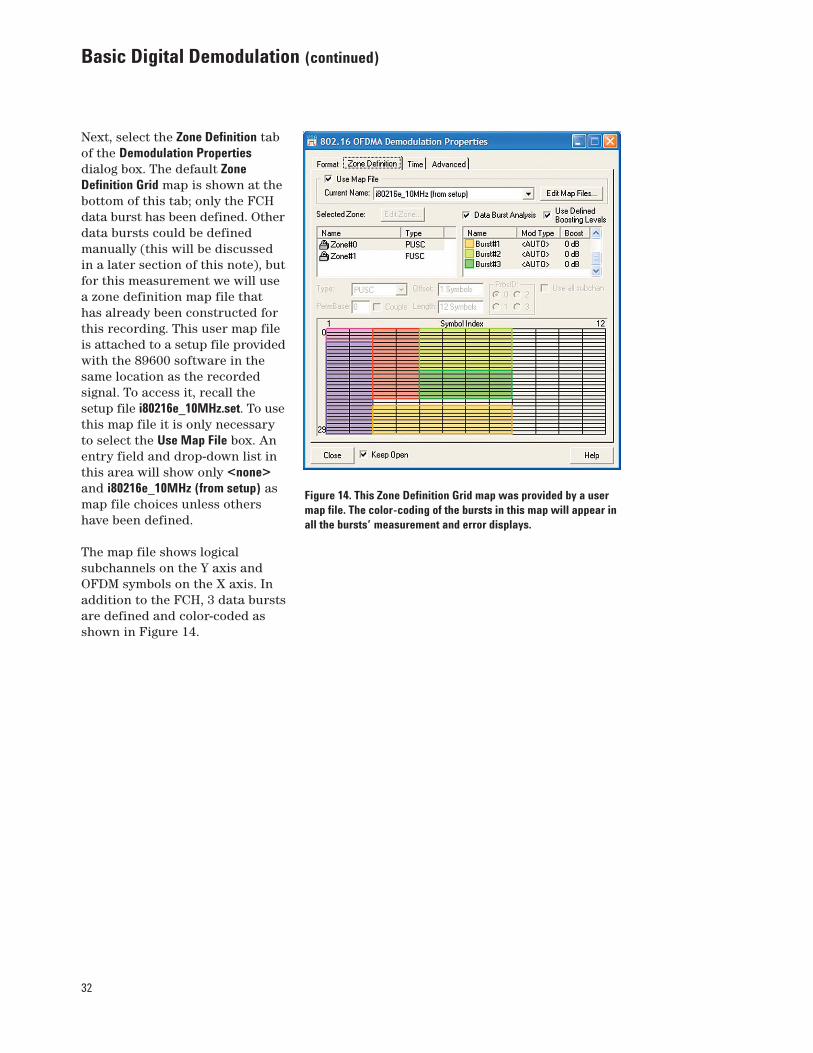
Figure 14. This Zone Definition Grid map was provided by a usermap file. The color-coding of the bursts in this map will appear inall the bursts’ measurement and error displays.
Next, select the Zone Definition tabof the Demodulation Propertiesdialog box. The default ZoneDefinition Grid map is shown at thebottom of this tab; only the FCHdata burst has been defined. Otherdata bursts could be definedmanually (this will be discussedin a later section of this note), butfor this measurement we will usea zone definition map file thathas already been constructed forthis recording. This user map fileis attached to a setup file providedwith the 89600 software in thesame location as the recordedsignal. To access it, recall thesetup file i80216e_10MHz.set. To usethis map file it is only necessaryto select the Use Map File box. Anentry field and drop-down list inthis area will show only <none>and i80216e_10MHz (from setup) asmap file choices unless othershave been defined.
The map file shows logicalsubchannels on the Y axis andOFDM symbols on the X axis. Inaddition to the FCH, 3 data burstsare defined and color-coded asshown in Figure 14.
33
Basic Digital Demodulation (continued)
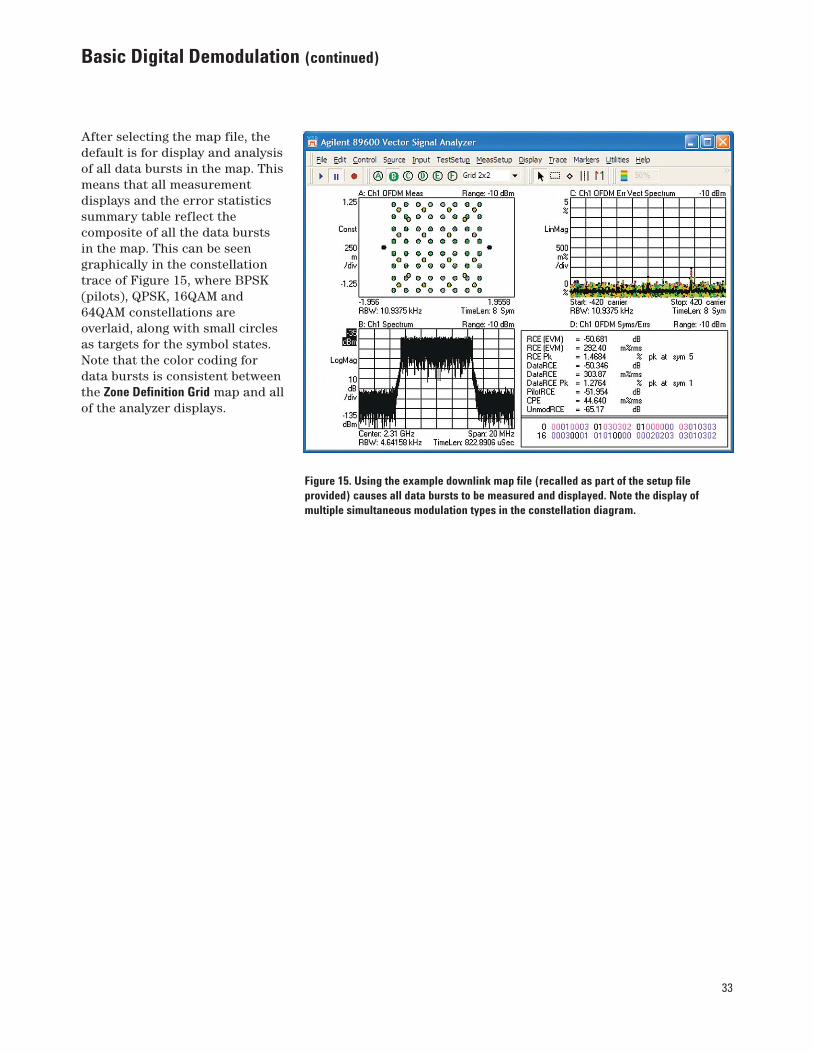
After selecting the map file, thedefault is for display and analysisof all data bursts in the map. Thismeans that all measurementdisplays and the error statisticssummary table reflect thecomposite of all the data bursts in the map. This can be seengraphically in the constellationtrace of Figure 15, where BPSK(pilots), QPSK, 16QAM and64QAM constellations areoverlaid, along with small circlesas targets for the symbol states.Note that the color coding fordata bursts is consistent betweenthe Zone Definition Grid map and allof the analyzer displays.
Figure 15. Using the example downlink map file (recalled as part of the setup fileprovided) causes all data bursts to be measured and displayed. Note the display ofmultiple simultaneous modulation types in the constellation diagram.
34
Basic Digital Demodulation (continued)
Data burst analysis can be usedto display and analyze single databursts or selected groups. Toselect a specific data burst, clickthe Zone Definition Grid, or click theBurst name in the list box abovethe map. The list box shows theburst name, modulation type, andboost level. After selecting a databurst for analysis, you will see the analyzer displays change to reflect the measuredcharacteristics and data of theselected burst. The displays willgenerally be updated immediatelyafter you make these changes, andit will not be necessary to acquirenew data. For bursts such as these,where the modulation format isdifferent for each one, the easiestway to see the change is to watchthe constellation display.
To select and measure multipledata bursts at once, press the Ctrlkey while clicking the desireddata bursts. To select all databursts, right-click the Data Burstlist box or the Zone Definition Grid,and click Select All.
One diagnostic clue for the properconfiguration of a transmitter, orof the Zone Definition Grid map inthe analyzer, is the absence ofsymbols at the center or origin ofthe constellation when measuringdownlink signals. Symbols in this location indicate that theanalyzer is expecting a modulatedsubcarrier at a frequency where itis receiving little or no signalenergy. This phenomenonindicates that one or more databursts are configured to expectlogical subchannels or individualsubcarriers which are not beingtransmitted. You can diagnose thespecifics by coupling theanalyzer’s markers, setting themarker on one or more of thecenter constellation symbols, anddetermining whether the symbolsare all associated with subcarrierswhich can be identified withspecific logical subchannels.
35
Basic Digital Demodulation (continued)
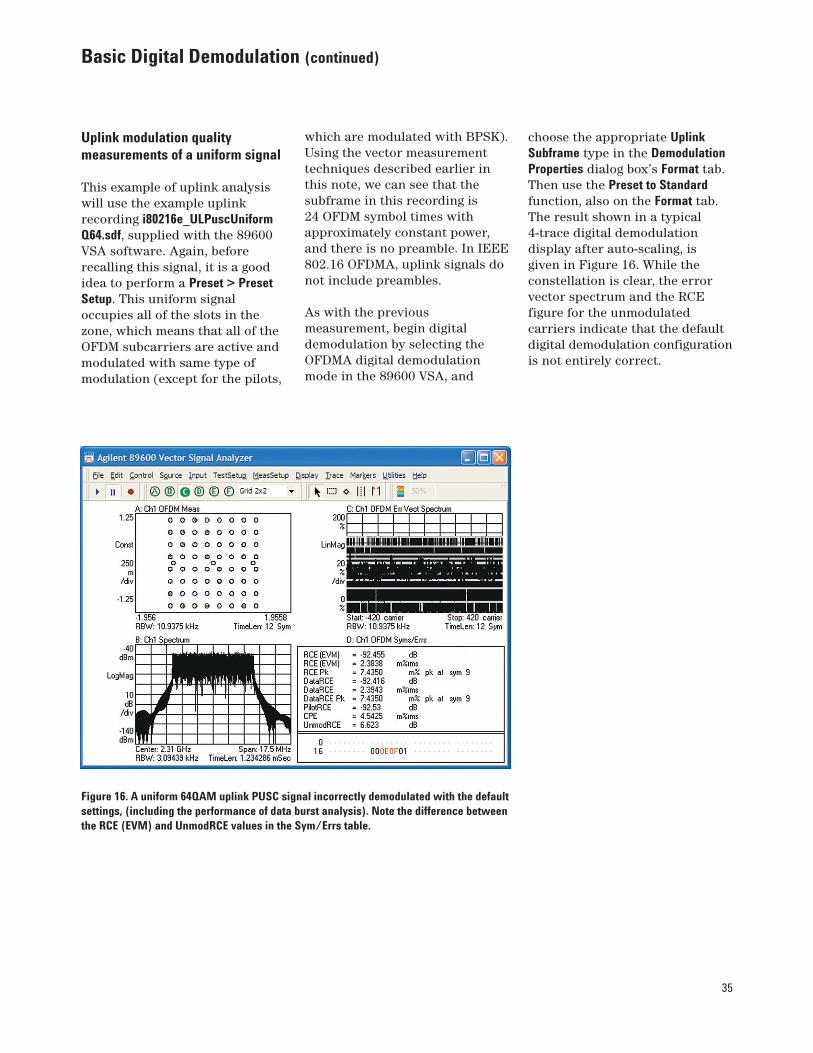
Figure 16. A uniform 64QAM uplink PUSC signal incorrectly demodulated with the defaultsettings, (including the performance of data burst analysis). Note the difference betweenthe RCE (EVM) and UnmodRCE values in the Sym/Errs table.
Uplink modulation qualitymeasurements of a uniform signal
This example of uplink analysiswill use the example uplinkrecording i80216e_ULPuscUniformQ64.sdf, supplied with the 89600VSA software. Again, beforerecalling this signal, it is a goodidea to perform a Preset > PresetSetup. This uniform signaloccupies all of the slots in thezone, which means that all of theOFDM subcarriers are active andmodulated with same type ofmodulation (except for the pilots,
which are modulated with BPSK).Using the vector measurementtechniques described earlier inthis note, we can see that thesubframe in this recording is 24 OFDM symbol times withapproximately constant power,and there is no preamble. In IEEE802.16 OFDMA, uplink signals donot include preambles.
As with the previousmeasurement, begin digitaldemodulation by selecting theOFDMA digital demodulationmode in the 89600 VSA, and
choose the appropriate UplinkSubframe type in the DemodulationProperties dialog box’s Format tab.Then use the Preset to Standardfunction, also on the Format tab.The result shown in a typical4-trace digital demodulationdisplay after auto-scaling, is given in Figure 16. While theconstellation is clear, the errorvector spectrum and the RCEfigure for the unmodulatedcarriers indicate that the defaultdigital demodulation configurationis not entirely correct.
36
Basic Digital Demodulation (continued)
Fortunately, there are indicationsof a way to correct the analyzerconfiguration. First, theconstellation shows that carrierlock and symbol lock have beenachieved. Second, the use of databurst analysis (the default in thePreset to Standard operation) is notneeded when analyzing a uniformsignal. However, before we switchoff data burst analysis, it is usefulto notice several things about theconstellation and the Syms/Errstable. The constellation is clearlylocked to something, althoughcolor-coding indicates a mixing of the pilot and data locations. In addition, the error vector time trace is very high, while the numerical error data (RCE)reported in the Syms/Errs table isquite low – with one exception: theUnmodRCE data (representingthe RCE of unmodulated carriers).
The reason for this result can beseen by going to the Advanced tabof Demod Properties. The analyzer’sdefault settings for severalparameters are different for UL
and DL signals. For UL signals, thedefault is to include all inactivesubchannels in all traces. In theSym/Errs tabular data, the errorsare always broken out by carriertype: Data RCE, Pilot RCE, andUnMod RCE. By turning off UseDefault Settings and Include InactiveSubchannels on the Advanced tabof the Demodulation Properties tab,the trace error displays appearmore congruent with the errordata values being displayed in theSym/Errs table.
You can adjust other parameterson this tab as well, includingdirecting the analyzer toauto-detect modulation format, ormanually setting the modulationformat for uniform signals. Forburst signals, you can either letthe analyzer automatically detectthe modulation format, or force itto use the modulation formatsdescribed in the burst definitions.Note that the analyzer willattempt to use these definitionswhether they are correct or not.
37
Basic Digital Demodulation (continued)
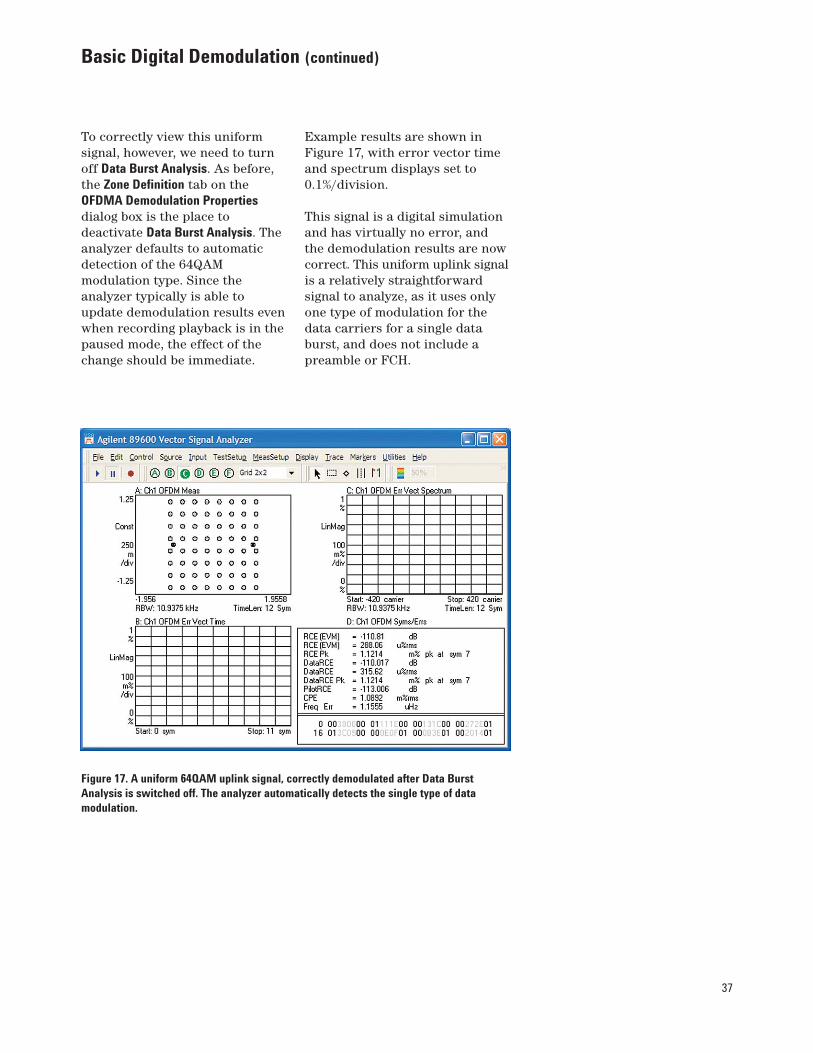
Figure 17. A uniform 64QAM uplink signal, correctly demodulated after Data BurstAnalysis is switched off. The analyzer automatically detects the single type of datamodulation.
To correctly view this uniformsignal, however, we need to turnoff Data Burst Analysis. As before,the Zone Definition tab on theOFDMA Demodulation Propertiesdialog box is the place todeactivate Data Burst Analysis. Theanalyzer defaults to automaticdetection of the 64QAMmodulation type. Since theanalyzer typically is able toupdate demodulation results evenwhen recording playback is in thepaused mode, the effect of thechange should be immediate.
Example results are shown inFigure 17, with error vector timeand spectrum displays set to0.1%/division.
This signal is a digital simulationand has virtually no error, andthe demodulation results are nowcorrect. This uniform uplink signalis a relatively straightforwardsignal to analyze, as it uses onlyone type of modulation for thedata carriers for a single databurst, and does not include apreamble or FCH.
38
Basic Digital Demodulation (continued)
For the analyzer or a receiver,demodulating uplink subframesmay be a challenge for severalreasons. First, the lack of timing,frequency synchronization, andequalization information thatmight be provided by a preamblerequires more complicatedsynchronization algorithms, withreceivers assuming specific pilotlocations and values. Second,settings for the frame numberindex and the frame type (PUSC,FUSC, etc.) must be correct toprovide the receiver with theaccurate pilot locations andvalues that are essential fordemodulation.
Incorrect frame numbers will notgenerally produce recognizableconstellations, though theconstellations may nonethelessexhibit some recognizable digitalmodulation characteristics.
To help with UL synchronizationthe 89600 software willdemodulate a signal even if itsPRBS is incorrect. The recoveredPRBS seed result is presented onthe Sym/Errs table. The user candecompose this 11-bit Status valueinto a Frame Number and IDCell forthe UL in order to confirm thatthe settings match expectations.A small indicator (“*”) is providedif the software detects a mismatchbetween the PRBS sequence andthe setup, and yet a furtherindicator (“?”) is presented if the89600 software cannot uniquelyidentify the PRBS seed. This may indicate an incorrect PRBSgenerator, or insufficient data todeduce the PRBS. Since the PRBSdetermines the carrier and pilotpositions, a correct PRBS is vitalto even beginning measurements.This unique 89600 VSA software capability can help you troubleshoot your earlydevelopment efforts and get a working design as quickly as possible.
39
Basic Digital Demodulation (continued)
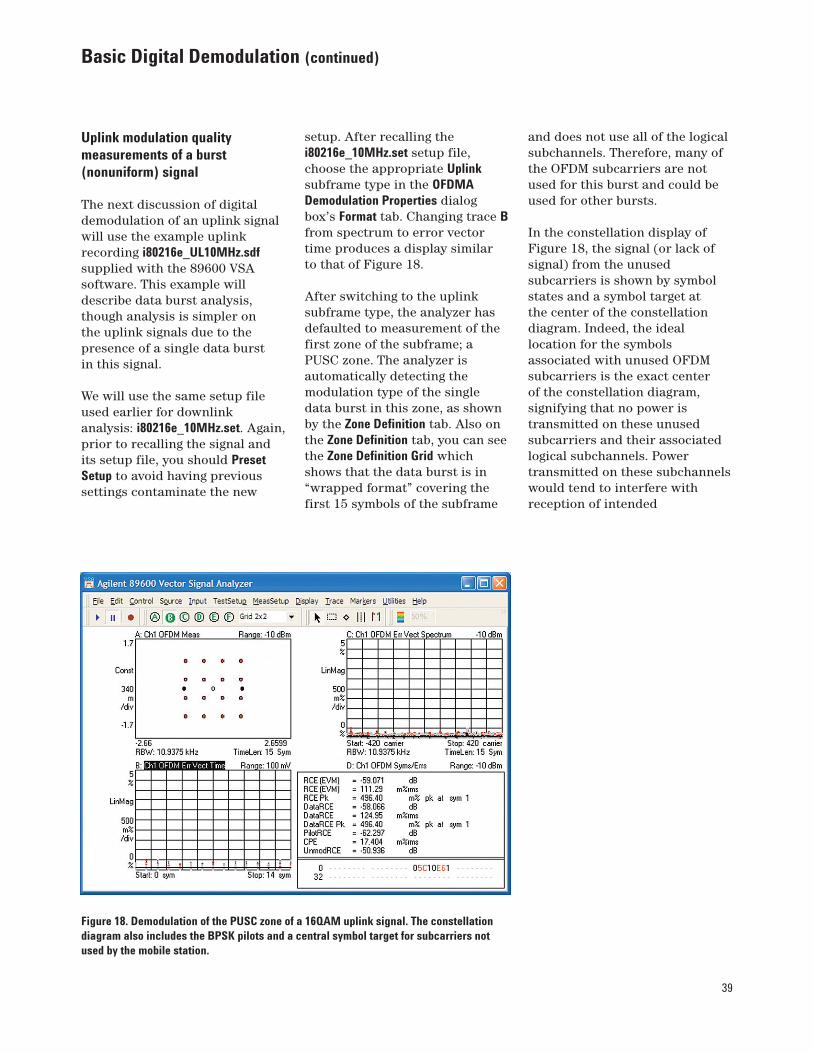
Figure 18. Demodulation of the PUSC zone of a 16QAM uplink signal. The constellationdiagram also includes the BPSK pilots and a central symbol target for subcarriers notused by the mobile station.
Uplink modulation qualitymeasurements of a burst(nonuniform) signal
The next discussion of digitaldemodulation of an uplink signalwill use the example uplinkrecording i80216e_UL10MHz.sdfsupplied with the 89600 VSAsoftware. This example willdescribe data burst analysis,though analysis is simpler on the uplink signals due to thepresence of a single data burst in this signal.
We will use the same setup fileused earlier for downlinkanalysis: i80216e_10MHz.set. Again,prior to recalling the signal andits setup file, you should PresetSetup to avoid having previoussettings contaminate the new
setup. After recalling thei80216e_10MHz.set setup file,choose the appropriate Uplinksubframe type in the OFDMADemodulation Properties dialogbox’s Format tab. Changing trace Bfrom spectrum to error vectortime produces a display similar to that of Figure 18.
After switching to the uplinksubframe type, the analyzer hasdefaulted to measurement of thefirst zone of the subframe; aPUSC zone. The analyzer isautomatically detecting themodulation type of the singledata burst in this zone, as shownby the Zone Definition tab. Also onthe Zone Definition tab, you can seethe Zone Definition Grid whichshows that the data burst is in“wrapped format” covering thefirst 15 symbols of the subframe
and does not use all of the logicalsubchannels. Therefore, many ofthe OFDM subcarriers are notused for this burst and could beused for other bursts.
In the constellation display ofFigure 18, the signal (or lack ofsignal) from the unusedsubcarriers is shown by symbolstates and a symbol target at the center of the constellationdiagram. Indeed, the ideallocation for the symbolsassociated with unused OFDMsubcarriers is the exact center of the constellation diagram,signifying that no power istransmitted on these unusedsubcarriers and their associatedlogical subchannels. Powertransmitted on these subchannelswould tend to interfere withreception of intended
40
Basic Digital Demodulation (continued)
Figure 19. Measurement of the 6 symbols of the second (OPUSC) zone of the same uplinksignal as used previously in Figure 18.
transmissions on thesefrequencies by other mobilestations, especially in unfavorablenear/far configurations oftransmitters and receivers. Inuplink measurements, the 89600VSA defaults to a measurement of EVM which includes thecontribution of unusedsubchannels. The 89600 VSAautomatically reports RCE (EVM)of unmodulated carriers in itsSyms/Errs table. This is in someways similar to a noise powerratio measurement or codedomain error. Where it isdesirable to view only the activesubchannels associated with theselected data burst, the displayconfiguration can be changed byclearing a box on the Advancedtab of the OFDMA DemodulationProperties dialog box labeledInclude Inactive Subchannels in EVM.
This signal contains two zones: 15symbols of PUSC, and 6 symbolsof OPUSC. Measuring the OPUSCzone is slightly more complexbecause the analyzer expects theOPUSC zone to be located at thetrigger location chosen by thepulse search algorithm. Instead,the PUSC zone begins at thattime. So, to measure the OPUSCzone the analyzer must be set toskip the first 15 symbols of thePUSC zone. To do so, go to theTime tab of OFDMA DemodulationProperties and select Manual SyncSearch, with an Offset of 15symbols. Then switch back to theZone Definition tab and click Zone#1,the OPUSC zone in the list ofselected zones. The analyzer will now use its pulse searchalgorithms to locate the RF burst,and then delay 15 symbols tobegin the analysis of the OPUSCzone, as shown in Figure 19.
41
Basic Digital Demodulation (continued)
Common problems andtroubleshooting approaches for“uniform” measurements
Both the IEEE 802.16 OFDMAstandard and the signal itself are quite complex from an RFphysical layer standpoint (RFbursting, multiple carriers,moving pilots, multiplemodulation types, etc.) and froma baseband digital standpoint(preamble indexes, subchannelbitmasks, permutation functions,etc.). There are, therefore, manypossible causes of demodulationfailure including uncertainty andconfusion over the correctinterpretation of the standarditself. As an aid to troubleshooting,the following are some typicaldemodulation results, along withsuggestions as to possible causes.
Low “Sync Corr” (synccorrelation; see the table in theSyms/Errs trace data type) valueand possible demodulationfailure. An incorrect preamblevalue on downlink signals may bethe cause. The preamble indexmay be incorrect, or may beselected based on a differentinterpretation of the standardthan that of the 89600 VSA.
Circular symbol configurationwhen phase tracking is turnedon (see the Pilot Tracking box on the Advanced tab): BPSKsymbols not colored as pilotswhile QPSK/QAM symbols are.This may be a problem withincorrect pilot locations on adownlink signal, either due to anincorrect offset value (on the ZoneDefinition tab of the OFDMADemodulation Properties dialogbox), or the pilot location may be based on a differentinterpretation of the standardthan that of the 89600 VSA.
Symbol constellations appear tohave a near-random “cloud”pattern. This type of constellationon an uplink signal suggests thatthe pilot symbols were notdetected for synchronization.Causes are similar to the previous phenomenon, includingmismatched setup parametersand differing interpretations of the standard. Successfuldemodulation may be possible byexperimenting with parameterssuch as Offset and PermBase in theZone Definition tab to find a matchwith the signal.
Noisy constellations with a largesymbol clock error (SymClkErr,see the table in the Syms/Errstrace data type), or unlockedmeasurements. These phenomenamay be caused by incorrectvalues of the Bandwidth (orNominal BW if set manually) valuein the Format tab of the OFDMADemodulation Properties dialog box.The bandwidth value determinesOFDM carrier spacing, and itshould be set as closely aspossible to the actual value.Subcarrier measurements such as those described in the timeand frequency (vector) domainsection earlier in this applicationnote may be helpful indetermining the exact subcarrierspacing and the actual bandwidthof a specific signal.
Pulse search failure. A variety ofconditions may cause this errorenunciator to appear (typicallyalong with demodulation failure).You can disable the pulse searchfunction in digital demodulationand configure a trigger as asubstitute. The trigger may beinternally generated using an IFmagnitude value and appropriateholdoff and delay values, orexternal triggers may also be usedif available.
42
Basic Digital Demodulation (continued)
Common problems andtroubleshooting approaches for“data burst” measurements
The suggestions above for uniformmeasurements are also applicableto data burst measurements. In addition, the followingapproaches may be helpful.
Unexpected modulation formats(or noise) appear in theconstellation where othermodulation formats areexpected. Incorrect permutationparameters on downlink signalsmay be causing zone parametersto be mismatched or theparameters may be based on adifferent interpretation of thestandard than that of the 89600VSA. The PRBS Status on theSyms/Errs table can provideinformation on what was actually decoded, including suchparameters as the PRBS seed, ID cell, segment, PermBase,PRBS_ID, and much more. Inaddition, it may be helpful to try the P802.16 OFDMA (Cor1/D2)standard mode, selected from the Format tab in the OFDMADemodulation Properties dialog box.
Symbol constellations appear tohave a near-random “cloud”pattern. This type of constellationon an uplink signal suggests thatthe pilot symbols were notdetected for synchronization.Causes are similar to those forthe uniform measurements,including mismatched setupparameters and differinginterpretations of the standard.Successful demodulation may bepossible by experimenting withparameters such as Offset andPermBase in the Zone Definition tabto find a match with the signal.This situation is essentiallysimilar to the uniformmeasurement mode measurementsperformed on uplink signals, asdescribed previously.
43
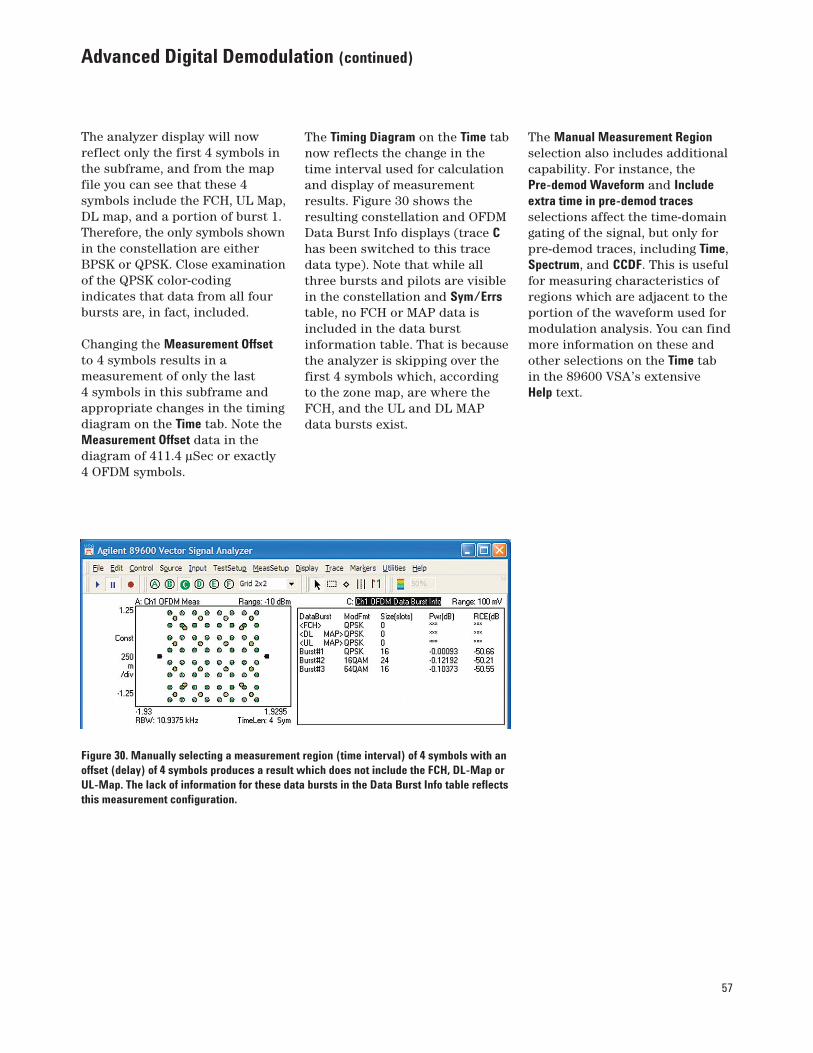
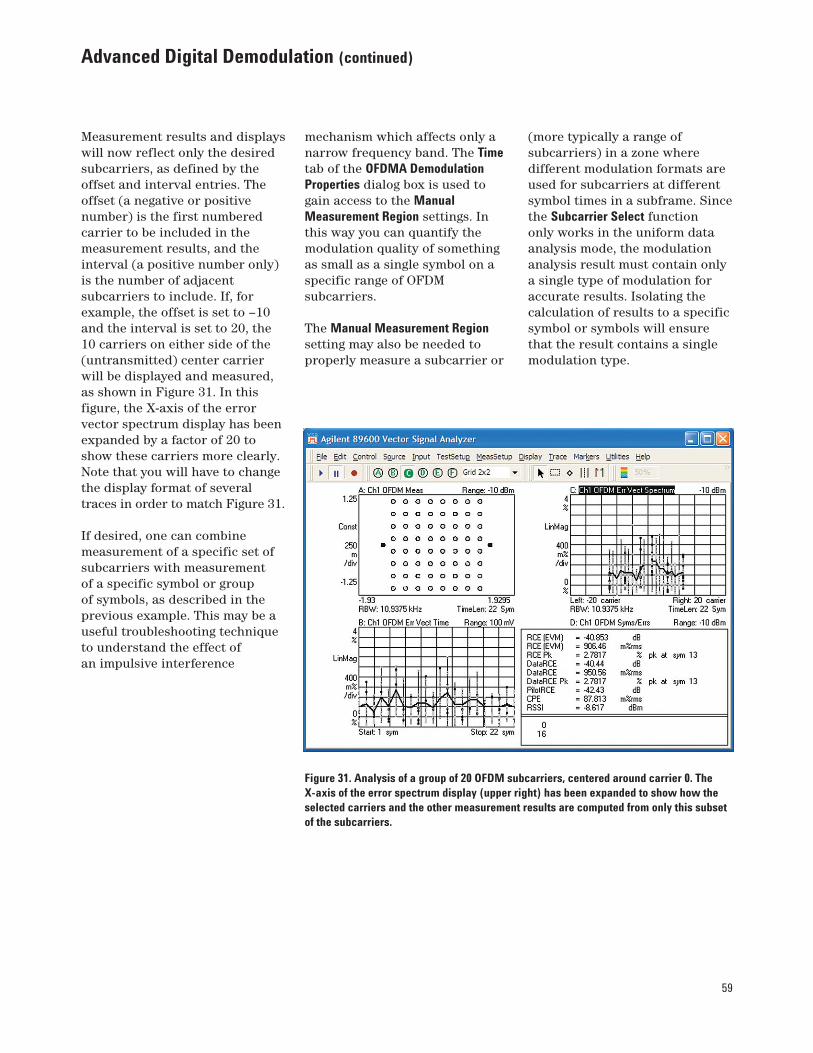
Advanced Digital Demodulation
Frequency,frequency and time
Basicdigital demod
Advanced andspecific demod
Get basics right,find major problems
Signal quality numbers, constellation, basic error vector measurements
Find specific problems and causes
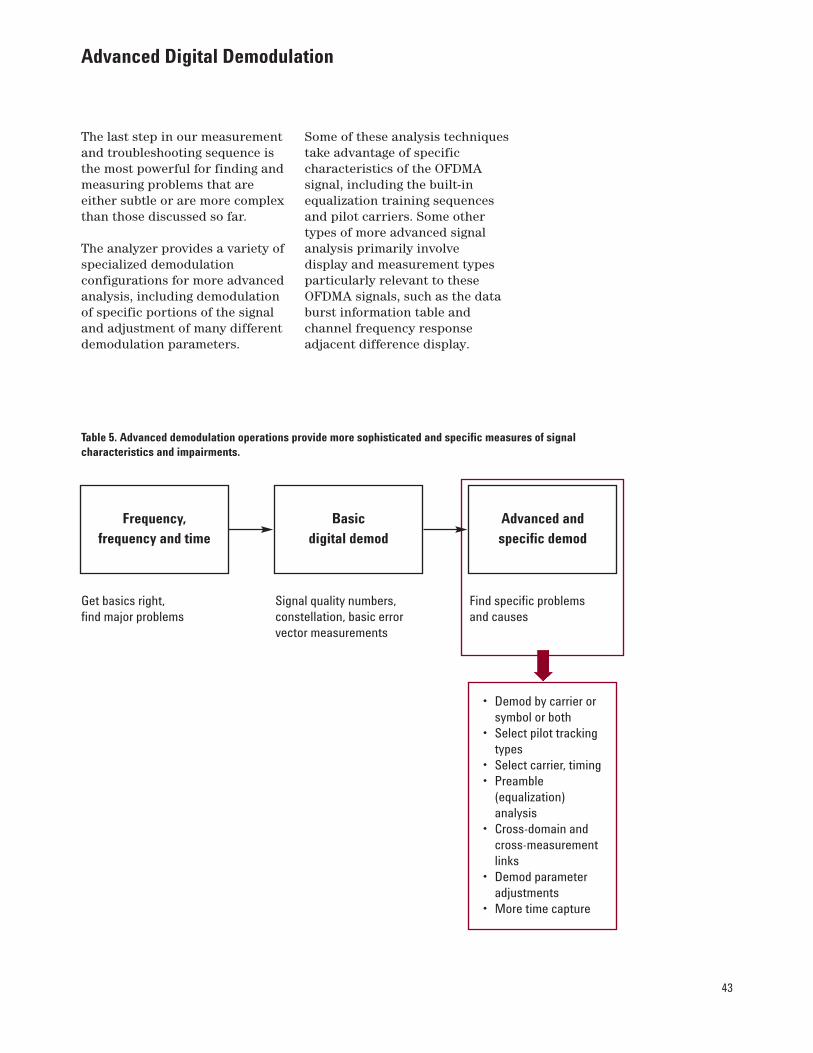
Table 5. Advanced demodulation operations provide more sophisticated and specific measures of signalcharacteristics and impairments.
• Demod by carrier orsymbol or both
• Select pilot trackingtypes
• Select carrier, timing• Preamble
(equalization)analysis
• Cross-domain andcross-measurementlinks
• Demod parameteradjustments
• More time capture
The last step in our measurementand troubleshooting sequence isthe most powerful for finding andmeasuring problems that areeither subtle or are more complexthan those discussed so far.
The analyzer provides a variety ofspecialized demodulationconfigurations for more advancedanalysis, including demodulationof specific portions of the signaland adjustment of many differentdemodulation parameters.
Some of these analysis techniquestake advantage of specificcharacteristics of the OFDMAsignal, including the built-inequalization training sequencesand pilot carriers. Some othertypes of more advanced signalanalysis primarily involve display and measurement typesparticularly relevant to theseOFDMA signals, such as the databurst information table andchannel frequency responseadjacent difference display.
44
Advanced Digital Demodulation (continued)
Advanced displays
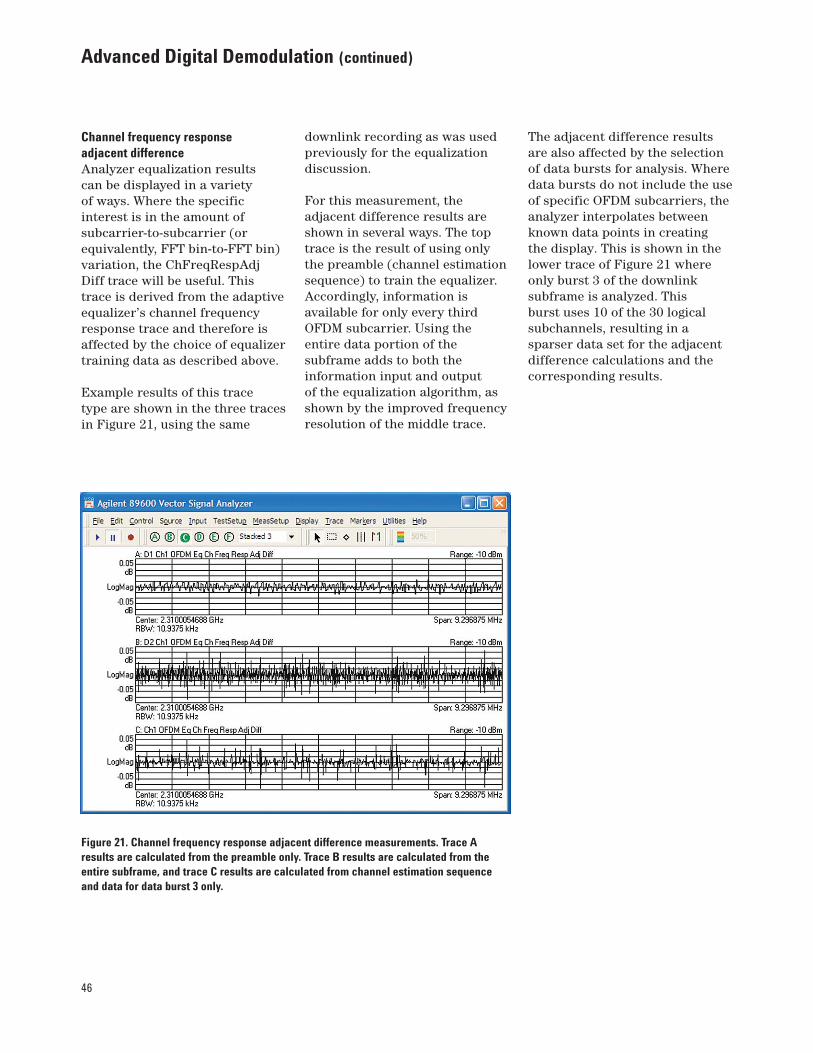
Equalization and channel frequency response As shown previously in bothvector and basic digitaldemodulation measurements,downlink subframes include apreamble with a time length ofone OFDM symbol. The preambleis composed of every third OFDM subcarrier, with one eachtransmitted at equal amplitude.In addition to its use bysubscriber unit receivers, thispreamble is very useful fordiagnostics by the 89600 VSA.
Adaptive equalization is requiredby the WiMAX standards and isnormally used to compensate forlinear errors such as amplitudeand phase flatness, either in thetransmitters or in the transmitchannel. When measured directlyat the output of a transmitter,typical causes of error includebaseband or IF filtering errors, andincorrect sin(x)/x compensation.
These errors may be caused bymultipath or by tilt or ripple inthe frequency response of a
system. In contrast, noise,intermodulation, and the effectsof amplifier compression arenonlinear forms of distortion,and are not corrected by adaptive equalization.
Similar to the receiver in asubscriber unit, the 89600 VSAuses the preamble to calculatecoefficients for its adaptiveequalizer, and these filtercoefficients are very useful fortroubleshooting. In addition, (incontrast to the typical subscriberunit receiver) the 89600 VSAsoftware allows the adaptiveequalizer to be trained on eitherthe preamble or on the entiresubframe, including thepreamble. Including both thepreamble (also called the channelestimation sequence) and thesubframe data improves thechannel equalization estimate,and is called data-drivenequalization. The improvedchannel equalization estimate has the dual benefits of typicallymore accurate modulation qualityresults and a more accurateestimate of the channel frequencyresponse for display and analysis.
45
Figure 20. Channel frequency response amplitude (lower left) and phase (upper right)and equalizer impulse response (lower right) derived from adaptive equalizer trained ondownlink preamble.
For the design engineer, a majorbenefit of equalization is that theresults can be viewed, quantified,and then used to find the sourceof problems. Using the samenonuniform downlink PUSCsignal (i80216e_DL10MHz.sdf) as in previous digital demodulationmeasurements, you can configurethe analyzer to show theequalization results in a variety of different ways as shown inFigure 20.
The equalization results areshown in several different formsin this figure. The equalizerchannel frequency response in log magnitude form (trace B) isperhaps the most familiar. This is the combined amplitudefrequency response of thechannel and the transmitter,displayed against the OFDM
Advanced Digital Demodulation (continued)
carrier frequency number. Thefrequency response can bedisplayed in terms of phase aswell, as shown in trace C, wherephase is selected as the dataformat. The analyzer can alsodisplay the impulse (time domain)response of the filter it created toequalize the channel, and this isshown in trace D, labeled OFDM EqImpls Resp. This impulse responseresult may be more useful thanfrequency response in some DSPdesign efforts.
As mentioned previously, theanalyzer’s equalizer can betrained on the preamble (channelestimation sequence) or on theentire subframe including boththe preamble and the data, or onthe channel estimation pluspilots. Since an uplink signal hasno preamble, the analyzer uses
either the pilots or a combinationof data and pilots, depending onwhich Equalizer Training parameteris selected. This training choice isavailable as check boxes on theAdvanced tab of the OFDMADemodulation Properties dialog box,and may result in significantlydifferent modulation qualityresults, depending on the specificsignal involved. Since the signalrecording used as an examplehere is of high quality and doesnot have significant multipath,the effect of the change inequalizer training is to change themeasured modulation quality(RCE/EVM) from approximately–49 dB to –52 dB depending onwhich mode is chosen, though allindicate very low levels of error.The effect on the equalizer displaytraces is correspondingly slight.
46
Advanced Digital Demodulation (continued)
Figure 21. Channel frequency response adjacent difference measurements. Trace Aresults are calculated from the preamble only. Trace B results are calculated from theentire subframe, and trace C results are calculated from channel estimation sequenceand data for data burst 3 only.
Channel frequency response adjacent difference Analyzer equalization results can be displayed in a variety of ways. Where the specificinterest is in the amount ofsubcarrier-to-subcarrier (orequivalently, FFT bin-to-FFT bin)variation, the ChFreqRespAdjDiff trace will be useful. Thistrace is derived from the adaptiveequalizer’s channel frequencyresponse trace and therefore isaffected by the choice of equalizertraining data as described above.
Example results of this trace type are shown in the three tracesin Figure 21, using the same
downlink recording as was usedpreviously for the equalizationdiscussion.
For this measurement, theadjacent difference results areshown in several ways. The toptrace is the result of using onlythe preamble (channel estimationsequence) to train the equalizer.Accordingly, information isavailable for only every thirdOFDM subcarrier. Using theentire data portion of thesubframe adds to both theinformation input and output of the equalization algorithm, asshown by the improved frequencyresolution of the middle trace.
The adjacent difference resultsare also affected by the selectionof data bursts for analysis. Wheredata bursts do not include the useof specific OFDM subcarriers, theanalyzer interpolates betweenknown data points in creating the display. This is shown in thelower trace of Figure 21 whereonly burst 3 of the downlinksubframe is analyzed. This burst uses 10 of the 30 logicalsubchannels, resulting in asparser data set for the adjacentdifference calculations and thecorresponding results.
47
Advanced Digital Demodulation (continued)
Figure 22. The Data Burst Info trace lists the FCH and allmeasured data bursts in the subframe, along with theirsize, power, RCE, and the RCE of selected data bursts (ifdisplay space permits).
Data burst information table A new display associated with IEEE 802.16 OFDMAmeasurements in the 89600 VSAis the OFDM Data Burst Info table.This is both a measurement datatype and an associated displayformat. Example results from thenonuniform downlink PUSCrecording are shown in Figure 22.
This display is used when in thedata burst analysis mode, and is most useful when you aremeasuring multiple data bursts.
It provides a list of the subframe’sdata bursts, including the FCH.Reported values for each databurst include the format, theburst size (length), average power,and the average error (RCE, indB) of the entire signal or thedata subcarriers only (DataRCE).
Like the rest of the displaysavailable when in data burstanalysis mode, this table reflectsonly the results of the data burstsselected for analysis.
48
Advanced Digital Demodulation (continued)
Figure 23. Pilot tracking parameters including amplitude, phase,and timing can be selected in any combination on the Advancedtab of the OFDMA Demodulation Properties dialog box.
Pilot tracking
In much the same way as forIEEE 802.11a OFDM and IEEE802.16-2004 WiMAX, IEEE 802.16OFDMA demodulation isperformed relative to BPSK pilotcarriers which are embedded inthe signal. These pilot carriersreplace data-carrying elements of the signal and allow manyimpairments to be dynamicallyremoved or “tracked out.” Thepilot carriers are transmittedcontinuously throughout the dataportion of the subframes, thoughtheir location varies according topermutation functions. The pilotsfor some logical subchannels willnot be present for every symbolof every data burst.
Many signal impairments will becommon to all pilot carriers, andcan be measured and displayed as“common pilot error.” Thisparameter is reported as part ofthe Symbols/Errors trace data.
In addition, the specific trackingfunctions can be individuallyswitched on and off in thedemodulation performed by the89600 software. This is a veryuseful troubleshooting approach,since modulation errors can beexamined with and without thebenefit of particular types of pilot tracking.
Three types of tracking areavailable: Amplitude, Phase, andTiming. Selection of trackingparameters is accomplished onthe Advanced tab of the OFDMADemodulation Properties dialog box(after clearing the box for UseDefault Settings), as shown inFigure 23.
Amplitude tracking (default forthe 89600 VSA is Track AmplitudeOff for downlink signals and Onfor uplink signals). A commontype of signal impairment isvarying signal amplitude during asubframe. Signal changes such asvariable subcarrier occupancy
and modulation type overdifferent data bursts can causeRF and microwave circuits tochange temperature and gainduring a subframe. For subscriberunits, the combination oftransmit and DSP power maycause amplitude droop. WhenTrack Amplitude is selected, thetracking results can be analyzedby viewing the magnitude portionof the Common Pilot Error datatype. Such errors could beisolated by comparing the peakerror symbols with their locationin the constellation and/or theirlocation in the subframe.
49
Advanced Digital Demodulation (continued)
Symbol timing adjustment
The alignment of the analyzer’ssymbol demodulation within theinterval defined by the OFDMsymbol plus the guard interval isadjustable through a dialog box in the Advanced tab of the OFDMADemodulation Properties dialog box.For the 89600 VSA, this positionsin time the FFT used fordemodulation. No specific timeposition is called out in thestandard, and different timingsettings will affect measuredmodulation quality. In particular,if filter ISI or multipath affectsthe guard interval, certain symboltiming settings will provide muchbetter demodulation results than others.
Time-specific andfrequency-specific measurements
You can use a large variety oftime-specific (relative to timeintervals, symbols, frames, ortriggers) and frequency-specific(OFDM subcarriers or logicalsubchannels) analysisconfigurations to find problemsand isolate their causes. In IEEE 802.16 OFDMA, many useful measurements are both time-specific andfrequency-specific, as we will seein the examples that follow.
These techniques can help, forexample, find subtle defects suchas DSP errors or impulsiveinterference that only affect aspecific carrier/frequency at aspecific time or over a specifictime interval.
Phase tracking (default for the89600 VSA is Track Phase On).Operation is similar to amplitudetracking, except that the analyzerdemodulation tracks the phase ofthe pilot carriers. Close-in phasenoise, for example, can beremoved or tracked out by phasetracking. As with amplitudetracking, when phase tracking isselected, the tracking results canbe analyzed by viewing the phaseportion of the Common Pilot Errordata type.
Timing (default for the 89600VSA is Track Timing Off fordownlink signals and On foruplink signals). When Track Timingis selected, the analyzer appliespilot subcarrier timing errorcorrection (frequency offsetcorrection) to the pilot and datasubcarriers. Timing errors may be caused by oscillator frequencyerrors or DSP errors such as animproper number of samples inthe guard interval. It is useful tokeep in mind that both analogand digital (DSP) mechanismscan cause timing problems. DSPdefects such as an impropersample rate can also affectrelative timing in the subframe.One useful troubleshootingtechnique is to observe changesin common pilot error whentiming tracking is enabled.
50
Advanced Digital Demodulation (continued)
Customizing a Zone Definition Grid map for measuring individualdata regions
The process for individuallydefining zones or configuring azone map for data burst analysiscan be best understood bybeginning with a known signaland its associated map. We willuse the same example downlinkrecording supplied with the89600 VSA software as was used previously for data burstanalysis: i80216e_DL10MHz.sdf. As before, remember to PresetSetup before recalling this signal,and its associated setup filei80216e_10MHz.set.
After recalling the setup file, databurst analysis is enabled and allof the data bursts are selected formeasurement and display. Youcan verify this by examining theZone Definition Grid map at thebottom of the Zone Definition tab ofthe OFDMA Demodulation Propertiesdialog box and noting that theoutlines of all data bursts areflashing. The zone definition mapreveals that the FCH data burst(upper left) is composed of 4 logical subchannels with aduration of 2 OFDM symbols. Anappropriate zone definition mapfile for the other data bursts inthis signal has been providedwith the analyzer’s setup file, andyou can select this by selectingthe Use Map File box (thisselection has already beenperformed by the setup file).
At this point it is instructive tochoose a single data burst andmodify its zone map to see themeasurement results in the timeand frequency domain (errorvector time and error vectorspectrum). For this example,Zone #1 will be modified since itdoes not contain a preamble orUL/DL maps and is thereforesimpler to edit. You can do thisgraphically by clicking the EditMap Files, and then From Setupbuttons to bring up the OFDMAMap File Editor. From the DownlinkZones section click Zone #1 andthe Edit button. This will bring upa display of the zone 1 map,which will look different from thezone 0 map that you may havealready been measuring. Thereyou can delete data burst #3(64QAM, middle burst, typicallycolored green). Simply clickanywhere in the burst to highlightit and click the Delete Burstbutton. When the burst is selectedyou can verify its name and thetype of modulation in the Burstarea at the upper right of thedisplay. Click OK and Close, asneeded, to return to the displayof the OFDMA DemodulationProperties dialog box. Then, fromthe Selected Zone area of theOFDMA Demodulation Propertiesdialog box, click Zone #1 to selectit for analysis.
51
Figure 24. Data burst measurement of a single burst from a downlink FUSC signal.Burst 2, with 16QAM modulation has been chosen for analysis.
Now, select only burst 2 foranalysis by clicking Burst #2 inthe Data Burst List on the OFDMADemodulation Properties tab or by clicking anywhere in thegraphical representation of burst2 on the Zone Definition Grid tableat the bottom of the dialog box.These changes take effectimmediately. Note that only16QAM modulation now shows inthe constellation display (alongwith the BPSK pilots). Yourdisplay should be similar toFigure 24, where traces B and Chave been changed to error vectortime and error vector spectrum,respectively.
Advanced Digital Demodulation (continued)
You will see from the error vectortime display that only 4 symbolsare being analyzed, and from theerror vector spectrum display youwill see that only a portion of theOFDM subcarriers are being usedfor the selected data burst. TheOFDM subcarrier population maybe viewed in greater detail byusing the Select Area marker tool(chosen from the marker toolbaror by selecting Markers > Tools >Select Area) and X-axis scaling theerror vector spectrum trace,focusing on perhaps the center20% of the trace, by drawing a boxand clicking Scale X. The trace
can be returned to full scale byselecting it and then Trace > XScale and clicking Full Scale.
Of course if the goal of themeasurement was to analyze only burst 2 of zone 1, theseparameters could have beenselected directly from the OFDMADemodulation Properties dialog boxwithout editing the zone map. Thetechnique described previouslywould normally be used tomanually define zone maps tomatch the signal under test or toexperiment with unknown signalsto learn their structure.
52
Advanced Digital Demodulation (continued)
Figure 25. Data burst analysis of a portion of the original burst 2. The error vector time(lower left) trace shows that only 3 symbols are measured, and the error vector spectrum(upper right) shows the sparse OFDM subcarrier population representing the onemeasured logical subchannel.
The next step is to experimentwith re-defining the data burst toinclude fewer logical sub-channelsand/or fewer symbols. Follow thesame procedure to again bring upthe Edit Downlink Zone DefinitionMap dialog box: From the ZoneDefinition tab of DemodulationProperties, click Edit Map Files > Edit(with i80216e_10MHz selected).Click Zone#1 in Downlink Zonesand click Edit, and then click thezone map on burst #2 (the lowerburst). You will see that burst #2is highlighted and blinking, andoccupies six logical subchannelsfor a duration of 4 symbols or 24 slots.
Use the mouse to click and dragdiagonally from corner to cornerto re-define burst 2 by creating a rectangular region with a“height” of one logical subchanneland a length of 3 symbols,anywhere within the previousboundaries of burst 2. Click OKand Close, as needed, to return to the display of the OFDMADemodulation Properties dialog box,selecting Yes when asked if youwant to reload i80216e_10MHz.Click burst 2 to select only thenewly-defined burst for analysis.
Note the differences in the errorvector time and error vectorspectrum traces. The measuredresult in time is now 3 symbolslong, and the OFDM subcarrierpopulation (representing a singlelogical subcarrier) is much moresparse. Since all the subcarriersnow defined for this burst areactively modulated with the rightformat for the selected durationof the new burst, the errorparameters should all be low, asshown in Figure 25.
53
Advanced Digital Demodulation (continued)
Figure 26. This zone definition grid has been modified to explore the effects of incorrectdata burst length and demodulation type (16QAM instead of 64QAM). The demodulationresults are shown in Figure 27.
Figure 27. Incorrectly defining the zone map for data burst analysis causes large errorswhere 64QAM (from an adjacent burst) is demodulated as 16QAM, and symbols forinactive carriers are shown at the center of the constellation diagram.
Now we can observe the resultwhen burst 2 is defined withlogical channels beyond thoseactually transmitted, and/or witha burst length which includes acombination of symbols andsubchannels where inactivesubcarriers are analyzed. Forexample, extending the timeduration of burst 2 (beyond thatpreviously defined) to cover 3additional symbols in this zonewill cause some inactivesubcarriers (the equivalent ofnoise) to be demodulated as16QAM data. Similarly, expandingburst 2 into logical subchannelspreviously defined as 64QAM(from the deleted burst 3) willcause these symbols to bedemodulated as 16QAM instead.The resulting zone definition gridis shown in Figure 26, and thecorresponding measurementresults are shown in Figure 27.
54
Advanced Digital Demodulation (continued)
Several results in all of theanalyzer displays are useful fortroubleshooting the kind ofproblems introduced in thisexample. The constellationdisplay now includes a number of64QAM symbols without targetsin addition to the expected16QAM symbols and targets. The64QAM symbols will be analyzedas 16QAM, resulting in muchhigher error figures. There arealso symbols (without a target) at the center of the constellationdiagram; this is a result ofdemodulating parts of the zonewithout active subcarriers.
The error vector time trace revealsthe same errors in a differentway. The average and peak errorsclimb sharply, starting at symbol17, where data transmission hasactually stopped. A relatedbehavior is shown in the errorvector spectrum trace, whereerror is either very high (64QAMor inactive carriers demodulatedas 16QAM) or very low (16QAMdemodulated properly and BPSK pilots).
You can edit, save, and recallthese zone maps, and customizethe associated data burst analysisto verify the proper compositionof a zone, or to troubleshootproblems in the data burstarrangement of a zone.
Note: The analyzer will rememberthe (deliberately incorrect) zonemap which has been created hereeven after analyzer Preset andPreset to Standard actions, so it is agood idea at this point to reset themap to the correct values for thisexample downlink signal. To dothis, you will need to delete thismodified i80216e_10MHz zonedefinition map file (these files havethe extension “.omf”) and recallthe original preset file. From theZone Definition tab click Edit MapFiles, select the i80216e_10MHz mapfile and click Delete. Then recall thesetup file i80216e_10MHz.set andyou will see the zone definitionmap (for Zone 1) return to theoriginal configuration with threedata bursts.
55
Advanced Digital Demodulation (continued)
Measuring specific time or symbol intervals
Time-specific measurements are an essential element oftroubleshooting any system usingtime-varying signals such aspulsed/bursted transmissions,TDMA techniques, variable powerlevels or boosting, etc. For OFDMA,demodulation of specific elementsof a subframe is a powerfultroubleshooting technique,allowing clearer isolation oferrors and impairments, andtherefore a clearer view of theircauses. The Time tab of the OFDMADemodulation Properties box in the89600 VSA offers several types oftime-specific analysis within thedigital demodulation function.Compared with time-specificvector mode analysis, the digitaldemodulation function offerssignificant benefits in the areas of pulse and sync searching,synchronization with frames andsubframes, and alignment ofmeasurements with OFDMsymbol times. In addition, the Time tab of the OFDMADemodulation Properties dialog box includes a graphic displayshowing the relative timing of themeasurements vs. the frame andzone timing.
For this example, we will use the same downlink recording(i80216e_DL10MHz.sdf) suppliedwith the 89600 VSA software asused above for data burst analysisand for customizing a zone map.If you have not already done so,use the instructions at the end ofthe previous section to delete themodified zone definition map file.As described previously, performthe Preset Setup function, recallthe recording, and recall its setupfile, i80216e_10MHz.set.
We will now use the recordeddownlink signal (containing aPUSC zone followed by a FUSCzone) to explore time-specificmeasurements. After the signaland its setup file have beenrecalled, select the appropriatezone definition map file byselecting the Use Map File box on the Zone Definition tab of theOFDMA Demodulation Propertiesdialog box. It is also a good ideato configure the analyzer for the same combination ofconstellation, error vector time,and error vector spectrumdisplays as used in the previousexamples. The analyzer shoulddefault to measuring the firstzone in the subframe: Zone #0(the FUSC zone).
56
Advanced Digital Demodulation (continued)
Figure 28. The Time tab on the OFDMA Demodulation Propertiesdialog box includes an active timing diagram (derived from thesignal and user settings, and updated as the measurementconfiguration is changed) to help you visualize your signal foreasier measurement setup.
Figure 29. After selecting a manual measurement region witha length of 4 symbols and an offset of 0 symbols, the timingdiagram reflects the actual measurement interval and offsetsin seconds. This is a clear graphic representation of themeasurement interval of 411.4 µSec and its relationship to thetotal result length, frame, and zone length (1.234 mSec).
For a time-specific measurementrelative to symbols in thesubframe, it is now only a matterof selecting the Time tab of theOFDMA Demodulation Propertiesdialog box. From the setup filethe analyzer should be configuredto select all of the data bursts foranalysis. If a single burst isselected, the Manual MeasurementRegion (on the Time tab) is limitedto testing the selected burst. Thegraphic diagrams and entry areasof this tab are shown in Figure 28.
Note the figures in the TimingDiagram portion of the tab. Theresult length and its relationshipto the OFDM frame are shown atthe bottom, while the analysisregion is shown at the top. Thedefault is for analysis of theentire 12 symbol (1.234 mSec)data portion of the subframe,following the zone offset of 1symbol due to the preamble.
You can perform a simpletime-specific analysis of thesubframe by selecting the ManualMeasurement Region check box and entering a measurementinterval of 4 symbols. With ameasurement offset of 0 symbols,the result will be a measurementisolated to the first 4 symbols ofthe subframe, and a display in theTime tab similar to Figure 29.
57
Advanced Digital Demodulation (continued)
Figure 30. Manually selecting a measurement region (time interval) of 4 symbols with anoffset (delay) of 4 symbols produces a result which does not include the FCH, DL-Map orUL-Map. The lack of information for these data bursts in the Data Burst Info table reflectsthis measurement configuration.
The Manual Measurement Regionselection also includes additionalcapability. For instance, thePre-demod Waveform and Includeextra time in pre-demod tracesselections affect the time-domaingating of the signal, but only forpre-demod traces, including Time,Spectrum, and CCDF. This is usefulfor measuring characteristics ofregions which are adjacent to theportion of the waveform used formodulation analysis. You can findmore information on these andother selections on the Time tab in the 89600 VSA’s extensive Help text.
The analyzer display will nowreflect only the first 4 symbols inthe subframe, and from the mapfile you can see that these 4symbols include the FCH, UL Map,DL map, and a portion of burst 1.Therefore, the only symbols shownin the constellation are eitherBPSK or QPSK. Close examinationof the QPSK color-codingindicates that data from all fourbursts are, in fact, included.
Changing the Measurement Offsetto 4 symbols results in ameasurement of only the last 4 symbols in this subframe andappropriate changes in the timingdiagram on the Time tab. Note theMeasurement Offset data in thediagram of 411.4 µSec or exactly4 OFDM symbols.
The Timing Diagram on the Time tabnow reflects the change in thetime interval used for calculationand display of measurementresults. Figure 30 shows theresulting constellation and OFDMData Burst Info displays (trace Chas been switched to this tracedata type). Note that while allthree bursts and pilots are visiblein the constellation and Sym/Errstable, no FCH or MAP data isincluded in the data burstinformation table. That is becausethe analyzer is skipping over thefirst 4 symbols which, accordingto the zone map, are where theFCH, and the UL and DL MAPdata bursts exist.
58
Advanced Digital Demodulation (continued)
Measuring a specific subcarrier orrange of subcarriers
Some modulation impairments,especially those involvinginterference of some kind, are associated with specificfrequencies or frequency ranges.Indeed, one of the benefits ofOFDM techniques is their relativeimmunity to narrowbandinterference or robustness of transmission capability in environments where onefrequency or a particular band of frequencies (and thereforesubcarriers) is significantlyimpaired.
The error vector spectrum display,as described previously, can revealerror behavior that is associatedwith frequencies or subcarriers.Since the number of subcarriersis so large (840 active subcarriersduring data bursts of the 10 MHzsignal), X-axis display scaling can be very useful for focusingattention on the desired range ofcarriers. One application of thisapproach would be to examineband edges more closely todiagnose filtering problems or interference from an adjacent band.
For applications where it isdesirable to focus the actualdemodulation operations on a specific subcarrier or, moretypically, a range of subcarriers,the Subcarrier Select function onthe Advanced tab of the OFDMADemodulation Properties dialog boxwill provide a solution. Since thedemodulation itself is actuallyrestricted to the selectedsubcarriers, the accuracy androbustness of the demodulation(including automatic recognitionof modulation type, if selected)will depend on the signal qualityof the selected subcarrier(s).
Selecting a specific set ofsubcarriers may be particularlyuseful when it is suspected thatthe signal under test has animproper configuration of thedata burst map or an error in the permutation formula.Demodulating a very limited data set in this way may present problems for automaticrecognition of modulation type,and it may be helpful to use aManual setting for Data ToneModulation as described below.
For applications where it isdesirable to focus themeasurement (if not the entiredemodulation result) on aspecific subcarrier or range ofsubcarriers, the Subcarrier Selectfunction on the Advanced tab ofthe OFDMA Demodulation Propertiesdialog box will provide a solution.
This example of frequency-specificanalysis will use the downlink recordingi80216e_DLPuscUniformQ64.sdfsupplied with the 89600 VSAsoftware. As describedpreviously, perform the PresetSetup function, recall therecording, and recall its setupfile: i80216e_DLPuscUniformQ64.set.This setup file will automaticallyclear the Data Burst Analysis boxon the Zone Definition tab ofOFDMA Demodulation Properties,allowing for subcarrier selection.
The data tone modulation type is usually automatically detectedby the 89600 VSA software.However, you can also manuallyset the data tone modulation, ifneeded, by going to the Advancedtab of OFDMA DemodulationProperties and clearing Use DefaultSettings. This will allow you tochange Data Tone Modulation fromAutomatic to Manual, as well as toselect the modulation format.Whether modulation type isdetected automatically or setmanually, the next step is toswitch from All to Subset in theSubcarrier Select box, also on theAdvanced tab.
59
Figure 31. Analysis of a group of 20 OFDM subcarriers, centered around carrier 0. TheX-axis of the error spectrum display (upper right) has been expanded to show how theselected carriers and the other measurement results are computed from only this subsetof the subcarriers.
Advanced Digital Demodulation (continued)
Measurement results and displayswill now reflect only the desiredsubcarriers, as defined by theoffset and interval entries. Theoffset (a negative or positivenumber) is the first numberedcarrier to be included in themeasurement results, and theinterval (a positive number only)is the number of adjacentsubcarriers to include. If, forexample, the offset is set to –10and the interval is set to 20, the10 carriers on either side of the(untransmitted) center carrierwill be displayed and measured,as shown in Figure 31. In thisfigure, the X-axis of the errorvector spectrum display has beenexpanded by a factor of 20 toshow these carriers more clearly.Note that you will have to changethe display format of severaltraces in order to match Figure 31.
If desired, one can combinemeasurement of a specific set ofsubcarriers with measurement of a specific symbol or group of symbols, as described in theprevious example. This may be auseful troubleshooting techniqueto understand the effect of an impulsive interference
mechanism which affects only anarrow frequency band. The Timetab of the OFDMA DemodulationProperties dialog box is used togain access to the ManualMeasurement Region settings. Inthis way you can quantify themodulation quality of somethingas small as a single symbol on aspecific range of OFDMsubcarriers.
The Manual Measurement Regionsetting may also be needed toproperly measure a subcarrier or
(more typically a range ofsubcarriers) in a zone wheredifferent modulation formats areused for subcarriers at differentsymbol times in a subframe. Sincethe Subcarrier Select function only works in the uniform dataanalysis mode, the modulationanalysis result must contain onlya single type of modulation foraccurate results. Isolating thecalculation of results to a specificsymbol or symbols will ensurethat the result contains a singlemodulation type.
60
Summary
By following the discipline of anorganized measurement sequence,you can uncover signal problemswith your OFDMA signals. Begin with basic spectrummeasurements, then add vectormeasurements, combiningfrequency and time, beforeswitching to basic digitalmodulation analysis. After that, you can take advantage ofadvanced or standard-specificanalysis.
The 89600 VSA software containssophisticated measurement andanalysis tools for time-selective or carrier-selective measurementsin either the uniform dataanalysis or data burst analysismodes. With these tools, the VSA software can help youtroubleshoot your signals quickly,and with an unmatched depth of understanding.
Publication Title Publication Type Publication Number
Agilent 89600 Series Vector Signal Analysis Self-Guided Demonstration 5989-2383ENSoftware for IEEE 802.16 OFDMA Evaluation and Troubleshooting
89600 Series VSA Technical Overview 5989-1679EN
89600 VSA Software Data Sheet 5989-1786EN
89600 VSA Software Hardware Specification Data Sheet 5989-1753EN
WiMAX Signal Analysis; Part 1: Making Application Note 5989-3037ENFrequency and Time Measurements
WiMAX Signal Analysis; Part 2: Demodulating Application Note 5989-3038ENand Troubleshooting the Subframe
WiMAX Signal Analysis; Part 3: Troubleshooting Application Note 5989-3039EN Symbols and Improving Demodulation
Agilent 89600 Series Vector Signal Analysis Demonstration Guide 5989-2029ENSoftware WiMAX (IEEE 802.16-2004) and Application Note
Agilent Technologies’ Test and Measurement Support, Services, and AssistanceAgilent Technologies aims to maximize the value you receive, while minimizing your risk andproblems. We strive to ensure that you get the test and measurement capabilities you paidfor and obtain the support you need. Our extensive support resources and services can helpyou choose the right Agilent products for your applications and apply them successfully.Every instrument and system we sell has a global warranty. Two concepts underlie Agilent’soverall support policy: “Our Promise” and “Your Advantage.”
Our PromiseOur Promise means your Agilent test and measurement equipment will meet its advertisedperformance and functionality. When you are choosing new equipment, we will help youwith product information, including realistic performance specifications and practicalrecommendations from experienced test engineers. When you receive your new Agilentequipment, we can help verify that it works properly and help with initial product operation.
Your AdvantageYour Advantage means that Agilent offers a wide range of additional expert test andmeasurement services, which you can purchase according to your unique technical andbusiness needs. Solve problems efficiently and gain a competitive edge by contracting withus for calibration, extra-cost upgrades, out-of-warranty repairs, and on-site education andtraining, as well as design, system integration, project management, and other professionalengineering services. Experienced Agilent engineers and technicians worldwide can help you maximize your productivity, optimize the return on investment of your Agilentinstruments and systems, and obtain dependable measurement accuracy for the life ofthose products.
For more information on Agilent Technologies’products, applications or services, pleasecontact your local Agilent office. The completelist is available at:
www.agilent.com/find/contactus
Phone or FaxUnited States:(tel) 800 829 4444(fax) 800 829 4433
www.agilent.com/find/emailupdatesGet the latest information on the products and applications you select.
www.agilent.com
Agilent Direct
www.agilent.com/find/agilentdirectQuickly choose and use your test equipment solutions with confidence.
Agilent Open
www.agilent.com/find/openAgilent Open simplifies the process of connecting and programming test systems to help engineers design, validate and manufacture electronic products. Agilent offers openconnectivity for a broad range of system-ready instruments, open industry software,PC-standard I/O and global support, which are combined to more easily integrate testsystem development.