56
BUILDING SMILES 2006 Annual Report

BUILDING SMILES2006 Annual Report

As Wal-Mart chairman, I assure you, our shareholders and associates, that our entire organization is more committed than ever to Dad’s founding principles.
Being a good and respectful employer: Wal-Mart offers tremendous opportunities for our associates to develop their professional skills and pursue a long-term career if they choose. Our management teams foster an environment where people are treated honestly and with respect.
Improving the associate and customer shopping experience: We must improve every day in what we offer our associates and our customers. Our every day low price position is the basis for our business. While this core principle is critical to our growth and business strategy, by itself it is not enough anymore.
This year, for example, our management team took the initial steps to revamp the field organization structure of Wal-Mart U.S. The new structure gives more authority and responsibility to those closest to the customer.
It was not an easy change, but a necessary one that will better serve our customers and associ-ates over the long term. We are driving similar improvement in other important business areas, including compliance, diversity, and health care benefits for our associates.
Community citizenship: We have a responsibility and an opportunity to improve the quality of life in every community we serve. The tremendous potential we have was underscored in 2005 with the way our associates and Company responded to the hurricane disaster. The positive impact of our response was unparalleled in Wal-Mart’s history and clearly strengthened our reputation as a corporate leader and good citizen.
Actions like our hurricane response efforts provide a return on investment to our business – both short- and long-term. We are committed to applying our scale and efficiencies toward the public good around the world. Recently, we launched initiatives to take a leadership role in improving our operations and products for our custom-ers that will benefit the environment. Our efforts, some of which are already in place,
are designed to help conserve and sustain the natural resources of our planet in the future, as well as save money for the Company and ultimately our customers. And, these plans will continue to expand during the next several years.
Integrity: There is no area of leadership more important than this one. Our culture is built on the high-est level of integrity, and we will continue to hold all associates to these high standards.
As a company and as individuals, we must continue to lead in these principles. Powerful leadership comes at all levels – from the board room, from store managers, and from cashiers, truck drivers and overnight stockers – who live daily the principles that make Wal-Mart a retail leader around the world.
Rob WaltonChairman of the Board of Directors
Wal-Mart Stores, Inc.
Building smiles today and tomorrow. I am asked often what my father, Sam Walton, who founded Wal-Mart in 1962, would think of our Company today. There is no doubt
he’d be proud of our success and the 1.8 million associates who serve our customers every day. He also would be proud that we
remain true to the fundamental principles of leadership and business that he was so instrumental in establishing.
– Rob Walton

I’m smiling because there is more selection at Wal-Mart than ever before.
1
– Stephanie, customer and associate

ElectronicsToday, a trip to Wal-Mart can consist of a basket fi lled with diapers, salsa, and electronic products with the latest technology. Flat panel televisions (plasma and liquid crystal display or LCD) are our fastest growing TV segment in both our U.S. SAM’S CLUBs and Wal-Mart stores. You can fi nd fl at panel televisions in our stores worldwide, as well as online at www.walmart.com and www.samsclub.com. Did you know that in the U.S. retail channel, we are the fi rst to make available RoHS (Restriction on Hazardous Substance) compliant products? This refl ects our commitment to our customers who want to protect and sustain the environment, and buy products at every day low prices. By July 2006, we expect all personal computers sold at U.S. Wal-Mart stores will meet the RoHS standard.
In October 2005, Wal-Mart debuted its exclusive Metro 7™ collection – a distinct line of women’s apparel designed specifi cally for the fashion-savvy customer. The Metro 7™ line appeals to a more urban customer and features styles that are both feminine and contemporary. All items are designed with high-quality fabrics, and are versatile enough to allow women to dress fashionably around the clock – at the affordable prices customers expect from Wal-Mart. The line recently expanded to acces-sories, including belts, handbags, shoes and jewelry. The collection is available in misses and plus sizes in select Wal-Mart stores and online at www.walmart.com.
2
Today’s consumers want healthier and more responsible food choices. That’s why we are doubling the organic product and socially responsible offerings in select U.S. Wal-Mart stores. SAM’S CLUB also is expanding its array of organic and socially responsible products by more than 100 new items, such as Brazilian Marques de Paiva USDA organic coffee.
Organic and healthier food choices
™

Gift cards are the perfect gift! They can be used for all purchases in our stores and clubs, as well as online at www.walmart.com and www.samsclub.com. Wal-Mart gift cards are available for in-country use around the world. Customers can personalize gift cards either online or at our one-hour photo labs at stores and clubs, so they can carry a photo of loved ones. Wal-Mart was fi rst to market with this exciting in-store innovation. Wal-Mart was also one of the very fi rst retailers to market an environmentally friendly, corn-based, plastic PLA (Polylactic Acid) gift card from NatureWorks™.
3
We have new product offerings in our home area to provide stylish and affordable solutions for home decorating, from furniture to linens, storage to enter-taining. Our collection of products is for the customer seeking quality and style at affordable prices. By the way, in the U.S., we are now aligning with furniture suppliers who can certify that the wood in their prod-ucts is sustainably grown.
For your home Gift cards
Excellent values and services
The George™ apparel line started as a small unknown brand in 100 ASDA stores in the United Kingdom and today is sold in more than 240 stores in the U.K., plus stores in 9 other countries, including the U.S. George™ products are available for men, women, and children and include apparel, shoes, handbags and even eyeglass frames in select stores. In the United Kingdom, we recently launched a line of George™ homeware prod-ucts. The George™ brand is recognized as a stylish, high quality brand at a great value and continues to grow and develop as a favorite fashion choice across the globe.
Great products and services at every day low prices continue to drive our business model. Every day, we fi nd more ways to improve the standard of living for our customers. According to Global Insight, Inc., an internationally recognized fi rm providing economic anal-ysis, we save the average American working family more than $2,300 a year. Our Great Value® and Sam’s Choice® products are examples of quality products at every day low prices. And it doesn’t stop there. In our U.S. Wal-Mart stores, we save our customers hundreds of millions of dollars per year through many fi nancial services – from money orders and money transfers, to check cashing and product care plans. Did you know we also offer fi nancial services around the globe, including pet insurance in the United Kingdom?
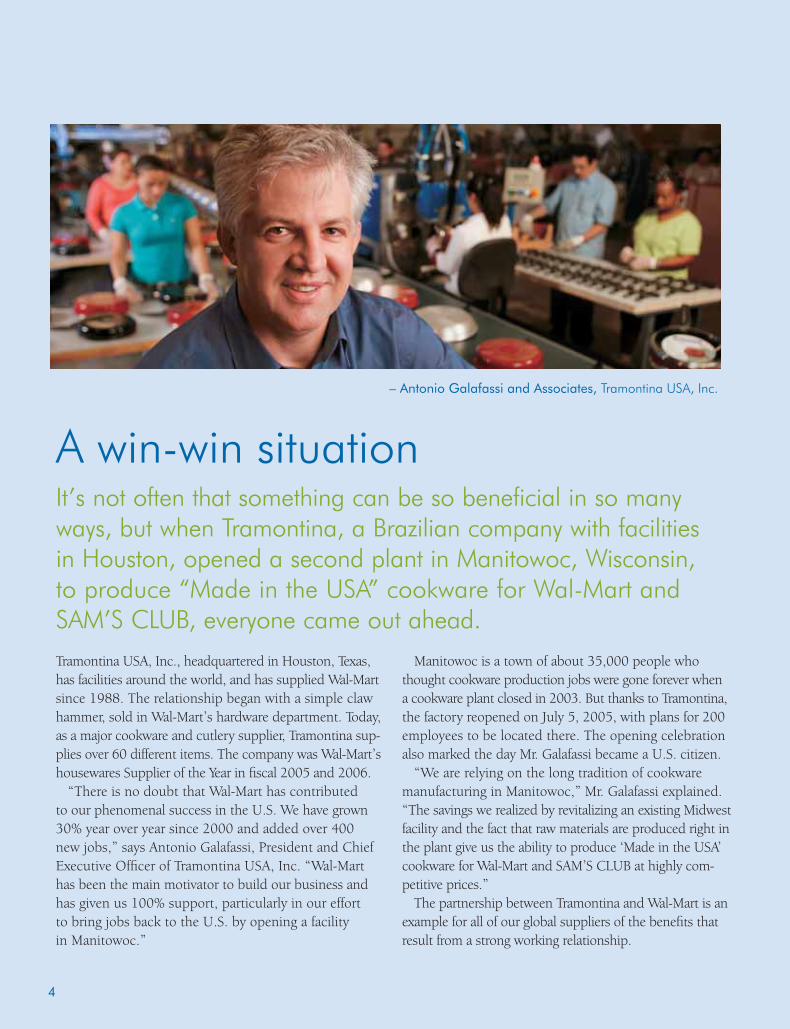
Tramontina USA, Inc., headquartered in Houston, Texas, has facilities around the world, and has supplied Wal-Mart since 1988. The relationship began with a simple claw hammer, sold in Wal-Mart’s hardware department. Today, as a major cookware and cutlery supplier, Tramontina sup-plies over 60 different items. The company was Wal-Mart’s housewares Supplier of the Year in fi scal 2005 and 2006.
“There is no doubt that Wal-Mart has contributed to our phenomenal success in the U.S. We have grown 30% year over year since 2000 and added over 400 new jobs,” says Antonio Galafassi, President and Chief Executive Offi cer of Tramontina USA, Inc. “Wal-Mart has been the main motivator to build our business and has given us 100% support, particularly in our effort to bring jobs back to the U.S. by opening a facility in Manitowoc.”
Manitowoc is a town of about 35,000 people who thought cookware production jobs were gone forever when a cookware plant closed in 2003. But thanks to Tramontina, the factory reopened on July 5, 2005, with plans for 200 employees to be located there. The opening celebration also marked the day Mr. Galafassi became a U.S. citizen.
“We are relying on the long tradition of cookware manufacturing in Manitowoc,” Mr. Galafassi explained. “The savings we realized by revitalizing an existing Midwest facility and the fact that raw materials are produced right in the plant give us the ability to produce ‘Made in the USA’ cookware for Wal-Mart and SAM’S CLUB at highly com-petitive prices.”
The partnership between Tramontina and Wal-Mart is an example for all of our global suppliers of the benefi ts that result from a strong working relationship.
4
– Antonio Galafassi and Associates, Tramontina USA, Inc.
A win-win situationIt’s not often that something can be so beneficial in so many ways, but when Tramontina, a Brazilian company with facilities in Houston, opened a second plant in Manitowoc, Wisconsin, to produce “Made in the USA” cookware for Wal-Mart and SAM’S CLUB, everyone came out ahead.

I’m smiling because Wal-Mart makes a real difference in my community.
5
– James Sexton, Mayor, Evergreen Park, IL
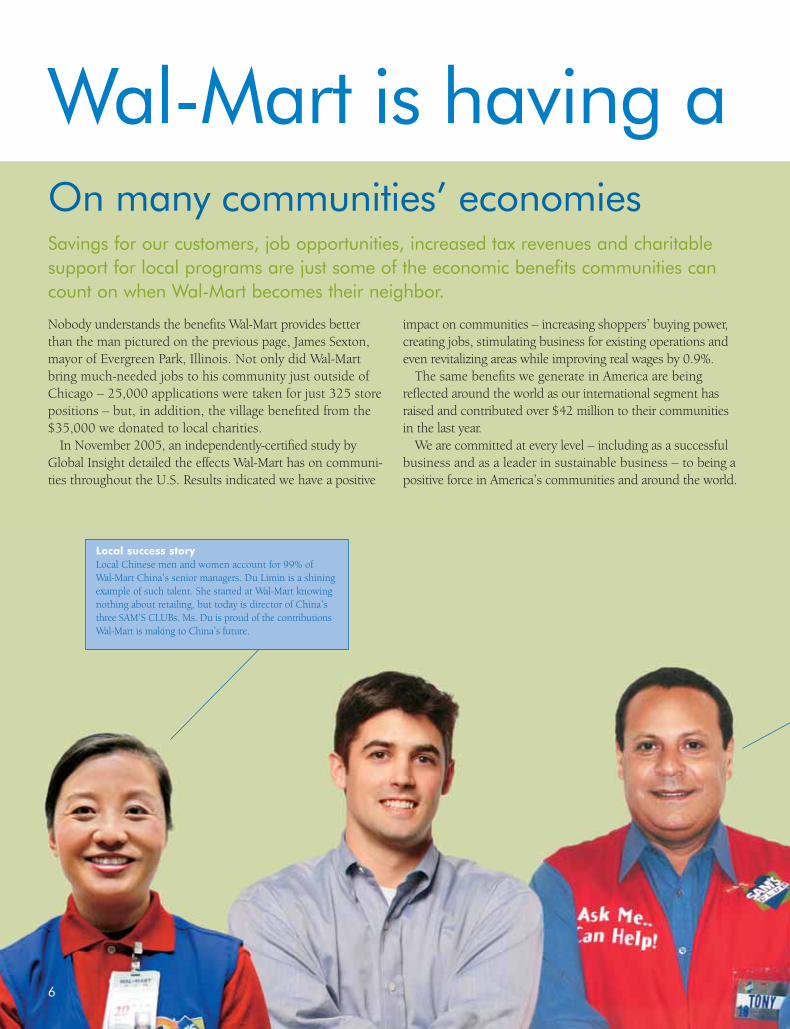
Wal-Mart is having a
Nobody understands the benefi ts Wal-Mart provides better than the man pictured on the previous page, James Sexton, mayor of Evergreen Park, Illinois. Not only did Wal-Mart bring much-needed jobs to his community just outside of Chicago – 25,000 applications were taken for just 325 store positions – but, in addition, the village benefi ted from the $35,000 we donated to local charities.
In November 2005, an independently-certifi ed study by Global Insight detailed the effects Wal-Mart has on communi-ties throughout the U.S. Results indicated we have a positive
impact on communities – increasing shoppers’ buying power, creating jobs, stimulating business for existing operations and even revitalizing areas while improving real wages by 0.9%.
The same benefi ts we generate in America are being refl ected around the world as our international segment has raised and contributed over $42 million to their communities in the last year.
We are committed at every level – including as a successful business and as a leader in sustainable business – to being a positive force in America’s communities and around the world.
Savings for our customers, job opportunities, increased tax revenues and charitable support for local programs are just some of the economic benefits communities can count on when Wal-Mart becomes their neighbor.
6
On many communities’ economies
Local success storyLocal Chinese men and women account for 99% of Wal-Mart China’s senior managers. Du Limin is a shining example of such talent. She started at Wal-Mart knowing nothing about retailing, but today is director of China’s three SAM’S CLUBs. Ms. Du is proud of the contributions Wal-Mart is making to China’s future.

Local success storyTony Perez started out pushing carts at SAM’S CLUB in Kenner, Louisiana. Today he manages a Miami, Florida SAM’S CLUB so successfully – stocking the ethnic foods his local Hispanic members want – that in just two years, the CLUB has grown sales by more than 60%. The result is more sales tax for the local community and more associate jobs, all with great career potential.
7
On many associates’ lives
positive impact:
For those seeking a career with Wal-Mart, more than three-fourths of U.S. store management started with the Company in hourly positions.
By promoting diversity and inclusion in the workplace, we impact our associates’ lives in an important way. Wal-Mart’s diversity initiatives are being recognized by such reputable orga-nizations and publications as DiversityInc®, Black Enterprise® and Hispanic Network Magazine®. When you work at Wal-Mart, you work with a diverse group of associates.
Wal-Mart drives results by holding our senior leaders accountable for meeting diversity goals, which are tied to
incentive compensation and performance evaluations. In fact, all offi cers achieved their diversity goals in fi scal 2006.
Our survey results as of September 2005 show that more than 30% of the over 1.3 million associates in the U.S. are minorities, and more than 60% are female. Many associates are seniors who supplement their income or students who gain valuable professional experience.
Local success storyCan a mom with only a high school diploma become manager of an exciting multi-million-dollar operation? She can if she’s high-energy Sherry Bryan, manager of our Lexington, Kentucky Wal-Mart on Richmond Road. This Wal-Mart raised funds to support their local community’s military unit in Iraq, contributed to their local food bank, and helped a local child’s Make-a-Wish® dream come true.
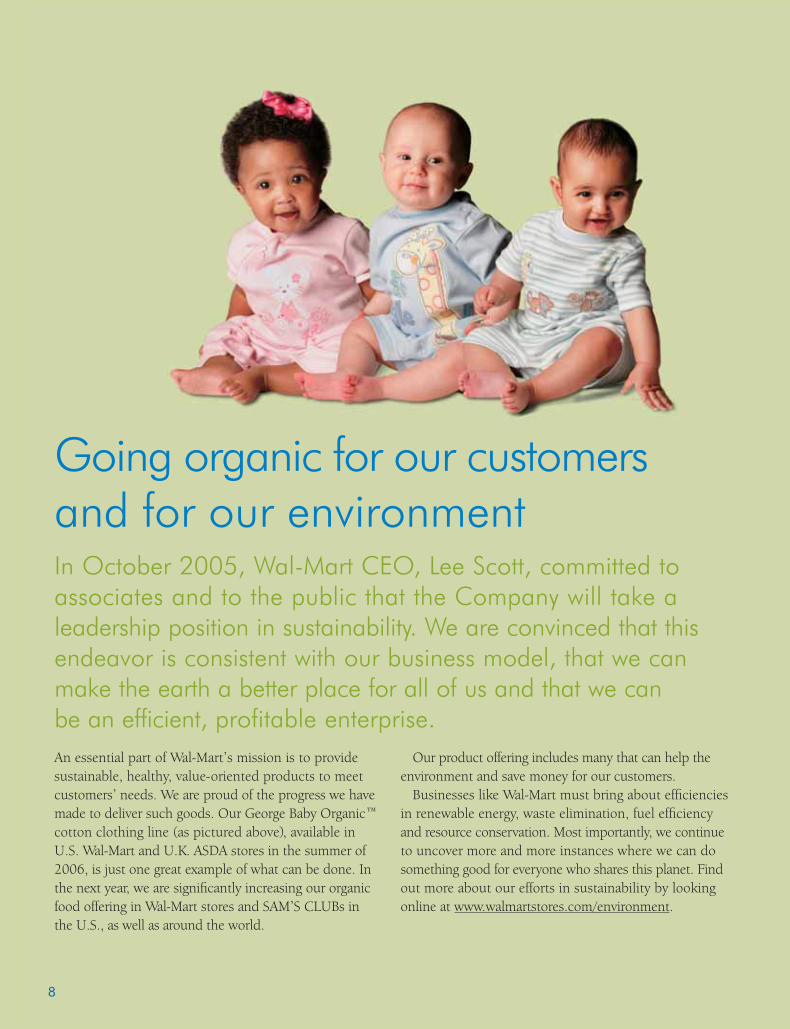
In October 2005, Wal-Mart CEO, Lee Scott, committed to associates and to the public that the Company will take a leadership position in sustainability. We are convinced that this endeavor is consistent with our business model, that we can make the earth a better place for all of us and that we can be an efficient, profitable enterprise.An essential part of Wal-Mart’s mission is to provide sustainable, healthy, value-oriented products to meet customers’ needs. We are proud of the progress we have made to deliver such goods. Our George Baby Organic™ cotton clothing line (as pictured above), available in U.S. Wal-Mart and U.K. ASDA stores in the summer of 2006, is just one great example of what can be done. In the next year, we are signifi cantly increasing our organic food offering in Wal-Mart stores and SAM’S CLUBs in the U.S., as well as around the world.
Our product offering includes many that can help the environment and save money for our customers.
Businesses like Wal-Mart must bring about effi ciencies in renewable energy, waste elimination, fuel effi ciency and resource conservation. Most importantly, we continue to uncover more and more instances where we can do something good for everyone who shares this planet. Find out more about our efforts in sustainability by lookingonline at www.walmartstores.com/environment.
8
Going organic for our customers and for our environment

I’m smiling because Wal-Mart helps people.
– Kirstyn, student
9
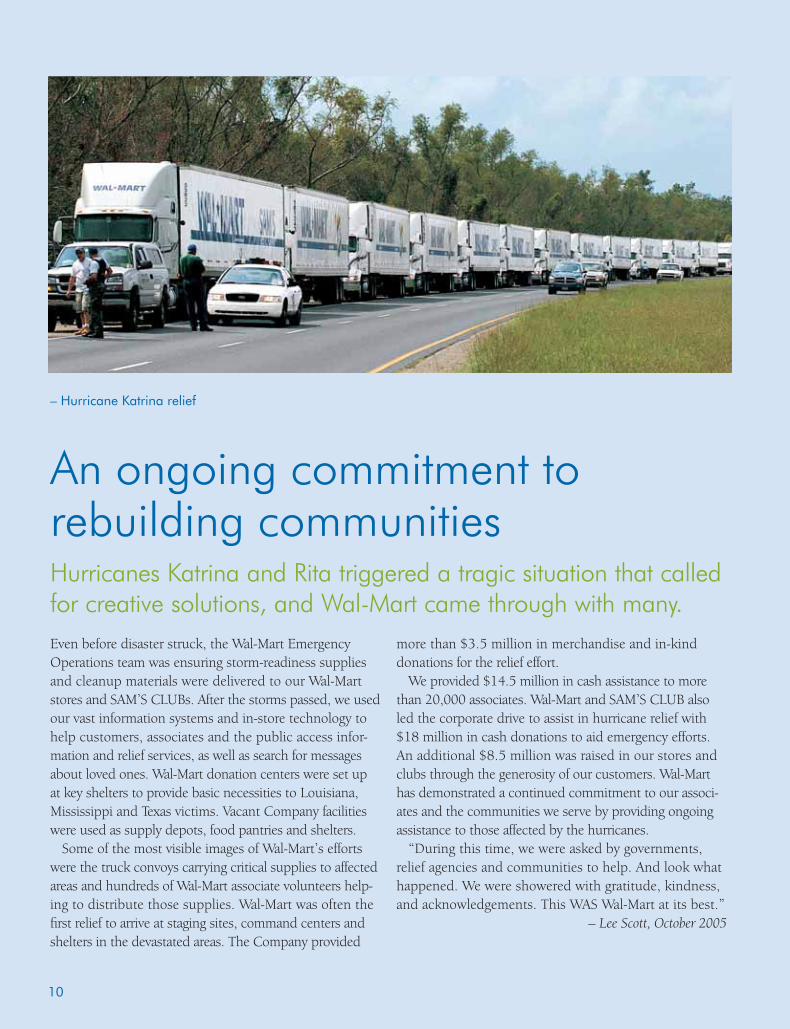
Hurricanes Katrina and Rita triggered a tragic situation that called for creative solutions, and Wal-Mart came through with many.Even before disaster struck, the Wal-Mart Emergency Operations team was ensuring storm-readiness supplies and cleanup materials were delivered to our Wal-Mart stores and SAM’S CLUBs. After the storms passed, we used our vast information systems and in-store technology to help customers, associates and the public access infor-mation and relief services, as well as search for messages about loved ones. Wal-Mart donation centers were set up at key shelters to provide basic necessities to Louisiana, Mississippi and Texas victims. Vacant Company facilities were used as supply depots, food pantries and shelters.
Some of the most visible images of Wal-Mart’s efforts were the truck convoys carrying critical supplies to affected areas and hundreds of Wal-Mart associate volunteers help-ing to distribute those supplies. Wal-Mart was often the fi rst relief to arrive at staging sites, command centers and shelters in the devastated areas. The Company provided
more than $3.5 million in merchandise and in-kind donations for the relief effort.
We provided $14.5 million in cash assistance to more than 20,000 associates. Wal-Mart and SAM’S CLUB also led the corporate drive to assist in hurricane relief with $18 million in cash donations to aid emergency efforts. An additional $8.5 million was raised in our stores and clubs through the generosity of our customers. Wal-Mart has demonstrated a continued commitment to our associ-ates and the communities we serve by providing ongoing assistance to those affected by the hurricanes.
“During this time, we were asked by governments, relief agencies and communities to help. And look what happened. We were showered with gratitude, kindness, and acknowledgements. This WAS Wal-Mart at its best.”
– Lee Scott, October 2005
An ongoing commitment to rebuilding communities
– Hurricane Katrina relief
10
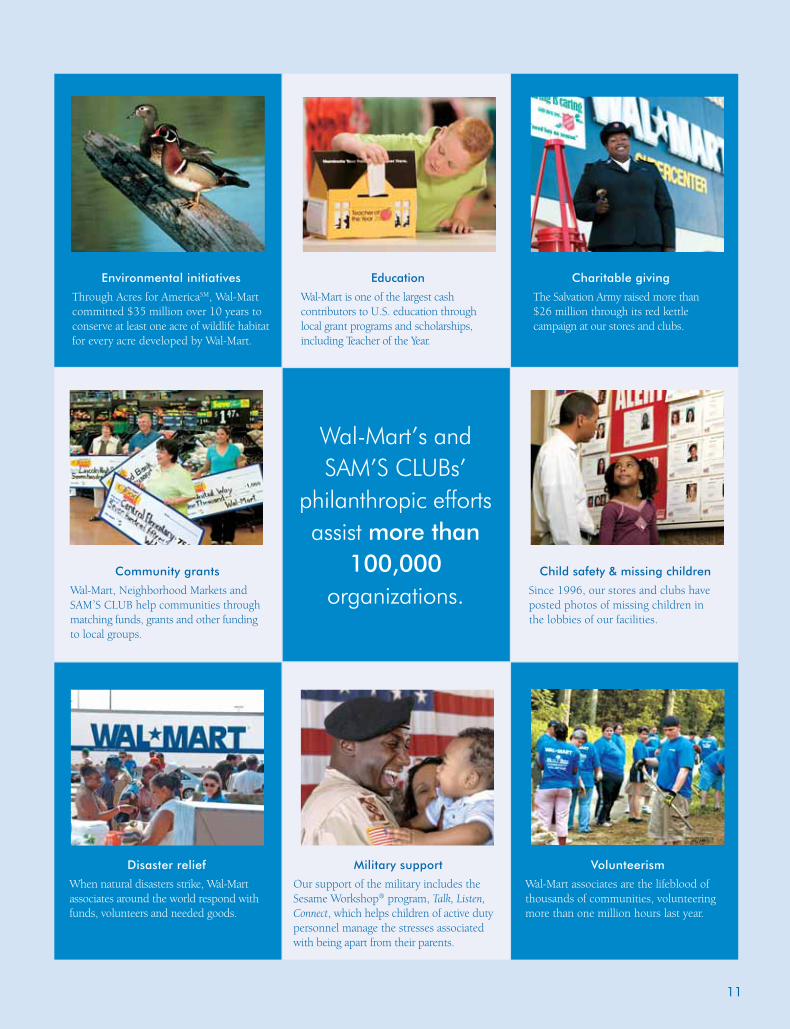
Wal-Mart’s and SAM’S CLUBs’
philanthropic efforts assist more than
100,000 organizations.
Charitable giving
The Salvation Army raised more than $26 million through its red kettle campaign at our stores and clubs.
Education
Wal-Mart is one of the largest cash contributors to U.S. education through local grant programs and scholarships, including Teacher of the Year.
Child safety & missing children
Since 1996, our stores and clubs have posted photos of missing children in the lobbies of our facilities.
Disaster relief
When natural disasters strike, Wal-Mart associates around the world respond with funds, volunteers and needed goods.
Volunteerism
Wal-Mart associates are the lifeblood of thousands of communities, volunteering more than one million hours last year.
Military support
Our support of the military includes the Sesame Workshop® program, Talk, Listen, Connect, which helps children of active duty personnel manage the stresses associated with being apart from their parents.
11
Environmental initiatives
Through Acres for AmericaSM, Wal-Mart committed $35 million over 10 years to conserve at least one acre of wildlife habitat for every acre developed by Wal-Mart.
Community grants
Wal-Mart, Neighborhood Markets and SAM’S CLUB help communities through matching funds, grants and other funding to local groups.
To our shareholders, associates and customers:Last year was a good year for Wal-Mart. We delivered record financial results and strong, steady growth. But just as important as what we achieved are the changes we made to position our Company for the future. We at Wal-Mart are optimistic – or smiling, if you will – about our ability to continue to grow and touch the lives of millions more working families around the world.
When it comes to our performance during fiscal 2006, we have a lot to
be proud of at Wal-Mart. Our net sales rose 9.5% to a record $312.4 bil-
lion. Net income rose 9.4% to a record $11.2 billion. Our earnings per
share grew double-digits from $2.41 to $2.68 per share. And despite high-
er energy costs – which will likely remain a challenge in the coming year
– comparative store sales in the U.S. rose a healthy 3.4%. We were also
pleased with strong international sales in Argentina, Mexico and Brazil.
All of this success is a tribute to the 1.8 million associates who serve
our customers every day in our more than 6,100 stores worldwide. And
thanks to these hard-working men and women and their ability to grow
with our Company, we are excited about the future. Together, we are going
to leverage the changes of this past year into even greater success for
Wal-Mart and the communities we serve and support.
One area where we made major changes last year was management.
John Menzer and Mike Duke switched leadership roles. As a vice chair-
man, John now runs U.S. operations and several divisions. Mike, also a
vice chairman, now runs our international operations. After a superb job
at the helm of Wal-Mex, Eduardo Castro-Wright took over our U.S. stores.
And we elevated Company veteran Doug McMillon to president and CEO
of SAM’S CLUB. We also strengthened the leadership in both our domes-
tic and international divisions by attracting some outstanding talent from
outside the Company. With these moves, our entire management team
is now sharply focused on strengthening the customer experience in our
stores and clubs.
Another area where we made significant changes was in our inter-
national business. With our purchase of the retail operations of Sonae
in Brazil and our consolidation of Seiyu in Japan, we added 537 new
international stores and 50,000 new associates. And, with our purchase
of an interest in CARHCO in Central America, we increased the num-
ber of countries in which we operate by 50% – from 10 countries to
15 countries. These aggressive moves are helping us continue to drive
robust growth in our international division. So will our expansion plans.
Of the almost 600 stores we plan to open this year, we expect more
than a third will be international.
“ When it comes to our performance during fiscal 2006, we have a lot to be proud of at Wal-Mart. Our net sales rose 9.5% to a record $312.4 billion. Net income rose 9.4% to a record $11.2 billion. Our earnings per share grew double-digits from $2.41 to $2.68 per share.”
12
– Lee Scott, President and Chief Executive Offi cer

13
In addition to our financial performance and these exciting changes,
we are also proud of the Company’s progress on a variety of issues that
both our associates and our customers care deeply about. First, we made
our U.S. health coverage more affordable to associates by offering a
new Value Plan. By next year, the Value Plan will be available to half of
our associates for just $11 per month. Second, we created 125,000 new
jobs in the U.S. We are especially excited about the jobs we are creating
by successfully building stores in urban areas. At a store opening this
year just outside of Chicago, we received more than 25,000 applications
for just 325 jobs. Third, we began aggressively to implement sustainable
business practices. One of the goals we set is to double the fuel effi-
ciency of our truck fleet within 10 years. This should save us $300 mil-
lion per year when fully implemented. All of this progress is good for the
working men and women we employ, the thousands of communities we
support, and the millions of customers we serve worldwide. And that’s
why it is also good for our Company and our shareholders.
For some time, more than any other company, Wal-Mart has been at
the intersection of American life. Yet today, we find ourselves operat-
ing 2,285 international stores, buying products from 70 countries, and
doing 20% of our business abroad. Wal-Mart’s marketplace is clearly the
world. And we have every reason to be optimistic about our role – both
for the opportunity it provides our Company to learn and to grow, but
also for the opportunity Wal-Mart has to continue to raise the standard
of living for people everywhere.
Wal-Mart can be – and in many cases, already is – part of the solution
to some of the most complex challenges in the world today. Just like our
U.S. stores, our international stores help working families stretch their
incomes and afford daily needs like fresh foods and quality school clothes.
And we help working families in many other meaningful ways – such as
giving an operations manager at our distribution center in Tianjin, China
the opportunity to learn logistics and supply chain management, or
creating community centers in Uttar Pradesh, India where mothers can
make their crafts in a better work environment and earn more income
for their families. This is tremendous good that Wal-Mart is doing at the
intersection of global life.
On March 17, 1992, the President of the United States presented
our founder, Sam Walton, with the Medal of Freedom. It was one of the
proudest days in his life and in the life of our Company. Accepting the
award, Mr. Sam said: “We’ll lower the cost of living for everyone, not just
in America, but we’ll give the world an opportunity to see what it’s like
to save and do better.” Sam Walton saw then what we’re making a reality
today at Wal-Mart. And to borrow just a few more of his words from that
moving day: “We think we’ve just begun.”
My thanks to all of you for your support, your service and your
patronage during the past year and in the promising years ahead.
Lee Scott
President and Chief Executive Officer
Wal-Mart Stores, Inc.
“ Today, we find ourselves operating 2,285 international stores, buying products from 70 countries, and doing 20% of our business abroad. Wal-Mart’s marketplace is clearly the world.”
Financial Highlights
(In Millions Except Per Share Data)
Fiscal Years Ended January 31, 2006 2005 2004 2003 2002
Net Sales $312,427 $285,222 $256,329 $229,616 $204,011 Cost of Sales $240,391 $219,793 $198,747 $178,299 $159,097 Net Income $ 11,231 $ 10,267 $ 9,054 $ 7,955 $ 6,592 Diluted Earnings Per Share $ 2.68 $ 2.41 $ 2.07 $ 1.79 $ 1.47 Long Term Debt $ 26,429 $ 20,087 $ 17,102 $ 16,597 $ 15,676 Return on Assets(1) 8.9% 9.3% 9.2% 9.2% 8.4% Return on Shareholders’ Equity(2) 22.5% 22.6% 21.3% 20.9% 19.4%
(1) Income from continuing operations before minority interest divided by average total assets.(2) Income from continuing operations before minority interest divided by average shareholders’ equity.
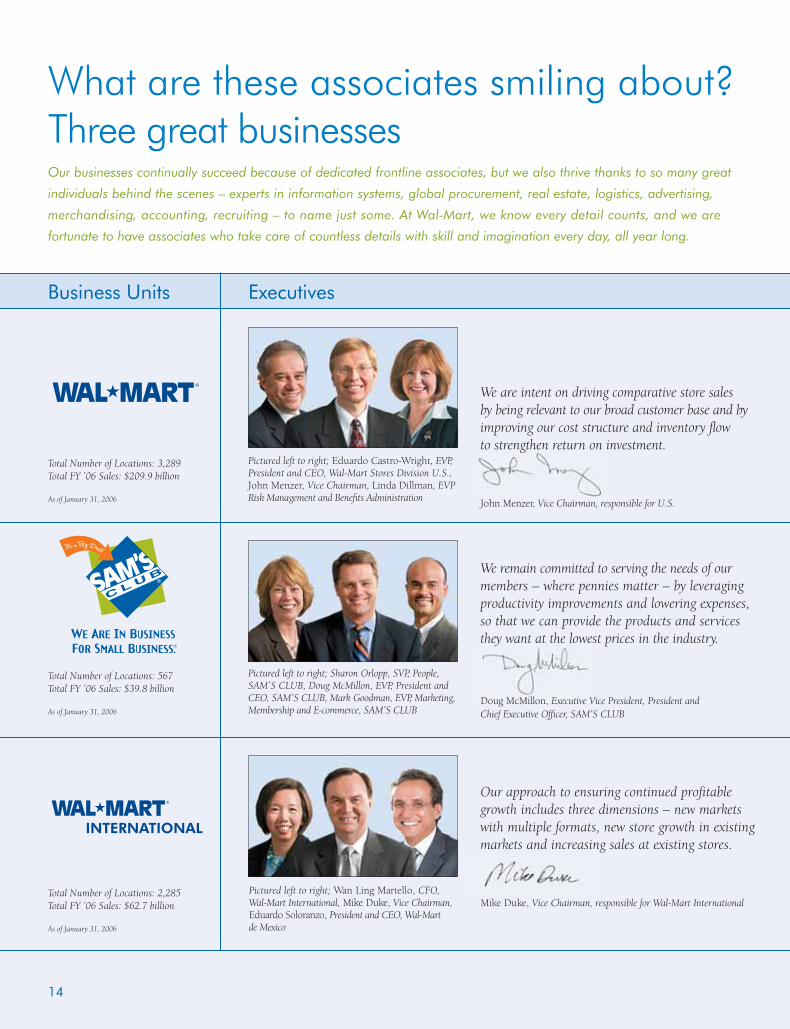
What are these associates smiling about? Three great businessesOur businesses continually succeed because of dedicated frontline associates, but we also thrive thanks to so many great
individuals behind the scenes – experts in information systems, global procurement, real estate, logistics, advertising,
merchandising, accounting, recruiting – to name just some. At Wal-Mart, we know every detail counts, and we are
fortunate to have associates who take care of countless details with skill and imagination every day, all year long.
14
Business Units Executives
INTERNATIONAL
Total Number of Locations: 2,285Total FY ’06 Sales: $62.7 billion
As of January 31, 2006
Total Number of Locations: 3,289Total FY ’06 Sales: $209.9 billion
As of January 31, 2006
Total Number of Locations: 567Total FY ’06 Sales: $39.8 billion
As of January 31, 2006
We remain committed to serving the needs of our members – where pennies matter – by leveraging productivity improvements and lowering expenses, so that we can provide the products and services they want at the lowest prices in the industry.
Doug McMillon, Executive Vice President, President and Chief Executive Offi cer, SAM’S CLUB
We are intent on driving comparative store sales by being relevant to our broad customer base and by improving our cost structure and inventory flow to strengthen return on investment.
John Menzer, Vice Chairman, responsible for U.S.
Our approach to ensuring continued profitable growth includes three dimensions – new markets with multiple formats, new store growth in existing markets and increasing sales at existing stores.
Mike Duke, Vice Chairman, responsible for Wal-Mart International
Pictured left to right; Sharon Orlopp, SVP, People, SAM’S CLUB, Doug McMillon, EVP, President and CEO, SAM’S CLUB, Mark Goodman, EVP, Marketing, Membership and E-commerce, SAM’S CLUB
Pictured left to right; Eduardo Castro-Wright, EVP, President and CEO, Wal-Mart Stores Division U.S., John Menzer, Vice Chairman, Linda Dillman, EVP Risk Management and Benefi ts Administration
Pictured left to right; Wan Ling Martello, CFO, Wal-Mart International, Mike Duke, Vice Chairman, Eduardo Soloranzo, President and CEO, Wal-Mart de Mexico
15
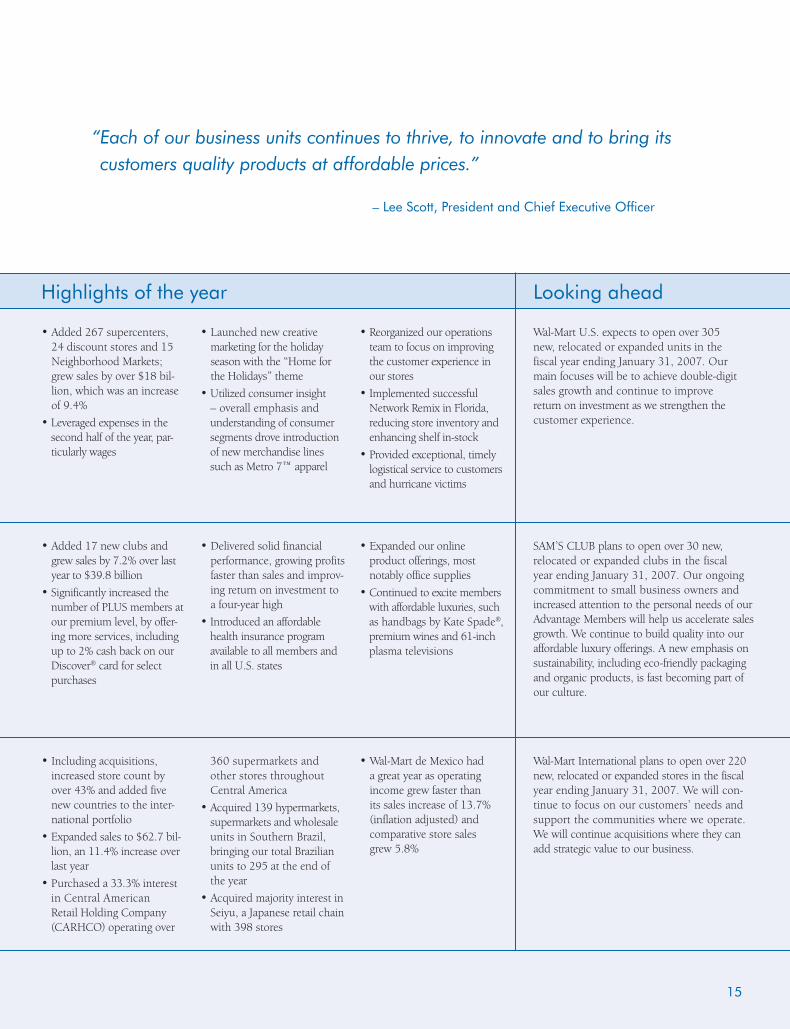
Wal-Mart U.S. expects to open over 305 new, relocated or expanded units in the fiscal year ending January 31, 2007. Our main focuses will be to achieve double-digit sales growth and continue to improve return on investment as we strengthen the customer experience.
SAM’S CLUB plans to open over 30 new, relocated or expanded clubs in the fiscal year ending January 31, 2007. Our ongoing commitment to small business owners and increased attention to the personal needs of our Advantage Members will help us accelerate sales growth. We continue to build quality into our affordable luxury offerings. A new emphasis on sustainability, including eco-friendly packaging and organic products, is fast becoming part of our culture.
Wal-Mart International plans to open over 220 new, relocated or expanded stores in the fiscal year ending January 31, 2007. We will con-tinue to focus on our customers’ needs and support the communities where we operate. We will continue acquisitions where they can add strategic value to our business.
• Added 17 new clubs and grew sales by 7.2% over last year to $39.8 billion
• Significantly increased the number of PLUS members at our premium level, by offer-ing more services, including up to 2% cash back on our Discover® card for select purchases
• Delivered solid financial performance, growing profits faster than sales and improv-ing return on investment to a four-year high
• Introduced an affordable health insurance program available to all members and in all U.S. states
• Expanded our online product offerings, most notably office supplies
• Continued to excite members with affordable luxuries, such as handbags by Kate Spade®, premium wines and 61-inch plasma televisions
• Added 267 supercenters, 24 discount stores and 15 Neighborhood Markets; grew sales by over $18 bil-lion, which was an increase of 9.4%
• Leveraged expenses in the second half of the year, par-ticularly wages
• Launched new creative marketing for the holiday season with the “Home for the Holidays” theme
• Utilized consumer insight – overall emphasis and understanding of consumer segments drove introduction of new merchandise lines such as Metro 7™ apparel
• Reorganized our operations team to focus on improving the customer experience in our stores
• Implemented successful Network Remix in Florida, reducing store inventory and enhancing shelf in-stock
• Provided exceptional, timely logistical service to customers and hurricane victims
• Including acquisitions, increased store count by over 43% and added five new countries to the inter-national portfolio
• Expanded sales to $62.7 bil-lion, an 11.4% increase over last year
• Purchased a 33.3% interest in Central American Retail Holding Company (CARHCO) operating over
360 supermarkets and other stores throughout Central America
• Acquired 139 hypermarkets, supermarkets and wholesale units in Southern Brazil, bringing our total Brazilian units to 295 at the end of the year
• Acquired majority interest in Seiyu, a Japanese retail chain with 398 stores
• Wal-Mart de Mexico had a great year as operating income grew faster than its sales increase of 13.7% (inflation adjusted) and comparative store sales grew 5.8%
Looking aheadHighlights of the year
“ Each of our business units continues to thrive, to innovate and to bring its customers quality products at affordable prices.”
– Lee Scott, President and Chief Executive Offi cer
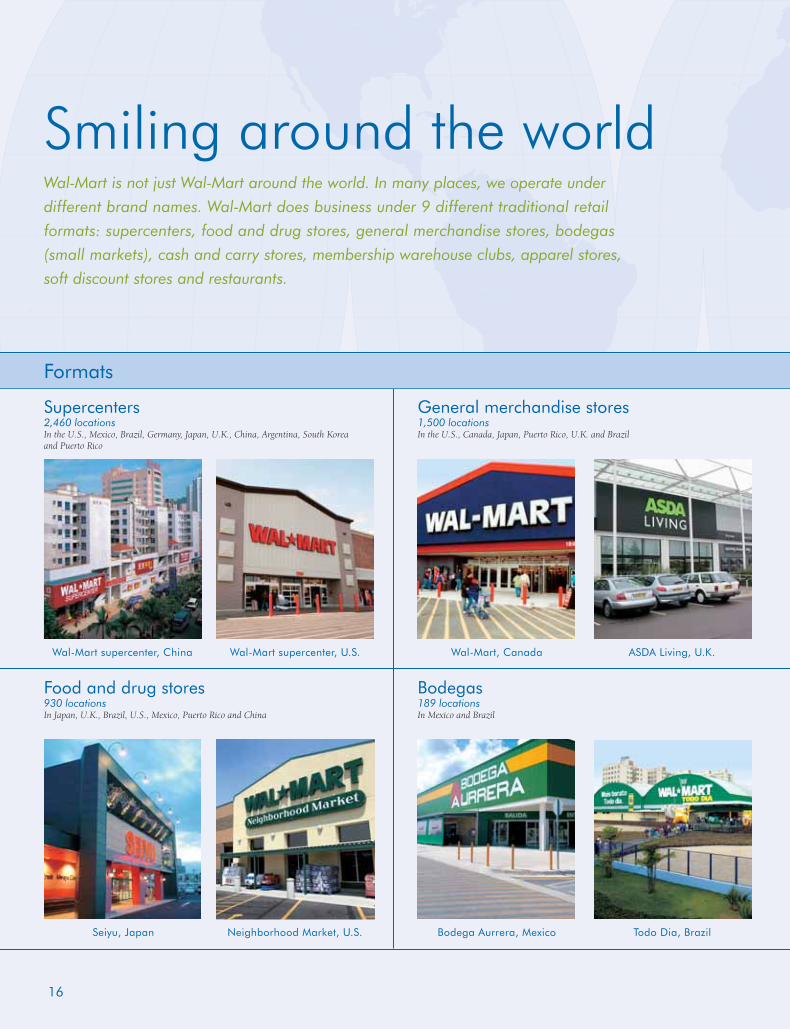
Wal-Mart is not just Wal-Mart around the world. In many places, we operate under
different brand names. Wal-Mart does business under 9 different traditional retail
formats: supercenters, food and drug stores, general merchandise stores, bodegas
(small markets), cash and carry stores, membership warehouse clubs, apparel stores,
soft discount stores and restaurants.
Smiling around the world
16
Food and drug stores930 locationsIn Japan, U.K., Brazil, U.S., Mexico, Puerto Rico and China
Supercenters2,460 locationsIn the U.S., Mexico, Brazil, Germany, Japan, U.K., China, Argentina, South Korea and Puerto Rico
Formats
Wal-Mart supercenter, U.S.Wal-Mart supercenter, China
Neighborhood Market, U.S.Seiyu, Japan
Bodegas189 locationsIn Mexico and Brazil
General merchandise stores1,500 locationsIn the U.S., Canada, Japan, Puerto Rico, U.K. and Brazil
ASDA Living, U.K.Wal-Mart, Canada
Todo Dia, BrazilBodega Aurrera, Mexico
17
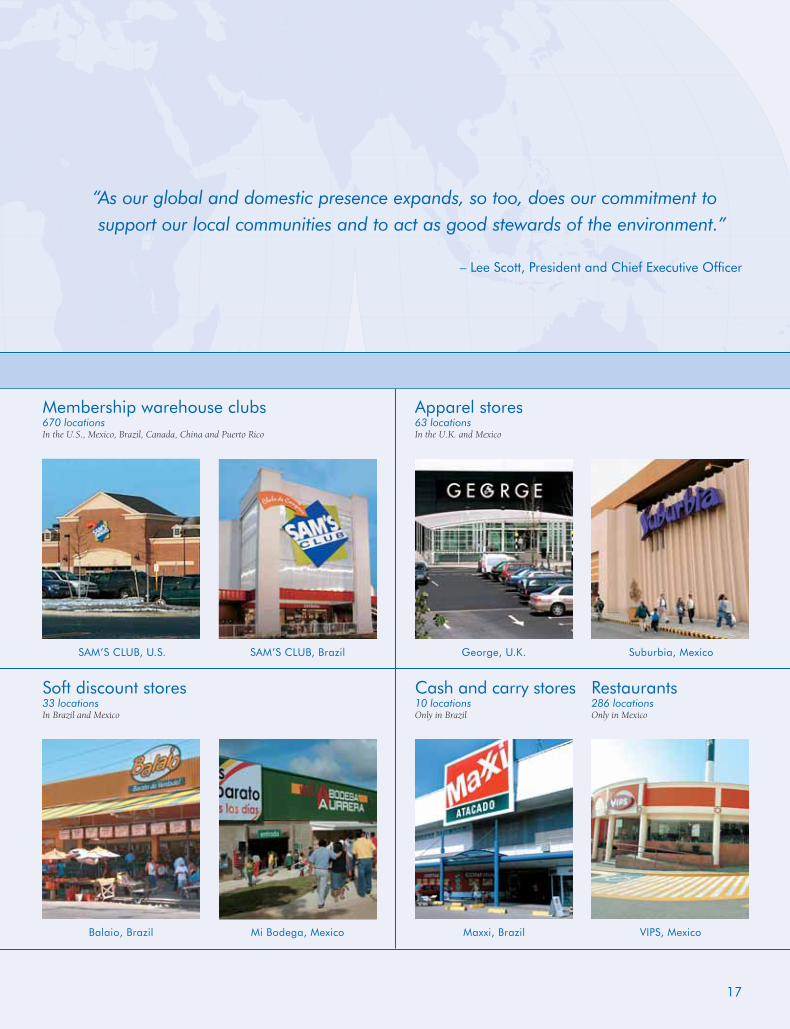
Soft discount stores33 locationsIn Brazil and Mexico
Membership warehouse clubs670 locationsIn the U.S., Mexico, Brazil, Canada, China and Puerto Rico
SAM’S CLUB, BrazilSAM’S CLUB, U.S.
Apparel stores63 locationsIn the U.K. and Mexico
Restaurants286 locationsOnly in Mexico
Cash and carry stores10 locationsOnly in Brazil
VIPS, MexicoMaxxi, Brazil
George, U.K. Suburbia, Mexico
Mi Bodega, MexicoBalaio, Brazil
“ As our global and domestic presence expands, so too, does our commitment to support our local communities and to act as good stewards of the environment.”
– Lee Scott, President and Chief Executive Offi cer
18
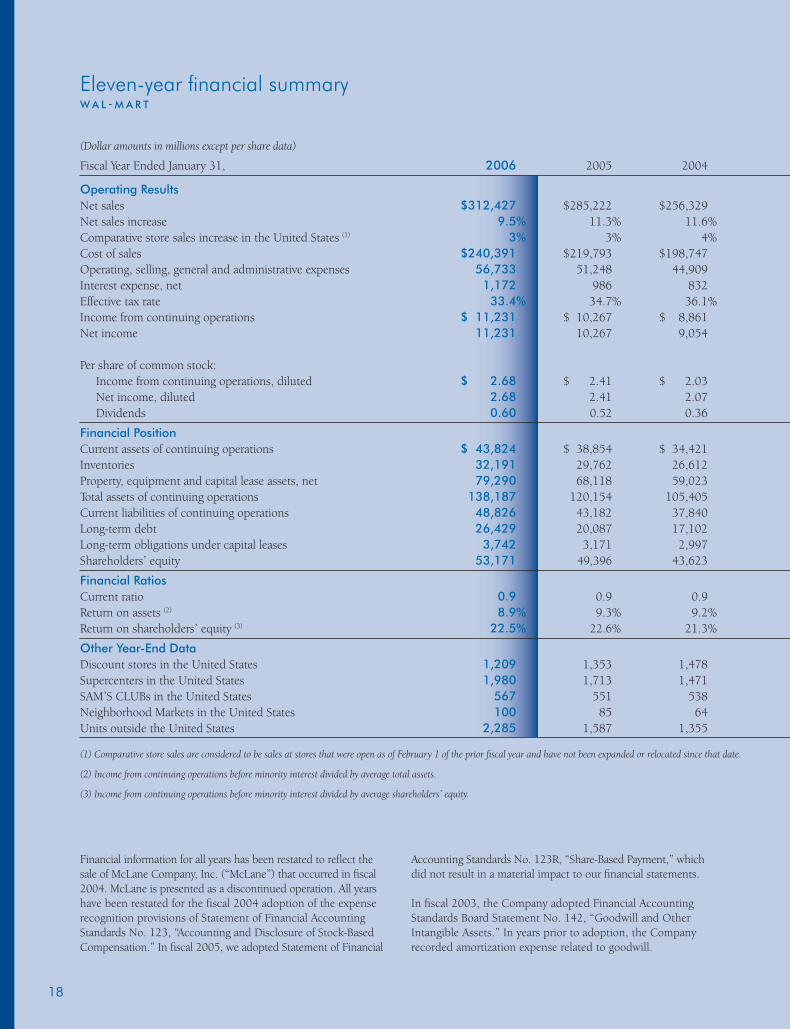
Eleven-year fi nancial summaryW A L - M A R T
(Dollar amounts in millions except per share data)
Fiscal Year Ended January 31, 2006 2005 2004
Operating ResultsNet sales $312,427 $285,222 $256,329 Net sales increase 9.5% 11.3% 11.6% Comparative store sales increase in the United States (1) 3% 3% 4% Cost of sales $240,391 $219,793 $198,747 Operating, selling, general and administrative expenses 56,733 51,248 44,909 Interest expense, net 1,172 986 832 Effective tax rate 33.4% 34.7% 36.1% Income from continuing operations $ 11,231 $ 10,267 $ 8,861 Net income 11,231 10,267 9,054
Per share of common stock: Income from continuing operations, diluted $ 2.68 $ 2.41 $ 2.03 Net income, diluted 2.68 2.41 2.07 Dividends 0.60 0.52 0.36
Financial PositionCurrent assets of continuing operations $ 43,824 $ 38,854 $ 34,421 Inventories 32,191 29,762 26,612 Property, equipment and capital lease assets, net 79,290 68,118 59,023 Total assets of continuing operations 138,187 120,154 105,405 Current liabilities of continuing operations 48,826 43,182 37,840 Long-term debt 26,429 20,087 17,102 Long-term obligations under capital leases 3,742 3,171 2,997 Shareholders’ equity 53,171 49,396 43,623
Financial RatiosCurrent ratio 0.9 0.9 0.9 Return on assets (2) 8.9% 9.3% 9.2% Return on shareholders’ equity (3) 22.5% 22.6% 21.3%
Other Year-End DataDiscount stores in the United States 1,209 1,353 1,478 Supercenters in the United States 1,980 1,713 1,471 SAM’S CLUBs in the United States 567 551 538 Neighborhood Markets in the United States 100 85 64 Units outside the United States 2,285 1,587 1,355
(1) Comparative store sales are considered to be sales at stores that were open as of February 1 of the prior fi scal year and have not been expanded or relocated since that date.
(2) Income from continuing operations before minority interest divided by average total assets.
(3) Income from continuing operations before minority interest divided by average shareholders’ equity.
Financial information for all years has been restated to refl ect the sale of McLane Company, Inc. (“McLane”) that occurred in fi scal 2004. McLane is presented as a discontinued operation. All years have been restated for the fi scal 2004 adoption of the expense recognition provisions of Statement of Financial Accounting Standards No. 123, “Accounting and Disclosure of Stock-Based Compensation.” In fi scal 2005, we adopted Statement of Financial
Accounting Standards No. 123R, “Share-Based Payment,” which did not result in a material impact to our fi nancial statements. In fi scal 2003, the Company adopted Financial Accounting Standards Board Statement No. 142, “Goodwill and Other Intangible Assets.” In years prior to adoption, the Company recorded amortization expense related to goodwill.
19
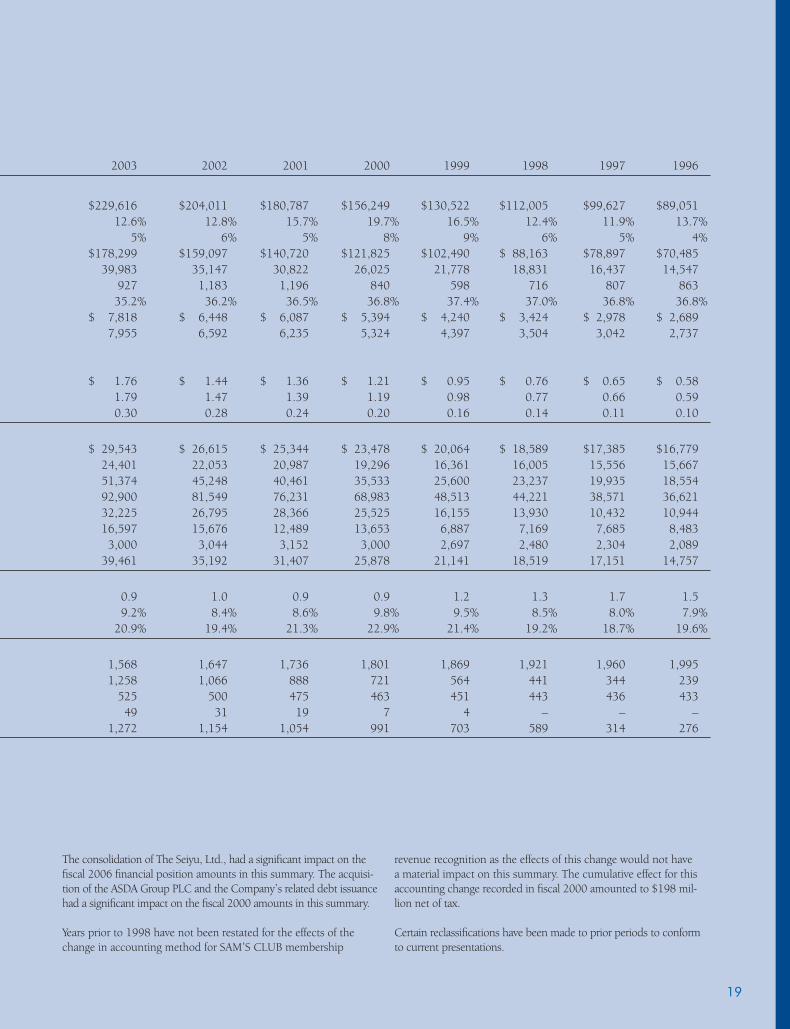
2003 2002 2001 2000 1999 1998 1997 1996
$229,616 $204,011 $180,787 $156,249 $130,522 $112,005 $99,627 $89,05112.6% 12.8% 15.7% 19.7% 16.5% 12.4% 11.9% 13.7%
5% 6% 5% 8% 9% 6% 5% 4%$178,299 $159,097 $140,720 $121,825 $102,490 $ 88,163 $78,897 $70,485
39,983 35,147 30,822 26,025 21,778 18,831 16,437 14,547927 1,183 1,196 840 598 716 807 86335.2% 36.2% 36.5% 36.8% 37.4% 37.0% 36.8% 36.8%
$ 7,818 $ 6,448 $ 6,087 $ 5,394 $ 4,240 $ 3,424 $ 2,978 $ 2,6897,955 6,592 6,235 5,324 4,397 3,504 3,042 2,737
$ 1.76 $ 1.44 $ 1.36 $ 1.21 $ 0.95 $ 0.76 $ 0.65 $ 0.581.79 1.47 1.39 1.19 0.98 0.77 0.66 0.590.30 0.28 0.24 0.20 0.16 0.14 0.11 0.10
$ 29,543 $ 26,615 $ 25,344 $ 23,478 $ 20,064 $ 18,589 $17,385 $16,77924,401 22,053 20,987 19,296 16,361 16,005 15,556 15,66751,374 45,248 40,461 35,533 25,600 23,237 19,935 18,55492,900 81,549 76,231 68,983 48,513 44,221 38,571 36,62132,225 26,795 28,366 25,525 16,155 13,930 10,432 10,94416,597 15,676 12,489 13,653 6,887 7,169 7,685 8,483
3,000 3,044 3,152 3,000 2,697 2,480 2,304 2,08939,461 35,192 31,407 25,878 21,141 18,519 17,151 14,757
0.9 1.0 0.9 0.9 1.2 1.3 1.7 1.59.2% 8.4% 8.6% 9.8% 9.5% 8.5% 8.0% 7.9%
20.9% 19.4% 21.3% 22.9% 21.4% 19.2% 18.7% 19.6%
1,568 1,647 1,736 1,801 1,869 1,921 1,960 1,9951,258 1,066 888 721 564 441 344 239
525 500 475 463 451 443 436 43349 31 19 7 4 – – –
1,272 1,154 1,054 991 703 589 314 276
The consolidation of The Seiyu, Ltd., had a signifi cant impact on the fi scal 2006 fi nancial position amounts in this summary. The acquisi-tion of the ASDA Group PLC and the Company’s related debt issuance had a signifi cant impact on the fi scal 2000 amounts in this summary.
Years prior to 1998 have not been restated for the effects of the change in accounting method for SAM’S CLUB membership
revenue recognition as the effects of this change would not have a material impact on this summary. The cumulative effect for this accounting change recorded in fi scal 2000 amounted to $198 mil-lion net of tax.
Certain reclassifi cations have been made to prior periods to conform to current presentations.
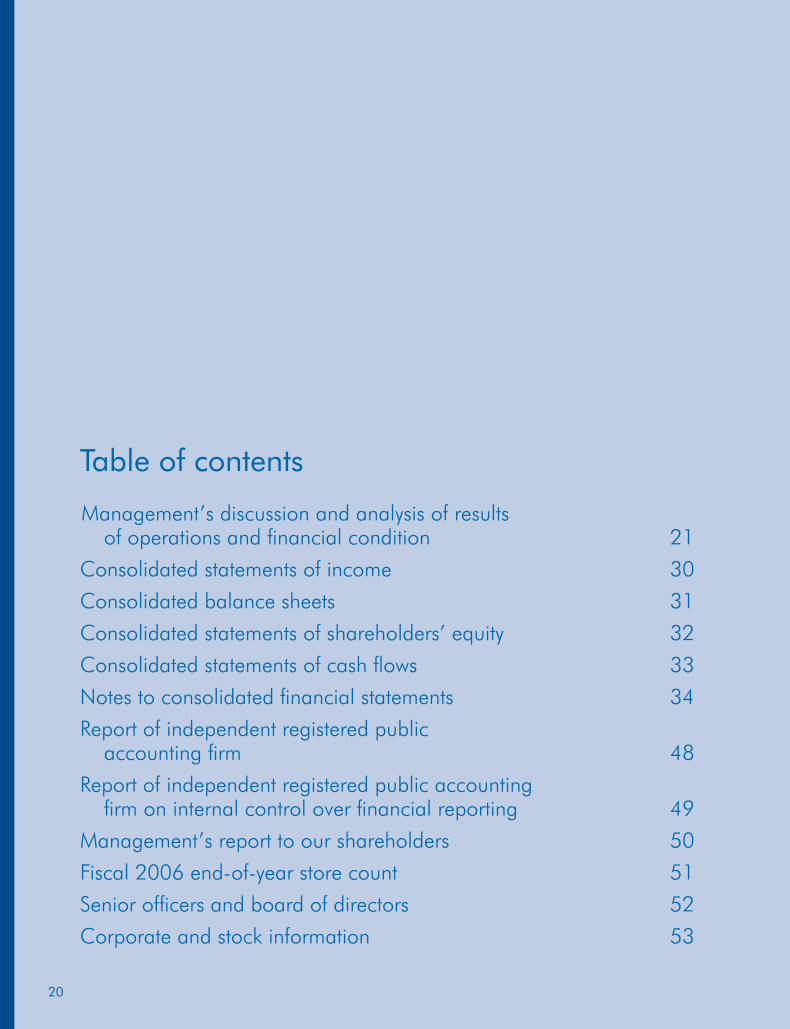
Table of contents
Management’s discussion and analysis of results of operations and fi nancial condition 21
Consolidated statements of income 30
Consolidated balance sheets 31
Consolidated statements of shareholders’ equity 32
Consolidated statements of cash fl ows 33
Notes to consolidated fi nancial statements 34
Report of independent registered public accounting fi rm 48
Report of independent registered public accounting fi rm on internal control over fi nancial reporting 49
Management’s report to our shareholders 50
Fiscal 2006 end-of-year store count 51
Senior offi cers and board of directors 52
Corporate and stock information 53
20
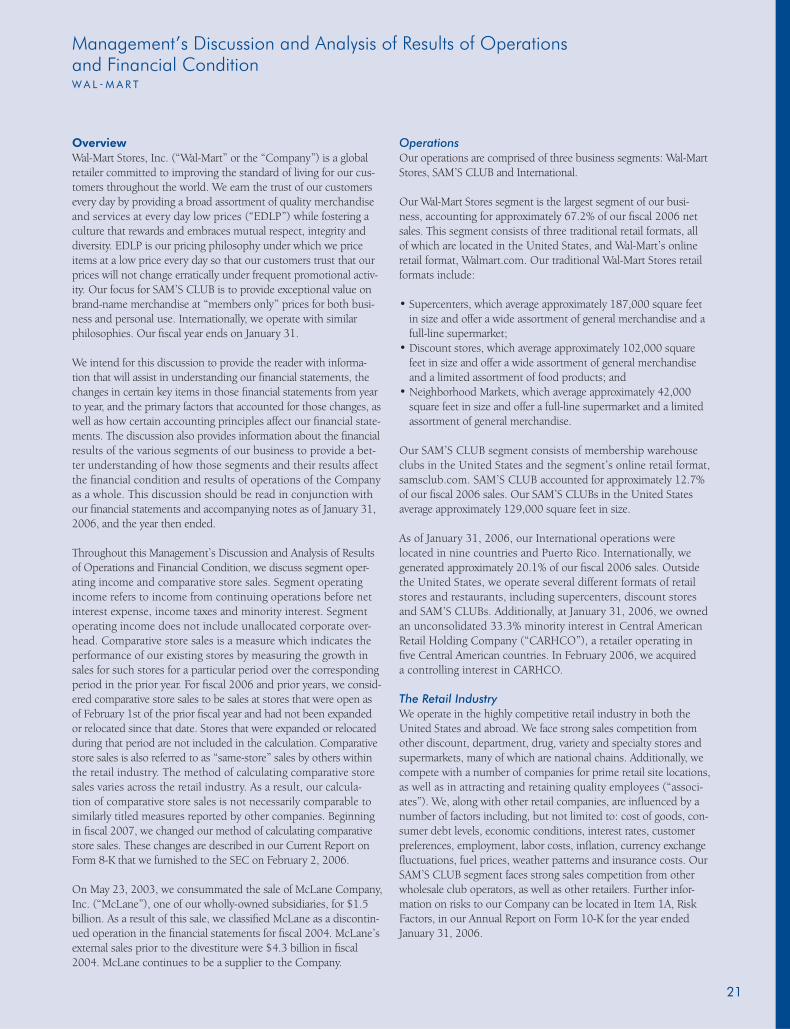
OverviewWal-Mart Stores, Inc. (“Wal-Mart” or the “Company”) is a global retailer committed to improving the standard of living for our cus-tomers throughout the world. We earn the trust of our customers every day by providing a broad assortment of quality merchandise and services at every day low prices (“EDLP”) while fostering a culture that rewards and embraces mutual respect, integrity and diversity. EDLP is our pricing philosophy under which we price items at a low price every day so that our customers trust that our prices will not change erratically under frequent promotional activ-ity. Our focus for SAM’S CLUB is to provide exceptional value on brand-name merchandise at “members only” prices for both busi-ness and personal use. Internationally, we operate with similar philosophies. Our fi scal year ends on January 31.
We intend for this discussion to provide the reader with informa-tion that will assist in understanding our fi nancial statements, the changes in certain key items in those fi nancial statements from year to year, and the primary factors that accounted for those changes, as well as how certain accounting principles affect our fi nancial state-ments. The discussion also provides information about the fi nancial results of the various segments of our business to provide a bet-ter understanding of how those segments and their results affect the fi nancial condition and results of operations of the Company as a whole. This discussion should be read in conjunction with our fi nancial statements and accompanying notes as of January 31, 2006, and the year then ended. Throughout this Management’s Discussion and Analysis of Results of Operations and Financial Condition, we discuss segment oper-ating income and comparative store sales. Segment operating income refers to income from continuing operations before net interest expense, income taxes and minority interest. Segment operating income does not include unallocated corporate over-head. Comparative store sales is a measure which indicates the performance of our existing stores by measuring the growth in sales for such stores for a particular period over the corresponding period in the prior year. For fi scal 2006 and prior years, we consid-ered comparative store sales to be sales at stores that were open as of February 1st of the prior fi scal year and had not been expanded or relocated since that date. Stores that were expanded or relocated during that period are not included in the calculation. Comparative store sales is also referred to as “same-store” sales by others within the retail industry. The method of calculating comparative store sales varies across the retail industry. As a result, our calcula-tion of comparative store sales is not necessarily comparable to similarly titled measures reported by other companies. Beginning in fi scal 2007, we changed our method of calculating comparative store sales. These changes are described in our Current Report on Form 8-K that we furnished to the SEC on February 2, 2006. On May 23, 2003, we consummated the sale of McLane Company, Inc. (“McLane”), one of our wholly-owned subsidiaries, for $1.5 billion. As a result of this sale, we classifi ed McLane as a discontin-ued operation in the fi nancial statements for fi scal 2004. McLane’s external sales prior to the divestiture were $4.3 billion in fi scal 2004. McLane continues to be a supplier to the Company.
OperationsOur operations are comprised of three business segments: Wal-Mart Stores, SAM’S CLUB and International. Our Wal-Mart Stores segment is the largest segment of our busi-ness, accounting for approximately 67.2% of our fi scal 2006 net sales. This segment consists of three traditional retail formats, all of which are located in the United States, and Wal-Mart’s online retail format, Walmart.com. Our traditional Wal-Mart Stores retail formats include: • Supercenters, which average approximately 187,000 square feet
in size and offer a wide assortment of general merchandise and a full-line supermarket;
• Discount stores, which average approximately 102,000 square feet in size and offer a wide assortment of general merchandise and a limited assortment of food products; and
• Neighborhood Markets, which average approximately 42,000 square feet in size and offer a full-line supermarket and a limited assortment of general merchandise.
Our SAM’S CLUB segment consists of membership warehouse clubs in the United States and the segment’s online retail format, samsclub.com. SAM’S CLUB accounted for approximately 12.7% of our fi scal 2006 sales. Our SAM’S CLUBs in the United States average approximately 129,000 square feet in size. As of January 31, 2006, our International operations were located in nine countries and Puerto Rico. Internationally, we generated approximately 20.1% of our fi scal 2006 sales. Outside the United States, we operate several different formats of retail stores and restaurants, including supercenters, discount stores and SAM’S CLUBs. Additionally, at January 31, 2006, we owned an unconsolidated 33.3% minority interest in Central American Retail Holding Company (“CARHCO”), a retailer operating in fi ve Central American countries. In February 2006, we acquired a controlling interest in CARHCO. The Retail Industry We operate in the highly competitive retail industry in both the United States and abroad. We face strong sales competition from other discount, department, drug, variety and specialty stores and supermarkets, many of which are national chains. Additionally, we compete with a number of companies for prime retail site locations, as well as in attracting and retaining quality employees (“associ-ates”). We, along with other retail companies, are infl uenced by a number of factors including, but not limited to: cost of goods, con-sumer debt levels, economic conditions, interest rates, customer preferences, employment, labor costs, infl ation, currency exchange fl uctuations, fuel prices, weather patterns and insurance costs. Our SAM’S CLUB segment faces strong sales competition from other wholesale club operators, as well as other retailers. Further infor-mation on risks to our Company can be located in Item 1A, Risk Factors, in our Annual Report on Form 10-K for the year ended January 31, 2006.
Management’s Discussion and Analysis of Results of Operations and Financial ConditionW A L - M A R T
21
Management’s Discussion and Analysis of Results of Operations and Financial ConditionW A L - M A R T
22
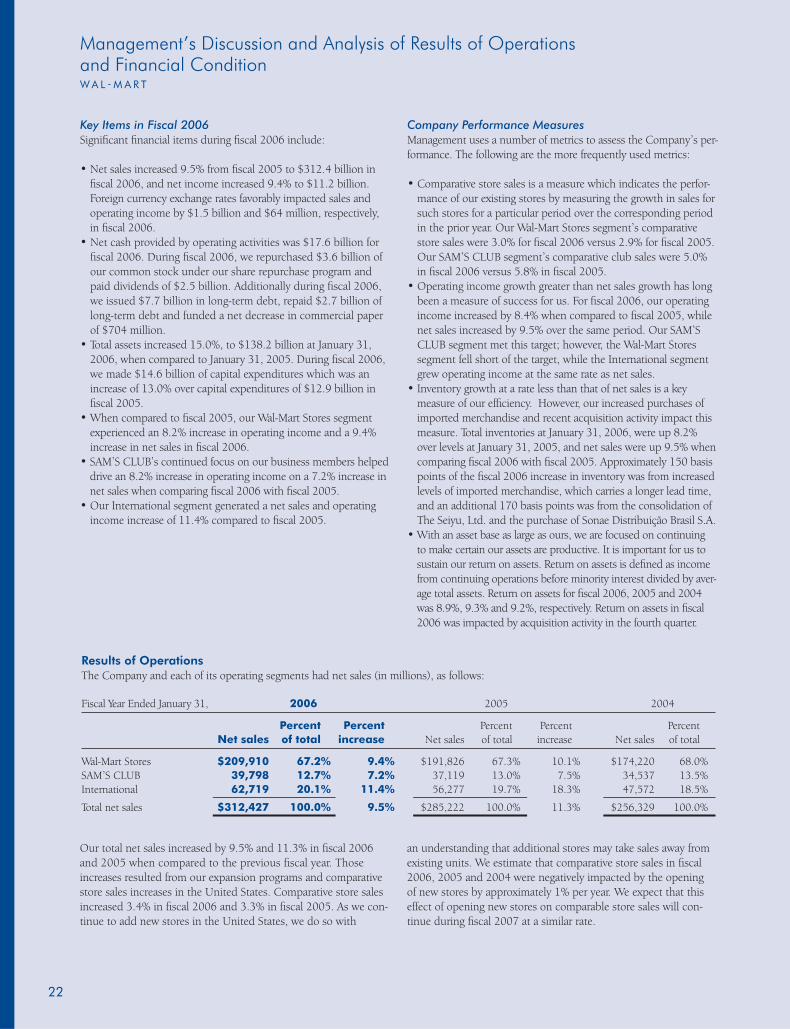
Key Items in Fiscal 2006 Signifi cant fi nancial items during fi scal 2006 include: • Net sales increased 9.5% from fi scal 2005 to $312.4 billion in
fi scal 2006, and net income increased 9.4% to $11.2 billion. Foreign currency exchange rates favorably impacted sales and operating income by $1.5 billion and $64 million, respectively, in fi scal 2006.
• Net cash provided by operating activities was $17.6 billion for fi scal 2006. During fi scal 2006, we repurchased $3.6 billion of our common stock under our share repurchase program and paid dividends of $2.5 billion. Additionally during fi scal 2006, we issued $7.7 billion in long-term debt, repaid $2.7 billion of long-term debt and funded a net decrease in commercial paper of $704 million.
• Total assets increased 15.0%, to $138.2 billion at January 31, 2006, when compared to January 31, 2005. During fi scal 2006, we made $14.6 billion of capital expenditures which was an increase of 13.0% over capital expenditures of $12.9 billion in fi scal 2005.
• When compared to fi scal 2005, our Wal-Mart Stores segment experienced an 8.2% increase in operating income and a 9.4% increase in net sales in fi scal 2006.
• SAM’S CLUB’s continued focus on our business members helped drive an 8.2% increase in operating income on a 7.2% increase in net sales when comparing fi scal 2006 with fi scal 2005.
• Our International segment generated a net sales and operating income increase of 11.4% compared to fi scal 2005.
Company Performance Measures Management uses a number of metrics to assess the Company’s per-formance. The following are the more frequently used metrics:
• Comparative store sales is a measure which indicates the perfor-mance of our existing stores by measuring the growth in sales for such stores for a particular period over the corresponding period in the prior year. Our Wal-Mart Stores segment’s comparative store sales were 3.0% for fi scal 2006 versus 2.9% for fi scal 2005. Our SAM’S CLUB segment’s comparative club sales were 5.0% in fi scal 2006 versus 5.8% in fi scal 2005.
• Operating income growth greater than net sales growth has long been a measure of success for us. For fi scal 2006, our operating income increased by 8.4% when compared to fi scal 2005, while net sales increased by 9.5% over the same period. Our SAM’S CLUB segment met this target; however, the Wal-Mart Stores segment fell short of the target, while the International segment grew operating income at the same rate as net sales.
• Inventory growth at a rate less than that of net sales is a key measure of our effi ciency. However, our increased purchases of imported merchandise and recent acquisition activity impact this measure. Total inventories at January 31, 2006, were up 8.2% over levels at January 31, 2005, and net sales were up 9.5% when comparing fi scal 2006 with fi scal 2005. Approximately 150 basis points of the fi scal 2006 increase in inventory was from increased levels of imported merchandise, which carries a longer lead time, and an additional 170 basis points was from the consolidation of The Seiyu, Ltd. and the purchase of Sonae Distribuição Brasil S.A.
• With an asset base as large as ours, we are focused on continuing to make certain our assets are productive. It is important for us to sustain our return on assets. Return on assets is defi ned as income from continuing operations before minority interest divided by aver-age total assets. Return on assets for fi scal 2006, 2005 and 2004 was 8.9%, 9.3% and 9.2%, respectively. Return on assets in fi scal 2006 was impacted by acquisition activity in the fourth quarter.
Results of OperationsThe Company and each of its operating segments had net sales (in millions), as follows:
Fiscal Year Ended January 31, 2006 2005 2004
Percent Percent Percent Percent Percent Net sales of total increase Net sales of total increase Net sales of total
Wal-Mart Stores $209,910 67.2% 9.4% $191,826 67.3% 10.1% $174,220 68.0%SAM’S CLUB 39,798 12.7% 7.2% 37,119 13.0% 7.5% 34,537 13.5%International 62,719 20.1% 11.4% 56,277 19.7% 18.3% 47,572 18.5%
Total net sales $312,427 100.0% 9.5% $285,222 100.0% 11.3% $256,329 100.0%
Our total net sales increased by 9.5% and 11.3% in fi scal 2006 and 2005 when compared to the previous fi scal year. Those increases resulted from our expansion programs and comparative store sales increases in the United States. Comparative store sales increased 3.4% in fi scal 2006 and 3.3% in fi scal 2005. As we con-tinue to add new stores in the United States, we do so with
an understanding that additional stores may take sales away from existing units. We estimate that comparative store sales in fi scal 2006, 2005 and 2004 were negatively impacted by the opening of new stores by approximately 1% per year. We expect that this effect of opening new stores on comparable store sales will con-tinue during fi scal 2007 at a similar rate.
23
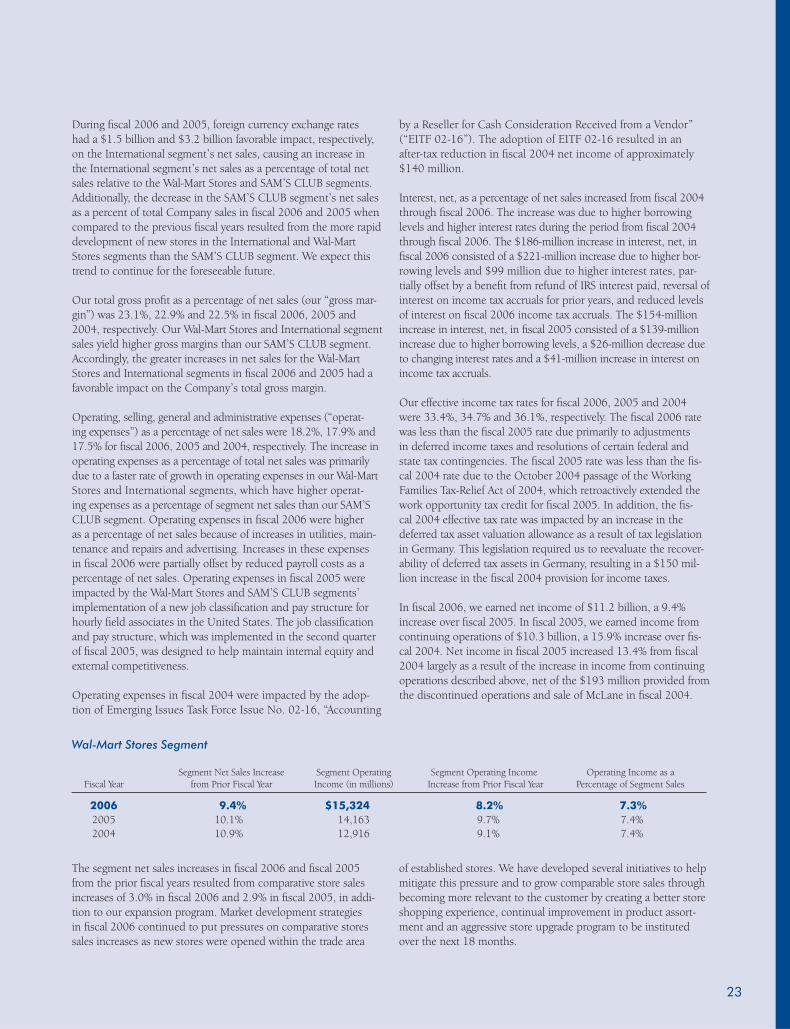
During fi scal 2006 and 2005, foreign currency exchange rates had a $1.5 billion and $3.2 billion favorable impact, respectively, on the International segment’s net sales, causing an increase in the International segment’s net sales as a percentage of total net sales relative to the Wal-Mart Stores and SAM’S CLUB segments. Additionally, the decrease in the SAM’S CLUB segment’s net sales as a percent of total Company sales in fi scal 2006 and 2005 when compared to the previous fi scal years resulted from the more rapid development of new stores in the International and Wal-Mart Stores segments than the SAM’S CLUB segment. We expect this trend to continue for the foreseeable future. Our total gross profi t as a percentage of net sales (our “gross mar-gin”) was 23.1%, 22.9% and 22.5% in fi scal 2006, 2005 and 2004, respectively. Our Wal-Mart Stores and International segment sales yield higher gross margins than our SAM’S CLUB segment. Accordingly, the greater increases in net sales for the Wal-Mart Stores and International segments in fi scal 2006 and 2005 had a favorable impact on the Company’s total gross margin. Operating, selling, general and administrative expenses (“operat-ing expenses”) as a percentage of net sales were 18.2%, 17.9% and 17.5% for fi scal 2006, 2005 and 2004, respectively. The increase in operating expenses as a percentage of total net sales was primarily due to a faster rate of growth in operating expenses in our Wal-Mart Stores and International segments, which have higher operat-ing expenses as a percentage of segment net sales than our SAM’S CLUB segment. Operating expenses in fi scal 2006 were higher as a percentage of net sales because of increases in utilities, main-tenance and repairs and advertising. Increases in these expenses in fi scal 2006 were partially offset by reduced payroll costs as a percentage of net sales. Operating expenses in fi scal 2005 were impacted by the Wal-Mart Stores and SAM’S CLUB segments’ implementation of a new job classifi cation and pay structure for hourly fi eld associates in the United States. The job classifi cation and pay structure, which was implemented in the second quarter of fi scal 2005, was designed to help maintain internal equity and external competitiveness. Operating expenses in fi scal 2004 were impacted by the adop-tion of Emerging Issues Task Force Issue No. 02-16, “Accounting
by a Reseller for Cash Consideration Received from a Vendor” (“EITF 02-16”). The adoption of EITF 02-16 resulted in an after-tax reduction in fi scal 2004 net income of approximately $140 million. Interest, net, as a percentage of net sales increased from fi scal 2004 through fi scal 2006. The increase was due to higher borrowing levels and higher interest rates during the period from fi scal 2004 through fi scal 2006. The $186-million increase in interest, net, in fi scal 2006 consisted of a $221-million increase due to higher bor-rowing levels and $99 million due to higher interest rates, par-tially offset by a benefi t from refund of IRS interest paid, reversal of interest on income tax accruals for prior years, and reduced levels of interest on fi scal 2006 income tax accruals. The $154-million increase in interest, net, in fi scal 2005 consisted of a $139-million increase due to higher borrowing levels, a $26-million decrease due to changing interest rates and a $41-million increase in interest on income tax accruals.
Our effective income tax rates for fi scal 2006, 2005 and 2004 were 33.4%, 34.7% and 36.1%, respectively. The fi scal 2006 rate was less than the fi scal 2005 rate due primarily to adjustments in deferred income taxes and resolutions of certain federal and state tax contingencies. The fi scal 2005 rate was less than the fi s-cal 2004 rate due to the October 2004 passage of the Working Families Tax-Relief Act of 2004, which retroactively extended the work opportunity tax credit for fi scal 2005. In addition, the fi s-cal 2004 effective tax rate was impacted by an increase in the deferred tax asset valuation allowance as a result of tax legislation in Germany. This legislation required us to reevaluate the recover-ability of deferred tax assets in Germany, resulting in a $150 mil-lion increase in the fi scal 2004 provision for income taxes. In fi scal 2006, we earned net income of $11.2 billion, a 9.4% increase over fi scal 2005. In fi scal 2005, we earned income from continuing operations of $10.3 billion, a 15.9% increase over fi s-cal 2004. Net income in fi scal 2005 increased 13.4% from fi scal 2004 largely as a result of the increase in income from continuing operations described above, net of the $193 million provided from the discontinued operations and sale of McLane in fi scal 2004.
Wal-Mart Stores Segment
Segment Net Sales Increase Segment Operating Segment Operating Income Operating Income as a Fiscal Year from Prior Fiscal Year Income (in millions) Increase from Prior Fiscal Year Percentage of Segment Sales
2006 9.4% $15,324 8.2% 7.3% 2005 10.1% 14,163 9.7% 7.4% 2004 10.9% 12,916 9.1% 7.4%
The segment net sales increases in fi scal 2006 and fi scal 2005 from the prior fi scal years resulted from comparative store sales increases of 3.0% in fi scal 2006 and 2.9% in fi scal 2005, in addi-tion to our expansion program. Market development strategies in fi scal 2006 continued to put pressures on comparative stores sales increases as new stores were opened within the trade area
of established stores. We have developed several initiatives to help mitigate this pressure and to grow comparable store sales through becoming more relevant to the customer by creating a better store shopping experience, continual improvement in product assort-ment and an aggressive store upgrade program to be instituted over the next 18 months.
Management’s Discussion and Analysis of Results of Operations and Financial ConditionW A L - M A R T
24
Our expansion programs consist of opening new units, converting discount stores to supercenters, relocations that result in more square footage, as well as expansions of existing stores. Segment expansion during fi scal 2006 included the opening of 24 discount stores, 15 Neighborhood Markets and 267 supercenters (including the conversion and/or relocation of 166 existing discount stores into supercenters). Two discount stores closed in fi scal 2006. During fi scal 2006, our total expansion program added approxi-mately 39 million of store square footage, an 8.6% increase. Segment expansion during fi scal 2005 included the opening of 36 discount stores, 21 Neighborhood Markets and 242 supercenters (includ-ing the conversion and/or relocation of 159 existing discount stores into supercenters). Two discount stores closed in fi scal 2005. During fi scal 2005, our total expansion program added approximately 36 million of store square footage, an 8.6% increase.
Fiscal 2006 segment operating income was down 0.1% as a per-centage of segment net sales. This decrease was driven by a 4 basis point decline in gross margin and an 8 basis point increase in oper-ating expenses, partially offset by a slight increase in other income as a percentage of segment net sales. This gross margin decrease from
fi scal 2005 can be attributed to the continued increase in sales of our lower-margin food items as a percentage of total segment net sales, rising transportation costs, and the unfavorable impact of an adjustment to our product warranty liabilities in fi scal 2006. The segment’s operating expenses as a percentage of segment net sales in fi scal 2006 were higher than fi scal 2005 primarily due to expense pressures from utilities and advertising costs. While our fi scal 2005 segment operating income as a percent-age of segment net sales was unchanged from fi scal 2004, seg-ment gross margin and operating expenses as a percentage of segment net sales were each up 0.4% for the year. Our gross mar-gin improvement in fi scal 2005 can be primarily attributed to our global sourcing effort and reductions in markdowns and shrink-age as a percentage of segment net sales for fi scal 2005 when com-pared to fi scal 2004. The segment’s operating expenses in fi scal 2005 as a percentage of segment net sales were higher than fi scal 2004 primarily due to expense pressures from associate wages and accident costs. Wages primarily increased due to our new job classifi cation and pay structure, which was implemented in the second quarter of fi scal 2005.
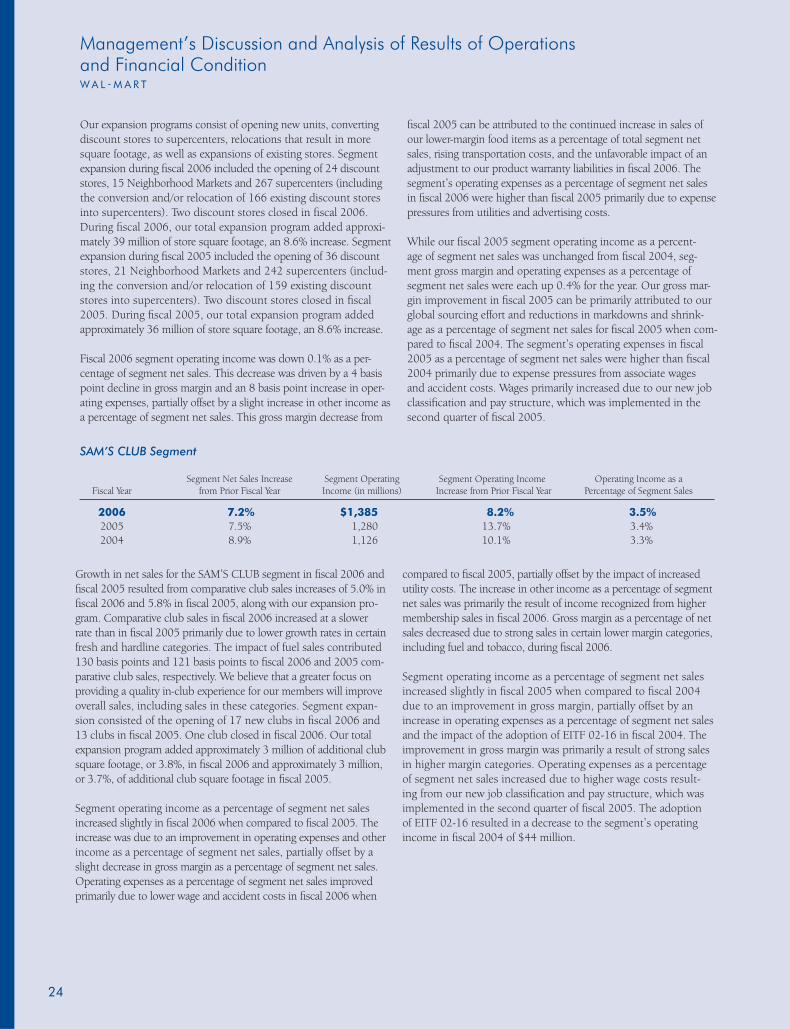
Growth in net sales for the SAM’S CLUB segment in fi scal 2006 and fi scal 2005 resulted from comparative club sales increases of 5.0% in fi scal 2006 and 5.8% in fi scal 2005, along with our expansion pro-gram. Comparative club sales in fi scal 2006 increased at a slower rate than in fi scal 2005 primarily due to lower growth rates in certain fresh and hardline categories. The impact of fuel sales contributed 130 basis points and 121 basis points to fi scal 2006 and 2005 com-parative club sales, respectively. We believe that a greater focus on providing a quality in-club experience for our members will improve overall sales, including sales in these categories. Segment expan-sion consisted of the opening of 17 new clubs in fi scal 2006 and 13 clubs in fi scal 2005. One club closed in fi scal 2006. Our total expansion program added approximately 3 million of additional club square footage, or 3.8%, in fi scal 2006 and approximately 3 million, or 3.7%, of additional club square footage in fi scal 2005. Segment operating income as a percentage of segment net sales increased slightly in fi scal 2006 when compared to fi scal 2005. The increase was due to an improvement in operating expenses and other income as a percentage of segment net sales, partially offset by a slight decrease in gross margin as a percentage of segment net sales. Operating expenses as a percentage of segment net sales improved primarily due to lower wage and accident costs in fi scal 2006 when
compared to fi scal 2005, partially offset by the impact of increased utility costs. The increase in other income as a percentage of segment net sales was primarily the result of income recognized from higher membership sales in fi scal 2006. Gross margin as a percentage of net sales decreased due to strong sales in certain lower margin categories, including fuel and tobacco, during fi scal 2006. Segment operating income as a percentage of segment net sales increased slightly in fi scal 2005 when compared to fi scal 2004 due to an improvement in gross margin, partially offset by an increase in operating expenses as a percentage of segment net sales and the impact of the adoption of EITF 02-16 in fi scal 2004. The improvement in gross margin was primarily a result of strong sales in higher margin categories. Operating expenses as a percentage of segment net sales increased due to higher wage costs result-ing from our new job classifi cation and pay structure, which was implemented in the second quarter of fi scal 2005. The adoption of EITF 02-16 resulted in a decrease to the segment’s operating income in fi scal 2004 of $44 million.
SAM’S CLUB Segment
Segment Net Sales Increase Segment Operating Segment Operating Income Operating Income as a Fiscal Year from Prior Fiscal Year Income (in millions) Increase from Prior Fiscal Year Percentage of Segment Sales
2006 7.2% $1,385 8.2% 3.5% 2005 7.5% 1,280 13.7% 3.4% 2004 8.9% 1,126 10.1% 3.3%
25
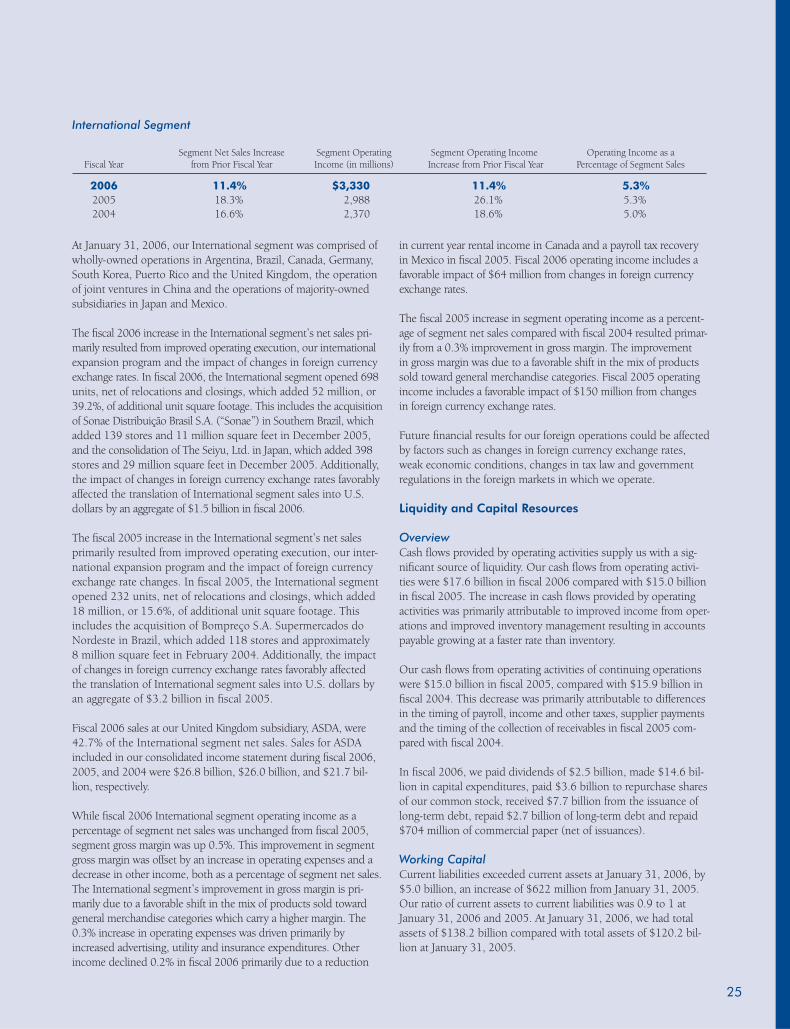
International Segment
Segment Net Sales Increase Segment Operating Segment Operating Income Operating Income as a Fiscal Year from Prior Fiscal Year Income (in millions) Increase from Prior Fiscal Year Percentage of Segment Sales
2006 11.4% $3,330 11.4% 5.3% 2005 18.3% 2,988 26.1% 5.3% 2004 16.6% 2,370 18.6% 5.0%
At January 31, 2006, our International segment was comprised of wholly-owned operations in Argentina, Brazil, Canada, Germany, South Korea, Puerto Rico and the United Kingdom, the operation of joint ventures in China and the operations of majority-owned subsidiaries in Japan and Mexico. The fi scal 2006 increase in the International segment’s net sales pri-marily resulted from improved operating execution, our international expansion program and the impact of changes in foreign currency exchange rates. In fi scal 2006, the International segment opened 698 units, net of relocations and closings, which added 52 million, or 39.2%, of additional unit square footage. This includes the acquisition of Sonae Distribuição Brasil S.A. (“Sonae”) in Southern Brazil, which added 139 stores and 11 million square feet in December 2005, and the consolidation of The Seiyu, Ltd. in Japan, which added 398 stores and 29 million square feet in December 2005. Additionally, the impact of changes in foreign currency exchange rates favorably affected the translation of International segment sales into U.S. dollars by an aggregate of $1.5 billion in fi scal 2006.
The fi scal 2005 increase in the International segment’s net sales primarily resulted from improved operating execution, our inter-national expansion program and the impact of foreign currency exchange rate changes. In fi scal 2005, the International segment opened 232 units, net of relocations and closings, which added 18 million, or 15.6%, of additional unit square footage. This includes the acquisition of Bompreço S.A. Supermercados do Nordeste in Brazil, which added 118 stores and approximately 8 million square feet in February 2004. Additionally, the impact of changes in foreign currency exchange rates favorably affected the translation of International segment sales into U.S. dollars by an aggregate of $3.2 billion in fi scal 2005. Fiscal 2006 sales at our United Kingdom subsidiary, ASDA, were 42.7% of the International segment net sales. Sales for ASDA included in our consolidated income statement during fi scal 2006, 2005, and 2004 were $26.8 billion, $26.0 billion, and $21.7 bil-lion, respectively. While fi scal 2006 International segment operating income as a percentage of segment net sales was unchanged from fi scal 2005, segment gross margin was up 0.5%. This improvement in segment gross margin was offset by an increase in operating expenses and a decrease in other income, both as a percentage of segment net sales. The International segment’s improvement in gross margin is pri-marily due to a favorable shift in the mix of products sold toward general merchandise categories which carry a higher margin. The 0.3% increase in operating expenses was driven primarily by increased advertising, utility and insurance expenditures. Other income declined 0.2% in fi scal 2006 primarily due to a reduction
in current year rental income in Canada and a payroll tax recovery in Mexico in fi scal 2005. Fiscal 2006 operating income includes a favorable impact of $64 million from changes in foreign currency exchange rates.
The fi scal 2005 increase in segment operating income as a percent-age of segment net sales compared with fi scal 2004 resulted primar-ily from a 0.3% improvement in gross margin. The improvement in gross margin was due to a favorable shift in the mix of products sold toward general merchandise categories. Fiscal 2005 operating income includes a favorable impact of $150 million from changes in foreign currency exchange rates. Future fi nancial results for our foreign operations could be affected by factors such as changes in foreign currency exchange rates, weak economic conditions, changes in tax law and government regulations in the foreign markets in which we operate. Liquidity and Capital Resources Overview Cash fl ows provided by operating activities supply us with a sig-nifi cant source of liquidity. Our cash fl ows from operating activi-ties were $17.6 billion in fi scal 2006 compared with $15.0 billion in fi scal 2005. The increase in cash fl ows provided by operating activities was primarily attributable to improved income from oper-ations and improved inventory management resulting in accounts payable growing at a faster rate than inventory. Our cash fl ows from operating activities of continuing operations were $15.0 billion in fi scal 2005, compared with $15.9 billion in fi scal 2004. This decrease was primarily attributable to differences in the timing of payroll, income and other taxes, supplier payments and the timing of the collection of receivables in fi scal 2005 com-pared with fi scal 2004. In fi scal 2006, we paid dividends of $2.5 billion, made $14.6 bil-lion in capital expenditures, paid $3.6 billion to repurchase shares of our common stock, received $7.7 billion from the issuance of long-term debt, repaid $2.7 billion of long-term debt and repaid $704 million of commercial paper (net of issuances). Working CapitalCurrent liabilities exceeded current assets at January 31, 2006, by $5.0 billion, an increase of $622 million from January 31, 2005. Our ratio of current assets to current liabilities was 0.9 to 1 at January 31, 2006 and 2005. At January 31, 2006, we had total assets of $138.2 billion compared with total assets of $120.2 bil-lion at January 31, 2005.
Management’s Discussion and Analysis of Results of Operations and Financial ConditionW A L - M A R T
26
Company Share Repurchase ProgramFrom time to time, we repurchase shares of our common stock under a $10.0 billion share repurchase program authorized by our Board of Directors in September 2004. During the fi rst half of fi scal 2006, we repurchased $3.6 billion of shares under this repurchase program. No shares of our common stock were repurchased under this program in the third or fourth quarters of fi scal 2006. During fi scal 2005, we repurchased $4.5 billion of shares under the cur-rent and past authorizations. At January 31, 2006, approximately $6.1 billion of additional shares may be repurchased under the current authorization.
There is no expiration date for or other restriction limiting the period over which we can make our share repurchases under the program, which will expire only when and if we have repurchased $10.0 billion of our shares under the program. Under the program, repurchased shares are constructively retired and returned to unissued status. We consider several factors in determining when
to make share repurchases, including among other things, our current cash needs, the ratio of our debt to our total capitalization, our cost of borrowings, and the market price of the stock. Common Stock Dividends We paid dividends totaling approximately $2.5 billion or $0.60 per share in fi scal 2006. The dividends paid in fi scal 2006 repre-sent a 15.4% increase over fi scal 2005. The fi scal 2005 dividend of $0.52 per share represented a 44.4% increase over fi scal 2004. We have increased our dividend every year since the fi rst dividend was declared in March 1974. On March 2, 2006, the Company’s Board of Directors approved an increase in annual dividends to $0.67 per share. The annual divi-dend will be paid in four quarterly installments on April 3, 2006, June 5, 2006, September 5, 2006, and January 2, 2007 to holders of record on March 17, May 19, August 18 and December 15, 2006, respectively.
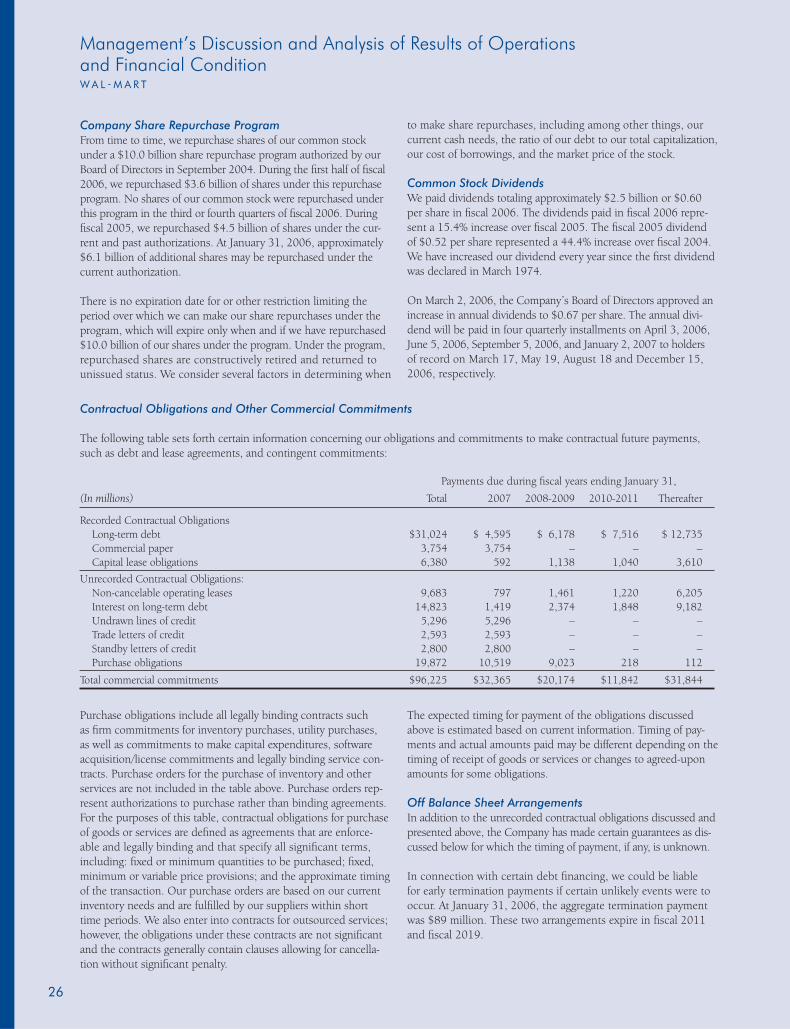
Contractual Obligations and Other Commercial Commitments
The following table sets forth certain information concerning our obligations and commitments to make contractual future payments, such as debt and lease agreements, and contingent commitments:
Payments due during fi scal years ending January 31,
(In millions) Total 2007 2008-2009 2010-2011 Thereafter
Recorded Contractual Obligations Long-term debt $31,024 $ 4,595 $ 6,178 $ 7,516 $ 12,735 Commercial paper 3,754 3,754 – – – Capital lease obligations 6,380 592 1,138 1,040 3,610
Unrecorded Contractual Obligations: Non-cancelable operating leases 9,683 797 1,461 1,220 6,205 Interest on long-term debt 14,823 1,419 2,374 1,848 9,182 Undrawn lines of credit 5,296 5,296 – – – Trade letters of credit 2,593 2,593 – – – Standby letters of credit 2,800 2,800 – – – Purchase obligations 19,872 10,519 9,023 218 112
Total commercial commitments $96,225 $32,365 $20,174 $11,842 $31,844
Purchase obligations include all legally binding contracts such as fi rm commitments for inventory purchases, utility purchases, as well as commitments to make capital expenditures, software acquisition/license commitments and legally binding service con-tracts. Purchase orders for the purchase of inventory and other services are not included in the table above. Purchase orders rep-resent authorizations to purchase rather than binding agreements. For the purposes of this table, contractual obligations for purchase of goods or services are defi ned as agreements that are enforce -able and legally binding and that specify all signifi cant terms, including: fi xed or minimum quantities to be purchased; fi xed, minimum or variable price provisions; and the approximate timing of the transaction. Our purchase orders are based on our current inventory needs and are fulfi lled by our suppliers within short time periods. We also enter into contracts for outsourced services; however, the obligations under these contracts are not signifi cant and the contracts generally contain clauses allowing for cancella-tion without signifi cant penalty.
The expected timing for payment of the obligations discussed above is estimated based on current information. Timing of pay-ments and actual amounts paid may be different depending on the timing of receipt of goods or services or changes to agreed-upon amounts for some obligations. Off Balance Sheet ArrangementsIn addition to the unrecorded contractual obligations discussed and presented above, the Company has made certain guarantees as dis-cussed below for which the timing of payment, if any, is unknown.
In connection with certain debt fi nancing, we could be liable for early termination payments if certain unlikely events were to occur. At January 31, 2006, the aggregate termination payment was $89 million. These two arrangements expire in fi scal 2011 and fi scal 2019.
27
In connection with the development of our grocery distribution network in the United States, we have agreements with third par-ties which would require us to purchase or assume the leases on certain unique equipment in the event the agreements are termi-nated. These agreements, which can be terminated by either party at will, cover up to a fi ve-year period and obligate the Company to pay up to approximately $233 million upon termination of some or all of these agreements. There are no recourse provisions which would enable us to recover from third parties any amounts paid under the above guarantees. No liability for these guarantees has been recorded in our fi nancial statements. The Company has entered into lease commitments for land and buildings for 60 future locations. These lease commitments with real estate developers provide for minimum rentals ranging from fi ve to 35 years, which, if consummated based on current cost estimates, will approximate $95 million annually over the lease terms. Capital Resources During fi scal 2006, we issued $7.7 billion of long-term debt. The net proceeds from the issuance of such long-term debt were used to repay outstanding commercial paper indebtedness and for other general corporate purposes. At January 31, 2006 and 2005, the ratio of our debt to our total capitalization was 42% and 39%, respectively. The fi scal 2006 con-solidation of Seiyu and purchase of Sonae increased our debt to total capitalization at January 31, 2006, by 2.5 percentage points. Our objective is to maintain a debt to total capitalization ratio averaging approximately 40%. Management believes that cash fl ows from operations and pro-ceeds from the sale of commercial paper will be suffi cient to fi nance any seasonal buildups in merchandise inventories and meet other cash requirements. If our operating cash fl ows are not suffi cient to pay dividends and to fund our capital expenditures, we anticipate funding any shortfall in these expenditures with a combination of commercial paper and long-term debt. We plan to refi nance existing long-term debt as it matures and may desire to obtain additional long-term fi nancing for other corporate pur-poses. We anticipate no diffi culty in obtaining long-term fi nancing in view of our credit rating and favorable experiences in the debt market in the recent past. The following table details the ratings of the credit rating agencies that rated our outstanding indebtedness at January 31, 2006.
Rating agency Commercial paper Long-term debt
Standard and Poor’s A-1+ AAMoody’s Investors Service P-1 Aa2Fitch Ratings F1+ AADominion Bond Rating Service R-1(middle) AA
In February 2006, we entered into a £150 million revolving credit facility in the United Kingdom. Interest on borrowings under the credit facility accrues at LIBOR plus 25 basis points. Future Expansion Capital expenditures for fi scal 2007 are expected to be approxi-mately $17.5 billion, including additions of capital leases. These fi scal 2007 expenditures will include the construction of 20 to 30 new discount stores, 270 to 280 new supercenters (with reloca-tions or expansions accounting for approximately 160 of those supercenters), 15 to 20 new Neighborhood Markets, 30 to 40 new SAM’S CLUBs (with relocations or expansions accounting for 20 of those SAM’S CLUBs) and 220 to 230 new units in our International segment (with relocations or expansions accounting for approxi-mately 35 of those units). We plan to fi nance this expansion, and any acquisitions of other operations that we may make during fi scal 2007, primarily out of cash fl ows from operations. Market Risk In addition to the risks inherent in our operations, we are exposed to certain market risks, including changes in interest rates and changes in foreign currency exchange rates. The analysis presented for each of our market risk sensitive instru-ments is based on a 10% change in interest or foreign currency exchange rates. These changes are hypothetical scenarios used to calibrate potential risk and do not represent our view of future mar-ket changes. As the hypothetical fi gures indicate, changes in fair value based on the assumed change in rates generally cannot be extrapolated because the relationship of the change in assumption to the change in fair value may not be linear. The effect of a variation in a particular assumption is calculated without changing any other assumption. In reality, changes in one factor may result in changes in another, which may magnify or counteract the sensitivities. At January 31, 2006 and 2005, we had $31.0 billion and $23.8 billion, respectively, of long-term debt outstanding. Our weighted average effective interest rate on long-term debt, after considering the effect of interest rate swaps, was 4.79% and 4.08% at January 31, 2006 and 2005, respectively. A hypotheti-cal 10% increase in interest rates in effect at January 31, 2006 and 2005, would have increased annual interest expense on bor-rowings outstanding at those dates by $48 million and $25 mil-lion, respectively.
At January 31, 2006 and 2005, we had $3.8 billion of outstand-ing commercial paper obligations. The rate, including fees, on these obligations at January 31, 2006 and 2005, was 3.9% and 2.9%, respectively. A hypothetical 10% increase in commercial paper rates in effect at January 31, 2006 and 2005, would have increased annual interest expense on the outstanding balances on those dates by $14 million and $11 million, respectively.
Management’s Discussion and Analysis of Results of Operations and Financial ConditionW A L - M A R T
28
We enter into interest rate swaps to minimize the risks and costs associated with fi nancing activities, as well as to maintain an appro-priate mix of fi xed- and fl oating-rate debt. Our preference is to maintain approximately 50% of our debt portfolio, including inter-est rate swaps, in fl oating-rate debt. The swap agreements are contracts to exchange fi xed- or variable-rates for variable- or fi xed-interest rate payments periodically over the life of the instruments. The aggregate fair value of these swaps was a gain of approximately $133 million and $472 million at January 31, 2006 and 2005, respectively. A hypothetical increase (or decrease) of 10% in inter-est rates from the level in effect at January 31, 2006, would result in a (loss) or gain in value of the swaps of ($103 million) or $104 million, respectively. A hypothetical increase (or decrease) of 10% in interest rates from the level in effect at January 31, 2005, would result in a (loss) or gain in value of the swaps of ($123 million) or $126 million, respectively. We hold currency swaps to hedge the foreign currency exchange component of our net investments in the United Kingdom and Japan. In addition, we hold a cross-currency swap which hedges the foreign currency risk of debt denominated in currencies other than the local currency. The aggregate fair value of these swaps at January 31, 2006 and 2005, was a loss of $244 million and $169 million, respectively. A hypothetical 10% increase (or decrease) in the foreign currency exchange rates underlying these swaps from the market rate would result in a (loss) or gain in the value of the swaps of ($96 million) and $78 million at January 31, 2006, and ($90 million) and $71 million at January 31, 2005. A hypothetical 10% change in interest rates underlying these swaps from the mar-ket rates in effect at January 31, 2006 and 2005, would have an insignifi cant impact on the value of the swaps. In addition to currency swaps, we have designated debt of approxi-mately £2.0 billion as of January 31, 2006 and 2005, as a hedge of our net investment in the United Kingdom. At January 31, 2006, a hypothetical 10% increase (or decrease) in value of the U.S. dol-lar relative to the British pound would result in a gain (or loss) in the value of the debt of $359 million. At January 31, 2005, a hypo-thetical 10% increase (or decrease) in value of the U.S. dollar rela-tive to the British pound would result in a gain (or loss) in the value of the debt of $380 million. In addition, we have designated debt of approximately ¥87.1 billion as of January 31, 2006 as a hedge of our net investment in Japan. At January 31, 2006, a hypothetical 10% increase (or decrease) in value of the U.S. dollar relative tothe Japanese yen would result in a gain (or loss) in the value of the debt of $75 million. Summary of Critical Accounting Policies Management strives to report the fi nancial results of the Company in a clear and understandable manner, although in some cases accounting and disclosure rules are complex and require us to use technical terminology. In preparing our consolidated fi nancial state-ments, we follow accounting principles generally accepted in the United States. These principles require us to make certain estimates and apply judgments that affect our fi nancial position and results of operations as refl ected in our fi nancial statements. These judgments and estimates are based on past events and expectations of future outcomes. Actual results may differ from our estimates.
Management continually reviews its accounting policies, how they are applied and how they are reported and disclosed in our fi nan-cial statements. Following is a summary of our more signifi cant accounting policies and how they are applied in preparation of the fi nancial statements. Inventories We value our inventories at the lower of cost or market as deter-mined primarily by the retail method of accounting, using the last-in, fi rst-out (“LIFO”) method for substantially all merchandise inventories in the United States, except SAM’S CLUB merchandise and merchandise in our distribution warehouses, which is based on the cost LIFO method. Inventories for international operations are primarily valued by the retail method of accounting and are stated using the fi rst-in, fi rst-out (“FIFO”) method. Under the retail method, inventory is stated at cost, which is determined by applying a cost-to-retail ratio to each merchan-dise grouping’s retail value. The cost-to-retail ratio is based on the fi scal year purchase activity. The retail method requires management to make certain judgments and estimates that may signifi cantly impact the ending inventory valuation at cost as well as the amount of gross margin recognized. Judgments made include the recording of markdowns used to sell through inven-tory and shrinkage. Markdowns designated for clearance activity are recorded at the time of the decision rather than at the point of sale, when management determines the salability of inventory has diminished. Factors considered in the determination of markdowns include current and anticipated demand, customer preferences and age of merchandise, as well as seasonal and fashion trends. Changes in weather patterns and customer preferences related to fashion trends could cause material changes in the amount and timing of markdowns from year to year. When necessary, the Company records a LIFO provision each quar-ter for the estimated annual effect of infl ation, and these estimates are adjusted to actual results determined at year-end. Our LIFO provision is calculated based on inventory levels, markup rates and internally generated retail price indices except for grocery items, for which we use a consumer price index. At January 31, 2006 and 2005, our inventories valued at LIFO approximated those inventories as if they were valued at FIFO.
The Company provides for estimated inventory losses (“shrink-age”) between physical inventory counts on the basis of a per-centage of sales. The provision is adjusted annually to refl ect the historical trend of the actual physical inventory count results. Historically, shrinkage has not been volatile. Impairment of Assets We evaluate long-lived assets other than goodwill for indicators of impairment whenever events or changes in circumstances indicate their carrying values may not be recoverable. Management’s judg-ments regarding the existence of impairment indicators are based on market conditions and our operational performance, such as operat-ing income and cash fl ows. The variability of these factors depends on a number of conditions, including uncertainty about future events, and thus our accounting estimates may change from period
29
to period. These factors could cause management to conclude that impairment indicators exist and require that impairment tests be performed, which could result in management determining that the value of long-lived assets is impaired, resulting in a writedown of the long-lived assets. Goodwill is not amortized, but is evaluated for impairment annu-ally or whenever events or changes in circumstances indicate that the value of certain goodwill may be impaired. This evaluation requires management to make judgments relating to future cash fl ows, growth rates, and economic and market conditions. These evaluations are based on discounted cash fl ows that incorporate the impact of existing Company businesses. Historically, the Company has generated suffi cient returns to recover the cost of goodwill and other intangible assets. Because of the nature of the factors used in these tests, if different conditions occur in future periods, future operating results could be materially impacted. Income Taxes The determination of our provision for income taxes requires sig-nifi cant judgment, the use of estimates, and the interpretation and application of complex tax laws. Signifi cant judgment is required in assessing the timing and amounts of deductible and taxable items. We establish reserves when, despite our belief that our tax return positions are fully supportable, we believe that certain positions may be successfully challenged. When facts and circum-stances change, we adjust these reserves through our provision for income taxes. Self-Insurance We use a combination of insurance, self-insured retention and self-insurance for a number of risks, including, without limita-tion, workers’ compensation, general liability, vehicle liability and the Company’s portion of employee-related health care benefi ts. Liabilities associated with the risks that we retain are estimated in part by considering historical claims experience, including fre-quency, severity, demographic factors, and other actuarial assump-tions. In calculating our liability, we analyze our historical trends, including loss development, and apply appropriate loss develop-ment factors to the incurred costs associated with the claims made against our self-insured program. The estimated accruals for these liabilities could be signifi cantly affected if future occurrences or loss development differ from these assumptions. For example, for workers’ compensation and liability, a 1% increase or decrease to the assumptions for claims costs and loss development factors would increase or decrease our self-insurance accrual by $23 mil-lion and $62 million, respectively. For a summary of our signifi cant accounting policies, please see Note 1 to our consolidated fi nancial statements that appear after this discussion. Forward-Looking Statements This Annual Report contains statements that Wal-Mart believes are “forward-looking statements” within the meaning of the Private Securities Litigation Reform Act of 1995. Those state-ments are intended to enjoy the protection of the safe harbor for
forward-looking statements provided by that Act. These for-ward-looking statements include statements under the caption “Results of Operations” regarding the effect of the opening of new stores on existing stores’ sales and the trend in the percentages that the net sales of certain of our business segments represent of our total net sales, under the caption “SAM’S CLUB Segment” regarding the improvement in net sales in the SAM’S CLUB Segment and under the caption “Liquidity and Capital Resources” in Management’s Discussion and Analysis of Financial Condition and Results of Operations with respect to our capital expenditures, our ability to fund certain cash fl ow shortfalls by the sale of com-mercial paper and long-term debt securities, our ability to sell our long-term securities and our anticipated reasons for repurchasing shares of our common stock. These statements are identifi ed by the use of the words “anticipate,” “believe,” “contemplate,” “expect,” “plan,” and other, similar words or phrases. Similarly, descriptions of our objectives, strategies, plans, goals or targets are also forward-looking statements. These statements discuss, among other things, expected growth, future revenues, future cash fl ows, future capital expenditures, future performance and the anticipation and expec-tations of Wal-Mart and its management as to future occurrences and trends. These forward-looking statements are subject to cer-tain factors, in the United States and internationally, that could affect our fi nancial performance, business strategy, plans, goals and objectives. Those factors include the cost of goods, labor costs, the cost of fuel and electricity, the cost of healthcare benefi ts, insur-ance costs, catastrophic events, competitive pressures, infl ation, accident-related costs, consumer buying patterns and debt levels, weather patterns, transport of goods from foreign suppliers, cur-rency exchange fl uctuations, trade restrictions, changes in tariff and freight rates, changes in tax and other laws and regulations that affect our business, the outcome of legal proceedings to which we are a party, unemployment levels, interest rate fl uctuations, changes in employment legislation and other capital market, eco-nomic and geo-political conditions. Moreover, we typically earn a disproportionate part of our annual operating income in the fourth quarter as a result of the seasonal buying patterns. Those buying patterns are diffi cult to forecast with certainty. The foregoing list of factors that may affect our performance is not exclusive. Other fac-tors and unanticipated events could adversely affect our business operations and fi nancial performance. We discuss certain of these matters more fully, as well as certain risk factors that may affect our business operations, fi nancial condition and results of operations, in other of our fi lings with the SEC, including our Annual Report on Form 10-K. We fi led our Annual Report on Form 10-K for the year ended January 31, 2006, with the SEC on or about March 29, 2006. Actual results may materially differ from anticipated results described or implied in these forward-looking statements as a result of changes in facts, assumptions not being realized or other circum-stances. You are urged to consider all of these risks, uncertainties and other factors carefully in evaluating the forward-looking state-ments. The forward-looking statements included in this Annual Report are made only as of the date of this report, and we under-take no obligation to update these forward-looking statements to refl ect subsequent events or circumstances, except as may be required by applicable law.
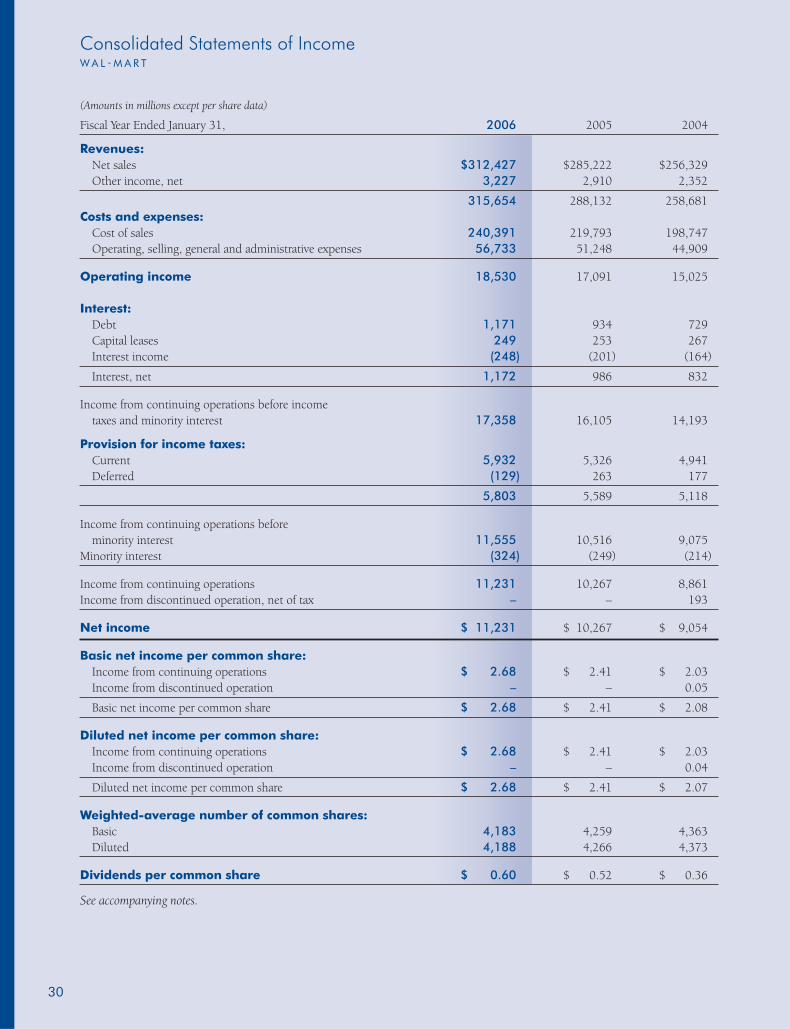
Management’s Discussion and Analysis of Results of Operations and Financial ConditionW A L - M A R T
Consolidated Statements of IncomeW A L - M A R T
(Amounts in millions except per share data)
Fiscal Year Ended January 31, 2006 2005 2004
Revenues: Net sales $312,427 $285,222 $256,329 Other income, net 3,227 2,910 2,352
315,654 288,132 258,681Costs and expenses: Cost of sales 240,391 219,793 198,747 Operating, selling, general and administrative expenses 56,733 51,248 44,909
Operating income 18,530 17,091 15,025
Interest: Debt 1,171 934 729 Capital leases 249 253 267 Interest income (248) (201) (164)
Interest, net 1,172 986 832
Income from continuing operations before income taxes and minority interest 17,358 16,105 14,193
Provision for income taxes: Current 5,932 5,326 4,941 Deferred (129) 263 177
5,803 5,589 5,118
Income from continuing operations before minority interest 11,555 10,516 9,075 Minority interest (324) (249) (214)
Income from continuing operations 11,231 10,267 8,861 Income from discontinued operation, net of tax – – 193
Net income $ 11,231 $ 10,267 $ 9,054
Basic net income per common share: Income from continuing operations $ 2.68 $ 2.41 $ 2.03 Income from discontinued operation – – 0.05
Basic net income per common share $ 2.68 $ 2.41 $ 2.08
Diluted net income per common share: Income from continuing operations $ 2.68 $ 2.41 $ 2.03 Income from discontinued operation – – 0.04
Diluted net income per common share $ 2.68 $ 2.41 $ 2.07
Weighted-average number of common shares: Basic 4,183 4,259 4,363 Diluted 4,188 4,266 4,373
Dividends per common share $ 0.60 $ 0.52 $ 0.36
See accompanying notes.
30
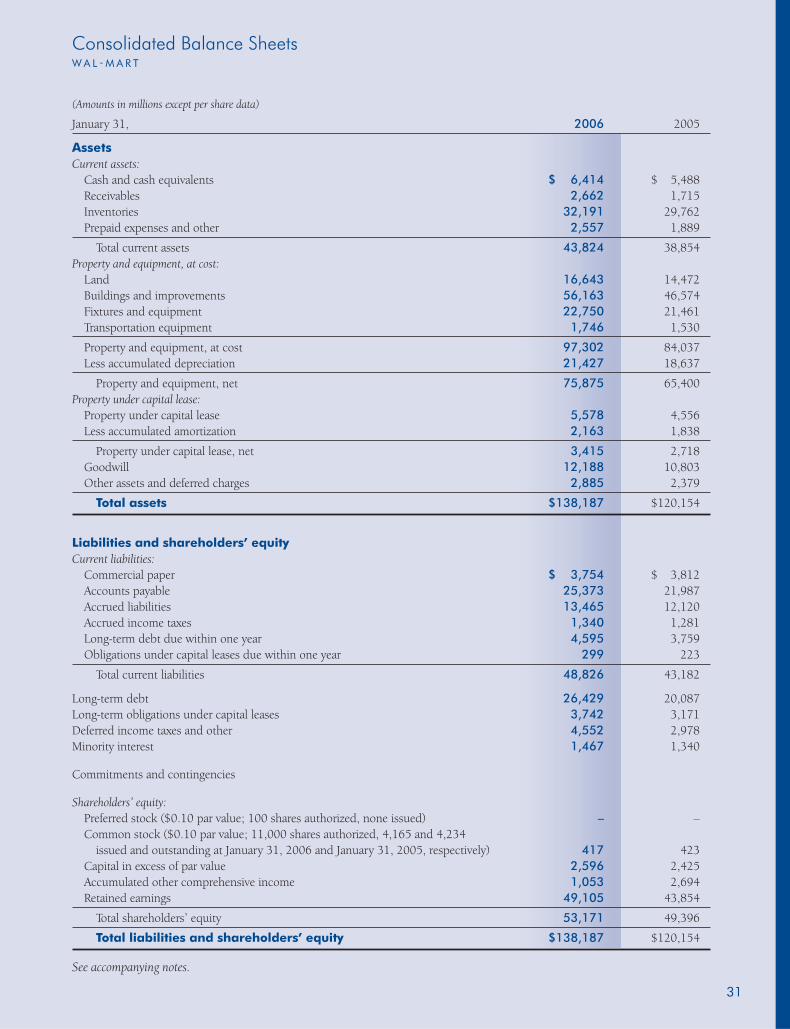
(Amounts in millions except per share data)
January 31, 2006 2005
Assets Current assets: Cash and cash equivalents $ 6,414 $ 5,488 Receivables 2,662 1,715 Inventories 32,191 29,762 Prepaid expenses and other 2,557 1,889
Total current assets 43,824 38,854Property and equipment, at cost: Land 16,643 14,472 Buildings and improvements 56,163 46,574 Fixtures and equipment 22,750 21,461 Transportation equipment 1,746 1,530
Property and equipment, at cost 97,302 84,037 Less accumulated depreciation 21,427 18,637
Property and equipment, net 75,875 65,400Property under capital lease: Property under capital lease 5,578 4,556 Less accumulated amortization 2,163 1,838
Property under capital lease, net 3,415 2,718 Goodwill 12,188 10,803 Other assets and deferred charges 2,885 2,379
Total assets $138,187 $120,154
Liabilities and shareholders’ equityCurrent liabilities: Commercial paper $ 3,754 $ 3,812 Accounts payable 25,373 21,987 Accrued liabilities 13,465 12,120 Accrued income taxes 1,340 1,281 Long-term debt due within one year 4,595 3,759 Obligations under capital leases due within one year 299 223
Total current liabilities 48,826 43,182 Long-term debt 26,429 20,087Long-term obligations under capital leases 3,742 3,171Deferred income taxes and other 4,552 2,978Minority interest 1,467 1,340
Commitments and contingencies
Shareholders’ equity: Preferred stock ($0.10 par value; 100 shares authorized, none issued) – – Common stock ($0.10 par value; 11,000 shares authorized, 4,165 and 4,234 issued and outstanding at January 31, 2006 and January 31, 2005, respectively) 417 423 Capital in excess of par value 2,596 2,425 Accumulated other comprehensive income 1,053 2,694 Retained earnings 49,105 43,854
Total shareholders’ equity 53,171 49,396
Total liabilities and shareholders’ equity $138,187 $120,154
See accompanying notes.
Consolidated Balance SheetsW A L - M A R T
31
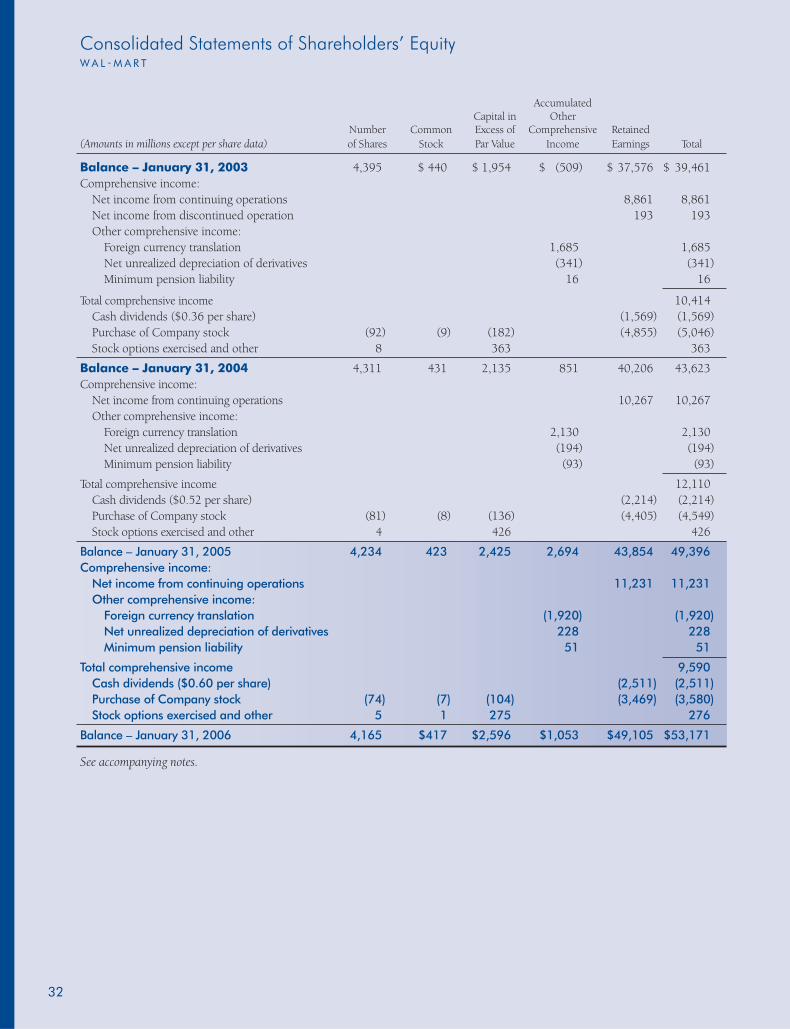
Consolidated Statements of Shareholders’ EquityW A L - M A R T
Accumulated Capital in Other Number Common Excess of Comprehensive Retained(Amounts in millions except per share data) of Shares Stock Par Value Income Earnings Total
Balance – January 31, 2003 4,395 $ 440 $ 1,954 $ (509) $ 37,576 $ 39,461 Comprehensive income: Net income from continuing operations 8,861 8,861 Net income from discontinued operation 193 193 Other comprehensive income: Foreign currency translation 1,685 1,685 Net unrealized depreciation of derivatives (341) (341) Minimum pension liability 16 16
Total comprehensive income 10,414 Cash dividends ($0.36 per share) (1,569) (1,569) Purchase of Company stock (92) (9) (182) (4,855) (5,046) Stock options exercised and other 8 363 363
Balance – January 31, 2004 4,311 431 2,135 851 40,206 43,623 Comprehensive income: Net income from continuing operations 10,267 10,267 Other comprehensive income: Foreign currency translation 2,130 2,130 Net unrealized depreciation of derivatives (194) (194) Minimum pension liability (93) (93)
Total comprehensive income 12,110 Cash dividends ($0.52 per share) (2,214) (2,214) Purchase of Company stock (81) (8) (136) (4,405) (4,549) Stock options exercised and other 4 426 426
Balance – January 31, 2005 4,234 423 2,425 2,694 43,854 49,396 Comprehensive income: Net income from continuing operations 11,231 11,231 Other comprehensive income: Foreign currency translation (1,920) (1,920) Net unrealized depreciation of derivatives 228 228 Minimum pension liability 51 51
Total comprehensive income 9,590 Cash dividends ($0.60 per share) (2,511) (2,511) Purchase of Company stock (74) (7) (104) (3,469) (3,580) Stock options exercised and other 5 1 275 276
Balance – January 31, 2006 4,165 $417 $2,596 $1,053 $49,105 $53,171
See accompanying notes.
32
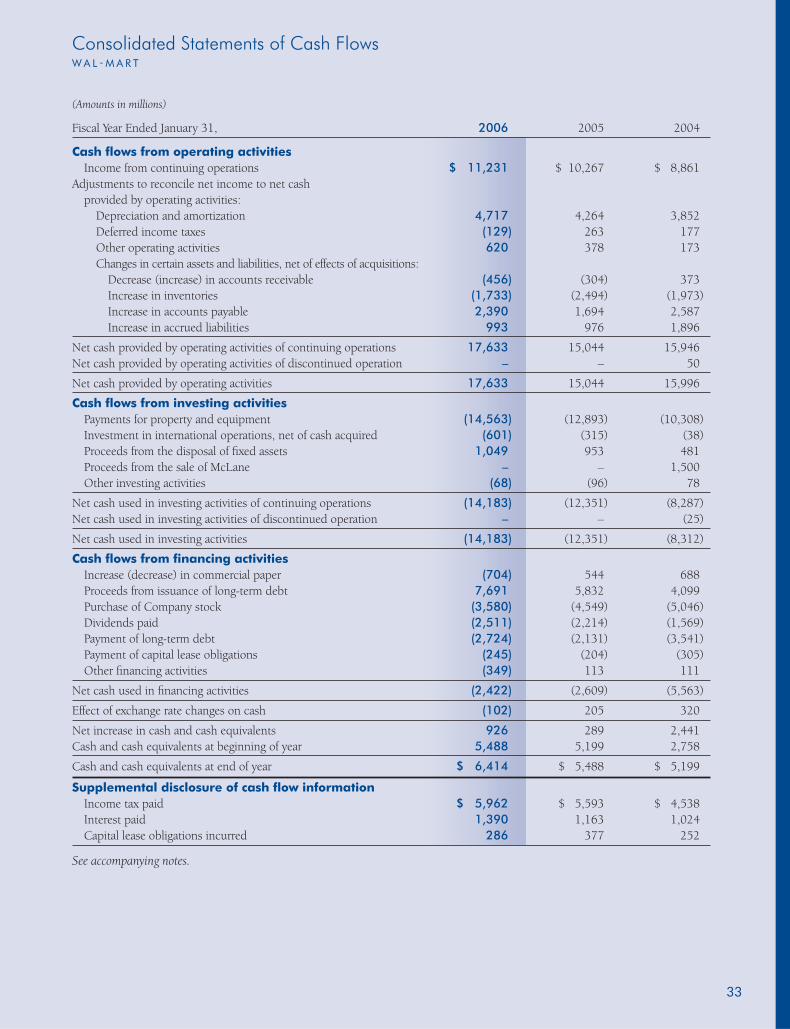
Consolidated Statements of Cash FlowsW A L - M A R T
33
(Amounts in millions)
Fiscal Year Ended January 31, 2006 2005 2004
Cash fl ows from operating activities Income from continuing operations $ 11,231 $ 10,267 $ 8,861 Adjustments to reconcile net income to net cash provided by operating activities: Depreciation and amortization 4,717 4,264 3,852 Deferred income taxes (129) 263 177 Other operating activities 620 378 173 Changes in certain assets and liabilities, net of effects of acquisitions: Decrease (increase) in accounts receivable (456) (304) 373 Increase in inventories (1,733) (2,494) (1,973) Increase in accounts payable 2,390 1,694 2,587 Increase in accrued liabilities 993 976 1,896
Net cash provided by operating activities of continuing operations 17,633 15,044 15,946 Net cash provided by operating activities of discontinued operation – – 50
Net cash provided by operating activities 17,633 15,044 15,996
Cash fl ows from investing activities Payments for property and equipment (14,563) (12,893) (10,308) Investment in international operations, net of cash acquired (601) (315) (38) Proceeds from the disposal of fi xed assets 1,049 953 481 Proceeds from the sale of McLane – – 1,500 Other investing activities (68) (96) 78
Net cash used in investing activities of continuing operations (14,183) (12,351) (8,287)Net cash used in investing activities of discontinued operation – – (25)
Net cash used in investing activities (14,183) (12,351) (8,312)
Cash fl ows from fi nancing activities Increase (decrease) in commercial paper (704) 544 688 Proceeds from issuance of long-term debt 7,691 5,832 4,099 Purchase of Company stock (3,580) (4,549) (5,046) Dividends paid (2,511) (2,214) (1,569) Payment of long-term debt (2,724) (2,131) (3,541) Payment of capital lease obligations (245) (204) (305) Other fi nancing activities (349) 113 111
Net cash used in fi nancing activities (2,422) (2,609) (5,563)
Effect of exchange rate changes on cash (102) 205 320
Net increase in cash and cash equivalents 926 289 2,441 Cash and cash equivalents at beginning of year 5,488 5,199 2,758
Cash and cash equivalents at end of year $ 6,414 $ 5,488 $ 5,199
Supplemental disclosure of cash fl ow information Income tax paid $ 5,962 $ 5,593 $ 4,538 Interest paid 1,390 1,163 1,024 Capital lease obligations incurred 286 377 252
See accompanying notes.
Consolidated Statements of Cash FlowsW A L - M A R T
33
Notes to Consolidated Financial StatementsW A L - M A R T
34
1 SUMMARY OF SIGNIFICANT ACCOUNTING POLICIES
Consolidation The consolidated fi nancial statements include the accounts of Wal-Mart Stores, Inc. and its subsidiaries (“Wal-Mart” or the “Company”). Signifi cant intercompany transactions have been eliminated in consolidation. Investments in which the Company has a 20 percent to 50 percent voting interest and where the Company exercises signifi cant infl uence over the investee are accounted for using the equity method. The Company’s operations in Argentina, Brazil, China, Germany, Japan, Mexico, South Korea and the United Kingdom are con-solidated using a December 31 fi scal year-end, generally due to statutory reporting requirements. There were no signifi cant inter-vening events which materially affected the fi nancial statements. The Company’s operations in Canada and Puerto Rico are consoli-dated using a January 31 fi scal year-end.
The Company consolidates the accounts of certain variable inter-est entities where it has been determined that Wal-Mart is the primary benefi ciary of those entities’ operations. The assets, liabil-ities and results of operations of these entities are not material to the Company. Cash and Cash Equivalents The Company considers investments with a maturity of three months or less when purchased to be cash equivalents. The major-ity of payments due from banks for third-party credit card, debit card and electronic benefi t transactions (“EBT”) process within 24-48 hours, except for transactions occurring on a Friday, which are generally processed the following Monday. All credit card, debit card and EBT transactions that process in less than seven days are classifi ed as cash and cash equivalents. Amounts due from banks for these transactions classifi ed as cash totaled $575 million and $549 million at January 31, 2006 and 2005, respectively. Receivables Accounts receivable consist primarily of receivables from insurance companies resulting from our pharmacy sales, receivables from suppliers for marketing or incentive programs, receivables from real estate transactions and receivables from property insurance claims. Additionally, amounts due from banks for customer credit card, debit card and EBT transactions that take in excess of seven days to process are classifi ed as accounts receivable. Inventories The Company values inventories at the lower of cost or market as determined primarily by the retail method of accounting, using the last-in, fi rst-out (“LIFO”) method for substantially all mer-chandise inventories in the United States, except SAM’S CLUB merchandise and merchandise in our distribution warehouses, which is based on the cost LIFO method. Inventories of foreign operations are primarily valued by the retail method of account-ing, using the fi rst-in, fi rst-out (“FIFO”) method. At January 31, 2006 and 2005, our inventories valued at LIFO approximate those inventories as if they were valued at FIFO.
Financial Instruments The Company uses derivative fi nancial instruments for purposes other than trading to manage its exposure to interest and for-eign exchange rates, as well as to maintain an appropriate mix of fi xed and fl oating-rate debt. Contract terms of a hedge instrument closely mirror those of the hedged item, providing a high degree of risk reduction and correlation. Contracts that are effective at meeting the risk reduction and correlation criteria are recorded using hedge accounting. If a derivative instrument is a hedge, depending on the nature of the hedge, changes in the fair value of the instrument will either be offset against the change in fair value of the hedged assets, liabilities or fi rm commitments through earnings or recognized in other comprehensive income until the hedged item is recognized in earnings. The ineffective portion of an instrument’s change in fair value will be immediately recog-nized in earnings. Instruments that do not meet the criteria for hedge accounting, or contracts for which the Company has not elected hedge accounting, are marked to fair value with unrealized gains or losses reported in earnings during the period of change. Capitalized Interest Interest costs capitalized on construction projects were $157 mil-lion, $120 million, and $144 million in fi scal 2006, 2005 and 2004, respectively. Long-Lived Assets Long-lived assets are stated at cost. Management reviews long-lived assets for indicators of impairment whenever events or changes in circumstances indicate that the carrying value may not be recoverable. The evaluation is performed at the lowest level of identifi able cash fl ows, which is typically at the individual store level. Cash fl ows expected to be generated by the related assets are estimated over the asset’s useful life based on updated projec-tions. If the evaluation indicates that the carrying amount of the asset may not be recoverable, any potential impairment is mea-sured based on a projected discounted cash fl ow method using a discount rate that is considered to be commensurate with the risk inherent in the Company’s current business model. Goodwill and Other Acquired Intangible Assets Goodwill is not amortized; rather it is evaluated for impairment annually or whenever events or changes in circumstances indi-cate that the value of certain goodwill may be impaired. Other acquired intangible assets are amortized on a straight-line basis over the periods that expected economic benefi ts will be provided. These evaluations are based on discounted cash fl ows and incor-porate the impact of existing Company businesses. The analyses require signifi cant management judgment to evaluate the capacity of an acquired business to perform within projections. Historically, the Company has generated suffi cient returns to recover the cost of the goodwill and other intangible assets.
Notes to Consolidated Financial StatementsW A L - M A R T
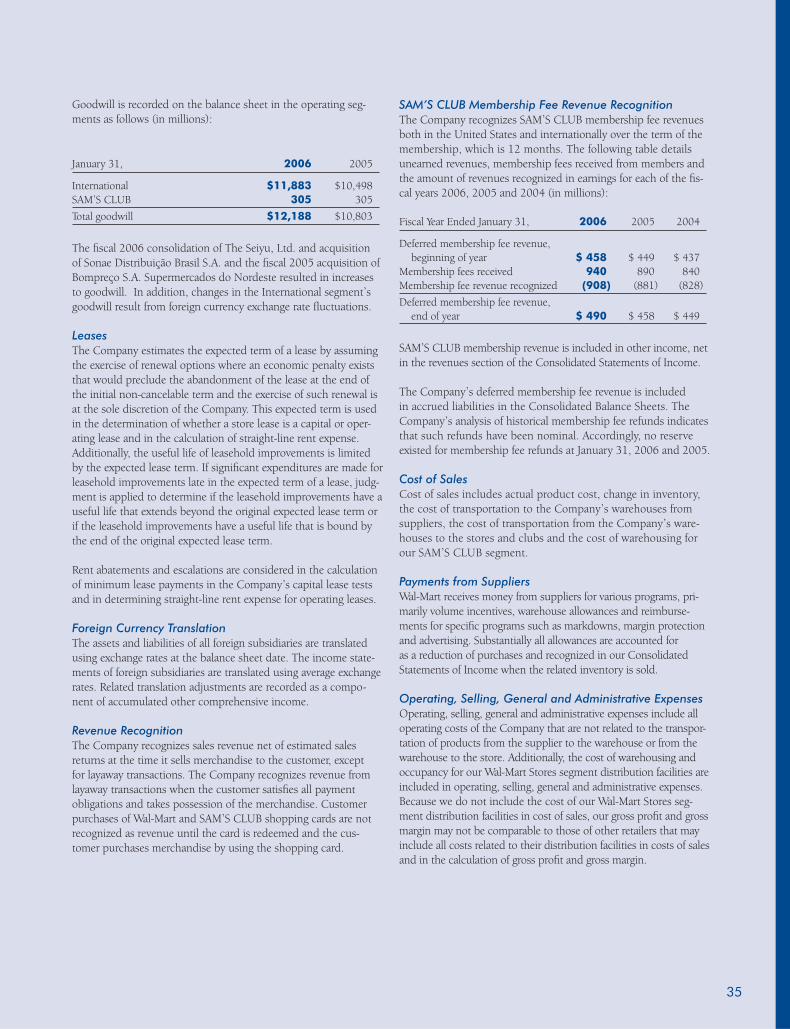
35
Goodwill is recorded on the balance sheet in the operating seg-ments as follows (in millions): January 31, 2006 2005
International $11,883 $10,498SAM’S CLUB 305 305
Total goodwill $12,188 $10,803
The fi scal 2006 consolidation of The Seiyu, Ltd. and acquisition of Sonae Distribuição Brasil S.A. and the fi scal 2005 acquisition of Bompreço S.A. Supermercados do Nordeste resulted in increases to goodwill. In addition, changes in the International segment’s goodwill result from foreign currency exchange rate fl uctuations. Leases The Company estimates the expected term of a lease by assuming the exercise of renewal options where an economic penalty exists that would preclude the abandonment of the lease at the end of the initial non-cancelable term and the exercise of such renewal is at the sole discretion of the Company. This expected term is used in the determination of whether a store lease is a capital or oper-ating lease and in the calculation of straight-line rent expense. Additionally, the useful life of leasehold improvements is limited by the expected lease term. If signifi cant expenditures are made for leasehold improvements late in the expected term of a lease, judg-ment is applied to determine if the leasehold improvements have a useful life that extends beyond the original expected lease term or if the leasehold improvements have a useful life that is bound by the end of the original expected lease term. Rent abatements and escalations are considered in the calculation of minimum lease payments in the Company’s capital lease tests and in determining straight-line rent expense for operating leases. Foreign Currency Translation The assets and liabilities of all foreign subsidiaries are translated using exchange rates at the balance sheet date. The income state-ments of foreign subsidiaries are translated using average exchange rates. Related translation adjustments are recorded as a compo-nent of accumulated other comprehensive income. Revenue Recognition The Company recognizes sales revenue net of estimated sales returns at the time it sells merchandise to the customer, except for layaway transactions. The Company recognizes revenue from layaway transactions when the customer satisfi es all payment obligations and takes possession of the merchandise. Customer purchases of Wal-Mart and SAM’S CLUB shopping cards are not recognized as revenue until the card is redeemed and the cus-tomer purchases merchandise by using the shopping card.
SAM’S CLUB Membership Fee Revenue Recognition The Company recognizes SAM’S CLUB membership fee revenues both in the United States and internationally over the term of the membership, which is 12 months. The following table details unearned revenues, membership fees received from members and the amount of revenues recognized in earnings for each of the fi s-cal years 2006, 2005 and 2004 (in millions): Fiscal Year Ended January 31, 2006 2005 2004
Deferred membership fee revenue, beginning of year $ 458 $ 449 $ 437Membership fees received 940 890 840Membership fee revenue recognized (908) (881) (828)
Deferred membership fee revenue, end of year $ 490 $ 458 $ 449
SAM’S CLUB membership revenue is included in other income, net in the revenues section of the Consolidated Statements of Income. The Company’s deferred membership fee revenue is included in accrued liabilities in the Consolidated Balance Sheets. The Company’s analysis of historical membership fee refunds indicates that such refunds have been nominal. Accordingly, no reserve existed for membership fee refunds at January 31, 2006 and 2005. Cost of Sales Cost of sales includes actual product cost, change in inventory, the cost of transportation to the Company’s warehouses from suppliers, the cost of transportation from the Company’s ware-houses to the stores and clubs and the cost of warehousing for our SAM’S CLUB segment. Payments from Suppliers Wal-Mart receives money from suppliers for various programs, pri-marily volume incentives, warehouse allowances and reimburse-ments for specifi c programs such as markdowns, margin protection and advertising. Substantially all allowances are accounted for as a reduction of purchases and recognized in our Consolidated Statements of Income when the related inventory is sold. Operating, Selling, General and Administrative Expenses Operating, selling, general and administrative expenses include all operating costs of the Company that are not related to the transpor-tation of products from the supplier to the warehouse or from the warehouse to the store. Additionally, the cost of warehousing and occupancy for our Wal-Mart Stores segment distribution facilities are included in operating, selling, general and administrative expenses. Because we do not include the cost of our Wal-Mart Stores seg-ment distribution facilities in cost of sales, our gross profi t and gross margin may not be comparable to those of other retailers that may include all costs related to their distribution facilities in costs of sales and in the calculation of gross profi t and gross margin.

Notes to Consolidated Financial StatementsW A L - M A R T
36
Advertising Costs Advertising costs are expensed as incurred and were $1.6 billion, $1.4 billion and $966 million in fi scal 2006, 2005 and 2004, respectively. Advertising costs consist primarily of print and televi-sion advertisements. Pre-Opening Costs The costs of start-up activities, including organization costs and new store openings, are expensed as incurred. Share-Based Compensation The Company recognizes expense for its share-based compensation based on the fair value of the awards that are granted. The fair value of stock options is estimated at the date of grant using the Black-Scholes-Merton option valuation model which was developed for use in estimating the fair value of exchange traded options that have no vesting restrictions and are fully transferable. Option valuation methods require the input of highly subjective assumptions, includ-ing the expected stock price volatility. Measured compensation cost is recognized ratably over the vesting period of the related share-based compensation award.
Share-based compensation awards that may be settled in cash are accounted for as liabilities and marked to market each period.
Insurance/Self-Insurance The Company uses a combination of insurance, self-insured reten-tion and self-insurance for a number of risks, including, without limitation, workers’ compensation, general liability, vehicle liability and the Company-funded portion of employee-related health care benefi ts. Liabilities associated with these risks are estimated in part by considering historical claims experience, demographic factors, frequency and severity factors and other actuarial assumptions. Depreciation and Amortization Depreciation and amortization for fi nancial statement purposes are provided on the straight-line method over the estimated useful lives of the various assets. Depreciation expense, including amorti-zation of property under capital leases for fi scal years 2006, 2005 and 2004 was $4.7 billion, $4.3 billion and $3.9 billion, respec-tively. For income tax purposes, accelerated methods of deprecia-tion are used with recognition of deferred income taxes for the resulting temporary differences. Leasehold improvements are depre-ciated over the shorter of the estimated useful life of the asset or the remaining lease term. Estimated useful lives for fi nancial statement purposes are as follows: Buildings and improvements 5 – 50 yearsFixtures and equipment 3 – 12 yearsTransportation equipment 3 – 15 years
Income Taxes Income taxes are accounted for under the asset and liability method. Deferred tax assets and liabilities are recognized for the estimated future tax consequences attributable to differences between the fi nancial statement carrying amounts of existing assets and liabilities and their respective tax bases. Deferred tax assets and liabilities are measured using enacted tax rates in effect for the year in which those temporary differences are expected to be recovered or settled. The effect on deferred tax assets and liabilities of a change in tax rate is recognized in income in the period that includes the enactment date. Valuation allowances are established when necessary to reduce deferred tax assets to the amounts more likely than not to be realized. In determining the quarterly provision for income taxes, the Company uses an annual effective tax rate based on expected annual income and statutory tax rates. The effective tax rate also refl ects the Company’s assessment of the ultimate outcome of tax audits. Signifi cant discrete items are separately recognized in the income tax provision in the quarter in which they occur. The determination of the Company’s provision for income taxes requires signifi cant judgment, the use of estimates, and the interpre-tation and application of complex tax laws. Signifi cant judgment is required in assessing the timing and amounts of deductible and tax-able items. Reserves are established when, despite management’s belief that the Company’s tax return positions are fully supportable, management believes that certain positions may be successfully challenged. When facts and circumstances change, these reserves are adjusted through the provision for income taxes. Net Income Per Common Share Basic net income per common share is based on the weighted-average outstanding common shares. Diluted net income per com-mon share is based on the weighted-average outstanding shares adjusted for the dilutive effect of stock options and restricted stock grants. The dilutive effect of stock options and restricted stock was 5 million, 7 million and 10 million shares in fi scal 2006, 2005 and 2004, respectively. The Company had approximately 57 million, 59 million and 50 million option shares outstanding at January 31, 2006, 2005 and 2004, respectively, which were not included in the diluted net income per share calculation because their effect would be antidilutive as the underlying option price exceeded the average market price of the stock for the period. Estimates and Assumptions The preparation of consolidated fi nancial statements in conformity with generally accepted accounting principles requires Management to make estimates and assumptions. These estimates and assump-tions affect the reported amounts of assets and liabilities. They also affect the disclosure of contingent assets and liabilities at the date of the consolidated fi nancial statements and the reported amounts of revenues and expenses during the reporting period. Actual results may differ from those estimates. Reclassifi cations Certain reclassifi cations have been made to prior periods to conform to current presentations.
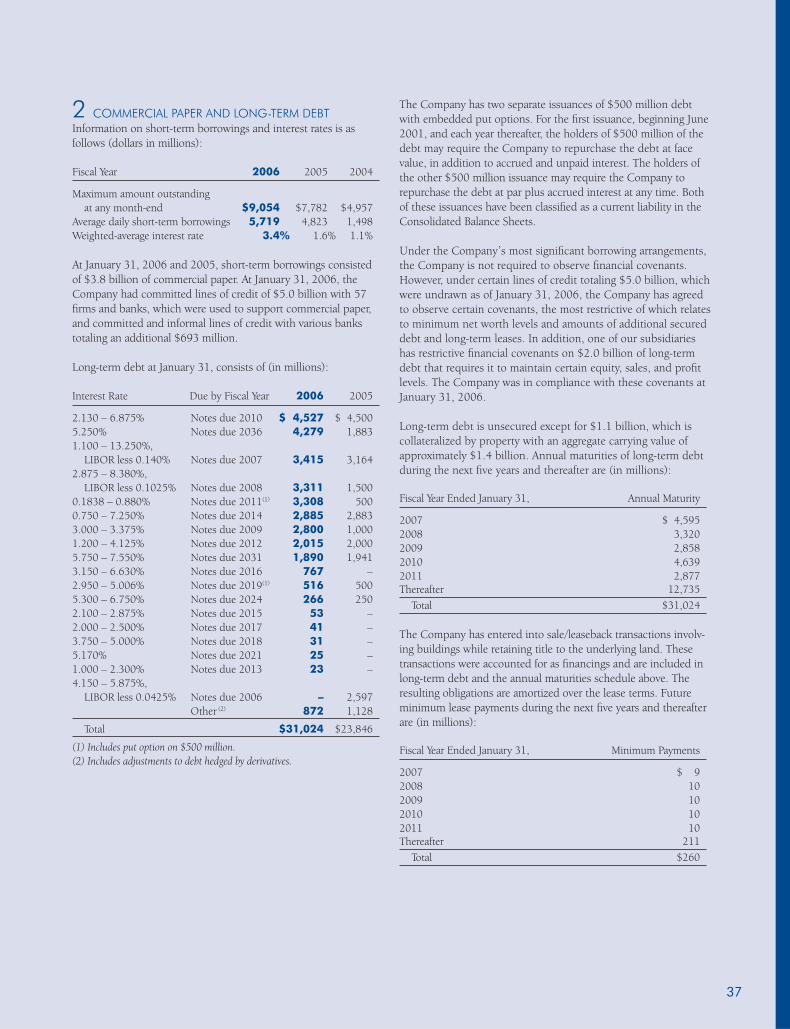
37
2 COMMERCIAL PAPER AND LONG-TERM DEBT Information on short-term borrowings and interest rates is as follows (dollars in millions): Fiscal Year 2006 2005 2004
Maximum amount outstanding at any month-end $9,054 $7,782 $4,957 Average daily short-term borrowings 5,719 4,823 1,498 Weighted-average interest rate 3.4% 1.6% 1.1% At January 31, 2006 and 2005, short-term borrowings consisted of $3.8 billion of commercial paper. At January 31, 2006, the Company had committed lines of credit of $5.0 billion with 57 fi rms and banks, which were used to support commercial paper, and committed and informal lines of credit with various banks totaling an additional $693 million. Long-term debt at January 31, consists of (in millions):
Interest Rate Due by Fiscal Year 2006 2005
2.130 – 6.875% Notes due 2010 $ 4,527 $ 4,500 5.250% Notes due 2036 4,279 1,883 1.100 – 13.250%, LIBOR less 0.140% Notes due 2007 3,415 3,1642.875 – 8.380%, LIBOR less 0.1025% Notes due 2008 3,311 1,5000.1838 – 0.880% Notes due 2011(1) 3,308 5000.750 – 7.250% Notes due 2014 2,885 2,8833.000 – 3.375% Notes due 2009 2,800 1,0001.200 – 4.125% Notes due 2012 2,015 2,0005.750 – 7.550% Notes due 2031 1,890 1,9413.150 – 6.630% Notes due 2016 767 – 2.950 – 5.006% Notes due 2019(1) 516 5005.300 – 6.750% Notes due 2024 266 2502.100 – 2.875% Notes due 2015 53 – 2.000 – 2.500% Notes due 2017 41 – 3.750 – 5.000% Notes due 2018 31 – 5.170% Notes due 2021 25 – 1.000 – 2.300% Notes due 2013 23 – 4.150 – 5.875%, LIBOR less 0.0425% Notes due 2006 – 2,597 Other (2) 872 1,128
Total $31,024 $23,846
(1) Includes put option on $500 million.(2) Includes adjustments to debt hedged by derivatives.
The Company has two separate issuances of $500 million debt with embedded put options. For the fi rst issuance, beginning June 2001, and each year thereafter, the holders of $500 million of the debt may require the Company to repurchase the debt at face value, in addition to accrued and unpaid interest. The holders of the other $500 million issuance may require the Company to repurchase the debt at par plus accrued interest at any time. Both of these issuances have been classifi ed as a current liability in the Consolidated Balance Sheets. Under the Company’s most signifi cant borrowing arrangements, the Company is not required to observe fi nancial covenants. However, under certain lines of credit totaling $5.0 billion, which were undrawn as of January 31, 2006, the Company has agreed to observe certain covenants, the most restrictive of which relates to minimum net worth levels and amounts of additional secured debt and long-term leases. In addition, one of our subsidiaries has restrictive fi nancial covenants on $2.0 billion of long-term debt that requires it to maintain certain equity, sales, and profi t levels. The Company was in compliance with these covenants at January 31, 2006. Long-term debt is unsecured except for $1.1 billion, which is collateralized by property with an aggregate carrying value of approximately $1.4 billion. Annual maturities of long-term debt during the next fi ve years and thereafter are (in millions): Fiscal Year Ended January 31, Annual Maturity
2007 $ 4,5952008 3,3202009 2,8582010 4,6392011 2,877Thereafter 12,735 Total $31,024
The Company has entered into sale/leaseback transactions involv-ing buildings while retaining title to the underlying land. These transactions were accounted for as fi nancings and are included in long-term debt and the annual maturities schedule above. The resulting obligations are amortized over the lease terms. Future minimum lease payments during the next fi ve years and thereafter are (in millions): Fiscal Year Ended January 31, Minimum Payments
2007 $ 92008 102009 102010 102011 10Thereafter 211 Total $260
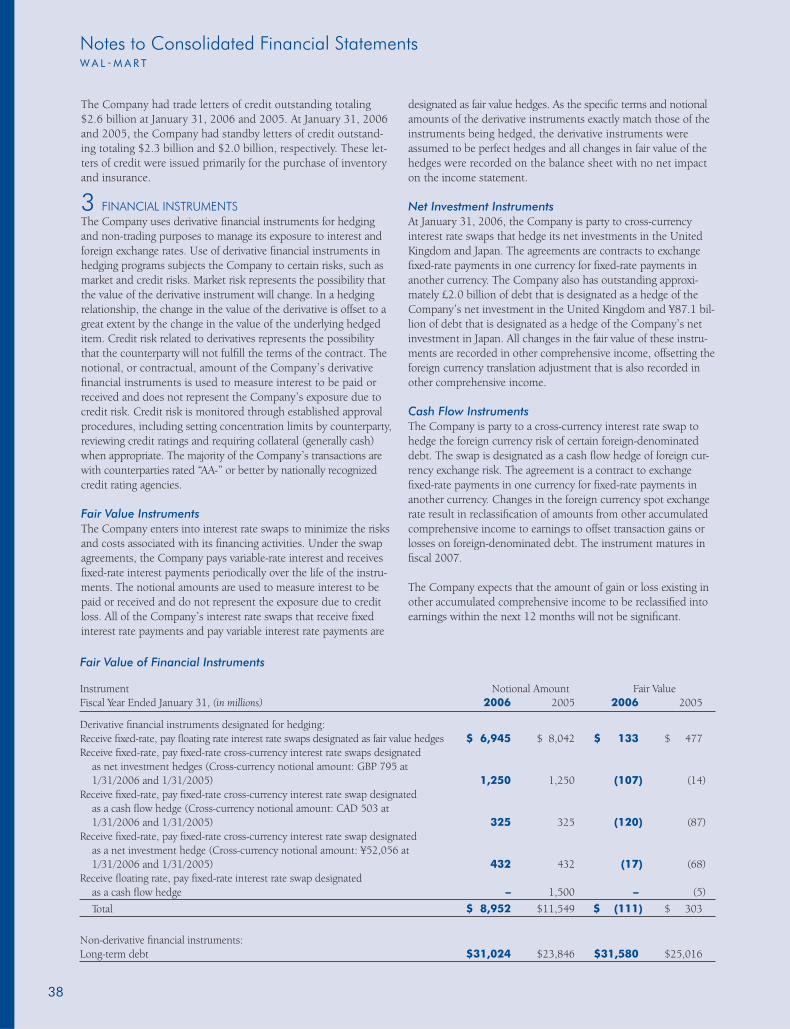
Notes to Consolidated Financial StatementsW A L - M A R T
38
The Company had trade letters of credit outstanding totaling $2.6 billion at January 31, 2006 and 2005. At January 31, 2006 and 2005, the Company had standby letters of credit outstand-ing totaling $2.3 billion and $2.0 billion, respectively. These let-ters of credit were issued primarily for the purchase of inventory and insurance. 3 FINANCIAL INSTRUMENTS The Company uses derivative fi nancial instruments for hedging and non-trading purposes to manage its exposure to interest and foreign exchange rates. Use of derivative fi nancial instruments in hedging programs subjects the Company to certain risks, such as market and credit risks. Market risk represents the possibility that the value of the derivative instrument will change. In a hedging relationship, the change in the value of the derivative is offset to a great extent by the change in the value of the underlying hedged item. Credit risk related to derivatives represents the possibility that the counterparty will not fulfi ll the terms of the contract. The notional, or contractual, amount of the Company’s derivative fi nancial instruments is used to measure interest to be paid or received and does not represent the Company’s exposure due to credit risk. Credit risk is monitored through established approval procedures, including setting concentration limits by counterparty, reviewing credit ratings and requiring collateral (generally cash) when appropriate. The majority of the Company’s transactions are with counterparties rated “AA-” or better by nationally recognized credit rating agencies. Fair Value Instruments The Company enters into interest rate swaps to minimize the risks and costs associated with its fi nancing activities. Under the swap agreements, the Company pays variable-rate interest and receives fi xed-rate interest payments periodically over the life of the instru-ments. The notional amounts are used to measure interest to be paid or received and do not represent the exposure due to credit loss. All of the Company’s interest rate swaps that receive fi xed interest rate payments and pay variable interest rate payments are
designated as fair value hedges. As the specifi c terms and notional amounts of the derivative instruments exactly match those of the instruments being hedged, the derivative instruments were assumed to be perfect hedges and all changes in fair value of the hedges were recorded on the balance sheet with no net impact on the income statement. Net Investment Instruments At January 31, 2006, the Company is party to cross-currency interest rate swaps that hedge its net investments in the United Kingdom and Japan. The agreements are contracts to exchange fi xed-rate payments in one currency for fi xed-rate payments in another currency. The Company also has outstanding approxi-mately £2.0 billion of debt that is designated as a hedge of the Company’s net investment in the United Kingdom and ¥87.1 bil-lion of debt that is designated as a hedge of the Company’s net investment in Japan. All changes in the fair value of these instru-ments are recorded in other comprehensive income, offsetting the foreign currency translation adjustment that is also recorded in other comprehensive income. Cash Flow Instruments The Company is party to a cross-currency interest rate swap to hedge the foreign currency risk of certain foreign-denominated debt. The swap is designated as a cash fl ow hedge of foreign cur-rency exchange risk. The agreement is a contract to exchange fi xed-rate payments in one currency for fi xed-rate payments in another currency. Changes in the foreign currency spot exchange rate result in reclassifi cation of amounts from other accumulated comprehensive income to earnings to offset transaction gains or losses on foreign-denominated debt. The instrument matures in fi scal 2007. The Company expects that the amount of gain or loss existing in other accumulated comprehensive income to be reclassifi ed into earnings within the next 12 months will not be signifi cant.
Fair Value of Financial Instruments
Instrument Notional Amount Fair ValueFiscal Year Ended January 31, (in millions) 2006 2005 2006 2005
Derivative fi nancial instruments designated for hedging:Receive fi xed-rate, pay fl oating rate interest rate swaps designated as fair value hedges $ 6,945 $ 8,042 $ 133 $ 477Receive fi xed-rate, pay fi xed-rate cross-currency interest rate swaps designated as net investment hedges (Cross-currency notional amount: GBP 795 at 1/31/2006 and 1/31/2005) 1,250 1,250 (107) (14)Receive fi xed-rate, pay fi xed-rate cross-currency interest rate swap designated as a cash fl ow hedge (Cross-currency notional amount: CAD 503 at 1/31/2006 and 1/31/2005) 325 325 (120) (87)Receive fi xed-rate, pay fi xed-rate cross-currency interest rate swap designated as a net investment hedge (Cross-currency notional amount: ¥52,056 at 1/31/2006 and 1/31/2005) 432 432 (17) (68)Receive fl oating rate, pay fi xed-rate interest rate swap designated as a cash fl ow hedge – 1,500 – (5)
Total $ 8,952 $11,549 $ (111) $ 303
Non-derivative fi nancial instruments:Long-term debt $31,024 $23,846 $31,580 $25,016
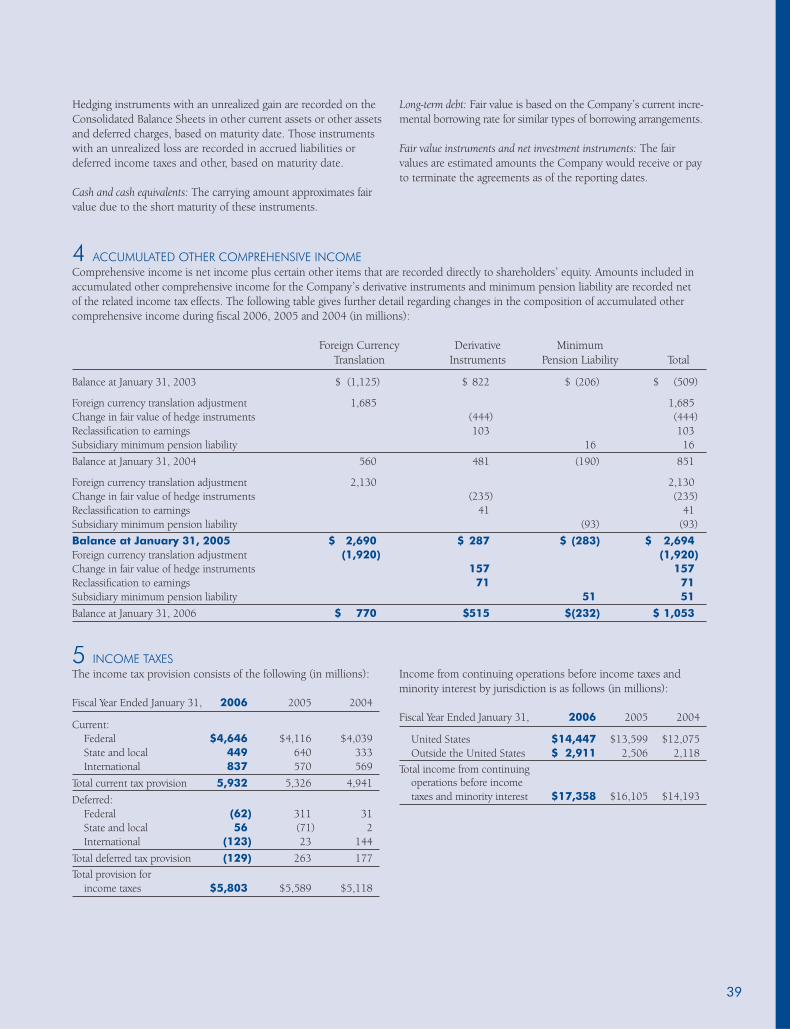
39
Hedging instruments with an unrealized gain are recorded on the Consolidated Balance Sheets in other current assets or other assets and deferred charges, based on maturity date. Those instruments with an unrealized loss are recorded in accrued liabilities or deferred income taxes and other, based on maturity date.
Cash and cash equivalents: The carrying amount approximates fair value due to the short maturity of these instruments.
Long-term debt: Fair value is based on the Company’s current incre-mental borrowing rate for similar types of borrowing arrangements.
Fair value instruments and net investment instruments: The fair values are estimated amounts the Company would receive or pay to terminate the agreements as of the reporting dates.
4 ACCUMULATED OTHER COMPREHENSIVE INCOMEComprehensive income is net income plus certain other items that are recorded directly to shareholders’ equity. Amounts included in accumulated other comprehensive income for the Company’s derivative instruments and minimum pension liability are recorded net of the related income tax effects. The following table gives further detail regarding changes in the composition of accumulated other comprehensive income during fi scal 2006, 2005 and 2004 (in millions):
Foreign Currency Derivative Minimum Translation Instruments Pension Liability Total
Balance at January 31, 2003 $ (1,125) $ 822 $ (206) $ (509) Foreign currency translation adjustment 1,685 1,685 Change in fair value of hedge instruments (444) (444)Reclassifi cation to earnings 103 103 Subsidiary minimum pension liability 16 16
Balance at January 31, 2004 560 481 (190) 851
Foreign currency translation adjustment 2,130 2,130 Change in fair value of hedge instruments (235) (235)Reclassifi cation to earnings 41 41 Subsidiary minimum pension liability (93) (93)
Balance at January 31, 2005 $ 2,690 $ 287 $ (283) $ 2,694 Foreign currency translation adjustment (1,920) (1,920) Change in fair value of hedge instruments 157 157Reclassifi cation to earnings 71 71 Subsidiary minimum pension liability 51 51
Balance at January 31, 2006 $ 770 $515 $(232) $ 1,053
5 INCOME TAXESThe income tax provision consists of the following (in millions):
Fiscal Year Ended January 31, 2006 2005 2004
Current: Federal $4,646 $4,116 $4,039 State and local 449 640 333 International 837 570 569
Total current tax provision 5,932 5,326 4,941
Deferred: Federal (62) 311 31 State and local 56 (71) 2 International (123) 23 144
Total deferred tax provision (129) 263 177Total provision for income taxes $5,803 $5,589 $5,118
Income from continuing operations before income taxes and minority interest by jurisdiction is as follows (in millions):
Fiscal Year Ended January 31, 2006 2005 2004
United States $14,447 $13,599 $12,075 Outside the United States $ 2,911 2,506 2,118Total income from continuing operations before income taxes and minority interest $17,358 $16,105 $14,193
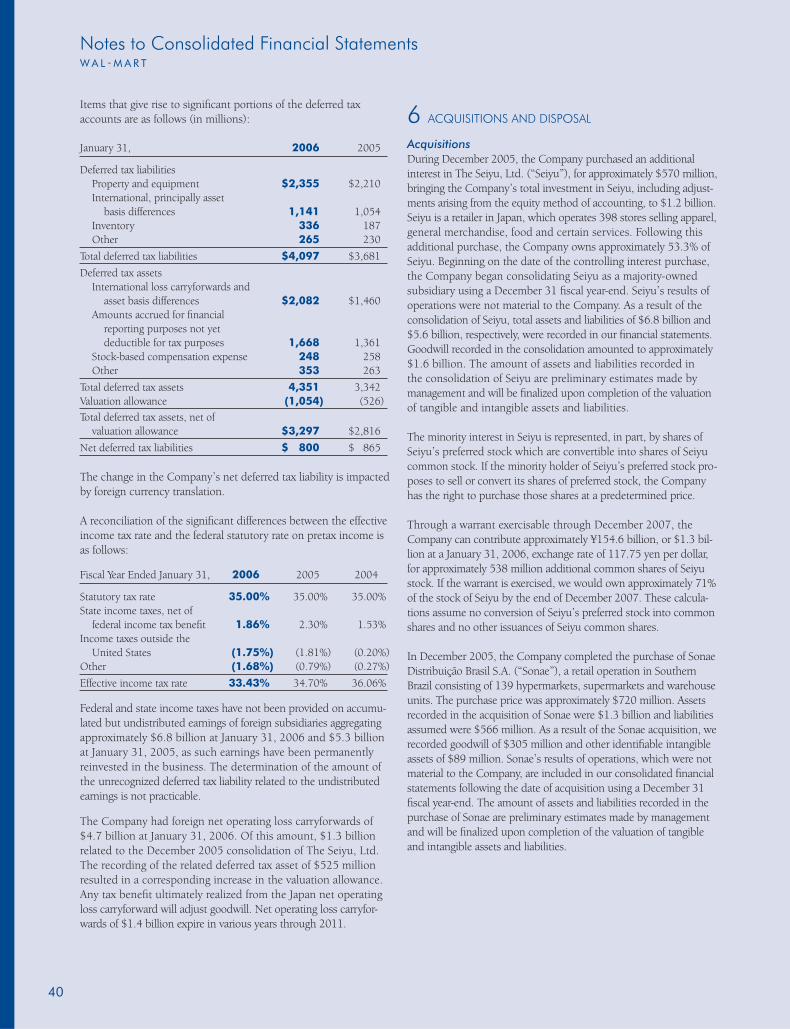
Notes to Consolidated Financial StatementsW A L - M A R T
40
Items that give rise to signifi cant portions of the deferred tax accounts are as follows (in millions):
January 31, 2006 2005
Deferred tax liabilities Property and equipment $2,355 $2,210 International, principally asset basis differences 1,141 1,054 Inventory 336 187 Other 265 230
Total deferred tax liabilities $4,097 $3,681
Deferred tax assets International loss carryforwards and asset basis differences $2,082 $1,460 Amounts accrued for fi nancial reporting purposes not yet deductible for tax purposes 1,668 1,361 Stock-based compensation expense 248 258 Other 353 263
Total deferred tax assets 4,351 3,342Valuation allowance (1,054) (526)Total deferred tax assets, net of valuation allowance $3,297 $2,816
Net deferred tax liabilities $ 800 $ 865
The change in the Company’s net deferred tax liability is impacted by foreign currency translation.
A reconciliation of the signifi cant differences between the effective income tax rate and the federal statutory rate on pretax income is as follows:
Fiscal Year Ended January 31, 2006 2005 2004
Statutory tax rate 35.00% 35.00% 35.00% State income taxes, net of federal income tax benefi t 1.86% 2.30% 1.53% Income taxes outside the United States (1.75%) (1.81%) (0.20%)Other (1.68%) (0.79%) (0.27%)
Effective income tax rate 33.43% 34.70% 36.06%
Federal and state income taxes have not been provided on accumu-lated but undistributed earnings of foreign subsidiaries aggregating approximately $6.8 billion at January 31, 2006 and $5.3 billion at January 31, 2005, as such earnings have been permanently reinvested in the business. The determination of the amount of the unrecognized deferred tax liability related to the undistributed earnings is not practicable.
The Company had foreign net operating loss carryforwards of $4.7 billion at January 31, 2006. Of this amount, $1.3 billion related to the December 2005 consolidation of The Seiyu, Ltd. The recording of the related deferred tax asset of $525 million resulted in a corresponding increase in the valuation allowance. Any tax benefi t ultimately realized from the Japan net operating loss carryforward will adjust goodwill. Net operating loss carryfor-wards of $1.4 billion expire in various years through 2011.
6 ACQUISITIONS AND DISPOSAL
AcquisitionsDuring December 2005, the Company purchased an additional interest in The Seiyu, Ltd. (“Seiyu”), for approximately $570 million, bringing the Company’s total investment in Seiyu, including adjust-ments arising from the equity method of accounting, to $1.2 billion. Seiyu is a retailer in Japan, which operates 398 stores selling apparel, general merchandise, food and certain services. Following this additional purchase, the Company owns approximately 53.3% of Seiyu. Beginning on the date of the controlling interest purchase, the Company began consolidating Seiyu as a majority-owned subsidiary using a December 31 fi scal year-end. Seiyu’s results of operations were not material to the Company. As a result of the consolidation of Seiyu, total assets and liabilities of $6.8 billion and $5.6 billion, respectively, were recorded in our fi nancial statements. Goodwill recorded in the consolidation amounted to approximately $1.6 billion. The amount of assets and liabilities recorded in the consolidation of Seiyu are preliminary estimates made by management and will be fi nalized upon completion of the valuation of tangible and intangible assets and liabilities.
The minority interest in Seiyu is represented, in part, by shares of Seiyu’s preferred stock which are convertible into shares of Seiyu common stock. If the minority holder of Seiyu’s preferred stock pro-poses to sell or convert its shares of preferred stock, the Company has the right to purchase those shares at a predetermined price.
Through a warrant exercisable through December 2007, the Company can contribute approximately ¥154.6 billion, or $1.3 bil-lion at a January 31, 2006, exchange rate of 117.75 yen per dollar, for approximately 538 million additional common shares of Seiyu stock. If the warrant is exercised, we would own approximately 71% of the stock of Seiyu by the end of December 2007. These calcula-tions assume no conversion of Seiyu’s preferred stock into common shares and no other issuances of Seiyu common shares.
In December 2005, the Company completed the purchase of Sonae Distribuição Brasil S.A. (“Sonae”), a retail operation in Southern Brazil consisting of 139 hypermarkets, supermarkets and warehouse units. The purchase price was approximately $720 million. Assets recorded in the acquisition of Sonae were $1.3 billion and liabilities assumed were $566 million. As a result of the Sonae acquisition, we recorded goodwill of $305 million and other identifi able intangible assets of $89 million. Sonae’s results of operations, which were not material to the Company, are included in our consolidated fi nancial statements following the date of acquisition using a December 31 fi scal year-end. The amount of assets and liabilities recorded in the purchase of Sonae are preliminary estimates made by management and will be fi nalized upon completion of the valuation of tangible and intangible assets and liabilities.
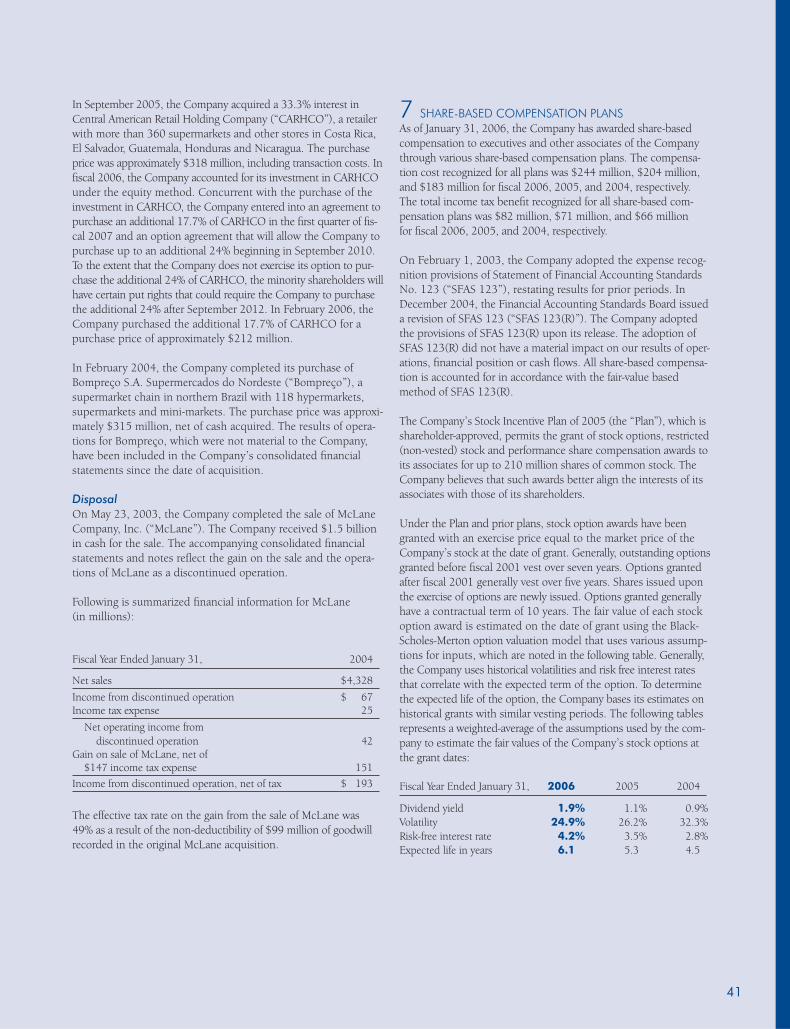
41
In September 2005, the Company acquired a 33.3% interest in Central American Retail Holding Company (“CARHCO”), a retailer with more than 360 supermarkets and other stores in Costa Rica, El Salvador, Guatemala, Honduras and Nicaragua. The purchase price was approximately $318 million, including transaction costs. In fi scal 2006, the Company accounted for its investment in CARHCO under the equity method. Concurrent with the purchase of the investment in CARHCO, the Company entered into an agreement to purchase an additional 17.7% of CARHCO in the fi rst quarter of fi s-cal 2007 and an option agreement that will allow the Company to purchase up to an additional 24% beginning in September 2010. To the extent that the Company does not exercise its option to pur-chase the additional 24% of CARHCO, the minority shareholders will have certain put rights that could require the Company to purchase the additional 24% after September 2012. In February 2006, the Company purchased the additional 17.7% of CARHCO for a purchase price of approximately $212 million.
In February 2004, the Company completed its purchase of Bompreço S.A. Supermercados do Nordeste (“Bompreço”), a supermarket chain in northern Brazil with 118 hypermarkets, supermarkets and mini-markets. The purchase price was approxi-mately $315 million, net of cash acquired. The results of opera-tions for Bompreço, which were not material to the Company, have been included in the Company’s consolidated fi nancial statements since the date of acquisition. Disposal On May 23, 2003, the Company completed the sale of McLane Company, Inc. (“McLane”). The Company received $1.5 billion in cash for the sale. The accompanying consolidated fi nancial statements and notes refl ect the gain on the sale and the opera-tions of McLane as a discontinued operation. Following is summarized fi nancial information for McLane (in millions):
Fiscal Year Ended January 31, 2004
Net sales $4,328
Income from discontinued operation $ 67Income tax expense 25
Net operating income from discontinued operation 42Gain on sale of McLane, net of $147 income tax expense 151Income from discontinued operation, net of tax $ 193
The effective tax rate on the gain from the sale of McLane was 49% as a result of the non-deductibility of $99 million of goodwill recorded in the original McLane acquisition.
7 SHARE-BASED COMPENSATION PLANSAs of January 31, 2006, the Company has awarded share-based compensation to executives and other associates of the Company through various share-based compensation plans. The compensa-tion cost recognized for all plans was $244 million, $204 million, and $183 million for fi scal 2006, 2005, and 2004, respectively. The total income tax benefi t recognized for all share-based com-pensation plans was $82 million, $71 million, and $66 million for fi scal 2006, 2005, and 2004, respectively.
On February 1, 2003, the Company adopted the expense recog-nition provisions of Statement of Financial Accounting Standards No. 123 (“SFAS 123”), restating results for prior periods. In December 2004, the Financial Accounting Standards Board issued a revision of SFAS 123 (“SFAS 123(R)”). The Company adopted the provisions of SFAS 123(R) upon its release. The adoption of SFAS 123(R) did not have a material impact on our results of oper-ations, fi nancial position or cash fl ows. All share-based compensa-tion is accounted for in accordance with the fair-value based method of SFAS 123(R).
The Company’s Stock Incentive Plan of 2005 (the “Plan”), which is shareholder-approved, permits the grant of stock options, restricted (non-vested) stock and performance share compensation awards to its associates for up to 210 million shares of common stock. The Company believes that such awards better align the interests of its associates with those of its shareholders.
Under the Plan and prior plans, stock option awards have been granted with an exercise price equal to the market price of the Company’s stock at the date of grant. Generally, outstanding options granted before fi scal 2001 vest over seven years. Options granted after fi scal 2001 generally vest over fi ve years. Shares issued upon the exercise of options are newly issued. Options granted generally have a contractual term of 10 years. The fair value of each stock option award is estimated on the date of grant using the Black-Scholes-Merton option valuation model that uses various assump-tions for inputs, which are noted in the following table. Generally, the Company uses historical volatilities and risk free interest rates that correlate with the expected term of the option. To determine the expected life of the option, the Company bases its estimates on historical grants with similar vesting periods. The following tables represents a weighted-average of the assumptions used by the com-pany to estimate the fair values of the Company’s stock options at the grant dates: Fiscal Year Ended January 31, 2006 2005 2004
Dividend yield 1.9% 1.1% 0.9%Volatility 24.9% 26.2% 32.3%Risk-free interest rate 4.2% 3.5% 2.8%Expected life in years 6.1 5.3 4.5
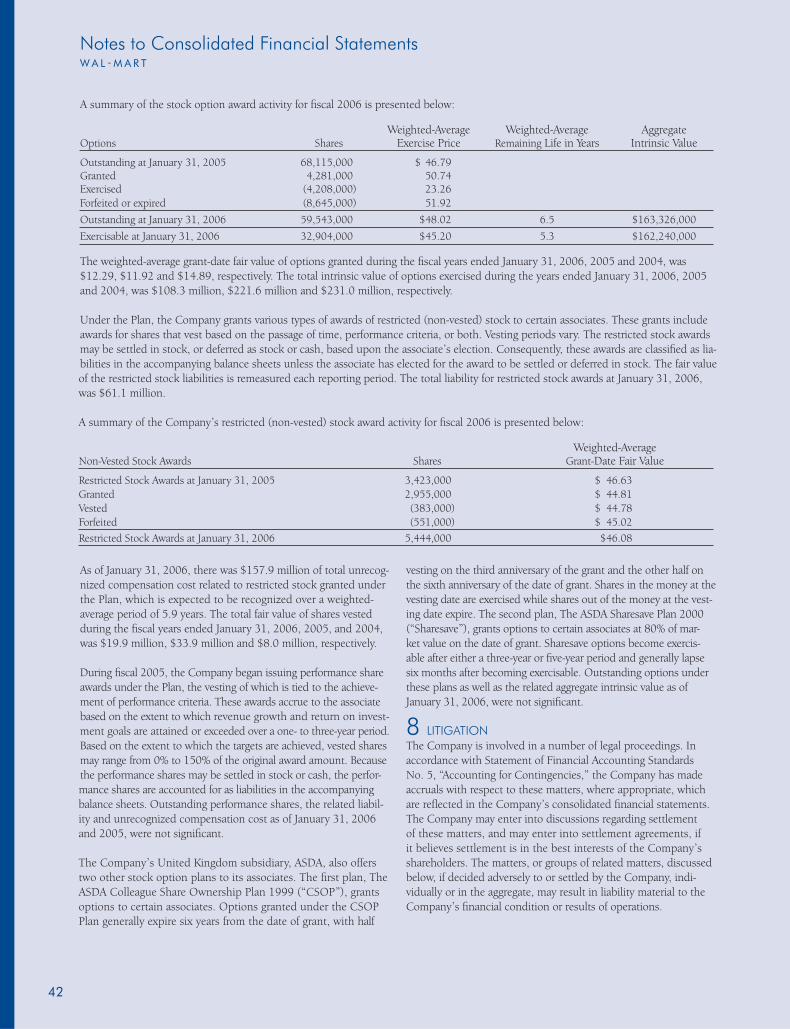
Notes to Consolidated Financial StatementsW A L - M A R T
42
A summary of the stock option award activity for fi scal 2006 is presented below:
Weighted-Average Weighted-Average AggregateOptions Shares Exercise Price Remaining Life in Years Intrinsic Value
Outstanding at January 31, 2005 68,115,000 $ 46.79Granted 4,281,000 50.74Exercised (4,208,000) 23.26Forfeited or expired (8,645,000) 51.92
Outstanding at January 31, 2006 59,543,000 $48.02 6.5 $163,326,000
Exercisable at January 31, 2006 32,904,000 $45.20 5.3 $162,240,000
The weighted-average grant-date fair value of options granted during the fi scal years ended January 31, 2006, 2005 and 2004, was $12.29, $11.92 and $14.89, respectively. The total intrinsic value of options exercised during the years ended January 31, 2006, 2005 and 2004, was $108.3 million, $221.6 million and $231.0 million, respectively.
Under the Plan, the Company grants various types of awards of restricted (non-vested) stock to certain associates. These grants include awards for shares that vest based on the passage of time, performance criteria, or both. Vesting periods vary. The restricted stock awards may be settled in stock, or deferred as stock or cash, based upon the associate’s election. Consequently, these awards are classifi ed as lia-bilities in the accompanying balance sheets unless the associate has elected for the award to be settled or deferred in stock. The fair value of the restricted stock liabilities is remeasured each reporting period. The total liability for restricted stock awards at January 31, 2006, was $61.1 million.
A summary of the Company’s restricted (non-vested) stock award activity for fi scal 2006 is presented below:
Weighted-AverageNon-Vested Stock Awards Shares Grant-Date Fair Value
Restricted Stock Awards at January 31, 2005 3,423,000 $ 46.63Granted 2,955,000 $ 44.81Vested (383,000) $ 44.78Forfeited (551,000) $ 45.02Restricted Stock Awards at January 31, 2006 5,444,000 $46.08
As of January 31, 2006, there was $157.9 million of total unrecog-nized compensation cost related to restricted stock granted under the Plan, which is expected to be recognized over a weighted-average period of 5.9 years. The total fair value of shares vested during the fi scal years ended January 31, 2006, 2005, and 2004, was $19.9 million, $33.9 million and $8.0 million, respectively.
During fi scal 2005, the Company began issuing performance share awards under the Plan, the vesting of which is tied to the achieve-ment of performance criteria. These awards accrue to the associate based on the extent to which revenue growth and return on invest-ment goals are attained or exceeded over a one- to three-year period. Based on the extent to which the targets are achieved, vested shares may range from 0% to 150% of the original award amount. Because the performance shares may be settled in stock or cash, the perfor-mance shares are accounted for as liabilities in the accompanying balance sheets. Outstanding performance shares, the related liabil-ity and unrecognized compensation cost as of January 31, 2006 and 2005, were not signifi cant.
The Company’s United Kingdom subsidiary, ASDA, also offers two other stock option plans to its associates. The fi rst plan, The ASDA Colleague Share Ownership Plan 1999 (“CSOP”), grants options to certain associates. Options granted under the CSOP Plan generally expire six years from the date of grant, with half
vesting on the third anniversary of the grant and the other half on the sixth anniversary of the date of grant. Shares in the money at the vesting date are exercised while shares out of the money at the vest-ing date expire. The second plan, The ASDA Sharesave Plan 2000 (“Sharesave”), grants options to certain associates at 80% of mar-ket value on the date of grant. Sharesave options become exercis-able after either a three-year or fi ve-year period and generally lapse six months after becoming exercisable. Outstanding options under these plans as well as the related aggregate intrinsic value as of January 31, 2006, were not signifi cant.
8 LITIGATION The Company is involved in a number of legal proceedings. In accordance with Statement of Financial Accounting Standards No. 5, “Accounting for Contingencies,” the Company has made accruals with respect to these matters, where appropriate, which are refl ected in the Company’s consolidated fi nancial statements. The Company may enter into discussions regarding settlement of these matters, and may enter into settlement agreements, if it believes settlement is in the best interests of the Company’s shareholders. The matters, or groups of related matters, discussed below, if decided adversely to or settled by the Company, indi-vidually or in the aggregate, may result in liability material to the Company’s fi nancial condition or results of operations.
43
The Company is a defendant in numerous cases containing class-action allegations in which the plaintiffs have brought claims under the Fair Labor Standards Act (“FLSA”), corresponding state statutes, or other laws. The plaintiffs in these lawsuits are current and former hourly associates who allege, among other things, that the Company forced them to work “off the clock,” or failed to provide work breaks, or otherwise claim they were not paid for work performed. The complaints generally seek unspecifi ed monetary damages, injunc-tive relief, or both. Class certifi cation has yet to be addressed in a majority of the cases. Class certifi cation has been denied or over-turned in cases pending in Arizona, Arkansas, Florida, Georgia, Indiana, Louisiana, Maryland, Michigan, Nevada, New Jersey, North Carolina, Ohio, Texas, West Virginia and Wisconsin. Some or all of the requested classes have been certifi ed in cases pending in California, Colorado, Massachusetts, Minnesota, Missouri, New Mexico, Oregon, Pennsylvania and Washington. Conditional certi-fi cations for notice purposes under the FLSA have been allowed in cases in Georgia, Michigan and Texas. The Company cannot estimate the possible loss or range of loss which may arise from these lawsuits. The Company is a defendant in Savaglio v. Wal-Mart Stores, Inc., a class-action lawsuit in which the plaintiffs allege that they were not provided meal and rest breaks in accordance with California law, and seek monetary damages and injunctive relief. A jury trial on the plaintiffs’ claims for monetary damages concluded on December 22, 2005. The jury returned a verdict of $57,216,673 in statutory penalties and $115 million in punitive damages. The Company believes that it has substantial defenses to the claims at issue, and intends to challenge the verdict in post-trial motions and, if necessary, on appeal. Meanwhile, the plaintiffs’ claims for injunctive relief have been tentatively set for trial in June 2006. A putative class action is pending in California challenging the methodology of payments made under various Associate incentive bonus plans, and a second putative class action in California asserts that the Company has omitted to include bonus payments in calculating associates’ regular rate of pay for purposes of determin-ing overtime. As to the fi rst case (Cruz v. Wal-Mart Stores, Inc.), the Company cannot estimate the possible loss or range of loss which may arise. The parties have entered into an agreement to settle the second case (Fries v. Wal-Mart Stores, Inc.), which must be approved by the court in order to become effective. If approved by the court, the settlement will include all class members who do not opt out of the settlement class. The amount to be paid by Wal-Mart under the settlement will not have a material impact on the Company’s fi nancial condition or results of operations.
The Company is currently a defendant in fi ve putative class actions brought on behalf of assistant store managers who challenge their exempt status under state and federal laws, which are pending in California, Michigan, New Mexico and Tennessee. Conditional cer-tifi cation for notice purposes under the FLSA has been granted in one of these cases (Comer v. Wal-Mart Stores, Inc.). Otherwise, no determination has been made as to class certifi cation in any of these cases. The Company cannot estimate the possible loss or range of loss which may arise from these lawsuits.
The Company is a defendant in Dukes v. Wal-Mart Stores, Inc., a class-action lawsuit commenced in June 2001 and pending in the United States District Court for the Northern District of California. The case was brought on behalf of all past and present female employees in all of the Company’s retail stores and warehouse clubs in the United States. The complaint alleges that the Company has engaged in a pattern and practice of discriminating against women in promotions, pay, training and job assignments. The complaint seeks, among other things, injunctive relief, front pay, back pay, punitive damages, and attorneys’ fees. Following a hearing on class certifi cation on September 24, 2003, on June 21, 2004, the District Court issued an order granting in part and denying in part the plain-tiffs’ motion for class certifi cation. The class, which was certifi ed by the District Court for purposes of liability, injunctive and declara-tory relief, punitive damages, and lost pay, subject to certain excep-tions, includes all women employed at any Wal-Mart domestic retail store at any time since December 26, 1998, who have been or may be subjected to the pay and management track promotions poli-cies and practices challenged by the plaintiffs. The class as certifi ed currently includes approximately 1.6 million present and former female associates. The Company believes that the District Court’s ruling is incor-rect. The United States Court of Appeals for the Ninth Circuit has granted the Company’s petition for discretionary review of the rul-ing. The Court of Appeals heard oral argument from counsel in the case on August 8, 2005. There is no indication at this time as to when a decision will be rendered. If the Company is not suc-cessful in its appeal of class certifi cation, or an appellate court issues a ruling that allows for the certifi cation of a class or classes with a different size or scope, and if there is a subsequent adverse verdict on the merits from which there is no successful appeal, or in the event of a negotiated settlement of the litigation, the result-ing liability could be material to the Company. The plaintiffs also seek punitive damages which, if awarded, could result in the pay-ment of additional amounts material to the Company. However, because of the uncertainty of the outcome of the appeal from the District Court’s certifi cation decision, because of the uncertainty of the balance of the proceedings contemplated by the District Court, and because the Company’s liability, if any, arising from the litigation, including the size of any damages award if plaintiffs are successful in the litigation or any negotiated settlement, could vary widely, the Company cannot reasonably estimate the possible loss or range of loss which may arise from the litigation.
The Company is a defendant in Mauldin v. Wal-Mart Stores, Inc., a class-action lawsuit that was fi led on October 16, 2001, in the United States District Court for the Northern District of Georgia, Atlanta Division. The class was certifi ed on August 23, 2002. On September 30, 2003, the court denied the Company’s motion to reconsider that ruling. The class is composed of female Wal-Mart associates who were participants in the Associates Health and Welfare Plan at any time from March 8, 2001, to the present and who were using prescription contraceptives. The class seeks amend-ment of the Plan to include coverage for prescription contraceptives, back pay for all members in the form of reimbursement of the cost of prescription contraceptives, pre-judgment interest, and attorneys’
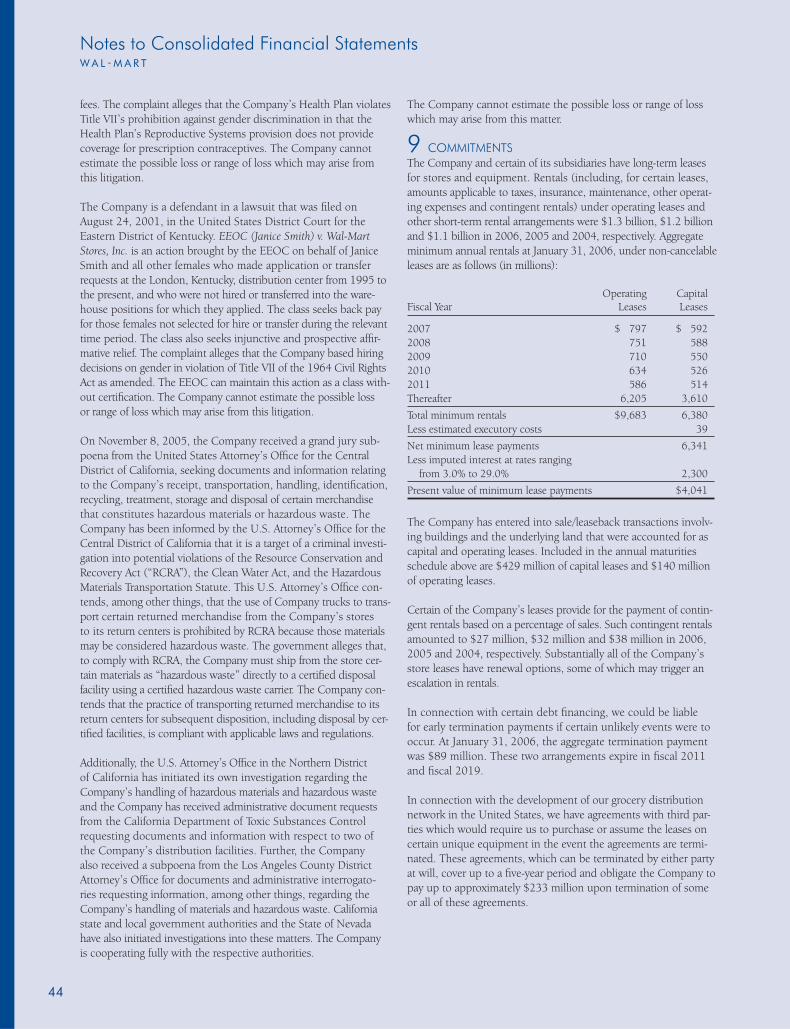
Notes to Consolidated Financial StatementsW A L - M A R T
44
fees. The complaint alleges that the Company’s Health Plan violates Title VII’s prohibition against gender discrimination in that the Health Plan’s Reproductive Systems provision does not provide coverage for prescription contraceptives. The Company cannot estimate the possible loss or range of loss which may arise from this litigation.
The Company is a defendant in a lawsuit that was fi led on August 24, 2001, in the United States District Court for the Eastern District of Kentucky. EEOC (Janice Smith) v. Wal-Mart Stores, Inc. is an action brought by the EEOC on behalf of Janice Smith and all other females who made application or transfer requests at the London, Kentucky, distribution center from 1995 to the present, and who were not hired or transferred into the ware-house positions for which they applied. The class seeks back pay for those females not selected for hire or transfer during the relevant time period. The class also seeks injunctive and prospective affi r-mative relief. The complaint alleges that the Company based hiring decisions on gender in violation of Title VII of the 1964 Civil Rights Act as amended. The EEOC can maintain this action as a class with-out certifi cation. The Company cannot estimate the possible loss or range of loss which may arise from this litigation.
On November 8, 2005, the Company received a grand jury sub-poena from the United States Attorney’s Offi ce for the Central District of California, seeking documents and information relating to the Company’s receipt, transportation, handling, identifi cation, recycling, treatment, storage and disposal of certain merchandise that constitutes hazardous materials or hazardous waste. The Company has been informed by the U.S. Attorney’s Offi ce for the Central District of California that it is a target of a criminal investi-gation into potential violations of the Resource Conservation and Recovery Act (“RCRA”), the Clean Water Act, and the Hazardous Materials Transportation Statute. This U.S. Attorney’s Offi ce con-tends, among other things, that the use of Company trucks to trans-port certain returned merchandise from the Company’s stores to its return centers is prohibited by RCRA because those materials may be considered hazardous waste. The government alleges that, to comply with RCRA, the Company must ship from the store cer-tain materials as “hazardous waste” directly to a certifi ed disposal facility using a certifi ed hazardous waste carrier. The Company con-tends that the practice of transporting returned merchandise to its return centers for subsequent disposition, including disposal by cer-tifi ed facilities, is compliant with applicable laws and regulations.
Additionally, the U.S. Attorney’s Offi ce in the Northern District of California has initiated its own investigation regarding the Company’s handling of hazardous materials and hazardous waste and the Company has received administrative document requests from the California Department of Toxic Substances Control requesting documents and information with respect to two of the Company’s distribution facilities. Further, the Company also received a subpoena from the Los Angeles County District Attorney’s Offi ce for documents and administrative interrogato-ries requesting information, among other things, regarding the Company’s handling of materials and hazardous waste. California state and local government authorities and the State of Nevada have also initiated investigations into these matters. The Company is cooperating fully with the respective authorities.
The Company cannot estimate the possible loss or range of loss which may arise from this matter.
9 COMMITMENTSThe Company and certain of its subsidiaries have long-term leases for stores and equipment. Rentals (including, for certain leases, amounts applicable to taxes, insurance, maintenance, other operat-ing expenses and contingent rentals) under operating leases and other short-term rental arrangements were $1.3 billion, $1.2 billion and $1.1 billion in 2006, 2005 and 2004, respectively. Aggregate minimum annual rentals at January 31, 2006, under non-cancelable leases are as follows (in millions):
Operating CapitalFiscal Year Leases Leases
2007 $ 797 $ 5922008 751 5882009 710 5502010 634 5262011 586 514Thereafter 6,205 3,610
Total minimum rentals $9,683 6,380Less estimated executory costs 39
Net minimum lease payments 6,341Less imputed interest at rates ranging from 3.0% to 29.0% 2,300
Present value of minimum lease payments $4,041
The Company has entered into sale/leaseback transactions involv-ing buildings and the underlying land that were accounted for as capital and operating leases. Included in the annual maturities schedule above are $429 million of capital leases and $140 million of operating leases. Certain of the Company’s leases provide for the payment of contin-gent rentals based on a percentage of sales. Such contingent rentals amounted to $27 million, $32 million and $38 million in 2006, 2005 and 2004, respectively. Substantially all of the Company’s store leases have renewal options, some of which may trigger an escalation in rentals. In connection with certain debt fi nancing, we could be liable for early termination payments if certain unlikely events were to occur. At January 31, 2006, the aggregate termination payment was $89 million. These two arrangements expire in fi scal 2011 and fi scal 2019. In connection with the development of our grocery distribution network in the United States, we have agreements with third par-ties which would require us to purchase or assume the leases on certain unique equipment in the event the agreements are termi-nated. These agreements, which can be terminated by either party at will, cover up to a fi ve-year period and obligate the Company to pay up to approximately $233 million upon termination of some or all of these agreements.
45
There are no recourse provisions which would enable us to recover from third parties any amounts paid under the above guarantees. No liability for these guarantees has been recorded in our fi nancial statements. The Company has entered into lease commitments for land and buildings for 60 future locations. These lease commitments with real estate developers provide for minimum rentals ranging from 5 to 35 years, which if consummated based on current cost esti-mates, will approximate $95 million annually over the lease terms.
10 RETIREMENT-RELATED BENEFITSIn the United States, the Company maintains a Profi t Sharing and 401(k) Retirement Savings Plan under which most full-time and many part-time associates become participants following one year of employment. The Profi t Sharing component of the plan is entirely funded by the Company, with an additional contribution made by the Company to the associates’ 401(k) component of the plan. In addition to the Company contributions to the 401(k) Retirement Savings component of the plan, associates may elect to contribute a percentage of their earnings. During fi scal 2006, participants could contribute up to 25% of their pretax earnings, but not more than statutory limits. Associates may choose from among 13 different investment options for the 401(k) Retirement Savings component of the plan. For associates who did not make an election, their 401(k) balance in the plan is placed in a balanced fund. Associates are immediately vested in their 401(k) funds and may change their investment options at any time. Additionally, fully vested associates have the same 13 investment options for the Profi t Sharing component of the plan. Associates are fully vested in the Profi t Sharing compo-nent of the plan after seven years of service. Annual contributions made by the Company to the United States and Puerto Rico Profi t Sharing and 401(k) Retirement Savings Plans are made at the sole discretion of the Company, and were $827 million, $756 million and $662 million for fi scal 2006, 2005 and 2004, respectively.
Employees in foreign countries who are not U.S. citizens are covered by various post-employment benefi t arrangements. These plans are administered based upon the legislative and tax requirements in the country in which they are established. Annual contributions to for-eign retirement savings and profi t sharing plans are made at the dis-cretion of the Company, and were $244 million, $199 million and $123 million in fi scal 2006, 2005 and 2004, respectively. The Company’s subsidiaries in the United Kingdom and Japan have defi ned benefi t pension plans. The plan in the United Kingdom was underfunded by $332 million and $419 million at January 31, 2006 and 2005, respectively. The plan in Japan was underfunded by $228 million at January 31, 2006.
11 SEGMENTS At January 31, 2006, the Company and its subsidiaries were princi-pally engaged in the operation of retail stores located in all 50 states, Argentina, Brazil, Canada, Germany, South Korea, Puerto Rico and the United Kingdom, through joint ventures in China, and through majority-owned subsidiaries in Japan and Mexico. The Company identifi es segments based on management responsibility within the United States and in total for international units. The Wal-Mart Stores segment includes the Company’s supercenters, discount stores and Neighborhood Markets in the United States, as well as Walmart.com. The SAM’S CLUB segment includes the warehouse membership clubs in the United States as well as samsclub.com. At January 31, 2006, the International segment consisted of the Company’s operations in Argentina, Brazil, China, Germany, Mexico, South Korea, Japan and the United Kingdom, which are consolidated using a December 31 fi scal year-end, generally due to statutory reporting requirements. There were no signifi cant intervening events which materially affected the fi nancial statements. The Company’s operations in Canada and Puerto Rico are consolidated using a January 31 fi scal year-end. The amounts under the caption “Other” in the following table include unallocated corporate overhead. The Company’s portion of the results of our unconsolidated minority interest in Seiyu prior to December 20, 2005, and our unconsolidated minority interest in CARHCO are also included under the caption “Other.”
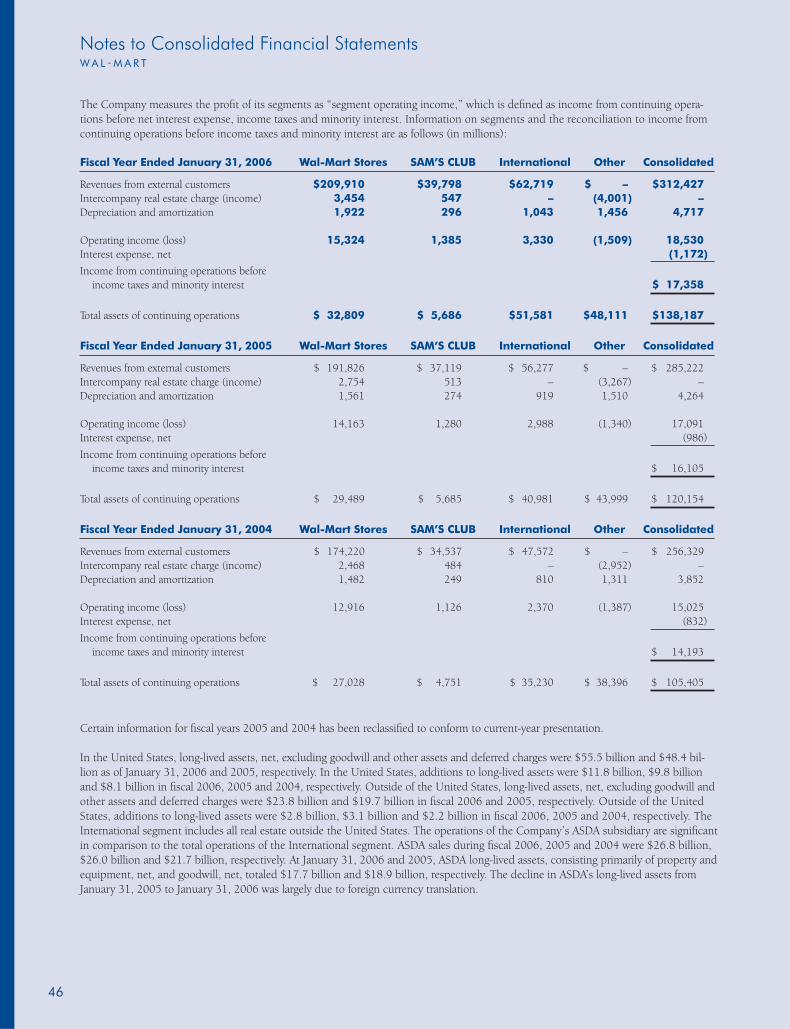
Notes to Consolidated Financial StatementsW A L - M A R T
46
The Company measures the profi t of its segments as “segment operating income,” which is defi ned as income from continuing opera-tions before net interest expense, income taxes and minority interest. Information on segments and the reconciliation to income from continuing operations before income taxes and minority interest are as follows (in millions):
Fiscal Year Ended January 31, 2006 Wal-Mart Stores SAM’S CLUB International Other Consolidated
Revenues from external customers $209,910 $39,798 $62,719 $ – $312,427 Intercompany real estate charge (income) 3,454 547 – (4,001) –Depreciation and amortization 1,922 296 1,043 1,456 4,717
Operating income (loss) 15,324 1,385 3,330 (1,509) 18,530Interest expense, net (1,172)
Income from continuing operations before income taxes and minority interest $ 17,358
Total assets of continuing operations $ 32,809 $ 5,686 $51,581 $48,111 $138,187
Fiscal Year Ended January 31, 2005 Wal-Mart Stores SAM’S CLUB International Other Consolidated
Revenues from external customers $ 191,826 $ 37,119 $ 56,277 $ – $ 285,222 Intercompany real estate charge (income) 2,754 513 – (3,267) –Depreciation and amortization 1,561 274 919 1,510 4,264
Operating income (loss) 14,163 1,280 2,988 (1,340) 17,091 Interest expense, net (986)
Income from continuing operations before income taxes and minority interest $ 16,105
Total assets of continuing operations $ 29,489 $ 5,685 $ 40,981 $ 43,999 $ 120,154
Fiscal Year Ended January 31, 2004 Wal-Mart Stores SAM’S CLUB International Other Consolidated
Revenues from external customers $ 174,220 $ 34,537 $ 47,572 $ – $ 256,329 Intercompany real estate charge (income) 2,468 484 – (2,952) –Depreciation and amortization 1,482 249 810 1,311 3,852
Operating income (loss) 12,916 1,126 2,370 (1,387) 15,025 Interest expense, net (832)
Income from continuing operations before income taxes and minority interest $ 14,193
Total assets of continuing operations $ 27,028 $ 4,751 $ 35,230 $ 38,396 $ 105,405
Certain information for fi scal years 2005 and 2004 has been reclassifi ed to conform to current-year presentation. In the United States, long-lived assets, net, excluding goodwill and other assets and deferred charges were $55.5 billion and $48.4 bil-lion as of January 31, 2006 and 2005, respectively. In the United States, additions to long-lived assets were $11.8 billion, $9.8 billion and $8.1 billion in fi scal 2006, 2005 and 2004, respectively. Outside of the United States, long-lived assets, net, excluding goodwill and other assets and deferred charges were $23.8 billion and $19.7 billion in fi scal 2006 and 2005, respectively. Outside of the United States, additions to long-lived assets were $2.8 billion, $3.1 billion and $2.2 billion in fi scal 2006, 2005 and 2004, respectively. The International segment includes all real estate outside the United States. The operations of the Company’s ASDA subsidiary are signifi cant in comparison to the total operations of the International segment. ASDA sales during fi scal 2006, 2005 and 2004 were $26.8 billion, $26.0 billion and $21.7 billion, respectively. At January 31, 2006 and 2005, ASDA long-lived assets, consisting primarily of property and equipment, net, and goodwill, net, totaled $17.7 billion and $18.9 billion, respectively. The decline in ASDA’s long-lived assets from January 31, 2005 to January 31, 2006 was largely due to foreign currency translation.
47
12 QUARTERLY FINANCIAL DATA (UNAUDITED) Quarters ended(Amounts in millions except per share information) April 30, July 31, October 31, January 31,
Fiscal 2006Net sales $70,908 $76,811 $75,436 $89,273Cost of sales 54,571 58,787 57,988 69,045
Gross profi t $16,337 $18,024 $17,448 $20,228Net income $ 2,461 $ 2,805 $ 2,374 $ 3,589Basic and diluted net income per common share $ 0.58 $ 0.67 $ 0.57 $ 0.86
Fiscal 2005Net sales $64,763 $69,722 $68,520 $82,216Cost of sales 49,969 53,533 52,567 63,723Gross profi t $14,794 $16,189 $15,953 $18,493Net income $ 2,166 $ 2,651 $ 2,286 $ 3,164Basic and diluted net income per common share $ 0.50 $ 0.62 $ 0.54 $ 0.75
The sum of quarterly fi nancial data will not agree to annual amounts due to rounding.
13 SUBSEQUENT EVENTSOn March 2, 2006, the Company’s Board of Directors approved an increase in the Company’s annual dividend to $0.67 per share. The annual dividend will be paid in four quarterly installments on April 3, 2006, June 5, 2006, September 5, 2006, and January 2, 2007 to holders of record on March 17, May 19, August 18 and December 15, 2006, respectively.
In February 2006, we entered into a £150 million revolving credit facility in the United Kingdom. Interest on borrowings under the credit facility accrues at LIBOR plus 25 basis points.
48
The Board of Directors and Shareholders, Wal-Mart Stores, Inc.
We have audited the accompanying consolidated balance sheets of Wal-Mart Stores, Inc. as of January 31, 2006 and 2005, and the related consolidated statements of income, shareholders’ equity and cash fl ows for each of the three years in the period ended January 31, 2006. These fi nancial statements are the responsibility of the Company’s management. Our responsibility is to express an opinion on these fi nancial statements based on our audits. We conducted our audits in accordance with the standards of the Public Company Accounting Oversight Board (United States). Those standards require that we plan and perform the audit to obtain reasonable assurance about whether the fi nancial statements are free of material misstatement. An audit includes examining, on a test basis, evidence supporting the amounts and disclosures in the fi nancial statements. An audit also includes assessing the account-ing principles used and signifi cant estimates made by management, as well as evaluating the overall fi nancial statement presentation. We believe that our audits provide a reasonable basis for our opinion.
In our opinion, the fi nancial statements referred to above present fairly, in all material respects, the consolidated fi nancial position of Wal-Mart Stores, Inc. at January 31, 2006 and 2005, and the con-solidated results of its operations and its cash fl ows for each of the three years in the period ended January 31, 2006, in conformity with U.S. generally accepted accounting principles. We also have audited, in accordance with the standards of the Public Company Accounting Oversight Board (United States), the effectiveness of Wal-Mart Stores, Inc.’s internal control over fi nancial reporting as of January 31, 2006, based on crite-ria established in Internal Control – Integrated Framework issued by the Committee of Sponsoring Organizations of the Treadway Commission and our report dated March 27, 2006 expressed an unqualifi ed opinion thereon.
Rogers, ArkansasMarch 27, 2006
Report of Independent Registered Public Accounting FirmW A L - M A R T
49
Report of Independent Registered Public Accounting Firm on Internal Control Over Financial ReportingW A L - M A R T
The Board of Directors and Shareholders, Wal-Mart Stores, Inc.
We have audited management’s assessment, included in the accompanying Management’s Report to Our Shareholders under the caption “Report on Internal Control Over Financial Reporting,” that Wal-Mart Stores, Inc. maintained effective inter-nal control over fi nancial reporting as of January 31, 2006, based on criteria established in Internal Control – Integrated Framework issued by the Committee of Sponsoring Organizations of the Treadway Commission (the COSO criteria). Wal-Mart Stores, Inc.’s management is responsible for maintaining effective internal con-trol over fi nancial reporting and for its assessment of the effective-ness of internal control over fi nancial reporting. Our responsibility is to express an opinion on management’s assessment and an opinion on the effectiveness of the company’s internal control over fi nancial reporting based on our audit. We conducted our audit in accordance with the standards of the Public Company Accounting Oversight Board (United States). Those standards require that we plan and perform the audit to obtain reasonable assurance about whether effective internal con-trol over fi nancial reporting was maintained in all material respects. Our audit included obtaining an understanding of internal control over fi nancial reporting, evaluating management’s assessment, test-ing and evaluating the design and operating effectiveness of inter-nal control, and performing such other procedures as we considered necessary in the circumstances. We believe that our audit provides a reasonable basis for our opinion. A company’s internal control over fi nancial reporting is a process designed to provide reasonable assurance regarding the reliability of fi nancial reporting and the preparation of fi nancial statements for external purposes in accordance with generally accepted accounting principles. A company’s internal control over fi nancial reporting includes those policies and procedures that (1) pertain to the maintenance of records that, in reasonable detail, accurately and fairly refl ect the transactions and dispositions of the assets of the company; (2) provide reasonable assurance that transactions are recorded as necessary to permit preparation of fi nancial statements in accordance with generally accepted accounting principles, and that receipts and expenditures of the company are being made only in accordance with authorizations of management and directors of the company; and (3) provide reasonable assurance regarding prevention or timely detection of unauthorized acquisition, use, or disposition of the company’s assets that could have a material effect on the fi nancial statements.
Because of its inherent limitations, internal control over fi nancial reporting may not prevent or detect misstatements. Also, projec-tions of any evaluation of effectiveness to future periods are sub-ject to the risk that controls may become inadequate because of changes in conditions, or that the degree of compliance with the policies or procedures may deteriorate. As indicated in the accompanying Management’s Report to Our Shareholders, management’s assessment of and conclusion on the effectiveness of internal control over fi nancial reporting did not include the internal controls of The Seiyu, Ltd., and Sonae Distribuição Brasil S.A., both of which were acquired in fi scal 2006 and are included in the fi scal 2006 consolidated fi nancial state-ments of Wal-Mart Stores, Inc. These entities represented, in the aggregate, 5.8% and 0.1% of total assets and total net sales, respec-tively, of the Company as of, and for the year ended, January 31, 2006. These acquisitions are more fully discussed in Note 6 to the consolidated fi nancial statements for fi scal 2006. Our audit of inter-nal control over fi nancial reporting of Wal-Mart Stores, Inc. also did not include an evaluation of the internal control over fi nancial reporting for these fi scal 2006 acquisitions.
In our opinion, management’s assessment that Wal-Mart Stores, Inc. maintained effective internal control over fi nancial reporting as of January 31, 2006, is fairly stated, in all material respects, based on the COSO criteria. Also, in our opinion, Wal-Mart Stores, Inc., main-tained, in all material respects, effective internal control over fi nan-cial reporting as of January 31, 2006, based on the COSO criteria. We also have audited, in accordance with the standards of the Public Company Accounting Oversight Board (United States), the con-solidated balance sheets of Wal-Mart Stores, Inc. as of January 31, 2006 and 2005, and the related consolidated statements of income, shareholders’ equity and cash fl ows for each of the three years in the period ended January 31, 2006 and our report dated March 27, 2006 expressed an unqualifi ed opinion thereon. .
Rogers, ArkansasMarch 27, 2006
50
Management of Wal-Mart Stores, Inc. (“Wal-Mart” or the “Company”) is responsible for the preparation, integrity and objec-tivity of Wal-Mart’s consolidated fi nancial statements and other fi nan-cial information contained in this Annual Report to Shareholders. Those consolidated fi nancial statements were prepared in conformity with accounting principles generally accepted in the United States. In preparing those consolidated fi nancial statements, management was required to make certain estimates and judgments, which are based upon currently available information and management’s view of current conditions and circumstances. The Audit Committee of the Board of Directors, which consists solely of independent directors, oversees our process of reporting fi nancial information and the audit of our consolidated fi nancial statements. The Audit Committee stays informed of the fi nancial condition of Wal-Mart and regularly reviews management’s fi nan-cial policies and procedures, the independence of our independent auditors, our internal control and the objectivity of our fi nancial reporting. Both the independent auditors and the internal auditors have free access to the Audit Committee and meet with the Audit Committee periodically, both with and without management present. We have retained Ernst & Young LLP, an independent registered public accounting fi rm, to audit our consolidated fi nancial statements found in this annual report. We have made available to Ernst & Young LLP all of our fi nancial records and related data in connection with their audit of our consolidated fi nancial statements. We have fi led with the Securities and Exchange Commission (“SEC”) the required certifi cations related to our consolidated fi nan-cial statements as of and for the year ended January 31, 2006. These certifi cations are attached as exhibits to our Annual Report on Form 10-K for the year ended January 31, 2006. Additionally, we have also provided to the New York Stock Exchange the required annual certifi cation of our Chief Executive Offi cer regarding our compliance with the New York Stock Exchange’s corporate governance listing standards. Report on Internal Control Over Financial Reporting. Management has responsibility for establishing and maintaining adequate internal control over fi nancial reporting. Internal control over fi nancial reporting is a process designed to provide reasonable assurance regarding the reliability of fi nancial reporting and the preparation of fi nancial statements for external reporting purposes in accordance with accounting principles generally accepted in the United States. Because of its inherent limitations, internal control over fi nancial reporting may not prevent or detect misstatements. Management has assessed the effectiveness of the Company’s internal control over fi nancial reporting as of January 31, 2006. In making its assessment, management has utilized the criteria set forth by the Committee of Sponsoring Organizations (“COSO”) of the Treadway Commission in Internal Control – Integrated Framework. Management concluded that based on its assessment, Wal-Mart’s internal control over fi nancial reporting was effective as of January 31, 2006. Management’s assessment of the effective-ness of the Company’s internal control over fi nancial reporting as of January 31, 2006, has been audited by Ernst & Young LLP, an independent registered public accounting fi rm, as stated in their report which appears in this Annual Report to Shareholders.
Management’s assessment of the effectiveness of the Company’s internal control over fi nancial reporting excluded The Seiyu, Ltd. and Sonae Distribuição Brasil S.A., both of which were acquired in fi scal 2006. These entities represented, in the aggregate, 5.8% and
0.1% of consolidated total assets and consolidated net sales, respec-tively, of the Company as of and for the year ended January 31, 2006. These acquisitions are more fully discussed in Note 6 to our consolidated fi nancial statements for fi scal 2006. Under guidelines established by the SEC, companies are allowed to exclude acquisi-tions from their fi rst assessment of internal control over fi nancial reporting following the date of the acquisition. Evaluation of Disclosure Controls and Procedures. We maintain disclosure controls and procedures designed to pro-vide reasonable assurance that information required to be timely disclosed is accumulated and communicated to management in a timely fashion. Management has assessed the effectiveness of these disclosure controls and procedures as of January 31, 2006, and determined they were effective as of that date to provide reasonable assurance that information required to be disclosed by us in the reports we fi le or submit under the Securities Exchange Act of 1934, as amended, was accumulated and communicated to management, as appropriate, to allow timely decisions regarding required disclo-sure and were effective to provide reasonable assurance that such information is recorded, processed, summarized and reported within the time periods specifi ed by the SEC’s rules and forms. Report on Ethical Standards. Our Company was founded on the belief that open communica-tions and the highest standards of ethics are necessary to be suc-cessful. Our long-standing “Open Door” communication policy helps management be aware of and address issues in a timely and effective manner. Through the open door policy all associates are encouraged to inform management at the appropriate level when they are concerned about any matter pertaining to Wal-Mart. Wal-Mart has adopted a Statement of Ethics to guide our associ-ates in the continued observance of high ethical standards such as honesty, integrity and compliance with the law in the conduct of Wal-Mart’s business. Familiarity and compliance with the Statement of Ethics is required of all associates who are part of management. The Company also maintains a separate Code of Ethics for our senior fi nancial offi cers. Wal-Mart also has in place a Related-Party Transaction Policy. This policy applies to Wal-Mart’s senior offi cers and directors and requires material related-party transactions to be reviewed by the Audit Committee. The senior offi cers and directors are required to report material related-party transactions to Wal-Mart. We maintain an ethics offi ce which over-sees and administers an ethics hotline. The ethics hotline provides a channel for associates to make confi dential and anonymous complaints regarding potential violations of our statements of ethics, including violations related to fi nancial or accounting matters.
H. Lee ScottPresident and Chief Executive Offi cer
Thomas M. SchoeweExecutive Vice President and Chief Financial Offi cer
Management’s Report to Our ShareholdersW A L - M A R T
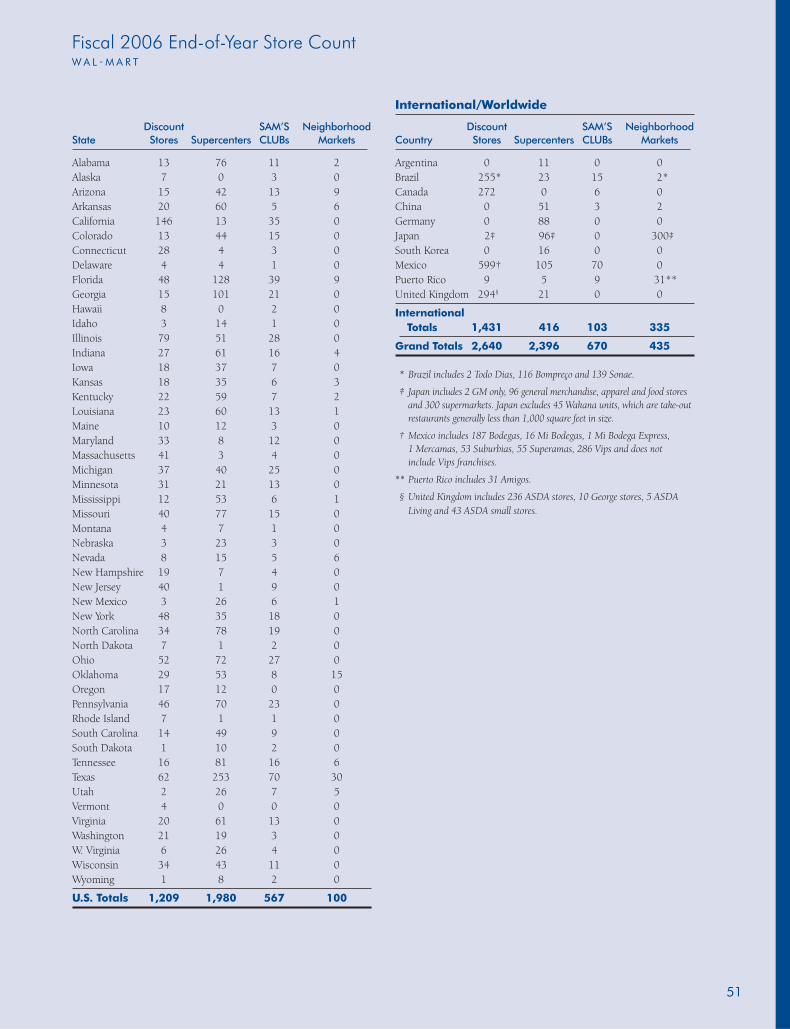
51
Discount SAM’S Neighborhood State Stores Supercenters CLUBs Markets
Alabama 13 76 11 2Alaska 7 0 3 0Arizona 15 42 13 9Arkansas 20 60 5 6California 146 13 35 0Colorado 13 44 15 0Connecticut 28 4 3 0Delaware 4 4 1 0Florida 48 128 39 9Georgia 15 101 21 0Hawaii 8 0 2 0Idaho 3 14 1 0Illinois 79 51 28 0Indiana 27 61 16 4Iowa 18 37 7 0Kansas 18 35 6 3Kentucky 22 59 7 2Louisiana 23 60 13 1Maine 10 12 3 0Maryland 33 8 12 0Massachusetts 41 3 4 0Michigan 37 40 25 0Minnesota 31 21 13 0Mississippi 12 53 6 1Missouri 40 77 15 0Montana 4 7 1 0Nebraska 3 23 3 0Nevada 8 15 5 6New Hampshire 19 7 4 0New Jersey 40 1 9 0New Mexico 3 26 6 1New York 48 35 18 0North Carolina 34 78 19 0North Dakota 7 1 2 0Ohio 52 72 27 0Oklahoma 29 53 8 15Oregon 17 12 0 0Pennsylvania 46 70 23 0Rhode Island 7 1 1 0South Carolina 14 49 9 0South Dakota 1 10 2 0Tennessee 16 81 16 6Texas 62 253 70 30Utah 2 26 7 5Vermont 4 0 0 0Virginia 20 61 13 0Washington 21 19 3 0W. Virginia 6 26 4 0Wisconsin 34 43 11 0Wyoming 1 8 2 0
U.S. Totals 1,209 1,980 567 100
Fiscal 2006 End-of-Year Store CountW A L - M A R T
International/Worldwide
Discount SAM’S Neighborhood Country Stores Supercenters CLUBs Markets
Argentina 0 11 0 0Brazil 255* 23 15 2*Canada 272 0 6 0China 0 51 3 2Germany 0 88 0 0Japan 2‡ 96‡ 0 300‡South Korea 0 16 0 0Mexico 599† 105 70 0Puerto Rico 9 5 9 31**United Kingdom 294§ 21 0 0
International Totals 1,431 416 103 335
Grand Totals 2,640 2,396 670 435
* Brazil includes 2 Todo Dias, 116 Bompreço and 139 Sonae.
‡ Japan includes 2 GM only, 96 general merchandise, apparel and food stores and 300 supermarkets. Japan excludes 45 Wakana units, which are take-out restaurants generally less than 1,000 square feet in size.
† Mexico includes 187 Bodegas, 16 Mi Bodegas, 1 Mi Bodega Express, 1 Mercamas, 53 Suburbias, 55 Superamas, 286 Vips and does not include Vips franchises.
** Puerto Rico includes 31 Amigos.
§ United Kingdom includes 236 ASDA stores, 10 George stores, 5 ASDA Living and 43 ASDA small stores.
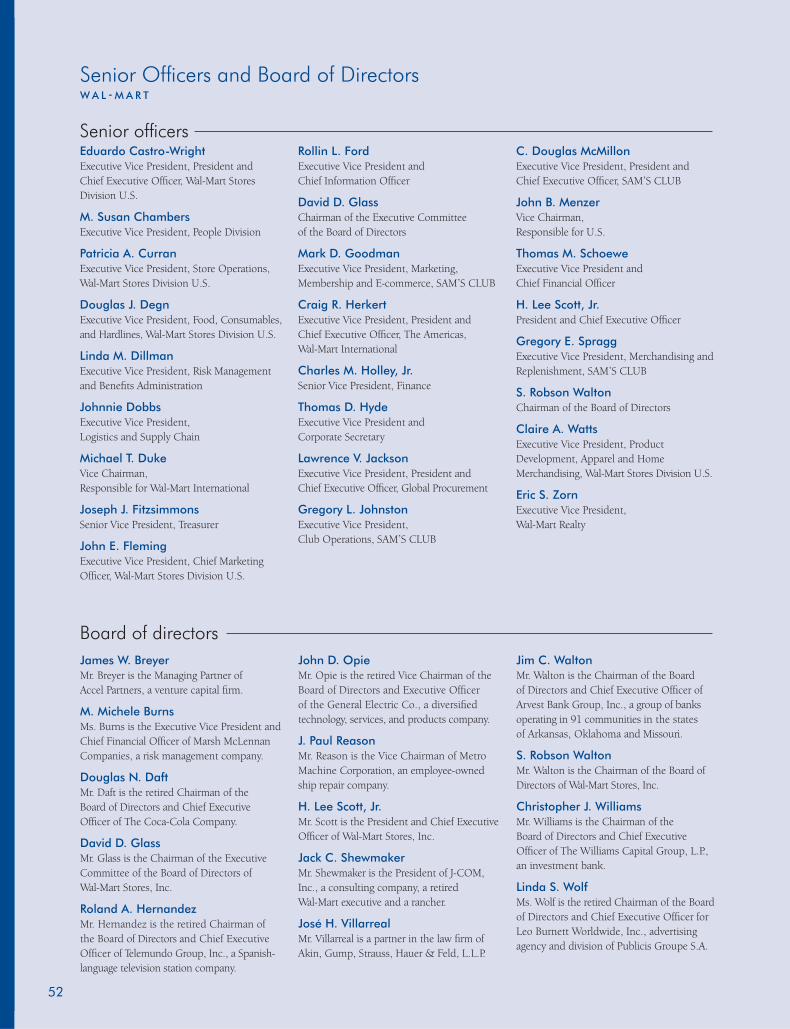
Eduardo Castro-Wright Executive Vice President, President and Chief Executive Offi cer, Wal-Mart Stores Division U.S.
M. Susan Chambers Executive Vice President, People Division
Patricia A. CurranExecutive Vice President, Store Operations, Wal-Mart Stores Division U.S.
Douglas J. Degn Executive Vice President, Food, Consumables, and Hardlines, Wal-Mart Stores Division U.S.
Linda M. Dillman Executive Vice President, Risk Management and Benefi ts Administration
Johnnie Dobbs Executive Vice President, Logistics and Supply Chain
Michael T. Duke Vice Chairman, Responsible for Wal-Mart International
Joseph J. Fitzsimmons Senior Vice President, Treasurer
John E. FlemingExecutive Vice President, Chief Marketing Offi cer, Wal-Mart Stores Division U.S.
Rollin L. Ford Executive Vice President and Chief Information Offi cer
David D. Glass Chairman of the Executive Committee of the Board of Directors
Mark D. Goodman Executive Vice President, Marketing, Membership and E-commerce, SAM’S CLUB
Craig R. Herkert Executive Vice President, President and Chief Executive Offi cer, The Americas, Wal-Mart International
Charles M. Holley, Jr. Senior Vice President, Finance
Thomas D. Hyde Executive Vice President and Corporate Secretary
Lawrence V. Jackson Executive Vice President, President and Chief Executive Offi cer, Global Procurement
Gregory L. JohnstonExecutive Vice President, Club Operations, SAM’S CLUB
C. Douglas McMillon Executive Vice President, President and Chief Executive Offi cer, SAM’S CLUB
John B. Menzer Vice Chairman, Responsible for U.S.
Thomas M. Schoewe Executive Vice President and Chief Financial Offi cer
H. Lee Scott, Jr. President and Chief Executive Offi cer
Gregory E. Spragg Executive Vice President, Merchandising and Replenishment, SAM’S CLUB
S. Robson Walton Chairman of the Board of Directors
Claire A. Watts Executive Vice President, Product Development, Apparel and Home Merchandising, Wal-Mart Stores Division U.S.
Eric S. ZornExecutive Vice President, Wal-Mart Realty
James W. Breyer Mr. Breyer is the Managing Partner of Accel Partners, a venture capital fi rm.
M. Michele Burns Ms. Burns is the Executive Vice President and Chief Financial Offi cer of Marsh McLennan Companies, a risk management company.
Douglas N. Daft Mr. Daft is the retired Chairman of the Board of Directors and Chief Executive Offi cer of The Coca-Cola Company.
David D. Glass Mr. Glass is the Chairman of the Executive Committee of the Board of Directors of Wal-Mart Stores, Inc.
Roland A. Hernandez Mr. Hernandez is the retired Chairman of the Board of Directors and Chief Executive Offi cer of Telemundo Group, Inc., a Spanish-language television station company.
John D. Opie Mr. Opie is the retired Vice Chairman of the Board of Directors and Executive Offi cer of the General Electric Co., a diversifi ed technology, services, and products company.
J. Paul Reason Mr. Reason is the Vice Chairman of Metro Machine Corporation, an employee-owned ship repair company.
H. Lee Scott, Jr. Mr. Scott is the President and Chief Executive Offi cer of Wal-Mart Stores, Inc.
Jack C. Shewmaker Mr. Shewmaker is the President of J-COM, Inc., a consulting company, a retired Wal-Mart executive and a rancher.
José H. Villarreal Mr. Villarreal is a partner in the law fi rm of Akin, Gump, Strauss, Hauer & Feld, L.L.P.
Jim C. WaltonMr. Walton is the Chairman of the Board of Directors and Chief Executive Offi cer of Arvest Bank Group, Inc., a group of banks operating in 91 communities in the states of Arkansas, Oklahoma and Missouri.
S. Robson Walton Mr. Walton is the Chairman of the Board of Directors of Wal-Mart Stores, Inc.
Christopher J. Williams Mr. Williams is the Chairman of the Board of Directors and Chief Executive Offi cer of The Williams Capital Group, L.P., an investment bank.
Linda S. WolfMs. Wolf is the retired Chairman of the Board of Directors and Chief Executive Offi cer for Leo Burnett Worldwide, Inc., advertising agency and division of Publicis Groupe S.A.
Board of directors
Senior Offi cers and Board of DirectorsW A L - M A R T
Senior offi cers
52
Corporate information Registrar and Transfer Agent:Computershare Trust Company, N.A.P.O. Box 43069Providence, Rhode Island 02940-30691-800-438-6278TDD for hearing-impaired inside the U.S. 1-800-952-9245Internet: http//www.computershare.com/equiserveDividend reinvestment and direct stock purchase available
Listings – Stock Symbol: WMT New York Stock Exchange Pacifi c Stock Exchange Annual meeting: Our Annual Meeting of Shareholders will be held on Friday, June 2, 2006, in Bud Walton Arena on the University of Arkansas campus, Fayetteville, Arkansas. Communication with shareholders: Wal-Mart Stores, Inc. periodically communicates with its shareholders and other members of the investment community about our operations. For further information regarding our policy on shareholder and investor communications refer to our website www.walmartstores.com/investors. Independent registered public accounting fi rm: Ernst & Young LLP 5414 Pinnacle Point Dr., Suite 102 Rogers, AR 72758 Corporate address: Wal-Mart Stores, Inc. 702 S.W. 8th Street Bentonville, Arkansas 72716 Telephone: 479-273-4000
Retail Internet Sites: http://www.walmart.com http://www.samsclub.com
Corporate Internet Sites: http://www.walmartstores.com http://www.walmartfacts.com The following reports are available without charge upon request by writing the Company c/o Investor Relations or by calling 479-273-8446. These reports are also available via the corporate website. Annual Report on Form 10-K Quarterly Reports on Form 10-Q Current Reports on Form 8-K Current Sales and Earnings Releases Copy of Proxy Statement Supplier Standards Report
Sustainability in action
Market price of common stock Fiscal year ended January 31, 2005 2006 High Low High Low
1st Quarter $61.05 $54.69 $53.51 $46.812nd Quarter $57.68 $51.76 $50.51 $47.003rd Quarter $54.97 $51.33 $49.80 $42.494th Quarter $57.70 $52.02 $50.57 $44.95
Fiscal year ended January 31, 2007 High Low
1st Quarter* $47.76 $44.74
*Through March 20, 2006
Certifi cations The Company’s Chief Executive Offi cer and Chief Financial Offi cer have fi led their certifi cations as required by the Securities and Exchange Commission (the “SEC”) regarding the quality of the Company’s public dis-closure for each of the periods ended during the Company’s fi scal year ended January 31, 2006 and the effectiveness of internal control over fi nan-cial reporting as of January 31, 2006 and 2005. Further, the Company’s Chief Executive Offi cer has certifi ed to the New York Stock Exchange (“NYSE”) that he is not aware of any violation by the Company of the NYSE corporate governance listing standards, as required by Section 303A.12(a) of the NYSE listing standards, and he has certifi ed to the Pacifi c Stock Exchange that he is not aware of any violation by the Company of the Pacifi c Stock Exchange Corporate Governance Rules, as required by Rule 5.3(m) of the Corporate Governance Rules.
Shareholders As of March 20, 2006, there were 312,663 holders of record of Wal-Mart’s Common Stock.
Dividends paid per share Fiscal year ended January 31, 2005
April 5, 2004 $ 0.130June 7, 2004 $ 0.130September 7, 2004 $ 0.130January 3, 2005 $ 0.130
Dividends paid per share Fiscal year ended January 31, 2006
April 4, 2005 $ 0.150June 6, 2005 $ 0.150September 6, 2005 $ 0.150January 3, 2006 $ 0.150
Dividends payable per share Fiscal year ended January 31, 2007
April 3, 2006 $ 0.1675June 5, 2006 $ 0.1675September 5, 2006 $ 0.1675January 2, 2007 $ 0.1675
Corporate and Stock InformationW A L - M A R T
SCS-COC-00648
All of the paper used for Wal-Mart’s Annual Report came from well-managed forests certifi ed to the international standards of the Forest Stewardship Council (FSC). The fi nancial section paper also contains 10% post-consumer recycled fi ber.
Des
igne
d by
Cor
pora
te R
epor
ts In
c./A
tlant
a
ww
w.co
rpor
ater
epor
t.com

MORE TO SMILE ABOUTGreat products at our stores and clubs in 2006.
Kid Connection® toys
Wal-Mart Stores, Inc.702 S.W. 8th StreetBentonville, Arkansas 72716www.walmartstores.com
www.walmart.com www.samsclub.com
Parent’s Choice® organic baby formula
Samsung® LCD television
Unifl ame® gas grill
RAZR™ cell phone
Exsto™ men’s clothing
Fresh fl owers and plants
GE® compact fl uorescent light bulbs
Bose® speakers
George Baby Organic™ clothing
George™ women’s clothing
GE® appliances


