32
2006 Census
| Date post: | 01-Jan-2016 |
| Category: |
Documents |
| Upload: | sybil-conley |
| View: | 217 times |
| Download: | 0 times |

2006 Census

2
Background
• A very Canadian tradition since Jean Talon in 1666
• An important “national ceremony”
• Wide ranging consultations: several thousand briefs, submissions and comments
• A legal requirement – Statistics Act

3
Why a census
• Transfer payments: $250 billion plus over the five years
• Only consistent source of small area data, population trends, immigration, industry-occupation, language issues, etc.
• Required for numerous Federal Statutes:– Employment Equity Act– Official Languages Act

4
0
10
20
30
40
1951-52 56-57 61-62 66-67 71-72 76-77 81-82 86-87 91-92 96-97 2001-02
Millions
0
1
2
3
4
Population and population growth rate, Canada
%
Rate(%)Number
(Millions)

5
Components of population growth, 1993-2002
1,410,120
567,277
1,785,413
1,017,595
46,900
0
500,000
1,000,000
1,500,000
2,000,000
Natural increase Net international migration Net interprovincial migration
Canada Ontario
N/A

6
Total CMAs 1.2%
0.1
0.6
0.9
1.3
1.6
1.7
1.9
3.0
0.0 0.5 1.0 1.5 2.0 2.5 3.0 3.5
Winnipeg
Montréal
Halifax
Ottawa-Gatineau
Vancouver
Edmonton
Toronto
Calgary
% change
Average annual growth rates, selected CMAs, 1996-2001

7
2001
1971
Population age-sex distribution, Ontario
Population '000s
Males Females
90+
85
80
75
70
65
60
55
50
45
40
35
30
25
20
15
10
5
0
Age
100 100 120120 080 60 6040 20 804020
Population '000s
Males Females
90+
85
80
75
70
65
60
55
50
45
40
35
30
25
20
15
10
5
0
Age
100 100 120120 080 60 6040 20 804020
Population '000s
Males Females
90+
85
80
75
70
65
60
55
50
45
40
35
30
25
20
15
10
5
0
Age
100 100 120120 080 60 6040 20 804020

8
2026
2001
Population age-sex distribution, Ontario
Population '000s
Males Females
90+
85
80
75
70
65
60
55
50
45
40
35
30
25
20
15
10
5
0
Age
100 100 120120 080 60 6040 20 804020

9
0
5
10
15
20
25
30
1921 1931 1941 1951 1961 1971 1981 1991 2001 2011 2021 2031 2041 2051
%
0
5
10
15
20
25
30
Percentage of population aged 65 and over, Canada
2
Medium Projections

10
Immigration by calendar year, Canada
0
100,000
200,000
300,000
400,000
500,000
1901 1911 1921 1931 1941 1951 1961 1971 1981 1991 20010
100,000
200,000
300,000
400,000
500,000

11
0%
10%
20%
30%
40%
50%
60%
70%
80%
90%
100%
Before1961
1961 to1970
1971 to1980
1981 to1990
1991 to2001
United States
Europe
Asia and theMiddle East
Africa
Caribbean, Central& South America
Oceania and other
Immigrants are increasingly from Asia and the Middle East
Source: Statistics Canada, 2001 Census

12
Visible minority populations continue to grow
20
30
40
50
60
1981 1986 1991 1996 2001 2006 2011 20160
10
20
30
40
50
60
%
0
10
Estimates Projections
Toronto CMA
Ontario less Toronto CMA
OntarioCanada
%

13
Population reporting Aboriginal ancestry (origin), Canada, 1901-2001
128,890 160,937113,724
127,941
105,611165,607
1,319,890
491,465
1,002,675
220,121312,765
0
200,000
400,000
600,000
800,000
1,000,000
1,200,000
1,400,000
1901 1911 1921 1931 1941 1951 1961 1971 1981 1991 2001

14
Almost half of the Aboriginal population live in urban areas and their share is increasing over 1996-2001 period
32.7
20.4 20.7
26.3
31.4
19.521.3
27.8
0
5
10
15
20
25
30
35
40
On reserve Rural non-reserve Urban non-CMA Urban CMA
1996
2001
%
15
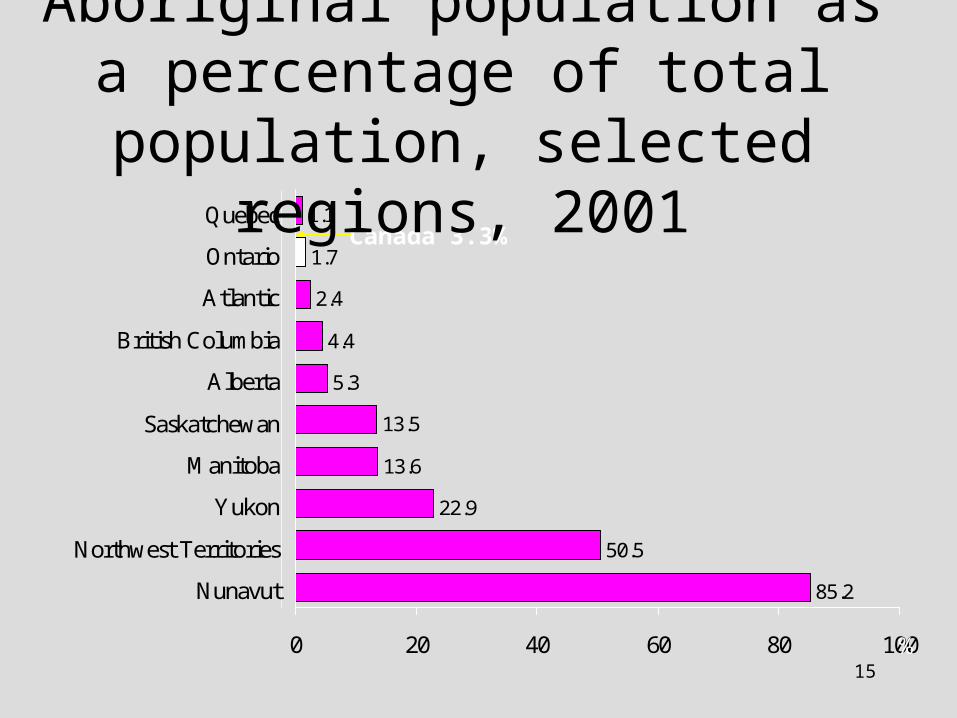
Canada 3.3%
85.2
50.5
22.9
13.6
13.5
5.3
4.4
2.4
1.7
1.1
0 20 40 60 80 100
Nunavut
Northwest Territories
Yukon
Manitoba
Saskatchewan
Alberta
British Columbia
Atlantic
Ontario
Quebec
%
Aboriginal population as a percentage of total population, selected regions,
2001

16
Just under 1 million in Canada self-identify as Aboriginal in 2001
30,080
45,070
292,310
608,850
976,305
0 200,000 400,000 600,000 800,000 1,000,000
Multiple & otherAboriginal responses
Inuit
Métis
North American Indian
Total Aboriginal identity
17
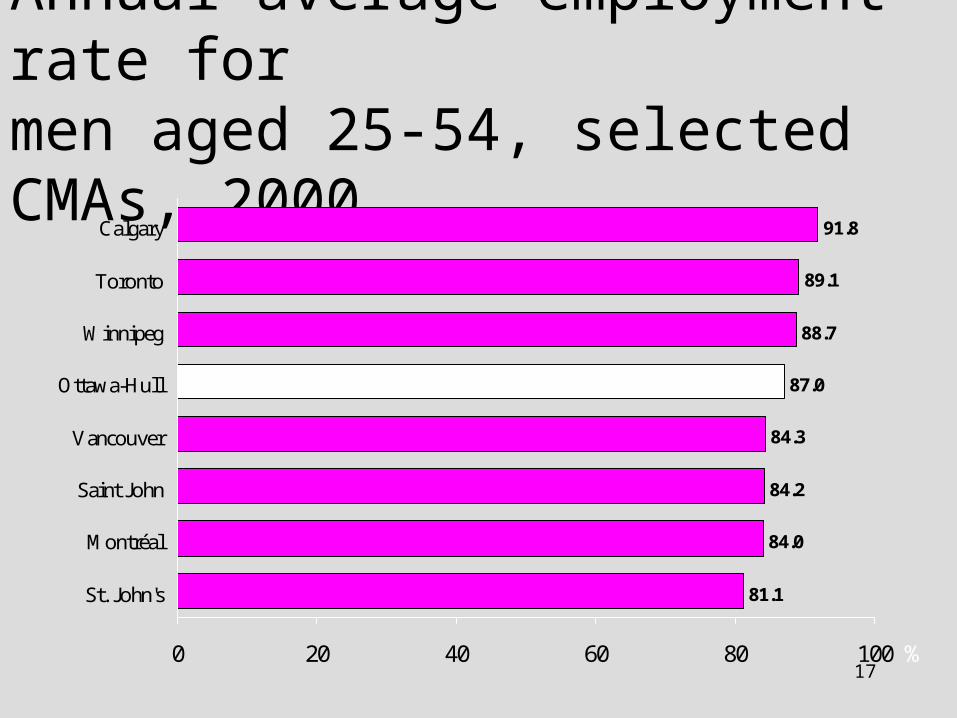
Annual average employment rate formen aged 25-54, selected CMAs, 2000
81.1
84.0
84.2
84.3
87.0
88.7
89.1
91.8
0 20 40 60 80 100
St. John's
Montréal
Saint John
Vancouver
Ottawa-Hull
Winnipeg
Toronto
Calgary
%

18
Annual average employment rate for women 25-54, selected CMAs, 2000
72.2
73.1
73.3
75.7
76.7
78.8
81.0
81.5
0 20 40 60 80 100
Saint John
St. John's
Montréal
Toronto
Ottawa-Hull
Winnipeg
Calgary
Regina
%

19
Canada 6.8%4.5
4.8
5.0
5.5
5.6
7.7
8.0
9.4
0 1 2 3 4 5 6 7 8 9 10
Calgary
Regina
Hamilton
Toronto
Ottawa-Hull
Montréal
Québec
St. John's
%
Annual average unemployment rate for selected CMAs, 2000

20
Growth in part-time, full-time and self-employment, Canada
80
100
120
140
160
180
1981 1983 1985 1987 1989 1991 1993 1995 1997 1999
Index: 1981=100
80
100
120
140
160
180
Full-time
Self-employed
Part-time
2000

21
Average Income, Ontario
0
10
20
30
40
50
60
70
80
1980 1983 1986 1989 1992 1995 1998 2001
Thousands of 2001 dollars
0
10
20
30
40
50
60
70
80
Before taxAfter tax
Unattached individuals
Families

22
59
60
61
62
63
64
65
66
1976 1978 1980 1982 1984 1986 1988 1990 1992 1994 1996 1998
Age
59
60
61
62
63
64
65
66
Average age of retirement, Canada
MaleFemale

23
Consultation & Testing
Consultation • Stage I – written submissions – 75• Stage II – follow-up with groups – 25• Comments – more than 800
Testing• Focus groups• One-on-ones• 2004 Census Test

24
New for 2006
Content:• Permission to use income tax files• 92-year consent question• Education – location of study
Operations:• Internet• Mail out to 70% of households• 100% mail back to a centralized data processing centre• Scanning rather than key entry

25
Pressures to change for 2006
• Privacy issues (local enumerator)• Changing nature of our partnership• CRA automation efforts and impact on capture of
Census data• Internet option (GOL and public expectations)• Recruiting large decentralized workforce• Timeliness improvements• First major change since 1971

26
6 Years of Preparation
• Planning meeting November 2000• Consultation 2001 - 2002• Detailed testing 2002 – 2004• Outsourcing contract 2003 – 2006• Development of Internet 2002 - 2006• Census Test / analysis 2004• Collection & Processing Facilities 2005 to 2006• Approval of content April 2005• Census Day May 16, 2006

27
Schedule
May 2-13 Mail-out / Drop off
May 1 Census Help Line starts
May 1-June 30 Publicity campaign
May 16 Census Day
May 17 -19 Reminder cards
May 20 Failed edit followup begins
May 22 Non response followup
July Field work complete
February 2007 First release of population and dwelling counts

28
Information collected
• Basic demographics • Activities of daily living• Sociocultural• Mobility• Education• Household activities• Labour market activities• Income• Housing

29
Organization
• 4 Regional Census Centres
• 36 Local Census Offices
• 3 Census Help Lines
• 1 Data Processing Centre
• 1 warehouse

30
Numbers
• 32.5 million people
• 12.7 million households
• 50,000 collection units
• 42 million questionnaires
• XX Field Operations Supervisors
• 1,600 Crew Leaders
• 25,000 Enumerators

31
Communications
• Media relations
• Paid advertising
• Education
• Third-party support
• Internet / website

Wish us good luck!


