TRANSPORTATION DEVELOPMENT DIVISION Published by the Transportation Data Section Crash Analysis and Reporting Unit in cooperation with the Transportation Safety Division June 2007 OREGON DEPARTMENT OF TRANSPORTATION 2006 OREGON TRAFFIC CRASH SUMMARY
Transcript
T R A N S P O R T A T I O N D E V E L O P M E N T D I V I S I O N
Published by the Transportation Data Section
Crash Analysis and Reporting Unit in cooperation with the
Transportation Safety Division
June 2007
O R E G O N D E P A R T M E N T O F T R A N S P O R T A T I O N
2006
OREGON TRAFFIC CRASH
SUMMARY
2006 OREGON TRAFFIC CRASH SUMMARY
Oregon Department of Transportation Transportation Development Division
Crash Analysis and Reporting Unit 555 13th Street NE, Suite 2 Salem, OR 97301-4178
Mark Wills Manager
June 2007
The Crash Analysis and Reporting Unit compiles data for reported motor vehicle traffic crashes occurring on city streets, county roads and state highways. The data supports various local, county and state traffic safety programs, engineering and planning projects, legislative concepts, and law enforcement services. Legally reportable motor vehicle traffic crashes are those involving death, bodily injury, or damage to personal property in excess of $500 (for crashes that occurred prior to 9/01/1997) or $1,000 (for crashes that occurred between 9/01/1997 and 12/31/2003). As of 01/01/2004, drivers are required to file an Accident and Insurance Report Form with DMV within 72 hours when damage to the driver's vehicle is over $1,500; damage to any vehicle is over $1,500 and any vehicle is towed from the scene as a result of damage from the accident; if injury or death resulted from the accident; or if damage to any one person’s property other than a vehicle involved in the accident is over $1,500. For more information on filing requirements, please contact DMV. The Crash Analysis and Reporting Unit is committed to providing the highest quality crash data to customers. However, because submittal of crash report forms is the responsibility of the individual driver, the Crash Analysis and Reporting Unit cannot guarantee that all qualifying crashes are represented; nor can assurances be made that all details pertaining to a single crash are accurate. Database expansion and refinement implemented in 2002 may result in slight differences between data reported in this publication and similar information reported in prior years.
iii
T A B L E O F C O N T E N T S
I. FIVE-YEAR CRASH TABLES Page
Statewide Crashes, Injuries and Deaths by Month, 2002 - 2006................................3 Statewide Crashes, Injuries and Deaths by Selected Crash Type, 2002- 2006 .........4 City of Portland Crashes, Injuries and Deaths by Month, 2002 - 2006 .......................5
II. DRIVER ERROR TABLES
All Drivers ...................................................................................................................9 Drivers in Fatal Crashes ...........................................................................................10 All Drivers in Motorcycle Crashes.............................................................................11 Drivers in Fatal Motorcycle Crashes.........................................................................12 All Drivers in Motorhome Crashes ............................................................................13 Drivers in Fatal Motorhome Crashes ........................................................................14 All Drivers in Pedalcycle Crashes.............................................................................15 Drivers in Fatal Pedalcycle Crashes.........................................................................16 All Drivers in Pedestrian Crashes .............................................................................17 Drivers in Fatal Pedestrian Crashes .........................................................................18 All Drivers in State Highway Crashes .......................................................................19 Drivers in Fatal State Highway Crashes ...................................................................20 All Drivers in Truck Crashes .....................................................................................21 Drivers in Fatal Truck Crashes .................................................................................22
III. CRASH SUMMARIES
A. Statewide Crash Summaries
State of Oregon Crashes..................................................................................25 Crashes in Rural Areas. ...................................................................................27 Crashes in Cities and Urban Areas. .................................................................29 Crashes in All Cities except Portland................................................................31 Crashes in Portland. .........................................................................................33
B. Fatal Crash Summaries
State of Oregon Fatal Crashes.........................................................................37 Fatal Crashes in Oregon Rural Areas...............................................................39 Fatal Crashes in Cities and Urban Areas. ........................................................41 Fatal Crashes in All Cities except Portland.......................................................43 Fatal Crashes in Portland .................................................................................45 C. Motorcycle Crash Summaries
State of Oregon Motorcycle Crashes................................................................49 Motorcycle Crashes in Oregon Rural Areas. ....................................................51 Motorcycle Crashes in Cities and Urban Areas. ...............................................53
iv
T A B L E OF C O N T E N T S
Motorcycle Crashes in Cities. ...........................................................................55 Motorcycle Crashes in Portland........................................................................57 D. Motorhome Crash Summaries
State of Oregon Motorhome Crashes...............................................................61 Motorhome Crashes in Oregon Rural Areas. ...................................................63 Motorhome Crashes in Cities and Urban Areas. ..............................................65 Motorhome Crashes in All Cities except Portland.............................................67 Motorhome Crashes in Portland.......................................................................69
E. Pedalcycle Crash Summaries
State of Oregon Pedalcycle Crashes................................................................73 Pedalcycle Crashes in Oregon Rural Areas. ....................................................75 Pedalcycle Crashes in Cities and Urban Areas. ...............................................77 Pedalcycle Crashes in All Cities except Portland. ............................................79 Pedalcycle Crashes in Portland........................................................................81
F. Pedestrian Crash Summaries
State of Oregon Pedestrian Crashes................................................................85 Pedestrian Crashes in Oregon Rural Areas. ....................................................87 Pedestrian Crashes in Cities and Urban Areas ................................................89 Pedestrian Crashes in All Cities except Portland..............................................91 Pedestrian Crashes in Portland........................................................................93
G. State Highway Crash Summaries
State of Oregon Highway Crashes ...................................................................97 State Highway Crashes in Oregon Rural Areas. ..............................................99 State Highway Crashes in Cities and Urban Areas ........................................101 State Highway Crashes in All Cities except Portland......................................103 State Highway Crashes in Portland ................................................................105
H. Truck Crash Summaries
State of Oregon Truck Crashes......................................................................109 Truck Crashes in Oregon Rural Areas............................................................111 Truck Crashes in Cities and Urban Areas ......................................................113 Truck Crashes in All Cities except Portland....................................................115 Truck Crashes in Portland ..............................................................................117
IV. Crash Summaries for Oregon Cities with Population 10,000 or more
COMPARATIVE SUMMARY OF TRAFFIC CRASHES, PERSONAL INJURIES AND DEATHS BY SELECTED CRASH TYPE
2002 TO 2006
This table lists major crash categories, total crashes for each category, and total injuries and deaths for all persons involved regardless of Participant Type. For example, in 2006, there were 736 crashes involving motorcycles, in which 742 persons were injured and 45 killed. Not all casualties in those crashes were motorcyclists.
SUMMARY OF PERSONAL INJURIES AND DEATHS BY SELECTED PARTICIPANT TYPE 2002 TO 2006
This table lists Participant Types corresponding to several major crash categories listed above, and the total injuries and deaths for those Participant Types. For example, of the 742 participants injured in motorcycle crashes during 2006 (above), 679 were motorcyclists. Of the 45 deaths in motorcycle crashes, 44 were motorcyclists.
NOTE: Up to three errors per driver are coded for a given crash. However, only the first, most relevant error for each driver is represented on this report, to avoid counting the same driver multiple times. This results in under-reporting of total errors. For total errors by age group, please request a CDS300 report.
TYPE OF ERROR # OF % --------------------------------------- COUNT OF DRIVERS BY AGE GROUP --------------------------------------------- DRVRS ERR <15 15 16 17 18 19 20 21 22-24 25-34 35-44 45-54 55-64 65-74 75+ NS
NOTE: Up to three errors per driver are coded for a given crash. However, only the first, most relevant error for each driver is represented on this report, to avoid counting the same driver multiple times. This results in under-reporting of total errors. For total errors by age group, please request a CDS300 report.
TYPE OF ERROR # OF % --------------------------------------- COUNT OF DRIVERS BY AGE GROUP -------------------------------------------- DRVRS ERR <15 15 16 17 18 19 20 21 22-24 25-34 35-44 45-54 55-64 65-74 75+ NS
2006 DRIVER ERROR TABLESALL DRIVERS IN MOTORCYCLE CRASHES
NOTE: Up to three errors per driver are coded for a given crash. However, only the first, most relevant error for each driver is represented on this report, to avoid counting the same driver multiple times. This results in under-reporting of total errors. For total errors by age group, please request a CDS300 report.
TYPE OF ERROR # OF % --------------------------------------- COUNT OF DRIVERS BY AGE GROUP -------------------------------------------- DRVRS ERR <15 15 16 17 18 19 20 21 22-24 25-34 35-44 45-54 55-64 65-74 75+ NS
2006 DRIVER ERROR TABLESDRIVERS IN FATAL MOTORCYCLE CRASHES
NOTE: Up to three errors per driver are coded for a given crash. However, only the first, most relevant error for each driver is represented on this report, to avoid counting the same driver multiple times. This results in under-reporting of total errors. For total errors by age group, please request a CDS300 report.
TYPE OF ERROR # OF % --------------------------------------- COUNT OF DRIVERS BY AGE GROUP -------------------------------------------- DRVRS ERR <15 15 16 17 18 19 20 21 22-24 25-34 35-44 45-54 55-64 65-74 75+ NS
2006 DRIVER ERROR TABLESALL DRIVERS IN MOTORHOME CRASHES
NOTE: Up to three errors per driver are coded for a given crash. However, only the first, most relevant error for each driver is represented on this report, to avoid counting the same driver multiple times. This results in under-reporting of total errors. For total errors by age group, please request a CDS300 report.
TYPE OF ERROR # OF % --------------------------------------- COUNT OF DRIVERS BY AGE GROUP -------------------------------------------- DRVRS ERR <15 15 16 17 18 19 20 21 22-24 25-34 35-44 45-54 55-64 65-74 75+ NS
2006 DRIVER ERROR TABLESDRIVERS IN FATAL MOTORHOME CRASHES
NOTE: Up to three errors per driver are coded for a given crash. However, only the first, most relevant error for each driver is represented on this report, to avoid counting the same driver multiple times. This results in under-reporting of total errors. For total errors by age group, please request a CDS300 report.
TYPE OF ERROR # OF % --------------------------------------- COUNT OF DRIVERS BY AGE GROUP -------------------------------------------- DRVRS ERR <15 15 16 17 18 19 20 21 22-24 25-34 35-44 45-54 55-64 65-74 75+ NS
2006 DRIVER ERROR TABLESALL DRIVERS IN PEDALCYCLE CRASHES
NOTE: Up to three errors per driver are coded for a given crash. However, only the first, most relevant error for each driver is represented on this report, to avoid counting the same driver multiple times. This results in under-reporting of total errors. For total errors by age group, please request a CDS300 report.
TYPE OF ERROR # OF % --------------------------------------- COUNT OF DRIVERS BY AGE GROUP -------------------------------------------- DRVRS ERR <15 15 16 17 18 19 20 21 22-24 25-34 35-44 45-54 55-64 65-74 75+ NS
2006 DRIVER ERROR TABLESDRIVERS IN FATAL PEDALCYCLE CRASHES
NOTE: Up to three errors per driver are coded for a given crash. However, only the first, most relevant error for each driver is represented on this report, to avoid counting the same driver multiple times. This results in under-reporting of total errors. For total errors by age group, please request a CDS300 report.
TYPE OF ERROR # OF % --------------------------------------- COUNT OF DRIVERS BY AGE GROUP -------------------------------------------- DRVRS ERR <15 15 16 17 18 19 20 21 22-24 25-34 35-44 45-54 55-64 65-74 75+ NS
2006 DRIVER ERROR TABLESALL DRIVERS IN PEDESTRIAN CRASHES
NOTE: Up to three errors per driver are coded for a given crash. However, only the first, most relevant error for each driver is represented on this report, to avoid counting the same driver multiple times. This results in under-reporting of total errors. For total errors by age group, please request a CDS300 report.
TYPE OF ERROR # OF % --------------------------------------- COUNT OF DRIVERS BY AGE GROUP -------------------------------------------- DRVRS ERR <15 15 16 17 18 19 20 21 22-24 25-34 35-44 45-54 55-64 65-74 75+ NS
2006 DRIVER ERROR TABLESDRIVERS IN FATAL PEDESTRIAN CRASHES
NOTE: Up to three errors per driver are coded for a given crash. However, only the first, most relevant error for each driver is represented on this report, to avoid counting the same driver multiple times. This results in under-reporting of total errors. For total errors by age group, please request a CDS300 report.
TYPE OF ERROR # OF % --------------------------------------- COUNT OF DRIVERS BY AGE GROUP -------------------------------------------- DRVRS ERR <15 15 16 17 18 19 20 21 22-24 25-34 35-44 45-54 55-64 65-74 75+ NS
2006 DRIVER ERROR TABLESALL DRIVERS IN STATE HIGHWAY CRASHES
NOTE: Up to three errors per driver are coded for a given crash. However, only the first, most relevant error for each driver is represented on this report, to avoid counting the same driver multiple times. This results in under-reporting of total errors. For total errors by age group, please request a CDS300 report.
TYPE OF ERROR # OF % --------------------------------------- COUNT OF DRIVERS BY AGE GROUP -------------------------------------------- DRVRS ERR <15 15 16 17 18 19 20 21 22-24 25-34 35-44 45-54 55-64 65-74 75+ NS
2006 DRIVER ERROR TABLESDRIVERS IN FATAL STATE HIGHWAY CRASHES
NOTE: Up to three errors per driver are coded for a given crash. However, only the first, most relevant error for each driver is represented on this report, to avoid counting the same driver multiple times. This results in under-reporting of total errors. For total errors by age group, please request a CDS300 report.
TYPE OF ERROR # OF % --------------------------------------- COUNT OF DRIVERS BY AGE GROUP -------------------------------------------- DRVRS ERR <15 15 16 17 18 19 20 21 22-24 25-34 35-44 45-54 55-64 65-74 75+ NS
2006 DRIVER ERROR TABLESALL DRIVERS IN TRUCK CRASHES
NOTE: Up to three errors per driver are coded for a given crash. However, only the first, most relevant error for each driver is represented on this report, to avoid counting the same driver multiple times. This results in under-reporting of total errors. For total errors by age group, please request a CDS300 report.
TYPE OF ERROR # OF % --------------------------------------- COUNT OF DRIVERS BY AGE GROUP -------------------------------------------- DRVRS ERR <15 15 16 17 18 19 20 21 22-24 25-34 35-44 45-54 55-64 65-74 75+ NS
2006 DRIVER ERROR TABLESDRIVERS IN FATAL TRUCK CRASHES
NOTE: Up to three errors per driver are coded for a given crash. However, only the first, most relevant error for each driver is represented on this report, to avoid counting the same driver multiple times. This results in under-reporting of total errors. For total errors by age group, please request a CDS300 report.
TYPE OF ERROR # OF % --------------------------------------- COUNT OF DRIVERS BY AGE GROUP -------------------------------------------- DRVRS ERR <15 15 16 17 18 19 20 21 22-24 25-34 35-44 45-54 55-64 65-74 75+ NS
NOTE: THIS YEAR TO DATE represents only those crashes entered onto the database as of the date above. SAME PERIOD LAST YEAR represents all crashes including late reports. MAJOR INJURIES are incapacitating injuries. MINOR INJURIES are non-incapacitating evident injuries.
3. LOCATION Total
PropertyDamage
Nonfatal Injury Fatal Property
DamageNonfatal
InjuryFatalTotalPropertyDamage
Nonfatal Injury Fatal Total Killed Injured
Total On Roadway TotalOff Roadway Number Of Crashes Number Of Persons
1. Below 1,000 2. 1,000 to 2,500 3. 2,501 to 5,000 4. 5,001 to 10,000 5. 10,001 to 25,000 6. 25,001 to 50,000 7. 50,001 to 100,000 8. 100,001 to 200,000 9. City of Portland Only Total - Municipalities
Directional Analysis - A crash consisting of a series of collisions, overturning, etc., is classified according to the first damage or injury producing event; includes on roadway and off roadway.5A. MULTIPLE VEH CRASH Total Fatal Injury P.D.O.
NOTE: THIS YEAR TO DATE represents only those crashes entered onto the database as of the date above. SAME PERIOD LAST YEAR represents all crashes including late reports. MAJOR INJURIES are incapacitating injuries. MINOR INJURIES are non-incapacitating evident injuries.
3. LOCATION Total
PropertyDamage
Nonfatal Injury Fatal Property
DamageNonfatal
InjuryFatalTotalPropertyDamage
Nonfatal Injury Fatal Total Killed Injured
Total On Roadway TotalOff Roadway Number Of Crashes Number Of Persons
1. Below 1,000 2. 1,000 to 2,500 3. 2,501 to 5,000 4. 5,001 to 10,000 5. 10,001 to 25,000 6. 25,001 to 50,000 7. 50,001 to 100,000 8. 100,001 to 200,000 9. City of Portland Only Total - Municipalities 1. Primary State Highways 2. Secondary State Highways 3. County and Local Roads
4. City Streets
5. Not Stated Total--Urban Area 6. Interstate System 7. Other State Freeways 8. Other State Highways Total--Urban System
6. Interstate System 1,223 24 493 706 549 8 199 342 674 16 294 364 24 7487. Other State Freeways 8. Other State Highways 4,962 143 2,409 2,410 2,747 79 1,253 1,415 2,215 64 1,156 995 178 4,016Total--Rural System 6,185 167 2,902 3,116 3,296 87 1,452 1,757 2,889 80 1,450 1,359 202 4,764
June 1, 2007
OREGON RURAL AREAS
28
At I
nter
sect
ion
Not
at I
nter
sect
ion
At
Inte
r. N
on -I
nter
.
OREGON RURAL AREAS 2006 STATEWIDE CRASHES
4. AGE OF CASUALTY
Number of Persons Killed Number of Persons Injured Total Killed Pedestrians Pedalcyclist Total Injured Pedestrians Pedalcyclist
Directional Analysis - A crash consisting of a series of collisions, overturning, etc., is classified according to the first damage or injury producing event; includes on roadway and off roadway.5A. MULTIPLE VEH CRASH Total Fatal Injury P.D.O.
Junction1. Car go straight 41 10 10 31 3 282. Car turning right 1 1 13. Car turning left4. Car backing 3 2 2 1 15. All others 1 1 1Totals 46 12 12 34 3 31
5D. ALL OTHER CRASHES Total Fatal Injury P.D.O.Coll-isionWith
Coll-isionWith
1. Other rd veh or railway train 9 2 11 2. Fixed object 87 61 1 149 3. Other object or animal 4 3 7 4. Overturning 10 9 1 20 5. Other noncollision 2 2 4 6. Other rd veh or railway train 5 15 3 23 7. Fixed object 1,867 2,139 141 4,147 8. Other object or animal 525 164 6 695 9. Overturning 192 300 22 514 10. Other noncollision 32 31 4 67 11. Not statedTotals 2,7242,733 180 5,637
6. PEDESTRIAN ACTION BY AGE
Ages of Pedstrians Killed and InjuredPedestrians Killed Total 0 to 4 5 to 9 10 to 14 15 to 19 20 to 24 25 to 44 45 to 64 65 & older Not stated
1a. X-ing at intersect or X-walk 1 1 2 1b. X-ing not at intersection 5 3 2 1 1 12 4 2a. Walking in road with traffic 3 3 1 7 3 2b. Same against traffic 3. Standing in roadway 1 3 1 1 6 1 4. Push or work on veh in road 1 1 5. Other working in roadway 1 1 6. Playing in roadway 7. Other in roadway 1 3 1 1 1 7 1 8. Not in roadway 1 2 7 2 2 2 16 4 9. Not stated
28 16 9573 2 52 13 Totals
7. AGE OF DRIVER All Crashes Fatal Injury 1. 14 & YOUNGER 3 1 1 2. 15 29 1 11 3. 16 348 4 201 4. 17 502 9 281 5. 18 603 12 326 6. 19 496 14 251 7. 20 441 11 251 8. 21 397 12 208 9. 22 to 24 977 33 510 10. 25 to 34 2,335 65 1,169 11. 35 to 44 2,244 57 1,129 12. 45 to 54 2,491 82 1,181 13. 55 to 64 1,843 51 876 14. 65 to 74 888 31 423 15. 75 & older 567 19 255 16. Not stated 819 2 104 Totals 14,983 404 7,177 8. SEX OF DRIVER Injury Fatal All Crashes
1. Male 9,449 307 4,254 2. Female 5,312 96 2,862 3. Not stated 222 1 61 Totals 14,983 404 7,177
9. RESIDENCE OF DRIVER All Crashes Fatal Injury
1. Local resident 10,378 258 5,156 2. In-state resident 2,770 90 1,314 3. Non resident 1,417 54 624 4. Not stated 418 2 83 Totals 14,983 404 7,177
10. CRASHES BY CONTRIBUTING FACTOR All InjuryFatal1. Speed too fast
434 127 234
20 95
7. Followed too closely 894 2 10 41
1 3
336 517
33 156
6. Improper overtaking5. Drove left of center4. Disregard traffic signal3. Passed stop sign2. Failed to yield 1,094 18 577
2,384 144 4,760
8. Made improper turn
Totals 11,755 430 5,728 654
79 741 297
86
20 3
85 100
3
1,642 157
1,478 480 208
12. Other 11. Mechanical defect10. Improper driving9. Had been drinking
12. ROAD SURFACECONDITION InjuryFatalAll
1. Dry 6,043 188 2,9742. Wet 2,226 67 1,1273. Snowy or icy 1,760 20 7204. Other 5. Not stated 122 13 15Totals 10,151 288 4,836
13. LIGHT CONDITION InjuryFatalAll1. Daylight 6,507 171 3,1342. Dawn or Dusk 617 19 2723. Darkness 3,002 93 1,4244. Not stated 25 5 6Totals 10,151 288 4,836
11. VEHICLE TYPE InjuryFatalAll1. Passenger car 13,451 327 6,4432. Pass Car and trailer 338 7 1173. Truck or truck tractor 100 7 414. Truck tractor with semi-trailer 697 26 2595. Other truck combination 30 1 126. Farm tractor and/or equip. 23 2 137. Taxicab 1 18. Bus 15 89. School bus 26 1 1210. Motorcycle 336 31 29111. Motor scooter or moped 3 212. Others and not stated 85 3 26Totals 15,105 405 7,225Special vehicles included above 13. Log trucks 55 7 2714. Emergency (incl. private) 47 1 1715. Military vehicles 16. Other public vehicles 110 4 41
3. County and Local Roads 157 47 19 66 184 95 279 231 114 345 4. City Streets
5. Not Stated 516 1 89 55 1 145 454 300 754 543 355 1 899 Total--Rural Area
NOTE: THIS YEAR TO DATE represents only those crashes entered onto the database as of the date above. SAME PERIOD LAST YEAR represents all crashes including late reports. MAJOR INJURIES are incapacitating injuries. MINOR INJURIES are non-incapacitating evident injuries.
3. LOCATION Total
PropertyDamage
Nonfatal Injury Fatal Property
DamageNonfatal
InjuryFatalTotalPropertyDamage
Nonfatal Injury Fatal Total Killed Injured
Total On Roadway TotalOff Roadway Number Of Crashes Number Of Persons
1. Below 1,000 2. 1,000 to 2,500 3. 2,501 to 5,000 4. 5,001 to 10,000 5. 10,001 to 25,000 6. 25,001 to 50,000 7. 50,001 to 100,000 8. 100,001 to 200,000 9. City of Portland Only Total - Municipalities
Directional Analysis - A crash consisting of a series of collisions, overturning, etc., is classified according to the first damage or injury producing event; includes on roadway and off roadway.5A. MULTIPLE VEH CRASH Total Fatal Injury P.D.O.
5B. MULTIPLE VEH CRASH Total Fatal Injury P.D.O. 304 219 6 5291. Moving in opposite dir.
1,249 599 3 1,8512. Both moving in same dir. 376 128 5043a. One car parked
2,944 2,468 3 5,4153b. One car stopped in traffic 141 28 1694. Enter/Leave parked pos. 140 60 1 2015a. Entering driveway/alley 693 206 8995b. Leaving driveway/alley 432 277 2 7116. All others
Totals 6,279 3,985 15 10,279
5C. PEDESTRIANCRASHES
All PedCrashes
Fatal Crashes Non-Fatal Injury Crashes
TotalAt
Intersection Non-
Junction TotalAt
IntersectionNon-
Junction1. Car go straight 216 18 3 15 198 63 1352. Car turning right 53 2 1 1 51 37 143. Car turning left 90 90 78 124. Car backing 6 1 1 5 1 45. All others 2 2 2Totals 367 21 4 17 346 179 167
5D. ALL OTHER CRASHES Total Fatal Injury P.D.O.Coll-isionWith
Coll-isionWith
1. Other rd veh or railway train 1 287 2 290 2. Fixed object 124 77 1 202 3. Other object or animal 2 1 3 4. Overturning 7 13 1 21 5. Other noncollision 2 5 1 8 6. Other rd veh or railway train 6 189 3 198 7. Fixed object 682 504 13 1,199 8. Other object or animal 70 18 88 9. Overturning 13 50 1 64 10. Other noncollision 6 8 4 18 11. Not statedTotals 9131,152 26 2,091
6. PEDESTRIAN ACTION BY AGE
Ages of Pedstrians Killed and InjuredPedestrians Killed Total 0 to 4 5 to 9 10 to 14 15 to 19 20 to 24 25 to 44 45 to 64 65 & older Not stated
1a. X-ing at intersect or X-walk 8 27 50 46 21 28 22 4 2 208 6 1b. X-ing not at intersection 5 8 28 24 9 16 14 9 1 114 7 2a. Walking in road with traffic 1 1 2b. Same against traffic 3. Standing in roadway 2 2 2 6 2 4. Push or work on veh in road 5. Other working in roadway 1 1 6. Playing in roadway 2 1 2 2 7 1 7. Other in roadway 4 4 2 3 1 4 1 19 3 8. Not in roadway 2 5 4 11 3 8 1 1 35 2 9. Not stated 1 1
1744 88 8536564219 5 392 21 Totals
7. AGE OF DRIVER All Crashes Fatal Injury 1. 14 & YOUNGER 11 5 2. 15 56 21 3. 16 775 331 4. 17 1,225 2 588 5. 18 1,385 4 630 6. 19 1,230 3 636 7. 20 1,091 5 529 8. 21 1,045 6 509 9. 22 to 24 2,634 14 1,265 10. 25 to 34 6,939 25 3,366 11. 35 to 44 6,373 17 3,065 12. 45 to 54 6,291 22 2,966 13. 55 to 64 4,536 11 2,055 14. 65 to 74 2,198 8 910 15. 75 & older 1,734 5 709 16. Not stated 3,716 1 473 Totals 41,239 123 18,058 8. SEX OF DRIVER Injury Fatal All Crashes
1. Male 21,500 81 9,024 2. Female 19,001 41 8,790 3. Not stated 738 1 244 Totals 41,239 123 18,058
9. RESIDENCE OF DRIVER All Crashes Fatal Injury
1. Local resident 35,503 95 15,963 2. In-state resident 2,535 10 1,151 3. Non resident 1,420 12 532 4. Not stated 1,781 6 412 Totals 41,239 123 18,058
10. CRASHES BY CONTRIBUTING FACTOR All InjuryFatal1. Speed too fast
2,468 68 89
757 204
7. Followed too closely 5,239 3 1 4 6 5
311 209
1,437 434
6. Improper overtaking5. Drove left of center4. Disregard traffic signal3. Passed stop sign2. Failed to yield 5,714 15 2,507
1,908 26 4,075
8. Made improper turn
Totals 23,944 127 10,633 1,294
74 692 267 305
10 1
20 35
1
2,838 134
1,926 519
1,108
12. Other 11. Mechanical defect10. Improper driving9. Had been drinking
12. ROAD SURFACECONDITION InjuryFatalAll
1. Dry 15,435 57 6,8182. Wet 4,893 16 2,1703. Snowy or icy 493 1 1564. Other 5. Not stated 310 5 23Totals 21,131 79 9,167
13. LIGHT CONDITION InjuryFatalAll1. Daylight 15,929 33 6,8632. Dawn or Dusk 1,025 4 4133. Darkness 4,147 41 1,8854. Not stated 30 1 6Totals 21,131 79 9,167
11. VEHICLE TYPE InjuryFatalAll1. Passenger car 40,502 99 17,6332. Pass Car and trailer 203 1 763. Truck or truck tractor 165 3 474. Truck tractor with semi-trailer 450 10 1455. Other truck combination 30 76. Farm tractor and/or equip. 3 17. Taxicab 9 68. Bus 75 299. School bus 77 2910. Motorcycle 271 8 22711. Motor scooter or moped 18 1612. Others and not stated 266 4 60Totals 42,069 125 18,276Special vehicles included above 13. Log trucks 13 1 414. Emergency (incl. private) 104 2 4015. Military vehicles 2 116. Other public vehicles 247 94
1. Primary State Highways 2. Secondary State Highways 3. County and Local Roads 4. City Streets 5. Not Stated Total--Rural Area
NOTE: THIS YEAR TO DATE represents only those crashes entered onto the database as of the date above. SAME PERIOD LAST YEAR represents all crashes including late reports. MAJOR INJURIES are incapacitating injuries. MINOR INJURIES are non-incapacitating evident injuries.
3. LOCATION Total
PropertyDamage
Nonfatal Injury Fatal Property
DamageNonfatal
InjuryFatalTotalPropertyDamage
Nonfatal Injury Fatal Total Killed Injured
Total On Roadway TotalOff Roadway Number Of Crashes Number Of Persons
1. Below 1,000 2. 1,000 to 2,500 3. 2,501 to 5,000 4. 5,001 to 10,000 5. 10,001 to 25,000 6. 25,001 to 50,000 7. 50,001 to 100,000 8. 100,001 to 200,000 9. City of Portland Only Total - Municipalities
Directional Analysis - A crash consisting of a series of collisions, overturning, etc., is classified according to the first damage or injury producing event; includes on roadway and off roadway.5A. MULTIPLE VEH CRASH Total Fatal Injury P.D.O.
5B. MULTIPLE VEH CRASH Total Fatal Injury P.D.O. 115 95 5 2151. Moving in opposite dir. 945 420 1 1,3662. Both moving in same dir. 196 52 1 2493a. One car parked
1,255 993 1 2,2493b. One car stopped in traffic 81 14 954. Enter/Leave parked pos. 59 25 845a. Entering driveway/alley
223 80 3035b. Leaving driveway/alley 111 85 1966. All others
Totals 2,985 1,764 8 4,757
5C. PEDESTRIANCRASHES
All PedCrashes
Fatal Crashes Non-Fatal Injury Crashes
TotalAt
Intersection Non-
Junction TotalAt
IntersectionNon-
Junction1. Car go straight 99 5 5 94 41 532. Car turning right 25 25 21 43. Car turning left 62 1 1 61 54 74. Car backing 3 3 35. All othersTotals 189 6 6 183 116 67
5D. ALL OTHER CRASHES Total Fatal Injury P.D.O.Coll-isionWith
Coll-isionWith
1. Other rd veh or railway train 11 135 146 2. Fixed object 53 28 2 83 3. Other object or animal 1 1 4. Overturning 1 3 4 5. Other noncollision 2 2 6. Other rd veh or railway train 5 61 66 7. Fixed object 192 158 5 355 8. Other object or animal 17 9 26 9. Overturning 5 16 2 23 10. Other noncollision 7 3 1 11 11. Not statedTotals 292415 10 717
6. PEDESTRIAN ACTION BY AGE
Ages of Pedstrians Killed and InjuredPedestrians Killed Total 0 to 4 5 to 9 10 to 14 15 to 19 20 to 24 25 to 44 45 to 64 65 & older Not stated
1a. X-ing at intersect or X-walk 9 11 42 34 9 15 4 1 2 127 6 1b. X-ing not at intersection 2 1 7 12 7 6 6 1 2 44 2a. Walking in road with traffic 1 1 2 2b. Same against traffic 2 2 3. Standing in roadway 1 2 1 4 4. Push or work on veh in road 5. Other working in roadway 1 1 6. Playing in roadway 1 1 7. Other in roadway 1 1 1 1 4 8. Not in roadway 1 3 7 2 2 15 9. Not stated
1214 55 581924113 4 200 6 Totals
7. AGE OF DRIVER All Crashes Fatal Injury 1. 14 & YOUNGER 1 2. 15 10 1 4 3. 16 135 53 4. 17 232 102 5. 18 374 193 6. 19 362 172 7. 20 391 193 8. 21 387 1 190 9. 22 to 24 1,239 3 597 10. 25 to 34 3,870 9 1,822 11. 35 to 44 3,382 7 1,544 12. 45 to 54 3,092 8 1,328 13. 55 to 64 2,152 6 914 14. 65 to 74 757 2 296 15. 75 & older 560 1 217 16. Not stated 2,748 437 Totals 19,692 38 8,062 8. SEX OF DRIVER Injury Fatal All Crashes
1. Male 10,828 29 4,283 2. Female 8,152 9 3,556 3. Not stated 712 223 Totals 19,692 38 8,062
9. RESIDENCE OF DRIVER All Crashes Fatal Injury
1. Local resident 15,522 31 6,605 2. In-state resident 754 2 344 3. Non resident 1,694 5 676 4. Not stated 1,722 437 Totals 19,692 38 8,062
10. CRASHES BY CONTRIBUTING FACTOR All InjuryFatal1. Speed too fast
1,611 21 15
369 124
7. Followed too closely 3,666 2 1 3 1
94 45
830 250
6. Improper overtaking5. Drove left of center4. Disregard traffic signal3. Passed stop sign2. Failed to yield 2,265 7 1,006
282 12 598
8. Made improper turn
Totals 11,412 47 4,747 576
29 391 157 166
2 1 8
10
1,528 66
1,210 287 573
12. Other 11. Mechanical defect10. Improper driving9. Had been drinking
12. ROAD SURFACECONDITION InjuryFatalAll
1. Dry 6,960 16 2,8832. Wet 2,628 8 1,1073. Snowy or icy 81 1 354. Other 5. Not stated 216 1 13Totals 9,885 26 4,038
13. LIGHT CONDITION InjuryFatalAll1. Daylight 7,250 10 2,9412. Dawn or Dusk 401 2 1673. Darkness 2,212 14 9274. Not stated 22 3Totals 9,885 26 4,038
11. VEHICLE TYPE InjuryFatalAll1. Passenger car 19,315 33 7,8342. Pass Car and trailer 62 173. Truck or truck tractor 157 1 654. Truck tractor with semi-trailer 315 2 985. Other truck combination 6 26. Farm tractor and/or equip. 7. Taxicab 36 208. Bus 102 1 429. School bus 25 310. Motorcycle 93 4 7211. Motor scooter or moped 19 1412. Others and not stated 55 20Totals 20,185 41 8,187Special vehicles included above 13. Log trucks14. Emergency (incl. private) 73 1 3015. Military vehicles 16. Other public vehicles 153 1 52
143 151 56 56 67 67 123 123 1. Primary State Highways 43 52 25 25 20 20 45 45 2. Secondary State Highways 78 129 85 85 36 36 121 121 3. County and Local Roads
4. City Streets 5. Not Stated
264 332 166 166 123 123 289 289 Total--Rural Area
NOTE: THIS YEAR TO DATE represents only those crashes entered onto the database as of the date above. SAME PERIOD LAST YEAR represents all crashes including late reports. MAJOR INJURIES are incapacitating injuries. MINOR INJURIES are non-incapacitating evident injuries.
3. LOCATION Total
PropertyDamage
Nonfatal Injury Fatal Property
DamageNonfatal
InjuryFatalTotalPropertyDamage
Nonfatal Injury Fatal Total Killed Injured
Total On Roadway TotalOff Roadway Number Of Crashes Number Of Persons
1. Below 1,000 2. 1,000 to 2,500 3. 2,501 to 5,000 4. 5,001 to 10,000 5. 10,001 to 25,000 6. 25,001 to 50,000 7. 50,001 to 100,000 8. 100,001 to 200,000 9. City of Portland Only Total - Municipalities
1 3 5
16 12 35
7 26
1 3 5
16 12 35
7 26
105 105
3 3 4 4
11 11 9 9
25 25 6 6
16 16 74 74
1 1
1 1 5 5 3 3
10 10 1 1
10 10 31 31
1 1 1 4 3 6 4 16
19 14 29 41
4 10 11 27 72 119
40 60 15 15 40 40 55 55 1. Primary State Highways 7 11 6 6 6 6 2. Secondary State Highways 1 11 4 4 5 5 9 9 3. County and Local Roads
31 63 21 21 37 37 58 58 4. City Streets 5. Not Stated Total--Urban Area 79145 40 408888 128 128 6. Interstate System 13 13 7 7 6 6 13 67. Other State Freeways 3 3 3 8 38. Other State Highways 45 45 36 36 9 9 50 38Total--Urban System 61 61 46 46 15 15 71 47
6. Interstate System 25 25 8 8 17 17 25 317. Other State Freeways 8. Other State Highways 143 143 79 79 64 64 178 155Total--Rural System 168 168 87 87 81 81 203 186
June 1, 2007
STATE OF OREGON
38
At I
nter
sect
ion
Not
at I
nter
sect
ion
At
Inte
r. N
on -I
nter
.
STATE OF OREGON 2006 FATAL CRASHES
4. AGE OF CASUALTY
Number of Persons Killed Number of Persons Injured Total Killed Pedestrians Pedalcyclist Total Injured Pedestrians Pedalcyclist
Total Total Total Total Total TotalMale Male Male Male Male MaleFemale Female Female Female Female Female1. 0 to 4 1 1 7 7 14 9 4 5 3 1 2 2. 5 to 9 6 9 15 8 6 2 1 1 3. 10 to 14 7 7 14 6 2 4 1 1 4. 15 to 19 1 1 20 28 48 49 27 22 2 1 1 5. 20 to 24 10 38 48 66 53 13 1 1 6. 25 to 34 1 1 27 38 65 67 51 16 8 4 4 1 17. 35 to 44 11 28 39 63 41 22 6 3 3 2 28. 45 to 54 17 27 44 90 65 25 7 7 4 3 19. 55 to 64 10 17 27 47 35 12 5 5 4 3 110. 65 to 74 7 9 16 39 24 15 7 1 6 2 211. 75 & older 5 4 9 33 18 15 7 3 4 1 112. Not-stated 2 2 4Totals 477 326 151 48 26 22 14 11 3 343 214 129 3 3
Directional Analysis - A crash consisting of a series of collisions, overturning, etc., is classified according to the first damage or injury producing event; includes on roadway and off roadway.5A. MULTIPLE VEH CRASH Total Fatal Injury P.D.O.
Junction1. Car go straight 40 40 8 322. Car turning right 2 2 1 13. Car turning left 2 2 2 4. Car backing 3 3 35. All othersTotals 47 47 11 36
5D. ALL OTHER CRASHES Total Fatal Injury P.D.O.Coll-isionWith
Coll-isionWith
1. Other rd veh or railway train 4 4 2. Fixed object 4 4 3. Other object or animal4. Overturning 2 2 5. Other noncollision 1 1 6. Other rd veh or railway train 8 8 7. Fixed object 166 166 8. Other object or animal 6 6 9. Overturning 25 25 10. Other noncollision 9 9 11. Not statedTotals 225 225
6. PEDESTRIAN ACTION BY AGE
Ages of Pedstrians Killed and InjuredPedestrians Killed Total 0 to 4 5 to 9 10 to 14 15 to 19 20 to 24 25 to 44 45 to 64 65 & older Not stated
1a. X-ing at intersect or X-walk 8 1 3 1 2 15 13 1b. X-ing not at intersection 5 4 3 1 13 13 2a. Walking in road with traffic 1 2 3 3 2b. Same against traffic 3. Standing in roadway 2 2 1 1 6 6 4. Push or work on veh in road 5. Other working in roadway 6. Playing in roadway 1 1 2 2 7. Other in roadway 2 1 1 4 4 8. Not in roadway 1 2 3 1 1 8 7 9. Not stated
14 12 151311 4 51 48 Totals
7. AGE OF DRIVER All Crashes Fatal Injury 1. 14 & YOUNGER 1 1 2. 15 2 2 3. 16 4 4 4. 17 11 11 5. 18 18 18 6. 19 19 19 7. 20 16 16 8. 21 20 20 9. 22 to 24 53 53 10. 25 to 34 107 107 11. 35 to 44 86 86 12. 45 to 54 116 116 13. 55 to 64 73 73 14. 65 to 74 42 42 15. 75 & older 26 26 16. Not stated 3 3 Totals 597 597 8. SEX OF DRIVER Injury Fatal All Crashes
1. Male 438 438 2. Female 157 157 3. Not stated 2 2 Totals 597 597
9. RESIDENCE OF DRIVER All Crashes Fatal Injury
1. Local resident 410 410 2. In-state resident 104 104 3. Non resident 75 75 4. Not stated 8 8 Totals 597 597
10. CRASHES BY CONTRIBUTING FACTOR All InjuryFatal1. Speed too fast
7. Followed too closely 8 8 15 52
8 8
15 52
8 8
6. Improper overtaking5. Drove left of center4. Disregard traffic signal3. Passed stop sign2. Failed to yield 42 42
187 187
8. Made improper turn
Totals 644 644 35
5 122 158
4
35 5
122 158
4
12. Other 11. Mechanical defect10. Improper driving9. Had been drinking
12. ROAD SURFACECONDITION InjuryFatalAll
1. Dry 282 2822. Wet 93 933. Snowy or icy 22 224. Other 5. Not stated 20 20Totals 417 417
13. LIGHT CONDITION InjuryFatalAll1. Daylight 226 2262. Dawn or Dusk 28 283. Darkness 157 1574. Not stated 6 6Totals 417 417
11. VEHICLE TYPE InjuryFatalAll1. Passenger car 487 4872. Pass Car and trailer 9 93. Truck or truck tractor 11 114. Truck tractor with semi-trailer 40 405. Other truck combination 1 16. Farm tractor and/or equip. 2 27. Taxicab8. Bus 1 19. School bus 1 110. Motorcycle 44 4411. Motor scooter or moped 12. Others and not stated 7 7Totals 603 603Special vehicles included above 13. Log trucks 8 814. Emergency (incl. private) 4 415. Military vehicles 16. Other public vehicles 5 5
142 150 55 55 67 67 122 122 1. Primary State Highways 43 52 25 25 20 20 45 45 2. Secondary State Highways 78 129 85 85 36 36 121 121 3. County and Local Roads
4. City Streets 5. Not Stated
263 331 165 165 123 123 288 288 Total--Rural Area
NOTE: THIS YEAR TO DATE represents only those crashes entered onto the database as of the date above. SAME PERIOD LAST YEAR represents all crashes including late reports. MAJOR INJURIES are incapacitating injuries. MINOR INJURIES are non-incapacitating evident injuries.
3. LOCATION Total
PropertyDamage
Nonfatal Injury Fatal Property
DamageNonfatal
InjuryFatalTotalPropertyDamage
Nonfatal Injury Fatal Total Killed Injured
Total On Roadway TotalOff Roadway Number Of Crashes Number Of Persons
1. Below 1,000 2. 1,000 to 2,500 3. 2,501 to 5,000 4. 5,001 to 10,000 5. 10,001 to 25,000 6. 25,001 to 50,000 7. 50,001 to 100,000 8. 100,001 to 200,000 9. City of Portland Only Total - Municipalities 1. Primary State Highways 2. Secondary State Highways 3. County and Local Roads 4. City Streets 5. Not Stated Total--Urban Area 6. Interstate System 7. Other State Freeways 8. Other State Highways Total--Urban System
6. Interstate System 24 24 8 8 16 16 24 307. Other State Freeways 8. Other State Highways 143 143 79 79 64 64 178 155Total--Rural System 167 167 87 87 80 80 202 185
June 1, 2007
OREGON RURAL AREAS
40
At I
nter
sect
ion
Not
at I
nter
sect
ion
At
Inte
r. N
on -I
nter
.
OREGON RURAL AREAS 2006 FATAL CRASHES
4. AGE OF CASUALTY
Number of Persons Killed Number of Persons Injured Total Killed Pedestrians Pedalcyclist Total Injured Pedestrians Pedalcyclist
Total Total Total Total Total TotalMale Male Male Male Male MaleFemale Female Female Female Female Female1. 0 to 4 3 6 9 4 2 22. 5 to 9 5 8 13 6 4 23. 10 to 14 5 7 12 5 2 34. 15 to 19 15 22 37 38 23 155. 20 to 24 8 28 36 44 34 106. 25 to 34 18 25 43 45 34 11 3 3 7. 35 to 44 11 16 27 47 30 17 1 1 1 18. 45 to 54 13 24 37 64 46 18 3 3 1 19. 55 to 64 7 15 22 31 22 9 2 2 1 110. 65 to 74 6 8 14 25 16 9 2 2 11. 75 & older 5 4 9 22 13 9 2 1 1 1 112. Not-stated 2 2 4Totals 331 226 105 13 6 7 4 2 2 263 165 98
Directional Analysis - A crash consisting of a series of collisions, overturning, etc., is classified according to the first damage or injury producing event; includes on roadway and off roadway.5A. MULTIPLE VEH CRASH Total Fatal Injury P.D.O.
1. Entering at angle 9 9 2a. Same dir.- both straight 2b. Same-1 turn, 1 straight 2c. Same-one stopped 2d. Same-all others 3a. Opposite dir.- both straight 1 1 3b. Opposite-1 turn, 1 straight 4 4 3c. Opposite-all others 4. Not stated Totals 14 14
5B. MULTIPLE VEH CRASH Total Fatal Injury P.D.O. 71 711. Moving in opposite dir.
6 62. Both moving in same dir. 1 13a. One car parked 3 33b. One car stopped in traffic
5b. Leaving driveway/alley 6. All others Totals 82 82
5C. PEDESTRIANCRASHES
All PedCrashes
Fatal Crashes Non-Fatal Injury Crashes
TotalAt
Intersection Non-
Junction TotalAt
IntersectionNon-
Junction1. Car go straight 10 10 10 2. Car turning right 3. Car turning left 4. Car backing 2 2 2 5. All othersTotals 12 12 12
5D. ALL OTHER CRASHES Total Fatal Injury P.D.O.Coll-isionWith
Coll-isionWith
1. Other rd veh or railway train 2 2 2. Fixed object 1 1 3. Other object or animal4. Overturning 1 1 5. Other noncollision6. Other rd veh or railway train 3 3 7. Fixed object 141 141 8. Other object or animal 6 6 9. Overturning 22 22 10. Other noncollision 4 4 11. Not statedTotals 180 180
6. PEDESTRIAN ACTION BY AGE
Ages of Pedstrians Killed and InjuredPedestrians Killed Total 0 to 4 5 to 9 10 to 14 15 to 19 20 to 24 25 to 44 45 to 64 65 & older Not stated
1a. X-ing at intersect or X-walk 1b. X-ing not at intersection 3 1 4 4 2a. Walking in road with traffic 1 2 3 3 2b. Same against traffic 3. Standing in roadway 1 1 1 4. Push or work on veh in road 5. Other working in roadway 6. Playing in roadway 7. Other in roadway 1 1 1 8. Not in roadway 1 2 1 4 4 9. Not stated
4 5 4 13 13 Totals
7. AGE OF DRIVER All Crashes Fatal Injury 1. 14 & YOUNGER 1 1 2. 15 1 1 3. 16 4 4 4. 17 9 9 5. 18 12 12 6. 19 14 14 7. 20 11 11 8. 21 12 12 9. 22 to 24 33 33 10. 25 to 34 65 65 11. 35 to 44 57 57 12. 45 to 54 82 82 13. 55 to 64 51 51 14. 65 to 74 31 31 15. 75 & older 19 19 16. Not stated 2 2 Totals 404 404 8. SEX OF DRIVER Injury Fatal All Crashes
1. Male 307 307 2. Female 96 96 3. Not stated 1 1 Totals 404 404
9. RESIDENCE OF DRIVER All Crashes Fatal Injury
1. Local resident 258 258 2. In-state resident 90 90 3. Non resident 54 54 4. Not stated 2 2 Totals 404 404
10. CRASHES BY CONTRIBUTING FACTOR All InjuryFatal1. Speed too fast
7. Followed too closely 2 2 10 41
1 3
10 41
1 3
6. Improper overtaking5. Drove left of center4. Disregard traffic signal3. Passed stop sign2. Failed to yield 18 18
144 144
8. Made improper turn
Totals 430 430 20
3 85
100 3
20 3
85 100
3
12. Other 11. Mechanical defect10. Improper driving9. Had been drinking
12. ROAD SURFACECONDITION InjuryFatalAll
1. Dry 188 1882. Wet 67 673. Snowy or icy 20 204. Other 5. Not stated 13 13Totals 288 288
13. LIGHT CONDITION InjuryFatalAll1. Daylight 171 1712. Dawn or Dusk 19 193. Darkness 93 934. Not stated 5 5Totals 288 288
11. VEHICLE TYPE InjuryFatalAll1. Passenger car 327 3272. Pass Car and trailer 7 73. Truck or truck tractor 7 74. Truck tractor with semi-trailer 26 265. Other truck combination 1 16. Farm tractor and/or equip. 2 27. Taxicab8. Bus9. School bus 1 110. Motorcycle 31 3111. Motor scooter or moped 12. Others and not stated 3 3Totals 405 405Special vehicles included above 13. Log trucks 7 714. Emergency (incl. private) 1 115. Military vehicles 16. Other public vehicles 4 4
1 1 1 1 1 1 1. Primary State Highways 2. Secondary State Highways 3. County and Local Roads 4. City Streets 5. Not Stated
1 1 1 1 1 1 Total--Rural Area
NOTE: THIS YEAR TO DATE represents only those crashes entered onto the database as of the date above. SAME PERIOD LAST YEAR represents all crashes including late reports. MAJOR INJURIES are incapacitating injuries. MINOR INJURIES are non-incapacitating evident injuries.
3. LOCATION Total
PropertyDamage
Nonfatal Injury Fatal Property
DamageNonfatal
InjuryFatalTotalPropertyDamage
Nonfatal Injury Fatal Total Killed Injured
Total On Roadway TotalOff Roadway Number Of Crashes Number Of Persons
1. Below 1,000 2. 1,000 to 2,500 3. 2,501 to 5,000 4. 5,001 to 10,000 5. 10,001 to 25,000 6. 25,001 to 50,000 7. 50,001 to 100,000 8. 100,001 to 200,000 9. City of Portland Only Total - Municipalities
1 3 5
16 12 35
7 26
1 3 5
16 12 35
7 26
105 105
3 3 4 4
11 11 9 9
25 25 6 6
16 16 74 74
1 1
1 1 5 5 3 3
10 10 1 1
10 10 31 31
1 1 1 4 3 6 4 16
19 14 29 41
4 10 11 27 72 119
40 60 15 15 40 40 55 55 1. Primary State Highways 7 11 6 6 6 6 2. Secondary State Highways 1 11 4 4 5 5 9 9 3. County and Local Roads
31 63 21 21 37 37 58 58 4. City Streets 5. Not Stated Total--Urban Area 79145 40 408888 128 128 6. Interstate System 13 13 7 7 6 6 13 67. Other State Freeways 3 3 3 8 38. Other State Highways 45 45 36 36 9 9 50 38Total--Urban System 61 61 46 46 15 15 71 47
6. Interstate System 1 1 1 1 1 17. Other State Freeways 8. Other State Highways Total--Rural System 1 1 1 1 1 1
June 1, 2007
OREGON CITIES AND URBAN AREAS
42
At I
nter
sect
ion
Not
at I
nter
sect
ion
At
Inte
r. N
on -I
nter
.
OREGON CITIES AND URBAN AREAS 2006 FATAL CRASHES
4. AGE OF CASUALTY
Number of Persons Killed Number of Persons Injured Total Killed Pedestrians Pedalcyclist Total Injured Pedestrians Pedalcyclist
Total Total Total Total Total TotalMale Male Male Male Male MaleFemale Female Female Female Female Female1. 0 to 4 1 1 4 1 5 5 2 3 3 1 2 2. 5 to 9 1 1 2 2 2 1 1 3. 10 to 14 2 2 1 1 1 1 4. 15 to 19 1 1 5 6 11 11 4 7 2 1 1 5. 20 to 24 2 10 12 22 19 3 1 1 6. 25 to 34 1 1 9 13 22 22 17 5 5 4 1 1 17. 35 to 44 12 12 16 11 5 5 3 2 1 18. 45 to 54 4 3 7 26 19 7 4 4 3 39. 55 to 64 3 2 5 16 13 3 3 3 3 2 110. 65 to 74 1 1 2 14 8 6 5 1 4 2 211. 75 & older 11 5 6 5 2 3 12. Not-stated Totals 146 100 46 35 20 15 10 9 1 80 49 31 3 3
Directional Analysis - A crash consisting of a series of collisions, overturning, etc., is classified according to the first damage or injury producing event; includes on roadway and off roadway.5A. MULTIPLE VEH CRASH Total Fatal Injury P.D.O.
1. Entering at angle 14 14 2a. Same dir.- both straight 1 1 2b. Same-1 turn, 1 straight 1 1 2c. Same-one stopped 3 3 2d. Same-all others 3a. Opposite dir.- both straight 1 1 3b. Opposite-1 turn, 1 straight 3c. Opposite-all others 4. Not stated Totals 20 20
5B. MULTIPLE VEH CRASH Total Fatal Injury P.D.O. 16 161. Moving in opposite dir.
5 52. Both moving in same dir. 1 13a. One car parked 4 43b. One car stopped in traffic
Junction1. Car go straight 30 30 8 222. Car turning right 2 2 1 13. Car turning left 2 2 2 4. Car backing 1 1 15. All othersTotals 35 35 11 24
5D. ALL OTHER CRASHES Total Fatal Injury P.D.O.Coll-isionWith
Coll-isionWith
1. Other rd veh or railway train 2 2 2. Fixed object 3 3 3. Other object or animal4. Overturning 1 1 5. Other noncollision 1 1 6. Other rd veh or railway train 5 5 7. Fixed object 25 25 8. Other object or animal9. Overturning 3 3 10. Other noncollision 5 5 11. Not statedTotals 45 45
6. PEDESTRIAN ACTION BY AGE
Ages of Pedstrians Killed and InjuredPedestrians Killed Total 0 to 4 5 to 9 10 to 14 15 to 19 20 to 24 25 to 44 45 to 64 65 & older Not stated
1a. X-ing at intersect or X-walk 8 1 3 1 2 15 13 1b. X-ing not at intersection 2 3 3 1 9 9 2a. Walking in road with traffic 2b. Same against traffic 3. Standing in roadway 2 1 1 1 5 5 4. Push or work on veh in road 5. Other working in roadway 6. Playing in roadway 1 1 2 2 7. Other in roadway 1 1 1 3 3 8. Not in roadway 2 1 1 4 3 9. Not stated
10 7 111311 4 38 35 Totals
7. AGE OF DRIVER All Crashes Fatal Injury 1. 14 & younger 2. 15 1 1 3. 16 4. 17 2 2 5. 18 6 6 6. 19 5 5 7. 20 5 5 8. 21 8 8 9. 22 to 24 20 20 10. 25 to 34 42 42 11. 35 to 44 29 29 12. 45 to 54 34 34 13. 55 to 64 22 22 14. 65 to 74 11 11 15. 75 & older 7 7 16. Not stated 1 1 Totals 193 193 8. SEX OF DRIVER Injury Fatal All Crashes
1. Male 131 131 2. Female 61 61 3. Not stated 1 1 Totals 193 193
9. RESIDENCE OF DRIVER All Crashes Fatal Injury
1. Local resident 152 152 2. In-state resident 14 14 3. Non resident 21 21 4. Not stated 6 6 Totals 193 193
10. CRASHES BY CONTRIBUTING FACTOR All InjuryFatal1. Speed too fast
7. Followed too closely 6 6 5
11 7 5
5 11
7 5
6. Improper overtaking5. Drove left of center4. Disregard traffic signal3. Passed stop sign2. Failed to yield 24 24
43 43
8. Made improper turn
Totals 214 214 15
2 37 58
1
15 2
37 58
1
12. Other 11. Mechanical defect10. Improper driving9. Had been drinking
12. ROAD SURFACECONDITION InjuryFatalAll
1. Dry 94 942. Wet 26 263. Snowy or icy 2 24. Other 5. Not stated 7 7Totals 129 129
13. LIGHT CONDITION InjuryFatalAll1. Daylight 55 552. Dawn or Dusk 9 93. Darkness 64 644. Not stated 1 1Totals 129 129
11. VEHICLE TYPE InjuryFatalAll1. Passenger car 160 1602. Pass Car and trailer 2 23. Truck or truck tractor 4 44. Truck tractor with semi-trailer 14 145. Other truck combination 6. Farm tractor and/or equip. 7. Taxicab8. Bus 1 19. School bus10. Motorcycle 13 1311. Motor scooter or moped 12. Others and not stated 4 4Totals 198 198Special vehicles included above 13. Log trucks 1 114. Emergency (incl. private) 3 315. Military vehicles 16. Other public vehicles 1 1
1 1 1 1 1 1 1. Primary State Highways 2. Secondary State Highways 3. County and Local Roads 4. City Streets 5. Not Stated
1 1 1 1 1 1 Total--Rural Area
NOTE: THIS YEAR TO DATE represents only those crashes entered onto the database as of the date above. SAME PERIOD LAST YEAR represents all crashes including late reports. MAJOR INJURIES are incapacitating injuries. MINOR INJURIES are non-incapacitating evident injuries.
3. LOCATION Total
PropertyDamage
Nonfatal Injury Fatal Property
DamageNonfatal
InjuryFatalTotalPropertyDamage
Nonfatal Injury Fatal Total Killed Injured
Total On Roadway TotalOff Roadway Number Of Crashes Number Of Persons
1. Below 1,000 2. 1,000 to 2,500 3. 2,501 to 5,000 4. 5,001 to 10,000 5. 10,001 to 25,000 6. 25,001 to 50,000 7. 50,001 to 100,000 8. 100,001 to 200,000 9. City of Portland Only Total - Municipalities
3. County and Local Roads 28 49 16 16 29 29 45 45 4. City Streets
5. Not Stated Total--Urban Area 6091 20 205858 78 78 6. Interstate System 6 6 5 5 1 1 6 37. Other State Freeways 3 3 3 8 38. Other State Highways 24 24 21 21 3 3 28 26Total--Urban System 33 33 29 29 4 4 42 32
6. Interstate System 1 1 1 1 1 17. Other State Freeways 8. Other State Highways Total--Rural System 1 1 1 1 1 1
June 1, 2007
ALL CITIES EXCEPT PORTLAND
44
At I
nter
sect
ion
Not
at I
nter
sect
ion
At
Inte
r. N
on -I
nter
.
ALL CITIES EXCEPT PORTLAND 2006 FATAL CRASHES
4. AGE OF CASUALTY
Number of Persons Killed Number of Persons Injured Total Killed Pedestrians Pedalcyclist Total Injured Pedestrians Pedalcyclist
Total Total Total Total Total TotalMale Male Male Male Male MaleFemale Female Female Female Female Female1. 0 to 4 3 1 4 4 2 2 2 1 1 2. 5 to 9 1 1 2 2 2 1 1 3. 10 to 14 2 24. 15 to 19 1 1 5 4 9 6 2 45. 20 to 24 2 7 9 18 15 3 1 1 6. 25 to 34 7 10 17 8 6 2 1 1 7. 35 to 44 8 8 11 7 4 5 3 2 1 18. 45 to 54 3 2 5 16 11 5 3 3 2 29. 55 to 64 1 2 3 12 10 2 2 2 2 210. 65 to 74 1 1 2 8 4 4 3 1 2 11. 75 & older 7 3 4 3 2 1 12. Not-stated Totals 92 62 30 21 14 7 5 5 61 36 25 1 1
Directional Analysis - A crash consisting of a series of collisions, overturning, etc., is classified according to the first damage or injury producing event; includes on roadway and off roadway.5A. MULTIPLE VEH CRASH Total Fatal Injury P.D.O.
1. Entering at angle 13 13 2a. Same dir.- both straight 1 1 2b. Same-1 turn, 1 straight 2c. Same-one stopped 2 2 2d. Same-all others 3a. Opposite dir.- both straight 1 1 3b. Opposite-1 turn, 1 straight 3c. Opposite-all others 4. Not stated Totals 17 17
5B. MULTIPLE VEH CRASH Total Fatal Injury P.D.O. 6 61. Moving in opposite dir. 3 32. Both moving in same dir.
3a. One car parked 3 33b. One car stopped in traffic
Junction1. Car go straight 18 18 3 152. Car turning right 2 2 1 13. Car turning left4. Car backing 1 1 15. All othersTotals 21 21 4 17
5D. ALL OTHER CRASHES Total Fatal Injury P.D.O.Coll-isionWith
Coll-isionWith
1. Other rd veh or railway train 2 2 2. Fixed object 1 1 3. Other object or animal4. Overturning 1 1 5. Other noncollision 1 1 6. Other rd veh or railway train 3 3 7. Fixed object 13 13 8. Other object or animal9. Overturning 1 1 10. Other noncollision 4 4 11. Not statedTotals 26 26
6. PEDESTRIAN ACTION BY AGE
Ages of Pedstrians Killed and InjuredPedestrians Killed Total 0 to 4 5 to 9 10 to 14 15 to 19 20 to 24 25 to 44 45 to 64 65 & older Not stated
1a. X-ing at intersect or X-walk 5 1 6 6 1b. X-ing not at intersection 1 2 3 1 7 7 2a. Walking in road with traffic 2b. Same against traffic 3. Standing in roadway 1 1 2 2 4. Push or work on veh in road 5. Other working in roadway 6. Playing in roadway 1 1 1 7. Other in roadway 1 1 1 3 3 8. Not in roadway 2 1 3 2 9. Not stated
6 5 6111 2 22 21 Totals
7. AGE OF DRIVER All Crashes Fatal Injury 1. 14 & younger 2. 15 3. 16 4. 17 2 2 5. 18 4 4 6. 19 3 3 7. 20 5 5 8. 21 6 6 9. 22 to 24 14 14 10. 25 to 34 25 25 11. 35 to 44 17 17 12. 45 to 54 22 22 13. 55 to 64 11 11 14. 65 to 74 8 8 15. 75 & older 5 5 16. Not stated 1 1 Totals 123 123 8. SEX OF DRIVER Injury Fatal All Crashes
1. Male 81 81 2. Female 41 41 3. Not stated 1 1 Totals 123 123
9. RESIDENCE OF DRIVER All Crashes Fatal Injury
1. Local resident 95 95 2. In-state resident 10 10 3. Non resident 12 12 4. Not stated 6 6 Totals 123 123
10. CRASHES BY CONTRIBUTING FACTOR All InjuryFatal1. Speed too fast
7. Followed too closely 3 3 1 4 6 5
1 4 6 5
6. Improper overtaking5. Drove left of center4. Disregard traffic signal3. Passed stop sign2. Failed to yield 15 15
26 26
8. Made improper turn
Totals 127 127 10
1 20 35
1
10 1
20 35
1
12. Other 11. Mechanical defect10. Improper driving9. Had been drinking
12. ROAD SURFACECONDITION InjuryFatalAll
1. Dry 57 572. Wet 16 163. Snowy or icy 1 14. Other 5. Not stated 5 5Totals 79 79
13. LIGHT CONDITION InjuryFatalAll1. Daylight 33 332. Dawn or Dusk 4 43. Darkness 41 414. Not stated 1 1Totals 79 79
11. VEHICLE TYPE InjuryFatalAll1. Passenger car 99 992. Pass Car and trailer 1 13. Truck or truck tractor 3 34. Truck tractor with semi-trailer 10 105. Other truck combination 6. Farm tractor and/or equip. 7. Taxicab 8. Bus 9. School bus10. Motorcycle 8 811. Motor scooter or moped 12. Others and not stated 4 4Totals 125 125Special vehicles included above 13. Log trucks 1 114. Emergency (incl. private) 2 215. Military vehicles 16. Other public vehicles
1. Primary State Highways 2. Secondary State Highways 3. County and Local Roads 4. City Streets 5. Not Stated Total--Rural Area
NOTE: THIS YEAR TO DATE represents only those crashes entered onto the database as of the date above. SAME PERIOD LAST YEAR represents all crashes including late reports. MAJOR INJURIES are incapacitating injuries. MINOR INJURIES are non-incapacitating evident injuries.
3. LOCATION Total
PropertyDamage
Nonfatal Injury Fatal Property
DamageNonfatal
InjuryFatalTotalPropertyDamage
Nonfatal Injury Fatal Total Killed Injured
Total On Roadway TotalOff Roadway Number Of Crashes Number Of Persons
1. Below 1,000 2. 1,000 to 2,500 3. 2,501 to 5,000 4. 5,001 to 10,000 5. 10,001 to 25,000 6. 25,001 to 50,000 7. 50,001 to 100,000 8. 100,001 to 200,000 9. City of Portland Only Total - Municipalities
3. County and Local Roads 3 14 5 5 8 8 13 13 4. City Streets
5. Not Stated Total--Urban Area 1127 10 101616 26 26 6. Interstate System 4 4 1 1 3 3 4 37. Other State Freeways 8. Other State Highways 9 9 7 7 2 2 9 5Total--Urban System 13 13 8 8 5 5 13 8
6. Interstate System 7. Other State Freeways 8. Other State Highways Total--Rural System
June 1, 2007
PORTLAND
46
At I
nter
sect
ion
Not
at I
nter
sect
ion
At
Inte
r. N
on -I
nter
.
PORTLAND 2006 FATAL CRASHES
4. AGE OF CASUALTY
Number of Persons Killed Number of Persons Injured Total Killed Pedestrians Pedalcyclist Total Injured Pedestrians Pedalcyclist
Total Total Total Total Total TotalMale Male Male Male Male MaleFemale Female Female Female Female Female1. 0 to 4 2. 5 to 9 3. 10 to 14 4. 15 to 19 1 1 1 1 5. 20 to 24 3 3 2 2 6. 25 to 34 1 1 1 3 4 8 6 2 2 1 1 7. 35 to 44 1 1 5 4 18. 45 to 54 1 1 2 6 4 29. 55 to 64 1 110. 65 to 74 3 1 2 2 2 11. 75 & older 2 1 1 1 1 12. Not-stated Totals 27 18 9 6 1 5 11 8 3 1 1
Directional Analysis - A crash consisting of a series of collisions, overturning, etc., is classified according to the first damage or injury producing event; includes on roadway and off roadway.5A. MULTIPLE VEH CRASH Total Fatal Injury P.D.O.
1. Entering at angle 1 1 2a. Same dir.- both straight 2b. Same-1 turn, 1 straight 1 1 2c. Same-one stopped 2d. Same-all others 3a. Opposite dir.- both straight 3b. Opposite-1 turn, 1 straight 3c. Opposite-all others 4. Not stated Totals 2 2
5B. MULTIPLE VEH CRASH Total Fatal Injury P.D.O. 5 51. Moving in opposite dir. 1 12. Both moving in same dir. 1 13a. One car parked 1 13b. One car stopped in traffic
Junction1. Car go straight 5 5 5 2. Car turning right3. Car turning left 1 1 1 4. Car backing5. All othersTotals 6 6 6
5D. ALL OTHER CRASHES Total Fatal Injury P.D.O.Coll-isionWith
Coll-isionWith
1. Other rd veh or railway train2. Fixed object 2 2 3. Other object or animal4. Overturning 5. Other noncollision 6. Other rd veh or railway train7. Fixed object 5 5 8. Other object or animal9. Overturning 2 2 10. Other noncollision 1 1 11. Not statedTotals 10 10
6. PEDESTRIAN ACTION BY AGE
Ages of Pedstrians Killed and InjuredPedestrians Killed Total 0 to 4 5 to 9 10 to 14 15 to 19 20 to 24 25 to 44 45 to 64 65 & older Not stated
1a. X-ing at intersect or X-walk 3 3 1 7 6 1b. X-ing not at intersection 2a. Walking in road with traffic 2b. Same against traffic 3. Standing in roadway 4. Push or work on veh in road 5. Other working in roadway 6. Playing in roadway 7. Other in roadway 8. Not in roadway 9. Not stated
3 31 7 6 Totals
7. AGE OF DRIVER All Crashes Fatal Injury 1. 14 & younger 2. 15 1 1 3. 16 4. 17 5. 18 6. 19 7. 20 8. 21 1 1 9. 22 to 24 3 3 10. 25 to 34 9 9 11. 35 to 44 7 7 12. 45 to 54 8 8 13. 55 to 64 6 6 14. 65 to 74 2 2 15. 75 & older 1 1 16. Not stated Totals 38 38 8. SEX OF DRIVER Injury Fatal All Crashes
1. Male 29 29 2. Female 9 9 3. Not stated Totals 38 38
9. RESIDENCE OF DRIVER All Crashes Fatal Injury
1. Local resident 31 31 2. In-state resident 2 2 3. Non resident 5 5 4. Not stated Totals 38 38
10. CRASHES BY CONTRIBUTING FACTOR All InjuryFatal1. Speed too fast
7. Followed too closely 2 2 1 3 1
1 3 1
6. Improper overtaking5. Drove left of center4. Disregard traffic signal3. Passed stop sign2. Failed to yield 7 7
12 12
8. Made improper turn
Totals 47 47 2 1 8
10
2 1 8
10
12. Other 11. Mechanical defect10. Improper driving9. Had been drinking
12. ROAD SURFACECONDITION InjuryFatalAll
1. Dry 16 162. Wet 8 83. Snowy or icy 1 14. Other 5. Not stated 1 1Totals 26 26
13. LIGHT CONDITION InjuryFatalAll1. Daylight 10 102. Dawn or Dusk 2 23. Darkness 14 144. Not statedTotals 26 26
11. VEHICLE TYPE InjuryFatalAll1. Passenger car 33 332. Pass Car and trailer 3. Truck or truck tractor 1 14. Truck tractor with semi-trailer 2 25. Other truck combination 6. Farm tractor and/or equip. 7. Taxicab8. Bus 1 19. School bus10. Motorcycle 4 411. Motor scooter or moped 12. Others and not stated Totals 41 41Special vehicles included above 13. Log trucks14. Emergency (incl. private) 1 115. Military vehicles 16. Other public vehicles 1 1
148 21 1 62 13 76 5 65 7 77 6 127 20 153 3. County and Local Roads 3 3 3 3 3 4. City Streets
5. Not Stated 360 32 4 139 16 159 13 150 14 177 17 289 30 336 Total--Rural Area
NOTE: THIS YEAR TO DATE represents only those crashes entered onto the database as of the date above. SAME PERIOD LAST YEAR represents all crashes including late reports. MAJOR INJURIES are incapacitating injuries. MINOR INJURIES are non-incapacitating evident injuries.
3. LOCATION Total
PropertyDamage
Nonfatal Injury Fatal Property
DamageNonfatal
InjuryFatalTotalPropertyDamage
Nonfatal Injury Fatal Total Killed Injured
Total On Roadway TotalOff Roadway Number Of Crashes Number Of Persons
1. Below 1,000 2. 1,000 to 2,500 3. 2,501 to 5,000 4. 5,001 to 10,000 5. 10,001 to 25,000 6. 25,001 to 50,000 7. 50,001 to 100,000 8. 100,001 to 200,000 9. City of Portland Only Total - Municipalities
1 1 1 1
2 6 4
4 12 21 42 36
109 44 92
361 12
3 1 11 1 17 4 36 4 34 2 88 15 37 7 71 17
297 52
1 1 2 9 1 10
14 4 18 31 4 35 28 2 30
4 77 13 94 31 6 37
4 63 16 83 8 254 47 309
2 2 2 2 3 3
2 5 7 6 6
2 11 2 15 6 1 7 8 1 9
4 43 5 52
3 16 19 41 2 39 96 6 46 80 4
340 12
111 2 1 11 12 12 85 2 99 13 96 2 111 1. Primary State Highways 22 2 2 3 16 19 3 18 21 2. Secondary State Highways 32 1 8 8 3 19 1 23 3 27 1 31 3. County and Local Roads
217 10 3 29 4 36 32 163 6 201 35 192 10 237 4. City Streets 5. Not Stated Total--Urban Area 382134 50 4 5850283934254 333 13 400 6. Interstate System 20 19 1 16 15 1 4 4 257. Other State Freeways 14 11 3 12 9 3 2 2 128. Other State Highways 98 2 84 12 90 77 11 8 7 1 2 96Total--Urban System 132 2 114 16 118 2 101 15 14 13 1 2 133
6. Interstate System 17 1 15 1 6 6 0 11 1 9 1 1 157. Other State Freeways 8. Other State Highways 163 9 144 10 94 7 79 8 69 2 65 2 10 194Total--Rural System 180 10 159 11 100 7 85 8 80 3 74 3 11 209
June 1, 2007
STATE OF OREGON
50
At I
nter
sect
ion
Not
at I
nter
sect
ion
At
Inte
r. N
on -I
nter
.
STATE OF OREGON 2006 MOTORCYCLE CRASHES
4. AGE OF CASUALTY
Number of Persons Killed Number of Persons Injured Total Killed Pedestrians Pedalcyclist Total Injured Pedestrians Pedalcyclist
Total Total Total Total Total TotalMale Male Male Male Male MaleFemale Female Female Female Female Female1. 0 to 4 1 1 22. 5 to 9 1 1 1 2 13. 10 to 14 2 1 1 3 1 44. 15 to 19 1 9 20 29 1 1 15. 20 to 24 5 63 68 6 6 6. 25 to 34 15 79 94 5 5 7. 35 to 44 1 1 35 109 144 6 4 28. 45 to 54 1 1 1 40 180 220 15 14 1 19. 55 to 64 1 11 114 125 10 10 1 1 110. 65 to 74 1 1 3 36 3911. 75 & older 3 9 12 2 2 12. Not-stated 2 1 3Totals 45 42 3 1 1 742 614 128 5 2 3 4 4
Directional Analysis - A crash consisting of a series of collisions, overturning, etc., is classified according to the first damage or injury producing event; includes on roadway and off roadway.5A. MULTIPLE VEH CRASH Total Fatal Injury P.D.O.
Junction1. Car go straight 5 5 1 42. Car turning right3. Car turning left 4. Car backing 5. All othersTotals 5 5 1 4
5D. ALL OTHER CRASHES Total Fatal Injury P.D.O.Coll-isionWith
Coll-isionWith
1. Other rd veh or railway train 2 1 3 2. Fixed object 7 7 3. Other object or animal 1 1 4. Overturning 2 17 19 5. Other noncollision 1 4 5 6. Other rd veh or railway train 2 2 7. Fixed object 4 139 15 158 8. Other object or animal 1 44 1 46 9. Overturning 9 68 6 83 10. Other noncollision 3 27 2 32 11. Not statedTotals 20311 25 356
6. PEDESTRIAN ACTION BY AGE
Ages of Pedstrians Killed and InjuredPedestrians Killed Total 0 to 4 5 to 9 10 to 14 15 to 19 20 to 24 25 to 44 45 to 64 65 & older Not stated
1a. X-ing at intersect or X-walk 1b. X-ing not at intersection 1 1 2 4 2a. Walking in road with traffic 2b. Same against traffic 3. Standing in roadway 1 1 4. Push or work on veh in road 5. Other working in roadway 6. Playing in roadway 7. Other in roadway 8. Not in roadway 9. Not stated
1 1 12 5 Totals
7. AGE OF DRIVER All Crashes Fatal Injury 1. 14 & younger 2. 15 2 2 3. 16 4 3 4. 17 13 1 12 5. 18 16 14 6. 19 20 2 14 7. 20 25 1 23 8. 21 24 2 18 9. 22 to 24 66 4 55 10. 25 to 34 172 9 143 11. 35 to 44 200 10 172 12. 45 to 54 300 20 246 13. 55 to 64 195 16 165 14. 65 to 74 55 50 15. 75 & older 20 2 16 16. Not stated 22 12 Totals 1,134 67 945 8. SEX OF DRIVER Injury Fatal All Crashes
1. Male 921 56 771 2. Female 201 11 166 3. Not stated 12 8 Totals 1,134 67 945
9. RESIDENCE OF DRIVER All Crashes Fatal Injury
1. Local resident 894 50 752 2. In-state resident 122 11 99 3. Non resident 101 5 85 4. Not stated 17 1 9 Totals 1,134 67 945
10. CRASHES BY CONTRIBUTING FACTOR All InjuryFatal1. Speed too fast
59 18 16 10
6
7. Followed too closely 77 3 4 3 1
26 19 13
6
6. Improper overtaking5. Drove left of center4. Disregard traffic signal3. Passed stop sign2. Failed to yield 155 8 132
224 22 259
8. Made improper turn
Totals 880 75 729 127
9 79 25 24
3
13 18
143 10
101 44 27
12. Other 11. Mechanical defect10. Improper driving9. Had been drinking
12. ROAD SURFACECONDITION InjuryFatalAll
1. Dry 674 32 5812. Wet 45 4 363. Snowy or icy 4 1 24. Other 5. Not stated 13 6 3Totals 736 43 622
13. LIGHT CONDITION InjuryFatalAll1. Daylight 599 33 5102. Dawn or Dusk 33 2 263. Darkness 102 7 854. Not stated 2 1 1Totals 736 43 622
11. VEHICLE TYPE InjuryFatalAll1. Passenger car 373 21 3032. Pass Car and trailer 3 33. Truck or truck tractor 3 1 24. Truck tractor with semi-trailer 2 1 15. Other truck combination 6. Farm tractor and/or equip. 1 17. Taxicab8. Bus 1 19. School bus10. Motorcycle 756 44 63911. Motor scooter or moped 12. Others and not stated 3 2Totals 1,142 67 952Special vehicles included above 13. Log trucks14. Emergency (incl. private) 8 715. Military vehicles 16. Other public vehicles 1 1
NOTE: THIS YEAR TO DATE represents only those crashes entered onto the database as of the date above. SAME PERIOD LAST YEAR represents all crashes including late reports. MAJOR INJURIES are incapacitating injuries. MINOR INJURIES are non-incapacitating evident injuries.
3. LOCATION Total
PropertyDamage
Nonfatal Injury Fatal Property
DamageNonfatal
InjuryFatalTotalPropertyDamage
Nonfatal Injury Fatal Total Killed Injured
Total On Roadway TotalOff Roadway Number Of Crashes Number Of Persons
1. Below 1,000 2. 1,000 to 2,500 3. 2,501 to 5,000 4. 5,001 to 10,000 5. 10,001 to 25,000 6. 25,001 to 50,000 7. 50,001 to 100,000 8. 100,001 to 200,000 9. City of Portland Only Total - Municipalities 1. Primary State Highways 2. Secondary State Highways 3. County and Local Roads 4. City Streets 5. Not Stated Total--Urban Area 6. Interstate System 7. Other State Freeways 8. Other State Highways Total--Urban System
6. Interstate System 16 1 15 6 6 0 10 1 9 1 157. Other State Freeways 8. Other State Highways 151 9 135 7 83 7 71 5 68 2 64 2 10 181Total--Rural System 167 10 150 7 89 7 77 5 78 3 73 2 11 196
June 1, 2007
OREGON RURAL AREAS
52
At I
nter
sect
ion
Not
at I
nter
sect
ion
At
Inte
r. N
on -I
nter
.
OREGON RURAL AREAS 2006 MOTORCYCLE CRASHES
4. AGE OF CASUALTY
Number of Persons Killed Number of Persons Injured Total Killed Pedestrians Pedalcyclist Total Injured Pedestrians Pedalcyclist
Total Total Total Total Total TotalMale Male Male Male Male MaleFemale Female Female Female Female Female1. 0 to 4 1 12. 5 to 9 3. 10 to 14 1 1 1 1 24. 15 to 19 6 10 16 1 1 5. 20 to 24 4 24 28 2 2 6. 25 to 34 5 24 29 2 2 7. 35 to 44 1 1 23 46 69 4 2 28. 45 to 54 25 79 104 12 12 9. 55 to 64 7 57 64 9 9 1 110. 65 to 74 1 1 1 23 2411. 75 & older 2 4 6 2 2 12. Not-stated 1 1Totals 32 30 2 1 1 344 268 76 3 2 1
Directional Analysis - A crash consisting of a series of collisions, overturning, etc., is classified according to the first damage or injury producing event; includes on roadway and off roadway.5A. MULTIPLE VEH CRASH Total Fatal Injury P.D.O.
Junction1. Car go straight 3 3 1 22. Car turning right3. Car turning left 4. Car backing 5. All othersTotals 3 3 1 2
5D. ALL OTHER CRASHES Total Fatal Injury P.D.O.Coll-isionWith
Coll-isionWith
1. Other rd veh or railway train 1 1 2. Fixed object 2 2 3. Other object or animal 1 1 4. Overturning 3 3 5. Other noncollision 1 1 6. Other rd veh or railway train7. Fixed object 2 105 12 119 8. Other object or animal 1 37 1 39 9. Overturning 3 39 5 47 10. Other noncollision 20 1 21 11. Not statedTotals 6208 20 234
6. PEDESTRIAN ACTION BY AGE
Ages of Pedstrians Killed and InjuredPedestrians Killed Total 0 to 4 5 to 9 10 to 14 15 to 19 20 to 24 25 to 44 45 to 64 65 & older Not stated
1a. X-ing at intersect or X-walk 1b. X-ing not at intersection 1 1 2 2a. Walking in road with traffic 2b. Same against traffic 3. Standing in roadway 1 1 4. Push or work on veh in road 5. Other working in roadway 6. Playing in roadway 7. Other in roadway 8. Not in roadway 9. Not stated
1 11 3 Totals
7. AGE OF DRIVER All Crashes Fatal Injury 1. 14 & younger 2. 15 1 1 3. 16 1 1 4. 17 5 5 5. 18 7 7 6. 19 4 2 2 7. 20 11 11 8. 21 2 1 1 9. 22 to 24 21 1 19 10. 25 to 34 46 4 37 11. 35 to 44 74 6 66 12. 45 to 54 119 15 101 13. 55 to 64 90 13 73 14. 65 to 74 28 28 15. 75 & older 7 2 4 16. Not stated 6 2 Totals 422 44 358 8. SEX OF DRIVER Injury Fatal All Crashes
1. Male 356 40 301 2. Female 61 4 55 3. Not stated 5 2 Totals 422 44 358
9. RESIDENCE OF DRIVER All Crashes Fatal Injury
1. Local resident 264 31 226 2. In-state resident 91 10 75 3. Non resident 60 2 55 4. Not stated 7 1 2 Totals 422 44 358
10. CRASHES BY CONTRIBUTING FACTOR All InjuryFatal1. Speed too fast
10 8
14
3
7. Followed too closely 10 2 3
11 17
3
6. Improper overtaking5. Drove left of center4. Disregard traffic signal3. Passed stop sign2. Failed to yield 34 5 26
142 12 158
8. Made improper turn
Totals 383 43 325 62
8 38 12
2
2
9 10
67 9
50 22
2
12. Other 11. Mechanical defect10. Improper driving9. Had been drinking
12. ROAD SURFACECONDITION InjuryFatalAll
1. Dry 289 20 2582. Wet 21 3 183. Snowy or icy 2 1 14. Other 5. Not stated 8 6Totals 320 30 277
13. LIGHT CONDITION InjuryFatalAll1. Daylight 283 25 2462. Dawn or Dusk 7 1 53. Darkness 29 3 264. Not stated 1 1Totals 320 30 277
11. VEHICLE TYPE InjuryFatalAll1. Passenger car 79 12 612. Pass Car and trailer 2 23. Truck or truck tractor 1 14. Truck tractor with semi-trailer 5. Other truck combination 6. Farm tractor and/or equip. 1 17. Taxicab8. Bus 9. School bus10. Motorcycle 336 31 29111. Motor scooter or moped 12. Others and not stated 1 1Totals 420 44 356Special vehicles included above 13. Log trucks14. Emergency (incl. private) 15. Military vehicles 16. Other public vehicles
14. MANNER OF COLLISION InjuryFatalAll
1. Head-on 10 4 62. Rear end 13 123. Angle 42 5 334. Sideswipe-meeting 11 1 105. Sideswipe-overtaking 5 56. Backed into 7. Other 2Totals 83 10 66
11. Count of vehicles, including properly parked vehicles.
Totals include participant records where gender was coded as "unknown".
10. Count of crashes. Crashes with multiple contributing circumstances are counted in all applicable categories.
MULTIPLE VEHICLE CRASHES
7 - 9. Tally of drivers by age, sex, residence & crash severity. Excludes occupants of properly & improperly parked vehicles.
53
Col
lisio
n in
volv
ing:
N
on-
coll.
N
on-
coll.
C
ollis
ion
invo
lvin
g:
Non
- co
ll.
Col
lisio
n in
volv
ing:
3C
. RU
RA
L 3A
. Inc
orpo
rate
d A
reas
3B
. UR
BA
N
SUMMARY OF MOTOR VEHICLE TRAFFIC CRASHES 2006 MOTORCYCLE CRASHESForIn
3. County and Local Roads 3 3 3 3 3 4. City Streets
5. Not Stated 16 1 4 5 3 8 11 4 12 16 Total--Rural Area
NOTE: THIS YEAR TO DATE represents only those crashes entered onto the database as of the date above. SAME PERIOD LAST YEAR represents all crashes including late reports. MAJOR INJURIES are incapacitating injuries. MINOR INJURIES are non-incapacitating evident injuries.
3. LOCATION Total
PropertyDamage
Nonfatal Injury Fatal Property
DamageNonfatal
InjuryFatalTotalPropertyDamage
Nonfatal Injury Fatal Total Killed Injured
Total On Roadway TotalOff Roadway Number Of Crashes Number Of Persons
1. Below 1,000 2. 1,000 to 2,500 3. 2,501 to 5,000 4. 5,001 to 10,000 5. 10,001 to 25,000 6. 25,001 to 50,000 7. 50,001 to 100,000 8. 100,001 to 200,000 9. City of Portland Only Total - Municipalities
1 1 1 1
2 6 4
4 12 21 42 36
109 44 92
361 12
3 1 11 1 17 4 36 4 34 2 88 15 37 7 71 17
297 52
1 1 2 9 1 10
14 4 18 31 4 35 28 2 30
4 77 13 94 31 6 37
4 63 16 83 8 254 47 309
2 2 2 2 3 3
2 5 7 6 6
2 11 2 15 6 1 7 8 1 9
4 43 5 52
3 16 19 41 2 39 96 6 46 80 4
340 12
111 2 1 11 12 12 85 2 99 13 96 2 111 1. Primary State Highways 22 2 2 3 16 19 3 18 21 2. Secondary State Highways 32 1 8 8 3 19 1 23 3 27 1 31 3. County and Local Roads
217 10 3 29 4 36 32 163 6 201 35 192 10 237 4. City Streets 5. Not Stated Total--Urban Area 382134 50 4 5850283934254 333 13 400 6. Interstate System 20 19 1 16 15 1 4 4 257. Other State Freeways 14 11 3 12 9 3 2 2 128. Other State Highways 98 2 84 12 90 77 11 8 7 1 2 96Total--Urban System 132 2 114 16 118 2 101 15 14 13 1 2 133
6. Interstate System 1 1 0 0 1 17. Other State Freeways 8. Other State Highways 12 9 3 11 8 3 1 1 13Total--Rural System 13 9 4 11 8 3 2 1 1 13
June 1, 2007
OREGON CITIES AND URBAN AREAS
54
At I
nter
sect
ion
Not
at I
nter
sect
ion
At
Inte
r. N
on -I
nter
.
OREGON CITIES AND URBAN AREAS 2006 MOTORCYCLE CRASHES
4. AGE OF CASUALTY
Number of Persons Killed Number of Persons Injured Total Killed Pedestrians Pedalcyclist Total Injured Pedestrians Pedalcyclist
Total Total Total Total Total TotalMale Male Male Male Male MaleFemale Female Female Female Female Female1. 0 to 4 1 12. 5 to 9 1 1 1 2 13. 10 to 14 1 1 2 24. 15 to 19 1 3 10 13 15. 20 to 24 1 39 40 4 4 6. 25 to 34 10 55 65 3 3 7. 35 to 44 12 63 75 2 2 8. 45 to 54 1 1 1 15 101 116 3 2 1 19. 55 to 64 1 4 57 61 1 1 110. 65 to 74 2 13 1511. 75 & older 1 5 612. Not-stated 1 1 2Totals 13 12 1 398 346 52 2 2 4 4
Directional Analysis - A crash consisting of a series of collisions, overturning, etc., is classified according to the first damage or injury producing event; includes on roadway and off roadway.5A. MULTIPLE VEH CRASH Total Fatal Injury P.D.O.
Junction1. Car go straight 2 2 22. Car turning right3. Car turning left 4. Car backing 5. All othersTotals 2 2 2
5D. ALL OTHER CRASHES Total Fatal Injury P.D.O.Coll-isionWith
Coll-isionWith
1. Other rd veh or railway train 2 2 2. Fixed object 5 5 3. Other object or animal4. Overturning 2 14 16 5. Other noncollision 1 3 4 6. Other rd veh or railway train 2 2 7. Fixed object 2 34 3 39 8. Other object or animal 7 7 9. Overturning 6 29 1 36 10. Other noncollision 3 7 1 11 11. Not statedTotals 14103 5 122
6. PEDESTRIAN ACTION BY AGE
Ages of Pedstrians Killed and InjuredPedestrians Killed Total 0 to 4 5 to 9 10 to 14 15 to 19 20 to 24 25 to 44 45 to 64 65 & older Not stated
1a. X-ing at intersect or X-walk 1b. X-ing not at intersection 1 1 2 2a. Walking in road with traffic 2b. Same against traffic 3. Standing in roadway 4. Push or work on veh in road 5. Other working in roadway 6. Playing in roadway 7. Other in roadway 8. Not in roadway 9. Not stated
1 1 2 Totals
7. AGE OF DRIVER All Crashes Fatal Injury 1. 14 & younger 2. 15 1 1 3. 16 3 2 4. 17 8 1 7 5. 18 9 7 6. 19 16 12 7. 20 14 1 12 8. 21 22 1 17 9. 22 to 24 45 3 36 10. 25 to 34 126 5 106 11. 35 to 44 126 4 106 12. 45 to 54 181 5 145 13. 55 to 64 105 3 92 14. 65 to 74 27 22 15. 75 & older 13 12 16. Not stated 16 10 Totals 712 23 587 8. SEX OF DRIVER Injury Fatal All Crashes
1. Male 565 16 470 2. Female 140 7 111 3. Not stated 7 6 Totals 712 23 587
9. RESIDENCE OF DRIVER All Crashes Fatal Injury
1. Local resident 630 19 526 2. In-state resident 31 1 24 3. Non resident 41 3 30 4. Not stated 10 7 Totals 712 23 587
10. CRASHES BY CONTRIBUTING FACTOR All InjuryFatal1. Speed too fast
49 10
2 10
3
7. Followed too closely 67 3 2
1
15 2
13 3
6. Improper overtaking5. Drove left of center4. Disregard traffic signal3. Passed stop sign2. Failed to yield 121 3 106
82 10 101
8. Made improper turn
Totals 497 32 404 65
1 41 13 22
1
4 8
76 1
51 22 25
12. Other 11. Mechanical defect10. Improper driving9. Had been drinking
12. ROAD SURFACECONDITION InjuryFatalAll
1. Dry 385 12 3232. Wet 24 1 183. Snowy or icy 2 14. Other 5. Not stated 5 3Totals 416 13 345
13. LIGHT CONDITION InjuryFatalAll1. Daylight 316 8 2642. Dawn or Dusk 26 1 213. Darkness 73 4 594. Not stated 1 1Totals 416 13 345
11. VEHICLE TYPE InjuryFatalAll1. Passenger car 294 9 2422. Pass Car and trailer 1 13. Truck or truck tractor 2 24. Truck tractor with semi-trailer 2 1 15. Other truck combination 6. Farm tractor and/or equip. 7. Taxicab8. Bus 1 19. School bus10. Motorcycle 420 13 34811. Motor scooter or moped 12. Others and not stated 2 1Totals 722 23 596Special vehicles included above 13. Log trucks14. Emergency (incl. private) 8 715. Military vehicles 16. Other public vehicles 1 1
14. MANNER OF COLLISION InjuryFatalAll
1. Head-on 3 32. Rear end 95 2 743. Angle 169 5 1444. Sideswipe-meeting 3 15. Sideswipe-overtaking 15 1 146. Backed into 6 37. Other 1 1Totals 292 8 240
11. Count of vehicles, including properly parked vehicles.
Totals include participant records where gender was coded as "unknown".
10. Count of crashes. Crashes with multiple contributing circumstances are counted in all applicable categories.
MULTIPLE VEHICLE CRASHES
7 - 9. Tally of drivers by age, sex, residence & crash severity. Excludes occupants of properly & improperly parked vehicles.
55
Col
lisio
n in
volv
ing:
N
on-
coll.
N
on-
coll.
C
ollis
ion
invo
lvin
g:
Non
- co
ll.
Col
lisio
n in
volv
ing:
3C
. RU
RA
L 3A
. Inc
orpo
rate
d A
reas
3B
. UR
BA
N
SUMMARY OF MOTOR VEHICLE TRAFFIC CRASHES 2006 MOTORCYCLE CRASHESForIn
3. County and Local Roads 3 3 3 3 3 4. City Streets
5. Not Stated 16 1 4 5 3 8 11 4 12 16 Total--Rural Area
NOTE: THIS YEAR TO DATE represents only those crashes entered onto the database as of the date above. SAME PERIOD LAST YEAR represents all crashes including late reports. MAJOR INJURIES are incapacitating injuries. MINOR INJURIES are non-incapacitating evident injuries.
3. LOCATION Total
PropertyDamage
Nonfatal Injury Fatal Property
DamageNonfatal
InjuryFatalTotalPropertyDamage
Nonfatal Injury Fatal Total Killed Injured
Total On Roadway TotalOff Roadway Number Of Crashes Number Of Persons
1. Below 1,000 2. 1,000 to 2,500 3. 2,501 to 5,000 4. 5,001 to 10,000 5. 10,001 to 25,000 6. 25,001 to 50,000 7. 50,001 to 100,000 8. 100,001 to 200,000 9. City of Portland Only Total - Municipalities
3. County and Local Roads 162 7 2 24 4 30 21 120 3 144 23 144 7 174 4. City Streets
5. Not Stated Total--Urban Area 24483 31 4 3828183421531 214 8 253 6. Interstate System 4 4 3 3 1 1 67. Other State Freeways 13 11 2 11 9 2 2 2 128. Other State Highways 62 1 55 6 57 51 5 5 4 1 1 64Total--Urban System 79 1 70 8 71 1 63 7 8 7 1 1 82
6. Interstate System 1 1 0 0 1 17. Other State Freeways 8. Other State Highways 12 9 3 11 8 3 1 1 13Total--Rural System 13 9 4 11 8 3 2 1 1 13
June 1, 2007
ALL CITIES EXCEPT PORTLAND
56
At I
nter
sect
ion
Not
at I
nter
sect
ion
At
Inte
r. N
on -I
nter
.
ALL CITIES EXCEPT PORTLAND 2006 MOTORCYCLE CRASHES
4. AGE OF CASUALTY
Number of Persons Killed Number of Persons Injured Total Killed Pedestrians Pedalcyclist Total Injured Pedestrians Pedalcyclist
Total Total Total Total Total TotalMale Male Male Male Male MaleFemale Female Female Female Female Female1. 0 to 4 2. 5 to 9 1 1 1 13. 10 to 14 1 14. 15 to 19 1 3 8 11 15. 20 to 24 1 25 26 4 4 6. 25 to 34 7 33 40 1 1 7. 35 to 44 8 38 46 1 1 8. 45 to 54 1 1 1 6 67 73 1 1 19. 55 to 64 1 4 39 43 1 1 110. 65 to 74 2 11 1311. 75 & older 5 512. Not-stated 1 1Totals 8 7 1 260 227 33 1 1 4 4
Directional Analysis - A crash consisting of a series of collisions, overturning, etc., is classified according to the first damage or injury producing event; includes on roadway and off roadway.5A. MULTIPLE VEH CRASH Total Fatal Injury P.D.O.
Junction1. Car go straight 1 1 12. Car turning right3. Car turning left 4. Car backing 5. All othersTotals 1 1 1
5D. ALL OTHER CRASHES Total Fatal Injury P.D.O.Coll-isionWith
Coll-isionWith
1. Other rd veh or railway train 2 2 2. Fixed object 4 4 3. Other object or animal4. Overturning 1 10 11 5. Other noncollision 1 2 3 6. Other rd veh or railway train 2 2 7. Fixed object 2 23 3 28 8. Other object or animal 4 4 9. Overturning 5 18 23 10. Other noncollision 1 6 1 8 11. Not statedTotals 1071 4 85
6. PEDESTRIAN ACTION BY AGE
Ages of Pedstrians Killed and InjuredPedestrians Killed Total 0 to 4 5 to 9 10 to 14 15 to 19 20 to 24 25 to 44 45 to 64 65 & older Not stated
1a. X-ing at intersect or X-walk 1b. X-ing not at intersection 1 1 2a. Walking in road with traffic 2b. Same against traffic 3. Standing in roadway 4. Push or work on veh in road 5. Other working in roadway 6. Playing in roadway 7. Other in roadway 8. Not in roadway 9. Not stated
1 1 Totals
7. AGE OF DRIVER All Crashes Fatal Injury 1. 14 & younger 2. 15 1 1 3. 16 3 2 4. 17 6 1 5 5. 18 5 4 6. 19 12 9 7. 20 12 1 10 8. 21 13 1 9 9. 22 to 24 30 2 25 10. 25 to 34 84 3 70 11. 35 to 44 77 2 63 12. 45 to 54 104 1 87 13. 55 to 64 69 1 64 14. 65 to 74 21 18 15. 75 & older 12 11 16. Not stated 6 4 Totals 455 12 382 8. SEX OF DRIVER Injury Fatal All Crashes
1. Male 363 9 306 2. Female 88 3 73 3. Not stated 4 3 Totals 455 12 382
9. RESIDENCE OF DRIVER All Crashes Fatal Injury
1. Local resident 400 9 340 2. In-state resident 26 1 19 3. Non resident 25 2 20 4. Not stated 4 3 Totals 455 12 382
10. CRASHES BY CONTRIBUTING FACTOR All InjuryFatal1. Speed too fast
24 9 1 6 1
7. Followed too closely 28 1
1
13 1 9 1
6. Improper overtaking5. Drove left of center4. Disregard traffic signal3. Passed stop sign2. Failed to yield 80 1 72
54 6 68
8. Made improper turn
Totals 319 20 262 44
1 29 6
15
1
4 6
52 1
38 12 16
12. Other 11. Mechanical defect10. Improper driving9. Had been drinking
12. ROAD SURFACECONDITION InjuryFatalAll
1. Dry 254 7 2162. Wet 12 1 83. Snowy or icy 1 14. Other 5. Not stated 2 1Totals 269 8 226
13. LIGHT CONDITION InjuryFatalAll1. Daylight 212 4 1812. Dawn or Dusk 15 1 123. Darkness 41 3 324. Not stated 1 1Totals 269 8 226
11. VEHICLE TYPE InjuryFatalAll1. Passenger car 182 3 1552. Pass Car and trailer 1 13. Truck or truck tractor 2 24. Truck tractor with semi-trailer 2 1 15. Other truck combination 6. Farm tractor and/or equip. 7. Taxicab 8. Bus 9. School bus10. Motorcycle 271 8 22711. Motor scooter or moped 12. Others and not stated 2 1Totals 460 12 387Special vehicles included above 13. Log trucks14. Emergency (incl. private) 5 415. Military vehicles 16. Other public vehicles
14. MANNER OF COLLISION InjuryFatalAll
1. Head-on 2 22. Rear end 55 473. Angle 110 3 944. Sideswipe-meeting 2 15. Sideswipe-overtaking 10 1 96. Backed into 37. Other 1 1Totals 183 4 154
11. Count of vehicles, including properly parked vehicles.
Totals include participant records where gender was coded as "unknown".
10. Count of crashes. Crashes with multiple contributing circumstances are counted in all applicable categories.
MULTIPLE VEHICLE CRASHES
7 - 9. Tally of drivers by age, sex, residence & crash severity. Excludes occupants of properly & improperly parked vehicles.
57
Col
lisio
n in
volv
ing:
N
on-
coll.
N
on-
coll.
C
ollis
ion
invo
lvin
g:
Non
- co
ll.
Col
lisio
n in
volv
ing:
3C
. RU
RA
L 3A
. Inc
orpo
rate
d A
reas
3B
. UR
BA
N
SUMMARY OF MOTOR VEHICLE TRAFFIC CRASHES 2006 MOTORCYCLE CRASHESForIn
1. Primary State Highways 2. Secondary State Highways 3. County and Local Roads 4. City Streets 5. Not Stated Total--Rural Area
NOTE: THIS YEAR TO DATE represents only those crashes entered onto the database as of the date above. SAME PERIOD LAST YEAR represents all crashes including late reports. MAJOR INJURIES are incapacitating injuries. MINOR INJURIES are non-incapacitating evident injuries.
3. LOCATION Total
PropertyDamage
Nonfatal Injury Fatal Property
DamageNonfatal
InjuryFatalTotalPropertyDamage
Nonfatal Injury Fatal Total Killed Injured
Total On Roadway TotalOff Roadway Number Of Crashes Number Of Persons
1. Below 1,000 2. 1,000 to 2,500 3. 2,501 to 5,000 4. 5,001 to 10,000 5. 10,001 to 25,000 6. 25,001 to 50,000 7. 50,001 to 100,000 8. 100,001 to 200,000 9. City of Portland Only Total - Municipalities
3. County and Local Roads 55 3 1 5 6 11 43 3 57 12 48 3 63 4. City Streets
5. Not Stated Total--Urban Area 8041 8 9166348317 71 4 92 6. Interstate System 9 8 1 7 6 1 2 2 97. Other State Freeways 1 1 1 18. Other State Highways 19 1 15 3 18 14 3 1 1 1 16Total--Urban System 29 1 23 5 26 1 20 5 3 3 1 25
6. Interstate System 7. Other State Freeways 8. Other State Highways Total--Rural System
June 1, 2007
PORTLAND
58
At I
nter
sect
ion
Not
at I
nter
sect
ion
At
Inte
r. N
on -I
nter
.
PORTLAND 2006 MOTORCYCLE CRASHES
4. AGE OF CASUALTY
Number of Persons Killed Number of Persons Injured Total Killed Pedestrians Pedalcyclist Total Injured Pedestrians Pedalcyclist
Total Total Total Total Total TotalMale Male Male Male Male MaleFemale Female Female Female Female Female1. 0 to 4 1 12. 5 to 9 1 13. 10 to 14 1 1 1 14. 15 to 19 5. 20 to 24 8 86. 25 to 34 2 15 17 1 1 7. 35 to 44 2 15 17 1 1 8. 45 to 54 5 21 26 2 2 9. 55 to 64 8 810. 65 to 74 11. 75 & older 12. Not-stated 1 1Totals 4 4 80 69 11 1 1
Directional Analysis - A crash consisting of a series of collisions, overturning, etc., is classified according to the first damage or injury producing event; includes on roadway and off roadway.5A. MULTIPLE VEH CRASH Total Fatal Injury P.D.O.
Junction1. Car go straight 1 1 12. Car turning right3. Car turning left 4. Car backing 5. All othersTotals 1 1 1
5D. ALL OTHER CRASHES Total Fatal Injury P.D.O.Coll-isionWith
Coll-isionWith
1. Other rd veh or railway train2. Fixed object 3. Other object or animal4. Overturning 1 2 3 5. Other noncollision6. Other rd veh or railway train7. Fixed object 2 2 8. Other object or animal 1 1 9. Overturning 1 8 1 10 10. Other noncollision 1 1 11. Not statedTotals 313 1 17
6. PEDESTRIAN ACTION BY AGE
Ages of Pedstrians Killed and InjuredPedestrians Killed Total 0 to 4 5 to 9 10 to 14 15 to 19 20 to 24 25 to 44 45 to 64 65 & older Not stated
1a. X-ing at intersect or X-walk 1b. X-ing not at intersection 1 1 2a. Walking in road with traffic 2b. Same against traffic 3. Standing in roadway 4. Push or work on veh in road 5. Other working in roadway 6. Playing in roadway 7. Other in roadway 8. Not in roadway 9. Not stated
1 1 Totals
7. AGE OF DRIVER All Crashes Fatal Injury 1. 14 & younger 2. 15 3. 16 4. 17 1 1 5. 18 2 2 6. 19 2 2 7. 20 8. 21 6 5 9. 22 to 24 10 1 7 10. 25 to 34 28 1 24 11. 35 to 44 34 2 28 12. 45 to 54 50 3 36 13. 55 to 64 20 2 14 14. 65 to 74 4 2 15. 75 & older 16. Not stated 9 6 Totals 166 9 127 8. SEX OF DRIVER Injury Fatal All Crashes
1. Male 127 5 99 2. Female 36 4 25 3. Not stated 3 3 Totals 166 9 127
9. RESIDENCE OF DRIVER All Crashes Fatal Injury
1. Local resident 144 9 112 2. In-state resident 3 3 3. Non resident 13 8 4. Not stated 6 4 Totals 166 9 127
10. CRASHES BY CONTRIBUTING FACTOR All InjuryFatal1. Speed too fast
18
4 1
7. Followed too closely 27 2 1 1
4 1
6. Improper overtaking5. Drove left of center4. Disregard traffic signal3. Passed stop sign2. Failed to yield 31 2 24
14 3 18
8. Made improper turn
Totals 111 9 84 7
8 4 4
1
9
9 6 5
12. Other 11. Mechanical defect10. Improper driving9. Had been drinking
12. ROAD SURFACECONDITION InjuryFatalAll
1. Dry 80 4 622. Wet 10 93. Snowy or icy 14. Other 5. Not stated 1Totals 92 4 71
13. LIGHT CONDITION InjuryFatalAll1. Daylight 66 3 512. Dawn or Dusk 7 53. Darkness 19 1 154. Not statedTotals 92 4 71
11. VEHICLE TYPE InjuryFatalAll1. Passenger car 75 5 562. Pass Car and trailer 3. Truck or truck tractor 4. Truck tractor with semi-trailer 5. Other truck combination 6. Farm tractor and/or equip. 7. Taxicab 8. Bus 1 19. School bus10. Motorcycle 93 4 7211. Motor scooter or moped 12. Others and not stated Totals 169 9 129Special vehicles included above 13. Log trucks14. Emergency (incl. private) 3 315. Military vehicles 16. Other public vehicles 1 1
10 2 2 4 4 2 4 6 3. County and Local Roads 4. City Streets 5. Not Stated
28 1 6 1 7 13 12 25 19 12 1 32 Total--Rural Area
NOTE: THIS YEAR TO DATE represents only those crashes entered onto the database as of the date above. SAME PERIOD LAST YEAR represents all crashes including late reports. MAJOR INJURIES are incapacitating injuries. MINOR INJURIES are non-incapacitating evident injuries.
3. LOCATION Total
PropertyDamage
Nonfatal Injury Fatal Property
DamageNonfatal
InjuryFatalTotalPropertyDamage
Nonfatal Injury Fatal Total Killed Injured
Total On Roadway TotalOff Roadway Number Of Crashes Number Of Persons
1. Below 1,000 2. 1,000 to 2,500 3. 2,501 to 5,000 4. 5,001 to 10,000 5. 10,001 to 25,000 6. 25,001 to 50,000 7. 50,001 to 100,000 8. 100,001 to 200,000 9. City of Portland Only Total - Municipalities
1
1
1 2 4 7 8 4 7 6
39 2
1 1 1 3 2 5 2 5
4 1 6 4 2
11 26
1 1 1 1 2 1 2 3
1 2 4 7 2 2
1 3 4 4 2 6
1 10 14 25
1 1 1 1 2 2
1 3 4 1 1 2 2 3 3
1 1 12 14
1 1 1 5 2 4 2
1 6
20 3
11 4 4 7 5 12 11 5 16 1. Primary State Highways 2 2 2 4 2 2 4 2. Secondary State Highways 2 1 1 1 1 3. County and Local Roads 6 2 9 1 10 6 3 1 10 15 4 1 20 4. City Streets
5. Not Stated Total--Urban Area 21213 1 14151112728 12 1 41 6. Interstate System 10 4 6 7 4 3 3 3 67. Other State Freeways 8. Other State Highways 10 3 7 9 3 6 1 1 7Total--Urban System 20 7 13 16 7 9 4 4 13
6. Interstate System 5 1 4 4 0 4 1 1 1 17. Other State Freeways 8. Other State Highways 21 8 13 17 8 9 4 4 17Total--Rural System 26 1 8 17 21 8 13 5 1 4 1 18
June 1, 2007
STATE OF OREGON
62
At I
nter
sect
ion
Not
at I
nter
sect
ion
At
Inte
r. N
on -I
nter
.
STATE OF OREGON 2006 MOTORHOME CRASHES
4. AGE OF CASUALTY
Number of Persons Killed Number of Persons Injured Total Killed Pedestrians Pedalcyclist Total Injured Pedestrians Pedalcyclist
Total Total Total Total Total TotalMale Male Male Male Male MaleFemale Female Female Female Female Female1. 0 to 4 1 12. 5 to 9 1 13. 10 to 14 2 2 44. 15 to 19 2 1 3 1 15. 20 to 24 1 16. 25 to 34 1 1 27. 35 to 44 3 5 88. 45 to 54 4 4 89. 55 to 64 10 2 12 1 1 10. 65 to 74 1 4 511. 75 & older 2 1 3 1 1 12. Not-stated 1 1Totals 3 2 1 49 22 27
Directional Analysis - A crash consisting of a series of collisions, overturning, etc., is classified according to the first damage or injury producing event; includes on roadway and off roadway.5A. MULTIPLE VEH CRASH Total Fatal Injury P.D.O.
Junction1. Car go straight2. Car turning right3. Car turning left 4. Car backing 5. All othersTotals
5D. ALL OTHER CRASHES Total Fatal Injury P.D.O.Coll-isionWith
Coll-isionWith
1. Other rd veh or railway train2. Fixed object 1 1 3. Other object or animal4. Overturning 1 1 5. Other noncollision6. Other rd veh or railway train7. Fixed object 8 1 9 8. Other object or animal 3 3 9. Overturning 1 1 10. Other noncollision11. Not statedTotals 122 1 15
6. PEDESTRIAN ACTION BY AGE
Ages of Pedstrians Killed and InjuredPedestrians Killed Total 0 to 4 5 to 9 10 to 14 15 to 19 20 to 24 25 to 44 45 to 64 65 & older Not stated
1a. X-ing at intersect or X-walk 1b. X-ing not at intersection 2a. Walking in road with traffic 2b. Same against traffic 3. Standing in roadway 4. Push or work on veh in road 5. Other working in roadway 6. Playing in roadway 7. Other in roadway 8. Not in roadway 9. Not stated Totals
7. AGE OF DRIVER All Crashes Fatal Injury 1. 14 & younger 2. 15 3. 16 4. 17 2 1 5. 18 6. 19 1 1 7. 20 3 8. 21 9. 22 to 24 4 1 10. 25 to 34 14 1 6 11. 35 to 44 16 11 12. 45 to 54 24 12 13. 55 to 64 19 1 9 14. 65 to 74 28 1 8 15. 75 & older 11 4 16. Not stated 12 5 Totals 134 3 58 8. SEX OF DRIVER Injury Fatal All Crashes
1. Male 90 2 36 2. Female 37 1 17 3. Not stated 7 5 Totals 134 3 58
9. RESIDENCE OF DRIVER All Crashes Fatal Injury
1. Local resident 64 2 29 2. In-state resident 33 16 3. Non resident 28 8 4. Not stated 9 1 5 Totals 134 3 58
10. CRASHES BY CONTRIBUTING FACTOR All InjuryFatal1. Speed too fast
9
1
7. Followed too closely 11
1 4 4 2
6. Improper overtaking5. Drove left of center4. Disregard traffic signal3. Passed stop sign2. Failed to yield 4 4
7 1 18
8. Made improper turn
Totals 82 2 24 1
2
12
16 3 8
12. Other 11. Mechanical defect10. Improper driving9. Had been drinking
12. ROAD SURFACECONDITION InjuryFatalAll
1. Dry 55 2 192. Wet 16 53. Snowy or icy 14. Other 5. Not stated 1Totals 73 2 24
13. LIGHT CONDITION InjuryFatalAll1. Daylight 63 1 212. Dawn or Dusk3. Darkness 10 1 34. Not statedTotals 73 2 24
11. VEHICLE TYPE InjuryFatalAll1. Passenger car 57 1 272. Pass Car and trailer 1 13. Truck or truck tractor 3 24. Truck tractor with semi-trailer 6 25. Other truck combination 1 16. Farm tractor and/or equip. 7. Taxicab8. Bus 19. School bus10. Motorcycle 1 111. Motor scooter or moped 12. Others and not stated 74 2 24Totals 144 3 58Special vehicles included above 13. Log trucks 114. Emergency (incl. private) 2 215. Military vehicles 16. Other public vehicles 2
10 2 2 4 4 2 4 6 3. County and Local Roads 4. City Streets 5. Not Stated
26 5 5 13 11 24 18 11 29 Total--Rural Area
NOTE: THIS YEAR TO DATE represents only those crashes entered onto the database as of the date above. SAME PERIOD LAST YEAR represents all crashes including late reports. MAJOR INJURIES are incapacitating injuries. MINOR INJURIES are non-incapacitating evident injuries.
3. LOCATION Total
PropertyDamage
Nonfatal Injury Fatal Property
DamageNonfatal
InjuryFatalTotalPropertyDamage
Nonfatal Injury Fatal Total Killed Injured
Total On Roadway TotalOff Roadway Number Of Crashes Number Of Persons
1. Below 1,000 2. 1,000 to 2,500 3. 2,501 to 5,000 4. 5,001 to 10,000 5. 10,001 to 25,000 6. 25,001 to 50,000 7. 50,001 to 100,000 8. 100,001 to 200,000 9. City of Portland Only Total - Municipalities 1. Primary State Highways 2. Secondary State Highways 3. County and Local Roads 4. City Streets 5. Not Stated Total--Urban Area 6. Interstate System 7. Other State Freeways 8. Other State Highways Total--Urban System
6. Interstate System 4 4 4 0 47. Other State Freeways 8. Other State Highways 19 7 12 16 7 9 3 3 16Total--Rural System 23 7 16 20 7 13 3 3 16
June 1, 2007
OREGON RURAL AREAS
64
At I
nter
sect
ion
Not
at I
nter
sect
ion
At
Inte
r. N
on -I
nter
.
OREGON RURAL AREAS 2006 MOTORHOME CRASHES
4. AGE OF CASUALTY
Number of Persons Killed Number of Persons Injured Total Killed Pedestrians Pedalcyclist Total Injured Pedestrians Pedalcyclist
Total Total Total Total Total TotalMale Male Male Male Male MaleFemale Female Female Female Female Female1. 0 to 4 1 12. 5 to 9 3. 10 to 14 2 24. 15 to 19 5. 20 to 24 1 16. 25 to 34 1 1 27. 35 to 44 2 1 38. 45 to 54 2 3 59. 55 to 64 6 1 710. 65 to 74 2 211. 75 & older 1 1 212. Not-stated 1 1Totals 26 13 13
Directional Analysis - A crash consisting of a series of collisions, overturning, etc., is classified according to the first damage or injury producing event; includes on roadway and off roadway.5A. MULTIPLE VEH CRASH Total Fatal Injury P.D.O.
1. Entering at angle 1 1 2a. Same dir.- both straight 2b. Same-1 turn, 1 straight 1 1 2c. Same-one stopped 2d. Same-all others 3a. Opposite dir.- both straight 3b. Opposite-1 turn, 1 straight 3c. Opposite-all others 1 1 4. Not stated Totals 1 2 3
5B. MULTIPLE VEH CRASH Total Fatal Injury P.D.O. 5 51. Moving in opposite dir.
9 2 112. Both moving in same dir. 3a. One car parked
1 1 23b. One car stopped in traffic 4. Enter/Leave parked pos. 5a. Entering driveway/alley 5b. Leaving driveway/alley
1 16. All others Totals 10 9 19
5C. PEDESTRIANCRASHES
All PedCrashes
Fatal Crashes Non-Fatal Injury Crashes
TotalAt
Intersection Non-
Junction TotalAt
IntersectionNon-
Junction1. Car go straight2. Car turning right3. Car turning left 4. Car backing 5. All othersTotals
5D. ALL OTHER CRASHES Total Fatal Injury P.D.O.Coll-isionWith
Coll-isionWith
1. Other rd veh or railway train2. Fixed object 3. Other object or animal 4. Overturning 5. Other noncollision 6. Other rd veh or railway train 7. Fixed object 4 4 8. Other object or animal 3 3 9. Overturning10. Other noncollision 11. Not statedTotals 7 7
6. PEDESTRIAN ACTION BY AGE
Ages of Pedstrians Killed and InjuredPedestrians Killed Total 0 to 4 5 to 9 10 to 14 15 to 19 20 to 24 25 to 44 45 to 64 65 & older Not stated
1a. X-ing at intersect or X-walk 1b. X-ing not at intersection 2a. Walking in road with traffic 2b. Same against traffic 3. Standing in roadway 4. Push or work on veh in road 5. Other working in roadway 6. Playing in roadway 7. Other in roadway 8. Not in roadway 9. Not stated
Totals
7. AGE OF DRIVER All Crashes Fatal Injury 1. 14 & younger 2. 15 3. 16 4. 17 1 5. 18 6. 19 7. 20 1 8. 21 9. 22 to 24 10. 25 to 34 4 2 11. 35 to 44 5 4 12. 45 to 54 13 7 13. 55 to 64 7 4 14. 65 to 74 12 4 15. 75 & older 4 1 16. Not stated 6 1 Totals 53 23 8. SEX OF DRIVER Injury Fatal All Crashes
1. Male 37 15 2. Female 13 7 3. Not stated 3 1 Totals 53 23
9. RESIDENCE OF DRIVER All Crashes Fatal Injury
1. Local resident 18 10 2. In-state resident 21 9 3. Non resident 10 3 4. Not stated 4 1 Totals 53 23
10. CRASHES BY CONTRIBUTING FACTOR All InjuryFatal1. Speed too fast
2
1
7. Followed too closely 3 3 3
6. Improper overtaking5. Drove left of center4. Disregard traffic signal3. Passed stop sign2. Failed to yield 4 4
3 8
8. Made improper turn
Totals 33 11
1
6
5
1
12. Other 11. Mechanical defect10. Improper driving9. Had been drinking
12. ROAD SURFACECONDITION InjuryFatalAll
1. Dry 21 92. Wet 6 23. Snowy or icy 14. Other 5. Not stated 1Totals 29 11
13. LIGHT CONDITION InjuryFatalAll1. Daylight 28 102. Dawn or Dusk3. Darkness 1 14. Not statedTotals 29 11
11. VEHICLE TYPE InjuryFatalAll1. Passenger car 15 82. Pass Car and trailer 3. Truck or truck tractor 2 14. Truck tractor with semi-trailer 3 15. Other truck combination 1 16. Farm tractor and/or equip. 7. Taxicab8. Bus 19. School bus10. Motorcycle 1 111. Motor scooter or moped 12. Others and not stated 30 11Totals 53 23Special vehicles included above 13. Log trucks 114. Emergency (incl. private) 15. Military vehicles 16. Other public vehicles 2
2 1 1 1 2 1 1 1 1 1 3 1. Primary State Highways 2. Secondary State Highways 3. County and Local Roads 4. City Streets 5. Not Stated
2 1 1 1 2 1 1 1 1 1 3 Total--Rural Area
NOTE: THIS YEAR TO DATE represents only those crashes entered onto the database as of the date above. SAME PERIOD LAST YEAR represents all crashes including late reports. MAJOR INJURIES are incapacitating injuries. MINOR INJURIES are non-incapacitating evident injuries.
3. LOCATION Total
PropertyDamage
Nonfatal Injury Fatal Property
DamageNonfatal
InjuryFatalTotalPropertyDamage
Nonfatal Injury Fatal Total Killed Injured
Total On Roadway TotalOff Roadway Number Of Crashes Number Of Persons
1. Below 1,000 2. 1,000 to 2,500 3. 2,501 to 5,000 4. 5,001 to 10,000 5. 10,001 to 25,000 6. 25,001 to 50,000 7. 50,001 to 100,000 8. 100,001 to 200,000 9. City of Portland Only Total - Municipalities
1
1
1 2 4 7 8 4 7 6
39 2
1 1 1 3 2 5 2 5
4 1 6 4 2
11 26
1 1 1 1 2 1 2 3
1 2 4 7 2 2
1 3 4 4 2 6
1 10 14 25
1 1 1 1 2 2
1 3 4 1 1 2 2 3 3
1 1 12 14
1 1 1 5 2 4 2
1 6
20 3
11 4 4 7 5 12 11 5 16 1. Primary State Highways 2 2 2 4 2 2 4 2. Secondary State Highways 2 1 1 1 1 3. County and Local Roads 6 2 9 1 10 6 3 1 10 15 4 1 20 4. City Streets
5. Not Stated Total--Urban Area 21213 1 14151112728 12 1 41 6. Interstate System 10 4 6 7 4 3 3 3 67. Other State Freeways 8. Other State Highways 10 3 7 9 3 6 1 1 7Total--Urban System 20 7 13 16 7 9 4 4 13
6. Interstate System 1 1 0 0 1 1 1 17. Other State Freeways 8. Other State Highways 2 1 1 1 1 0 1 1 1Total--Rural System 3 1 1 1 1 1 2 1 1 1 2
June 1, 2007
OREGON CITIES AND URBAN AREAS
66
At I
nter
sect
ion
Not
at I
nter
sect
ion
At
Inte
r. N
on -I
nter
.
OREGON CITIES AND URBAN AREAS 2006 MOTORHOME CRASHES
4. AGE OF CASUALTY
Number of Persons Killed Number of Persons Injured Total Killed Pedestrians Pedalcyclist Total Injured Pedestrians Pedalcyclist
Total Total Total Total Total TotalMale Male Male Male Male MaleFemale Female Female Female Female Female1. 0 to 4 2. 5 to 9 1 13. 10 to 14 2 24. 15 to 19 2 1 3 1 15. 20 to 24 6. 25 to 34 7. 35 to 44 1 4 58. 45 to 54 2 1 39. 55 to 64 4 1 5 1 1 10. 65 to 74 1 2 311. 75 & older 1 1 1 1 12. Not-stated Totals 3 2 1 23 9 14
Directional Analysis - A crash consisting of a series of collisions, overturning, etc., is classified according to the first damage or injury producing event; includes on roadway and off roadway.5A. MULTIPLE VEH CRASH Total Fatal Injury P.D.O.
1. Entering at angle 3 3 2a. Same dir.- both straight 2b. Same-1 turn, 1 straight 2c. Same-one stopped 1 2 3 2d. Same-all others 3a. Opposite dir.- both straight 3b. Opposite-1 turn, 1 straight 3c. Opposite-all others 1 1 4. Not stated 1 1 Totals 6 2 8
5B. MULTIPLE VEH CRASH Total Fatal Injury P.D.O. 1 11. Moving in opposite dir.
6 4 102. Both moving in same dir. 8 83a. One car parked 2 5 73b. One car stopped in traffic
Junction1. Car go straight2. Car turning right3. Car turning left 4. Car backing 5. All othersTotals
5D. ALL OTHER CRASHES Total Fatal Injury P.D.O.Coll-isionWith
Coll-isionWith
1. Other rd veh or railway train2. Fixed object 1 1 3. Other object or animal4. Overturning 1 1 5. Other noncollision6. Other rd veh or railway train7. Fixed object 4 1 5 8. Other object or animal9. Overturning 1 1 10. Other noncollision11. Not statedTotals 52 1 8
6. PEDESTRIAN ACTION BY AGE
Ages of Pedstrians Killed and InjuredPedestrians Killed Total 0 to 4 5 to 9 10 to 14 15 to 19 20 to 24 25 to 44 45 to 64 65 & older Not stated
1a. X-ing at intersect or X-walk 1b. X-ing not at intersection 2a. Walking in road with traffic 2b. Same against traffic 3. Standing in roadway 4. Push or work on veh in road 5. Other working in roadway 6. Playing in roadway 7. Other in roadway 8. Not in roadway 9. Not stated Totals
7. AGE OF DRIVER All Crashes Fatal Injury 1. 14 & younger 2. 15 3. 16 4. 17 1 1 5. 18 6. 19 1 1 7. 20 2 8. 21 9. 22 to 24 4 1 10. 25 to 34 10 1 4 11. 35 to 44 11 7 12. 45 to 54 11 5 13. 55 to 64 12 1 5 14. 65 to 74 16 1 4 15. 75 & older 7 3 16. Not stated 6 4 Totals 81 3 35 8. SEX OF DRIVER Injury Fatal All Crashes
1. Male 53 2 21 2. Female 24 1 10 3. Not stated 4 4 Totals 81 3 35
9. RESIDENCE OF DRIVER All Crashes Fatal Injury
1. Local resident 46 2 19 2. In-state resident 12 7 3. Non resident 18 5 4. Not stated 5 1 4 Totals 81 3 35
10. CRASHES BY CONTRIBUTING FACTOR All InjuryFatal1. Speed too fast
77. Followed too closely 8
1 1 1 2
6. Improper overtaking5. Drove left of center4. Disregard traffic signal3. Passed stop sign2. Failed to yield
4 1 10
8. Made improper turn
Totals 49 2 13 1
1
6
11 3 7
12. Other 11. Mechanical defect10. Improper driving9. Had been drinking
12. ROAD SURFACECONDITION InjuryFatalAll
1. Dry 34 2 102. Wet 10 33. Snowy or icy4. Other 5. Not statedTotals 44 2 13
13. LIGHT CONDITION InjuryFatalAll1. Daylight 35 1 112. Dawn or Dusk3. Darkness 9 1 24. Not statedTotals 44 2 13
11. VEHICLE TYPE InjuryFatalAll1. Passenger car 42 1 192. Pass Car and trailer 1 13. Truck or truck tractor 1 14. Truck tractor with semi-trailer 3 15. Other truck combination 6. Farm tractor and/or equip. 7. Taxicab 8. Bus 9. School bus 10. Motorcycle 11. Motor scooter or moped 12. Others and not stated 44 2 13Totals 91 3 35Special vehicles included above 13. Log trucks14. Emergency (incl. private) 2 215. Military vehicles 16. Other public vehicles
2 1 1 1 2 1 1 1 1 1 3 1. Primary State Highways 2. Secondary State Highways 3. County and Local Roads 4. City Streets 5. Not Stated
2 1 1 1 2 1 1 1 1 1 3 Total--Rural Area
NOTE: THIS YEAR TO DATE represents only those crashes entered onto the database as of the date above. SAME PERIOD LAST YEAR represents all crashes including late reports. MAJOR INJURIES are incapacitating injuries. MINOR INJURIES are non-incapacitating evident injuries.
3. LOCATION Total
PropertyDamage
Nonfatal Injury Fatal Property
DamageNonfatal
InjuryFatalTotalPropertyDamage
Nonfatal Injury Fatal Total Killed Injured
Total On Roadway TotalOff Roadway Number Of Crashes Number Of Persons
1. Below 1,000 2. 1,000 to 2,500 3. 2,501 to 5,000 4. 5,001 to 10,000 5. 10,001 to 25,000 6. 25,001 to 50,000 7. 50,001 to 100,000 8. 100,001 to 200,000 9. City of Portland Only Total - Municipalities
3. County and Local Roads 3 2 9 1 10 6 1 1 8 15 2 1 18 4. City Streets
5. Not Stated Total--Urban Area 12211 1 1212511823 6 1 30 6. Interstate System 5 2 3 4 2 2 1 1 37. Other State Freeways 8. Other State Highways 7 2 5 6 2 4 1 1 6Total--Urban System 12 4 8 10 4 6 2 2 9
6. Interstate System 1 1 0 0 1 1 1 17. Other State Freeways 8. Other State Highways 2 1 1 1 1 0 1 1 1Total--Rural System 3 1 1 1 1 1 2 1 1 1 2
June 1, 2007
ALL CITIES EXCEPT PORTLAND
68
At I
nter
sect
ion
Not
at I
nter
sect
ion
At
Inte
r. N
on -I
nter
.
ALL CITIES EXCEPT PORTLAND 2006 MOTORHOME CRASHES
4. AGE OF CASUALTY
Number of Persons Killed Number of Persons Injured Total Killed Pedestrians Pedalcyclist Total Injured Pedestrians Pedalcyclist
Total Total Total Total Total TotalMale Male Male Male Male MaleFemale Female Female Female Female Female1. 0 to 4 2. 5 to 9 3. 10 to 14 1 14. 15 to 19 1 1 1 15. 20 to 24 6. 25 to 34 7. 35 to 44 2 28. 45 to 54 2 29. 55 to 64 4 1 5 1 1 10. 65 to 74 1 2 311. 75 & older 1 1 12. Not-stated Totals 3 2 1 14 5 9
Directional Analysis - A crash consisting of a series of collisions, overturning, etc., is classified according to the first damage or injury producing event; includes on roadway and off roadway.5A. MULTIPLE VEH CRASH Total Fatal Injury P.D.O.
1. Entering at angle 3 3 2a. Same dir.- both straight 2b. Same-1 turn, 1 straight 2c. Same-one stopped 1 1 2d. Same-all others 3a. Opposite dir.- both straight 3b. Opposite-1 turn, 1 straight 3c. Opposite-all others 4. Not stated 1 1 Totals 4 1 5
5B. MULTIPLE VEH CRASH Total Fatal Injury P.D.O. 1 11. Moving in opposite dir.
5 3 82. Both moving in same dir. 7 73a. One car parked 2 2 43b. One car stopped in traffic
Junction1. Car go straight2. Car turning right3. Car turning left 4. Car backing 5. All othersTotals
5D. ALL OTHER CRASHES Total Fatal Injury P.D.O.Coll-isionWith
Coll-isionWith
1. Other rd veh or railway train2. Fixed object 1 1 3. Other object or animal4. Overturning 5. Other noncollision 6. Other rd veh or railway train7. Fixed object 3 1 4 8. Other object or animal9. Overturning 1 1 10. Other noncollision11. Not statedTotals 41 1 6
6. PEDESTRIAN ACTION BY AGE
Ages of Pedstrians Killed and InjuredPedestrians Killed Total 0 to 4 5 to 9 10 to 14 15 to 19 20 to 24 25 to 44 45 to 64 65 & older Not stated
1a. X-ing at intersect or X-walk 1b. X-ing not at intersection 2a. Walking in road with traffic 2b. Same against traffic 3. Standing in roadway 4. Push or work on veh in road 5. Other working in roadway 6. Playing in roadway 7. Other in roadway 8. Not in roadway 9. Not stated Totals
7. AGE OF DRIVER All Crashes Fatal Injury 1. 14 & younger 2. 15 3. 16 4. 17 1 1 5. 18 6. 19 7. 20 2 8. 21 9. 22 to 24 3 10. 25 to 34 10 1 4 11. 35 to 44 7 3 12. 45 to 54 8 4 13. 55 to 64 9 1 4 14. 65 to 74 13 1 3 15. 75 & older 4 1 16. Not stated 1 Totals 58 3 20 8. SEX OF DRIVER Injury Fatal All Crashes
1. Male 40 2 13 2. Female 18 1 7 3. Not stated Totals 58 3 20
9. RESIDENCE OF DRIVER All Crashes Fatal Injury
1. Local resident 37 2 13 2. In-state resident 9 5 3. Non resident 11 2 4. Not stated 1 1 0 Totals 58 3 20
10. CRASHES BY CONTRIBUTING FACTOR All InjuryFatal1. Speed too fast
37. Followed too closely 3
1 1 1 2
6. Improper overtaking5. Drove left of center4. Disregard traffic signal3. Passed stop sign2. Failed to yield
3 1 9
8. Made improper turn
Totals 38 2 7
1
3
9 3 7
12. Other 11. Mechanical defect10. Improper driving9. Had been drinking
12. ROAD SURFACECONDITION InjuryFatalAll
1. Dry 25 2 52. Wet 8 23. Snowy or icy4. Other 5. Not statedTotals 33 2 7
13. LIGHT CONDITION InjuryFatalAll1. Daylight 26 1 62. Dawn or Dusk3. Darkness 7 1 14. Not statedTotals 33 2 7
11. VEHICLE TYPE InjuryFatalAll1. Passenger car 32 1 122. Pass Car and trailer 3. Truck or truck tractor 4. Truck tractor with semi-trailer 2 15. Other truck combination 6. Farm tractor and/or equip. 7. Taxicab 8. Bus 9. School bus 10. Motorcycle 11. Motor scooter or moped 12. Others and not stated 33 2 7Totals 67 3 20Special vehicles included above 13. Log trucks14. Emergency (incl. private) 2 215. Military vehicles 16. Other public vehicles
1. Primary State Highways 2. Secondary State Highways 3. County and Local Roads 4. City Streets 5. Not Stated Total--Rural Area
NOTE: THIS YEAR TO DATE represents only those crashes entered onto the database as of the date above. SAME PERIOD LAST YEAR represents all crashes including late reports. MAJOR INJURIES are incapacitating injuries. MINOR INJURIES are non-incapacitating evident injuries.
3. LOCATION Total
PropertyDamage
Nonfatal Injury Fatal Property
DamageNonfatal
InjuryFatalTotalPropertyDamage
Nonfatal Injury Fatal Total Killed Injured
Total On Roadway TotalOff Roadway Number Of Crashes Number Of Persons
1. Below 1,000 2. 1,000 to 2,500 3. 2,501 to 5,000 4. 5,001 to 10,000 5. 10,001 to 25,000 6. 25,001 to 50,000 7. 50,001 to 100,000 8. 100,001 to 200,000 9. City of Portland Only Total - Municipalities
6 6
4 2 4 2
4 2 6 4 2 6
6 6
3 1 2 3 1 2 3 1. Primary State Highways 1 1 1 1 2. Secondary State Highways
3. County and Local Roads 3 2 2 2 2 4. City Streets
5. Not Stated Total--Urban Area 62462 4 6 6. Interstate System 2 2 2 2 37. Other State Freeways 8. Other State Highways 2 2 2 2Total--Urban System 4 2 4 2 2 3
6. Interstate System 7. Other State Freeways 8. Other State Highways Total--Rural System
June 1, 2007
PORTLAND
70
At I
nter
sect
ion
Not
at I
nter
sect
ion
At
Inte
r. N
on -I
nter
.
PORTLAND 2006 MOTORHOME CRASHES
4. AGE OF CASUALTY
Number of Persons Killed Number of Persons Injured Total Killed Pedestrians Pedalcyclist Total Injured Pedestrians Pedalcyclist
Total Total Total Total Total TotalMale Male Male Male Male MaleFemale Female Female Female Female Female1. 0 to 4 2. 5 to 9 3. 10 to 14 4. 15 to 19 1 1 25. 20 to 24 6. 25 to 34 7. 35 to 44 1 2 38. 45 to 54 1 19. 55 to 64 10. 65 to 74 11. 75 & older 12. Not-stated Totals 6 4 2
Directional Analysis - A crash consisting of a series of collisions, overturning, etc., is classified according to the first damage or injury producing event; includes on roadway and off roadway.5A. MULTIPLE VEH CRASH Total Fatal Injury P.D.O.
1. Entering at angle 2a. Same dir.- both straight 2b. Same-1 turn, 1 straight 2c. Same-one stopped 1 1 2 2d. Same-all others 3a. Opposite dir.- both straight 3b. Opposite-1 turn, 1 straight 3c. Opposite-all others 1 1 4. Not stated Totals 2 1 3
5B. MULTIPLE VEH CRASH Total Fatal Injury P.D.O.1. Moving in opposite dir.
1 12. Both moving in same dir. 3a. One car parked
2 23b. One car stopped in traffic 4. Enter/Leave parked pos. 5a. Entering driveway/alley 5b. Leaving driveway/alley 6. All others Totals 3 3
5C. PEDESTRIANCRASHES
All PedCrashes
Fatal Crashes Non-Fatal Injury Crashes
TotalAt
Intersection Non-
Junction TotalAt
IntersectionNon-
Junction1. Car go straight2. Car turning right3. Car turning left 4. Car backing 5. All othersTotals
5D. ALL OTHER CRASHES Total Fatal Injury P.D.O.Coll-isionWith
Coll-isionWith
1. Other rd veh or railway train2. Fixed object 3. Other object or animal 4. Overturning 5. Other noncollision 6. Other rd veh or railway train 7. Fixed object 8. Other object or animal 9. Overturning 10. Other noncollision 11. Not stated Totals
6. PEDESTRIAN ACTION BY AGE
Ages of Pedstrians Killed and InjuredPedestrians Killed Total 0 to 4 5 to 9 10 to 14 15 to 19 20 to 24 25 to 44 45 to 64 65 & older Not stated
1a. X-ing at intersect or X-walk 1b. X-ing not at intersection 2a. Walking in road with traffic 2b. Same against traffic 3. Standing in roadway 4. Push or work on veh in road 5. Other working in roadway 6. Playing in roadway 7. Other in roadway 8. Not in roadway 9. Not stated Totals
7. AGE OF DRIVER All Crashes Fatal Injury 1. 14 & younger 2. 15 3. 16 4. 17 5. 18 6. 19 1 1 7. 20 8. 21 9. 22 to 24 1 1 10. 25 to 34 11. 35 to 44 2 2 12. 45 to 54 1 1 13. 55 to 64 2 1 14. 65 to 74 2 1 15. 75 & older 2 1 16. Not stated 5 4 Totals 16 12 8. SEX OF DRIVER Injury Fatal All Crashes
1. Male 8 6 2. Female 4 2 3. Not stated 4 4 Totals 16 12
9. RESIDENCE OF DRIVER All Crashes Fatal Injury
1. Local resident 8 5 2. In-state resident 3. Non resident 4 3 4. Not stated 4 4 Totals 16 12
10. CRASHES BY CONTRIBUTING FACTOR All InjuryFatal1. Speed too fast
37. Followed too closely 46. Improper overtaking5. Drove left of center4. Disregard traffic signal3. Passed stop sign2. Failed to yield
8. Made improper turn
Totals 6 4 1 1
1
12. Other 11. Mechanical defect10. Improper driving9. Had been drinking
12. ROAD SURFACECONDITION InjuryFatalAll
1. Dry 5 42. Wet 13. Snowy or icy4. Other 5. Not statedTotals 6 4
13. LIGHT CONDITION InjuryFatalAll1. Daylight 5 32. Dawn or Dusk3. Darkness 1 14. Not statedTotals 6 4
11. VEHICLE TYPE InjuryFatalAll1. Passenger car 9 72. Pass Car and trailer 3. Truck or truck tractor 1 14. Truck tractor with semi-trailer 5. Other truck combination 6. Farm tractor and/or equip. 7. Taxicab 8. Bus 9. School bus 10. Motorcycle 11. Motor scooter or moped 12. Others and not stated 6 4Totals 16 12Special vehicles included above 13. Log trucks14. Emergency (incl. private) 15. Military vehicles 16. Other public vehicles
14. MANNER OF COLLISION InjuryFatalAll
1. Head-on2. Rear end 4 33. Angle4. Sideswipe-meeting 5. Sideswipe-overtaking 1 16. Backed into 17. OtherTotals 6 4
11. Count of vehicles, including properly parked vehicles.
Totals include participant records where gender was coded as "unknown".
10. Count of crashes. Crashes with multiple contributing circumstances are counted in all applicable categories.
MULTIPLE VEHICLE CRASHES
7 - 9. Tally of drivers by age, sex, residence & crash severity. Excludes occupants of properly & improperly parked vehicles.
71
Pedalcycle
Crash Summaries
72
73
Col
lisio
n in
volv
ing:
N
on-
coll.
N
on-
coll.
C
ollis
ion
invo
lvin
g:
Non
- co
ll.
Col
lisio
n in
volv
ing:
3C
. RU
RA
L 3A
. Inc
orpo
rate
d A
reas
3B
. UR
BA
N
SUMMARY OF MOTOR VEHICLE TRAFFIC CRASHES 2006 PEDALCYCLE CRASHESForIn
12 3 1 1 2 12 2 16 2 12 3 17 3. County and Local Roads 6 6 6 6 6 4. City Streets
5. Not Stated 44 4 2 1 3 2 36 3 41 2 38 4 44 Total--Rural Area
NOTE: THIS YEAR TO DATE represents only those crashes entered onto the database as of the date above. SAME PERIOD LAST YEAR represents all crashes including late reports. MAJOR INJURIES are incapacitating injuries. MINOR INJURIES are non-incapacitating evident injuries.
3. LOCATION Total
PropertyDamage
Nonfatal Injury Fatal Property
DamageNonfatal
InjuryFatalTotalPropertyDamage
Nonfatal Injury Fatal Total Killed Injured
Total On Roadway TotalOff Roadway Number Of Crashes Number Of Persons
1. Below 1,000 2. 1,000 to 2,500 3. 2,501 to 5,000 4. 5,001 to 10,000 5. 10,001 to 25,000 6. 25,001 to 50,000 7. 50,001 to 100,000 8. 100,001 to 200,000 9. City of Portland Only Total - Municipalities
2 3
3 11 46 92 75
154 97
205 683 5
3 11 46 90 75
151 97
195 10 668 10
3 3 9 9
41 41 2 84 86
67 67 2 135 137
91 91 179 9 188
4 609 9 622
2 2 5 5 6 6 8 8
1 16 17 6 6
16 1 17 1 59 1 61
3 11 49 96 2 75
155 3 99
200 688 5
123 5 13 4 17 3 107 110 3 120 4 127 1. Primary State Highways 21 4 4 17 17 21 21 2. Secondary State Highways 23 4 4 19 19 23 23 3. County and Local Roads
535 5 1 42 1 44 7 476 4 487 8 518 5 531 4. City Streets 5. Not Stated Total--Urban Area 702101 63 5 6910619463311 682 9 702 6. Interstate System 7. Other State Freeways 2 2 2 2 28. Other State Highways 146 4 139 3 125 0 122 3 21 4 17 5 142Total--Urban System 148 4 141 3 127 124 3 21 4 17 5 144
6. Interstate System 7. Other State Freeways 8. Other State Highways 21 1 20 19 1 18 2 2 1 26Total--Rural System 21 1 20 19 1 18 2 2 1 26
June 1, 2007
STATE OF OREGON
74
At I
nter
sect
ion
Not
at I
nter
sect
ion
At
Inte
r. N
on -I
nter
.
STATE OF OREGON 2006 PEDALCYCLE CRASHES
4. AGE OF CASUALTY
Number of Persons Killed Number of Persons Injured Total Killed Pedestrians Pedalcyclist Total Injured Pedestrians Pedalcyclist
Total Total Total Total Total TotalMale Male Male Male Male MaleFemale Female Female Female Female Female1. 0 to 4 1 1 1 12. 5 to 9 4 22 4 19 23 183. 10 to 14 14 80 15 66 81 664. 15 to 19 22 93 25 72 97 715. 20 to 24 22 79 22 57 79 576. 25 to 34 31 134 35 104 139 1 1 1 1 1037. 35 to 44 19 99 19 82 101 2 2 2 2 808. 45 to 54 18 93 19 76 95 4 3 1 4 3 1 759. 55 to 64 5 40 6 37 43 4 3 1 4 3 1 3510. 65 to 74 2 13 3 12 15 2 2 2 2 1111. 75 & older 8 8 8 1 1 1 1 812. Not-stated 13 63 13 49 64 49Totals 14 11 3 14 11 3 746 583 161 725 574 150
Directional Analysis - A crash consisting of a series of collisions, overturning, etc., is classified according to the first damage or injury producing event; includes on roadway and off roadway.5A. MULTIPLE VEH CRASH Total Fatal Injury P.D.O.
1. Entering at angle 1 1 2a. Same dir.- both straight 2b. Same-1 turn, 1 straight 2c. Same-one stopped 1 1 2d. Same-all others 3a. Opposite dir.- both straight 3b. Opposite-1 turn, 1 straight 3c. Opposite-all others 4. Not stated Totals 2 2
5B. MULTIPLE VEH CRASH Total Fatal Injury P.D.O.1. Moving in opposite dir. 2. Both moving in same dir. 3a. One car parked 3b. One car stopped in traffic 4. Enter/Leave parked pos. 5a. Entering driveway/alley 5b. Leaving driveway/alley 6. All others Totals
5C. PEDESTRIANCRASHES
All PedCrashes
Fatal Crashes Non-Fatal Injury Crashes
TotalAt
Intersection Non-
Junction TotalAt
IntersectionNon-
Junction1. Car go straight2. Car turning right3. Car turning left 4. Car backing 5. All othersTotals
5D. ALL OTHER CRASHES Total Fatal Injury P.D.O.Coll-isionWith
Coll-isionWith
1. Other rd veh or railway train 6 439 4 449 2. Fixed object3. Other object or animal 4. Overturning 5. Other noncollision6. Other rd veh or railway train 7 279 7 293 7. Fixed object 2 2 8. Other object or animal9. Overturning 10. Other noncollision 11. Not statedTotals 13718 13 744
6. PEDESTRIAN ACTION BY AGE
Ages of Pedstrians Killed and InjuredPedestrians Killed Total 0 to 4 5 to 9 10 to 14 15 to 19 20 to 24 25 to 44 45 to 64 65 & older Not stated
1a. X-ing at intersect or X-walk 1b. X-ing not at intersection 2a. Walking in road with traffic 2b. Same against traffic 3. Standing in roadway 4. Push or work on veh in road 5. Other working in roadway 6. Playing in roadway 7. Other in roadway 8. Not in roadway 9. Not stated Totals
7. AGE OF DRIVER All Crashes Fatal Injury 1. 14 & younger 2. 15 3. 16 9 9 4. 17 18 18 5. 18 15 1 14 6. 19 16 16 7. 20 9 9 8. 21 14 14 9. 22 to 24 35 2 33 10. 25 to 34 127 3 122 11. 35 to 44 134 2 127 12. 45 to 54 135 2 132 13. 55 to 64 135 2 128 14. 65 to 74 57 57 15. 75 & older 43 1 42 16. Not stated 4 4 Totals 751 13 725 8. SEX OF DRIVER Injury Fatal All Crashes
1. Male 404 8 390 2. Female 346 5 334 3. Not stated 1 1 Totals 751 13 725
9. RESIDENCE OF DRIVER All Crashes Fatal Injury
1. Local resident 687 9 666 2. In-state resident 31 2 29 3. Non resident 27 26 4. Not stated 6 2 4 Totals 751 13 725
10. CRASHES BY CONTRIBUTING FACTOR All InjuryFatal1. Speed too fast
10 8
11 48 30
7. Followed too closely 13 2
1
10 11 50 30
6. Improper overtaking5. Drove left of center4. Disregard traffic signal3. Passed stop sign2. Failed to yield 497 3 486
34 1 36
8. Made improper turn
Totals 841 19 807 41
2 98 15 24
2
4 5 1
45 2
102 20 25
12. Other 11. Mechanical defect10. Improper driving9. Had been drinking
12. ROAD SURFACECONDITION InjuryFatalAll
1. Dry 620 10 6012. Wet 119 2 1143. Snowy or icy4. Other 5. Not stated 7 1 5Totals 746 13 720
13. LIGHT CONDITION InjuryFatalAll1. Daylight 588 8 5692. Dawn or Dusk 36 1 343. Darkness 120 3 1164. Not stated 2 1 1Totals 746 13 720
11. VEHICLE TYPE InjuryFatalAll1. Passenger car 722 11 6982. Pass Car and trailer 5 53. Truck or truck tractor 2 24. Truck tractor with semi-trailer 7 1 65. Other truck combination 6. Farm tractor and/or equip. 7. Taxicab 2 28. Bus 7 79. School bus 1 110. Motorcycle 5 1 411. Motor scooter or moped 12. Others and not stated 2 2Totals 753 13 727Special vehicles included above 13. Log trucks 2 1 114. Emergency (incl. private) 3 315. Military vehicles 16. Other public vehicles 10 10
14. MANNER OF COLLISION InjuryFatalAll
1. Head-on2. Rear end 1 13. Angle 1 14. Sideswipe-meeting 5. Sideswipe-overtaking 6. Backed into 7. OtherTotals 2 2
11. Count of vehicles, including properly parked vehicles.
Totals include participant records where gender was coded as "unknown".
10. Count of crashes. Crashes with multiple contributing circumstances are counted in all applicable categories.
MULTIPLE VEHICLE CRASHES
7 - 9. Tally of drivers by age, sex, residence & crash severity. Excludes occupants of properly & improperly parked vehicles.
75
Col
lisio
n in
volv
ing:
N
on-
coll.
N
on-
coll.
C
ollis
ion
invo
lvin
g:
Non
- co
ll.
Col
lisio
n in
volv
ing:
3C
. RU
RA
L 3A
. Inc
orpo
rate
d A
reas
3B
. UR
BA
N
SUMMARY OF MOTOR VEHICLE TRAFFIC CRASHES 2006 PEDALCYCLE CRASHESForIn
1A. TYPE OF MOTOR VEHICLE CRASH
Number of CrashesTotal On Roadway
Total Fatal Nonfatal
Injury Property Damage Total Fatal
NonfatalInjury
PropertyDamage Total Fatal
NonfatalInjury
Property Damage
Off Roadway
1. Overturning 2. Other noncollision 3. Pedestrian 4. MV in transport 5. MV on other roadway 6. Parked MV 7. Railway train 8. Pedalcyclist 29 4 23 2 27 3 22 2 2 1 19. Animal 10. Fixed object 11. Other object 12. Totals 29 4 23 2 27 3 22 2 2 1 1
This summary includes reports andinformation available on:
Report published by:
CRASH ANALYSIS AND REPORTING
1B. TYPE OF MOTOR VEHICLE CRASH
Number Of PersonsTotal Killed Total Injured Major Injuries Minor Injuries Possible Injuries No Injury
1. Overturning 2. Other noncollision 3. Pedestrian 4. MV in transport 5. MV on other roadway 6. Parked MV 7. Railway train 8. Pedalcyclist 4 28 5 18 5 449. Animal 10. Fixed object 11. Other object 12. Totals 4 28 5 18 5 44
2B. MILEAGE RATES ThisYearTo
Date
LastYearSamePeriod
PercentChange
1. Motor vehicle traffic deaths 2. Estimated vehicle miles traveled (in millions)
3. Death rate per 100 million vehicle miles 4. Fatal crash rate per 100 million vehicle miles
5. Crash rate per million vehicle miles 6. Fatal crashes
100%
100%
4 2
4 2
2A. TYPE OF MOTOR VEHICLE CRASH
Total On Roadway This Year To Date This Year To Date Same Period Last Year Same Period Last Year
All Crashes
Persons Killed
Persons Injured
AllCrashes
AllCrashes
AllCrashes
PersonsKilled
PersonsKilled
PersonsKilled
PersonsInjured
Persons Injured
PersonsInjured
1. Overturning 2. Other noncollision 3. Pedestrian 4. MV in transport 5. MV on other roadway 6. Parked MV 7. Railway train
12 3 1 1 2 12 2 16 2 12 3 17 3. County and Local Roads 4. City Streets 5. Not Stated
28 4 1 1 2 2 22 3 27 2 23 4 29 Total--Rural Area
NOTE: THIS YEAR TO DATE represents only those crashes entered onto the database as of the date above. SAME PERIOD LAST YEAR represents all crashes including late reports. MAJOR INJURIES are incapacitating injuries. MINOR INJURIES are non-incapacitating evident injuries.
3. LOCATION Total
PropertyDamage
Nonfatal Injury Fatal Property
DamageNonfatal
InjuryFatalTotalPropertyDamage
Nonfatal Injury Fatal Total Killed Injured
Total On Roadway TotalOff Roadway Number Of Crashes Number Of Persons
1. Below 1,000 2. 1,000 to 2,500 3. 2,501 to 5,000 4. 5,001 to 10,000 5. 10,001 to 25,000 6. 25,001 to 50,000 7. 50,001 to 100,000 8. 100,001 to 200,000 9. City of Portland Only Total - Municipalities 1. Primary State Highways 2. Secondary State Highways 3. County and Local Roads 4. City Streets 5. Not Stated Total--Urban Area 6. Interstate System 7. Other State Freeways 8. Other State Highways Total--Urban System
6. Interstate System 7. Other State Freeways 8. Other State Highways 12 1 11 11 1 10 1 1 1 16Total--Rural System 12 1 11 11 1 10 1 1 1 16
June 1, 2007
OREGON RURAL AREAS
76
At I
nter
sect
ion
Not
at I
nter
sect
ion
At
Inte
r. N
on -I
nter
.
OREGON RURAL AREAS 2006 PEDALCYCLE CRASHES
4. AGE OF CASUALTY
Number of Persons Killed Number of Persons Injured Total Killed Pedestrians Pedalcyclist Total Injured Pedestrians Pedalcyclist
Total Total Total Total Total TotalMale Male Male Male Male MaleFemale Female Female Female Female Female1. 0 to 4 2. 5 to 9 3. 10 to 14 1 7 2 6 8 64. 15 to 19 3 2 3 5 35. 20 to 24 6. 25 to 34 4 4 4 47. 35 to 44 1 1 1 1 1 1 1 18. 45 to 54 1 3 2 3 5 1 1 1 1 29. 55 to 64 1 2 1 1 2 1 1 1 1 110. 65 to 74 1 1 1 111. 75 & older 1 1 1 1 1 1 1 112. Not-stated 1 1 1 1Totals 4 2 2 4 2 2 28 20 8 23 19 4
Directional Analysis - A crash consisting of a series of collisions, overturning, etc., is classified according to the first damage or injury producing event; includes on roadway and off roadway.5A. MULTIPLE VEH CRASH Total Fatal Injury P.D.O.
1. Entering at angle 2a. Same dir.- both straight 2b. Same-1 turn, 1 straight 2c. Same-one stopped 2d. Same-all others 3a. Opposite dir.- both straight 3b. Opposite-1 turn, 1 straight 3c. Opposite-all others 4. Not stated Totals
5B. MULTIPLE VEH CRASH Total Fatal Injury P.D.O.1. Moving in opposite dir. 2. Both moving in same dir. 3a. One car parked 3b. One car stopped in traffic 4. Enter/Leave parked pos. 5a. Entering driveway/alley 5b. Leaving driveway/alley 6. All others Totals
5C. PEDESTRIANCRASHES
All PedCrashes
Fatal Crashes Non-Fatal Injury Crashes
TotalAt
Intersection Non-
Junction TotalAt
IntersectionNon-
Junction1. Car go straight2. Car turning right3. Car turning left 4. Car backing 5. All othersTotals
5D. ALL OTHER CRASHES Total Fatal Injury P.D.O.Coll-isionWith
Coll-isionWith
1. Other rd veh or railway train 9 2 11 2. Fixed object3. Other object or animal 4. Overturning 5. Other noncollision6. Other rd veh or railway train 2 14 2 18 7. Fixed object8. Other object or animal 9. Overturning 10. Other noncollision 11. Not statedTotals 223 4 29
6. PEDESTRIAN ACTION BY AGE
Ages of Pedstrians Killed and InjuredPedestrians Killed Total 0 to 4 5 to 9 10 to 14 15 to 19 20 to 24 25 to 44 45 to 64 65 & older Not stated
1a. X-ing at intersect or X-walk 1b. X-ing not at intersection 2a. Walking in road with traffic 2b. Same against traffic 3. Standing in roadway 4. Push or work on veh in road 5. Other working in roadway 6. Playing in roadway 7. Other in roadway 8. Not in roadway 9. Not stated Totals
7. AGE OF DRIVER All Crashes Fatal Injury 1. 14 & younger 2. 15 3. 16 4. 17 5. 18 6. 19 7. 20 8. 21 9. 22 to 24 1 1 10. 25 to 34 5 1 4 11. 35 to 44 3 1 2 12. 45 to 54 4 1 3 13. 55 to 64 7 5 14. 65 to 74 4 4 15. 75 & older 5 1 4 16. Not stated Totals 29 4 23 8. SEX OF DRIVER Injury Fatal All Crashes
1. Male 17 3 14 2. Female 12 1 9 3. Not stated Totals 29 4 23
9. RESIDENCE OF DRIVER All Crashes Fatal Injury
1. Local resident 23 1 21 2. In-state resident 4 2 2 3. Non resident 1 0 4. Not stated 1 1 0 Totals 29 4 23
10. CRASHES BY CONTRIBUTING FACTOR All InjuryFatal1. Speed too fast
2 2
2
7. Followed too closely 1 1 3
2
2
6. Improper overtaking5. Drove left of center4. Disregard traffic signal3. Passed stop sign2. Failed to yield 12 1 11
4 1 5
8. Made improper turn
Totals 34 5 27 3
1 1 1
1 1
4
1 2 2
12. Other 11. Mechanical defect10. Improper driving9. Had been drinking
12. ROAD SURFACECONDITION InjuryFatalAll
1. Dry 26 1 232. Wet 2 23. Snowy or icy4. Other 5. Not stated 1 1Totals 29 4 23
13. LIGHT CONDITION InjuryFatalAll1. Daylight 24 3 192. Dawn or Dusk 1 13. Darkness 3 34. Not stated 1 1Totals 29 4 23
11. VEHICLE TYPE InjuryFatalAll1. Passenger car 25 2 212. Pass Car and trailer 2 23. Truck or truck tractor 4. Truck tractor with semi-trailer 1 15. Other truck combination 6. Farm tractor and/or equip. 7. Taxicab 8. Bus 9. School bus10. Motorcycle 1 111. Motor scooter or moped 12. Others and not stated Totals 29 4 23Special vehicles included above 13. Log trucks 1 114. Emergency (incl. private) 15. Military vehicles 16. Other public vehicles
14. MANNER OF COLLISION InjuryFatalAll
1. Head-on2. Rear end 3. Angle 4. Sideswipe-meeting 5. Sideswipe-overtaking 6. Backed into 7. Other Totals
11. Count of vehicles, including properly parked vehicles.
Totals include participant records where gender was coded as "unknown".
10. Count of crashes. Crashes with multiple contributing circumstances are counted in all applicable categories.
MULTIPLE VEHICLE CRASHES
7 - 9. Tally of drivers by age, sex, residence & crash severity. Excludes occupants of properly & improperly parked vehicles.
77
Col
lisio
n in
volv
ing:
N
on-
coll.
N
on-
coll.
C
ollis
ion
invo
lvin
g:
Non
- co
ll.
Col
lisio
n in
volv
ing:
3C
. RU
RA
L 3A
. Inc
orpo
rate
d A
reas
3B
. UR
BA
N
SUMMARY OF MOTOR VEHICLE TRAFFIC CRASHES 2006 PEDALCYCLE CRASHESForIn
10 1 1 8 8 9 9 1. Primary State Highways 2. Secondary State Highways 3. County and Local Roads
6 6 6 6 6 4. City Streets 5. Not Stated
16 1 1 14 14 15 15 Total--Rural Area
NOTE: THIS YEAR TO DATE represents only those crashes entered onto the database as of the date above. SAME PERIOD LAST YEAR represents all crashes including late reports. MAJOR INJURIES are incapacitating injuries. MINOR INJURIES are non-incapacitating evident injuries.
3. LOCATION Total
PropertyDamage
Nonfatal Injury Fatal Property
DamageNonfatal
InjuryFatalTotalPropertyDamage
Nonfatal Injury Fatal Total Killed Injured
Total On Roadway TotalOff Roadway Number Of Crashes Number Of Persons
1. Below 1,000 2. 1,000 to 2,500 3. 2,501 to 5,000 4. 5,001 to 10,000 5. 10,001 to 25,000 6. 25,001 to 50,000 7. 50,001 to 100,000 8. 100,001 to 200,000 9. City of Portland Only Total - Municipalities
2 3
3 11 46 92 75
154 97
205 683 5
3 11 46 90 75
151 97
195 10 668 10
3 3 9 9
41 41 2 84 86
67 67 2 135 137
91 91 179 9 188
4 609 9 622
2 2 5 5 6 6 8 8
1 16 17 6 6
16 1 17 1 59 1 61
3 11 49 96 2 75
155 3 99
200 688 5
123 5 13 4 17 3 107 110 3 120 4 127 1. Primary State Highways 21 4 4 17 17 21 21 2. Secondary State Highways 23 4 4 19 19 23 23 3. County and Local Roads
535 5 1 42 1 44 7 476 4 487 8 518 5 531 4. City Streets 5. Not Stated Total--Urban Area 702101 63 5 6910619463311 682 9 702 6. Interstate System 7. Other State Freeways 2 2 2 2 28. Other State Highways 146 4 139 3 125 0 122 3 21 4 17 5 142Total--Urban System 148 4 141 3 127 124 3 21 4 17 5 144
6. Interstate System 7. Other State Freeways 8. Other State Highways 9 9 8 8 1 1 10Total--Rural System 9 9 8 8 1 1 10
June 1, 2007
OREGON CITIES AND URBAN AREAS
78
At I
nter
sect
ion
Not
at I
nter
sect
ion
At
Inte
r. N
on -I
nter
.
OREGON CITIES AND URBAN AREAS 2006 PEDALCYCLE CRASHES
4. AGE OF CASUALTY
Number of Persons Killed Number of Persons Injured Total Killed Pedestrians Pedalcyclist Total Injured Pedestrians Pedalcyclist
Total Total Total Total Total TotalMale Male Male Male Male MaleFemale Female Female Female Female Female1. 0 to 4 1 1 1 12. 5 to 9 4 22 4 19 23 183. 10 to 14 13 73 13 60 73 604. 15 to 19 22 90 23 69 92 685. 20 to 24 22 79 22 57 79 576. 25 to 34 31 130 35 100 135 1 1 1 1 997. 35 to 44 19 98 19 81 100 1 1 1 1 798. 45 to 54 17 90 17 73 90 3 3 3 3 739. 55 to 64 4 38 5 36 41 3 2 1 3 2 1 3410. 65 to 74 2 12 3 11 14 2 2 2 2 1011. 75 & older 7 7 7 712. Not-stated 12 62 12 49 63 49Totals 10 9 1 10 9 1 718 563 153 702 555 146
Directional Analysis - A crash consisting of a series of collisions, overturning, etc., is classified according to the first damage or injury producing event; includes on roadway and off roadway.5A. MULTIPLE VEH CRASH Total Fatal Injury P.D.O.
1. Entering at angle 1 1 2a. Same dir.- both straight 2b. Same-1 turn, 1 straight 2c. Same-one stopped 1 1 2d. Same-all others 3a. Opposite dir.- both straight 3b. Opposite-1 turn, 1 straight 3c. Opposite-all others 4. Not stated Totals 2 2
5B. MULTIPLE VEH CRASH Total Fatal Injury P.D.O.1. Moving in opposite dir. 2. Both moving in same dir. 3a. One car parked 3b. One car stopped in traffic 4. Enter/Leave parked pos. 5a. Entering driveway/alley 5b. Leaving driveway/alley 6. All others Totals
5C. PEDESTRIANCRASHES
All PedCrashes
Fatal Crashes Non-Fatal Injury Crashes
TotalAt
Intersection Non-
Junction TotalAt
IntersectionNon-
Junction1. Car go straight2. Car turning right3. Car turning left 4. Car backing 5. All othersTotals
5D. ALL OTHER CRASHES Total Fatal Injury P.D.O.Coll-isionWith
Coll-isionWith
1. Other rd veh or railway train 6 430 2 438 2. Fixed object3. Other object or animal 4. Overturning 5. Other noncollision6. Other rd veh or railway train 5 265 5 275 7. Fixed object 2 2 8. Other object or animal9. Overturning 10. Other noncollision 11. Not statedTotals 11695 9 715
6. PEDESTRIAN ACTION BY AGE
Ages of Pedstrians Killed and InjuredPedestrians Killed Total 0 to 4 5 to 9 10 to 14 15 to 19 20 to 24 25 to 44 45 to 64 65 & older Not stated
1a. X-ing at intersect or X-walk 1b. X-ing not at intersection 2a. Walking in road with traffic 2b. Same against traffic 3. Standing in roadway 4. Push or work on veh in road 5. Other working in roadway 6. Playing in roadway 7. Other in roadway 8. Not in roadway 9. Not stated Totals
7. AGE OF DRIVER All Crashes Fatal Injury 1. 14 & younger 2. 15 3. 16 9 9 4. 17 18 18 5. 18 15 1 14 6. 19 16 16 7. 20 9 9 8. 21 14 14 9. 22 to 24 34 2 32 10. 25 to 34 122 2 118 11. 35 to 44 131 1 125 12. 45 to 54 131 1 129 13. 55 to 64 128 2 123 14. 65 to 74 53 53 15. 75 & older 38 38 16. Not stated 4 4 Totals 722 9 702 8. SEX OF DRIVER Injury Fatal All Crashes
1. Male 387 5 376 2. Female 334 4 325 3. Not stated 1 1 Totals 722 9 702
9. RESIDENCE OF DRIVER All Crashes Fatal Injury
1. Local resident 664 8 645 2. In-state resident 27 27 3. Non resident 26 26 4. Not stated 5 1 4 Totals 722 9 702
10. CRASHES BY CONTRIBUTING FACTOR All InjuryFatal1. Speed too fast
10 6 9
48 28
7. Followed too closely 12 1
1
7 9
50 28
6. Improper overtaking5. Drove left of center4. Disregard traffic signal3. Passed stop sign2. Failed to yield 485 2 475
30 31
8. Made improper turn
Totals 807 14 780 38
2 97 14 23
2
4 4
41 2
101 18 23
12. Other 11. Mechanical defect10. Improper driving9. Had been drinking
12. ROAD SURFACECONDITION InjuryFatalAll
1. Dry 594 9 5782. Wet 117 1143. Snowy or icy4. Other 5. Not stated 6 5Totals 717 9 697
13. LIGHT CONDITION InjuryFatalAll1. Daylight 564 5 5502. Dawn or Dusk 35 1 333. Darkness 117 3 1134. Not stated 1 1Totals 717 9 697
11. VEHICLE TYPE InjuryFatalAll1. Passenger car 697 9 6772. Pass Car and trailer 3 33. Truck or truck tractor 2 24. Truck tractor with semi-trailer 6 65. Other truck combination 6. Farm tractor and/or equip. 7. Taxicab 2 28. Bus 7 79. School bus 1 110. Motorcycle 4 411. Motor scooter or moped 12. Others and not stated 2 2Totals 724 9 704Special vehicles included above 13. Log trucks 1 114. Emergency (incl. private) 3 315. Military vehicles 16. Other public vehicles 10 10
14. MANNER OF COLLISION InjuryFatalAll
1. Head-on2. Rear end 1 13. Angle 1 14. Sideswipe-meeting 5. Sideswipe-overtaking 6. Backed into 7. OtherTotals 2 2
11. Count of vehicles, including properly parked vehicles.
Totals include participant records where gender was coded as "unknown".
10. Count of crashes. Crashes with multiple contributing circumstances are counted in all applicable categories.
MULTIPLE VEHICLE CRASHES
7 - 9. Tally of drivers by age, sex, residence & crash severity. Excludes occupants of properly & improperly parked vehicles.
79
Col
lisio
n in
volv
ing:
N
on-
coll.
N
on-
coll.
C
ollis
ion
invo
lvin
g:
Non
- co
ll.
Col
lisio
n in
volv
ing:
3C
. RU
RA
L 3A
. Inc
orpo
rate
d A
reas
3B
. UR
BA
N
SUMMARY OF MOTOR VEHICLE TRAFFIC CRASHES 2006 PEDALCYCLE CRASHESForIn
1A. TYPE OF MOTOR VEHICLE CRASH
Number of CrashesTotal On Roadway
Total Fatal Nonfatal
Injury Property Damage Total Fatal
NonfatalInjury
PropertyDamage Total Fatal
NonfatalInjury
Property Damage
Off Roadway
1. Overturning 2. Other noncollision 3. Pedestrian 4. MV in transport 5. MV on other roadway 6. Parked MV 7. Railway train 8. Pedalcyclist 478 5 473 434 4 430 44 1 439. Animal 10. Fixed object 11. Other object 12. Totals 478 5 473 434 4 430 44 1 43
This summary includes reports andinformation available on:
Report published by:
CRASH ANALYSIS AND REPORTING
1B. TYPE OF MOTOR VEHICLE CRASH
Number Of PersonsTotal Killed Total Injured Major Injuries Minor Injuries Possible Injuries No Injury
1. Overturning 2. Other noncollision 3. Pedestrian 4. MV in transport 5. MV on other roadway 6. Parked MV 7. Railway train 8. Pedalcyclist 5 488 56 287 145 6169. Animal 10. Fixed object 11. Other object 12. Totals 5 488 56 287 145 616
2B. MILEAGE RATES ThisYearTo
Date
LastYearSamePeriod
PercentChange
1. Motor vehicle traffic deaths 2. Estimated vehicle miles traveled (in millions)
3. Death rate per 100 million vehicle miles 4. Fatal crash rate per 100 million vehicle miles
5. Crash rate per million vehicle miles 6. Fatal crashes
67%
67%
5 3
5 3
2A. TYPE OF MOTOR VEHICLE CRASH
Total On Roadway This Year To Date This Year To Date Same Period Last Year Same Period Last Year
All Crashes
Persons Killed
Persons Injured
AllCrashes
AllCrashes
AllCrashes
PersonsKilled
PersonsKilled
PersonsKilled
PersonsInjured
Persons Injured
PersonsInjured
1. Overturning 2. Other noncollision 3. Pedestrian
1 1 1 14. MV in transport 5. MV on other roadway 6. Parked MV 7. Railway train
10 1 1 8 8 9 9 1. Primary State Highways 2. Secondary State Highways 3. County and Local Roads
6 6 6 6 6 4. City Streets 5. Not Stated
16 1 1 14 14 15 15 Total--Rural Area
NOTE: THIS YEAR TO DATE represents only those crashes entered onto the database as of the date above. SAME PERIOD LAST YEAR represents all crashes including late reports. MAJOR INJURIES are incapacitating injuries. MINOR INJURIES are non-incapacitating evident injuries.
3. LOCATION Total
PropertyDamage
Nonfatal Injury Fatal Property
DamageNonfatal
InjuryFatalTotalPropertyDamage
Nonfatal Injury Fatal Total Killed Injured
Total On Roadway TotalOff Roadway Number Of Crashes Number Of Persons
1. Below 1,000 2. 1,000 to 2,500 3. 2,501 to 5,000 4. 5,001 to 10,000 5. 10,001 to 25,000 6. 25,001 to 50,000 7. 50,001 to 100,000 8. 100,001 to 200,000 9. City of Portland Only Total - Municipalities
3. County and Local Roads 351 5 28 1 29 310 4 314 338 5 343 4. City Streets
5. Not Stated Total--Urban Area 4725 42 1 434164420 458 5 463 6. Interstate System 7. Other State Freeways 2 2 2 2 28. Other State Highways 118 118 104 104 14 14 119Total--Urban System 120 120 106 106 14 14 121
6. Interstate System 7. Other State Freeways 8. Other State Highways 9 9 8 8 1 1 10Total--Rural System 9 9 8 8 1 1 10
June 1, 2007
ALL CITIES EXCEPT PORTLAND
80
At I
nter
sect
ion
Not
at I
nter
sect
ion
At
Inte
r. N
on -I
nter
.
ALL CITIES EXCEPT PORTLAND 2006 PEDALCYCLE CRASHES
4. AGE OF CASUALTY
Number of Persons Killed Number of Persons Injured Total Killed Pedestrians Pedalcyclist Total Injured Pedestrians Pedalcyclist
Total Total Total Total Total TotalMale Male Male Male Male MaleFemale Female Female Female Female Female1. 0 to 4 2. 5 to 9 3 20 3 18 21 173. 10 to 14 10 64 10 54 64 544. 15 to 19 19 73 20 54 74 545. 20 to 24 13 49 13 36 49 366. 25 to 34 19 65 23 46 69 467. 35 to 44 13 64 13 53 66 1 1 1 1 518. 45 to 54 14 64 14 50 64 2 2 2 2 509. 55 to 64 3 27 3 26 29 2 2 2 2 2410. 65 to 74 1 8 2 7 9 711. 75 & older 7 7 7 712. Not-stated 9 36 9 26 36 26Totals 5 5 5 5 488 377 110 477 372 104
Directional Analysis - A crash consisting of a series of collisions, overturning, etc., is classified according to the first damage or injury producing event; includes on roadway and off roadway.5A. MULTIPLE VEH CRASH Total Fatal Injury P.D.O.
1. Entering at angle 2a. Same dir.- both straight 2b. Same-1 turn, 1 straight 2c. Same-one stopped 2d. Same-all others 3a. Opposite dir.- both straight 3b. Opposite-1 turn, 1 straight 3c. Opposite-all others 4. Not stated Totals
5B. MULTIPLE VEH CRASH Total Fatal Injury P.D.O.1. Moving in opposite dir. 2. Both moving in same dir. 3a. One car parked 3b. One car stopped in traffic 4. Enter/Leave parked pos. 5a. Entering driveway/alley 5b. Leaving driveway/alley 6. All others Totals
5C. PEDESTRIANCRASHES
All PedCrashes
Fatal Crashes Non-Fatal Injury Crashes
TotalAt
Intersection Non-
Junction TotalAt
IntersectionNon-
Junction1. Car go straight2. Car turning right3. Car turning left 4. Car backing 5. All othersTotals
5D. ALL OTHER CRASHES Total Fatal Injury P.D.O.Coll-isionWith
Coll-isionWith
1. Other rd veh or railway train 286 2 288 2. Fixed object3. Other object or animal 4. Overturning 5. Other noncollision6. Other rd veh or railway train 187 3 190 7. Fixed object8. Other object or animal 9. Overturning 10. Other noncollision 11. Not statedTotals 473 5 478
6. PEDESTRIAN ACTION BY AGE
Ages of Pedstrians Killed and InjuredPedestrians Killed Total 0 to 4 5 to 9 10 to 14 15 to 19 20 to 24 25 to 44 45 to 64 65 & older Not stated
1a. X-ing at intersect or X-walk 1b. X-ing not at intersection 2a. Walking in road with traffic 2b. Same against traffic 3. Standing in roadway 4. Push or work on veh in road 5. Other working in roadway 6. Playing in roadway 7. Other in roadway 8. Not in roadway 9. Not stated Totals
7. AGE OF DRIVER All Crashes Fatal Injury 1. 14 & younger 2. 15 3. 16 8 8 4. 17 11 11 5. 18 13 1 12 6. 19 11 11 7. 20 7 7 8. 21 10 10 9. 22 to 24 21 1 20 10. 25 to 34 74 1 73 11. 35 to 44 82 1 81 12. 45 to 54 93 1 92 13. 55 to 64 86 86 14. 65 to 74 34 34 15. 75 & older 27 27 16. Not stated 1 1 Totals 478 5 473 8. SEX OF DRIVER Injury Fatal All Crashes
1. Male 247 4 243 2. Female 230 1 229 3. Not stated 1 1 Totals 478 5 473
9. RESIDENCE OF DRIVER All Crashes Fatal Injury
1. Local resident 438 4 434 2. In-state resident 24 24 3. Non resident 13 13 4. Not stated 3 1 2 Totals 478 5 473
10. CRASHES BY CONTRIBUTING FACTOR All InjuryFatal1. Speed too fast
3 5 8
35 19
7. Followed too closely 3
1
5 8
36 19
6. Improper overtaking5. Drove left of center4. Disregard traffic signal3. Passed stop sign2. Failed to yield 321 2 319
23 23
8. Made improper turn
Totals 549 8 541 22
1 85 8
13
1
2 2
23 1
87 10 13
12. Other 11. Mechanical defect10. Improper driving9. Had been drinking
12. ROAD SURFACECONDITION InjuryFatalAll
1. Dry 401 5 3962. Wet 73 733. Snowy or icy4. Other 5. Not stated 4 4Totals 478 5 473
13. LIGHT CONDITION InjuryFatalAll1. Daylight 388 3 3852. Dawn or Dusk 20 203. Darkness 70 2 684. Not statedTotals 478 5 473
11. VEHICLE TYPE InjuryFatalAll1. Passenger car 463 5 4582. Pass Car and trailer 2 23. Truck or truck tractor 4. Truck tractor with semi-trailer 5 55. Other truck combination 6. Farm tractor and/or equip. 7. Taxicab8. Bus 3 39. School bus 1 110. Motorcycle 4 411. Motor scooter or moped 12. Others and not stated 1 1Totals 479 5 474Special vehicles included above 13. Log trucks 1 114. Emergency (incl. private) 1 115. Military vehicles 16. Other public vehicles 5 5
14. MANNER OF COLLISION InjuryFatalAll
1. Head-on2. Rear end 3. Angle 4. Sideswipe-meeting 5. Sideswipe-overtaking 6. Backed into 7. Other Totals
11. Count of vehicles, including properly parked vehicles.
Totals include participant records where gender was coded as "unknown".
10. Count of crashes. Crashes with multiple contributing circumstances are counted in all applicable categories.
MULTIPLE VEHICLE CRASHES
7 - 9. Tally of drivers by age, sex, residence & crash severity. Excludes occupants of properly & improperly parked vehicles.
81
Col
lisio
n in
volv
ing:
N
on-
coll.
N
on-
coll.
C
ollis
ion
invo
lvin
g:
Non
- co
ll.
Col
lisio
n in
volv
ing:
3C
. RU
RA
L 3A
. Inc
orpo
rate
d A
reas
3B
. UR
BA
N
SUMMARY OF MOTOR VEHICLE TRAFFIC CRASHES 2006 PEDALCYCLE CRASHESForIn
1A. TYPE OF MOTOR VEHICLE CRASH
Number of CrashesTotal On Roadway
Total Fatal Nonfatal
Injury Property Damage Total Fatal
NonfatalInjury
PropertyDamage Total Fatal
NonfatalInjury
Property Damage
Off Roadway
1. Overturning 2. Other noncollision 3. Pedestrian 4. MV in transport 2 2 2 25. MV on other roadway 6. Parked MV 7. Railway train 8. Pedalcyclist 203 193 10 186 177 9 17 16 1 9. Animal 10. Fixed object 11. Other object 12. Totals 205 195 10 188 179 9 17 16 1
This summary includes reports andinformation available on:
Report published by:
CRASH ANALYSIS AND REPORTING
1B. TYPE OF MOTOR VEHICLE CRASH
Number Of PersonsTotal Killed Total Injured Major Injuries Minor Injuries Possible Injuries No Injury
1. Overturning 2. Other noncollision 3. Pedestrian 4. MV in transport 4 1 3 75. MV on other roadway 6. Parked MV 7. Railway train 8. Pedalcyclist 196 26 96 74 2729. Animal 10. Fixed object 11. Other object 12. Totals 200 27 96 77 279
2B. MILEAGE RATES ThisYearTo
Date
LastYearSamePeriod
PercentChange
1. Motor vehicle traffic deaths 2. Estimated vehicle miles traveled (in millions)
3. Death rate per 100 million vehicle miles 4. Fatal crash rate per 100 million vehicle miles
5. Crash rate per million vehicle miles 6. Fatal crashes
-400%
-400%
4
4
2A. TYPE OF MOTOR VEHICLE CRASH
Total On Roadway This Year To Date This Year To Date Same Period Last Year Same Period Last Year
All Crashes
Persons Killed
Persons Injured
AllCrashes
AllCrashes
AllCrashes
PersonsKilled
PersonsKilled
PersonsKilled
PersonsInjured
Persons Injured
PersonsInjured
1. Overturning 2. Other noncollision 3. Pedestrian
4 2 4 2 4. MV in transport 5. MV on other roadway 6. Parked MV 7. Railway train
1. Primary State Highways 2. Secondary State Highways 3. County and Local Roads 4. City Streets 5. Not Stated Total--Rural Area
NOTE: THIS YEAR TO DATE represents only those crashes entered onto the database as of the date above. SAME PERIOD LAST YEAR represents all crashes including late reports. MAJOR INJURIES are incapacitating injuries. MINOR INJURIES are non-incapacitating evident injuries.
3. LOCATION Total
PropertyDamage
Nonfatal Injury Fatal Property
DamageNonfatal
InjuryFatalTotalPropertyDamage
Nonfatal Injury Fatal Total Killed Injured
Total On Roadway TotalOff Roadway Number Of Crashes Number Of Persons
1. Below 1,000 2. 1,000 to 2,500 3. 2,501 to 5,000 4. 5,001 to 10,000 5. 10,001 to 25,000 6. 25,001 to 50,000 7. 50,001 to 100,000 8. 100,001 to 200,000 9. City of Portland Only Total - Municipalities
3. County and Local Roads 184 1 14 15 7 166 173 8 180 188 4. City Streets
5. Not Stated Total--Urban Area 2001 16 17917918810 195 205 6. Interstate System 7. Other State Freeways 8. Other State Highways 17 15 2 15 13 2 2 2 16Total--Urban System 17 15 2 15 13 2 2 2 16
6. Interstate System 7. Other State Freeways 8. Other State Highways Total--Rural System
June 1, 2007
PORTLAND
82
At I
nter
sect
ion
Not
at I
nter
sect
ion
At
Inte
r. N
on -I
nter
.
PORTLAND 2006 PEDALCYCLE CRASHES
4. AGE OF CASUALTY
Number of Persons Killed Number of Persons Injured Total Killed Pedestrians Pedalcyclist Total Injured Pedestrians Pedalcyclist
Total Total Total Total Total TotalMale Male Male Male Male MaleFemale Female Female Female Female Female1. 0 to 4 2. 5 to 9 1 2 1 1 2 13. 10 to 14 2 4 2 2 4 24. 15 to 19 3 14 3 12 15 115. 20 to 24 9 27 9 18 27 186. 25 to 34 12 64 12 53 65 527. 35 to 44 6 27 6 21 27 218. 45 to 54 2 21 2 19 21 199. 55 to 64 1 9 1 8 9 810. 65 to 74 3 4 4 311. 75 & older 12. Not-stated 3 25 3 22 26 22Totals 200 160 39 196 157 39
Directional Analysis - A crash consisting of a series of collisions, overturning, etc., is classified according to the first damage or injury producing event; includes on roadway and off roadway.5A. MULTIPLE VEH CRASH Total Fatal Injury P.D.O.
1. Entering at angle 1 1 2a. Same dir.- both straight 2b. Same-1 turn, 1 straight 2c. Same-one stopped 1 1 2d. Same-all others 3a. Opposite dir.- both straight 3b. Opposite-1 turn, 1 straight 3c. Opposite-all others 4. Not stated Totals 2 2
5B. MULTIPLE VEH CRASH Total Fatal Injury P.D.O.1. Moving in opposite dir. 2. Both moving in same dir. 3a. One car parked 3b. One car stopped in traffic 4. Enter/Leave parked pos. 5a. Entering driveway/alley 5b. Leaving driveway/alley 6. All others Totals
5C. PEDESTRIANCRASHES
All PedCrashes
Fatal Crashes Non-Fatal Injury Crashes
TotalAt
Intersection Non-
Junction TotalAt
IntersectionNon-
Junction1. Car go straight2. Car turning right3. Car turning left 4. Car backing 5. All othersTotals
5D. ALL OTHER CRASHES Total Fatal Injury P.D.O.Coll-isionWith
Coll-isionWith
1. Other rd veh or railway train 6 132 138 2. Fixed object3. Other object or animal 4. Overturning 5. Other noncollision6. Other rd veh or railway train 4 61 65 7. Fixed object8. Other object or animal 9. Overturning 10. Other noncollision 11. Not stated Totals 10193 203
6. PEDESTRIAN ACTION BY AGE
Ages of Pedstrians Killed and InjuredPedestrians Killed Total 0 to 4 5 to 9 10 to 14 15 to 19 20 to 24 25 to 44 45 to 64 65 & older Not stated
1a. X-ing at intersect or X-walk 1b. X-ing not at intersection 2a. Walking in road with traffic 2b. Same against traffic 3. Standing in roadway 4. Push or work on veh in road 5. Other working in roadway 6. Playing in roadway 7. Other in roadway 8. Not in roadway 9. Not stated Totals
7. AGE OF DRIVER All Crashes Fatal Injury 1. 14 & younger 2. 15 3. 16 4. 17 5 5 5. 18 2 2 6. 19 5 5 7. 20 1 1 8. 21 4 4 9. 22 to 24 9 9 10. 25 to 34 42 40 11. 35 to 44 43 39 12. 45 to 54 34 33 13. 55 to 64 36 33 14. 65 to 74 16 16 15. 75 & older 10 10 16. Not stated 3 3 Totals 210 200 8. SEX OF DRIVER Injury Fatal All Crashes
1. Male 120 115 2. Female 90 85 3. Not stated Totals 210 200
9. RESIDENCE OF DRIVER All Crashes Fatal Injury
1. Local resident 193 183 2. In-state resident 3 3 3. Non resident 12 12 4. Not stated 2 2 Totals 210 200
10. CRASHES BY CONTRIBUTING FACTOR All InjuryFatal1. Speed too fast
6 1 1
12 9
7. Followed too closely 7 1 1
13 9
6. Improper overtaking5. Drove left of center4. Disregard traffic signal3. Passed stop sign2. Failed to yield 143 135
6 6
8. Made improper turn
Totals 218 208 15
1 10 6 6
15 1
10 6 6
12. Other 11. Mechanical defect10. Improper driving9. Had been drinking
12. ROAD SURFACECONDITION InjuryFatalAll
1. Dry 166 1602. Wet 37 343. Snowy or icy4. Other 5. Not stated 2 1Totals 205 195
13. LIGHT CONDITION InjuryFatalAll1. Daylight 150 1422. Dawn or Dusk 11 103. Darkness 43 424. Not stated 1 1Totals 205 195
11. VEHICLE TYPE InjuryFatalAll1. Passenger car 200 1902. Pass Car and trailer 1 13. Truck or truck tractor 2 24. Truck tractor with semi-trailer 1 15. Other truck combination 6. Farm tractor and/or equip. 7. Taxicab 2 28. Bus 4 49. School bus10. Motorcycle 11. Motor scooter or moped 12. Others and not stated 1 1Totals 211 201Special vehicles included above 13. Log trucks14. Emergency (incl. private) 2 215. Military vehicles 16. Other public vehicles 5 5
14. MANNER OF COLLISION InjuryFatalAll
1. Head-on2. Rear end 1 13. Angle 1 14. Sideswipe-meeting 5. Sideswipe-overtaking 6. Backed into 7. OtherTotals 2 2
11. Count of vehicles, including properly parked vehicles.
Totals include participant records where gender was coded as "unknown".
10. Count of crashes. Crashes with multiple contributing circumstances are counted in all applicable categories.
MULTIPLE VEHICLE CRASHES
7 - 9. Tally of drivers by age, sex, residence & crash severity. Excludes occupants of properly & improperly parked vehicles.
83
Pedestrian
Crash Summaries
84
85
Col
lisio
n in
volv
ing:
N
on-
coll.
N
on-
coll.
C
ollis
ion
invo
lvin
g:
Non
- co
ll.
Col
lisio
n in
volv
ing:
3C
. RU
RA
L 3A
. Inc
orpo
rate
d A
reas
3B
. UR
BA
N
SUMMARY OF MOTOR VEHICLE TRAFFIC CRASHES 2006 PEDESTRIAN CRASHESForIn
NOTE: THIS YEAR TO DATE represents only those crashes entered onto the database as of the date above. SAME PERIOD LAST YEAR represents all crashes including late reports. MAJOR INJURIES are incapacitating injuries. MINOR INJURIES are non-incapacitating evident injuries.
3. LOCATION Total
PropertyDamage
Nonfatal Injury Fatal Property
DamageNonfatal
InjuryFatalTotalPropertyDamage
Nonfatal Injury Fatal Total Killed Injured
Total On Roadway TotalOff Roadway Number Of Crashes Number Of Persons
1. Below 1,000 2. 1,000 to 2,500 3. 2,501 to 5,000 4. 5,001 to 10,000 5. 10,001 to 25,000 6. 25,001 to 50,000 7. 50,001 to 100,000 8. 100,001 to 200,000 9. City of Portland Only Total - Municipalities
Directional Analysis - A crash consisting of a series of collisions, overturning, etc., is classified according to the first damage or injury producing event; includes on roadway and off roadway.5A. MULTIPLE VEH CRASH Total Fatal Injury P.D.O.
1. Entering at angle 1 1 2a. Same dir.- both straight 2b. Same-1 turn, 1 straight 2c. Same-one stopped 2d. Same-all others 3a. Opposite dir.- both straight 3b. Opposite-1 turn, 1 straight 2 2 3c. Opposite-all others 4. Not stated Totals 2 1 3
5B. MULTIPLE VEH CRASH Total Fatal Injury P.D.O.1. Moving in opposite dir. 2. Both moving in same dir.
8 83a. One car parked 2 23b. One car stopped in traffic
Junction1. Car go straight 382 40 8 32 342 113 2292. Car turning right 94 2 1 1 92 64 283. Car turning left 161 2 2 159 139 204. Car backing 12 3 3 9 1 85. All others 3 3 3Totals 652 47 11 36 605 317 288
5D. ALL OTHER CRASHES Total Fatal Injury P.D.O.Coll-isionWith
Coll-isionWith
1. Other rd veh or railway train2. Fixed object 1 1 3. Other object or animal4. Overturning 5. Other noncollision 6. Other rd veh or railway train7. Fixed object 5 5 8. Other object or animal 1 1 9. Overturning10. Other noncollision 11. Not statedTotals 6 1 7
6. PEDESTRIAN ACTION BY AGE
Ages of Pedstrians Killed and InjuredPedestrians Killed Total 0 to 4 5 to 9 10 to 14 15 to 19 20 to 24 25 to 44 45 to 64 65 & older Not stated
1a. X-ing at intersect or X-walk 18 38 100 86 35 47 30 7 8 369 13 1b. X-ing not at intersection 7 15 41 38 17 25 24 10 4 181 13 2a. Walking in road with traffic 1 4 4 2 11 3 2b. Same against traffic 2 2 3. Standing in roadway 3 4 6 1 2 1 2 19 6 4. Push or work on veh in road 1 1 5. Other working in roadway 1 2 3 6. Playing in roadway 1 3 1 2 2 9 2 7. Other in roadway 1 5 7 3 4 2 5 3 1 31 4 8. Not in roadway 3 9 16 25 7 12 2 1 75 7 9. Not stated 1 1
3268 173 16865936325 15 702 48 Totals
7. AGE OF DRIVER All Crashes Fatal Injury 1. 14 & younger 2. 15 1 1 3. 16 11 2 9 4. 17 17 1 16 5. 18 14 1 13 6. 19 15 1 14 7. 20 20 19 8. 21 9 3 6 9. 22 to 24 40 6 33 10. 25 to 34 117 7 110 11. 35 to 44 98 11 87 12. 45 to 54 126 8 118 13. 55 to 64 115 7 107 14. 65 to 74 53 1 52 15. 75 & older 43 2 41 16. Not stated 2 2 Totals 681 53 625 8. SEX OF DRIVER Injury Fatal All Crashes
1. Male 400 40 357 2. Female 279 11 268 3. Not stated 2 2 Totals 681 53 625
9. RESIDENCE OF DRIVER All Crashes Fatal Injury
1. Local resident 624 42 579 2. In-state resident 31 7 24 3. Non resident 24 2 22 4. Not stated 2 2 0 Totals 681 53 625
10. CRASHES BY CONTRIBUTING FACTOR All InjuryFatal1. Speed too fast
1 1
25 1
7. Followed too closely 1 1
25 1
6. Improper overtaking5. Drove left of center4. Disregard traffic signal3. Passed stop sign2. Failed to yield 438 19 416
16 4 20
8. Made improper turn
Totals 640 62 575 32
1 34 44
4
7 1 9
22
39 2
43 66
4
12. Other 11. Mechanical defect10. Improper driving9. Had been drinking
12. ROAD SURFACECONDITION InjuryFatalAll
1. Dry 446 36 4102. Wet 208 10 1953. Snowy or icy 11 1 104. Other 5. Not stated 7 2 5Totals 672 49 620
13. LIGHT CONDITION InjuryFatalAll1. Daylight 366 16 3502. Dawn or Dusk 37 7 303. Darkness 269 26 2404. Not statedTotals 672 49 620
11. VEHICLE TYPE InjuryFatalAll1. Passenger car 667 49 6152. Pass Car and trailer 8 1 73. Truck or truck tractor 2 24. Truck tractor with semi-trailer 11 4 75. Other truck combination 6. Farm tractor and/or equip. 7. Taxicab 2 28. Bus 4 49. School bus 4 410. Motorcycle 5 511. Motor scooter or moped 12. Others and not stated 1 1Totals 704 57 644Special vehicles included above 13. Log trucks14. Emergency (incl. private) 4 415. Military vehicles 16. Other public vehicles 11 2 9
NOTE: THIS YEAR TO DATE represents only those crashes entered onto the database as of the date above. SAME PERIOD LAST YEAR represents all crashes including late reports. MAJOR INJURIES are incapacitating injuries. MINOR INJURIES are non-incapacitating evident injuries.
3. LOCATION Total
PropertyDamage
Nonfatal Injury Fatal Property
DamageNonfatal
InjuryFatalTotalPropertyDamage
Nonfatal Injury Fatal Total Killed Injured
Total On Roadway TotalOff Roadway Number Of Crashes Number Of Persons
1. Below 1,000 2. 1,000 to 2,500 3. 2,501 to 5,000 4. 5,001 to 10,000 5. 10,001 to 25,000 6. 25,001 to 50,000 7. 50,001 to 100,000 8. 100,001 to 200,000 9. City of Portland Only Total - Municipalities 1. Primary State Highways 2. Secondary State Highways 3. County and Local Roads 4. City Streets 5. Not Stated Total--Urban Area 6. Interstate System 7. Other State Freeways 8. Other State Highways Total--Urban System
6. Interstate System 2 2 2 2 0 2 27. Other State Freeways 8. Other State Highways 23 7 16 20 6 14 3 1 2 7 26Total--Rural System 25 9 16 22 8 14 3 1 2 9 28
June 1, 2007
OREGON RURAL AREAS
88
At I
nter
sect
ion
Not
at I
nter
sect
ion
At
Inte
r. N
on -I
nter
.
OREGON RURAL AREAS 2006 PEDESTRIAN CRASHES
4. AGE OF CASUALTY
Number of Persons Killed Number of Persons Injured Total Killed Pedestrians Pedalcyclist Total Injured Pedestrians Pedalcyclist
Total Total Total Total Total TotalMale Male Male Male Male MaleFemale Female Female Female Female Female1. 0 to 4 2 2 2 22. 5 to 9 3. 10 to 14 3 2 1 2 1 34. 15 to 19 7 2 5 2 6 85. 20 to 24 5 1 4 2 5 76. 25 to 34 2 2 1 3 4 3 3 3 3 7. 35 to 44 3 3 1 5 6 1 1 1 1 8. 45 to 54 9 4 5 5 6 11 3 3 3 3 9. 55 to 64 2 1 1 1 2 3 2 2 2 2 10. 65 to 74 3 2 1 3 3 6 2 2 2 2 11. 75 & older 1 1 1 1 2 1 1 2 1 1 12. Not-stated 2 1 1 1 1 2Totals 13 6 7 13 6 7 53 35 18 39 26 13
Directional Analysis - A crash consisting of a series of collisions, overturning, etc., is classified according to the first damage or injury producing event; includes on roadway and off roadway.5A. MULTIPLE VEH CRASH Total Fatal Injury P.D.O.
1. Entering at angle 2a. Same dir.- both straight 2b. Same-1 turn, 1 straight 2c. Same-one stopped 2d. Same-all others 3a. Opposite dir.- both straight 3b. Opposite-1 turn, 1 straight 3c. Opposite-all others 4. Not stated Totals
5B. MULTIPLE VEH CRASH Total Fatal Injury P.D.O.1. Moving in opposite dir. 2. Both moving in same dir.
1 13a. One car parked 2 23b. One car stopped in traffic
Junction1. Car go straight 41 10 10 31 3 282. Car turning right 1 1 13. Car turning left4. Car backing 3 2 2 1 15. All others 1 1 1Totals 46 12 12 34 3 31
5D. ALL OTHER CRASHES Total Fatal Injury P.D.O.Coll-isionWith
Coll-isionWith
1. Other rd veh or railway train2. Fixed object 3. Other object or animal 4. Overturning 5. Other noncollision 6. Other rd veh or railway train 7. Fixed object 8. Other object or animal 1 1 9. Overturning10. Other noncollision 11. Not statedTotals 1 1
6. PEDESTRIAN ACTION BY AGE
Ages of Pedstrians Killed and InjuredPedestrians Killed Total 0 to 4 5 to 9 10 to 14 15 to 19 20 to 24 25 to 44 45 to 64 65 & older Not stated
1a. X-ing at intersect or X-walk 1 1 2 1b. X-ing not at intersection 5 3 2 1 1 12 4 2a. Walking in road with traffic 3 3 1 7 3 2b. Same against traffic 3. Standing in roadway 1 3 1 1 6 1 4. Push or work on veh in road 1 1 5. Other working in roadway 1 1 6. Playing in roadway 7. Other in roadway 1 3 1 1 1 7 1 8. Not in roadway 1 2 7 2 2 2 16 4 9. Not stated
28 16 9573 2 52 13 Totals
7. AGE OF DRIVER All Crashes Fatal Injury 1. 14 & younger 2. 15 3. 16 2 2 4. 17 2 2 5. 18 1 1 6. 19 1 1 7. 20 2 2 8. 21 1 1 9. 22 to 24 5 2 2 10. 25 to 34 7 3 4 11. 35 to 44 6 2 4 12. 45 to 54 10 1 9 13. 55 to 64 10 3 7 14. 65 to 74 5 5 15. 75 & older 16. Not stated 1 1 Totals 53 15 37 8. SEX OF DRIVER Injury Fatal All Crashes
1. Male 40 12 27 2. Female 12 2 10 3. Not stated 1 1 Totals 53 15 37
9. RESIDENCE OF DRIVER All Crashes Fatal Injury
1. Local resident 40 10 29 2. In-state resident 8 3 5 3. Non resident 4 1 3 4. Not stated 1 1 0 Totals 53 15 37
10. CRASHES BY CONTRIBUTING FACTOR All InjuryFatal1. Speed too fast
7. Followed too closely6. Improper overtaking5. Drove left of center4. Disregard traffic signal3. Passed stop sign2. Failed to yield 20 4 15
8 8
8. Made improper turn
Totals 57 15 41 3 1 9 5
4 1 2 4
7 2
11 9
12. Other 11. Mechanical defect10. Improper driving9. Had been drinking
12. ROAD SURFACECONDITION InjuryFatalAll
1. Dry 39 11 282. Wet 7 2 43. Snowy or icy 3 34. Other 5. Not stated 1 1Totals 50 13 36
13. LIGHT CONDITION InjuryFatalAll1. Daylight 26 3 232. Dawn or Dusk 2 23. Darkness 22 8 134. Not statedTotals 50 13 36
11. VEHICLE TYPE InjuryFatalAll1. Passenger car 50 14 352. Pass Car and trailer 2 23. Truck or truck tractor 4. Truck tractor with semi-trailer 2 1 15. Other truck combination 6. Farm tractor and/or equip. 7. Taxicab 8. Bus9. School bus 1 110. Motorcycle 3 311. Motor scooter or moped 12. Others and not stated 1 1Totals 59 16 42Special vehicles included above 13. Log trucks14. Emergency (incl. private) 2 215. Military vehicles 16. Other public vehicles 2 2
10 10 10 10 10 1. Primary State Highways 4 3 3 3 3 2. Secondary State Highways
3. County and Local Roads 5 5 5 5 5 4. City Streets
5. Not Stated 19 18 18 18 18 Total--Rural Area
NOTE: THIS YEAR TO DATE represents only those crashes entered onto the database as of the date above. SAME PERIOD LAST YEAR represents all crashes including late reports. MAJOR INJURIES are incapacitating injuries. MINOR INJURIES are non-incapacitating evident injuries.
3. LOCATION Total
PropertyDamage
Nonfatal Injury Fatal Property
DamageNonfatal
InjuryFatalTotalPropertyDamage
Nonfatal Injury Fatal Total Killed Injured
Total On Roadway TotalOff Roadway Number Of Crashes Number Of Persons
1. Below 1,000 2. 1,000 to 2,500 3. 2,501 to 5,000 4. 5,001 to 10,000 5. 10,001 to 25,000 6. 25,001 to 50,000 7. 50,001 to 100,000 8. 100,001 to 200,000 9. City of Portland Only Total - Municipalities
Directional Analysis - A crash consisting of a series of collisions, overturning, etc., is classified according to the first damage or injury producing event; includes on roadway and off roadway.5A. MULTIPLE VEH CRASH Total Fatal Injury P.D.O.
1. Entering at angle 1 1 2a. Same dir.- both straight 2b. Same-1 turn, 1 straight 2c. Same-one stopped 2d. Same-all others 3a. Opposite dir.- both straight 3b. Opposite-1 turn, 1 straight 2 2 3c. Opposite-all others 4. Not stated Totals 2 1 3
5B. MULTIPLE VEH CRASH Total Fatal Injury P.D.O.1. Moving in opposite dir. 2. Both moving in same dir.
7 73a. One car parked 3b. One car stopped in traffic 4. Enter/Leave parked pos. 5a. Entering driveway/alley 5b. Leaving driveway/alley 6. All others Totals 7 7
5C. PEDESTRIANCRASHES
All PedCrashes
Fatal Crashes Non-Fatal Injury Crashes
TotalAt
Intersection Non-
Junction TotalAt
IntersectionNon-
Junction1. Car go straight 341 30 8 22 311 110 2012. Car turning right 93 2 1 1 91 64 273. Car turning left 161 2 2 159 139 204. Car backing 9 1 1 8 1 75. All others 2 2 2Totals 606 35 11 24 571 314 257
5D. ALL OTHER CRASHES Total Fatal Injury P.D.O.Coll-isionWith
Coll-isionWith
1. Other rd veh or railway train2. Fixed object 1 1 3. Other object or animal4. Overturning 5. Other noncollision 6. Other rd veh or railway train7. Fixed object 5 5 8. Other object or animal9. Overturning 10. Other noncollision 11. Not statedTotals 6 6
6. PEDESTRIAN ACTION BY AGE
Ages of Pedstrians Killed and InjuredPedestrians Killed Total 0 to 4 5 to 9 10 to 14 15 to 19 20 to 24 25 to 44 45 to 64 65 & older Not stated
1a. X-ing at intersect or X-walk 18 38 100 86 34 47 29 7 8 367 13 1b. X-ing not at intersection 7 10 38 38 17 23 23 10 3 169 9 2a. Walking in road with traffic 1 1 1 1 4 2b. Same against traffic 2 2 3. Standing in roadway 2 4 3 1 1 2 13 5 4. Push or work on veh in road 5. Other working in roadway 1 1 2 6. Playing in roadway 1 3 1 2 2 9 2 7. Other in roadway 1 4 4 3 3 1 5 3 24 3 8. Not in roadway 2 7 9 23 5 10 2 1 59 3 9. Not stated 1 1
3060 157 15960866025 13 650 35 Totals
7. AGE OF DRIVER All Crashes Fatal Injury 1. 14 & younger 2. 15 1 1 3. 16 9 9 4. 17 15 1 14 5. 18 13 1 12 6. 19 14 1 13 7. 20 18 17 8. 21 8 2 6 9. 22 to 24 35 4 31 10. 25 to 34 110 4 106 11. 35 to 44 92 9 83 12. 45 to 54 116 7 109 13. 55 to 64 105 4 100 14. 65 to 74 48 1 47 15. 75 & older 43 2 41 16. Not stated 1 1 Totals 628 38 588 8. SEX OF DRIVER Injury Fatal All Crashes
1. Male 360 28 330 2. Female 267 9 258 3. Not stated 1 1 Totals 628 38 588
9. RESIDENCE OF DRIVER All Crashes Fatal Injury
1. Local resident 584 32 550 2. In-state resident 23 4 19 3. Non resident 20 1 19 4. Not stated 1 1 0 Totals 628 38 588
10. CRASHES BY CONTRIBUTING FACTOR All InjuryFatal1. Speed too fast
1 1
25 1
7. Followed too closely 1 1
25 1
6. Improper overtaking5. Drove left of center4. Disregard traffic signal3. Passed stop sign2. Failed to yield 418 15 401
8 4 12
8. Made improper turn
Totals 583 47 534 29
25 39
4
3
7 18
32
32 57
4
12. Other 11. Mechanical defect10. Improper driving9. Had been drinking
12. ROAD SURFACECONDITION InjuryFatalAll
1. Dry 407 25 3822. Wet 201 8 1913. Snowy or icy 8 1 74. Other 5. Not stated 6 2 4Totals 622 36 584
13. LIGHT CONDITION InjuryFatalAll1. Daylight 340 13 3272. Dawn or Dusk 35 5 303. Darkness 247 18 2274. Not statedTotals 622 36 584
11. VEHICLE TYPE InjuryFatalAll1. Passenger car 617 35 5802. Pass Car and trailer 6 1 53. Truck or truck tractor 2 24. Truck tractor with semi-trailer 9 3 65. Other truck combination 6. Farm tractor and/or equip. 7. Taxicab 2 28. Bus 4 49. School bus 3 310. Motorcycle 2 211. Motor scooter or moped 12. Others and not stated Totals 645 41 602Special vehicles included above 13. Log trucks14. Emergency (incl. private) 2 215. Military vehicles 16. Other public vehicles 9 9
10 10 10 10 10 1. Primary State Highways 4 3 3 3 3 2. Secondary State Highways
3. County and Local Roads 5 5 5 5 5 4. City Streets
5. Not Stated 19 18 18 18 18 Total--Rural Area
NOTE: THIS YEAR TO DATE represents only those crashes entered onto the database as of the date above. SAME PERIOD LAST YEAR represents all crashes including late reports. MAJOR INJURIES are incapacitating injuries. MINOR INJURIES are non-incapacitating evident injuries.
3. LOCATION Total
PropertyDamage
Nonfatal Injury Fatal Property
DamageNonfatal
InjuryFatalTotalPropertyDamage
Nonfatal Injury Fatal Total Killed Injured
Total On Roadway TotalOff Roadway Number Of Crashes Number Of Persons
1. Below 1,000 2. 1,000 to 2,500 3. 2,501 to 5,000 4. 5,001 to 10,000 5. 10,001 to 25,000 6. 25,001 to 50,000 7. 50,001 to 100,000 8. 100,001 to 200,000 9. City of Portland Only Total - Municipalities
3. County and Local Roads 270 11 17 1 18 228 10 238 245 11 256 4. City Streets
5. Not Stated Total--Urban Area 36222 18 2 2031520335 333 22 355 6. Interstate System 4 3 1 3 2 1 1 1 3 17. Other State Freeways 1 1 1 1 18. Other State Highways 94 8 86 93 85 1 1 8 90Total--Urban System 99 11 88 97 10 87 2 1 1 11 92
6. Interstate System 7. Other State Freeways 8. Other State Highways 13 13 13 13 14Total--Rural System 13 13 13 13 14
June 1, 2007
ALL CITIES EXCEPT PORTLAND
92
At I
nter
sect
ion
Not
at I
nter
sect
ion
At
Inte
r. N
on -I
nter
.
ALL CITIES EXCEPT PORTLAND 2006 PEDESTRIAN CRASHES
4. AGE OF CASUALTY
Number of Persons Killed Number of Persons Injured Total Killed Pedestrians Pedalcyclist Total Injured Pedestrians Pedalcyclist
Total Total Total Total Total TotalMale Male Male Male Male MaleFemale Female Female Female Female Female1. 0 to 4 3 3 3 3 2 1 1 2 1 1 2. 5 to 9 18 5 13 5 14 19 1 1 1 1 3. 10 to 14 42 17 25 17 25 424. 15 to 19 56 27 29 27 30 575. 20 to 24 35 12 23 12 23 35 1 1 1 1 6. 25 to 34 42 18 24 18 28 46 1 1 1 1 7. 35 to 44 37 15 22 16 23 39 5 3 2 5 3 2 8. 45 to 54 44 25 19 26 19 45 4 3 1 3 3 9. 55 to 64 39 19 20 19 21 40 2 2 2 2 10. 65 to 74 23 5 18 5 18 23 3 1 2 3 1 2 11. 75 & older 15 6 9 6 9 15 3 2 1 3 2 1 12. Not-stated 17 7 10 7 10 17Totals 22 14 8 21 14 7 381 220 161 371 212 159
Directional Analysis - A crash consisting of a series of collisions, overturning, etc., is classified according to the first damage or injury producing event; includes on roadway and off roadway.5A. MULTIPLE VEH CRASH Total Fatal Injury P.D.O.
1. Entering at angle 1 1 2a. Same dir.- both straight 2b. Same-1 turn, 1 straight 2c. Same-one stopped 2d. Same-all others 3a. Opposite dir.- both straight 3b. Opposite-1 turn, 1 straight 1 1 3c. Opposite-all others 4. Not stated Totals 1 1 2
5B. MULTIPLE VEH CRASH Total Fatal Injury P.D.O.1. Moving in opposite dir. 2. Both moving in same dir.
1 13a. One car parked 3b. One car stopped in traffic 4. Enter/Leave parked pos. 5a. Entering driveway/alley 5b. Leaving driveway/alley 6. All others Totals 1 1
5C. PEDESTRIANCRASHES
All PedCrashes
Fatal Crashes Non-Fatal Injury Crashes
TotalAt
Intersection Non-
Junction TotalAt
IntersectionNon-
Junction1. Car go straight 216 18 3 15 198 63 1352. Car turning right 53 2 1 1 51 37 143. Car turning left 90 90 78 124. Car backing 6 1 1 5 1 45. All others 2 2 2Totals 367 21 4 17 346 179 167
5D. ALL OTHER CRASHES Total Fatal Injury P.D.O.Coll-isionWith
Coll-isionWith
1. Other rd veh or railway train2. Fixed object 3. Other object or animal 4. Overturning 5. Other noncollision 6. Other rd veh or railway train 7. Fixed object 3 3 8. Other object or animal9. Overturning 10. Other noncollision 11. Not statedTotals 3 3
6. PEDESTRIAN ACTION BY AGE
Ages of Pedstrians Killed and InjuredPedestrians Killed Total 0 to 4 5 to 9 10 to 14 15 to 19 20 to 24 25 to 44 45 to 64 65 & older Not stated
1a. X-ing at intersect or X-walk 8 27 50 46 21 28 22 4 2 208 6 1b. X-ing not at intersection 5 8 28 24 9 16 14 9 1 114 7 2a. Walking in road with traffic 1 1 2b. Same against traffic 3. Standing in roadway 2 2 2 6 2 4. Push or work on veh in road 5. Other working in roadway 1 1 6. Playing in roadway 2 1 2 2 7 1 7. Other in roadway 4 4 2 3 1 4 1 19 3 8. Not in roadway 2 5 4 11 3 8 1 1 35 2 9. Not stated 1 1
1744 88 8536564219 5 392 21 Totals
7. AGE OF DRIVER All Crashes Fatal Injury 1. 14 & younger 2. 15 3. 16 8 8 4. 17 11 1 10 5. 18 6 6 6. 19 8 1 7 7. 20 10 10 8. 21 4 2 2 9. 22 to 24 22 2 20 10. 25 to 34 61 61 11. 35 to 44 42 6 36 12. 45 to 54 74 6 68 13. 55 to 64 66 1 65 14. 65 to 74 32 1 31 15. 75 & older 29 2 27 16. Not stated 1 1 Totals 374 23 351 8. SEX OF DRIVER Injury Fatal All Crashes
1. Male 204 18 186 2. Female 169 4 165 3. Not stated 1 1 Totals 374 23 351
9. RESIDENCE OF DRIVER All Crashes Fatal Injury
1. Local resident 347 19 328 2. In-state resident 18 2 16 3. Non resident 8 1 7 4. Not stated 1 1 0 Totals 374 23 351
10. CRASHES BY CONTRIBUTING FACTOR All InjuryFatal1. Speed too fast
1
17
7. Followed too closely 1
17
6. Improper overtaking5. Drove left of center4. Disregard traffic signal3. Passed stop sign2. Failed to yield 269 8 261
4 2 6
8. Made improper turn
Totals 370 28 342 17
16 25
1
2
3 13
19
19 38
1
12. Other 11. Mechanical defect10. Improper driving9. Had been drinking
12. ROAD SURFACECONDITION InjuryFatalAll
1. Dry 250 15 2352. Wet 114 4 1103. Snowy or icy 5 1 44. Other 5. Not stated 4 2 2Totals 373 22 351
13. LIGHT CONDITION InjuryFatalAll1. Daylight 211 7 2042. Dawn or Dusk 22 3 193. Darkness 140 12 1284. Not statedTotals 373 22 351
11. VEHICLE TYPE InjuryFatalAll1. Passenger car 364 21 3432. Pass Car and trailer 3 33. Truck or truck tractor 2 24. Truck tractor with semi-trailer 5 3 25. Other truck combination 6. Farm tractor and/or equip. 7. Taxicab8. Bus 3 39. School bus 3 310. Motorcycle 1 111. Motor scooter or moped 12. Others and not stated Totals 381 26 355Special vehicles included above 13. Log trucks14. Emergency (incl. private) 15. Military vehicles 16. Other public vehicles 7 7
1. Primary State Highways 2. Secondary State Highways 3. County and Local Roads 4. City Streets 5. Not Stated Total--Rural Area
NOTE: THIS YEAR TO DATE represents only those crashes entered onto the database as of the date above. SAME PERIOD LAST YEAR represents all crashes including late reports. MAJOR INJURIES are incapacitating injuries. MINOR INJURIES are non-incapacitating evident injuries.
3. LOCATION Total
PropertyDamage
Nonfatal Injury Fatal Property
DamageNonfatal
InjuryFatalTotalPropertyDamage
Nonfatal Injury Fatal Total Killed Injured
Total On Roadway TotalOff Roadway Number Of Crashes Number Of Persons
1. Below 1,000 2. 1,000 to 2,500 3. 2,501 to 5,000 4. 5,001 to 10,000 5. 10,001 to 25,000 6. 25,001 to 50,000 7. 50,001 to 100,000 8. 100,001 to 200,000 9. City of Portland Only Total - Municipalities
3. County and Local Roads 170 3 12 12 1 145 3 149 1 157 3 161 4. City Streets
5. Not Stated Total--Urban Area 2036 13 13117561821 188 6 195 6. Interstate System 7. Other State Freeways 8. Other State Highways 34 3 31 33 30 1 1 3 33Total--Urban System 34 3 31 33 3 30 1 1 3 33
6. Interstate System 7. Other State Freeways 8. Other State Highways Total--Rural System
June 1, 2007
PORTLAND
94
At I
nter
sect
ion
Not
at I
nter
sect
ion
At
Inte
r. N
on -I
nter
.
PORTLAND 2006 PEDESTRIAN CRASHES
4. AGE OF CASUALTY
Number of Persons Killed Number of Persons Injured Total Killed Pedestrians Pedalcyclist Total Injured Pedestrians Pedalcyclist
Total Total Total Total Total TotalMale Male Male Male Male MaleFemale Female Female Female Female Female1. 0 to 4 4 4 4 42. 5 to 9 3 2 1 2 1 33. 10 to 14 11 5 6 5 6 114. 15 to 19 23 10 13 10 13 23 1 1 1 1 5. 20 to 24 19 8 11 8 12 206. 25 to 34 31 16 15 19 16 35 2 1 1 2 1 1 7. 35 to 44 25 12 13 12 13 258. 45 to 54 32 9 23 9 23 329. 55 to 64 23 16 7 18 8 2610. 65 to 74 5 2 3 2 3 5 2 2 2 2 11. 75 & older 6 5 1 5 2 7 1 1 1 1 12. Not-stated 12 3 6 3 6 12Totals 6 1 5 6 1 5 203 103 97 194 99 92
Directional Analysis - A crash consisting of a series of collisions, overturning, etc., is classified according to the first damage or injury producing event; includes on roadway and off roadway.5A. MULTIPLE VEH CRASH Total Fatal Injury P.D.O.
1. Entering at angle 2a. Same dir.- both straight 2b. Same-1 turn, 1 straight 2c. Same-one stopped 2d. Same-all others 3a. Opposite dir.- both straight 3b. Opposite-1 turn, 1 straight 1 1 3c. Opposite-all others 4. Not stated Totals 1 1
5B. MULTIPLE VEH CRASH Total Fatal Injury P.D.O.1. Moving in opposite dir. 2. Both moving in same dir.
3 33a. One car parked 3b. One car stopped in traffic 4. Enter/Leave parked pos. 5a. Entering driveway/alley 5b. Leaving driveway/alley 6. All others Totals 3 3
5C. PEDESTRIANCRASHES
All PedCrashes
Fatal Crashes Non-Fatal Injury Crashes
TotalAt
Intersection Non-
Junction TotalAt
IntersectionNon-
Junction1. Car go straight 99 5 5 94 41 532. Car turning right 25 25 21 43. Car turning left 62 1 1 61 54 74. Car backing 3 3 35. All othersTotals 189 6 6 183 116 67
5D. ALL OTHER CRASHES Total Fatal Injury P.D.O.Coll-isionWith
Coll-isionWith
1. Other rd veh or railway train2. Fixed object 1 1 3. Other object or animal4. Overturning 5. Other noncollision 6. Other rd veh or railway train7. Fixed object 1 1 8. Other object or animal9. Overturning 10. Other noncollision 11. Not statedTotals 2 2
6. PEDESTRIAN ACTION BY AGE
Ages of Pedstrians Killed and InjuredPedestrians Killed Total 0 to 4 5 to 9 10 to 14 15 to 19 20 to 24 25 to 44 45 to 64 65 & older Not stated
1a. X-ing at intersect or X-walk 9 11 42 34 9 15 4 1 2 127 6 1b. X-ing not at intersection 2 1 7 12 7 6 6 1 2 44 2a. Walking in road with traffic 1 1 2 2b. Same against traffic 2 2 3. Standing in roadway 1 2 1 4 4. Push or work on veh in road 5. Other working in roadway 1 1 6. Playing in roadway 1 1 7. Other in roadway 1 1 1 1 4 8. Not in roadway 1 3 7 2 2 15 9. Not stated
1214 55 581924113 4 200 6 Totals
7. AGE OF DRIVER All Crashes Fatal Injury 1. 14 & younger 2. 15 1 1 3. 16 1 1 4. 17 2 2 5. 18 4 4 6. 19 3 3 7. 20 4 3 8. 21 2 2 9. 22 to 24 11 1 10 10. 25 to 34 39 39 11. 35 to 44 39 1 38 12. 45 to 54 36 1 35 13. 55 to 64 32 2 30 14. 65 to 74 13 13 15. 75 & older 10 10 16. Not stated Totals 197 6 190 8. SEX OF DRIVER Injury Fatal All Crashes
1. Male 125 5 119 2. Female 72 1 71 3. Not stated Totals 197 6 190
9. RESIDENCE OF DRIVER All Crashes Fatal Injury
1. Local resident 184 5 178 2. In-state resident 3 1 2 3. Non resident 10 10 4. Not stated Totals 197 6 190
10. CRASHES BY CONTRIBUTING FACTOR All InjuryFatal1. Speed too fast
1
6 1
7. Followed too closely 1
6 1
6. Improper overtaking5. Drove left of center4. Disregard traffic signal3. Passed stop sign2. Failed to yield 114 5 108
2 2 4
8. Made improper turn
Totals 156 9 146 9
6 10
3
1 1
9
7 11
3
12. Other 11. Mechanical defect10. Improper driving9. Had been drinking
12. ROAD SURFACECONDITION InjuryFatalAll
1. Dry 117 3 1142. Wet 74 3 703. Snowy or icy 2 24. Other 5. Not stated 2 2Totals 195 6 188
13. LIGHT CONDITION InjuryFatalAll1. Daylight 104 3 1012. Dawn or Dusk 10 1 93. Darkness 81 2 784. Not statedTotals 195 6 188
11. VEHICLE TYPE InjuryFatalAll1. Passenger car 194 6 1872. Pass Car and trailer 2 23. Truck or truck tractor 4. Truck tractor with semi-trailer 3 35. Other truck combination 6. Farm tractor and/or equip. 7. Taxicab 2 28. Bus 1 19. School bus10. Motorcycle 1 111. Motor scooter or moped 12. Others and not stated Totals 203 6 196Special vehicles included above 13. Log trucks14. Emergency (incl. private) 2 215. Military vehicles 16. Other public vehicles 1 1
NOTE: THIS YEAR TO DATE represents only those crashes entered onto the database as of the date above. SAME PERIOD LAST YEAR represents all crashes including late reports. MAJOR INJURIES are incapacitating injuries. MINOR INJURIES are non-incapacitating evident injuries.
3. LOCATION Total
PropertyDamage
Nonfatal Injury Fatal Property
DamageNonfatal
InjuryFatalTotalPropertyDamage
Nonfatal Injury Fatal Total Killed Injured
Total On Roadway TotalOff Roadway Number Of Crashes Number Of Persons
1. Below 1,000 2. 1,000 to 2,500 3. 2,501 to 5,000 4. 5,001 to 10,000 5. 10,001 to 25,000 6. 25,001 to 50,000 7. 50,001 to 100,000 8. 100,001 to 200,000 9. City of Portland Only Total - Municipalities
Directional Analysis - A crash consisting of a series of collisions, overturning, etc., is classified according to the first damage or injury producing event; includes on roadway and off roadway.5A. MULTIPLE VEH CRASH Total Fatal Injury P.D.O.
Junction1. Car go straight 119 25 6 19 94 36 582. Car turning right 28 28 21 73. Car turning left 37 1 1 36 32 44. Car backing5. All others 1 1 1Totals 185 26 7 19 159 89 70
5D. ALL OTHER CRASHES Total Fatal Injury P.D.O.Coll-isionWith
Coll-isionWith
1. Other rd veh or railway train 1 102 103 2. Fixed object 86 64 2 152 3. Other object or animal 1 2 3 4. Overturning 10 14 2 26 5. Other noncollision 3 3 6 6. Other rd veh or railway train 5 60 3 68 7. Fixed object 1,596 1,599 77 3,272 8. Other object or animal 435 128 5 568 9. Overturning 148 230 16 394 10. Other noncollision 29 22 51 11. Not statedTotals 2,3142,224 105 4,643
6. PEDESTRIAN ACTION BY AGE
Ages of Pedstrians Killed and InjuredPedestrians Killed Total 0 to 4 5 to 9 10 to 14 15 to 19 20 to 24 25 to 44 45 to 64 65 & older Not stated
1a. X-ing at intersect or X-walk 7 17 29 24 7 13 7 3 4 111 8 1b. X-ing not at intersection 6 19 14 2 7 4 52 8 2a. Walking in road with traffic 2 2 1 5 2 2b. Same against traffic 3. Standing in roadway 1 1 2 1 5 3 4. Push or work on veh in road 1 1 5. Other working in roadway 1 1 6. Playing in roadway 7. Other in roadway 4 1 1 1 1 8 3 8. Not in roadway 3 7 6 2 1 19 3 9. Not stated
826 63 491324113 5 202 27 Totals
7. AGE OF DRIVER All Crashes Fatal Injury 1. 14 & YOUNGER 5 1 1 2. 15 31 2 13 3. 16 435 2 217 4. 17 736 4 399 5. 18 1,042 11 537 6. 19 955 12 500 7. 20 838 9 451 8. 21 804 10 417 9. 22 to 24 2,171 24 1,131 10. 25 to 34 6,229 70 3,114 11. 35 to 44 5,844 54 2,980 12. 45 to 54 5,941 64 2,871 13. 55 to 64 4,186 47 1,986 14. 65 to 74 1,904 28 863 15. 75 & older 1,372 18 613 16. Not stated 3,201 2 492 Totals 35,694 358 16,585 8. SEX OF DRIVER Injury Fatal All Crashes
1. Male 20,643 263 9,162 2. Female 14,240 93 7,164 3. Not stated 811 2 259 Totals 35,694 358 16,585
9. RESIDENCE OF DRIVER All Crashes Fatal Injury
1. Local resident 26,155 204 12,593 2. In-state resident 4,545 86 2,187 3. Non resident 3,194 63 1,354 4. Not stated 1,800 5 451 Totals 35,694 358 16,585
10. CRASHES BY CONTRIBUTING FACTOR All InjuryFatal1. Speed too fast
2,599 109 163 504
84
7. Followed too closely 5,548 5 9
35 4 4
385 336 993 154
6. Improper overtaking5. Drove left of center4. Disregard traffic signal3. Passed stop sign2. Failed to yield 2,731 22 1,351
2,540 95 5,123
8. Made improper turn
Totals 22,001 340 10,314 1,442
94 890 310 228
17 1
72 75
1
3,353 203
1,948 519 708
12. Other 11. Mechanical defect10. Improper driving9. Had been drinking
12. ROAD SURFACECONDITION InjuryFatalAll
1. Dry 12,579 148 5,8472. Wet 4,725 55 2,2413. Snowy or icy 1,601 18 6564. Other 5. Not stated 259 8 25Totals 19,164 229 8,769
13. LIGHT CONDITION InjuryFatalAll1. Daylight 13,561 123 6,2512. Dawn or Dusk 1,018 16 4433. Darkness 4,554 88 2,0684. Not stated 31 2 7Totals 19,164 229 8,769
11. VEHICLE TYPE InjuryFatalAll1. Passenger car 33,324 299 15,5622. Pass Car and trailer 475 7 1743. Truck or truck tractor 213 5 824. Truck tractor with semi-trailer 1,183 31 4525. Other truck combination 51 1 216. Farm tractor and/or equip. 8 1 47. Taxicab 8 48. Bus 61 1 249. School bus 27 1010. Motorcycle 325 13 28411. Motor scooter or moped 3 212. Others and not stated 232 1 63Totals 35,910 359 16,682Special vehicles included above 13. Log trucks 52 4 2614. Emergency (incl. private) 89 2 3015. Military vehicles 16. Other public vehicles 179 1 73
NOTE: THIS YEAR TO DATE represents only those crashes entered onto the database as of the date above. SAME PERIOD LAST YEAR represents all crashes including late reports. MAJOR INJURIES are incapacitating injuries. MINOR INJURIES are non-incapacitating evident injuries.
3. LOCATION Total
PropertyDamage
Nonfatal Injury Fatal Property
DamageNonfatal
InjuryFatalTotalPropertyDamage
Nonfatal Injury Fatal Total Killed Injured
Total On Roadway TotalOff Roadway Number Of Crashes Number Of Persons
1. Below 1,000 2. 1,000 to 2,500 3. 2,501 to 5,000 4. 5,001 to 10,000 5. 10,001 to 25,000 6. 25,001 to 50,000 7. 50,001 to 100,000 8. 100,001 to 200,000 9. City of Portland Only Total - Municipalities 1. Primary State Highways 2. Secondary State Highways 3. County and Local Roads 4. City Streets 5. Not Stated Total--Urban Area 6. Interstate System 7. Other State Freeways 8. Other State Highways Total--Urban System
6. Interstate System 1,223 24 493 706 549 8 199 342 674 16 294 364 24 7487. Other State Freeways 8. Other State Highways 4,962 143 2,409 2,410 2,747 79 1,253 1,415 2,215 64 1,156 995 178 4,016Total--Rural System 6,185 167 2,902 3,116 3,296 87 1,452 1,757 2,889 80 1,450 1,359 202 4,764
June 1, 2007
OREGON RURAL AREAS
100
At I
nter
sect
ion
Not
at I
nter
sect
ion
At
Inte
r. N
on -I
nter
.
OREGON RURAL AREAS 2006 STATE HIGHWAY CRASHES
4. AGE OF CASUALTY
Number of Persons Killed Number of Persons Injured Total Killed Pedestrians Pedalcyclist Total Injured Pedestrians Pedalcyclist
Total Total Total Total Total TotalMale Male Male Male Male MaleFemale Female Female Female Female Female1. 0 to 4 1 1 35 40 76 2 1 12. 5 to 9 62 54 116 4 4 3. 10 to 14 2 3 1 1 81 70 151 4 2 2 34. 15 to 19 3 1 1 2 385 269 654 23 14 9 15. 20 to 24 2 1 1 275 301 576 22 13 96. 25 to 34 1 2 1 351 374 725 31 24 7 2 2 27. 35 to 44 1 1 345 320 665 31 20 11 1 1 8. 45 to 54 6 2 2 4 347 383 730 34 21 13 2 2 1 1 29. 55 to 64 1 2 239 293 532 20 13 7 2 2 110. 65 to 74 2 1 1 1 151 162 313 16 10 6 1 1 111. 75 & older 90 97 187 15 10 5 1 1 12. Not-stated 1 1 17 19 39Totals 202 132 70 9 5 4 1 1 4,764 2,382 2,378 19 13 6 11 10 1
Directional Analysis - A crash consisting of a series of collisions, overturning, etc., is classified according to the first damage or injury producing event; includes on roadway and off roadway.5A. MULTIPLE VEH CRASH Total Fatal Injury P.D.O.
Junction1. Car go straight 21 8 8 13 2 112. Car turning right 3. Car turning left 4. Car backing 5. All others 1 1 1Totals 22 8 8 14 2 12
5D. ALL OTHER CRASHES Total Fatal Injury P.D.O.Coll-isionWith
Coll-isionWith
1. Other rd veh or railway train 4 4 2. Fixed object 38 23 1 62 3. Other object or animal 1 1 2 4. Overturning 6 5 1 12 5. Other noncollision 2 1 3 6. Other rd veh or railway train 2 7 1 10 7. Fixed object 1,164 1,231 68 2,463 8. Other object or animal 367 106 5 478 9. Overturning 133 196 14 343 10. Other noncollision 23 16 39 11. Not statedTotals 1,7361,590 90 3,416
6. PEDESTRIAN ACTION BY AGE
Ages of Pedstrians Killed and InjuredPedestrians Killed Total 0 to 4 5 to 9 10 to 14 15 to 19 20 to 24 25 to 44 45 to 64 65 & older Not stated
1a. X-ing at intersect or X-walk 1 1 1b. X-ing not at intersection 3 3 1 1 8 3 2a. Walking in road with traffic 2 2 1 5 2 2b. Same against traffic 3. Standing in roadway 1 1 2 1 4. Push or work on veh in road 1 1 5. Other working in roadway 6. Playing in roadway 7. Other in roadway 3 1 4 1 8. Not in roadway 1 2 2 1 1 7 2 9. Not stated
14 10 5232 1 28 9 Totals
7. AGE OF DRIVER All Crashes Fatal Injury 1. 14 & YOUNGER 2 12. 15 10 1 4 3. 16 152 2 88 4. 17 213 2 132 5. 18 314 8 170 6. 19 258 9 126 7. 20 230 6 136 8. 21 228 7 113 9. 22 to 24 583 20 297 10. 25 to 34 1,462 47 725 11. 35 to 44 1,438 39 731 12. 45 to 54 1,617 45 761 13. 55 to 64 1,224 31 589 14. 65 to 74 626 21 304 15. 75 & older 399 14 178 16. Not stated 489 1 65 Totals 9,245 254 4,419 8. SEX OF DRIVER Injury Fatal All Crashes
1. Male 5,909 194 2,634 2. Female 3,186 59 1,743 3. Not stated 150 1 42 Totals 9,245 254 4,419
9. RESIDENCE OF DRIVER All Crashes Fatal Injury
1. Local resident 5,350 129 2,693 2. In-state resident 2,346 76 1,108 3. Non resident 1,292 48 562 4. Not stated 257 1 56 Totals 9,245 254 4,419
10. CRASHES BY CONTRIBUTING FACTOR All InjuryFatal1. Speed too fast
306 75
123 13 40
7. Followed too closely 618 2 5
27 1 2
219 252
22 66
6. Improper overtaking5. Drove left of center4. Disregard traffic signal3. Passed stop sign2. Failed to yield 551 11 320
1,451 78 2,954
8. Made improper turn
Totals 7,117 238 3,411 419
46 434 136
48
13 1
53 45
1,117 105 874 227 112
12. Other 11. Mechanical defect10. Improper driving9. Had been drinking
12. ROAD SURFACECONDITION InjuryFatalAll
1. Dry 3,443 104 1,6582. Wet 1,350 42 6823. Snowy or icy 1,335 17 5544. Other 5. Not stated 57 4 8Totals 6,185 167 2,902
13. LIGHT CONDITION InjuryFatalAll1. Daylight 4,013 99 1,9292. Dawn or Dusk 375 9 1663. Darkness 1,782 57 8034. Not stated 15 2 4Totals 6,185 167 2,902
11. VEHICLE TYPE InjuryFatalAll1. Passenger car 8,098 212 3,9082. Pass Car and trailer 284 7 983. Truck or truck tractor 54 3 244. Truck tractor with semi-trailer 613 20 2295. Other truck combination 23 1 116. Farm tractor and/or equip. 7 1 47. Taxicab 1 18. Bus 7 39. School bus 8 210. Motorcycle 179 11 16011. Motor scooter or moped 1 112. Others and not stated 54 16Totals 9,329 255 4,457Special vehicles included above 13. Log trucks 39 3 2214. Emergency (incl. private) 28 1 915. Military vehicles 16. Other public vehicles 61 22
NOTE: THIS YEAR TO DATE represents only those crashes entered onto the database as of the date above. SAME PERIOD LAST YEAR represents all crashes including late reports. MAJOR INJURIES are incapacitating injuries. MINOR INJURIES are non-incapacitating evident injuries.
3. LOCATION Total
PropertyDamage
Nonfatal Injury Fatal Property
DamageNonfatal
InjuryFatalTotalPropertyDamage
Nonfatal Injury Fatal Total Killed Injured
Total On Roadway TotalOff Roadway Number Of Crashes Number Of Persons
1. Below 1,000 2. 1,000 to 2,500 3. 2,501 to 5,000 4. 5,001 to 10,000 5. 10,001 to 25,000 6. 25,001 to 50,000 7. 50,001 to 100,000 8. 100,001 to 200,000 9. City of Portland Only Total - Municipalities
Directional Analysis - A crash consisting of a series of collisions, overturning, etc., is classified according to the first damage or injury producing event; includes on roadway and off roadway.5A. MULTIPLE VEH CRASH Total Fatal Injury P.D.O.
Junction1. Car go straight 98 17 6 11 81 34 472. Car turning right 28 28 21 73. Car turning left 37 1 1 36 32 44. Car backing5. All othersTotals 163 18 7 11 145 87 58
5D. ALL OTHER CRASHES Total Fatal Injury P.D.O.Coll-isionWith
Coll-isionWith
1. Other rd veh or railway train 1 98 99 2. Fixed object 48 41 1 90 3. Other object or animal 1 1 4. Overturning 4 9 1 14 5. Other noncollision 1 2 3 6. Other rd veh or railway train 3 53 2 58 7. Fixed object 432 368 9 809 8. Other object or animal 68 22 90 9. Overturning 15 34 2 51 10. Other noncollision 6 6 12 11. Not statedTotals 578634 15 1,227
6. PEDESTRIAN ACTION BY AGE
Ages of Pedstrians Killed and InjuredPedestrians Killed Total 0 to 4 5 to 9 10 to 14 15 to 19 20 to 24 25 to 44 45 to 64 65 & older Not stated
1a. X-ing at intersect or X-walk 7 17 29 24 7 13 6 3 4 110 8 1b. X-ing not at intersection 3 16 14 2 6 3 44 5 2a. Walking in road with traffic 2b. Same against traffic 3. Standing in roadway 1 1 1 3 2 4. Push or work on veh in road 5. Other working in roadway 1 1 6. Playing in roadway 7. Other in roadway 1 1 1 1 4 2 8. Not in roadway 2 5 4 1 12 1 9. Not stated
722 53 44112193 4 174 18 Totals
7. AGE OF DRIVER All Crashes Fatal Injury 1. 14 & YOUNGER 3 1 2. 15 21 1 9 3. 16 283 129 4. 17 523 2 267 5. 18 728 3 367 6. 19 697 3 374 7. 20 608 3 315 8. 21 576 3 304 9. 22 to 24 1,588 4 834 10. 25 to 34 4,767 23 2,389 11. 35 to 44 4,406 15 2,249 12. 45 to 54 4,324 19 2,110 13. 55 to 64 2,962 16 1,397 14. 65 to 74 1,278 7 559 15. 75 & older 973 4 435 16. Not stated 2,712 1 427 Totals 26,449 104 12,166 8. SEX OF DRIVER Injury Fatal All Crashes
1. Male 14,734 69 6,528 2. Female 11,054 34 5,421 3. Not stated 661 1 217 Totals 26,449 104 12,166
9. RESIDENCE OF DRIVER All Crashes Fatal Injury
1. Local resident 20,805 75 9,900 2. In-state resident 2,199 10 1,079 3. Non resident 1,902 15 792 4. Not stated 1,543 4 395 Totals 26,449 104 12,166
10. CRASHES BY CONTRIBUTING FACTOR All InjuryFatal1. Speed too fast
2,293 34 40
491 44
7. Followed too closely 4,930 3 4 8 3 2
166 84
971 88
6. Improper overtaking5. Drove left of center4. Disregard traffic signal3. Passed stop sign2. Failed to yield 2,180 11 1,031
1,089 17 2,169
8. Made improper turn
Totals 14,884 102 6,903 1,023
48 456 174 180
4
19 30
1
2,236 98
1,074 292 596
12. Other 11. Mechanical defect10. Improper driving9. Had been drinking
12. ROAD SURFACECONDITION InjuryFatalAll
1. Dry 9,136 44 4,1892. Wet 3,375 13 1,5593. Snowy or icy 266 1 1024. Other 5. Not stated 202 4 17Totals 12,979 62 5,867
13. LIGHT CONDITION InjuryFatalAll1. Daylight 9,548 24 4,3222. Dawn or Dusk 643 7 2773. Darkness 2,772 31 1,2654. Not stated 16 3Totals 12,979 62 5,867
11. VEHICLE TYPE InjuryFatalAll1. Passenger car 25,226 87 11,6542. Pass Car and trailer 191 763. Truck or truck tractor 159 2 584. Truck tractor with semi-trailer 570 11 2235. Other truck combination 28 106. Farm tractor and/or equip. 17. Taxicab 7 38. Bus 54 1 219. School bus 19 810. Motorcycle 146 2 12411. Motor scooter or moped 2 112. Others and not stated 178 1 47Totals 26,581 104 12,225Special vehicles included above 13. Log trucks 13 1 414. Emergency (incl. private) 61 1 2115. Military vehicles 16. Other public vehicles 118 1 51
NOTE: THIS YEAR TO DATE represents only those crashes entered onto the database as of the date above. SAME PERIOD LAST YEAR represents all crashes including late reports. MAJOR INJURIES are incapacitating injuries. MINOR INJURIES are non-incapacitating evident injuries.
3. LOCATION Total
PropertyDamage
Nonfatal Injury Fatal Property
DamageNonfatal
InjuryFatalTotalPropertyDamage
Nonfatal Injury Fatal Total Killed Injured
Total On Roadway TotalOff Roadway Number Of Crashes Number Of Persons
1. Below 1,000 2. 1,000 to 2,500 3. 2,501 to 5,000 4. 5,001 to 10,000 5. 10,001 to 25,000 6. 25,001 to 50,000 7. 50,001 to 100,000 8. 100,001 to 200,000 9. City of Portland Only Total - Municipalities
Directional Analysis - A crash consisting of a series of collisions, overturning, etc., is classified according to the first damage or injury producing event; includes on roadway and off roadway.5A. MULTIPLE VEH CRASH Total Fatal Injury P.D.O.
Junction1. Car go straight 68 11 3 8 57 26 312. Car turning right 17 17 16 13. Car turning left 26 26 25 14. Car backing5. All othersTotals 111 11 3 8 100 67 33
5D. ALL OTHER CRASHES Total Fatal Injury P.D.O.Coll-isionWith
Coll-isionWith
1. Other rd veh or railway train 86 86 2. Fixed object 30 30 60 3. Other object or animal 1 1 4. Overturning 3 5 1 9 5. Other noncollision 1 1 2 6. Other rd veh or railway train 1 43 44 7. Fixed object 249 209 2 460 8. Other object or animal 34 9 43 9. Overturning 6 19 1 26 10. Other noncollision 1 3 4 11. Not statedTotals 325406 4 735
6. PEDESTRIAN ACTION BY AGE
Ages of Pedstrians Killed and InjuredPedestrians Killed Total 0 to 4 5 to 9 10 to 14 15 to 19 20 to 24 25 to 44 45 to 64 65 & older Not stated
1a. X-ing at intersect or X-walk 3 15 19 15 5 11 6 2 76 4 1b. X-ing not at intersection 2 13 10 3 1 29 3 2a. Walking in road with traffic 2b. Same against traffic 3. Standing in roadway 1 1 1 4. Push or work on veh in road 5. Other working in roadway 6. Playing in roadway 7. Other in roadway 1 1 1 1 4 2 8. Not in roadway 1 2 1 1 5 1 9. Not stated
318 36 2771572 115 11 Totals
7. AGE OF DRIVER All Crashes Fatal Injury 1. 14 & YOUNGER 3 1 2. 15 10 4 3. 16 200 87 4. 17 368 2 195 5. 18 496 2 252 6. 19 450 2 249 7. 20 366 3 188 8. 21 341 2 181 9. 22 to 24 944 1 494 10. 25 to 34 2,684 12 1,335 11. 35 to 44 2,482 7 1,278 12. 45 to 54 2,558 14 1,283 13. 55 to 64 1,802 8 858 14. 65 to 74 868 6 385 15. 75 & older 662 3 291 16. Not stated 1,296 1 190 Totals 15,530 63 7,271 8. SEX OF DRIVER Injury Fatal All Crashes
1. Male 8,537 38 3,885 2. Female 6,712 24 3,287 3. Not stated 281 1 99 Totals 15,530 63 7,271
9. RESIDENCE OF DRIVER All Crashes Fatal Injury
1. Local resident 12,610 43 6,083 2. In-state resident 1,498 7 726 3. Non resident 775 9 295 4. Not stated 647 4 167 Totals 15,530 63 7,271
10. CRASHES BY CONTRIBUTING FACTOR All InjuryFatal1. Speed too fast
1,128 26 28
358 33
7. Followed too closely 2,355 2 1 3 2 2
129 58
675 69
6. Improper overtaking5. Drove left of center4. Disregard traffic signal3. Passed stop sign2. Failed to yield 1,498 7 701
766 9 1,528
8. Made improper turn
Totals 8,743 56 4,139 603
32 256 98
110
2
11 16
1
1,204 64
592 170 401
12. Other 11. Mechanical defect10. Improper driving9. Had been drinking
12. ROAD SURFACECONDITION InjuryFatalAll
1. Dry 5,525 24 2,5882. Wet 1,920 7 9003. Snowy or icy 164 634. Other 5. Not stated 102 3 9Totals 7,711 34 3,560
13. LIGHT CONDITION InjuryFatalAll1. Daylight 5,775 12 2,6652. Dawn or Dusk 387 2 1713. Darkness 1,540 20 7224. Not stated 9 2Totals 7,711 34 3,560
11. VEHICLE TYPE InjuryFatalAll1. Passenger car 14,853 50 7,0122. Pass Car and trailer 113 433. Truck or truck tractor 73 1 204. Truck tractor with semi-trailer 295 9 1045. Other truck combination 19 46. Farm tractor and/or equip. 17. Taxicab 3 18. Bus 23 119. School bus 16 810. Motorcycle 92 1 7911. Motor scooter or moped 12. Others and not stated 130 1 34Totals 15,618 62 7,316Special vehicles included above 13. Log trucks 10 1 314. Emergency (incl. private) 31 1315. Military vehicles 16. Other public vehicles 77 35
1. Primary State Highways 2. Secondary State Highways 3. County and Local Roads 4. City Streets 5. Not Stated Total--Rural Area
NOTE: THIS YEAR TO DATE represents only those crashes entered onto the database as of the date above. SAME PERIOD LAST YEAR represents all crashes including late reports. MAJOR INJURIES are incapacitating injuries. MINOR INJURIES are non-incapacitating evident injuries.
3. LOCATION Total
PropertyDamage
Nonfatal Injury Fatal Property
DamageNonfatal
InjuryFatalTotalPropertyDamage
Nonfatal Injury Fatal Total Killed Injured
Total On Roadway TotalOff Roadway Number Of Crashes Number Of Persons
1. Below 1,000 2. 1,000 to 2,500 3. 2,501 to 5,000 4. 5,001 to 10,000 5. 10,001 to 25,000 6. 25,001 to 50,000 7. 50,001 to 100,000 8. 100,001 to 200,000 9. City of Portland Only Total - Municipalities
3. County and Local Roads 4. City Streets 5. Not Stated Total--Urban Area 2,17713108 99 5 2121,8061,35983,173 1,914 1,458 13 3,385 6. Interstate System 1,304 4 556 744 1,203 1 504 698 101 3 52 46 4 8397. Other State Freeways 267 98 169 244 88 156 23 10 13 1608. Other State Highways 1,814 9 804 1,001 1,726 7 767 952 88 2 37 49 9 1,178Total--Urban System 3,385 13 1,458 1,914 3,173 8 1,359 1,806 212 5 99 108 13 2,177
6. Interstate System 7. Other State Freeways 8. Other State Highways Total--Rural System
June 1, 2007
PORTLAND
106
At I
nter
sect
ion
Not
at I
nter
sect
ion
At
Inte
r. N
on -I
nter
.
PORTLAND 2006 STATE HIGHWAY CRASHES
4. AGE OF CASUALTY
Number of Persons Killed Number of Persons Injured Total Killed Pedestrians Pedalcyclist Total Injured Pedestrians Pedalcyclist
Total Total Total Total Total TotalMale Male Male Male Male MaleFemale Female Female Female Female Female1. 0 to 4 1 1 22 14 362. 5 to 9 27 35 623. 10 to 14 2 1 1 2 37 27 644. 15 to 19 3 1 2 93 65 1585. 20 to 24 2 2 153 119 272 2 2 6. 25 to 34 4 1 5 2 2 267 198 466 5 3 2 2 1 1 47. 35 to 44 4 1 2 2 2 240 198 438 2 2 18. 45 to 54 7 1 4 3 4 176 142 318 3 1 2 39. 55 to 64 4 2 3 1 109 104 213 210. 65 to 74 44 31 7511. 75 & older 1 1 17 13 30 1 1 1 1 12. Not-stated 4 1 2 2 16 24 45 1Totals 13 8 5 3 1 2 2,177 970 1,201 32 13 19 15 11 4
Directional Analysis - A crash consisting of a series of collisions, overturning, etc., is classified according to the first damage or injury producing event; includes on roadway and off roadway.5A. MULTIPLE VEH CRASH Total Fatal Injury P.D.O.
5B. MULTIPLE VEH CRASH Total Fatal Injury P.D.O. 17 23 4 441. Moving in opposite dir.
536 269 8052. Both moving in same dir. 7 2 93a. One car parked
689 573 1 1,2633b. One car stopped in traffic 3 34. Enter/Leave parked pos. 5 9 145a. Entering driveway/alley
23 15 385b. Leaving driveway/alley 17 28 456. All others
Totals 1,297 919 5 2,221
5C. PEDESTRIANCRASHES
All PedCrashes
Fatal Crashes Non-Fatal Injury Crashes
TotalAt
Intersection Non-
Junction TotalAt
IntersectionNon-
Junction1. Car go straight 21 3 3 18 8 102. Car turning right 6 6 5 13. Car turning left 7 7 5 24. Car backing5. All othersTotals 34 3 3 31 18 13
5D. ALL OTHER CRASHES Total Fatal Injury P.D.O.Coll-isionWith
Coll-isionWith
1. Other rd veh or railway train 1 10 11 2. Fixed object 11 6 1 18 3. Other object or animal4. Overturning 2 2 5. Other noncollision 1 1 6. Other rd veh or railway train 1 5 6 7. Fixed object 85 80 3 168 8. Other object or animal 9 6 15 9. Overturning 2 6 1 9 10. Other noncollision 2 1 3 11. Not statedTotals 111117 5 233
6. PEDESTRIAN ACTION BY AGE
Ages of Pedstrians Killed and InjuredPedestrians Killed Total 0 to 4 5 to 9 10 to 14 15 to 19 20 to 24 25 to 44 45 to 64 65 & older Not stated
1a. X-ing at intersect or X-walk 4 2 8 7 1 1 1 24 3 1b. X-ing not at intersection 1 2 1 2 2 8 2a. Walking in road with traffic 2b. Same against traffic 3. Standing in roadway 1 1 4. Push or work on veh in road 5. Other working in roadway 1 1 6. Playing in roadway 7. Other in roadway 8. Not in roadway 1 1 9. Not stated
42 11 10232 1 35 3 Totals
7. AGE OF DRIVER All Crashes Fatal Injury 1. 14 & younger 2. 15 5 1 2 3. 16 28 13 4. 17 65 31 5. 18 128 68 6. 19 139 76 7. 20 138 71 8. 21 151 1 76 9. 22 to 24 432 1 229 10. 25 to 34 1,411 6 704 11. 35 to 44 1,298 4 656 12. 45 to 54 1,156 3 523 13. 55 to 64 748 3 345 14. 65 to 74 247 1 108 15. 75 & older 154 62 16. Not stated 1,086 199 Totals 7,186 20 3,163 8. SEX OF DRIVER Injury Fatal All Crashes
1. Male 4,113 16 1,743 2. Female 2,764 4 1,318 3. Not stated 309 102 Totals 7,186 20 3,163
9. RESIDENCE OF DRIVER All Crashes Fatal Injury
1. Local resident 5,150 16 2,352 2. In-state resident 410 1 213 3. Non resident 908 3 402 4. Not stated 718 196 Totals 7,186 20 3,163
10. CRASHES BY CONTRIBUTING FACTOR All InjuryFatal1. Speed too fast
865 3 4
100 6
7. Followed too closely 1,921 1
1 1
14 5
227 10
6. Improper overtaking5. Drove left of center4. Disregard traffic signal3. Passed stop sign2. Failed to yield 315 2 148
145 6 285
8. Made improper turn
Totals 4,003 22 1,779 289
10 129 41 39
4 7
698 19
327 69
113
12. Other 11. Mechanical defect10. Improper driving9. Had been drinking
12. ROAD SURFACECONDITION InjuryFatalAll
1. Dry 2,312 7 1,0162. Wet 974 4 4293. Snowy or icy 26 1 94. Other 5. Not stated 73 1 4Totals 3,385 13 1,458
13. LIGHT CONDITION InjuryFatalAll1. Daylight 2,439 4 1,0552. Dawn or Dusk 153 2 633. Darkness 788 7 3394. Not stated 5 1Totals 3,385 13 1,458
11. VEHICLE TYPE InjuryFatalAll1. Passenger car 6,865 18 3,0242. Pass Car and trailer 36 113. Truck or truck tractor 64 1 294. Truck tractor with semi-trailer 180 695. Other truck combination 3 26. Farm tractor and/or equip. 7. Taxicab 3 28. Bus 24 1 99. School bus 210. Motorcycle 29 1 2311. Motor scooter or moped 2 112. Others and not stated 14 6Totals 7,222 21 3,176Special vehicles included above 13. Log trucks14. Emergency (incl. private) 21 1 715. Military vehicles 16. Other public vehicles 30 1 12
14. MANNER OF COLLISION InjuryFatalAll
1. Head-on 17 4 72. Rear end 2,006 1 9073. Angle 652 2754. Sideswipe-meeting 10 75. Sideswipe-overtaking 396 1066. Backed into 30 67. Other 7 2Totals 3,118 5 1,310
11. Count of vehicles, including properly parked vehicles.
Totals include participant records where gender was coded as "unknown".
10. Count of crashes. Crashes with multiple contributing circumstances are counted in all applicable categories.
MULTIPLE VEHICLE CRASHES
7 - 9. Tally of drivers by age, sex, residence & crash severity. Excludes occupants of properly & improperly parked vehicles.
107
Truck
Crash Summaries
108
109
Col
lisio
n in
volv
ing:
N
on-
coll.
N
on-
coll.
C
ollis
ion
invo
lvin
g:
Non
- co
ll.
Col
lisio
n in
volv
ing:
3C
. RU
RA
L 3A
. Inc
orpo
rate
d A
reas
3B
. UR
BA
N
SUMMARY OF MOTOR VEHICLE TRAFFIC CRASHES 2006 TRUCK CRASHESForIn
NOTE: THIS YEAR TO DATE represents only those crashes entered onto the database as of the date above. SAME PERIOD LAST YEAR represents all crashes including late reports. MAJOR INJURIES are incapacitating injuries. MINOR INJURIES are non-incapacitating evident injuries.
3. LOCATION Total
PropertyDamage
Nonfatal Injury Fatal Property
DamageNonfatal
InjuryFatalTotalPropertyDamage
Nonfatal Injury Fatal Total Killed Injured
Total On Roadway TotalOff Roadway Number Of Crashes Number Of Persons
1. Below 1,000 2. 1,000 to 2,500 3. 2,501 to 5,000 4. 5,001 to 10,000 5. 10,001 to 25,000 6. 25,001 to 50,000 7. 50,001 to 100,000 8. 100,001 to 200,000 9. City of Portland Only Total - Municipalities
6. Interstate System 259 2 96 161 173 2 64 107 86 32 54 2 1357. Other State Freeways 8. Other State Highways 439 21 177 241 304 20 129 155 135 1 48 86 32 274Total--Rural System 698 23 273 402 477 22 193 262 221 1 80 140 34 409
June 1, 2007
STATE OF OREGON
110
At I
nter
sect
ion
Not
at I
nter
sect
ion
At
Inte
r. N
on -I
nter
.
STATE OF OREGON 2006 TRUCK CRASHES
4. AGE OF CASUALTY
Number of Persons Killed Number of Persons Injured Total Killed Pedestrians Pedalcyclist Total Injured Pedestrians Pedalcyclist
Total Total Total Total Total TotalMale Male Male Male Male MaleFemale Female Female Female Female Female1. 0 to 4 4 2 6 2 1 1 1 1 2. 5 to 9 1 6 9 15 3 1 2 13. 10 to 14 7 12 19 3 2 14. 15 to 19 2 2 50 44 94 8 5 35. 20 to 24 1 1 1 57 58 115 3 1 2 16. 25 to 34 1 2 1 72 118 190 6 5 1 27. 35 to 44 2 1 1 2 67 121 188 13 9 4 2 1 1 8. 45 to 54 2 1 2 75 134 209 15 11 4 1 1 1 1 19. 55 to 64 1 1 1 49 81 130 4 4 1 1 110. 65 to 74 19 36 55 7 4 3 1 1 11. 75 & older 1 20 22 42 2 2 112. Not-stated 2 9 11Totals 66 43 23 6 4 2 1 1 1,074 646 428 9 7 2 8 7 1
Directional Analysis - A crash consisting of a series of collisions, overturning, etc., is classified according to the first damage or injury producing event; includes on roadway and off roadway.5A. MULTIPLE VEH CRASH Total Fatal Injury P.D.O.
5B. MULTIPLE VEH CRASH Total Fatal Injury P.D.O. 65 56 26 1471. Moving in opposite dir.
334 185 3 5222. Both moving in same dir. 39 21 603a. One car parked
141 112 2533b. One car stopped in traffic 13 3 164. Enter/Leave parked pos. 14 7 215a. Entering driveway/alley 19 4 235b. Leaving driveway/alley 25 13 386. All others
Totals 650 401 29 1,080
5C. PEDESTRIANCRASHES
All PedCrashes
Fatal Crashes Non-Fatal Injury Crashes
TotalAt
Intersection Non-
Junction TotalAt
IntersectionNon-
Junction1. Car go straight 8 4 1 3 4 2 22. Car turning right 2 2 1 13. Car turning left4. Car backing 1 1 15. All othersTotals 11 5 1 4 6 3 3
5D. ALL OTHER CRASHES Total Fatal Injury P.D.O.Coll-isionWith
Coll-isionWith
1. Other rd veh or railway train 5 5 2. Fixed object 19 3 22 3. Other object or animal4. Overturning 13 5 1 19 5. Other noncollision 3 1 4 6. Other rd veh or railway train 3 3 1 7 7. Fixed object 155 89 7 251 8. Other object or animal 21 7 1 29 9. Overturning 43 36 79 10. Other noncollision 19 1 20 11. Not statedTotals 276150 10 436
6. PEDESTRIAN ACTION BY AGE
Ages of Pedstrians Killed and InjuredPedestrians Killed Total 0 to 4 5 to 9 10 to 14 15 to 19 20 to 24 25 to 44 45 to 64 65 & older Not stated
1a. X-ing at intersect or X-walk 1 2 1 1 5 2 1b. X-ing not at intersection 1 1 2 2 2a. Walking in road with traffic 1 1 2b. Same against traffic 3. Standing in roadway 1 1 4. Push or work on veh in road 5. Other working in roadway 1 1 6. Playing in roadway 7. Other in roadway 8. Not in roadway 2 3 5 2 9. Not stated
1 5 512 1 15 6 Totals
7. AGE OF DRIVER All Crashes Fatal Injury 1. 14 & younger 2. 15 3. 16 14 8 4. 17 29 16 5. 18 50 3 19 6. 19 43 5 14 7. 20 47 1 30 8. 21 56 1 24 9. 22 to 24 166 3 77 10. 25 to 34 662 10 281 11. 35 to 44 756 22 305 12. 45 to 54 856 24 332 13. 55 to 64 556 14 209 14. 65 to 74 202 7 68 15. 75 & older 111 2 42 16. Not stated 348 1 62 Totals 3,896 93 1,487 8. SEX OF DRIVER Injury Fatal All Crashes
1. Male 2,931 74 1,081 2. Female 829 18 366 3. Not stated 136 1 40 Totals 3,896 93 1,487
9. RESIDENCE OF DRIVER All Crashes Fatal Injury
1. Local resident 2,135 46 865 2. In-state resident 690 20 286 3. Non resident 819 26 276 4. Not stated 252 1 60 Totals 3,896 93 1,487
10. CRASHES BY CONTRIBUTING FACTOR All InjuryFatal1. Speed too fast
153 18 31 31 10
7. Followed too closely 313 1 2
16 1 2
89 89 58 25
6. Improper overtaking5. Drove left of center4. Disregard traffic signal3. Passed stop sign2. Failed to yield 233 5 84
204 18 479
8. Made improper turn
Totals 2,464 75 906 167
18 136 18 36
4 1
12 11
2
462 42
440 38
196
12. Other 11. Mechanical defect10. Improper driving9. Had been drinking
12. ROAD SURFACECONDITION InjuryFatalAll
1. Dry 1,431 33 5282. Wet 447 13 1613. Snowy or icy 193 5 614. Other 5. Not stated 22 1Totals 2,093 51 751
13. LIGHT CONDITION InjuryFatalAll1. Daylight 1,546 37 5542. Dawn or Dusk 97 2 323. Darkness 446 12 1644. Not stated 4 1Totals 2,093 51 751
11. VEHICLE TYPE InjuryFatalAll1. Passenger car 1,740 36 7102. Pass Car and trailer 34 83. Truck or truck tractor 458 11 1674. Truck tractor with semi-trailer 1,568 40 5545. Other truck combination 76 1 266. Farm tractor and/or equip. 2 17. Taxicab8. Bus 9 1 29. School bus 5 210. Motorcycle 7 2 511. Motor scooter or moped 12. Others and not stated 17 6Totals 3,916 92 1,480Special vehicles included above 13. Log trucks 71 8 3214. Emergency (incl. private) 26 415. Military vehicles 116. Other public vehicles 83 2 21
NOTE: THIS YEAR TO DATE represents only those crashes entered onto the database as of the date above. SAME PERIOD LAST YEAR represents all crashes including late reports. MAJOR INJURIES are incapacitating injuries. MINOR INJURIES are non-incapacitating evident injuries.
3. LOCATION Total
PropertyDamage
Nonfatal Injury Fatal Property
DamageNonfatal
InjuryFatalTotalPropertyDamage
Nonfatal Injury Fatal Total Killed Injured
Total On Roadway TotalOff Roadway Number Of Crashes Number Of Persons
1. Below 1,000 2. 1,000 to 2,500 3. 2,501 to 5,000 4. 5,001 to 10,000 5. 10,001 to 25,000 6. 25,001 to 50,000 7. 50,001 to 100,000 8. 100,001 to 200,000 9. City of Portland Only Total - Municipalities 1. Primary State Highways 2. Secondary State Highways 3. County and Local Roads 4. City Streets 5. Not Stated Total--Urban Area 6. Interstate System 7. Other State Freeways 8. Other State Highways Total--Urban System
6. Interstate System 257 2 96 159 171 2 64 105 86 32 54 2 1357. Other State Freeways 8. Other State Highways 406 21 164 221 279 20 117 142 127 1 47 79 32 252Total--Rural System 663 23 260 380 450 22 181 247 213 1 79 133 34 387
June 1, 2007
OREGON RURAL AREAS
112
At I
nter
sect
ion
Not
at I
nter
sect
ion
At
Inte
r. N
on -I
nter
.
OREGON RURAL AREAS 2006 TRUCK CRASHES
4. AGE OF CASUALTY
Number of Persons Killed Number of Persons Injured Total Killed Pedestrians Pedalcyclist Total Injured Pedestrians Pedalcyclist
Total Total Total Total Total TotalMale Male Male Male Male MaleFemale Female Female Female Female Female1. 0 to 4 1 1 1 12. 5 to 9 3 3 6 3 1 23. 10 to 14 1 9 10 3 2 14. 15 to 19 2 2 22 22 44 7 5 25. 20 to 24 22 28 50 1 16. 25 to 34 17 58 75 6 5 17. 35 to 44 18 52 70 9 7 28. 45 to 54 1 1 31 76 107 8 5 3 1 19. 55 to 64 19 46 65 3 3 1 1 10. 65 to 74 7 16 23 6 4 211. 75 & older 8 10 18 1 112. Not-stated 1 4 5Totals 48 32 16 1 1 1 1 474 324 150 3 3
Directional Analysis - A crash consisting of a series of collisions, overturning, etc., is classified according to the first damage or injury producing event; includes on roadway and off roadway.5A. MULTIPLE VEH CRASH Total Fatal Injury P.D.O.
Junction1. Car go straight 1 1 12. Car turning right3. Car turning left 4. Car backing 5. All othersTotals 1 1 1
5D. ALL OTHER CRASHES Total Fatal Injury P.D.O.Coll-isionWith
Coll-isionWith
1. Other rd veh or railway train2. Fixed object 6 6 3. Other object or animal4. Overturning 6 2 1 9 5. Other noncollision 2 2 6. Other rd veh or railway train 2 1 1 4 7. Fixed object 115 75 6 196 8. Other object or animal 18 6 1 25 9. Overturning 40 29 69 10. Other noncollision 16 1 17 11. Not statedTotals 205114 9 328
6. PEDESTRIAN ACTION BY AGE
Ages of Pedstrians Killed and InjuredPedestrians Killed Total 0 to 4 5 to 9 10 to 14 15 to 19 20 to 24 25 to 44 45 to 64 65 & older Not stated
1a. X-ing at intersect or X-walk 1b. X-ing not at intersection 2a. Walking in road with traffic 1 1 2b. Same against traffic 3. Standing in roadway 1 1 4. Push or work on veh in road 5. Other working in roadway 6. Playing in roadway 7. Other in roadway 8. Not in roadway 2 2 1 9. Not stated
2 2 4 1 Totals
7. AGE OF DRIVER All Crashes Fatal Injury 1. 14 & younger 2. 15 3. 16 6 4 4. 17 10 8 5. 18 23 3 7 6. 19 18 4 9 7. 20 18 1 11 8. 21 21 13 9. 22 to 24 47 2 27 10. 25 to 34 191 10 89 11. 35 to 44 266 12 102 12. 45 to 54 325 15 138 13. 55 to 64 224 8 81 14. 65 to 74 71 6 27 15. 75 & older 35 1 16 16. Not stated 91 20 Totals 1,346 62 552 8. SEX OF DRIVER Injury Fatal All Crashes
1. Male 1,088 51 430 2. Female 211 11 106 3. Not stated 47 16 Totals 1,346 62 552
9. RESIDENCE OF DRIVER All Crashes Fatal Injury
1. Local resident 547 31 253 2. In-state resident 372 17 153 3. Non resident 364 14 128 4. Not stated 63 18 Totals 1,346 62 552
10. CRASHES BY CONTRIBUTING FACTOR All InjuryFatal1. Speed too fast
25 12 26
2 4
7. Followed too closely 52 2
12
1
51 68
4 9
6. Improper overtaking5. Drove left of center4. Disregard traffic signal3. Passed stop sign2. Failed to yield 65 3 28
131 15 329
8. Made improper turn
Totals 980 51 392 62 14 76 8 4
2 1 7 7 1
163 26
180 16 17
12. Other 11. Mechanical defect10. Improper driving9. Had been drinking
12. ROAD SURFACECONDITION InjuryFatalAll
1. Dry 492 21 2032. Wet 157 8 653. Snowy or icy 162 5 504. Other 5. Not stated 4 1Totals 815 34 319
13. LIGHT CONDITION InjuryFatalAll1. Daylight 541 27 2122. Dawn or Dusk 44 1 153. Darkness 228 6 914. Not stated 2 1Totals 815 34 319
11. VEHICLE TYPE InjuryFatalAll1. Passenger car 496 25 2322. Pass Car and trailer 18 53. Truck or truck tractor 100 7 414. Truck tractor with semi-trailer 697 26 2595. Other truck combination 30 1 126. Farm tractor and/or equip. 2 17. Taxicab8. Bus9. School bus 2 110. Motorcycle 3 1 211. Motor scooter or moped 12. Others and not stated 8 3Totals 1,356 61 555Special vehicles included above 13. Log trucks 55 7 2714. Emergency (incl. private) 5 115. Military vehicles 16. Other public vehicles 38 1 9
3. County and Local Roads 3 1 1 9 2 11 10 2 12 4. City Streets
5. Not Stated 25 8 1 9 24 14 38 32 15 47 Total--Rural Area
NOTE: THIS YEAR TO DATE represents only those crashes entered onto the database as of the date above. SAME PERIOD LAST YEAR represents all crashes including late reports. MAJOR INJURIES are incapacitating injuries. MINOR INJURIES are non-incapacitating evident injuries.
3. LOCATION Total
PropertyDamage
Nonfatal Injury Fatal Property
DamageNonfatal
InjuryFatalTotalPropertyDamage
Nonfatal Injury Fatal Total Killed Injured
Total On Roadway TotalOff Roadway Number Of Crashes Number Of Persons
1. Below 1,000 2. 1,000 to 2,500 3. 2,501 to 5,000 4. 5,001 to 10,000 5. 10,001 to 25,000 6. 25,001 to 50,000 7. 50,001 to 100,000 8. 100,001 to 200,000 9. City of Portland Only Total - Municipalities
6. Interstate System 2 2 2 0 27. Other State Freeways 8. Other State Highways 33 13 20 25 12 13 8 1 7 22Total--Rural System 35 13 22 27 12 15 8 1 7 22
June 1, 2007
OREGON CITIES AND URBAN AREAS
114
At I
nter
sect
ion
Not
at I
nter
sect
ion
At
Inte
r. N
on -I
nter
.
OREGON CITIES AND URBAN AREAS 2006 TRUCK CRASHES
4. AGE OF CASUALTY
Number of Persons Killed Number of Persons Injured Total Killed Pedestrians Pedalcyclist Total Injured Pedestrians Pedalcyclist
Total Total Total Total Total TotalMale Male Male Male Male MaleFemale Female Female Female Female Female1. 0 to 4 3 2 5 1 1 1 1 2. 5 to 9 1 3 6 9 13. 10 to 14 6 3 94. 15 to 19 28 22 50 1 15. 20 to 24 1 1 1 35 30 65 2 1 1 16. 25 to 34 1 2 1 55 60 115 27. 35 to 44 2 1 1 2 49 69 118 4 2 2 2 1 1 8. 45 to 54 1 1 1 44 58 102 7 6 1 1 1 19. 55 to 64 1 1 1 30 35 65 1 1 110. 65 to 74 12 20 32 1 1 1 1 11. 75 & older 1 12 12 24 1 1 112. Not-stated 1 5 6Totals 18 11 7 5 3 2 600 322 278 6 4 2 8 7 1
Directional Analysis - A crash consisting of a series of collisions, overturning, etc., is classified according to the first damage or injury producing event; includes on roadway and off roadway.5A. MULTIPLE VEH CRASH Total Fatal Injury P.D.O.
5B. MULTIPLE VEH CRASH Total Fatal Injury P.D.O. 17 14 6 371. Moving in opposite dir.
222 116 2 3402. Both moving in same dir. 28 4 323a. One car parked
113 89 2023b. One car stopped in traffic 10 2 124. Enter/Leave parked pos. 10 4 145a. Entering driveway/alley 17 4 215b. Leaving driveway/alley 22 7 296. All others
Totals 439 240 8 687
5C. PEDESTRIANCRASHES
All PedCrashes
Fatal Crashes Non-Fatal Injury Crashes
TotalAt
Intersection Non-
Junction TotalAt
IntersectionNon-
Junction1. Car go straight 7 4 1 3 3 2 12. Car turning right 2 2 1 13. Car turning left4. Car backing 1 1 15. All othersTotals 10 5 1 4 5 3 2
5D. ALL OTHER CRASHES Total Fatal Injury P.D.O.Coll-isionWith
Coll-isionWith
1. Other rd veh or railway train 5 5 2. Fixed object 13 3 16 3. Other object or animal4. Overturning 7 3 10 5. Other noncollision 1 1 2 6. Other rd veh or railway train 1 2 3 7. Fixed object 40 14 1 55 8. Other object or animal 3 1 4 9. Overturning 3 7 10 10. Other noncollision 3 3 11. Not statedTotals 7136 1 108
6. PEDESTRIAN ACTION BY AGE
Ages of Pedstrians Killed and InjuredPedestrians Killed Total 0 to 4 5 to 9 10 to 14 15 to 19 20 to 24 25 to 44 45 to 64 65 & older Not stated
1a. X-ing at intersect or X-walk 1 2 1 1 5 2 1b. X-ing not at intersection 1 1 2 2 2a. Walking in road with traffic 2b. Same against traffic 3. Standing in roadway 4. Push or work on veh in road 5. Other working in roadway 1 1 6. Playing in roadway 7. Other in roadway 8. Not in roadway 3 3 1 9. Not stated
1 3 51 1 11 5 Totals
7. AGE OF DRIVER All Crashes Fatal Injury 1. 14 & younger 2. 15 3. 16 8 4 4. 17 19 8 5. 18 27 12 6. 19 25 1 5 7. 20 29 19 8. 21 35 1 11 9. 22 to 24 119 1 50 10. 25 to 34 471 192 11. 35 to 44 490 10 203 12. 45 to 54 531 9 194 13. 55 to 64 332 6 128 14. 65 to 74 131 1 41 15. 75 & older 76 1 26 16. Not stated 257 1 42 Totals 2,550 31 935 8. SEX OF DRIVER Injury Fatal All Crashes
1. Male 1,843 23 651 2. Female 618 7 260 3. Not stated 89 1 24 Totals 2,550 31 935
9. RESIDENCE OF DRIVER All Crashes Fatal Injury
1. Local resident 1,588 15 612 2. In-state resident 318 3 133 3. Non resident 455 12 148 4. Not stated 189 1 42 Totals 2,550 31 935
10. CRASHES BY CONTRIBUTING FACTOR All InjuryFatal1. Speed too fast
128 6 5
29 6
7. Followed too closely 261 1
4 1 1
38 21 54 16
6. Improper overtaking5. Drove left of center4. Disregard traffic signal3. Passed stop sign2. Failed to yield 168 2 56
73 3 150
8. Made improper turn
Totals 1,484 24 514 105
4 60 10 32
2
5 4 1
299 16
260 22
179
12. Other 11. Mechanical defect10. Improper driving9. Had been drinking
12. ROAD SURFACECONDITION InjuryFatalAll
1. Dry 939 12 3252. Wet 290 5 963. Snowy or icy 31 114. Other 5. Not stated 18Totals 1,278 17 432
13. LIGHT CONDITION InjuryFatalAll1. Daylight 1,005 10 3422. Dawn or Dusk 53 1 173. Darkness 218 6 734. Not stated 2Totals 1,278 17 432
11. VEHICLE TYPE InjuryFatalAll1. Passenger car 1,244 11 4782. Pass Car and trailer 16 33. Truck or truck tractor 358 4 1264. Truck tractor with semi-trailer 871 14 2955. Other truck combination 46 146. Farm tractor and/or equip. 7. Taxicab8. Bus 9 1 29. School bus 3 110. Motorcycle 4 1 311. Motor scooter or moped 12. Others and not stated 9 3Totals 2,560 31 925Special vehicles included above 13. Log trucks 16 1 514. Emergency (incl. private) 21 315. Military vehicles 116. Other public vehicles 45 1 12
14. MANNER OF COLLISION InjuryFatalAll
1. Head-on 12 6 22. Rear end 350 1763. Angle 424 4 1224. Sideswipe-meeting 21 125. Sideswipe-overtaking 266 1 686. Backed into 64 87. Other 23 3Totals 1,160 11 391
11. Count of vehicles, including properly parked vehicles.
Totals include participant records where gender was coded as "unknown".
10. Count of crashes. Crashes with multiple contributing circumstances are counted in all applicable categories.
MULTIPLE VEHICLE CRASHES
7 - 9. Tally of drivers by age, sex, residence & crash severity. Excludes occupants of properly & improperly parked vehicles.
115
Col
lisio
n in
volv
ing:
N
on-
coll.
N
on-
coll.
C
ollis
ion
invo
lvin
g:
Non
- co
ll.
Col
lisio
n in
volv
ing:
3C
. RU
RA
L 3A
. Inc
orpo
rate
d A
reas
3B
. UR
BA
N
SUMMARY OF MOTOR VEHICLE TRAFFIC CRASHES 2006 TRUCK CRASHESForIn
3. County and Local Roads 3 1 1 9 2 11 10 2 12 4. City Streets
5. Not Stated 25 8 1 9 24 14 38 32 15 47 Total--Rural Area
NOTE: THIS YEAR TO DATE represents only those crashes entered onto the database as of the date above. SAME PERIOD LAST YEAR represents all crashes including late reports. MAJOR INJURIES are incapacitating injuries. MINOR INJURIES are non-incapacitating evident injuries.
3. LOCATION Total
PropertyDamage
Nonfatal Injury Fatal Property
DamageNonfatal
InjuryFatalTotalPropertyDamage
Nonfatal Injury Fatal Total Killed Injured
Total On Roadway TotalOff Roadway Number Of Crashes Number Of Persons
1. Below 1,000 2. 1,000 to 2,500 3. 2,501 to 5,000 4. 5,001 to 10,000 5. 10,001 to 25,000 6. 25,001 to 50,000 7. 50,001 to 100,000 8. 100,001 to 200,000 9. City of Portland Only Total - Municipalities
3. County and Local Roads 98 3 23 6 29 164 71 3 238 187 77 3 267 4. City Streets
5. Not Stated Total--Urban Area 2701339 16 1 5637417511560413 191 12 616 6. Interstate System 94 4 31 59 83 3 25 55 11 1 6 4 4 427. Other State Freeways 27 1 13 13 24 12 11 3 1 2 1 228. Other State Highways 228 4 70 154 215 67 144 13 3 10 5 108Total--Urban System 349 9 114 226 322 8 104 210 27 1 10 16 10 172
6. Interstate System 2 2 2 0 27. Other State Freeways 8. Other State Highways 33 13 20 25 12 13 8 1 7 22Total--Rural System 35 13 22 27 12 15 8 1 7 22
June 1, 2007
ALL CITIES EXCEPT PORTLAND
116
At I
nter
sect
ion
Not
at I
nter
sect
ion
At
Inte
r. N
on -I
nter
.
ALL CITIES EXCEPT PORTLAND 2006 TRUCK CRASHES
4. AGE OF CASUALTY
Number of Persons Killed Number of Persons Injured Total Killed Pedestrians Pedalcyclist Total Injured Pedestrians Pedalcyclist
Total Total Total Total Total TotalMale Male Male Male Male MaleFemale Female Female Female Female Female1. 0 to 4 3 1 4 1 1 1 1 2. 5 to 9 1 1 3 4 13. 10 to 14 3 2 54. 15 to 19 20 15 355. 20 to 24 1 1 16 9 25 1 16. 25 to 34 27 22 497. 35 to 44 1 1 18 37 55 4 2 2 2 1 1 8. 45 to 54 1 24 27 51 4 3 1 1 1 19. 55 to 64 1 1 1 19 10 29 1 1 110. 65 to 74 9 14 23 1 1 1 1 11. 75 & older 1 7 8 15 1 1 112. Not-stated Totals 13 7 6 5 3 2 295 148 147 2 1 1 5 4 1
Directional Analysis - A crash consisting of a series of collisions, overturning, etc., is classified according to the first damage or injury producing event; includes on roadway and off roadway.5A. MULTIPLE VEH CRASH Total Fatal Injury P.D.O.
5B. MULTIPLE VEH CRASH Total Fatal Injury P.D.O. 11 4 2 171. Moving in opposite dir. 98 50 2 1502. Both moving in same dir. 15 3 183a. One car parked 65 37 1023b. One car stopped in traffic
12 4 165b. Leaving driveway/alley 11 1 126. All others
Totals 221 102 4 327
5C. PEDESTRIANCRASHES
All PedCrashes
Fatal Crashes Non-Fatal Injury Crashes
TotalAt
Intersection Non-
Junction TotalAt
IntersectionNon-
Junction1. Car go straight 6 4 1 3 2 1 12. Car turning right 3. Car turning left 4. Car backing
1 1 1
5. All othersTotals 7 5 1 4 2 1 1
5D. ALL OTHER CRASHES Total Fatal Injury P.D.O.Coll-isionWith
Coll-isionWith
1. Other rd veh or railway train 4 4 2. Fixed object 11 1 12 3. Other object or animal4. Overturning 6 2 8 5. Other noncollision 1 1 2 6. Other rd veh or railway train 1 1 2 7. Fixed object 24 10 34 8. Other object or animal 2 1 3 9. Overturning 1 3 4 10. Other noncollision 1 1 11. Not statedTotals 4723 70
6. PEDESTRIAN ACTION BY AGE
Ages of Pedstrians Killed and InjuredPedestrians Killed Total 0 to 4 5 to 9 10 to 14 15 to 19 20 to 24 25 to 44 45 to 64 65 & older Not stated
1a. X-ing at intersect or X-walk 1 2 1 4 2 1b. X-ing not at intersection 1 1 2 2 2a. Walking in road with traffic 2b. Same against traffic 3. Standing in roadway 4. Push or work on veh in road 5. Other working in roadway 6. Playing in roadway 7. Other in roadway 8. Not in roadway 1 1 1 9. Not stated
1 2 21 1 7 5 Totals
7. AGE OF DRIVER All Crashes Fatal Injury 1. 14 & younger 2. 15 3. 16 4 1 4. 17 15 7 5. 18 20 9 6. 19 15 3 7. 20 14 8 8. 21 18 1 4 9. 22 to 24 56 20 10. 25 to 34 210 87 11. 35 to 44 267 8 102 12. 45 to 54 276 6 92 13. 55 to 64 163 5 50 14. 65 to 74 88 29 15. 75 & older 46 1 13 16. Not stated 107 1 13 Totals 1,299 22 438 8. SEX OF DRIVER Injury Fatal All Crashes
1. Male 924 15 297 2. Female 339 6 133 3. Not stated 36 1 8 Totals 1,299 22 438
9. RESIDENCE OF DRIVER All Crashes Fatal Injury
1. Local resident 832 11 305 2. In-state resident 204 3 74 3. Non resident 191 7 45 4. Not stated 72 1 14 Totals 1,299 22 438
10. CRASHES BY CONTRIBUTING FACTOR All InjuryFatal1. Speed too fast
49 3 4
17 2
7. Followed too closely 113 1
2 1 1
19 13 30
9
6. Improper overtaking5. Drove left of center4. Disregard traffic signal3. Passed stop sign2. Failed to yield 103 2 30
36 2 83
8. Made improper turn
Totals 758 17 236 56
2 20 1
16
2
2 3 1
143 11
124 9
101
12. Other 11. Mechanical defect10. Improper driving9. Had been drinking
12. ROAD SURFACECONDITION InjuryFatalAll
1. Dry 508 9 1602. Wet 130 3 433. Snowy or icy 18 34. Other 5. Not stated 7Totals 663 12 206
13. LIGHT CONDITION InjuryFatalAll1. Daylight 533 7 1642. Dawn or Dusk 24 1 73. Darkness 106 4 354. Not statedTotals 663 12 206
11. VEHICLE TYPE InjuryFatalAll1. Passenger car 629 7 2262. Pass Car and trailer 8 13. Truck or truck tractor 165 3 474. Truck tractor with semi-trailer 450 10 1455. Other truck combination 30 76. Farm tractor and/or equip. 7. Taxicab8. Bus 19. School bus 110. Motorcycle 4 1 311. Motor scooter or moped 12. Others and not stated 5 1Totals 1,293 21 430Special vehicles included above 13. Log trucks 13 1 414. Emergency (incl. private) 8 115. Military vehicles 16. Other public vehicles 20 3
14. MANNER OF COLLISION InjuryFatalAll
1. Head-on 3 22. Rear end 172 813. Angle 238 4 654. Sideswipe-meeting 11 45. Sideswipe-overtaking 113 1 286. Backed into 37 27. Other 12 1Totals 586 7 181
11. Count of vehicles, including properly parked vehicles.
Totals include participant records where gender was coded as "unknown".
10. Count of crashes. Crashes with multiple contributing circumstances are counted in all applicable categories.
MULTIPLE VEHICLE CRASHES
7 - 9. Tally of drivers by age, sex, residence & crash severity. Excludes occupants of properly & improperly parked vehicles.
117
Col
lisio
n in
volv
ing:
N
on-
coll.
N
on-
coll.
C
ollis
ion
invo
lvin
g:
Non
- co
ll.
Col
lisio
n in
volv
ing:
3C
. RU
RA
L 3A
. Inc
orpo
rate
d A
reas
3B
. UR
BA
N
SUMMARY OF MOTOR VEHICLE TRAFFIC CRASHES 2006 TRUCK CRASHESForIn
1. Primary State Highways 2. Secondary State Highways 3. County and Local Roads 4. City Streets 5. Not Stated Total--Rural Area
NOTE: THIS YEAR TO DATE represents only those crashes entered onto the database as of the date above. SAME PERIOD LAST YEAR represents all crashes including late reports. MAJOR INJURIES are incapacitating injuries. MINOR INJURIES are non-incapacitating evident injuries.
3. LOCATION Total
PropertyDamage
Nonfatal Injury Fatal Property
DamageNonfatal
InjuryFatalTotalPropertyDamage
Nonfatal Injury Fatal Total Killed Injured
Total On Roadway TotalOff Roadway Number Of Crashes Number Of Persons
1. Below 1,000 2. 1,000 to 2,500 3. 2,501 to 5,000 4. 5,001 to 10,000 5. 10,001 to 25,000 6. 25,001 to 50,000 7. 50,001 to 100,000 8. 100,001 to 200,000 9. City of Portland Only Total - Municipalities
3. County and Local Roads 73 2 22 4 1 27 142 57 1 200 164 61 2 227 4. City Streets
5. Not Stated Total--Urban Area 198326 7 1 342761442422302 151 3 456 6. Interstate System 146 57 89 141 54 87 5 3 2 867. Other State Freeways 12 4 8 12 4 8 48. Other State Highways 71 1 29 41 69 29 39 2 2 1 35Total--Urban System 229 1 90 138 222 1 87 134 7 3 4 1 125
6. Interstate System 7. Other State Freeways 8. Other State Highways Total--Rural System
June 1, 2007
PORTLAND
118
At I
nter
sect
ion
Not
at I
nter
sect
ion
At
Inte
r. N
on -I
nter
.
PORTLAND 2006 TRUCK CRASHES
4. AGE OF CASUALTY
Number of Persons Killed Number of Persons Injured Total Killed Pedestrians Pedalcyclist Total Injured Pedestrians Pedalcyclist
Total Total Total Total Total TotalMale Male Male Male Male MaleFemale Female Female Female Female Female1. 0 to 4 1 12. 5 to 9 2 2 43. 10 to 14 1 1 24. 15 to 19 5 3 85. 20 to 24 1 13 11 24 1 1 16. 25 to 34 1 2 1 21 25 46 27. 35 to 44 1 1 22 19 418. 45 to 54 1 1 15 16 31 2 2 9. 55 to 64 8 23 3110. 65 to 74 1 4 511. 75 & older 1 112. Not-stated 1 3 4Totals 3 3 198 108 90 3 2 1 3 3
Directional Analysis - A crash consisting of a series of collisions, overturning, etc., is classified according to the first damage or injury producing event; includes on roadway and off roadway.5A. MULTIPLE VEH CRASH Total Fatal Injury P.D.O.
Junction1. Car go straight 1 1 12. Car turning right 1 1 13. Car turning left4. Car backing 5. All othersTotals 2 2 2
5D. ALL OTHER CRASHES Total Fatal Injury P.D.O.Coll-isionWith
Coll-isionWith
1. Other rd veh or railway train 1 1 2. Fixed object 2 1 3 3. Other object or animal4. Overturning 1 1 5. Other noncollision6. Other rd veh or railway train 1 1 7. Fixed object 8 3 1 12 8. Other object or animal9. Overturning10. Other noncollision 2 2 11. Not statedTotals 127 1 20
6. PEDESTRIAN ACTION BY AGE
Ages of Pedstrians Killed and InjuredPedestrians Killed Total 0 to 4 5 to 9 10 to 14 15 to 19 20 to 24 25 to 44 45 to 64 65 & older Not stated
1a. X-ing at intersect or X-walk 1 1 1b. X-ing not at intersection 2a. Walking in road with traffic 2b. Same against traffic 3. Standing in roadway 4. Push or work on veh in road 5. Other working in roadway 1 1 6. Playing in roadway 7. Other in roadway 8. Not in roadway 1 1 9. Not stated
1 2 3 Totals
7. AGE OF DRIVER All Crashes Fatal Injury 1. 14 & younger 2. 15 3. 16 2 1 4. 17 2 5. 18 4 2 6. 19 5 1 7. 20 5 3 8. 21 12 4 9. 22 to 24 47 1 19 10. 25 to 34 197 75 11. 35 to 44 164 68 12. 45 to 54 189 2 70 13. 55 to 64 126 1 56 14. 65 to 74 34 1 8 15. 75 & older 19 5 16. Not stated 125 22 Totals 931 5 334 8. SEX OF DRIVER Injury Fatal All Crashes
1. Male 671 5 232 2. Female 216 90 3. Not stated 44 12 Totals 931 5 334
9. RESIDENCE OF DRIVER All Crashes Fatal Injury
1. Local resident 551 3 201 2. In-state resident 68 31 3. Non resident 214 2 80 4. Not stated 98 22 Totals 931 5 334
10. CRASHES BY CONTRIBUTING FACTOR All InjuryFatal1. Speed too fast
61 2
8 4
7. Followed too closely 118
1 17
4 19
5
6. Improper overtaking5. Drove left of center4. Disregard traffic signal3. Passed stop sign2. Failed to yield 40 12
18 1 33
8. Made improper turn
Totals 541 5 188 33
1 32 6
11
2 1
113 3
115 9
65
12. Other 11. Mechanical defect10. Improper driving9. Had been drinking
12. ROAD SURFACECONDITION InjuryFatalAll
1. Dry 325 1 1152. Wet 117 2 333. Snowy or icy 5 34. Other 5. Not stated 9Totals 456 3 151
13. LIGHT CONDITION InjuryFatalAll1. Daylight 358 1 1232. Dawn or Dusk 15 33. Darkness 81 2 254. Not stated 2Totals 456 3 151
11. VEHICLE TYPE InjuryFatalAll1. Passenger car 462 2 1702. Pass Car and trailer 4 13. Truck or truck tractor 157 1 654. Truck tractor with semi-trailer 315 2 985. Other truck combination 6 26. Farm tractor and/or equip. 7. Taxicab8. Bus 8 1 29. School bus 110. Motorcycle 11. Motor scooter or moped 12. Others and not stated 3 2Totals 956 6 340Special vehicles included above 13. Log trucks14. Emergency (incl. private) 9 215. Military vehicles 16. Other public vehicles 20 1 5
14. MANNER OF COLLISION InjuryFatalAll
1. Head-on 5 22. Rear end 123 623. Angle 148 384. Sideswipe-meeting 7 55. Sideswipe-overtaking 123 306. Backed into 19 57. Other 9 2Totals 434 2 142
11. Count of vehicles, including properly parked vehicles.
Totals include participant records where gender was coded as "unknown".
10. Count of crashes. Crashes with multiple contributing circumstances are counted in all applicable categories.
MULTIPLE VEHICLE CRASHES
7 - 9. Tally of drivers by age, sex, residence & crash severity. Excludes occupants of properly & improperly parked vehicles.
119
Oregon Cities
with Population 10,000 or more
Crash Summaries
120
121
Col
lisio
n in
volv
ing:
N
on-
coll.
N
on-
coll.
C
ollis
ion
invo
lvin
g:
Non
- co
ll.
Col
lisio
n in
volv
ing:
3C
. RU
RA
L 3A
. Inc
orpo
rate
d A
reas
3B
. UR
BA
N
SUMMARY OF MOTOR VEHICLE TRAFFIC CRASHES 2006 OREGON CRASHESForIn
1. Primary State Highways 2. Secondary State Highways 3. County and Local Roads 4. City Streets 5. Not Stated Total--Rural Area
NOTE: THIS YEAR TO DATE represents only those crashes entered onto the database as of the date above. SAME PERIOD LAST YEAR represents all crashes including late reports. MAJOR INJURIES are incapacitating injuries. MINOR INJURIES are non-incapacitating evident injuries.
3. LOCATION Total
PropertyDamage
Nonfatal Injury Fatal Property
DamageNonfatal
InjuryFatalTotalPropertyDamage
Nonfatal Injury Fatal Total Killed Injured
Total On Roadway TotalOff Roadway Number Of Crashes Number Of Persons
1. Below 1,000 2. 1,000 to 2,500 3. 2,501 to 5,000 4. 5,001 to 10,000 5. 10,001 to 25,000 6. 25,001 to 50,000 7. 50,001 to 100,000 8. 100,001 to 200,000 9. City of Portland Only Total - Municipalities
3 505
505 3
247 255
247 255
2 227 224 453
2 227 224 453
1 20 31 52
1 20 31 52
409 5
409 5
217 2 7 7 14 121 123 1 245 128 130 1 259 1. Primary State Highways 2. Secondary State Highways 3. County and Local Roads
192 3 24 13 1 38 103 104 1 208 127 117 2 246 4. City Streets 5. Not Stated Total--Urban Area 409531 20 1 522242272453255 247 3 505 6. Interstate System 8 8 6 6 2 27. Other State Freeways 8. Other State Highways 251 1 130 120 239 123 115 12 7 5 2 217Total--Urban System 259 1 130 128 245 1 123 121 14 7 7 2 217
6. Interstate System 7. Other State Freeways 8. Other State Highways Total--Rural System
June 1, 2007
ALBANY
122
At I
nter
sect
ion
Not
at I
nter
sect
ion
At
Inte
r. N
on -I
nter
.
ALBANY 2006 OREGON CRASHES
4. AGE OF CASUALTY
Number of Persons Killed Number of Persons Injured Total Killed Pedestrians Pedalcyclist Total Injured Pedestrians Pedalcyclist
Total Total Total Total Total TotalMale Male Male Male Male MaleFemale Female Female Female Female Female1. 0 to 4 2 5 72. 5 to 9 8 12 203. 10 to 14 1 1 1 12 8 20 14. 15 to 19 41 17 58 1 15. 20 to 24 1 3 1 36 18 54 2 2 36. 25 to 34 1 2 36 36 72 17. 35 to 44 3 1 4 1 2 40 25 65 38. 45 to 54 1 3 32 25 57 29. 55 to 64 1 1 1 11 15 26 1 1 110. 65 to 74 2 1 1 1 1 9 6 15 1 1 11. 75 & older 10 3 1312. Not-stated 1 2Totals 5 4 1 409 170 238 8 6 2 15 11 4
Directional Analysis - A crash consisting of a series of collisions, overturning, etc., is classified according to the first damage or injury producing event; includes on roadway and off roadway.5A. MULTIPLE VEH CRASH Total Fatal Injury P.D.O.
5B. MULTIPLE VEH CRASH Total Fatal Injury P.D.O. 4 10 1 151. Moving in opposite dir.
30 15 452. Both moving in same dir. 6 2 83a. One car parked
38 63 1013b. One car stopped in traffic 5 1 64. Enter/Leave parked pos. 6 2 85a. Entering driveway/alley
23 7 305b. Leaving driveway/alley 5 4 96. All others
Totals 117 104 1 222
5C. PEDESTRIANCRASHES
All PedCrashes
Fatal Crashes Non-Fatal Injury Crashes
TotalAt
Intersection Non-
Junction TotalAt
IntersectionNon-
Junction1. Car go straight 2 2 1 12. Car turning right 3 3 33. Car turning left 3 3 34. Car backing5. All othersTotals 8 8 7 1
5D. ALL OTHER CRASHES Total Fatal Injury P.D.O.Coll-isionWith
Coll-isionWith
1. Other rd veh or railway train 10 10 2. Fixed object 3 3 6 3. Other object or animal4. Overturning5. Other noncollision 1 1 6. Other rd veh or railway train 6 6 7. Fixed object 18 10 1 29 8. Other object or animal9. Overturning 10. Other noncollision 11. Not statedTotals 2130 1 52
6. PEDESTRIAN ACTION BY AGE
Ages of Pedstrians Killed and InjuredPedestrians Killed Total 0 to 4 5 to 9 10 to 14 15 to 19 20 to 24 25 to 44 45 to 64 65 & older Not stated
1a. X-ing at intersect or X-walk 2 1 2 1 1 7 1b. X-ing not at intersection 1 1 2a. Walking in road with traffic 2b. Same against traffic 3. Standing in roadway 4. Push or work on veh in road 5. Other working in roadway 6. Playing in roadway 7. Other in roadway 8. Not in roadway 9. Not stated
2 1 311 8 Totals
7. AGE OF DRIVER All Crashes Fatal Injury 1. 14 & younger 2. 15 1 3. 16 18 7 4. 17 31 11 5. 18 43 22 6. 19 35 24 7. 20 34 1 25 8. 21 25 13 9. 22 to 24 65 35 10. 25 to 34 153 2 84 11. 35 to 44 146 83 12. 45 to 54 141 74 13. 55 to 64 102 1 45 14. 65 to 74 62 1 28 15. 75 & older 46 19 16. Not stated 89 18 Totals 991 5 488 8. SEX OF DRIVER Injury Fatal All Crashes
1. Male 498 3 220 2. Female 472 2 258 3. Not stated 21 10 Totals 991 5 488
9. RESIDENCE OF DRIVER All Crashes Fatal Injury
1. Local resident 845 4 423 2. In-state resident 87 42 3. Non resident 17 7 4. Not stated 42 1 16 Totals 991 5 488
10. CRASHES BY CONTRIBUTING FACTOR All InjuryFatal1. Speed too fast
79
3 26 12
7. Followed too closely 138
1 6 49 18
6. Improper overtaking5. Drove left of center4. Disregard traffic signal3. Passed stop sign2. Failed to yield 140 66
30 3 62
8. Made improper turn
Totals 594 8 306 43
3 32 4 8
1 1 1 1
80 5
57 8
31
12. Other 11. Mechanical defect10. Improper driving9. Had been drinking
12. ROAD SURFACECONDITION InjuryFatalAll
1. Dry 385 1 1892. Wet 112 2 573. Snowy or icy 1 14. Other 5. Not stated 7Totals 505 3 247
13. LIGHT CONDITION InjuryFatalAll1. Daylight 399 1 1932. Dawn or Dusk 22 103. Darkness 83 2 444. Not stated 1Totals 505 3 247
11. VEHICLE TYPE InjuryFatalAll1. Passenger car 972 3 4802. Pass Car and trailer 4 23. Truck or truck tractor 14. Truck tractor with semi-trailer 12 35. Other truck combination 6. Farm tractor and/or equip. 7. Taxicab8. Bus 1 19. School bus 3 210. Motorcycle 3 311. Motor scooter or moped 1 112. Others and not stated 10 2 3Totals 1,007 5 495Special vehicles included above 13. Log trucks14. Emergency (incl. private) 2 215. Military vehicles 16. Other public vehicles 5 3
14. MANNER OF COLLISION InjuryFatalAll
1. Head-on 5 1 42. Rear end 185 1 1073. Angle 207 874. Sideswipe-meeting 15. Sideswipe-overtaking 29 106. Backed into 14 17. Other 4Totals 445 2 209
11. Count of vehicles, including properly parked vehicles.
Totals include participant records where gender was coded as "unknown".
10. Count of crashes. Crashes with multiple contributing circumstances are counted in all applicable categories.
MULTIPLE VEHICLE CRASHES
7 - 9. Tally of drivers by age, sex, residence & crash severity. Excludes occupants of properly & improperly parked vehicles.
123
Col
lisio
n in
volv
ing:
N
on-
coll.
N
on-
coll.
C
ollis
ion
invo
lvin
g:
Non
- co
ll.
Col
lisio
n in
volv
ing:
3C
. RU
RA
L 3A
. Inc
orpo
rate
d A
reas
3B
. UR
BA
N
SUMMARY OF MOTOR VEHICLE TRAFFIC CRASHES 2006 OREGON CRASHESForIn
1. Primary State Highways 2. Secondary State Highways 3. County and Local Roads 4. City Streets 5. Not Stated Total--Rural Area
NOTE: THIS YEAR TO DATE represents only those crashes entered onto the database as of the date above. SAME PERIOD LAST YEAR represents all crashes including late reports. MAJOR INJURIES are incapacitating injuries. MINOR INJURIES are non-incapacitating evident injuries.
3. LOCATION Total
PropertyDamage
Nonfatal Injury Fatal Property
DamageNonfatal
InjuryFatalTotalPropertyDamage
Nonfatal Injury Fatal Total Killed Injured
Total On Roadway TotalOff Roadway Number Of Crashes Number Of Persons
1. Below 1,000 2. 1,000 to 2,500 3. 2,501 to 5,000 4. 5,001 to 10,000 5. 10,001 to 25,000 6. 25,001 to 50,000 7. 50,001 to 100,000 8. 100,001 to 200,000 9. City of Portland Only Total - Municipalities
153
153
78 75
78 75
60 60 120
60 60 120
18 15 33
18 15 33
107
107
48 3 4 7 17 22 39 20 26 46 1. Primary State Highways 2. Secondary State Highways 3. County and Local Roads
59 12 14 26 43 38 81 55 52 107 4. City Streets 5. Not Stated Total--Urban Area 10715 18 33606012075 78 153 6. Interstate System 7. Other State Freeways 8. Other State Highways 46 26 20 39 22 17 7 4 3 48Total--Urban System 46 26 20 39 22 17 7 4 3 48
6. Interstate System 7. Other State Freeways 8. Other State Highways Total--Rural System
June 1, 2007
ASHLAND
124
At I
nter
sect
ion
Not
at I
nter
sect
ion
At
Inte
r. N
on -I
nter
.
ASHLAND 2006 OREGON CRASHES
4. AGE OF CASUALTY
Number of Persons Killed Number of Persons Injured Total Killed Pedestrians Pedalcyclist Total Injured Pedestrians Pedalcyclist
Total Total Total Total Total TotalMale Male Male Male Male MaleFemale Female Female Female Female Female1. 0 to 4 1 12. 5 to 9 1 1 1 13. 10 to 14 2 24. 15 to 19 1 1 1 5 6 11 15. 20 to 24 1 4 4 11 15 36. 25 to 34 1 1 1 6 7 13 17. 35 to 44 11 4 158. 45 to 54 1 15 3 18 19. 55 to 64 1 8 7 15 110. 65 to 74 1 4 2 6 111. 75 & older 2 2 4 4 812. Not-stated 1 2 1 1 2 1Totals 107 47 60 5 1 4 11 9 2
Directional Analysis - A crash consisting of a series of collisions, overturning, etc., is classified according to the first damage or injury producing event; includes on roadway and off roadway.5A. MULTIPLE VEH CRASH Total Fatal Injury P.D.O.
Junction1. Car go straight 2 2 1 12. Car turning right 2 2 1 13. Car turning left4. Car backing 1 1 15. All othersTotals 5 5 2 3
5D. ALL OTHER CRASHES Total Fatal Injury P.D.O.Coll-isionWith
Coll-isionWith
1. Other rd veh or railway train 9 9 2. Fixed object 2 3 5 3. Other object or animal4. Overturning 5. Other noncollision6. Other rd veh or railway train 2 2 7. Fixed object 6 7 13 8. Other object or animal9. Overturning 10. Other noncollision 11. Not statedTotals 821 29
6. PEDESTRIAN ACTION BY AGE
Ages of Pedstrians Killed and InjuredPedestrians Killed Total 0 to 4 5 to 9 10 to 14 15 to 19 20 to 24 25 to 44 45 to 64 65 & older Not stated
1a. X-ing at intersect or X-walk 1 1 2 1b. X-ing not at intersection 1 1 2a. Walking in road with traffic 2b. Same against traffic 3. Standing in roadway 4. Push or work on veh in road 5. Other working in roadway 6. Playing in roadway 7. Other in roadway 8. Not in roadway 1 1 2 9. Not stated
2 111 5 Totals
7. AGE OF DRIVER All Crashes Fatal Injury 1. 14 & younger 2. 15 3. 16 7 6 4. 17 7 3 5. 18 6 1 6. 19 9 7 7. 20 6 4 8. 21 9 5 9. 22 to 24 18 7 10. 25 to 34 31 14 11. 35 to 44 31 14 12. 45 to 54 39 23 13. 55 to 64 39 19 14. 65 to 74 19 10 15. 75 & older 21 12 16. Not stated 21 4 Totals 263 129 8. SEX OF DRIVER Injury Fatal All Crashes
1. Male 120 55 2. Female 138 72 3. Not stated 5 2 Totals 263 129
9. RESIDENCE OF DRIVER All Crashes Fatal Injury
1. Local resident 229 116 2. In-state resident 12 5 3. Non resident 14 6 4. Not stated 8 2 Totals 263 129
10. CRASHES BY CONTRIBUTING FACTOR All InjuryFatal1. Speed too fast
16
1 1 3
7. Followed too closely 33 2 2 2 3
6. Improper overtaking5. Drove left of center4. Disregard traffic signal3. Passed stop sign2. Failed to yield 45 24
5 11
8. Made improper turn
Totals 195 100 14
2 22 1
11
30 3
42 4
18
12. Other 11. Mechanical defect10. Improper driving9. Had been drinking
12. ROAD SURFACECONDITION InjuryFatalAll
1. Dry 122 612. Wet 21 143. Snowy or icy 7 24. Other 5. Not stated 3 1Totals 153 78
13. LIGHT CONDITION InjuryFatalAll1. Daylight 121 612. Dawn or Dusk 7 53. Darkness 24 114. Not stated 1 1Totals 153 78
11. VEHICLE TYPE InjuryFatalAll1. Passenger car 270 1292. Pass Car and trailer 3. Truck or truck tractor 4. Truck tractor with semi-trailer 2 15. Other truck combination 6. Farm tractor and/or equip. 7. Taxicab8. Bus 29. School bus10. Motorcycle 4 411. Motor scooter or moped 1 112. Others and not stated 1Totals 280 135Special vehicles included above 13. Log trucks14. Emergency (incl. private) 115. Military vehicles 16. Other public vehicles 1
14. MANNER OF COLLISION InjuryFatalAll
1. Head-on 1 12. Rear end 52 303. Angle 44 194. Sideswipe-meeting 15. Sideswipe-overtaking 12 16. Backed into 6 17. Other 3Totals 119 52
11. Count of vehicles, including properly parked vehicles.
Totals include participant records where gender was coded as "unknown".
10. Count of crashes. Crashes with multiple contributing circumstances are counted in all applicable categories.
MULTIPLE VEHICLE CRASHES
7 - 9. Tally of drivers by age, sex, residence & crash severity. Excludes occupants of properly & improperly parked vehicles.
125
Col
lisio
n in
volv
ing:
N
on-
coll.
N
on-
coll.
C
ollis
ion
invo
lvin
g:
Non
- co
ll.
Col
lisio
n in
volv
ing:
3C
. RU
RA
L 3A
. Inc
orpo
rate
d A
reas
3B
. UR
BA
N
SUMMARY OF MOTOR VEHICLE TRAFFIC CRASHES 2006 OREGON CRASHESForIn
This summary includes reports andinformation available on:
Report published by:
CRASH ANALYSIS AND REPORTING
1B. TYPE OF MOTOR VEHICLE CRASH
Number Of PersonsTotal Killed Total Injured Major Injuries Minor Injuries Possible Injuries No Injury
1. Overturning 2. Other noncollision 3. Pedestrian 1 1 24. MV in transport 21 1 3 17 865. MV on other roadway 6. Parked MV 27. Railway train 8. Pedalcyclist 1 1 19. Animal 310. Fixed object 3 1 2 511. Other object 12. Totals 26 1 5 20 99
2B. MILEAGE RATES ThisYearTo
Date
LastYearSamePeriod
PercentChange
1. Motor vehicle traffic deaths 2. Estimated vehicle miles traveled (in millions)
3. Death rate per 100 million vehicle miles 4. Fatal crash rate per 100 million vehicle miles
5. Crash rate per million vehicle miles 6. Fatal crashes
2A. TYPE OF MOTOR VEHICLE CRASH
Total On Roadway This Year To Date This Year To Date Same Period Last Year Same Period Last Year
All Crashes
Persons Killed
Persons Injured
AllCrashes
AllCrashes
AllCrashes
PersonsKilled
PersonsKilled
PersonsKilled
PersonsInjured
Persons Injured
PersonsInjured
1. Overturning 1 1 1 12. Other noncollision
1 1 1 1 3. Pedestrian 21 49 21 43 21 49 21 43 4. MV in transport
5. MV on other roadway 1 4 2 6. Parked MV
7. Railway train 1 1 1 1 8. Pedalcyclist
1 1 9. Animal 3 6 3 4 10. Fixed object
11. Other object 12.
22 50 23 46 26 60 26 52 Totals
1. Primary State Highways 2. Secondary State Highways 3. County and Local Roads 4. City Streets 5. Not Stated Total--Rural Area
NOTE: THIS YEAR TO DATE represents only those crashes entered onto the database as of the date above. SAME PERIOD LAST YEAR represents all crashes including late reports. MAJOR INJURIES are incapacitating injuries. MINOR INJURIES are non-incapacitating evident injuries.
3. LOCATION Total
PropertyDamage
Nonfatal Injury Fatal Property
DamageNonfatal
InjuryFatalTotalPropertyDamage
Nonfatal Injury Fatal Total Killed Injured
Total On Roadway TotalOff Roadway Number Of Crashes Number Of Persons
1. Below 1,000 2. 1,000 to 2,500 3. 2,501 to 5,000 4. 5,001 to 10,000 5. 10,001 to 25,000 6. 25,001 to 50,000 7. 50,001 to 100,000 8. 100,001 to 200,000 9. City of Portland Only Total - Municipalities
52
52
21 31
21 31
18 28 46
18 28 46
3 3 6
3 3 6
26
26
9 2 2 9 5 14 9 7 16 1. Primary State Highways 2. Secondary State Highways 3. County and Local Roads
17 3 1 4 19 13 32 22 14 36 4. City Streets 5. Not Stated Total--Urban Area 263 3 628184631 21 52 6. Interstate System 1 1 1 17. Other State Freeways 8. Other State Highways 15 7 8 13 5 8 2 2 9Total--Urban System 16 7 9 14 5 9 2 2 9
6. Interstate System 7. Other State Freeways 8. Other State Highways Total--Rural System
June 1, 2007
BAKER CITY
126
At I
nter
sect
ion
Not
at I
nter
sect
ion
At
Inte
r. N
on -I
nter
.
BAKER CITY 2006 OREGON CRASHES
4. AGE OF CASUALTY
Number of Persons Killed Number of Persons Injured Total Killed Pedestrians Pedalcyclist Total Injured Pedestrians Pedalcyclist
Total Total Total Total Total TotalMale Male Male Male Male MaleFemale Female Female Female Female Female1. 0 to 4 2. 5 to 9 1 13. 10 to 14 4. 15 to 19 5 2 75. 20 to 24 2 1 36. 25 to 34 4 47. 35 to 44 4 1 58. 45 to 54 1 1 1 2 2 19. 55 to 64 1 1 210. 65 to 74 1 111. 75 & older 1 112. Not-stated Totals 26 9 17 1 1 1 1
Directional Analysis - A crash consisting of a series of collisions, overturning, etc., is classified according to the first damage or injury producing event; includes on roadway and off roadway.5A. MULTIPLE VEH CRASH Total Fatal Injury P.D.O.
Junction1. Car go straight 1 1 12. Car turning right3. Car turning left 4. Car backing 5. All othersTotals 1 1 1
5D. ALL OTHER CRASHES Total Fatal Injury P.D.O.Coll-isionWith
Coll-isionWith
1. Other rd veh or railway train2. Fixed object 1 1 2 3. Other object or animal4. Overturning 5. Other noncollision6. Other rd veh or railway train 1 1 7. Fixed object 2 2 8. Other object or animal 1 1 9. Overturning10. Other noncollision 11. Not statedTotals 24 6
6. PEDESTRIAN ACTION BY AGE
Ages of Pedstrians Killed and InjuredPedestrians Killed Total 0 to 4 5 to 9 10 to 14 15 to 19 20 to 24 25 to 44 45 to 64 65 & older Not stated
1a. X-ing at intersect or X-walk 1b. X-ing not at intersection 1 1 2a. Walking in road with traffic 2b. Same against traffic 3. Standing in roadway 4. Push or work on veh in road 5. Other working in roadway 6. Playing in roadway 7. Other in roadway 8. Not in roadway 9. Not stated
1 1 Totals
7. AGE OF DRIVER All Crashes Fatal Injury 1. 14 & younger 2. 15 3. 16 4 1 4. 17 7 4 5. 18 4 2 6. 19 1 7. 20 2 1 8. 21 1 1 9. 22 to 24 6 3 10. 25 to 34 13 5 11. 35 to 44 14 7 12. 45 to 54 11 2 13. 55 to 64 12 5 14. 65 to 74 7 1 15. 75 & older 9 3 16. Not stated 4 2 Totals 95 37 8. SEX OF DRIVER Injury Fatal All Crashes
1. Male 44 16 2. Female 49 20 3. Not stated 2 1 Totals 95 37
9. RESIDENCE OF DRIVER All Crashes Fatal Injury
1. Local resident 83 34 2. In-state resident 6 2 3. Non resident 4 0 4. Not stated 2 1 Totals 95 37
10. CRASHES BY CONTRIBUTING FACTOR All InjuryFatal1. Speed too fast
3 1
1
7. Followed too closely 3 1 1 1 5
6. Improper overtaking5. Drove left of center4. Disregard traffic signal3. Passed stop sign2. Failed to yield 26 12
2 7
8. Made improper turn
Totals 58 24
4 1
3
9 1 1
12. Other 11. Mechanical defect10. Improper driving9. Had been drinking
12. ROAD SURFACECONDITION InjuryFatalAll
1. Dry 45 162. Wet 2 23. Snowy or icy 5 34. Other 5. Not statedTotals 52 21
13. LIGHT CONDITION InjuryFatalAll1. Daylight 42 172. Dawn or Dusk 4 13. Darkness 6 34. Not statedTotals 52 21
11. VEHICLE TYPE InjuryFatalAll1. Passenger car 92 362. Pass Car and trailer 3. Truck or truck tractor 4. Truck tractor with semi-trailer 15. Other truck combination 26. Farm tractor and/or equip. 7. Taxicab 8. Bus 9. School bus10. Motorcycle 1 111. Motor scooter or moped 12. Others and not stated 1Totals 97 37Special vehicles included above 13. Log trucks14. Emergency (incl. private) 15. Military vehicles 16. Other public vehicles 1
14. MANNER OF COLLISION InjuryFatalAll
1. Head-on2. Rear end 8 43. Angle 30 114. Sideswipe-meeting 5. Sideswipe-overtaking 26. Backed into 5 17. OtherTotals 45 16
11. Count of vehicles, including properly parked vehicles.
Totals include participant records where gender was coded as "unknown".
10. Count of crashes. Crashes with multiple contributing circumstances are counted in all applicable categories.
MULTIPLE VEHICLE CRASHES
7 - 9. Tally of drivers by age, sex, residence & crash severity. Excludes occupants of properly & improperly parked vehicles.
127
Col
lisio
n in
volv
ing:
N
on-
coll.
N
on-
coll.
C
ollis
ion
invo
lvin
g:
Non
- co
ll.
Col
lisio
n in
volv
ing:
3C
. RU
RA
L 3A
. Inc
orpo
rate
d A
reas
3B
. UR
BA
N
SUMMARY OF MOTOR VEHICLE TRAFFIC CRASHES 2006 OREGON CRASHESForIn
1. Primary State Highways 2. Secondary State Highways 3. County and Local Roads 4. City Streets 5. Not Stated Total--Rural Area
NOTE: THIS YEAR TO DATE represents only those crashes entered onto the database as of the date above. SAME PERIOD LAST YEAR represents all crashes including late reports. MAJOR INJURIES are incapacitating injuries. MINOR INJURIES are non-incapacitating evident injuries.
3. LOCATION Total
PropertyDamage
Nonfatal Injury Fatal Property
DamageNonfatal
InjuryFatalTotalPropertyDamage
Nonfatal Injury Fatal Total Killed Injured
Total On Roadway TotalOff Roadway Number Of Crashes Number Of Persons
1. Below 1,000 2. 1,000 to 2,500 3. 2,501 to 5,000 4. 5,001 to 10,000 5. 10,001 to 25,000 6. 25,001 to 50,000 7. 50,001 to 100,000 8. 100,001 to 200,000 9. City of Portland Only Total - Municipalities
3. County and Local Roads 647 5 53 27 2 82 577 423 2 1,002 630 450 4 1,084 4. City Streets
5. Not Stated Total--Urban Area 1,070681 48 2 13197869531,676 1,059 743 5 1,807 6. Interstate System 7. Other State Freeways 218 88 130 205 81 124 13 7 6 1308. Other State Highways 505 1 205 299 469 191 277 36 14 22 1 293Total--Urban System 723 1 293 429 674 1 272 401 49 21 28 1 423
6. Interstate System 7. Other State Freeways 8. Other State Highways Total--Rural System
June 1, 2007
BEAVERTON
128
At I
nter
sect
ion
Not
at I
nter
sect
ion
At
Inte
r. N
on -I
nter
.
BEAVERTON 2006 OREGON CRASHES
4. AGE OF CASUALTY
Number of Persons Killed Number of Persons Injured Total Killed Pedestrians Pedalcyclist Total Injured Pedestrians Pedalcyclist
Total Total Total Total Total TotalMale Male Male Male Male MaleFemale Female Female Female Female Female1. 0 to 4 4 10 142. 5 to 9 1 1 18 13 313. 10 to 14 14 8 224. 15 to 19 3 1 3 56 24 80 15. 20 to 24 2 4 2 70 59 129 2 2 46. 25 to 34 7 6 5 2 132 116 248 67. 35 to 44 2 2 2 121 91 212 1 1 1 1 28. 45 to 54 1 2 1 102 60 162 29. 55 to 64 2 2 1 1 59 35 94 1 1 1 1 210. 65 to 74 2 1 1 18 18 3611. 75 & older 1 1 10 6 16 2 2 1 1 12. Not-stated 4 14 8 26 4Totals 6 4 2 2 1 1 1 1 1,070 448 618 21 9 12 21 21
Directional Analysis - A crash consisting of a series of collisions, overturning, etc., is classified according to the first damage or injury producing event; includes on roadway and off roadway.5A. MULTIPLE VEH CRASH Total Fatal Injury P.D.O.
Junction1. Car go straight 14 2 1 1 12 3 92. Car turning right 3 3 33. Car turning left 5 5 54. Car backing5. All othersTotals 22 2 1 1 20 11 9
5D. ALL OTHER CRASHES Total Fatal Injury P.D.O.Coll-isionWith
Coll-isionWith
1. Other rd veh or railway train 17 1 18 2. Fixed object 13 5 18 3. Other object or animal4. Overturning 1 1 5. Other noncollision 1 1 2 6. Other rd veh or railway train 4 4 7. Fixed object 49 33 1 83 8. Other object or animal9. Overturning 1 3 4 10. Other noncollision 1 1 2 11. Not statedTotals 6664 2 132
6. PEDESTRIAN ACTION BY AGE
Ages of Pedstrians Killed and InjuredPedestrians Killed Total 0 to 4 5 to 9 10 to 14 15 to 19 20 to 24 25 to 44 45 to 64 65 & older Not stated
1a. X-ing at intersect or X-walk 3 1 6 1 1 12 1 1b. X-ing not at intersection 1 1 3 1 2 1 9 1 2a. Walking in road with traffic 2b. Same against traffic 3. Standing in roadway 4. Push or work on veh in road 5. Other working in roadway 6. Playing in roadway 7. Other in roadway 8. Not in roadway 1 1 2 9. Not stated
4 3 10231 23 2 Totals
7. AGE OF DRIVER All Crashes Fatal Injury 1. 14 & younger 2. 15 2 3. 16 62 23 4. 17 65 33 5. 18 88 30 6. 19 72 30 7. 20 81 1 33 8. 21 81 49 9. 22 to 24 247 114 10. 25 to 34 747 2 344 11. 35 to 44 683 1 318 12. 45 to 54 562 1 271 13. 55 to 64 361 166 14. 65 to 74 128 51 15. 75 & older 104 1 36 16. Not stated 404 50 Totals 3,687 6 1,548 8. SEX OF DRIVER Injury Fatal All Crashes
1. Male 1,870 4 775 2. Female 1,737 2 744 3. Not stated 80 29 Totals 3,687 6 1,548
9. RESIDENCE OF DRIVER All Crashes Fatal Injury
1. Local resident 3,234 6 1,411 2. In-state resident 124 52 3. Non resident 111 39 4. Not stated 218 46 Totals 3,687 6 1,548
10. CRASHES BY CONTRIBUTING FACTOR All InjuryFatal1. Speed too fast
248 1 7
75 9
7. Followed too closely 656 7
12 145
15
6. Improper overtaking5. Drove left of center4. Disregard traffic signal3. Passed stop sign2. Failed to yield 365 4 148
171 1 313
8. Made improper turn
Totals 1,976 7 829 118
4 20 11 17
2
261 10 86 29 77
12. Other 11. Mechanical defect10. Improper driving9. Had been drinking
12. ROAD SURFACECONDITION InjuryFatalAll
1. Dry 1,264 3 5442. Wet 478 2 1933. Snowy or icy 14 34. Other 5. Not stated 51 3Totals 1,807 5 743
13. LIGHT CONDITION InjuryFatalAll1. Daylight 1,276 2 5272. Dawn or Dusk 119 373. Darkness 407 3 1794. Not stated 5Totals 1,807 5 743
11. VEHICLE TYPE InjuryFatalAll1. Passenger car 3,560 6 1,5022. Pass Car and trailer 10 43. Truck or truck tractor 14 34. Truck tractor with semi-trailer 17 75. Other truck combination 16. Farm tractor and/or equip. 7. Taxicab8. Bus 8 69. School bus 6 310. Motorcycle 23 1711. Motor scooter or moped 12. Others and not stated 76 17Totals 3,715 6 1,559Special vehicles included above 13. Log trucks14. Emergency (incl. private) 7 315. Military vehicles 1 116. Other public vehicles 19 9
14. MANNER OF COLLISION InjuryFatalAll
1. Head-on 8 42. Rear end 940 4133. Angle 576 1 2224. Sideswipe-meeting 7 15. Sideswipe-overtaking 90 156. Backed into 29 37. Other 3 1Totals 1,653 1 659
11. Count of vehicles, including properly parked vehicles.
Totals include participant records where gender was coded as "unknown".
10. Count of crashes. Crashes with multiple contributing circumstances are counted in all applicable categories.
MULTIPLE VEHICLE CRASHES
7 - 9. Tally of drivers by age, sex, residence & crash severity. Excludes occupants of properly & improperly parked vehicles.
129
Col
lisio
n in
volv
ing:
N
on-
coll.
N
on-
coll.
C
ollis
ion
invo
lvin
g:
Non
- co
ll.
Col
lisio
n in
volv
ing:
3C
. RU
RA
L 3A
. Inc
orpo
rate
d A
reas
3B
. UR
BA
N
SUMMARY OF MOTOR VEHICLE TRAFFIC CRASHES 2006 OREGON CRASHESForIn
1. Primary State Highways 2. Secondary State Highways 3. County and Local Roads 4. City Streets 5. Not Stated Total--Rural Area
NOTE: THIS YEAR TO DATE represents only those crashes entered onto the database as of the date above. SAME PERIOD LAST YEAR represents all crashes including late reports. MAJOR INJURIES are incapacitating injuries. MINOR INJURIES are non-incapacitating evident injuries.
3. LOCATION Total
PropertyDamage
Nonfatal Injury Fatal Property
DamageNonfatal
InjuryFatalTotalPropertyDamage
Nonfatal Injury Fatal Total Killed Injured
Total On Roadway TotalOff Roadway Number Of Crashes Number Of Persons
1. Below 1,000 2. 1,000 to 2,500 3. 2,501 to 5,000 4. 5,001 to 10,000 5. 10,001 to 25,000 6. 25,001 to 50,000 7. 50,001 to 100,000 8. 100,001 to 200,000 9. City of Portland Only Total - Municipalities
7 841
841 7
359 475
359 475
4 318 416 738
4 318 416 738
3 41 59 103
3 41 59 103
516 8
516 8
194 4 7 11 18 95 110 3 208 102 121 3 226 1. Primary State Highways 2. Secondary State Highways 3. County and Local Roads
322 4 52 30 3 85 321 208 1 530 373 238 4 615 4. City Streets 5. Not Stated Total--Urban Area 516859 41 3 1034163184738475 359 7 841 6. Interstate System 7. Other State Freeways 8. Other State Highways 226 3 121 102 208 110 95 18 11 7 4 194Total--Urban System 226 3 121 102 208 3 110 95 18 11 7 4 194
6. Interstate System 7. Other State Freeways 8. Other State Highways Total--Rural System
June 1, 2007
BEND
130
At I
nter
sect
ion
Not
at I
nter
sect
ion
At
Inte
r. N
on -I
nter
.
BEND 2006 OREGON CRASHES
4. AGE OF CASUALTY
Number of Persons Killed Number of Persons Injured Total Killed Pedestrians Pedalcyclist Total Injured Pedestrians Pedalcyclist
Total Total Total Total Total TotalMale Male Male Male Male MaleFemale Female Female Female Female Female1. 0 to 4 5 1 62. 5 to 9 1 7 2 9 13. 10 to 14 1 2 1 8 5 13 24. 15 to 19 1 1 3 1 56 28 84 25. 20 to 24 4 19 29 48 2 2 46. 25 to 34 3 8 55 50 105 1 1 1 1 57. 35 to 44 1 1 1 46 36 82 2 2 18. 45 to 54 1 2 4 1 45 24 69 29. 55 to 64 1 1 1 36 18 54 2 2 110. 65 to 74 1 15 8 23 111. 75 & older 1 7 11 18 1 1 112. Not-stated 4 1 5Totals 8 7 1 1 1 516 213 303 5 3 2 26 20 6
Directional Analysis - A crash consisting of a series of collisions, overturning, etc., is classified according to the first damage or injury producing event; includes on roadway and off roadway.5A. MULTIPLE VEH CRASH Total Fatal Injury P.D.O.
26 8 345b. Leaving driveway/alley 10 10 206. All others
Totals 198 121 1 320
5C. PEDESTRIANCRASHES
All PedCrashes
Fatal Crashes Non-Fatal Injury Crashes
TotalAt
Intersection Non-
Junction TotalAt
IntersectionNon-
Junction1. Car go straight 4 4 1 32. Car turning right 2 1 1 1 13. Car turning left4. Car backing 5. All othersTotals 6 1 1 5 1 4
5D. ALL OTHER CRASHES Total Fatal Injury P.D.O.Coll-isionWith
Coll-isionWith
1. Other rd veh or railway train 18 18 2. Fixed object 7 7 14 3. Other object or animal4. Overturning 3 1 4 5. Other noncollision6. Other rd veh or railway train 8 8 7. Fixed object 42 22 2 66 8. Other object or animal 1 1 9. Overturning 1 3 4 10. Other noncollision 1 1 11. Not statedTotals 5459 3 116
6. PEDESTRIAN ACTION BY AGE
Ages of Pedstrians Killed and InjuredPedestrians Killed Total 0 to 4 5 to 9 10 to 14 15 to 19 20 to 24 25 to 44 45 to 64 65 & older Not stated
1a. X-ing at intersect or X-walk 1 1 1b. X-ing not at intersection 2 1 3 2a. Walking in road with traffic 2b. Same against traffic 3. Standing in roadway 4. Push or work on veh in road 5. Other working in roadway 6. Playing in roadway 7. Other in roadway 8. Not in roadway 2 2 1 9. Not stated
2 211 6 1 Totals
7. AGE OF DRIVER All Crashes Fatal Injury 1. 14 & YOUNGER 1 1 2. 15 4 1 3. 16 38 19 4. 17 56 34 5. 18 59 30 6. 19 57 34 7. 20 47 25 8. 21 34 1 13 9. 22 to 24 99 1 42 10. 25 to 34 276 4 120 11. 35 to 44 250 1 117 12. 45 to 54 253 1 116 13. 55 to 64 188 2 82 14. 65 to 74 75 28 15. 75 & older 58 1 22 16. Not stated 121 10 Totals 1,616 11 694 8. SEX OF DRIVER Injury Fatal All Crashes
1. Male 873 8 353 2. Female 719 3 337 3. Not stated 24 4 Totals 1,616 11 694
9. RESIDENCE OF DRIVER All Crashes Fatal Injury
1. Local resident 1,372 7 604 2. In-state resident 129 1 62 3. Non resident 52 3 21 4. Not stated 63 7 Totals 1,616 11 694
10. CRASHES BY CONTRIBUTING FACTOR All InjuryFatal1. Speed too fast
96 2 1
26 16
7. Followed too closely 222
1
1
9 10 46 39
6. Improper overtaking5. Drove left of center4. Disregard traffic signal3. Passed stop sign2. Failed to yield 219 106
56 4 164
8. Made improper turn
Totals 1,012 12 421 60
32 10 16
1
2 3
124 1
102 32 44
12. Other 11. Mechanical defect10. Improper driving9. Had been drinking
12. ROAD SURFACECONDITION InjuryFatalAll
1. Dry 619 6 2722. Wet 90 533. Snowy or icy 125 1 344. Other 5. Not stated 7Totals 841 7 359
13. LIGHT CONDITION InjuryFatalAll1. Daylight 668 5 2872. Dawn or Dusk 26 1 113. Darkness 146 1 604. Not stated 1 1Totals 841 7 359
11. VEHICLE TYPE InjuryFatalAll1. Passenger car 1,574 7 6722. Pass Car and trailer 11 63. Truck or truck tractor 34. Truck tractor with semi-trailer 22 2 75. Other truck combination 2 16. Farm tractor and/or equip. 7. Taxicab 1 18. Bus 2 19. School bus 510. Motorcycle 16 2 1211. Motor scooter or moped 12. Others and not stated 3 1Totals 1,639 11 701Special vehicles included above 13. Log trucks14. Emergency (incl. private) 3 115. Military vehicles 16. Other public vehicles 11 1
14. MANNER OF COLLISION InjuryFatalAll
1. Head-on 12 1 42. Rear end 318 1 1443. Angle 311 1 1324. Sideswipe-meeting 16 15. Sideswipe-overtaking 32 96. Backed into 29 57. Other 1Totals 719 3 295
11. Count of vehicles, including properly parked vehicles.
Totals include participant records where gender was coded as "unknown".
10. Count of crashes. Crashes with multiple contributing circumstances are counted in all applicable categories.
MULTIPLE VEHICLE CRASHES
7 - 9. Tally of drivers by age, sex, residence & crash severity. Excludes occupants of properly & improperly parked vehicles.
131
Col
lisio
n in
volv
ing:
N
on-
coll.
N
on-
coll.
C
ollis
ion
invo
lvin
g:
Non
- co
ll.
Col
lisio
n in
volv
ing:
3C
. RU
RA
L 3A
. Inc
orpo
rate
d A
reas
3B
. UR
BA
N
SUMMARY OF MOTOR VEHICLE TRAFFIC CRASHES 2006 OREGON CRASHESForIn
This summary includes reports andinformation available on:
Report published by:
CRASH ANALYSIS AND REPORTING
1B. TYPE OF MOTOR VEHICLE CRASH
Number Of PersonsTotal Killed Total Injured Major Injuries Minor Injuries Possible Injuries No Injury
1. Overturning 2. Other noncollision 3. Pedestrian 2 2 24. MV in transport 43 11 32 2055. MV on other roadway 6. Parked MV 17. Railway train 8. Pedalcyclist 4 2 2 69. Animal 10. Fixed object 211. Other object 12. Totals 49 15 34 216
2B. MILEAGE RATES ThisYearTo
Date
LastYearSamePeriod
PercentChange
1. Motor vehicle traffic deaths 2. Estimated vehicle miles traveled (in millions)
3. Death rate per 100 million vehicle miles 4. Fatal crash rate per 100 million vehicle miles
5. Crash rate per million vehicle miles 6. Fatal crashes
-100%
-100%
1
1
2A. TYPE OF MOTOR VEHICLE CRASH
Total On Roadway This Year To Date This Year To Date Same Period Last Year Same Period Last Year
All Crashes
Persons Killed
Persons Injured
AllCrashes
AllCrashes
AllCrashes
PersonsKilled
PersonsKilled
PersonsKilled
PersonsInjured
Persons Injured
PersonsInjured
1. Overturning 1 12. Other noncollision
2 2 2 2 3. Pedestrian 42 73 42 88 42 73 43 89 4. MV in transport
5. MV on other roadway 1 1 1 1 1 1 6. Parked MV
7. Railway train 3 5 4 4 3 5 4 4 8. Pedalcyclist
9. Animal 1 1 6 1 7 2 10. Fixed object
11. Other object 12.
47 81 48 95 52 1 87 49 98 Totals
1. Primary State Highways 2. Secondary State Highways 3. County and Local Roads 4. City Streets 5. Not Stated Total--Rural Area
NOTE: THIS YEAR TO DATE represents only those crashes entered onto the database as of the date above. SAME PERIOD LAST YEAR represents all crashes including late reports. MAJOR INJURIES are incapacitating injuries. MINOR INJURIES are non-incapacitating evident injuries.
3. LOCATION Total
PropertyDamage
Nonfatal Injury Fatal Property
DamageNonfatal
InjuryFatalTotalPropertyDamage
Nonfatal Injury Fatal Total Killed Injured
Total On Roadway TotalOff Roadway Number Of Crashes Number Of Persons
1. Below 1,000 2. 1,000 to 2,500 3. 2,501 to 5,000 4. 5,001 to 10,000 5. 10,001 to 25,000 6. 25,001 to 50,000 7. 50,001 to 100,000 8. 100,001 to 200,000 9. City of Portland Only Total - Municipalities
98
98
39 59
39 59
38 57 95
38 57 95
1 2 3
1 2 3
49
49
20 1 1 24 17 41 25 17 42 1. Primary State Highways 2. Secondary State Highways 3. County and Local Roads
29 1 1 2 33 21 54 34 22 56 4. City Streets 5. Not Stated Total--Urban Area 492 1 357389559 39 98 6. Interstate System 7. Other State Freeways 8. Other State Highways 42 17 25 41 17 24 1 1 20Total--Urban System 42 17 25 41 17 24 1 1 20
6. Interstate System 7. Other State Freeways 8. Other State Highways Total--Rural System
June 1, 2007
CANBY
132
At I
nter
sect
ion
Not
at I
nter
sect
ion
At
Inte
r. N
on -I
nter
.
CANBY 2006 OREGON CRASHES
4. AGE OF CASUALTY
Number of Persons Killed Number of Persons Injured Total Killed Pedestrians Pedalcyclist Total Injured Pedestrians Pedalcyclist
Total Total Total Total Total TotalMale Male Male Male Male MaleFemale Female Female Female Female Female1. 0 to 4 2. 5 to 9 1 13. 10 to 14 1 1 1 14. 15 to 19 1 1 6 65. 20 to 24 1 1 1 1 26. 25 to 34 1 4 6 10 17. 35 to 44 1 1 6 7 138. 45 to 54 1 5 4 9 19. 55 to 64 3 2 510. 65 to 74 1 111. 75 & older 1 112. Not-stated Totals 49 22 27 2 1 1 4 3 1
Directional Analysis - A crash consisting of a series of collisions, overturning, etc., is classified according to the first damage or injury producing event; includes on roadway and off roadway.5A. MULTIPLE VEH CRASH Total Fatal Injury P.D.O.
1. Entering at angle 10 10 20 2a. Same dir.- both straight 2b. Same-1 turn, 1 straight 2c. Same-one stopped 3 3 2d. Same-all others 1 1 3a. Opposite dir.- both straight 3b. Opposite-1 turn, 1 straight 3 2 5 3c. Opposite-all others 4. Not stated Totals 17 12 29
5B. MULTIPLE VEH CRASH Total Fatal Injury P.D.O. 1 11. Moving in opposite dir. 4 1 52. Both moving in same dir. 1 13a. One car parked
25 17 423b. One car stopped in traffic 4. Enter/Leave parked pos. 5a. Entering driveway/alley
2 1 35b. Leaving driveway/alley 7 2 96. All others
Totals 40 21 61
5C. PEDESTRIANCRASHES
All PedCrashes
Fatal Crashes Non-Fatal Injury Crashes
TotalAt
Intersection Non-
Junction TotalAt
IntersectionNon-
Junction1. Car go straight 2 2 22. Car turning right3. Car turning left 4. Car backing 5. All othersTotals 2 2 2
5D. ALL OTHER CRASHES Total Fatal Injury P.D.O.Coll-isionWith
Coll-isionWith
1. Other rd veh or railway train 2 2 2. Fixed object3. Other object or animal 4. Overturning 5. Other noncollision6. Other rd veh or railway train 2 2 7. Fixed object 2 2 8. Other object or animal9. Overturning 10. Other noncollision 11. Not statedTotals 24 6
6. PEDESTRIAN ACTION BY AGE
Ages of Pedstrians Killed and InjuredPedestrians Killed Total 0 to 4 5 to 9 10 to 14 15 to 19 20 to 24 25 to 44 45 to 64 65 & older Not stated
1a. X-ing at intersect or X-walk 1 1 2 1b. X-ing not at intersection 2a. Walking in road with traffic 2b. Same against traffic 3. Standing in roadway 4. Push or work on veh in road 5. Other working in roadway 6. Playing in roadway 7. Other in roadway 8. Not in roadway 9. Not stated
11 2 Totals
7. AGE OF DRIVER All Crashes Fatal Injury 1. 14 & younger 2. 15 3. 16 7 4 4. 17 10 6 5. 18 3 1 6. 19 4 3 7. 20 3 1 8. 21 2 2 9. 22 to 24 8 3 10. 25 to 34 26 12 11. 35 to 44 32 14 12. 45 to 54 29 11 13. 55 to 64 28 13 14. 65 to 74 10 2 15. 75 & older 8 1 16. Not stated 23 2 Totals 193 75 8. SEX OF DRIVER Injury Fatal All Crashes
1. Male 106 39 2. Female 82 35 3. Not stated 5 1 Totals 193 75
9. RESIDENCE OF DRIVER All Crashes Fatal Injury
1. Local resident 176 71 2. In-state resident 3 0 3. Non resident 3 1 4. Not stated 11 3 Totals 193 75
10. CRASHES BY CONTRIBUTING FACTOR All InjuryFatal1. Speed too fast
16
5 2
7. Followed too closely 36
7 3
6. Improper overtaking5. Drove left of center4. Disregard traffic signal3. Passed stop sign2. Failed to yield 36 14
2 7
8. Made improper turn
Totals 103 43 1
1
2
3
5
6
12. Other 11. Mechanical defect10. Improper driving9. Had been drinking
12. ROAD SURFACECONDITION InjuryFatalAll
1. Dry 80 332. Wet 17 63. Snowy or icy 14. Other 5. Not statedTotals 98 39
13. LIGHT CONDITION InjuryFatalAll1. Daylight 80 302. Dawn or Dusk 1 13. Darkness 17 84. Not statedTotals 98 39
11. VEHICLE TYPE InjuryFatalAll1. Passenger car 193 752. Pass Car and trailer 3. Truck or truck tractor 4. Truck tractor with semi-trailer 5. Other truck combination 6. Farm tractor and/or equip. 7. Taxicab 8. Bus 9. School bus 10. Motorcycle 11. Motor scooter or moped 12. Others and not stated 1Totals 194 75Special vehicles included above 13. Log trucks14. Emergency (incl. private) 15. Military vehicles 16. Other public vehicles
1. Primary State Highways 2. Secondary State Highways 3. County and Local Roads 4. City Streets 5. Not Stated Total--Rural Area
NOTE: THIS YEAR TO DATE represents only those crashes entered onto the database as of the date above. SAME PERIOD LAST YEAR represents all crashes including late reports. MAJOR INJURIES are incapacitating injuries. MINOR INJURIES are non-incapacitating evident injuries.
3. LOCATION Total
PropertyDamage
Nonfatal Injury Fatal Property
DamageNonfatal
InjuryFatalTotalPropertyDamage
Nonfatal Injury Fatal Total Killed Injured
Total On Roadway TotalOff Roadway Number Of Crashes Number Of Persons
1. Below 1,000 2. 1,000 to 2,500 3. 2,501 to 5,000 4. 5,001 to 10,000 5. 10,001 to 25,000 6. 25,001 to 50,000 7. 50,001 to 100,000 8. 100,001 to 200,000 9. City of Portland Only Total - Municipalities
2 101
101 2
48 51
48 51
1 45 45 91
1 45 45 91
1 3 6 10
1 3 6 10
75 2
75 2
5 1 1 2 2 3 3 1. Primary State Highways 2. Secondary State Highways 3. County and Local Roads
70 2 6 2 1 9 45 43 1 89 51 45 2 98 4. City Streets 5. Not Stated Total--Urban Area 7526 3 1 10454519151 48 2 101 6. Interstate System 3 3 2 2 1 1 57. Other State Freeways 8. Other State Highways Total--Urban System 3 3 2 2 1 1 5
6. Interstate System 7. Other State Freeways 8. Other State Highways Total--Rural System
June 1, 2007
CENTRAL POINT
134
At I
nter
sect
ion
Not
at I
nter
sect
ion
At
Inte
r. N
on -I
nter
.
CENTRAL POINT 2006 OREGON CRASHES
4. AGE OF CASUALTY
Number of Persons Killed Number of Persons Injured Total Killed Pedestrians Pedalcyclist Total Injured Pedestrians Pedalcyclist
Total Total Total Total Total TotalMale Male Male Male Male MaleFemale Female Female Female Female Female1. 0 to 4 1 1 1 1 1 1 2. 5 to 9 1 1 1 1 23. 10 to 14 1 1 3 2 54. 15 to 19 6 8 145. 20 to 24 2 2 46. 25 to 34 3 4 77. 35 to 44 1 1 11 6 17 1 1 8. 45 to 54 9 2 119. 55 to 64 2 2 410. 65 to 74 3 2 511. 75 & older 3 2 512. Not-stated Totals 2 1 1 1 1 75 32 43 2 2 1 1
Directional Analysis - A crash consisting of a series of collisions, overturning, etc., is classified according to the first damage or injury producing event; includes on roadway and off roadway.5A. MULTIPLE VEH CRASH Total Fatal Injury P.D.O.
5B. MULTIPLE VEH CRASH Total Fatal Injury P.D.O. 1 11. Moving in opposite dir.
1 5 62. Both moving in same dir. 1 1 23a. One car parked 9 4 133b. One car stopped in traffic 1 14. Enter/Leave parked pos. 2 1 35a. Entering driveway/alley 4 45b. Leaving driveway/alley 4 3 76. All others
Totals 22 15 37
5C. PEDESTRIANCRASHES
All PedCrashes
Fatal Crashes Non-Fatal Injury Crashes
TotalAt
Intersection Non-
Junction TotalAt
IntersectionNon-
Junction1. Car go straight 2 1 1 1 12. Car turning right3. Car turning left 1 1 14. Car backing5. All othersTotals 3 1 1 2 2
5D. ALL OTHER CRASHES Total Fatal Injury P.D.O.Coll-isionWith
Coll-isionWith
1. Other rd veh or railway train 1 1 2. Fixed object 3 3 3. Other object or animal4. Overturning 5. Other noncollision 6. Other rd veh or railway train7. Fixed object 1 2 3 8. Other object or animal9. Overturning 1 1 10. Other noncollision 1 1 11. Not statedTotals 44 1 9
6. PEDESTRIAN ACTION BY AGE
Ages of Pedstrians Killed and InjuredPedestrians Killed Total 0 to 4 5 to 9 10 to 14 15 to 19 20 to 24 25 to 44 45 to 64 65 & older Not stated
1a. X-ing at intersect or X-walk 1 1 2 1b. X-ing not at intersection 2a. Walking in road with traffic 2b. Same against traffic 3. Standing in roadway 4. Push or work on veh in road 5. Other working in roadway 6. Playing in roadway 1 1 1 7. Other in roadway 8. Not in roadway 9. Not stated
11 1 3 1 Totals
7. AGE OF DRIVER All Crashes Fatal Injury 1. 14 & YOUNGER 1 1 2. 15 3. 16 7 2 4. 17 8 3 5. 18 9 5 6. 19 4 1 7. 20 4 3 8. 21 5 1 9. 22 to 24 8 3 10. 25 to 34 20 10 11. 35 to 44 40 1 24 12. 45 to 54 26 1 16 13. 55 to 64 20 7 14. 65 to 74 13 5 15. 75 & older 12 8 16. Not stated 11 1 Totals 188 2 90 8. SEX OF DRIVER Injury Fatal All Crashes
1. Male 103 2 45 2. Female 84 44 3. Not stated 1 1 Totals 188 2 90
9. RESIDENCE OF DRIVER All Crashes Fatal Injury
1. Local resident 169 2 84 2. In-state resident 8 3 3. Non resident 5 2 4. Not stated 6 1 Totals 188 2 90
10. CRASHES BY CONTRIBUTING FACTOR All InjuryFatal1. Speed too fast
6 2
4 3
7. Followed too closely 16 4
7 5
6. Improper overtaking5. Drove left of center4. Disregard traffic signal3. Passed stop sign2. Failed to yield 40 20
3 6
8. Made improper turn
Totals 125 1 62 9 1 9 1 4
1
17 1
20 2 7
12. Other 11. Mechanical defect10. Improper driving9. Had been drinking
12. ROAD SURFACECONDITION InjuryFatalAll
1. Dry 81 1 432. Wet 17 1 53. Snowy or icy 14. Other 5. Not stated 2Totals 101 2 48
13. LIGHT CONDITION InjuryFatalAll1. Daylight 82 2 382. Dawn or Dusk 6 33. Darkness 13 74. Not statedTotals 101 2 48
11. VEHICLE TYPE InjuryFatalAll1. Passenger car 182 1 842. Pass Car and trailer 3. Truck or truck tractor 4. Truck tractor with semi-trailer 6 55. Other truck combination 6. Farm tractor and/or equip. 7. Taxicab 8. Bus9. School bus 110. Motorcycle 3 1 211. Motor scooter or moped 1 112. Others and not stated 1Totals 194 2 92Special vehicles included above 13. Log trucks14. Emergency (incl. private) 15. Military vehicles 16. Other public vehicles 2
14. MANNER OF COLLISION InjuryFatalAll
1. Head-on2. Rear end 28 143. Angle 52 274. Sideswipe-meeting 5. Sideswipe-overtaking 3 16. Backed into 47. Other 2Totals 89 42
11. Count of vehicles, including properly parked vehicles.
Totals include participant records where gender was coded as "unknown".
10. Count of crashes. Crashes with multiple contributing circumstances are counted in all applicable categories.
MULTIPLE VEHICLE CRASHES
7 - 9. Tally of drivers by age, sex, residence & crash severity. Excludes occupants of properly & improperly parked vehicles.
135
Col
lisio
n in
volv
ing:
N
on-
coll.
N
on-
coll.
C
ollis
ion
invo
lvin
g:
Non
- co
ll.
Col
lisio
n in
volv
ing:
3C
. RU
RA
L 3A
. Inc
orpo
rate
d A
reas
3B
. UR
BA
N
SUMMARY OF MOTOR VEHICLE TRAFFIC CRASHES 2006 OREGON CRASHESForIn
1. Primary State Highways 2. Secondary State Highways 3. County and Local Roads 4. City Streets 5. Not Stated Total--Rural Area
NOTE: THIS YEAR TO DATE represents only those crashes entered onto the database as of the date above. SAME PERIOD LAST YEAR represents all crashes including late reports. MAJOR INJURIES are incapacitating injuries. MINOR INJURIES are non-incapacitating evident injuries.
3. LOCATION Total
PropertyDamage
Nonfatal Injury Fatal Property
DamageNonfatal
InjuryFatalTotalPropertyDamage
Nonfatal Injury Fatal Total Killed Injured
Total On Roadway TotalOff Roadway Number Of Crashes Number Of Persons
1. Below 1,000 2. 1,000 to 2,500 3. 2,501 to 5,000 4. 5,001 to 10,000 5. 10,001 to 25,000 6. 25,001 to 50,000 7. 50,001 to 100,000 8. 100,001 to 200,000 9. City of Portland Only Total - Municipalities
193
193
65 128
65 128
58 114 172
58 114 172
7 14 21
7 14 21
87
87
26 2 1 3 24 19 43 26 20 46 1. Primary State Highways 2. Secondary State Highways 3. County and Local Roads
61 12 6 18 90 39 129 102 45 147 4. City Streets 5. Not Stated Total--Urban Area 8714 7 2111458172128 65 193 6. Interstate System 7. Other State Freeways 8. Other State Highways 46 20 26 43 19 24 3 1 2 26Total--Urban System 46 20 26 43 19 24 3 1 2 26
6. Interstate System 7. Other State Freeways 8. Other State Highways Total--Rural System
June 1, 2007
COOS BAY
136
At I
nter
sect
ion
Not
at I
nter
sect
ion
At
Inte
r. N
on -I
nter
.
COOS BAY 2006 OREGON CRASHES
4. AGE OF CASUALTY
Number of Persons Killed Number of Persons Injured Total Killed Pedestrians Pedalcyclist Total Injured Pedestrians Pedalcyclist
Total Total Total Total Total TotalMale Male Male Male Male MaleFemale Female Female Female Female Female1. 0 to 4 2. 5 to 9 1 13. 10 to 14 1 1 1 14. 15 to 19 1 5 2 7 15. 20 to 24 5 3 86. 25 to 34 8 4 127. 35 to 44 15 5 208. 45 to 54 4 9 139. 55 to 64 1 1 5 4 910. 65 to 74 6 3 911. 75 & older 3 2 512. Not-stated 2 2 2 2Totals 87 36 51 4 4 1 1
Directional Analysis - A crash consisting of a series of collisions, overturning, etc., is classified according to the first damage or injury producing event; includes on roadway and off roadway.5A. MULTIPLE VEH CRASH Total Fatal Injury P.D.O.
Junction1. Car go straight 2 2 22. Car turning right3. Car turning left 1 1 14. Car backing5. All othersTotals 3 3 1 2
5D. ALL OTHER CRASHES Total Fatal Injury P.D.O.Coll-isionWith
Coll-isionWith
1. Other rd veh or railway train 1 1 2. Fixed object 2 2 3. Other object or animal4. Overturning 5. Other noncollision 6. Other rd veh or railway train7. Fixed object 6 4 10 8. Other object or animal 1 1 2 9. Overturning10. Other noncollision 11. Not statedTotals 96 15
6. PEDESTRIAN ACTION BY AGE
Ages of Pedstrians Killed and InjuredPedestrians Killed Total 0 to 4 5 to 9 10 to 14 15 to 19 20 to 24 25 to 44 45 to 64 65 & older Not stated
1a. X-ing at intersect or X-walk 1 1 1b. X-ing not at intersection 1 1 1 3 2a. Walking in road with traffic 2b. Same against traffic 3. Standing in roadway 4. Push or work on veh in road 5. Other working in roadway 6. Playing in roadway 7. Other in roadway 8. Not in roadway 9. Not stated
2 1 1 4 Totals
7. AGE OF DRIVER All Crashes Fatal Injury 1. 14 & younger 2. 15 3. 16 6 1 4. 17 13 6 5. 18 12 4 6. 19 7 2 7. 20 13 1 8. 21 7 5 9. 22 to 24 19 4 10. 25 to 34 60 17 11. 35 to 44 54 24 12. 45 to 54 59 19 13. 55 to 64 43 17 14. 65 to 74 37 13 15. 75 & older 20 9 16. Not stated 23 3 Totals 373 125 8. SEX OF DRIVER Injury Fatal All Crashes
1. Male 177 57 2. Female 194 66 3. Not stated 2 2 Totals 373 125
9. RESIDENCE OF DRIVER All Crashes Fatal Injury
1. Local resident 332 111 2. In-state resident 23 8 3. Non resident 12 3 4. Not stated 6 3 Totals 373 125
10. CRASHES BY CONTRIBUTING FACTOR All InjuryFatal1. Speed too fast
8
1 1 1
7. Followed too closely 17 7 4 8 3
6. Improper overtaking5. Drove left of center4. Disregard traffic signal3. Passed stop sign2. Failed to yield 81 29
13 32
8. Made improper turn
Totals 213 71 6 2 6 2 2
21 2
28 2 8
12. Other 11. Mechanical defect10. Improper driving9. Had been drinking
12. ROAD SURFACECONDITION InjuryFatalAll
1. Dry 145 512. Wet 48 143. Snowy or icy4. Other 5. Not statedTotals 193 65
13. LIGHT CONDITION InjuryFatalAll1. Daylight 162 522. Dawn or Dusk 8 53. Darkness 23 84. Not statedTotals 193 65
11. VEHICLE TYPE InjuryFatalAll1. Passenger car 367 1222. Pass Car and trailer 5 13. Truck or truck tractor 4. Truck tractor with semi-trailer 15. Other truck combination 6. Farm tractor and/or equip. 7. Taxicab 1 18. Bus9. School bus 110. Motorcycle 1 111. Motor scooter or moped 12. Others and not stated 5 2Totals 381 127Special vehicles included above 13. Log trucks14. Emergency (incl. private) 15. Military vehicles 16. Other public vehicles 1 1
14. MANNER OF COLLISION InjuryFatalAll
1. Head-on 2 12. Rear end 65 253. Angle 89 294. Sideswipe-meeting 25. Sideswipe-overtaking 9 16. Backed into 67. Other 2Totals 175 56
11. Count of vehicles, including properly parked vehicles.
Totals include participant records where gender was coded as "unknown".
10. Count of crashes. Crashes with multiple contributing circumstances are counted in all applicable categories.
MULTIPLE VEHICLE CRASHES
7 - 9. Tally of drivers by age, sex, residence & crash severity. Excludes occupants of properly & improperly parked vehicles.
137
Col
lisio
n in
volv
ing:
N
on-
coll.
N
on-
coll.
C
ollis
ion
invo
lvin
g:
Non
- co
ll.
Col
lisio
n in
volv
ing:
3C
. RU
RA
L 3A
. Inc
orpo
rate
d A
reas
3B
. UR
BA
N
SUMMARY OF MOTOR VEHICLE TRAFFIC CRASHES 2006 OREGON CRASHESForIn
This summary includes reports andinformation available on:
Report published by:
CRASH ANALYSIS AND REPORTING
1B. TYPE OF MOTOR VEHICLE CRASH
Number Of PersonsTotal Killed Total Injured Major Injuries Minor Injuries Possible Injuries No Injury
1. Overturning 2. Other noncollision 1 13. Pedestrian 4. MV in transport 39 1 8 30 1665. MV on other roadway 6. Parked MV 57. Railway train 8. Pedalcyclist 9. Animal 10. Fixed object 111. Other object 1 112. Totals 41 1 9 31 172
2B. MILEAGE RATES ThisYearTo
Date
LastYearSamePeriod
PercentChange
1. Motor vehicle traffic deaths 2. Estimated vehicle miles traveled (in millions)
3. Death rate per 100 million vehicle miles 4. Fatal crash rate per 100 million vehicle miles
5. Crash rate per million vehicle miles 6. Fatal crashes
2A. TYPE OF MOTOR VEHICLE CRASH
Total On Roadway This Year To Date This Year To Date Same Period Last Year Same Period Last Year
All Crashes
Persons Killed
Persons Injured
AllCrashes
AllCrashes
AllCrashes
PersonsKilled
PersonsKilled
PersonsKilled
PersonsInjured
Persons Injured
PersonsInjured
1. Overturning 1 1 1 1 2. Other noncollision
1 1 1 13. Pedestrian 41 59 39 70 41 59 39 70 4. MV in transport
5. MV on other roadway 2 4 4 6. Parked MV
7. Railway train 8. Pedalcyclist 9. Animal
1 2 1 10. Fixed object 1 1 1 1 11. Other object
12. 42 61 41 72 44 66 41 77 Totals
1. Primary State Highways 2. Secondary State Highways 3. County and Local Roads 4. City Streets 5. Not Stated Total--Rural Area
NOTE: THIS YEAR TO DATE represents only those crashes entered onto the database as of the date above. SAME PERIOD LAST YEAR represents all crashes including late reports. MAJOR INJURIES are incapacitating injuries. MINOR INJURIES are non-incapacitating evident injuries.
3. LOCATION Total
PropertyDamage
Nonfatal Injury Fatal Property
DamageNonfatal
InjuryFatalTotalPropertyDamage
Nonfatal Injury Fatal Total Killed Injured
Total On Roadway TotalOff Roadway Number Of Crashes Number Of Persons
1. Below 1,000 2. 1,000 to 2,500 3. 2,501 to 5,000 4. 5,001 to 10,000 5. 10,001 to 25,000 6. 25,001 to 50,000 7. 50,001 to 100,000 8. 100,001 to 200,000 9. City of Portland Only Total - Municipalities
77
77
25 52
25 52
25 47 72
25 47 72
5 5
5 5
41
41
36 1 1 30 21 51 31 21 52 1. Primary State Highways 2. Secondary State Highways 3. County and Local Roads
5 4 4 17 4 21 21 4 25 4. City Streets 5. Not Stated Total--Urban Area 415547257252 25 77 6. Interstate System 7. Other State Freeways 8. Other State Highways 52 21 31 51 21 30 1 1 36Total--Urban System 52 21 31 51 21 30 1 1 36
6. Interstate System 7. Other State Freeways 8. Other State Highways Total--Rural System
June 1, 2007
CORNELIUS
138
At I
nter
sect
ion
Not
at I
nter
sect
ion
At
Inte
r. N
on -I
nter
.
CORNELIUS 2006 OREGON CRASHES
4. AGE OF CASUALTY
Number of Persons Killed Number of Persons Injured Total Killed Pedestrians Pedalcyclist Total Injured Pedestrians Pedalcyclist
Total Total Total Total Total TotalMale Male Male Male Male MaleFemale Female Female Female Female Female1. 0 to 4 1 1 22. 5 to 9 1 13. 10 to 14 2 24. 15 to 19 3 2 55. 20 to 24 1 16. 25 to 34 6 3 97. 35 to 44 7 2 98. 45 to 54 1 1 29. 55 to 64 6 1 710. 65 to 74 1 111. 75 & older 1 112. Not-stated 1 1Totals 41 11 30
Directional Analysis - A crash consisting of a series of collisions, overturning, etc., is classified according to the first damage or injury producing event; includes on roadway and off roadway.5A. MULTIPLE VEH CRASH Total Fatal Injury P.D.O.
Junction1. Car go straight2. Car turning right3. Car turning left 4. Car backing 5. All othersTotals
5D. ALL OTHER CRASHES Total Fatal Injury P.D.O.Coll-isionWith
Coll-isionWith
1. Other rd veh or railway train2. Fixed object 3. Other object or animal 4. Overturning 5. Other noncollision 6. Other rd veh or railway train 7. Fixed object 1 1 8. Other object or animal 1 1 9. Overturning10. Other noncollision 1 1 11. Not statedTotals 12 3
6. PEDESTRIAN ACTION BY AGE
Ages of Pedstrians Killed and InjuredPedestrians Killed Total 0 to 4 5 to 9 10 to 14 15 to 19 20 to 24 25 to 44 45 to 64 65 & older Not stated
1a. X-ing at intersect or X-walk 1b. X-ing not at intersection 2a. Walking in road with traffic 2b. Same against traffic 3. Standing in roadway 4. Push or work on veh in road 5. Other working in roadway 6. Playing in roadway 7. Other in roadway 8. Not in roadway 9. Not stated Totals
7. AGE OF DRIVER All Crashes Fatal Injury 1. 14 & younger 2. 15 3. 16 1 1 4. 17 4 2 5. 18 2 1 6. 19 2 1 7. 20 3 2 8. 21 3 9. 22 to 24 9 3 10. 25 to 34 37 13 11. 35 to 44 32 10 12. 45 to 54 16 4 13. 55 to 64 24 11 14. 65 to 74 10 4 15. 75 & older 3 1 16. Not stated 12 2 Totals 158 55 8. SEX OF DRIVER Injury Fatal All Crashes
1. Male 81 29 2. Female 72 25 3. Not stated 5 1 Totals 158 55
9. RESIDENCE OF DRIVER All Crashes Fatal Injury
1. Local resident 142 52 2. In-state resident 5 1 3. Non resident 1 0 4. Not stated 10 2 Totals 158 55
10. CRASHES BY CONTRIBUTING FACTOR All InjuryFatal1. Speed too fast
4
4 2
7. Followed too closely 16
6 3
6. Improper overtaking5. Drove left of center4. Disregard traffic signal3. Passed stop sign2. Failed to yield 19 2
6 8
8. Made improper turn
Totals 82 28 6 1
1 2
14 1 6 3 6
12. Other 11. Mechanical defect10. Improper driving9. Had been drinking
12. ROAD SURFACECONDITION InjuryFatalAll
1. Dry 64 212. Wet 10 43. Snowy or icy4. Other 5. Not stated 3Totals 77 25
13. LIGHT CONDITION InjuryFatalAll1. Daylight 57 162. Dawn or Dusk 4 23. Darkness 15 74. Not stated 1Totals 77 25
11. VEHICLE TYPE InjuryFatalAll1. Passenger car 151 552. Pass Car and trailer 13. Truck or truck tractor 14. Truck tractor with semi-trailer 15. Other truck combination 6. Farm tractor and/or equip. 7. Taxicab 8. Bus9. School bus 110. Motorcycle 4 111. Motor scooter or moped 12. Others and not stated 4Totals 163 56Special vehicles included above 13. Log trucks14. Emergency (incl. private) 15. Military vehicles 16. Other public vehicles 2
1. Primary State Highways 2. Secondary State Highways 3. County and Local Roads 4. City Streets 5. Not Stated Total--Rural Area
NOTE: THIS YEAR TO DATE represents only those crashes entered onto the database as of the date above. SAME PERIOD LAST YEAR represents all crashes including late reports. MAJOR INJURIES are incapacitating injuries. MINOR INJURIES are non-incapacitating evident injuries.
3. LOCATION Total
PropertyDamage
Nonfatal Injury Fatal Property
DamageNonfatal
InjuryFatalTotalPropertyDamage
Nonfatal Injury Fatal Total Killed Injured
Total On Roadway TotalOff Roadway Number Of Crashes Number Of Persons
1. Below 1,000 2. 1,000 to 2,500 3. 2,501 to 5,000 4. 5,001 to 10,000 5. 10,001 to 25,000 6. 25,001 to 50,000 7. 50,001 to 100,000 8. 100,001 to 200,000 9. City of Portland Only Total - Municipalities
3. County and Local Roads 148 20 13 33 163 105 268 183 118 301 4. City Streets
5. Not Stated Total--Urban Area 25122 17 39235170405257 187 444 6. Interstate System 7. Other State Freeways 8. Other State Highways 143 69 74 137 65 72 6 4 2 103Total--Urban System 143 69 74 137 65 72 6 4 2 103
6. Interstate System 7. Other State Freeways 8. Other State Highways Total--Rural System
June 1, 2007
CORVALLIS
140
At I
nter
sect
ion
Not
at I
nter
sect
ion
At
Inte
r. N
on -I
nter
.
CORVALLIS 2006 OREGON CRASHES
4. AGE OF CASUALTY
Number of Persons Killed Number of Persons Injured Total Killed Pedestrians Pedalcyclist Total Injured Pedestrians Pedalcyclist
Total Total Total Total Total TotalMale Male Male Male Male MaleFemale Female Female Female Female Female1. 0 to 4 1 1 22. 5 to 9 1 1 2 1 33. 10 to 14 3 1 3 1 2 5 4 9 24. 15 to 19 1 17 17 34 15. 20 to 24 2 3 43 17 60 16. 25 to 34 1 1 3 1 24 12 36 27. 35 to 44 1 1 4 1 16 12 28 38. 45 to 54 2 5 18 13 31 39. 55 to 64 1 1 1 1 15 8 2310. 65 to 74 2 2 6 4 1011. 75 & older 1 1 9 5 1412. Not-stated 1 1Totals 251 95 156 9 5 4 21 12 9
Directional Analysis - A crash consisting of a series of collisions, overturning, etc., is classified according to the first damage or injury producing event; includes on roadway and off roadway.5A. MULTIPLE VEH CRASH Total Fatal Injury P.D.O.
Junction1. Car go straight 6 6 4 22. Car turning right3. Car turning left 2 2 24. Car backing 1 1 15. All othersTotals 9 9 6 3
5D. ALL OTHER CRASHES Total Fatal Injury P.D.O.Coll-isionWith
Coll-isionWith
1. Other rd veh or railway train 15 15 2. Fixed object 2 4 6 3. Other object or animal4. Overturning 1 1 5. Other noncollision6. Other rd veh or railway train 7 7 7. Fixed object 9 8 17 8. Other object or animal9. Overturning 1 1 2 10. Other noncollision11. Not statedTotals 1236 48
6. PEDESTRIAN ACTION BY AGE
Ages of Pedstrians Killed and InjuredPedestrians Killed Total 0 to 4 5 to 9 10 to 14 15 to 19 20 to 24 25 to 44 45 to 64 65 & older Not stated
1a. X-ing at intersect or X-walk 2 1 2 2 7 1b. X-ing not at intersection 2a. Walking in road with traffic 2b. Same against traffic 3. Standing in roadway 4. Push or work on veh in road 5. Other working in roadway 6. Playing in roadway 7. Other in roadway 1 1 2 8. Not in roadway 9. Not stated
3 1 23 9 Totals
7. AGE OF DRIVER All Crashes Fatal Injury 1. 14 & YOUNGER 1 2. 15 2 2 3. 16 11 3 4. 17 21 7 5. 18 35 13 6. 19 61 29 7. 20 41 17 8. 21 48 24 9. 22 to 24 83 46 10. 25 to 34 107 53 11. 35 to 44 87 35 12. 45 to 54 109 40 13. 55 to 64 95 35 14. 65 to 74 38 15 15. 75 & older 45 18 16. Not stated 62 4 Totals 846 341 8. SEX OF DRIVER Injury Fatal All Crashes
1. Male 421 156 2. Female 423 184 3. Not stated 2 1 Totals 846 341
9. RESIDENCE OF DRIVER All Crashes Fatal Injury
1. Local resident 632 273 2. In-state resident 163 53 3. Non resident 27 12 4. Not stated 24 3 Totals 846 341
10. CRASHES BY CONTRIBUTING FACTOR All InjuryFatal1. Speed too fast
42 1 2
31 12
7. Followed too closely 104 5 4
67 29
6. Improper overtaking5. Drove left of center4. Disregard traffic signal3. Passed stop sign2. Failed to yield 121 55
7 13
8. Made improper turn
Totals 537 224 36
1 24 5 8
92 2
60 14 26
12. Other 11. Mechanical defect10. Improper driving9. Had been drinking
12. ROAD SURFACECONDITION InjuryFatalAll
1. Dry 339 1402. Wet 102 453. Snowy or icy 3 24. Other 5. Not statedTotals 444 187
13. LIGHT CONDITION InjuryFatalAll1. Daylight 361 1542. Dawn or Dusk 4 13. Darkness 79 324. Not statedTotals 444 187
11. VEHICLE TYPE InjuryFatalAll1. Passenger car 838 3262. Pass Car and trailer 3 23. Truck or truck tractor 5 24. Truck tractor with semi-trailer 6 15. Other truck combination 6. Farm tractor and/or equip. 7. Taxicab8. Bus 1 19. School bus 110. Motorcycle 13 1111. Motor scooter or moped 1 112. Others and not stated 2 1Totals 870 345Special vehicles included above 13. Log trucks14. Emergency (incl. private) 15. Military vehicles 16. Other public vehicles 2 1
14. MANNER OF COLLISION InjuryFatalAll
1. Head-on 3 12. Rear end 121 533. Angle 216 804. Sideswipe-meeting 3 25. Sideswipe-overtaking 27 36. Backed into 15 37. Other 2Totals 387 142
11. Count of vehicles, including properly parked vehicles.
Totals include participant records where gender was coded as "unknown".
10. Count of crashes. Crashes with multiple contributing circumstances are counted in all applicable categories.
MULTIPLE VEHICLE CRASHES
7 - 9. Tally of drivers by age, sex, residence & crash severity. Excludes occupants of properly & improperly parked vehicles.
141
Col
lisio
n in
volv
ing:
N
on-
coll.
N
on-
coll.
C
ollis
ion
invo
lvin
g:
Non
- co
ll.
Col
lisio
n in
volv
ing:
3C
. RU
RA
L 3A
. Inc
orpo
rate
d A
reas
3B
. UR
BA
N
SUMMARY OF MOTOR VEHICLE TRAFFIC CRASHES 2006 OREGON CRASHESForIn
1. Primary State Highways 2. Secondary State Highways 3. County and Local Roads 4. City Streets 5. Not Stated Total--Rural Area
NOTE: THIS YEAR TO DATE represents only those crashes entered onto the database as of the date above. SAME PERIOD LAST YEAR represents all crashes including late reports. MAJOR INJURIES are incapacitating injuries. MINOR INJURIES are non-incapacitating evident injuries.
3. LOCATION Total
PropertyDamage
Nonfatal Injury Fatal Property
DamageNonfatal
InjuryFatalTotalPropertyDamage
Nonfatal Injury Fatal Total Killed Injured
Total On Roadway TotalOff Roadway Number Of Crashes Number Of Persons
1. Below 1,000 2. 1,000 to 2,500 3. 2,501 to 5,000 4. 5,001 to 10,000 5. 10,001 to 25,000 6. 25,001 to 50,000 7. 50,001 to 100,000 8. 100,001 to 200,000 9. City of Portland Only Total - Municipalities
84
84
38 46
38 46
35 37 72
35 37 72
3 9 12
3 9 12
57
57
1. Primary State Highways 31 1 1 2 17 19 36 18 20 38 2. Secondary State Highways
3. County and Local Roads 26 8 2 10 20 16 36 28 18 46 4. City Streets
5. Not Stated Total--Urban Area 579 3 1237357246 38 84 6. Interstate System 7. Other State Freeways 8. Other State Highways 38 20 18 36 19 17 2 1 1 31Total--Urban System 38 20 18 36 19 17 2 1 1 31
6. Interstate System 7. Other State Freeways 8. Other State Highways Total--Rural System
June 1, 2007
DALLAS
142
At I
nter
sect
ion
Not
at I
nter
sect
ion
At
Inte
r. N
on -I
nter
.
DALLAS 2006 OREGON CRASHES
4. AGE OF CASUALTY
Number of Persons Killed Number of Persons Injured Total Killed Pedestrians Pedalcyclist Total Injured Pedestrians Pedalcyclist
Total Total Total Total Total TotalMale Male Male Male Male MaleFemale Female Female Female Female Female1. 0 to 4 2. 5 to 9 3. 10 to 14 1 2 1 1 2 14. 15 to 19 3 3 3 11 145. 20 to 24 1 1 1 1 6 3 96. 25 to 34 1 1 3 3 67. 35 to 44 4 3 78. 45 to 54 4 2 69. 55 to 64 2 1 1 4 3 710. 65 to 74 1 1 211. 75 & older 2 1 312. Not-stated 1 1 1 1Totals 57 29 28 7 6 1 4 2 2
Directional Analysis - A crash consisting of a series of collisions, overturning, etc., is classified according to the first damage or injury producing event; includes on roadway and off roadway.5A. MULTIPLE VEH CRASH Total Fatal Injury P.D.O.
Junction1. Car go straight 2 2 22. Car turning right3. Car turning left 2 2 24. Car backing5. All othersTotals 4 4 4
5D. ALL OTHER CRASHES Total Fatal Injury P.D.O.Coll-isionWith
Coll-isionWith
1. Other rd veh or railway train 3 3 2. Fixed object3. Other object or animal4. Overturning 1 1 5. Other noncollision6. Other rd veh or railway train 1 1 7. Fixed object 2 2 8. Other object or animal 1 1 9. Overturning10. Other noncollision 11. Not statedTotals 35 8
6. PEDESTRIAN ACTION BY AGE
Ages of Pedstrians Killed and InjuredPedestrians Killed Total 0 to 4 5 to 9 10 to 14 15 to 19 20 to 24 25 to 44 45 to 64 65 & older Not stated
1a. X-ing at intersect or X-walk 2 1 1 4 1b. X-ing not at intersection 2a. Walking in road with traffic 2b. Same against traffic 3. Standing in roadway 4. Push or work on veh in road 5. Other working in roadway 6. Playing in roadway 7. Other in roadway 8. Not in roadway 3 3 9. Not stated
2 113 7 Totals
7. AGE OF DRIVER All Crashes Fatal Injury 1. 14 & younger 2. 15 3. 16 6 3 4. 17 5 2 5. 18 12 4 6. 19 2 1 7. 20 4 2 8. 21 5 3 9. 22 to 24 11 6 10. 25 to 34 16 7 11. 35 to 44 23 11 12. 45 to 54 22 11 13. 55 to 64 20 8 14. 65 to 74 10 6 15. 75 & older 6 3 16. Not stated 10 Totals 152 67 8. SEX OF DRIVER Injury Fatal All Crashes
1. Male 79 38 2. Female 73 29 3. Not stated Totals 152 67
9. RESIDENCE OF DRIVER All Crashes Fatal Injury
1. Local resident 136 59 2. In-state resident 10 6 3. Non resident 2 2 4. Not stated 4 0 Totals 152 67
10. CRASHES BY CONTRIBUTING FACTOR All InjuryFatal1. Speed too fast
10
2
7. Followed too closely 16
1 2 4
6. Improper overtaking5. Drove left of center4. Disregard traffic signal3. Passed stop sign2. Failed to yield 36 16
3 6
8. Made improper turn
Totals 111 50 6 1
12
17 1
24 1 3
12. Other 11. Mechanical defect10. Improper driving9. Had been drinking
12. ROAD SURFACECONDITION InjuryFatalAll
1. Dry 60 252. Wet 20 123. Snowy or icy4. Other 5. Not stated 4 1Totals 84 38
13. LIGHT CONDITION InjuryFatalAll1. Daylight 62 282. Dawn or Dusk 6 13. Darkness 15 84. Not stated 1 1Totals 84 38
11. VEHICLE TYPE InjuryFatalAll1. Passenger car 157 672. Pass Car and trailer 3. Truck or truck tractor 14. Truck tractor with semi-trailer 5. Other truck combination 6. Farm tractor and/or equip. 7. Taxicab 8. Bus 9. School bus 10. Motorcycle 3 311. Motor scooter or moped 12. Others and not stated 1 1Totals 162 71Special vehicles included above 13. Log trucks14. Emergency (incl. private) 115. Military vehicles 16. Other public vehicles
1. Primary State Highways 2. Secondary State Highways 3. County and Local Roads 4. City Streets 5. Not Stated Total--Rural Area
NOTE: THIS YEAR TO DATE represents only those crashes entered onto the database as of the date above. SAME PERIOD LAST YEAR represents all crashes including late reports. MAJOR INJURIES are incapacitating injuries. MINOR INJURIES are non-incapacitating evident injuries.
3. LOCATION Total
PropertyDamage
Nonfatal Injury Fatal Property
DamageNonfatal
InjuryFatalTotalPropertyDamage
Nonfatal Injury Fatal Total Killed Injured
Total On Roadway TotalOff Roadway Number Of Crashes Number Of Persons
1. Below 1,000 2. 1,000 to 2,500 3. 2,501 to 5,000 4. 5,001 to 10,000 5. 10,001 to 25,000 6. 25,001 to 50,000 7. 50,001 to 100,000 8. 100,001 to 200,000 9. City of Portland Only Total - Municipalities
3. County and Local Roads 708 4 94 36 1 131 806 488 3 1,297 900 524 4 1,428 4. City Streets
5. Not Stated Total--Urban Area 1,0005114 55 1 1701,04768041,731 1,161 735 5 1,901 6. Interstate System 106 46 60 87 36 51 19 10 9 617. Other State Freeways 93 1 45 47 82 39 42 11 6 5 1 608. Other State Highways 274 120 154 265 117 148 9 3 6 171Total--Urban System 473 1 211 261 434 1 192 241 39 19 20 1 292
6. Interstate System 7. Other State Freeways 8. Other State Highways Total--Rural System
June 1, 2007
EUGENE
144
At I
nter
sect
ion
Not
at I
nter
sect
ion
At
Inte
r. N
on -I
nter
.
EUGENE 2006 OREGON CRASHES
4. AGE OF CASUALTY
Number of Persons Killed Number of Persons Injured Total Killed Pedestrians Pedalcyclist Total Injured Pedestrians Pedalcyclist
Total Total Total Total Total TotalMale Male Male Male Male MaleFemale Female Female Female Female Female1. 0 to 4 9 4 13 1 1 2. 5 to 9 10 10 203. 10 to 14 4 1 5 1 3 13 16 29 44. 15 to 19 2 1 5 1 1 67 29 96 45. 20 to 24 5 6 9 2 3 108 59 167 1 1 36. 25 to 34 3 4 12 2 1 105 74 179 87. 35 to 44 2 3 8 2 91 65 156 1 1 1 1 58. 45 to 54 4 4 8 3 1 94 65 159 2 1 1 49. 55 to 64 1 1 6 1 65 35 100 510. 65 to 74 2 1 2 17 17 34 111. 75 & older 1 1 19 8 2712. Not-stated 5 2 6 4 1 10 5 20 3Totals 5 2 3 1 1 1,000 387 608 29 12 17 60 37 22
Directional Analysis - A crash consisting of a series of collisions, overturning, etc., is classified according to the first damage or injury producing event; includes on roadway and off roadway.5A. MULTIPLE VEH CRASH Total Fatal Injury P.D.O.
Junction1. Car go straight 16 1 1 15 1 142. Car turning right 3 3 2 13. Car turning left 10 10 9 14. Car backing5. All others 1 1 1Totals 30 1 1 29 12 17
5D. ALL OTHER CRASHES Total Fatal Injury P.D.O.Coll-isionWith
Coll-isionWith
1. Other rd veh or railway train 31 31 2. Fixed object 2 3 5 3. Other object or animal4. Overturning 1 1 5. Other noncollision6. Other rd veh or railway train 29 29 7. Fixed object 56 38 1 95 8. Other object or animal 4 1 5 9. Overturning 1 1 2 10. Other noncollision 1 1 11. Not statedTotals 63104 2 169
6. PEDESTRIAN ACTION BY AGE
Ages of Pedstrians Killed and InjuredPedestrians Killed Total 0 to 4 5 to 9 10 to 14 15 to 19 20 to 24 25 to 44 45 to 64 65 & older Not stated
1a. X-ing at intersect or X-walk 3 1 4 2 2 1 13 1b. X-ing not at intersection 1 1 1 4 1 1 3 12 1 2a. Walking in road with traffic 1 1 2b. Same against traffic 3. Standing in roadway 1 1 4. Push or work on veh in road 5. Other working in roadway 6. Playing in roadway 7. Other in roadway 8. Not in roadway 1 2 3 9. Not stated
53 5 6524 30 1 Totals
7. AGE OF DRIVER All Crashes Fatal Injury 1. 14 & YOUNGER 1 2. 15 3 3 3. 16 58 18 4. 17 89 37 5. 18 112 43 6. 19 115 46 7. 20 130 46 8. 21 130 1 50 9. 22 to 24 276 4 129 10. 25 to 34 603 1 253 11. 35 to 44 522 229 12. 45 to 54 578 3 261 13. 55 to 64 408 1 171 14. 65 to 74 188 72 15. 75 & older 129 46 16. Not stated 412 46 Totals 3,754 10 1,450 8. SEX OF DRIVER Injury Fatal All Crashes
1. Male 1,870 5 678 2. Female 1,812 5 745 3. Not stated 72 27 Totals 3,754 10 1,450
9. RESIDENCE OF DRIVER All Crashes Fatal Injury
1. Local resident 3,453 8 1,350 2. In-state resident 126 1 54 3. Non resident 57 1 15 4. Not stated 118 31 Totals 3,754 10 1,450
10. CRASHES BY CONTRIBUTING FACTOR All InjuryFatal1. Speed too fast
93 22
8 56
8
7. Followed too closely 169 1
1
102 12
104 17
6. Improper overtaking5. Drove left of center4. Disregard traffic signal3. Passed stop sign2. Failed to yield 517 202
307 1 797
8. Made improper turn
Totals 1,991 6 777 18
2 26 20 15
1
2
65 2
103 33 70
12. Other 11. Mechanical defect10. Improper driving9. Had been drinking
12. ROAD SURFACECONDITION InjuryFatalAll
1. Dry 1,439 3 5532. Wet 443 2 1753. Snowy or icy 19 74. Other 5. Not statedTotals 1,901 5 735
13. LIGHT CONDITION InjuryFatalAll1. Daylight 1,442 2 5572. Dawn or Dusk 80 283. Darkness 379 3 1504. Not statedTotals 1,901 5 735
11. VEHICLE TYPE InjuryFatalAll1. Passenger car 3,736 8 1,4232. Pass Car and trailer 16 1 53. Truck or truck tractor 15 44. Truck tractor with semi-trailer 22 1 75. Other truck combination 6. Farm tractor and/or equip. 7. Taxicab8. Bus 14 69. School bus 310. Motorcycle 23 2011. Motor scooter or moped 12. Others and not stated 4 1Totals 3,833 10 1,466Special vehicles included above 13. Log trucks14. Emergency (incl. private) 5 115. Military vehicles 16. Other public vehicles 21 10
14. MANNER OF COLLISION InjuryFatalAll
1. Head-on 4 22. Rear end 846 1 3663. Angle 630 1 2044. Sideswipe-meeting 9 55. Sideswipe-overtaking 156 226. Backed into 36 27. Other 21 1Totals 1,702 2 602
11. Count of vehicles, including properly parked vehicles.
Totals include participant records where gender was coded as "unknown".
10. Count of crashes. Crashes with multiple contributing circumstances are counted in all applicable categories.
MULTIPLE VEHICLE CRASHES
7 - 9. Tally of drivers by age, sex, residence & crash severity. Excludes occupants of properly & improperly parked vehicles.
145
Col
lisio
n in
volv
ing:
N
on-
coll.
N
on-
coll.
C
ollis
ion
invo
lvin
g:
Non
- co
ll.
Col
lisio
n in
volv
ing:
3C
. RU
RA
L 3A
. Inc
orpo
rate
d A
reas
3B
. UR
BA
N
SUMMARY OF MOTOR VEHICLE TRAFFIC CRASHES 2006 OREGON CRASHESForIn
1. Primary State Highways 2. Secondary State Highways 3. County and Local Roads 4. City Streets 5. Not Stated Total--Rural Area
NOTE: THIS YEAR TO DATE represents only those crashes entered onto the database as of the date above. SAME PERIOD LAST YEAR represents all crashes including late reports. MAJOR INJURIES are incapacitating injuries. MINOR INJURIES are non-incapacitating evident injuries.
3. LOCATION Total
PropertyDamage
Nonfatal Injury Fatal Property
DamageNonfatal
InjuryFatalTotalPropertyDamage
Nonfatal Injury Fatal Total Killed Injured
Total On Roadway TotalOff Roadway Number Of Crashes Number Of Persons
1. Below 1,000 2. 1,000 to 2,500 3. 2,501 to 5,000 4. 5,001 to 10,000 5. 10,001 to 25,000 6. 25,001 to 50,000 7. 50,001 to 100,000 8. 100,001 to 200,000 9. City of Portland Only Total - Municipalities
3. County and Local Roads 46 1 9 3 1 13 39 29 68 48 32 1 81 4. City Streets
5. Not Stated Total--Urban Area 85110 3 1 1448519958 54 1 113 6. Interstate System 7. Other State Freeways 8. Other State Highways 32 22 10 31 22 9 1 1 39Total--Urban System 32 22 10 31 22 9 1 1 39
6. Interstate System 7. Other State Freeways 8. Other State Highways Total--Rural System
June 1, 2007
FOREST GROVE
146
At I
nter
sect
ion
Not
at I
nter
sect
ion
At
Inte
r. N
on -I
nter
.
FOREST GROVE 2006 OREGON CRASHES
4. AGE OF CASUALTY
Number of Persons Killed Number of Persons Injured Total Killed Pedestrians Pedalcyclist Total Injured Pedestrians Pedalcyclist
Total Total Total Total Total TotalMale Male Male Male Male MaleFemale Female Female Female Female Female1. 0 to 4 2. 5 to 9 1 2 1 3 13. 10 to 14 1 14. 15 to 19 1 3 11 5 16 25. 20 to 24 1 1 7 3 106. 25 to 34 1 1 10 8 187. 35 to 44 1 4 6 10 18. 45 to 54 1 1 1 8 6 14 1 1 19. 55 to 64 1 4 4 8 110. 65 to 74 1 1 2 2 411. 75 & older 1 112. Not-stated Totals 1 1 85 36 49 3 3 8 6 2
Directional Analysis - A crash consisting of a series of collisions, overturning, etc., is classified according to the first damage or injury producing event; includes on roadway and off roadway.5A. MULTIPLE VEH CRASH Total Fatal Injury P.D.O.
5B. MULTIPLE VEH CRASH Total Fatal Injury P.D.O. 1 1 21. Moving in opposite dir. 5 2 72. Both moving in same dir. 4 43a. One car parked 7 7 143b. One car stopped in traffic 1 14. Enter/Leave parked pos.
Junction1. Car go straight 1 1 12. Car turning right 1 1 13. Car turning left 1 1 14. Car backing5. All othersTotals 3 3 1 2
5D. ALL OTHER CRASHES Total Fatal Injury P.D.O.Coll-isionWith
Coll-isionWith
1. Other rd veh or railway train 4 4 2. Fixed object3. Other object or animal 4. Overturning 5. Other noncollision6. Other rd veh or railway train 4 4 7. Fixed object 5 2 1 8 8. Other object or animal9. Overturning 10. Other noncollision 11. Not statedTotals 510 1 16
6. PEDESTRIAN ACTION BY AGE
Ages of Pedstrians Killed and InjuredPedestrians Killed Total 0 to 4 5 to 9 10 to 14 15 to 19 20 to 24 25 to 44 45 to 64 65 & older Not stated
1a. X-ing at intersect or X-walk 1 1 1b. X-ing not at intersection 1 1 2a. Walking in road with traffic 2b. Same against traffic 3. Standing in roadway 4. Push or work on veh in road 5. Other working in roadway 6. Playing in roadway 7. Other in roadway 8. Not in roadway 1 1 9. Not stated
1 1 1 3 Totals
7. AGE OF DRIVER All Crashes Fatal Injury 1. 14 & younger 2. 15 3. 16 5 4 4. 17 6 3 5. 18 9 5 6. 19 2 7. 20 3 1 8. 21 6 3 9. 22 to 24 9 3 10. 25 to 34 41 19 11. 35 to 44 32 15 12. 45 to 54 34 1 19 13. 55 to 64 29 14 14. 65 to 74 7 5 15. 75 & older 14 6 16. Not stated 13 1 Totals 210 1 98 8. SEX OF DRIVER Injury Fatal All Crashes
1. Male 119 1 44 2. Female 86 53 3. Not stated 5 1 Totals 210 1 98
9. RESIDENCE OF DRIVER All Crashes Fatal Injury
1. Local resident 184 1 89 2. In-state resident 11 5 3. Non resident 6 3 4. Not stated 9 1 Totals 210 1 98
10. CRASHES BY CONTRIBUTING FACTOR All InjuryFatal1. Speed too fast
6
3 1
7. Followed too closely 18 1 1 6 2
6. Improper overtaking5. Drove left of center4. Disregard traffic signal3. Passed stop sign2. Failed to yield 41 24
7 15
8. Made improper turn
Totals 123 2 58 5 2 4 3 3
1 1
11 2
11 7 8
12. Other 11. Mechanical defect10. Improper driving9. Had been drinking
12. ROAD SURFACECONDITION InjuryFatalAll
1. Dry 84 1 442. Wet 26 103. Snowy or icy 14. Other 5. Not stated 2Totals 113 1 54
13. LIGHT CONDITION InjuryFatalAll1. Daylight 73 352. Dawn or Dusk 9 43. Darkness 31 1 154. Not statedTotals 113 1 54
11. VEHICLE TYPE InjuryFatalAll1. Passenger car 198 1 902. Pass Car and trailer 13. Truck or truck tractor 2 14. Truck tractor with semi-trailer 4 35. Other truck combination 6. Farm tractor and/or equip. 7. Taxicab8. Bus 29. School bus 2 110. Motorcycle 2 211. Motor scooter or moped 12. Others and not stated 3Totals 214 1 97Special vehicles included above 13. Log trucks14. Emergency (incl. private) 15. Military vehicles 16. Other public vehicles 4 1
14. MANNER OF COLLISION InjuryFatalAll
1. Head-on2. Rear end 30 153. Angle 55 254. Sideswipe-meeting 15. Sideswipe-overtaking 6 16. Backed into 27. OtherTotals 94 41
11. Count of vehicles, including properly parked vehicles.
Totals include participant records where gender was coded as "unknown".
10. Count of crashes. Crashes with multiple contributing circumstances are counted in all applicable categories.
MULTIPLE VEHICLE CRASHES
7 - 9. Tally of drivers by age, sex, residence & crash severity. Excludes occupants of properly & improperly parked vehicles.
147
Col
lisio
n in
volv
ing:
N
on-
coll.
N
on-
coll.
C
ollis
ion
invo
lvin
g:
Non
- co
ll.
Col
lisio
n in
volv
ing:
3C
. RU
RA
L 3A
. Inc
orpo
rate
d A
reas
3B
. UR
BA
N
SUMMARY OF MOTOR VEHICLE TRAFFIC CRASHES 2006 OREGON CRASHESForIn
5. MV on other roadway 1 3 1 3 1 6 2 7 6. Parked MV
7. Railway train 1 1 3 3 2 2 3 3 8. Pedalcyclist
9. Animal 6 6 3 3 10. Fixed object
1 111. Other object 12.
88 125 85 95 97 137 89 102 Totals
1. Primary State Highways 2. Secondary State Highways 3. County and Local Roads 4. City Streets 5. Not Stated Total--Rural Area
NOTE: THIS YEAR TO DATE represents only those crashes entered onto the database as of the date above. SAME PERIOD LAST YEAR represents all crashes including late reports. MAJOR INJURIES are incapacitating injuries. MINOR INJURIES are non-incapacitating evident injuries.
3. LOCATION Total
PropertyDamage
Nonfatal Injury Fatal Property
DamageNonfatal
InjuryFatalTotalPropertyDamage
Nonfatal Injury Fatal Total Killed Injured
Total On Roadway TotalOff Roadway Number Of Crashes Number Of Persons
1. Below 1,000 2. 1,000 to 2,500 3. 2,501 to 5,000 4. 5,001 to 10,000 5. 10,001 to 25,000 6. 25,001 to 50,000 7. 50,001 to 100,000 8. 100,001 to 200,000 9. City of Portland Only Total - Municipalities
102
102
54 48
54 48
51 44 95
51 44 95
3 4 7
3 4 7
89
89
52 22 31 53 22 31 53 1. Primary State Highways 2. Secondary State Highways 3. County and Local Roads
37 4 3 7 22 20 42 26 23 49 4. City Streets 5. Not Stated Total--Urban Area 894 3 744519548 54 102 6. Interstate System 21 11 10 21 11 10 197. Other State Freeways 8. Other State Highways 32 20 12 32 20 12 33Total--Urban System 53 31 22 53 31 22 52
6. Interstate System 7. Other State Freeways 8. Other State Highways Total--Rural System
June 1, 2007
GLADSTONE
148
At I
nter
sect
ion
Not
at I
nter
sect
ion
At
Inte
r. N
on -I
nter
.
GLADSTONE 2006 OREGON CRASHES
4. AGE OF CASUALTY
Number of Persons Killed Number of Persons Injured Total Killed Pedestrians Pedalcyclist Total Injured Pedestrians Pedalcyclist
Total Total Total Total Total TotalMale Male Male Male Male MaleFemale Female Female Female Female Female1. 0 to 4 1 1 22. 5 to 9 1 1 3 2 53. 10 to 14 1 1 1 1 3 4 14. 15 to 19 1 1 1 8 9 17 15. 20 to 24 1 1 4 7 116. 25 to 34 5 7 127. 35 to 44 8 8 168. 45 to 54 1 1 1 5 4 9 19. 55 to 64 2 2 3 3 610. 65 to 74 3 1 411. 75 & older 2 1 312. Not-stated Totals 89 46 43 7 4 3 3 3
Directional Analysis - A crash consisting of a series of collisions, overturning, etc., is classified according to the first damage or injury producing event; includes on roadway and off roadway.5A. MULTIPLE VEH CRASH Total Fatal Injury P.D.O.
1. Entering at angle 6 4 10 2a. Same dir.- both straight 2b. Same-1 turn, 1 straight 2c. Same-one stopped 1 6 7 2d. Same-all others 3a. Opposite dir.- both straight 3b. Opposite-1 turn, 1 straight 2 2 3c. Opposite-all others 4. Not stated Totals 7 12 19
5B. MULTIPLE VEH CRASH Total Fatal Injury P.D.O. 1 11. Moving in opposite dir.
10 11 212. Both moving in same dir. 5 2 73a. One car parked
18 14 323b. One car stopped in traffic 1 14. Enter/Leave parked pos.
Junction1. Car go straight 5 5 1 42. Car turning right 1 1 13. Car turning left 1 1 14. Car backing5. All othersTotals 7 7 3 4
5D. ALL OTHER CRASHES Total Fatal Injury P.D.O.Coll-isionWith
Coll-isionWith
1. Other rd veh or railway train 1 1 2. Fixed object3. Other object or animal4. Overturning 1 1 5. Other noncollision6. Other rd veh or railway train 2 2 7. Fixed object 1 2 3 8. Other object or animal9. Overturning 10. Other noncollision 11. Not statedTotals 25 7
6. PEDESTRIAN ACTION BY AGE
Ages of Pedstrians Killed and InjuredPedestrians Killed Total 0 to 4 5 to 9 10 to 14 15 to 19 20 to 24 25 to 44 45 to 64 65 & older Not stated
1a. X-ing at intersect or X-walk 3 1 4 1b. X-ing not at intersection 2a. Walking in road with traffic 2b. Same against traffic 3. Standing in roadway 4. Push or work on veh in road 5. Other working in roadway 6. Playing in roadway 7. Other in roadway 1 1 1 3 8. Not in roadway 9. Not stated
3 1111 7 Totals
7. AGE OF DRIVER All Crashes Fatal Injury 1. 14 & younger 2. 15 1 1 3. 16 3 1 4. 17 6 3 5. 18 10 5 6. 19 7 5 7. 20 7 4 8. 21 4 2 9. 22 to 24 10 9 10. 25 to 34 35 17 11. 35 to 44 35 20 12. 45 to 54 28 15 13. 55 to 64 17 9 14. 65 to 74 11 7 15. 75 & older 4 1 16. Not stated 12 2 Totals 190 101 8. SEX OF DRIVER Injury Fatal All Crashes
1. Male 111 57 2. Female 76 43 3. Not stated 3 1 Totals 190 101
9. RESIDENCE OF DRIVER All Crashes Fatal Injury
1. Local resident 170 91 2. In-state resident 5 4 3. Non resident 6 4 4. Not stated 9 2 Totals 190 101
10. CRASHES BY CONTRIBUTING FACTOR All InjuryFatal1. Speed too fast
22 1
1 2
7. Followed too closely 39 2
1 2
6. Improper overtaking5. Drove left of center4. Disregard traffic signal3. Passed stop sign2. Failed to yield 29 14
6 13
8. Made improper turn
Totals 114 60 8
2 2 2
12
8 4 4
12. Other 11. Mechanical defect10. Improper driving9. Had been drinking
12. ROAD SURFACECONDITION InjuryFatalAll
1. Dry 71 422. Wet 29 123. Snowy or icy4. Other 5. Not stated 2Totals 102 54
13. LIGHT CONDITION InjuryFatalAll1. Daylight 77 382. Dawn or Dusk 1 13. Darkness 24 154. Not statedTotals 102 54
11. VEHICLE TYPE InjuryFatalAll1. Passenger car 187 982. Pass Car and trailer 1 13. Truck or truck tractor 3 24. Truck tractor with semi-trailer 35. Other truck combination 1 16. Farm tractor and/or equip. 7. Taxicab8. Bus 3 19. School bus 110. Motorcycle 11. Motor scooter or moped 12. Others and not stated 2Totals 201 103Special vehicles included above 13. Log trucks14. Emergency (incl. private) 15. Military vehicles 16. Other public vehicles 4 2
14. MANNER OF COLLISION InjuryFatalAll
1. Head-on2. Rear end 50 273. Angle 19 84. Sideswipe-meeting 15. Sideswipe-overtaking 13 66. Backed into 4 17. Other 1Totals 88 42
11. Count of vehicles, including properly parked vehicles.
Totals include participant records where gender was coded as "unknown".
10. Count of crashes. Crashes with multiple contributing circumstances are counted in all applicable categories.
MULTIPLE VEHICLE CRASHES
7 - 9. Tally of drivers by age, sex, residence & crash severity. Excludes occupants of properly & improperly parked vehicles.
149
Col
lisio
n in
volv
ing:
N
on-
coll.
N
on-
coll.
C
ollis
ion
invo
lvin
g:
Non
- co
ll.
Col
lisio
n in
volv
ing:
3C
. RU
RA
L 3A
. Inc
orpo
rate
d A
reas
3B
. UR
BA
N
SUMMARY OF MOTOR VEHICLE TRAFFIC CRASHES 2006 OREGON CRASHESForIn
1. Primary State Highways 2. Secondary State Highways 3. County and Local Roads 4. City Streets 5. Not Stated Total--Rural Area
NOTE: THIS YEAR TO DATE represents only those crashes entered onto the database as of the date above. SAME PERIOD LAST YEAR represents all crashes including late reports. MAJOR INJURIES are incapacitating injuries. MINOR INJURIES are non-incapacitating evident injuries.
3. LOCATION Total
PropertyDamage
Nonfatal Injury Fatal Property
DamageNonfatal
InjuryFatalTotalPropertyDamage
Nonfatal Injury Fatal Total Killed Injured
Total On Roadway TotalOff Roadway Number Of Crashes Number Of Persons
1. Below 1,000 2. 1,000 to 2,500 3. 2,501 to 5,000 4. 5,001 to 10,000 5. 10,001 to 25,000 6. 25,001 to 50,000 7. 50,001 to 100,000 8. 100,001 to 200,000 9. City of Portland Only Total - Municipalities
3. County and Local Roads 141 26 9 35 106 99 205 132 108 240 4. City Streets
5. Not Stated Total--Urban Area 410235 17 522532772532288 294 2 584 6. Interstate System 7 1 3 3 4 2 1 3 1 2 1 77. Other State Freeways 8. Other State Highways 337 1 183 153 323 176 146 14 7 7 1 262Total--Urban System 344 2 186 156 327 2 178 147 17 8 9 2 269
6. Interstate System 7. Other State Freeways 8. Other State Highways Total--Rural System
June 1, 2007
GRANTS PASS
150
At I
nter
sect
ion
Not
at I
nter
sect
ion
At
Inte
r. N
on -I
nter
.
GRANTS PASS 2006 OREGON CRASHES
4. AGE OF CASUALTY
Number of Persons Killed Number of Persons Injured Total Killed Pedestrians Pedalcyclist Total Injured Pedestrians Pedalcyclist
Total Total Total Total Total TotalMale Male Male Male Male MaleFemale Female Female Female Female Female1. 0 to 4 4 1 52. 5 to 9 1 2 3 5 13. 10 to 14 1 1 4 2 64. 15 to 19 1 1 21 26 475. 20 to 24 1 1 1 27 12 39 1 1 16. 25 to 34 1 4 1 35 25 60 1 1 47. 35 to 44 2 2 3 2 37 27 64 18. 45 to 54 1 1 1 48 29 77 19. 55 to 64 3 2 1 28 22 5010. 65 to 74 17 13 3011. 75 & older 3 1 1 2 16 10 26 112. Not-stated 1 1 1 1Totals 2 1 1 410 171 239 11 8 3 14 10 4
Directional Analysis - A crash consisting of a series of collisions, overturning, etc., is classified according to the first damage or injury producing event; includes on roadway and off roadway.5A. MULTIPLE VEH CRASH Total Fatal Injury P.D.O.
21 3 245b. Leaving driveway/alley 4 3 76. All others
Totals 124 116 240
5C. PEDESTRIANCRASHES
All PedCrashes
Fatal Crashes Non-Fatal Injury Crashes
TotalAt
Intersection Non-
Junction TotalAt
IntersectionNon-
Junction1. Car go straight 5 5 1 42. Car turning right 5 5 3 23. Car turning left 1 1 14. Car backing5. All othersTotals 11 11 4 7
5D. ALL OTHER CRASHES Total Fatal Injury P.D.O.Coll-isionWith
Coll-isionWith
1. Other rd veh or railway train 9 9 2. Fixed object 5 4 9 3. Other object or animal4. Overturning 1 1 5. Other noncollision6. Other rd veh or railway train 5 5 7. Fixed object 14 7 21 8. Other object or animal 4 2 6 9. Overturning 1 1 10. Other noncollision11. Not statedTotals 2328 1 52
6. PEDESTRIAN ACTION BY AGE
Ages of Pedstrians Killed and InjuredPedestrians Killed Total 0 to 4 5 to 9 10 to 14 15 to 19 20 to 24 25 to 44 45 to 64 65 & older Not stated
1a. X-ing at intersect or X-walk 1 1 2 4 1b. X-ing not at intersection 2 2 1 5 2a. Walking in road with traffic 2b. Same against traffic 3. Standing in roadway 4. Push or work on veh in road 5. Other working in roadway 6. Playing in roadway 7. Other in roadway 8. Not in roadway 1 1 2 9. Not stated
3 4 31 11 Totals
7. AGE OF DRIVER All Crashes Fatal Injury 1. 14 & younger 2. 15 2 1 3. 16 15 8 4. 17 33 12 5. 18 44 21 6. 19 35 20 7. 20 28 17 8. 21 31 1 15 9. 22 to 24 54 33 10. 25 to 34 156 1 89 11. 35 to 44 173 92 12. 45 to 54 188 1 106 13. 55 to 64 130 66 14. 65 to 74 111 57 15. 75 & older 91 40 16. Not stated 43 10 Totals 1,134 3 587 8. SEX OF DRIVER Injury Fatal All Crashes
1. Male 581 2 295 2. Female 543 1 286 3. Not stated 10 6 Totals 1,134 3 587
9. RESIDENCE OF DRIVER All Crashes Fatal Injury
1. Local resident 970 2 505 2. In-state resident 77 46 3. Non resident 59 1 26 4. Not stated 28 10 Totals 1,134 3 587
10. CRASHES BY CONTRIBUTING FACTOR All InjuryFatal1. Speed too fast
108 2 1
41 9
7. Followed too closely 174 6 3
77 15
6. Improper overtaking5. Drove left of center4. Disregard traffic signal3. Passed stop sign2. Failed to yield 110 1 51
8 2 23
8. Made improper turn
Totals 689 4 347 58
5 35 8
21 1
121 8
77 11 64
12. Other 11. Mechanical defect10. Improper driving9. Had been drinking
12. ROAD SURFACECONDITION InjuryFatalAll
1. Dry 432 1 2192. Wet 143 1 713. Snowy or icy 5 34. Other 5. Not stated 4 1Totals 584 2 294
13. LIGHT CONDITION InjuryFatalAll1. Daylight 457 1 2272. Dawn or Dusk 27 173. Darkness 100 1 504. Not statedTotals 584 2 294
11. VEHICLE TYPE InjuryFatalAll1. Passenger car 1,134 2 5802. Pass Car and trailer 12 73. Truck or truck tractor 14. Truck tractor with semi-trailer 10 1 55. Other truck combination 6. Farm tractor and/or equip. 7. Taxicab 8. Bus9. School bus 110. Motorcycle 4 411. Motor scooter or moped 12. Others and not stated 1Totals 1,163 3 596Special vehicles included above 13. Log trucks14. Emergency (incl. private) 15. Military vehicles 16. Other public vehicles 2
14. MANNER OF COLLISION InjuryFatalAll
1. Head-on 12. Rear end 210 1303. Angle 243 1 1034. Sideswipe-meeting 15. Sideswipe-overtaking 46 166. Backed into 14 37. Other 6 3Totals 521 1 255
11. Count of vehicles, including properly parked vehicles.
Totals include participant records where gender was coded as "unknown".
10. Count of crashes. Crashes with multiple contributing circumstances are counted in all applicable categories.
MULTIPLE VEHICLE CRASHES
7 - 9. Tally of drivers by age, sex, residence & crash severity. Excludes occupants of properly & improperly parked vehicles.
151
Col
lisio
n in
volv
ing:
N
on-
coll.
N
on-
coll.
C
ollis
ion
invo
lvin
g:
Non
- co
ll.
Col
lisio
n in
volv
ing:
3C
. RU
RA
L 3A
. Inc
orpo
rate
d A
reas
3B
. UR
BA
N
SUMMARY OF MOTOR VEHICLE TRAFFIC CRASHES 2006 OREGON CRASHESForIn
1. Primary State Highways 2. Secondary State Highways 3. County and Local Roads 4. City Streets 5. Not Stated Total--Rural Area
NOTE: THIS YEAR TO DATE represents only those crashes entered onto the database as of the date above. SAME PERIOD LAST YEAR represents all crashes including late reports. MAJOR INJURIES are incapacitating injuries. MINOR INJURIES are non-incapacitating evident injuries.
3. LOCATION Total
PropertyDamage
Nonfatal Injury Fatal Property
DamageNonfatal
InjuryFatalTotalPropertyDamage
Nonfatal Injury Fatal Total Killed Injured
Total On Roadway TotalOff Roadway Number Of Crashes Number Of Persons
1. Below 1,000 2. 1,000 to 2,500 3. 2,501 to 5,000 4. 5,001 to 10,000 5. 10,001 to 25,000 6. 25,001 to 50,000 7. 50,001 to 100,000 8. 100,001 to 200,000 9. City of Portland Only Total - Municipalities
8 1,053
1,053 8
478 567
478 567
7 435 514 956
7 435 514 956
1 43 53 97
1 43 53 97
723 8
723 8
32 3 5 8 22 17 39 25 22 47 1. Primary State Highways 2. Secondary State Highways 3. County and Local Roads
691 8 50 38 1 89 492 418 7 917 542 456 8 1,006 4. City Streets 5. Not Stated Total--Urban Area 723853 43 1 975144357956567 478 8 1,053 6. Interstate System 17 8 9 12 5 7 5 3 2 127. Other State Freeways 8. Other State Highways 30 14 16 27 12 15 3 2 1 20Total--Urban System 47 22 25 39 17 22 8 5 3 32
6. Interstate System 7. Other State Freeways 8. Other State Highways Total--Rural System
June 1, 2007
GRESHAM
152
At I
nter
sect
ion
Not
at I
nter
sect
ion
At
Inte
r. N
on -I
nter
.
GRESHAM 2006 OREGON CRASHES
4. AGE OF CASUALTY
Number of Persons Killed Number of Persons Injured Total Killed Pedestrians Pedalcyclist Total Injured Pedestrians Pedalcyclist
Total Total Total Total Total TotalMale Male Male Male Male MaleFemale Female Female Female Female Female1. 0 to 4 2 2 8 6 14 1 1 1 1 2. 5 to 9 3 1 4 3 5 26 31 1 1 33. 10 to 14 4 1 7 2 2 18 17 35 64. 15 to 19 7 4 4 3 52 48 100 45. 20 to 24 5 1 3 2 52 41 93 2 2 16. 25 to 34 5 3 5 2 3 76 64 140 1 1 27. 35 to 44 1 2 1 57 52 109 28. 45 to 54 2 1 4 1 1 56 28 84 3 2 1 1 1 39. 55 to 64 2 1 1 1 24 30 54 110. 65 to 74 13 9 2211. 75 & older 9 14 2312. Not-stated 2 1 4 2 7 8 18 3Totals 8 7 1 1 1 1 1 723 343 377 33 18 15 32 25 7
Directional Analysis - A crash consisting of a series of collisions, overturning, etc., is classified according to the first damage or injury producing event; includes on roadway and off roadway.5A. MULTIPLE VEH CRASH Total Fatal Injury P.D.O.
Junction1. Car go straight 17 1 1 16 5 112. Car turning right 5 5 4 13. Car turning left 7 7 5 24. Car backing5. All others 1 1 1Totals 30 1 1 29 14 15
5D. ALL OTHER CRASHES Total Fatal Injury P.D.O.Coll-isionWith
Coll-isionWith
1. Other rd veh or railway train 1 21 22 2. Fixed object 6 4 10 3. Other object or animal4. Overturning5. Other noncollision 1 1 6. Other rd veh or railway train 10 1 11 7. Fixed object 31 19 1 51 8. Other object or animal 3 1 4 9. Overturning 4 4 10. Other noncollision 2 2 11. Not statedTotals 4359 3 105
6. PEDESTRIAN ACTION BY AGE
Ages of Pedstrians Killed and InjuredPedestrians Killed Total 0 to 4 5 to 9 10 to 14 15 to 19 20 to 24 25 to 44 45 to 64 65 & older Not stated
1a. X-ing at intersect or X-walk 3 4 4 3 3 2 19 1b. X-ing not at intersection 1 1 2 1 3 1 2 1 12 1 2a. Walking in road with traffic 2b. Same against traffic 3. Standing in roadway 4. Push or work on veh in road 5. Other working in roadway 6. Playing in roadway 1 1 7. Other in roadway 8. Not in roadway 1 1 2 9. Not stated
2 4 65743 3 34 1 Totals
7. AGE OF DRIVER All Crashes Fatal Injury 1. 14 & younger 2. 15 4 1 3. 16 36 16 4. 17 65 32 5. 18 71 1 32 6. 19 61 37 7. 20 55 1 24 8. 21 65 33 9. 22 to 24 145 2 73 10. 25 to 34 344 4 194 11. 35 to 44 319 3 163 12. 45 to 54 307 1 135 13. 55 to 64 181 102 14. 65 to 74 105 42 15. 75 & older 66 30 16. Not stated 243 27 Totals 2,067 12 941 8. SEX OF DRIVER Injury Fatal All Crashes
1. Male 1,112 9 482 2. Female 896 3 444 3. Not stated 59 15 Totals 2,067 12 941
9. RESIDENCE OF DRIVER All Crashes Fatal Injury
1. Local resident 1,807 10 858 2. In-state resident 48 1 24 3. Non resident 79 1 34 4. Not stated 133 25 Totals 2,067 12 941
10. CRASHES BY CONTRIBUTING FACTOR All InjuryFatal1. Speed too fast
201 3 4
40 4
7. Followed too closely 404
1 2
6 5
77 12
6. Improper overtaking5. Drove left of center4. Disregard traffic signal3. Passed stop sign2. Failed to yield 281 2 130
48 3 99
8. Made improper turn
Totals 1,259 13 588 64
3 53 25 13
4
1
149 7
135 38 46
12. Other 11. Mechanical defect10. Improper driving9. Had been drinking
12. ROAD SURFACECONDITION InjuryFatalAll
1. Dry 726 5 3282. Wet 285 1 1473. Snowy or icy 19 14. Other 5. Not stated 23 2 2Totals 1,053 8 478
13. LIGHT CONDITION InjuryFatalAll1. Daylight 764 3 3452. Dawn or Dusk 37 143. Darkness 247 4 1184. Not stated 5 1 1Totals 1,053 8 478
11. VEHICLE TYPE InjuryFatalAll1. Passenger car 2,043 9 9262. Pass Car and trailer 10 73. Truck or truck tractor 8 1 24. Truck tractor with semi-trailer 10 1 35. Other truck combination 16. Farm tractor and/or equip. 7. Taxicab8. Bus 5 19. School bus 10 510. Motorcycle 13 1 911. Motor scooter or moped 2 112. Others and not stated 5Totals 2,107 12 954Special vehicles included above 13. Log trucks14. Emergency (incl. private) 13 2 215. Military vehicles 116. Other public vehicles 19 9
14. MANNER OF COLLISION InjuryFatalAll
1. Head-on 12 82. Rear end 430 2193. Angle 375 3 1454. Sideswipe-meeting 9 55. Sideswipe-overtaking 63 1 116. Backed into 24 17. Other 5 1Totals 918 4 390
11. Count of vehicles, including properly parked vehicles.
Totals include participant records where gender was coded as "unknown".
10. Count of crashes. Crashes with multiple contributing circumstances are counted in all applicable categories.
MULTIPLE VEHICLE CRASHES
7 - 9. Tally of drivers by age, sex, residence & crash severity. Excludes occupants of properly & improperly parked vehicles.
153
Col
lisio
n in
volv
ing:
N
on-
coll.
N
on-
coll.
C
ollis
ion
invo
lvin
g:
Non
- co
ll.
Col
lisio
n in
volv
ing:
3C
. RU
RA
L 3A
. Inc
orpo
rate
d A
reas
3B
. UR
BA
N
SUMMARY OF MOTOR VEHICLE TRAFFIC CRASHES 2006 OREGON CRASHESForIn
1. Primary State Highways 2. Secondary State Highways 3. County and Local Roads 4. City Streets 5. Not Stated Total--Rural Area
NOTE: THIS YEAR TO DATE represents only those crashes entered onto the database as of the date above. SAME PERIOD LAST YEAR represents all crashes including late reports. MAJOR INJURIES are incapacitating injuries. MINOR INJURIES are non-incapacitating evident injuries.
3. LOCATION Total
PropertyDamage
Nonfatal Injury Fatal Property
DamageNonfatal
InjuryFatalTotalPropertyDamage
Nonfatal Injury Fatal Total Killed Injured
Total On Roadway TotalOff Roadway Number Of Crashes Number Of Persons
1. Below 1,000 2. 1,000 to 2,500 3. 2,501 to 5,000 4. 5,001 to 10,000 5. 10,001 to 25,000 6. 25,001 to 50,000 7. 50,001 to 100,000 8. 100,001 to 200,000 9. City of Portland Only Total - Municipalities
3. County and Local Roads 29 2 3 5 22 20 42 24 23 47 4. City Streets
5. Not Stated Total--Urban Area 633 4 754429657 46 103 6. Interstate System 7. Other State Freeways 8. Other State Highways 56 23 33 54 22 32 2 1 1 34Total--Urban System 56 23 33 54 22 32 2 1 1 34
6. Interstate System 7. Other State Freeways 8. Other State Highways Total--Rural System
June 1, 2007
HERMISTON
154
At I
nter
sect
ion
Not
at I
nter
sect
ion
At
Inte
r. N
on -I
nter
.
HERMISTON 2006 OREGON CRASHES
4. AGE OF CASUALTY
Number of Persons Killed Number of Persons Injured Total Killed Pedestrians Pedalcyclist Total Injured Pedestrians Pedalcyclist
Total Total Total Total Total TotalMale Male Male Male Male MaleFemale Female Female Female Female Female1. 0 to 4 1 12. 5 to 9 1 13. 10 to 14 2 1 1 1 5 64. 15 to 19 1 8 3 11 15. 20 to 24 1 1 7 4 116. 25 to 34 4 3 77. 35 to 44 5 5 108. 45 to 54 5 2 79. 55 to 64 3 1 410. 65 to 74 4 1 511. 75 & older 12. Not-stated Totals 63 26 37 3 2 1 1 1
Directional Analysis - A crash consisting of a series of collisions, overturning, etc., is classified according to the first damage or injury producing event; includes on roadway and off roadway.5A. MULTIPLE VEH CRASH Total Fatal Injury P.D.O.
5B. MULTIPLE VEH CRASH Total Fatal Injury P.D.O. 2 21. Moving in opposite dir. 4 3 72. Both moving in same dir. 1 1 23a. One car parked 6 5 113b. One car stopped in traffic 1 1 24. Enter/Leave parked pos. 3 35a. Entering driveway/alley 4 4 85b. Leaving driveway/alley 3 2 56. All others
Totals 24 16 40
5C. PEDESTRIANCRASHES
All PedCrashes
Fatal Crashes Non-Fatal Injury Crashes
TotalAt
Intersection Non-
Junction TotalAt
IntersectionNon-
Junction1. Car go straight 3 3 2 12. Car turning right3. Car turning left 4. Car backing 5. All othersTotals 3 3 2 1
5D. ALL OTHER CRASHES Total Fatal Injury P.D.O.Coll-isionWith
Coll-isionWith
1. Other rd veh or railway train2. Fixed object 1 1 3. Other object or animal4. Overturning 5. Other noncollision6. Other rd veh or railway train 1 1 7. Fixed object 1 1 8. Other object or animal9. Overturning 1 1 10. Other noncollision11. Not statedTotals 4 4
6. PEDESTRIAN ACTION BY AGE
Ages of Pedstrians Killed and InjuredPedestrians Killed Total 0 to 4 5 to 9 10 to 14 15 to 19 20 to 24 25 to 44 45 to 64 65 & older Not stated
1a. X-ing at intersect or X-walk 1 1 2 1b. X-ing not at intersection 1 1 2a. Walking in road with traffic 2b. Same against traffic 3. Standing in roadway 4. Push or work on veh in road 5. Other working in roadway 6. Playing in roadway 7. Other in roadway 8. Not in roadway 9. Not stated
12 3 Totals
7. AGE OF DRIVER All Crashes Fatal Injury 1. 14 & younger 2. 15 3. 16 3 1 4. 17 8 4 5. 18 5 2 6. 19 8 4 7. 20 6 5 8. 21 2 1 9. 22 to 24 15 8 10. 25 to 34 37 15 11. 35 to 44 30 15 12. 45 to 54 30 11 13. 55 to 64 18 7 14. 65 to 74 17 12 15. 75 & older 8 2 16. Not stated 18 3 Totals 205 90 8. SEX OF DRIVER Injury Fatal All Crashes
1. Male 95 46 2. Female 102 42 3. Not stated 8 2 Totals 205 90
9. RESIDENCE OF DRIVER All Crashes Fatal Injury
1. Local resident 167 75 2. In-state resident 15 6 3. Non resident 13 6 4. Not stated 10 3 Totals 205 90
10. CRASHES BY CONTRIBUTING FACTOR All InjuryFatal1. Speed too fast
7 1
6 3
7. Followed too closely 15 2
11 4
6. Improper overtaking5. Drove left of center4. Disregard traffic signal3. Passed stop sign2. Failed to yield 45 19
3 5
8. Made improper turn
Totals 102 44 2
2
1
5
10
5
12. Other 11. Mechanical defect10. Improper driving9. Had been drinking
12. ROAD SURFACECONDITION InjuryFatalAll
1. Dry 85 392. Wet 16 63. Snowy or icy4. Other 5. Not stated 2 1Totals 103 46
13. LIGHT CONDITION InjuryFatalAll1. Daylight 82 362. Dawn or Dusk 7 13. Darkness 14 94. Not statedTotals 103 46
11. VEHICLE TYPE InjuryFatalAll1. Passenger car 199 892. Pass Car and trailer 13. Truck or truck tractor 4. Truck tractor with semi-trailer 4 15. Other truck combination 6. Farm tractor and/or equip. 17. Taxicab8. Bus 9. School bus 10. Motorcycle 11. Motor scooter or moped 12. Others and not stated 3 1Totals 208 91Special vehicles included above 13. Log trucks14. Emergency (incl. private) 15. Military vehicles 16. Other public vehicles 1 1
14. MANNER OF COLLISION InjuryFatalAll
1. Head-on2. Rear end 25 123. Angle 59 244. Sideswipe-meeting 5. Sideswipe-overtaking 4 16. Backed into 6 17. Other 2 1Totals 96 39
11. Count of vehicles, including properly parked vehicles.
Totals include participant records where gender was coded as "unknown".
10. Count of crashes. Crashes with multiple contributing circumstances are counted in all applicable categories.
MULTIPLE VEHICLE CRASHES
7 - 9. Tally of drivers by age, sex, residence & crash severity. Excludes occupants of properly & improperly parked vehicles.
155
Col
lisio
n in
volv
ing:
N
on-
coll.
N
on-
coll.
C
ollis
ion
invo
lvin
g:
Non
- co
ll.
Col
lisio
n in
volv
ing:
3C
. RU
RA
L 3A
. Inc
orpo
rate
d A
reas
3B
. UR
BA
N
SUMMARY OF MOTOR VEHICLE TRAFFIC CRASHES 2006 OREGON CRASHESForIn
1. Primary State Highways 2. Secondary State Highways 3. County and Local Roads 4. City Streets 5. Not Stated Total--Rural Area
NOTE: THIS YEAR TO DATE represents only those crashes entered onto the database as of the date above. SAME PERIOD LAST YEAR represents all crashes including late reports. MAJOR INJURIES are incapacitating injuries. MINOR INJURIES are non-incapacitating evident injuries.
3. LOCATION Total
PropertyDamage
Nonfatal Injury Fatal Property
DamageNonfatal
InjuryFatalTotalPropertyDamage
Nonfatal Injury Fatal Total Killed Injured
Total On Roadway TotalOff Roadway Number Of Crashes Number Of Persons
1. Below 1,000 2. 1,000 to 2,500 3. 2,501 to 5,000 4. 5,001 to 10,000 5. 10,001 to 25,000 6. 25,001 to 50,000 7. 50,001 to 100,000 8. 100,001 to 200,000 9. City of Portland Only Total - Municipalities
3. County and Local Roads 537 5 38 43 2 83 364 330 2 696 402 373 4 779 4. City Streets
5. Not Stated Total--Urban Area 782749 52 2 10352148841,013570 540 6 1,116 6. Interstate System 7. Other State Freeways 21 14 7 13 10 3 8 4 4 218. Other State Highways 316 2 153 161 304 148 154 12 5 7 2 224Total--Urban System 337 2 167 168 317 2 158 157 20 9 11 2 245
6. Interstate System 7. Other State Freeways 8. Other State Highways Total--Rural System
June 1, 2007
HILLSBORO
156
At I
nter
sect
ion
Not
at I
nter
sect
ion
At
Inte
r. N
on -I
nter
.
HILLSBORO 2006 OREGON CRASHES
4. AGE OF CASUALTY
Number of Persons Killed Number of Persons Injured Total Killed Pedestrians Pedalcyclist Total Injured Pedestrians Pedalcyclist
Total Total Total Total Total TotalMale Male Male Male Male MaleFemale Female Female Female Female Female1. 0 to 4 4 9 132. 5 to 9 13 6 193. 10 to 14 1 2 1 23 9 32 24. 15 to 19 4 1 7 4 60 47 107 65. 20 to 24 2 2 57 47 104 5 5 6. 25 to 34 6 2 4 89 67 156 1 17. 35 to 44 2 3 2 80 67 147 38. 45 to 54 5 1 3 2 63 40 103 1 1 19. 55 to 64 1 1 2 1 35 23 58 110. 65 to 74 1 1 8 8 1611. 75 & older 12 3 1512. Not-stated 8 4 12Totals 7 5 2 782 330 452 22 14 8 15 13 2
Directional Analysis - A crash consisting of a series of collisions, overturning, etc., is classified according to the first damage or injury producing event; includes on roadway and off roadway.5A. MULTIPLE VEH CRASH Total Fatal Injury P.D.O.
Junction1. Car go straight 7 7 3 42. Car turning right 5 5 4 13. Car turning left 7 7 74. Car backing5. All othersTotals 19 19 14 5
5D. ALL OTHER CRASHES Total Fatal Injury P.D.O.Coll-isionWith
Coll-isionWith
1. Other rd veh or railway train 10 10 2. Fixed object 11 8 1 20 3. Other object or animal4. Overturning 2 2 5. Other noncollision6. Other rd veh or railway train 6 6 7. Fixed object 25 33 1 59 8. Other object or animal 2 2 9. Overturning 5 5 10. Other noncollision11. Not statedTotals 3864 2 104
6. PEDESTRIAN ACTION BY AGE
Ages of Pedstrians Killed and InjuredPedestrians Killed Total 0 to 4 5 to 9 10 to 14 15 to 19 20 to 24 25 to 44 45 to 64 65 & older Not stated
1a. X-ing at intersect or X-walk 1 6 4 2 3 1 17 1b. X-ing not at intersection 3 1 4 2a. Walking in road with traffic 2b. Same against traffic 3. Standing in roadway 4. Push or work on veh in road 5. Other working in roadway 6. Playing in roadway 7. Other in roadway 8. Not in roadway 1 1 9. Not stated
1 6 8241 22 Totals
7. AGE OF DRIVER All Crashes Fatal Injury 1. 14 & younger 2. 15 4 2 3. 16 49 24 4. 17 57 28 5. 18 55 1 34 6. 19 57 36 7. 20 47 28 8. 21 54 29 9. 22 to 24 157 4 81 10. 25 to 34 481 3 241 11. 35 to 44 391 1 213 12. 45 to 54 329 1 168 13. 55 to 64 181 92 14. 65 to 74 81 1 33 15. 75 & older 59 24 16. Not stated 204 34 Totals 2,206 11 1,067 8. SEX OF DRIVER Injury Fatal All Crashes
1. Male 1,160 9 539 2. Female 1,006 2 514 3. Not stated 40 14 Totals 2,206 11 1,067
9. RESIDENCE OF DRIVER All Crashes Fatal Injury
1. Local resident 1,957 10 963 2. In-state resident 80 43 3. Non resident 56 1 30 4. Not stated 113 31 Totals 2,206 11 1,067
10. CRASHES BY CONTRIBUTING FACTOR All InjuryFatal1. Speed too fast
151 3 4
62 5
7. Followed too closely 324
1
11 14
109 12
6. Improper overtaking5. Drove left of center4. Disregard traffic signal3. Passed stop sign2. Failed to yield 237 1 116
122 2 209
8. Made improper turn
Totals 1,273 13 627 94
6 24 19 21
2
3 4
186 9
67 33 62
12. Other 11. Mechanical defect10. Improper driving9. Had been drinking
12. ROAD SURFACECONDITION InjuryFatalAll
1. Dry 798 6 3902. Wet 281 1373. Snowy or icy 21 124. Other 5. Not stated 16 1Totals 1,116 6 540
13. LIGHT CONDITION InjuryFatalAll1. Daylight 806 1 3842. Dawn or Dusk 59 1 233. Darkness 250 4 1334. Not stated 1Totals 1,116 6 540
11. VEHICLE TYPE InjuryFatalAll1. Passenger car 2,144 10 1,0312. Pass Car and trailer 4 23. Truck or truck tractor 11 44. Truck tractor with semi-trailer 14 75. Other truck combination 6. Farm tractor and/or equip. 7. Taxicab 1 18. Bus 6 39. School bus 3 210. Motorcycle 17 1 1611. Motor scooter or moped 3 312. Others and not stated 25 6Totals 2,228 11 1,075Special vehicles included above 13. Log trucks14. Emergency (incl. private) 10 615. Military vehicles 16. Other public vehicles 20 8
14. MANNER OF COLLISION InjuryFatalAll
1. Head-on 9 1 42. Rear end 507 2593. Angle 391 2 1754. Sideswipe-meeting 7 35. Sideswipe-overtaking 56 1 136. Backed into 20 27. Other 3 1Totals 993 4 457
11. Count of vehicles, including properly parked vehicles.
Totals include participant records where gender was coded as "unknown".
10. Count of crashes. Crashes with multiple contributing circumstances are counted in all applicable categories.
MULTIPLE VEHICLE CRASHES
7 - 9. Tally of drivers by age, sex, residence & crash severity. Excludes occupants of properly & improperly parked vehicles.
157
Col
lisio
n in
volv
ing:
N
on-
coll.
N
on-
coll.
C
ollis
ion
invo
lvin
g:
Non
- co
ll.
Col
lisio
n in
volv
ing:
3C
. RU
RA
L 3A
. Inc
orpo
rate
d A
reas
3B
. UR
BA
N
SUMMARY OF MOTOR VEHICLE TRAFFIC CRASHES 2006 OREGON CRASHESForIn
1. Primary State Highways 2. Secondary State Highways 3. County and Local Roads 4. City Streets 5. Not Stated Total--Rural Area
NOTE: THIS YEAR TO DATE represents only those crashes entered onto the database as of the date above. SAME PERIOD LAST YEAR represents all crashes including late reports. MAJOR INJURIES are incapacitating injuries. MINOR INJURIES are non-incapacitating evident injuries.
3. LOCATION Total
PropertyDamage
Nonfatal Injury Fatal Property
DamageNonfatal
InjuryFatalTotalPropertyDamage
Nonfatal Injury Fatal Total Killed Injured
Total On Roadway TotalOff Roadway Number Of Crashes Number Of Persons
1. Below 1,000 2. 1,000 to 2,500 3. 2,501 to 5,000 4. 5,001 to 10,000 5. 10,001 to 25,000 6. 25,001 to 50,000 7. 50,001 to 100,000 8. 100,001 to 200,000 9. City of Portland Only Total - Municipalities
193
193
99 94
99 94
90 79 169
90 79 169
9 15 24
9 15 24
151
151
2 1 1 1 1 1. Primary State Highways 2. Secondary State Highways 3. County and Local Roads
149 15 9 24 79 89 168 94 98 192 4. City Streets 5. Not Stated Total--Urban Area 15115 9 24799016994 99 193 6. Interstate System 7. Other State Freeways 8. Other State Highways 1 1 1 1 2Total--Urban System 1 1 1 1 2
6. Interstate System 7. Other State Freeways 8. Other State Highways Total--Rural System
June 1, 2007
KEIZER
158
At I
nter
sect
ion
Not
at I
nter
sect
ion
At
Inte
r. N
on -I
nter
.
KEIZER 2006 OREGON CRASHES
4. AGE OF CASUALTY
Number of Persons Killed Number of Persons Injured Total Killed Pedestrians Pedalcyclist Total Injured Pedestrians Pedalcyclist
Total Total Total Total Total TotalMale Male Male Male Male MaleFemale Female Female Female Female Female1. 0 to 4 4 1 52. 5 to 9 1 2 3 5 13. 10 to 14 1 1 24. 15 to 19 2 3 2 13 7 20 35. 20 to 24 12 11 236. 25 to 34 18 5 237. 35 to 44 16 7 238. 45 to 54 2 2 14 8 229. 55 to 64 8 3 1110. 65 to 74 1 3 4 7 111. 75 & older 1 1 4 5 912. Not-stated 1 1Totals 151 55 96 5 3 2 5 5
Directional Analysis - A crash consisting of a series of collisions, overturning, etc., is classified according to the first damage or injury producing event; includes on roadway and off roadway.5A. MULTIPLE VEH CRASH Total Fatal Injury P.D.O.
Junction1. Car go straight 2 2 22. Car turning right 1 1 13. Car turning left 2 2 24. Car backing5. All othersTotals 5 5 3 2
5D. ALL OTHER CRASHES Total Fatal Injury P.D.O.Coll-isionWith
Coll-isionWith
1. Other rd veh or railway train 3 3 2. Fixed object 1 1 3. Other object or animal4. Overturning 5. Other noncollision6. Other rd veh or railway train 2 2 7. Fixed object 8 7 15 8. Other object or animal 1 1 9. Overturning 1 1 10. Other noncollision11. Not statedTotals 914 23
6. PEDESTRIAN ACTION BY AGE
Ages of Pedstrians Killed and InjuredPedestrians Killed Total 0 to 4 5 to 9 10 to 14 15 to 19 20 to 24 25 to 44 45 to 64 65 & older Not stated
1a. X-ing at intersect or X-walk 1 2 3 1b. X-ing not at intersection 2 2 2a. Walking in road with traffic 2b. Same against traffic 3. Standing in roadway 4. Push or work on veh in road 5. Other working in roadway 6. Playing in roadway 7. Other in roadway 8. Not in roadway 9. Not stated
1 2 2 5 Totals
7. AGE OF DRIVER All Crashes Fatal Injury 1. 14 & younger 2. 15 3. 16 7 2 4. 17 13 3 5. 18 12 7 6. 19 12 7 7. 20 13 8 8. 21 10 7 9. 22 to 24 23 11 10. 25 to 34 72 41 11. 35 to 44 57 33 12. 45 to 54 50 29 13. 55 to 64 36 18 14. 65 to 74 15 9 15. 75 & older 19 12 16. Not stated 27 3 Totals 366 190 8. SEX OF DRIVER Injury Fatal All Crashes
1. Male 172 77 2. Female 188 111 3. Not stated 6 2 Totals 366 190
9. RESIDENCE OF DRIVER All Crashes Fatal Injury
1. Local resident 335 179 2. In-state resident 11 8 3. Non resident 1 1 4. Not stated 19 2 Totals 366 190
10. CRASHES BY CONTRIBUTING FACTOR All InjuryFatal1. Speed too fast
7 1
7 2
7. Followed too closely 25 1 1
12 5
6. Improper overtaking5. Drove left of center4. Disregard traffic signal3. Passed stop sign2. Failed to yield 61 30
43 69
8. Made improper turn
Totals 229 122 22
4 3 3
32
10 8 5
12. Other 11. Mechanical defect10. Improper driving9. Had been drinking
12. ROAD SURFACECONDITION InjuryFatalAll
1. Dry 133 722. Wet 55 273. Snowy or icy4. Other 5. Not stated 5Totals 193 99
13. LIGHT CONDITION InjuryFatalAll1. Daylight 128 662. Dawn or Dusk 20 103. Darkness 44 234. Not stated 1Totals 193 99
11. VEHICLE TYPE InjuryFatalAll1. Passenger car 369 1852. Pass Car and trailer 2 13. Truck or truck tractor 4. Truck tractor with semi-trailer 1 15. Other truck combination 6. Farm tractor and/or equip. 7. Taxicab 8. Bus 9. School bus10. Motorcycle 4 411. Motor scooter or moped 12. Others and not stated Totals 376 191Special vehicles included above 13. Log trucks14. Emergency (incl. private) 15. Military vehicles 16. Other public vehicles
14. MANNER OF COLLISION InjuryFatalAll
1. Head-on 12. Rear end 73 403. Angle 78 394. Sideswipe-meeting 5. Sideswipe-overtaking 4 16. Backed into 87. Other 1Totals 165 80
11. Count of vehicles, including properly parked vehicles.
Totals include participant records where gender was coded as "unknown".
10. Count of crashes. Crashes with multiple contributing circumstances are counted in all applicable categories.
MULTIPLE VEHICLE CRASHES
7 - 9. Tally of drivers by age, sex, residence & crash severity. Excludes occupants of properly & improperly parked vehicles.
159
Col
lisio
n in
volv
ing:
N
on-
coll.
N
on-
coll.
C
ollis
ion
invo
lvin
g:
Non
- co
ll.
Col
lisio
n in
volv
ing:
3C
. RU
RA
L 3A
. Inc
orpo
rate
d A
reas
3B
. UR
BA
N
SUMMARY OF MOTOR VEHICLE TRAFFIC CRASHES 2006 OREGON CRASHESForIn
1. Primary State Highways 2. Secondary State Highways 3. County and Local Roads 4. City Streets 5. Not Stated Total--Rural Area
NOTE: THIS YEAR TO DATE represents only those crashes entered onto the database as of the date above. SAME PERIOD LAST YEAR represents all crashes including late reports. MAJOR INJURIES are incapacitating injuries. MINOR INJURIES are non-incapacitating evident injuries.
3. LOCATION Total
PropertyDamage
Nonfatal Injury Fatal Property
DamageNonfatal
InjuryFatalTotalPropertyDamage
Nonfatal Injury Fatal Total Killed Injured
Total On Roadway TotalOff Roadway Number Of Crashes Number Of Persons
1. Below 1,000 2. 1,000 to 2,500 3. 2,501 to 5,000 4. 5,001 to 10,000 5. 10,001 to 25,000 6. 25,001 to 50,000 7. 50,001 to 100,000 8. 100,001 to 200,000 9. City of Portland Only Total - Municipalities
3. County and Local Roads 101 2 18 9 27 99 59 2 160 117 68 2 187 4. City Streets
5. Not Stated Total--Urban Area 117326 11 37118713192144 82 3 229 6. Interstate System 7. Other State Freeways 8. Other State Highways 42 1 14 27 32 12 19 10 2 8 1 16Total--Urban System 42 1 14 27 32 1 12 19 10 2 8 1 16
6. Interstate System 7. Other State Freeways 8. Other State Highways Total--Rural System
June 1, 2007
KLAMATH FALLS
160
At I
nter
sect
ion
Not
at I
nter
sect
ion
At
Inte
r. N
on -I
nter
.
KLAMATH FALLS 2006 OREGON CRASHES
4. AGE OF CASUALTY
Number of Persons Killed Number of Persons Injured Total Killed Pedestrians Pedalcyclist Total Injured Pedestrians Pedalcyclist
Total Total Total Total Total TotalMale Male Male Male Male MaleFemale Female Female Female Female Female1. 0 to 4 2 22. 5 to 9 2 1 33. 10 to 14 2 3 4 7 24. 15 to 19 2 1 1 2 12 6 185. 20 to 24 9 6 15 1 1 1 1 6. 25 to 34 9 5 147. 35 to 44 1 1 13 5 188. 45 to 54 1 1 16 2 18 1 1 1 19. 55 to 64 6 6 1210. 65 to 74 2 1 3 1 111. 75 & older 3 312. Not-stated 1 2 2 4 1Totals 3 1 2 1 1 1 1 117 43 74 4 1 3 4 3 1
Directional Analysis - A crash consisting of a series of collisions, overturning, etc., is classified according to the first damage or injury producing event; includes on roadway and off roadway.5A. MULTIPLE VEH CRASH Total Fatal Injury P.D.O.
5B. MULTIPLE VEH CRASH Total Fatal Injury P.D.O. 5 1 61. Moving in opposite dir.
11 3 142. Both moving in same dir. 7 5 123a. One car parked
21 10 1 323b. One car stopped in traffic 5 54. Enter/Leave parked pos. 1 1 25a. Entering driveway/alley 6 4 105b. Leaving driveway/alley 2 1 36. All others
Totals 58 25 1 84
5C. PEDESTRIANCRASHES
All PedCrashes
Fatal Crashes Non-Fatal Injury Crashes
TotalAt
Intersection Non-
Junction TotalAt
IntersectionNon-
Junction1. Car go straight 3 1 1 2 22. Car turning right3. Car turning left 2 2 24. Car backing5. All othersTotals 5 1 1 4 4
5D. ALL OTHER CRASHES Total Fatal Injury P.D.O.Coll-isionWith
Coll-isionWith
1. Other rd veh or railway train 1 1 2 2. Fixed object 2 2 3. Other object or animal4. Overturning5. Other noncollision 1 1 6. Other rd veh or railway train 2 2 7. Fixed object 10 7 17 8. Other object or animal 1 1 9. Overturning 1 1 10. Other noncollision11. Not statedTotals 1312 1 26
6. PEDESTRIAN ACTION BY AGE
Ages of Pedstrians Killed and InjuredPedestrians Killed Total 0 to 4 5 to 9 10 to 14 15 to 19 20 to 24 25 to 44 45 to 64 65 & older Not stated
1a. X-ing at intersect or X-walk 1 1 2 4 1b. X-ing not at intersection 2a. Walking in road with traffic 2b. Same against traffic 3. Standing in roadway 4. Push or work on veh in road 5. Other working in roadway 6. Playing in roadway 7. Other in roadway 1 1 1 8. Not in roadway 9. Not stated
1 112 5 1 Totals
7. AGE OF DRIVER All Crashes Fatal Injury 1. 14 & younger 2. 15 1 1 3. 16 11 6 4. 17 14 5 5. 18 13 2 6. 19 20 6 7. 20 16 1 5 8. 21 7 1 9. 22 to 24 22 9 10. 25 to 34 52 19 11. 35 to 44 59 26 12. 45 to 54 70 1 29 13. 55 to 64 53 20 14. 65 to 74 29 1 11 15. 75 & older 17 4 16. Not stated 29 4 Totals 413 4 147 8. SEX OF DRIVER Injury Fatal All Crashes
1. Male 207 2 68 2. Female 202 2 77 3. Not stated 4 2 Totals 413 4 147
9. RESIDENCE OF DRIVER All Crashes Fatal Injury
1. Local resident 361 3 132 2. In-state resident 20 1 5 3. Non resident 21 6 4. Not stated 11 4 Totals 413 4 147
10. CRASHES BY CONTRIBUTING FACTOR All InjuryFatal1. Speed too fast
21 1 1 7 4
7. Followed too closely 48 1
1
2 2
15 8
6. Improper overtaking5. Drove left of center4. Disregard traffic signal3. Passed stop sign2. Failed to yield 60 23
8 26
8. Made improper turn
Totals 264 3 101 13
12 7 4
1
37 1
43 10 12
12. Other 11. Mechanical defect10. Improper driving9. Had been drinking
12. ROAD SURFACECONDITION InjuryFatalAll
1. Dry 161 3 682. Wet 26 53. Snowy or icy 42 94. Other 5. Not statedTotals 229 3 82
13. LIGHT CONDITION InjuryFatalAll1. Daylight 172 1 602. Dawn or Dusk3. Darkness 57 2 224. Not statedTotals 229 3 82
11. VEHICLE TYPE InjuryFatalAll1. Passenger car 422 4 1482. Pass Car and trailer 13. Truck or truck tractor 44. Truck tractor with semi-trailer 5 15. Other truck combination 6. Farm tractor and/or equip. 7. Taxicab 1 18. Bus9. School bus 2 210. Motorcycle 3 311. Motor scooter or moped 12. Others and not stated Totals 438 4 155Special vehicles included above 13. Log trucks14. Emergency (incl. private) 115. Military vehicles 16. Other public vehicles 4 2
14. MANNER OF COLLISION InjuryFatalAll
1. Head-on 3 12. Rear end 74 1 273. Angle 94 324. Sideswipe-meeting 3 15. Sideswipe-overtaking 13 46. Backed into 10 17. Other 1Totals 198 1 66
11. Count of vehicles, including properly parked vehicles.
Totals include participant records where gender was coded as "unknown".
10. Count of crashes. Crashes with multiple contributing circumstances are counted in all applicable categories.
MULTIPLE VEHICLE CRASHES
7 - 9. Tally of drivers by age, sex, residence & crash severity. Excludes occupants of properly & improperly parked vehicles.
161
Col
lisio
n in
volv
ing:
N
on-
coll.
N
on-
coll.
C
ollis
ion
invo
lvin
g:
Non
- co
ll.
Col
lisio
n in
volv
ing:
3C
. RU
RA
L 3A
. Inc
orpo
rate
d A
reas
3B
. UR
BA
N
SUMMARY OF MOTOR VEHICLE TRAFFIC CRASHES 2006 OREGON CRASHESForIn
This summary includes reports andinformation available on:
Report published by:
CRASH ANALYSIS AND REPORTING
1B. TYPE OF MOTOR VEHICLE CRASH
Number Of PersonsTotal Killed Total Injured Major Injuries Minor Injuries Possible Injuries No Injury
1. Overturning 2. Other noncollision 3. Pedestrian 1 1 14. MV in transport 17 1 8 8 1615. MV on other roadway 6. Parked MV 1 1 27. Railway train 8. Pedalcyclist 2 1 1 29. Animal 10. Fixed object 311. Other object 1 112. Totals 22 2 12 8 169
2B. MILEAGE RATES ThisYearTo
Date
LastYearSamePeriod
PercentChange
1. Motor vehicle traffic deaths 2. Estimated vehicle miles traveled (in millions)
3. Death rate per 100 million vehicle miles 4. Fatal crash rate per 100 million vehicle miles
5. Crash rate per million vehicle miles 6. Fatal crashes
2A. TYPE OF MOTOR VEHICLE CRASH
Total On Roadway This Year To Date This Year To Date Same Period Last Year Same Period Last Year
All Crashes
Persons Killed
Persons Injured
AllCrashes
AllCrashes
AllCrashes
PersonsKilled
PersonsKilled
PersonsKilled
PersonsInjured
Persons Injured
PersonsInjured
1. Overturning 2. Other noncollision
1 1 1 1 3. Pedestrian 23 61 17 65 23 61 17 65 4. MV in transport
5. MV on other roadway 7 1 3 6. Parked MV
7. Railway train 1 1 2 2 1 1 2 2 8. Pedalcyclist
9. Animal 1 3 10. Fixed object
1 1 11. Other object 12.
24 62 20 68 24 70 22 75 Totals
1. Primary State Highways 2. Secondary State Highways 3. County and Local Roads 4. City Streets 5. Not Stated Total--Rural Area
NOTE: THIS YEAR TO DATE represents only those crashes entered onto the database as of the date above. SAME PERIOD LAST YEAR represents all crashes including late reports. MAJOR INJURIES are incapacitating injuries. MINOR INJURIES are non-incapacitating evident injuries.
3. LOCATION Total
PropertyDamage
Nonfatal Injury Fatal Property
DamageNonfatal
InjuryFatalTotalPropertyDamage
Nonfatal Injury Fatal Total Killed Injured
Total On Roadway TotalOff Roadway Number Of Crashes Number Of Persons
1. Below 1,000 2. 1,000 to 2,500 3. 2,501 to 5,000 4. 5,001 to 10,000 5. 10,001 to 25,000 6. 25,001 to 50,000 7. 50,001 to 100,000 8. 100,001 to 200,000 9. City of Portland Only Total - Municipalities
75
75
17 58
17 58
15 53 68
15 53 68
2 5 7
2 5 7
22
22
8 3 1 4 15 5 20 18 6 24 1. Primary State Highways 2. Secondary State Highways 3. County and Local Roads
14 2 1 3 38 10 48 40 11 51 4. City Streets 5. Not Stated Total--Urban Area 225 2 753156858 17 75 6. Interstate System 2 2 2 27. Other State Freeways 8. Other State Highways 22 6 16 20 5 15 2 1 1 8Total--Urban System 24 6 18 20 5 15 4 1 3 8
6. Interstate System 7. Other State Freeways 8. Other State Highways Total--Rural System
June 1, 2007
LA GRANDE
162
At I
nter
sect
ion
Not
at I
nter
sect
ion
At
Inte
r. N
on -I
nter
.
LA GRANDE 2006 OREGON CRASHES
4. AGE OF CASUALTY
Number of Persons Killed Number of Persons Injured Total Killed Pedestrians Pedalcyclist Total Injured Pedestrians Pedalcyclist
Total Total Total Total Total TotalMale Male Male Male Male MaleFemale Female Female Female Female Female1. 0 to 4 2. 5 to 9 3. 10 to 14 1 2 1 3 3 24. 15 to 19 5 2 75. 20 to 24 6. 25 to 34 1 1 27. 35 to 44 1 18. 45 to 54 3 3 69. 55 to 64 1 1 210. 65 to 74 11. 75 & older 1 112. Not-stated Totals 22 10 12 1 1 2 2
Directional Analysis - A crash consisting of a series of collisions, overturning, etc., is classified according to the first damage or injury producing event; includes on roadway and off roadway.5A. MULTIPLE VEH CRASH Total Fatal Injury P.D.O.
5B. MULTIPLE VEH CRASH Total Fatal Injury P.D.O. 6 1 71. Moving in opposite dir. 2 22. Both moving in same dir. 2 1 33a. One car parked 8 2 103b. One car stopped in traffic 1 1 24. Enter/Leave parked pos. 1 15a. Entering driveway/alley 5 1 65b. Leaving driveway/alley 1 16. All others
Totals 26 6 32
5C. PEDESTRIANCRASHES
All PedCrashes
Fatal Crashes Non-Fatal Injury Crashes
TotalAt
Intersection Non-
Junction TotalAt
IntersectionNon-
Junction1. Car go straight 2. Car turning right 3. Car turning left 1 1 14. Car backing5. All othersTotals 1 1 1
5D. ALL OTHER CRASHES Total Fatal Injury P.D.O.Coll-isionWith
Coll-isionWith
1. Other rd veh or railway train 2 2 2. Fixed object3. Other object or animal 4. Overturning 5. Other noncollision 6. Other rd veh or railway train7. Fixed object 3 3 8. Other object or animal 1 1 9. Overturning10. Other noncollision 11. Not statedTotals 33 6
6. PEDESTRIAN ACTION BY AGE
Ages of Pedstrians Killed and InjuredPedestrians Killed Total 0 to 4 5 to 9 10 to 14 15 to 19 20 to 24 25 to 44 45 to 64 65 & older Not stated
1a. X-ing at intersect or X-walk 1 1 1b. X-ing not at intersection 2a. Walking in road with traffic 2b. Same against traffic 3. Standing in roadway 4. Push or work on veh in road 5. Other working in roadway 6. Playing in roadway 7. Other in roadway 8. Not in roadway 9. Not stated
1 1 Totals
7. AGE OF DRIVER All Crashes Fatal Injury 1. 14 & younger 2. 15 1 3. 16 3 2 4. 17 7 1 5. 18 6 1 6. 19 7 4 7. 20 5 8. 21 2 1 9. 22 to 24 8 1 10. 25 to 34 18 4 11. 35 to 44 13 1 12. 45 to 54 28 8 13. 55 to 64 13 3 14. 65 to 74 9 1 15. 75 & older 5 2 16. Not stated 16 Totals 141 29 8. SEX OF DRIVER Injury Fatal All Crashes
1. Male 71 12 2. Female 70 17 3. Not stated Totals 141 29
9. RESIDENCE OF DRIVER All Crashes Fatal Injury
1. Local resident 132 29 2. In-state resident 2 0 3. Non resident 5 0 4. Not stated 2 0 Totals 141 29
10. CRASHES BY CONTRIBUTING FACTOR All InjuryFatal1. Speed too fast
1
1 2 1
7. Followed too closely 2 1 3 5 6
6. Improper overtaking5. Drove left of center4. Disregard traffic signal3. Passed stop sign2. Failed to yield 31 5
5 21
8. Made improper turn
Totals 85 21 1
5
1
14
1
12. Other 11. Mechanical defect10. Improper driving9. Had been drinking
12. ROAD SURFACECONDITION InjuryFatalAll
1. Dry 54 142. Wet 8 23. Snowy or icy 13 14. Other 5. Not statedTotals 75 17
13. LIGHT CONDITION InjuryFatalAll1. Daylight 58 142. Dawn or Dusk 4 13. Darkness 13 24. Not statedTotals 75 17
11. VEHICLE TYPE InjuryFatalAll1. Passenger car 140 302. Pass Car and trailer 3. Truck or truck tractor 24. Truck tractor with semi-trailer 25. Other truck combination 16. Farm tractor and/or equip. 7. Taxicab8. Bus 9. School bus 10. Motorcycle 11. Motor scooter or moped 12. Others and not stated Totals 145 30Special vehicles included above 13. Log trucks14. Emergency (incl. private) 1 115. Military vehicles 16. Other public vehicles
14. MANNER OF COLLISION InjuryFatalAll
1. Head-on 1 12. Rear end 10 33. Angle 41 54. Sideswipe-meeting 5 25. Sideswipe-overtaking 4 16. Backed into 57. Other 2 1Totals 68 13
11. Count of vehicles, including properly parked vehicles.
Totals include participant records where gender was coded as "unknown".
10. Count of crashes. Crashes with multiple contributing circumstances are counted in all applicable categories.
MULTIPLE VEHICLE CRASHES
7 - 9. Tally of drivers by age, sex, residence & crash severity. Excludes occupants of properly & improperly parked vehicles.
163
Col
lisio
n in
volv
ing:
N
on-
coll.
N
on-
coll.
C
ollis
ion
invo
lvin
g:
Non
- co
ll.
Col
lisio
n in
volv
ing:
3C
. RU
RA
L 3A
. Inc
orpo
rate
d A
reas
3B
. UR
BA
N
SUMMARY OF MOTOR VEHICLE TRAFFIC CRASHES 2006 OREGON CRASHESForIn
1. Primary State Highways 2. Secondary State Highways 3. County and Local Roads 4. City Streets 5. Not Stated Total--Rural Area
NOTE: THIS YEAR TO DATE represents only those crashes entered onto the database as of the date above. SAME PERIOD LAST YEAR represents all crashes including late reports. MAJOR INJURIES are incapacitating injuries. MINOR INJURIES are non-incapacitating evident injuries.
3. LOCATION Total
PropertyDamage
Nonfatal Injury Fatal Property
DamageNonfatal
InjuryFatalTotalPropertyDamage
Nonfatal Injury Fatal Total Killed Injured
Total On Roadway TotalOff Roadway Number Of Crashes Number Of Persons
1. Below 1,000 2. 1,000 to 2,500 3. 2,501 to 5,000 4. 5,001 to 10,000 5. 10,001 to 25,000 6. 25,001 to 50,000 7. 50,001 to 100,000 8. 100,001 to 200,000 9. City of Portland Only Total - Municipalities
3. County and Local Roads 98 20 7 27 95 69 164 115 76 191 4. City Streets
5. Not Stated Total--Urban Area 12126 9 3511484198140 93 233 6. Interstate System 2 2 2 27. Other State Freeways 5 1 4 5 1 4 28. Other State Highways 35 16 19 29 14 15 6 2 4 21Total--Urban System 42 17 25 34 15 19 8 2 6 23
6. Interstate System 7. Other State Freeways 8. Other State Highways Total--Rural System
June 1, 2007
LAKE OSWEGO
164
At I
nter
sect
ion
Not
at I
nter
sect
ion
At
Inte
r. N
on -I
nter
.
LAKE OSWEGO 2006 OREGON CRASHES
4. AGE OF CASUALTY
Number of Persons Killed Number of Persons Injured Total Killed Pedestrians Pedalcyclist Total Injured Pedestrians Pedalcyclist
Total Total Total Total Total TotalMale Male Male Male Male MaleFemale Female Female Female Female Female1. 0 to 4 2. 5 to 9 1 2 1 3 13. 10 to 14 1 1 3 4 14. 15 to 19 6 5 115. 20 to 24 2 2 8 4 126. 25 to 34 10 9 197. 35 to 44 1 1 1 9 8 17 18. 45 to 54 1 1 11 10 219. 55 to 64 2 1 1 16 7 2310. 65 to 74 2 3 511. 75 & older 1 1 1 3 412. Not-stated 1 1 2 2Totals 121 53 68 7 4 3 4 3 1
Directional Analysis - A crash consisting of a series of collisions, overturning, etc., is classified according to the first damage or injury producing event; includes on roadway and off roadway.5A. MULTIPLE VEH CRASH Total Fatal Injury P.D.O.
Junction1. Car go straight 3 3 32. Car turning right 1 1 13. Car turning left 3 3 2 14. Car backing5. All othersTotals 7 7 3 4
5D. ALL OTHER CRASHES Total Fatal Injury P.D.O.Coll-isionWith
Coll-isionWith
1. Other rd veh or railway train 1 1 2. Fixed object 1 1 3. Other object or animal4. Overturning 5. Other noncollision6. Other rd veh or railway train 3 3 7. Fixed object 20 6 26 8. Other object or animal 2 2 9. Overturning 1 1 2 10. Other noncollision11. Not statedTotals 2411 35
6. PEDESTRIAN ACTION BY AGE
Ages of Pedstrians Killed and InjuredPedestrians Killed Total 0 to 4 5 to 9 10 to 14 15 to 19 20 to 24 25 to 44 45 to 64 65 & older Not stated
1a. X-ing at intersect or X-walk 1 1 1 3 1b. X-ing not at intersection 1 1 2a. Walking in road with traffic 2b. Same against traffic 3. Standing in roadway 4. Push or work on veh in road 5. Other working in roadway 6. Playing in roadway 7. Other in roadway 1 2 3 8. Not in roadway 9. Not stated
1 3 12 7 Totals
7. AGE OF DRIVER All Crashes Fatal Injury 1. 14 & younger 2. 15 3. 16 20 5 4. 17 27 9 5. 18 15 4 6. 19 14 8 7. 20 10 4 8. 21 8 6 9. 22 to 24 27 8 10. 25 to 34 54 24 11. 35 to 44 62 28 12. 45 to 54 65 30 13. 55 to 64 54 31 14. 65 to 74 26 11 15. 75 & older 18 8 16. Not stated 41 2 Totals 441 178 8. SEX OF DRIVER Injury Fatal All Crashes
1. Male 219 90 2. Female 214 87 3. Not stated 8 1 Totals 441 178
9. RESIDENCE OF DRIVER All Crashes Fatal Injury
1. Local resident 407 175 2. In-state resident 3 1 3. Non resident 7 0 4. Not stated 24 2 Totals 441 178
10. CRASHES BY CONTRIBUTING FACTOR All InjuryFatal1. Speed too fast
43
1 6 1
7. Followed too closely 92
1 7 2
6. Improper overtaking5. Drove left of center4. Disregard traffic signal3. Passed stop sign2. Failed to yield 61 23
11 36
8. Made improper turn
Totals 252 105 5 1 1 5 8
17 3
10 8
15
12. Other 11. Mechanical defect10. Improper driving9. Had been drinking
12. ROAD SURFACECONDITION InjuryFatalAll
1. Dry 176 752. Wet 55 183. Snowy or icy4. Other 5. Not stated 2Totals 233 93
13. LIGHT CONDITION InjuryFatalAll1. Daylight 176 742. Dawn or Dusk 4 33. Darkness 53 164. Not statedTotals 233 93
11. VEHICLE TYPE InjuryFatalAll1. Passenger car 436 1782. Pass Car and trailer 33. Truck or truck tractor 34. Truck tractor with semi-trailer 15. Other truck combination 6. Farm tractor and/or equip. 7. Taxicab8. Bus 19. School bus10. Motorcycle 4 411. Motor scooter or moped 12. Others and not stated 2Totals 450 182Special vehicles included above 13. Log trucks14. Emergency (incl. private) 2 215. Military vehicles 16. Other public vehicles 3
1. Primary State Highways 2. Secondary State Highways 3. County and Local Roads 4. City Streets 5. Not Stated Total--Rural Area
NOTE: THIS YEAR TO DATE represents only those crashes entered onto the database as of the date above. SAME PERIOD LAST YEAR represents all crashes including late reports. MAJOR INJURIES are incapacitating injuries. MINOR INJURIES are non-incapacitating evident injuries.
3. LOCATION Total
PropertyDamage
Nonfatal Injury Fatal Property
DamageNonfatal
InjuryFatalTotalPropertyDamage
Nonfatal Injury Fatal Total Killed Injured
Total On Roadway TotalOff Roadway Number Of Crashes Number Of Persons
1. Below 1,000 2. 1,000 to 2,500 3. 2,501 to 5,000 4. 5,001 to 10,000 5. 10,001 to 25,000 6. 25,001 to 50,000 7. 50,001 to 100,000 8. 100,001 to 200,000 9. City of Portland Only Total - Municipalities
3. County and Local Roads 35 1 5 5 25 23 1 49 30 23 1 54 4. City Streets
5. Not Stated Total--Urban Area 7915 2 75550110660 52 1 113 6. Interstate System 7. Other State Freeways 8. Other State Highways 59 29 30 57 27 30 2 2 44Total--Urban System 59 29 30 57 27 30 2 2 44
6. Interstate System 7. Other State Freeways 8. Other State Highways Total--Rural System
June 1, 2007
LEBANON
166
At I
nter
sect
ion
Not
at I
nter
sect
ion
At
Inte
r. N
on -I
nter
.
LEBANON 2006 OREGON CRASHES
4. AGE OF CASUALTY
Number of Persons Killed Number of Persons Injured Total Killed Pedestrians Pedalcyclist Total Injured Pedestrians Pedalcyclist
Total Total Total Total Total TotalMale Male Male Male Male MaleFemale Female Female Female Female Female1. 0 to 4 2. 5 to 9 1 3 3 6 13. 10 to 14 1 1 1 2 2 4 14. 15 to 19 4 2 65. 20 to 24 4 4 86. 25 to 34 1 10 9 19 17. 35 to 44 4 2 68. 45 to 54 5 5 109. 55 to 64 1 1 2 3 5 1 1 10. 65 to 74 5 1 611. 75 & older 5 4 912. Not-stated Totals 1 1 79 35 44 2 1 1 3 3
Directional Analysis - A crash consisting of a series of collisions, overturning, etc., is classified according to the first damage or injury producing event; includes on roadway and off roadway.5A. MULTIPLE VEH CRASH Total Fatal Injury P.D.O.
5B. MULTIPLE VEH CRASH Total Fatal Injury P.D.O. 1 11. Moving in opposite dir.
5 4 92. Both moving in same dir. 4 43a. One car parked 9 10 193b. One car stopped in traffic 3 34. Enter/Leave parked pos. 1 1 25a. Entering driveway/alley 4 3 75b. Leaving driveway/alley 3 2 56. All others
Totals 29 21 50
5C. PEDESTRIANCRASHES
All PedCrashes
Fatal Crashes Non-Fatal Injury Crashes
TotalAt
Intersection Non-
Junction TotalAt
IntersectionNon-
Junction1. Car go straight 1 1 12. Car turning right3. Car turning left 1 1 14. Car backing5. All othersTotals 2 2 1 1
5D. ALL OTHER CRASHES Total Fatal Injury P.D.O.Coll-isionWith
Coll-isionWith
1. Other rd veh or railway train 2 2 2. Fixed object 1 1 3. Other object or animal4. Overturning 5. Other noncollision6. Other rd veh or railway train 1 1 7. Fixed object 1 1 8. Other object or animal9. Overturning 10. Other noncollision 11. Not statedTotals 14 5
6. PEDESTRIAN ACTION BY AGE
Ages of Pedstrians Killed and InjuredPedestrians Killed Total 0 to 4 5 to 9 10 to 14 15 to 19 20 to 24 25 to 44 45 to 64 65 & older Not stated
1a. X-ing at intersect or X-walk 1 1 1b. X-ing not at intersection 1 1 2a. Walking in road with traffic 2b. Same against traffic 3. Standing in roadway 4. Push or work on veh in road 5. Other working in roadway 6. Playing in roadway 7. Other in roadway 8. Not in roadway 9. Not stated
1 1 2 Totals
7. AGE OF DRIVER All Crashes Fatal Injury 1. 14 & younger 2. 15 3. 16 6 2 4. 17 8 3 5. 18 14 2 6. 19 3 1 7. 20 4 2 8. 21 3 3 9. 22 to 24 11 1 6 10. 25 to 34 35 21 11. 35 to 44 28 11 12. 45 to 54 44 24 13. 55 to 64 16 1 9 14. 65 to 74 22 9 15. 75 & older 19 10 16. Not stated 13 1 Totals 226 2 104 8. SEX OF DRIVER Injury Fatal All Crashes
1. Male 119 2 52 2. Female 105 52 3. Not stated 2 Totals 226 2 104
9. RESIDENCE OF DRIVER All Crashes Fatal Injury
1. Local resident 207 2 96 2. In-state resident 11 6 3. Non resident 1 1 4. Not stated 7 1 Totals 226 2 104
10. CRASHES BY CONTRIBUTING FACTOR All InjuryFatal1. Speed too fast
12 1 1 4 2
7. Followed too closely 25
1
1 1 6 6
6. Improper overtaking5. Drove left of center4. Disregard traffic signal3. Passed stop sign2. Failed to yield 39 17
11 1 20
8. Made improper turn
Totals 135 3 61 6
5
2 1
17 1
12 1 6
12. Other 11. Mechanical defect10. Improper driving9. Had been drinking
12. ROAD SURFACECONDITION InjuryFatalAll
1. Dry 79 1 392. Wet 31 133. Snowy or icy4. Other 5. Not stated 3Totals 113 1 52
13. LIGHT CONDITION InjuryFatalAll1. Daylight 97 1 442. Dawn or Dusk 4 23. Darkness 12 64. Not statedTotals 113 1 52
11. VEHICLE TYPE InjuryFatalAll1. Passenger car 226 2 992. Pass Car and trailer 13. Truck or truck tractor 4. Truck tractor with semi-trailer 2 25. Other truck combination 6. Farm tractor and/or equip. 7. Taxicab 8. Bus 9. School bus10. Motorcycle 2 211. Motor scooter or moped 12. Others and not stated Totals 231 2 103Special vehicles included above 13. Log trucks 1 114. Emergency (incl. private) 15. Military vehicles 16. Other public vehicles 2 2
14. MANNER OF COLLISION InjuryFatalAll
1. Head-on2. Rear end 43 213. Angle 54 1 224. Sideswipe-meeting 1 15. Sideswipe-overtaking 3 16. Backed into 3 17. Other 2Totals 106 1 46
11. Count of vehicles, including properly parked vehicles.
Totals include participant records where gender was coded as "unknown".
10. Count of crashes. Crashes with multiple contributing circumstances are counted in all applicable categories.
MULTIPLE VEHICLE CRASHES
7 - 9. Tally of drivers by age, sex, residence & crash severity. Excludes occupants of properly & improperly parked vehicles.
167
Col
lisio
n in
volv
ing:
N
on-
coll.
N
on-
coll.
C
ollis
ion
invo
lvin
g:
Non
- co
ll.
Col
lisio
n in
volv
ing:
3C
. RU
RA
L 3A
. Inc
orpo
rate
d A
reas
3B
. UR
BA
N
SUMMARY OF MOTOR VEHICLE TRAFFIC CRASHES 2006 OREGON CRASHESForIn
1. Primary State Highways 2. Secondary State Highways 3. County and Local Roads 4. City Streets 5. Not Stated Total--Rural Area
NOTE: THIS YEAR TO DATE represents only those crashes entered onto the database as of the date above. SAME PERIOD LAST YEAR represents all crashes including late reports. MAJOR INJURIES are incapacitating injuries. MINOR INJURIES are non-incapacitating evident injuries.
3. LOCATION Total
PropertyDamage
Nonfatal Injury Fatal Property
DamageNonfatal
InjuryFatalTotalPropertyDamage
Nonfatal Injury Fatal Total Killed Injured
Total On Roadway TotalOff Roadway Number Of Crashes Number Of Persons
1. Below 1,000 2. 1,000 to 2,500 3. 2,501 to 5,000 4. 5,001 to 10,000 5. 10,001 to 25,000 6. 25,001 to 50,000 7. 50,001 to 100,000 8. 100,001 to 200,000 9. City of Portland Only Total - Municipalities
3 269
269 3
125 141
125 141
3 114 123 240
3 114 123 240
11 18 29
11 18 29
195 3
195 3
114 3 3 6 69 67 136 72 70 142 1. Primary State Highways 2. Secondary State Highways 3. County and Local Roads
81 3 15 8 23 54 47 3 104 69 55 3 127 4. City Streets 5. Not Stated Total--Urban Area 195318 11 291231143240141 125 3 269 6. Interstate System 7. Other State Freeways 8. Other State Highways 142 70 72 136 67 69 6 3 3 114Total--Urban System 142 70 72 136 67 69 6 3 3 114
6. Interstate System 7. Other State Freeways 8. Other State Highways Total--Rural System
June 1, 2007
MCMINNVILLE
168
At I
nter
sect
ion
Not
at I
nter
sect
ion
At
Inte
r. N
on -I
nter
.
MCMINNVILLE 2006 OREGON CRASHES
4. AGE OF CASUALTY
Number of Persons Killed Number of Persons Injured Total Killed Pedestrians Pedalcyclist Total Injured Pedestrians Pedalcyclist
Total Total Total Total Total TotalMale Male Male Male Male MaleFemale Female Female Female Female Female1. 0 to 4 2 22. 5 to 9 2 1 33. 10 to 14 2 1 3 1 1 5 3 8 24. 15 to 19 2 1 2 21 18 39 15. 20 to 24 12 8 206. 25 to 34 2 17 15 32 27. 35 to 44 1 1 1 11 13 24 18. 45 to 54 17 7 24 2 1 19. 55 to 64 1 12 8 20 110. 65 to 74 1 10 5 15 1 1 1 1 111. 75 & older 5 2 712. Not-stated 1 1Totals 3 1 2 1 1 195 80 115 5 2 3 9 8 1
Directional Analysis - A crash consisting of a series of collisions, overturning, etc., is classified according to the first damage or injury producing event; includes on roadway and off roadway.5A. MULTIPLE VEH CRASH Total Fatal Injury P.D.O.
5B. MULTIPLE VEH CRASH Total Fatal Injury P.D.O. 1 11. Moving in opposite dir.
15 5 202. Both moving in same dir. 9 3 123a. One car parked
18 16 343b. One car stopped in traffic 3 34. Enter/Leave parked pos. 3 35a. Entering driveway/alley 8 1 95b. Leaving driveway/alley 5 6 116. All others
Totals 61 32 93
5C. PEDESTRIANCRASHES
All PedCrashes
Fatal Crashes Non-Fatal Injury Crashes
TotalAt
Intersection Non-
Junction TotalAt
IntersectionNon-
Junction1. Car go straight 2 2 1 12. Car turning right3. Car turning left 1 1 14. Car backing 1 1 15. All othersTotals 4 1 1 3 2 1
5D. ALL OTHER CRASHES Total Fatal Injury P.D.O.Coll-isionWith
Coll-isionWith
1. Other rd veh or railway train 8 8 2. Fixed object3. Other object or animal 4. Overturning 5. Other noncollision6. Other rd veh or railway train 1 1 2 7. Fixed object 4 4 8 8. Other object or animal 1 1 9. Overturning 1 1 10. Other noncollision 1 1 11. Not statedTotals 515 1 21
6. PEDESTRIAN ACTION BY AGE
Ages of Pedstrians Killed and InjuredPedestrians Killed Total 0 to 4 5 to 9 10 to 14 15 to 19 20 to 24 25 to 44 45 to 64 65 & older Not stated
1a. X-ing at intersect or X-walk 1 1 1 3 1 1b. X-ing not at intersection 1 1 2 2a. Walking in road with traffic 2b. Same against traffic 3. Standing in roadway 4. Push or work on veh in road 5. Other working in roadway 6. Playing in roadway 7. Other in roadway 8. Not in roadway 1 1 9. Not stated
1 122 6 1 Totals
7. AGE OF DRIVER All Crashes Fatal Injury 1. 14 & YOUNGER 1 2. 15 1 3. 16 11 2 4. 17 24 11 5. 18 21 12 6. 19 18 10 7. 20 13 3 8. 21 15 6 9. 22 to 24 28 14 10. 25 to 34 85 49 11. 35 to 44 75 2 37 12. 45 to 54 63 2 29 13. 55 to 64 57 30 14. 65 to 74 27 15 15. 75 & older 34 15 16. Not stated 36 5 Totals 509 4 238 8. SEX OF DRIVER Injury Fatal All Crashes
1. Male 257 3 113 2. Female 246 1 124 3. Not stated 6 1 Totals 509 4 238
9. RESIDENCE OF DRIVER All Crashes Fatal Injury
1. Local resident 432 4 204 2. In-state resident 49 27 3. Non resident 11 4 4. Not stated 17 3 Totals 509 4 238
10. CRASHES BY CONTRIBUTING FACTOR All InjuryFatal1. Speed too fast
29
1 15
4
7. Followed too closely 49 3 2
26 9
6. Improper overtaking5. Drove left of center4. Disregard traffic signal3. Passed stop sign2. Failed to yield 100 1 48
3 1 6
8. Made improper turn
Totals 267 4 123 9 2 6 3 3
1 1
26 3
24 6
13
12. Other 11. Mechanical defect10. Improper driving9. Had been drinking
12. ROAD SURFACECONDITION InjuryFatalAll
1. Dry 188 1 852. Wet 67 2 373. Snowy or icy 5 14. Other 5. Not stated 9 2Totals 269 3 125
13. LIGHT CONDITION InjuryFatalAll1. Daylight 209 2 972. Dawn or Dusk 13 63. Darkness 46 1 224. Not stated 1Totals 269 3 125
11. VEHICLE TYPE InjuryFatalAll1. Passenger car 505 5 2372. Pass Car and trailer 4 23. Truck or truck tractor 8 1 24. Truck tractor with semi-trailer 8 25. Other truck combination 6. Farm tractor and/or equip. 7. Taxicab8. Bus 19. School bus 110. Motorcycle 2 211. Motor scooter or moped 12. Others and not stated 4 1 1Totals 533 7 246Special vehicles included above 13. Log trucks 2 114. Emergency (incl. private) 115. Military vehicles 16. Other public vehicles 5 3
14. MANNER OF COLLISION InjuryFatalAll
1. Head-on2. Rear end 82 423. Angle 135 1 594. Sideswipe-meeting 1 15. Sideswipe-overtaking 14 46. Backed into 9 17. Other 3Totals 244 1 107
11. Count of vehicles, including properly parked vehicles.
Totals include participant records where gender was coded as "unknown".
10. Count of crashes. Crashes with multiple contributing circumstances are counted in all applicable categories.
MULTIPLE VEHICLE CRASHES
7 - 9. Tally of drivers by age, sex, residence & crash severity. Excludes occupants of properly & improperly parked vehicles.
169
Col
lisio
n in
volv
ing:
N
on-
coll.
N
on-
coll.
C
ollis
ion
invo
lvin
g:
Non
- co
ll.
Col
lisio
n in
volv
ing:
3C
. RU
RA
L 3A
. Inc
orpo
rate
d A
reas
3B
. UR
BA
N
SUMMARY OF MOTOR VEHICLE TRAFFIC CRASHES 2006 OREGON CRASHESForIn
1. Primary State Highways 2. Secondary State Highways 3. County and Local Roads 4. City Streets 5. Not Stated Total--Rural Area
NOTE: THIS YEAR TO DATE represents only those crashes entered onto the database as of the date above. SAME PERIOD LAST YEAR represents all crashes including late reports. MAJOR INJURIES are incapacitating injuries. MINOR INJURIES are non-incapacitating evident injuries.
3. LOCATION Total
PropertyDamage
Nonfatal Injury Fatal Property
DamageNonfatal
InjuryFatalTotalPropertyDamage
Nonfatal Injury Fatal Total Killed Injured
Total On Roadway TotalOff Roadway Number Of Crashes Number Of Persons
1. Below 1,000 2. 1,000 to 2,500 3. 2,501 to 5,000 4. 5,001 to 10,000 5. 10,001 to 25,000 6. 25,001 to 50,000 7. 50,001 to 100,000 8. 100,001 to 200,000 9. City of Portland Only Total - Municipalities
3. County and Local Roads 575 1 36 33 69 399 361 1 761 435 394 1 830 4. City Streets
5. Not Stated Total--Urban Area 706238 36 1 754704531924508 489 2 999 6. Interstate System 12 1 6 5 6 0 3 3 6 1 3 2 1 67. Other State Freeways 8. Other State Highways 157 89 68 157 89 68 125Total--Urban System 169 1 95 73 163 92 71 6 1 3 2 1 131
6. Interstate System 7. Other State Freeways 8. Other State Highways Total--Rural System
June 1, 2007
MEDFORD
170
At I
nter
sect
ion
Not
at I
nter
sect
ion
At
Inte
r. N
on -I
nter
.
MEDFORD 2006 OREGON CRASHES
4. AGE OF CASUALTY
Number of Persons Killed Number of Persons Injured Total Killed Pedestrians Pedalcyclist Total Injured Pedestrians Pedalcyclist
Total Total Total Total Total TotalMale Male Male Male Male MaleFemale Female Female Female Female Female1. 0 to 4 4 5 92. 5 to 9 2 2 12 13 253. 10 to 14 5 1 2 4 1 19 17 36 14. 15 to 19 1 1 1 60 36 96 15. 20 to 24 1 5 50 40 90 46. 25 to 34 1 2 4 1 67 42 109 27. 35 to 44 6 68 47 115 1 1 1 1 68. 45 to 54 4 1 4 4 57 44 101 39. 55 to 64 33 29 6210. 65 to 74 2 1 1 1 12 11 23 111. 75 & older 14 11 25 1 1 1 1 12. Not-stated 1 1 1 1 3 3 15Totals 2 1 1 2 1 1 706 298 399 16 10 6 24 18 6
Directional Analysis - A crash consisting of a series of collisions, overturning, etc., is classified according to the first damage or injury producing event; includes on roadway and off roadway.5A. MULTIPLE VEH CRASH Total Fatal Injury P.D.O.
5B. MULTIPLE VEH CRASH Total Fatal Injury P.D.O. 15 11 261. Moving in opposite dir. 66 25 912. Both moving in same dir. 10 6 163a. One car parked
121 137 2583b. One car stopped in traffic 4 1 54. Enter/Leave parked pos. 8 4 125a. Entering driveway/alley
43 7 505b. Leaving driveway/alley 12 14 266. All others
Totals 279 205 484
5C. PEDESTRIANCRASHES
All PedCrashes
Fatal Crashes Non-Fatal Injury Crashes
TotalAt
Intersection Non-
Junction TotalAt
IntersectionNon-
Junction1. Car go straight 12 2 2 10 1 92. Car turning right 3 3 2 13. Car turning left 1 1 14. Car backing5. All othersTotals 16 2 2 14 3 11
5D. ALL OTHER CRASHES Total Fatal Injury P.D.O.Coll-isionWith
Coll-isionWith
1. Other rd veh or railway train 8 8 2. Fixed object 4 1 5 3. Other object or animal4. Overturning 1 2 3 5. Other noncollision6. Other rd veh or railway train 16 16 7. Fixed object 19 23 42 8. Other object or animal 1 1 2 9. Overturning 1 1 10. Other noncollision 1 1 11. Not statedTotals 2553 78
6. PEDESTRIAN ACTION BY AGE
Ages of Pedstrians Killed and InjuredPedestrians Killed Total 0 to 4 5 to 9 10 to 14 15 to 19 20 to 24 25 to 44 45 to 64 65 & older Not stated
1a. X-ing at intersect or X-walk 1 1 3 5 1b. X-ing not at intersection 2 4 1 7 1 2a. Walking in road with traffic 2b. Same against traffic 3. Standing in roadway 4. Push or work on veh in road 5. Other working in roadway 6. Playing in roadway 1 1 1 3 7. Other in roadway 8. Not in roadway 1 1 1 3 1 9. Not stated
13 4 2152 18 2 Totals
7. AGE OF DRIVER All Crashes Fatal Injury 1. 14 & YOUNGER 1 1 2. 15 4 2 3. 16 47 28 4. 17 70 44 5. 18 79 41 6. 19 44 26 7. 20 65 39 8. 21 51 25 9. 22 to 24 115 54 10. 25 to 34 328 173 11. 35 to 44 288 164 12. 45 to 54 318 157 13. 55 to 64 224 109 14. 65 to 74 108 45 15. 75 & older 94 1 45 16. Not stated 145 1 21 Totals 1,981 2 974 8. SEX OF DRIVER Injury Fatal All Crashes
1. Male 990 464 2. Female 961 1 501 3. Not stated 30 1 9 Totals 1,981 2 974
9. RESIDENCE OF DRIVER All Crashes Fatal Injury
1. Local resident 1,785 1 905 2. In-state resident 81 37 3. Non resident 46 14 4. Not stated 69 1 18 Totals 1,981 2 974
10. CRASHES BY CONTRIBUTING FACTOR All InjuryFatal1. Speed too fast
170 1 3
58 3
7. Followed too closely 311 8 8
99 7
6. Improper overtaking5. Drove left of center4. Disregard traffic signal3. Passed stop sign2. Failed to yield 252 126
25 40
8. Made improper turn
Totals 1,163 2 584 78
9 69 16 26
1 1
168 12
148 26 84
12. Other 11. Mechanical defect10. Improper driving9. Had been drinking
12. ROAD SURFACECONDITION InjuryFatalAll
1. Dry 800 2 4002. Wet 161 793. Snowy or icy 23 94. Other 5. Not stated 15 1Totals 999 2 489
13. LIGHT CONDITION InjuryFatalAll1. Daylight 804 1 3832. Dawn or Dusk 48 1 223. Darkness 146 834. Not stated 1 1Totals 999 2 489
11. VEHICLE TYPE InjuryFatalAll1. Passenger car 1,947 1 9522. Pass Car and trailer 4 13. Truck or truck tractor 2 14. Truck tractor with semi-trailer 17 1 45. Other truck combination 16. Farm tractor and/or equip. 7. Taxicab 18. Bus 2 19. School bus 2 110. Motorcycle 21 2011. Motor scooter or moped 12. Others and not stated 6Totals 2,003 2 980Special vehicles included above 13. Log trucks14. Emergency (incl. private) 8 315. Military vehicles 16. Other public vehicles 11 4
14. MANNER OF COLLISION InjuryFatalAll
1. Head-on 22. Rear end 396 2173. Angle 400 1844. Sideswipe-meeting 4 15. Sideswipe-overtaking 69 156. Backed into 28 47. Other 6 1Totals 905 422
11. Count of vehicles, including properly parked vehicles.
Totals include participant records where gender was coded as "unknown".
10. Count of crashes. Crashes with multiple contributing circumstances are counted in all applicable categories.
MULTIPLE VEHICLE CRASHES
7 - 9. Tally of drivers by age, sex, residence & crash severity. Excludes occupants of properly & improperly parked vehicles.
171
Col
lisio
n in
volv
ing:
N
on-
coll.
N
on-
coll.
C
ollis
ion
invo
lvin
g:
Non
- co
ll.
Col
lisio
n in
volv
ing:
3C
. RU
RA
L 3A
. Inc
orpo
rate
d A
reas
3B
. UR
BA
N
SUMMARY OF MOTOR VEHICLE TRAFFIC CRASHES 2006 OREGON CRASHESForIn
1. Primary State Highways 2. Secondary State Highways 3. County and Local Roads 4. City Streets 5. Not Stated Total--Rural Area
NOTE: THIS YEAR TO DATE represents only those crashes entered onto the database as of the date above. SAME PERIOD LAST YEAR represents all crashes including late reports. MAJOR INJURIES are incapacitating injuries. MINOR INJURIES are non-incapacitating evident injuries.
3. LOCATION Total
PropertyDamage
Nonfatal Injury Fatal Property
DamageNonfatal
InjuryFatalTotalPropertyDamage
Nonfatal Injury Fatal Total Killed Injured
Total On Roadway TotalOff Roadway Number Of Crashes Number Of Persons
1. Below 1,000 2. 1,000 to 2,500 3. 2,501 to 5,000 4. 5,001 to 10,000 5. 10,001 to 25,000 6. 25,001 to 50,000 7. 50,001 to 100,000 8. 100,001 to 200,000 9. City of Portland Only Total - Municipalities
3. County and Local Roads 85 14 9 23 51 50 101 65 59 124 4. City Streets
5. Not Stated Total--Urban Area 12620 16 368877165108 93 201 6. Interstate System 7. Other State Freeways 34 14 20 29 11 18 5 3 2 178. Other State Highways 43 20 23 35 16 19 8 4 4 24Total--Urban System 77 34 43 64 27 37 13 7 6 41
6. Interstate System 7. Other State Freeways 8. Other State Highways Total--Rural System
June 1, 2007
MILWAUKIE
172
At I
nter
sect
ion
Not
at I
nter
sect
ion
At
Inte
r. N
on -I
nter
.
MILWAUKIE 2006 OREGON CRASHES
4. AGE OF CASUALTY
Number of Persons Killed Number of Persons Injured Total Killed Pedestrians Pedalcyclist Total Injured Pedestrians Pedalcyclist
Total Total Total Total Total TotalMale Male Male Male Male MaleFemale Female Female Female Female Female1. 0 to 4 1 1 22. 5 to 9 3 33. 10 to 14 1 2 2 2 4 14. 15 to 19 1 1 1 7 5 12 15. 20 to 24 8 3 116. 25 to 34 1 16 10 26 17. 35 to 44 2 6 9 15 28. 45 to 54 1 1 1 20 9 29 19. 55 to 64 1 6 9 15 110. 65 to 74 1 1 211. 75 & older 4 2 612. Not-stated 1 1 1 1Totals 126 52 74 2 2 9 8 1
Directional Analysis - A crash consisting of a series of collisions, overturning, etc., is classified according to the first damage or injury producing event; includes on roadway and off roadway.5A. MULTIPLE VEH CRASH Total Fatal Injury P.D.O.
Junction1. Car go straight 1 1 12. Car turning right 1 1 13. Car turning left4. Car backing 5. All othersTotals 2 2 1 1
5D. ALL OTHER CRASHES Total Fatal Injury P.D.O.Coll-isionWith
Coll-isionWith
1. Other rd veh or railway train 2 2 2. Fixed object3. Other object or animal 4. Overturning 5. Other noncollision6. Other rd veh or railway train 7 7 7. Fixed object 15 10 25 8. Other object or animal 1 1 9. Overturning 1 1 10. Other noncollision11. Not statedTotals 1719 36
6. PEDESTRIAN ACTION BY AGE
Ages of Pedstrians Killed and InjuredPedestrians Killed Total 0 to 4 5 to 9 10 to 14 15 to 19 20 to 24 25 to 44 45 to 64 65 & older Not stated
1a. X-ing at intersect or X-walk 1 1 1b. X-ing not at intersection 2a. Walking in road with traffic 2b. Same against traffic 3. Standing in roadway 4. Push or work on veh in road 5. Other working in roadway 6. Playing in roadway 7. Other in roadway 8. Not in roadway 1 1 9. Not stated
1 1 2 Totals
7. AGE OF DRIVER All Crashes Fatal Injury 1. 14 & younger 2. 15 3. 16 3 1 4. 17 8 2 5. 18 8 3 6. 19 9 7 7. 20 7 3 8. 21 5 2 9. 22 to 24 28 15 10. 25 to 34 65 38 11. 35 to 44 55 23 12. 45 to 54 64 33 13. 55 to 64 50 23 14. 65 to 74 14 7 15. 75 & older 27 10 16. Not stated 27 3 Totals 370 170 8. SEX OF DRIVER Injury Fatal All Crashes
1. Male 192 86 2. Female 173 83 3. Not stated 5 1 Totals 370 170
9. RESIDENCE OF DRIVER All Crashes Fatal Injury
1. Local resident 348 165 2. In-state resident 1 1 3. Non resident 5 1 4. Not stated 16 3 Totals 370 170
10. CRASHES BY CONTRIBUTING FACTOR All InjuryFatal1. Speed too fast
30
7 2
7. Followed too closely 62 3
10 5
6. Improper overtaking5. Drove left of center4. Disregard traffic signal3. Passed stop sign2. Failed to yield 68 31
14 36
8. Made improper turn
Totals 232 101 5
2 4 6
15 1 7
11 14
12. Other 11. Mechanical defect10. Improper driving9. Had been drinking
12. ROAD SURFACECONDITION InjuryFatalAll
1. Dry 137 682. Wet 58 223. Snowy or icy 5 24. Other 5. Not stated 1 1Totals 201 93
13. LIGHT CONDITION InjuryFatalAll1. Daylight 135 662. Dawn or Dusk 7 33. Darkness 59 244. Not statedTotals 201 93
11. VEHICLE TYPE InjuryFatalAll1. Passenger car 360 1662. Pass Car and trailer 3. Truck or truck tractor 14. Truck tractor with semi-trailer 7 35. Other truck combination 6. Farm tractor and/or equip. 7. Taxicab8. Bus 2 19. School bus10. Motorcycle 4 411. Motor scooter or moped 12. Others and not stated 2 1Totals 376 175Special vehicles included above 13. Log trucks14. Emergency (incl. private) 115. Military vehicles 16. Other public vehicles 1 1
1. Primary State Highways 2. Secondary State Highways 3. County and Local Roads 4. City Streets 5. Not Stated Total--Rural Area
NOTE: THIS YEAR TO DATE represents only those crashes entered onto the database as of the date above. SAME PERIOD LAST YEAR represents all crashes including late reports. MAJOR INJURIES are incapacitating injuries. MINOR INJURIES are non-incapacitating evident injuries.
3. LOCATION Total
PropertyDamage
Nonfatal Injury Fatal Property
DamageNonfatal
InjuryFatalTotalPropertyDamage
Nonfatal Injury Fatal Total Killed Injured
Total On Roadway TotalOff Roadway Number Of Crashes Number Of Persons
1. Below 1,000 2. 1,000 to 2,500 3. 2,501 to 5,000 4. 5,001 to 10,000 5. 10,001 to 25,000 6. 25,001 to 50,000 7. 50,001 to 100,000 8. 100,001 to 200,000 9. City of Portland Only Total - Municipalities
3. County and Local Roads 23 3 2 5 30 17 47 33 19 52 4. City Streets
5. Not Stated Total--Urban Area 10815 3 1 9927616897 79 1 177 6. Interstate System 7. Other State Freeways 8. Other State Highways 125 1 60 64 121 0 59 62 4 1 1 2 1 85Total--Urban System 125 1 60 64 121 59 62 4 1 1 2 1 85
6. Interstate System 7. Other State Freeways 8. Other State Highways Total--Rural System
June 1, 2007
NEWBERG
174
At I
nter
sect
ion
Not
at I
nter
sect
ion
At
Inte
r. N
on -I
nter
.
NEWBERG 2006 OREGON CRASHES
4. AGE OF CASUALTY
Number of Persons Killed Number of Persons Injured Total Killed Pedestrians Pedalcyclist Total Injured Pedestrians Pedalcyclist
Total Total Total Total Total TotalMale Male Male Male Male MaleFemale Female Female Female Female Female1. 0 to 4 1 12. 5 to 9 3 33. 10 to 14 1 14. 15 to 19 1 2 7 7 14 1 1 15. 20 to 24 8 6 146. 25 to 34 1 1 4 9 137. 35 to 44 1 1 11 12 238. 45 to 54 7 13 209. 55 to 64 9 3 1210. 65 to 74 1 2 311. 75 & older 1 2 312. Not-stated 1 1Totals 1 1 108 59 49 2 1 1 2 1 1
Directional Analysis - A crash consisting of a series of collisions, overturning, etc., is classified according to the first damage or injury producing event; includes on roadway and off roadway.5A. MULTIPLE VEH CRASH Total Fatal Injury P.D.O.
5B. MULTIPLE VEH CRASH Total Fatal Injury P.D.O. 3 1 41. Moving in opposite dir.
11 2 132. Both moving in same dir. 3 33a. One car parked
16 12 283b. One car stopped in traffic 1 14. Enter/Leave parked pos. 1 1 25a. Entering driveway/alley 4 1 55b. Leaving driveway/alley 1 16. All others
Totals 40 17 57
5C. PEDESTRIANCRASHES
All PedCrashes
Fatal Crashes Non-Fatal Injury Crashes
TotalAt
Intersection Non-
Junction TotalAt
IntersectionNon-
Junction1. Car go straight 1 1 12. Car turning right3. Car turning left 1 1 14. Car backing5. All othersTotals 2 2 1 1
5D. ALL OTHER CRASHES Total Fatal Injury P.D.O.Coll-isionWith
Coll-isionWith
1. Other rd veh or railway train2. Fixed object 3. Other object or animal 4. Overturning5. Other noncollision 2 2 6. Other rd veh or railway train 2 2 7. Fixed object 4 1 1 6 8. Other object or animal9. Overturning 10. Other noncollision 11. Not statedTotals 45 1 10
6. PEDESTRIAN ACTION BY AGE
Ages of Pedstrians Killed and InjuredPedestrians Killed Total 0 to 4 5 to 9 10 to 14 15 to 19 20 to 24 25 to 44 45 to 64 65 & older Not stated
1a. X-ing at intersect or X-walk 1 1 1b. X-ing not at intersection 2a. Walking in road with traffic 2b. Same against traffic 3. Standing in roadway 4. Push or work on veh in road 5. Other working in roadway 6. Playing in roadway 7. Other in roadway 8. Not in roadway 1 1 9. Not stated
2 2 Totals
7. AGE OF DRIVER All Crashes Fatal Injury 1. 14 & younger 2. 15 3. 16 6 1 4. 17 13 7 5. 18 12 1 4 6. 19 16 8 7. 20 11 8 8. 21 9 2 9. 22 to 24 22 13 10. 25 to 34 47 24 11. 35 to 44 56 27 12. 45 to 54 59 25 13. 55 to 64 46 23 14. 65 to 74 19 10 15. 75 & older 14 9 16. Not stated 27 1 Totals 357 1 162 8. SEX OF DRIVER Injury Fatal All Crashes
1. Male 198 94 2. Female 153 1 68 3. Not stated 6 Totals 357 1 162
9. RESIDENCE OF DRIVER All Crashes Fatal Injury
1. Local resident 285 130 2. In-state resident 47 25 3. Non resident 16 1 7 4. Not stated 9 0 Totals 357 1 162
10. CRASHES BY CONTRIBUTING FACTOR All InjuryFatal1. Speed too fast
22 2
6 7
7. Followed too closely 38 2 1
13 9
6. Improper overtaking5. Drove left of center4. Disregard traffic signal3. Passed stop sign2. Failed to yield 54 24
4 9
8. Made improper turn
Totals 178 1 81 4 1 7
4
1
21 1
16
14
12. Other 11. Mechanical defect10. Improper driving9. Had been drinking
12. ROAD SURFACECONDITION InjuryFatalAll
1. Dry 123 502. Wet 53 1 293. Snowy or icy4. Other 5. Not stated 1Totals 177 1 79
13. LIGHT CONDITION InjuryFatalAll1. Daylight 134 602. Dawn or Dusk 16 63. Darkness 27 1 134. Not statedTotals 177 1 79
11. VEHICLE TYPE InjuryFatalAll1. Passenger car 342 1 1522. Pass Car and trailer 2 13. Truck or truck tractor 5 14. Truck tractor with semi-trailer 5 35. Other truck combination 6. Farm tractor and/or equip. 7. Taxicab8. Bus 1 19. School bus 4 210. Motorcycle 2 211. Motor scooter or moped 12. Others and not stated Totals 361 1 162Special vehicles included above 13. Log trucks14. Emergency (incl. private) 3 215. Military vehicles 16. Other public vehicles 7 3
14. MANNER OF COLLISION InjuryFatalAll
1. Head-on 12. Rear end 63 333. Angle 86 384. Sideswipe-meeting 15. Sideswipe-overtaking 106. Backed into 3 17. Other 1Totals 165 72
11. Count of vehicles, including properly parked vehicles.
Totals include participant records where gender was coded as "unknown".
10. Count of crashes. Crashes with multiple contributing circumstances are counted in all applicable categories.
MULTIPLE VEHICLE CRASHES
7 - 9. Tally of drivers by age, sex, residence & crash severity. Excludes occupants of properly & improperly parked vehicles.
175
Col
lisio
n in
volv
ing:
N
on-
coll.
N
on-
coll.
C
ollis
ion
invo
lvin
g:
Non
- co
ll.
Col
lisio
n in
volv
ing:
3C
. RU
RA
L 3A
. Inc
orpo
rate
d A
reas
3B
. UR
BA
N
SUMMARY OF MOTOR VEHICLE TRAFFIC CRASHES 2006 OREGON CRASHESForIn
1. Primary State Highways 2. Secondary State Highways 3. County and Local Roads 4. City Streets 5. Not Stated Total--Rural Area
NOTE: THIS YEAR TO DATE represents only those crashes entered onto the database as of the date above. SAME PERIOD LAST YEAR represents all crashes including late reports. MAJOR INJURIES are incapacitating injuries. MINOR INJURIES are non-incapacitating evident injuries.
3. LOCATION Total
PropertyDamage
Nonfatal Injury Fatal Property
DamageNonfatal
InjuryFatalTotalPropertyDamage
Nonfatal Injury Fatal Total Killed Injured
Total On Roadway TotalOff Roadway Number Of Crashes Number Of Persons
1. Below 1,000 2. 1,000 to 2,500 3. 2,501 to 5,000 4. 5,001 to 10,000 5. 10,001 to 25,000 6. 25,001 to 50,000 7. 50,001 to 100,000 8. 100,001 to 200,000 9. City of Portland Only Total - Municipalities
169
169
51 118
51 118
49 102 151
49 102 151
2 16 18
2 16 18
76
76
53 3 1 4 70 34 104 73 35 108 1. Primary State Highways 2. Secondary State Highways 3. County and Local Roads
23 13 1 14 32 15 47 45 16 61 4. City Streets 5. Not Stated Total--Urban Area 7616 2 1810249151118 51 169 6. Interstate System 7. Other State Freeways 8. Other State Highways 108 35 73 104 34 70 4 1 3 53Total--Urban System 108 35 73 104 34 70 4 1 3 53
6. Interstate System 7. Other State Freeways 8. Other State Highways Total--Rural System
June 1, 2007
NEWPORT
176
At I
nter
sect
ion
Not
at I
nter
sect
ion
At
Inte
r. N
on -I
nter
.
NEWPORT 2006 OREGON CRASHES
4. AGE OF CASUALTY
Number of Persons Killed Number of Persons Injured Total Killed Pedestrians Pedalcyclist Total Injured Pedestrians Pedalcyclist
Total Total Total Total Total TotalMale Male Male Male Male MaleFemale Female Female Female Female Female1. 0 to 4 1 1 22. 5 to 9 1 13. 10 to 14 1 14. 15 to 19 2 1 1 4 5 95. 20 to 24 1 2 36. 25 to 34 1 1 12 2 147. 35 to 44 9 4 138. 45 to 54 1 1 11 2 139. 55 to 64 2 2 2 5 710. 65 to 74 3 3 611. 75 & older 3 312. Not-stated 1 3 4Totals 76 27 49 6 3 3
Directional Analysis - A crash consisting of a series of collisions, overturning, etc., is classified according to the first damage or injury producing event; includes on roadway and off roadway.5A. MULTIPLE VEH CRASH Total Fatal Injury P.D.O.
1. Entering at angle 26 13 39 2a. Same dir.- both straight 2b. Same-1 turn, 1 straight 2c. Same-one stopped 3 3 6 2d. Same-all others 3a. Opposite dir.- both straight 3b. Opposite-1 turn, 1 straight 3 1 4 3c. Opposite-all others 4. Not stated Totals 32 17 49
5B. MULTIPLE VEH CRASH Total Fatal Injury P.D.O. 5 4 91. Moving in opposite dir.
14 1 152. Both moving in same dir. 6 1 73a. One car parked
35 16 513b. One car stopped in traffic 5 54. Enter/Leave parked pos.
Junction1. Car go straight 5 5 52. Car turning right3. Car turning left 1 1 14. Car backing5. All othersTotals 6 6 1 5
5D. ALL OTHER CRASHES Total Fatal Injury P.D.O.Coll-isionWith
Coll-isionWith
1. Other rd veh or railway train2. Fixed object 3. Other object or animal 4. Overturning 5. Other noncollision 6. Other rd veh or railway train 7. Fixed object 8 1 9 8. Other object or animal9. Overturning 10. Other noncollision 11. Not statedTotals 81 9
6. PEDESTRIAN ACTION BY AGE
Ages of Pedstrians Killed and InjuredPedestrians Killed Total 0 to 4 5 to 9 10 to 14 15 to 19 20 to 24 25 to 44 45 to 64 65 & older Not stated
1a. X-ing at intersect or X-walk 1 1 1b. X-ing not at intersection 3 1 1 5 2a. Walking in road with traffic 2b. Same against traffic 3. Standing in roadway 4. Push or work on veh in road 5. Other working in roadway 6. Playing in roadway 7. Other in roadway 8. Not in roadway 9. Not stated
3 12 6 Totals
7. AGE OF DRIVER All Crashes Fatal Injury 1. 14 & younger 2. 15 3. 16 9 1 4. 17 14 6 5. 18 9 3 6. 19 6 2 7. 20 2 1 8. 21 6 9. 22 to 24 13 5 10. 25 to 34 48 18 11. 35 to 44 41 15 12. 45 to 54 63 23 13. 55 to 64 47 12 14. 65 to 74 23 5 15. 75 & older 23 10 16. Not stated 15 Totals 319 101 8. SEX OF DRIVER Injury Fatal All Crashes
1. Male 161 45 2. Female 157 56 3. Not stated 1 Totals 319 101
9. RESIDENCE OF DRIVER All Crashes Fatal Injury
1. Local resident 259 84 2. In-state resident 37 13 3. Non resident 22 4 4. Not stated 1 0 Totals 319 101
10. CRASHES BY CONTRIBUTING FACTOR All InjuryFatal1. Speed too fast
6
3 2 2
7. Followed too closely 6 9 6 5 4
6. Improper overtaking5. Drove left of center4. Disregard traffic signal3. Passed stop sign2. Failed to yield 59 22
18 63
8. Made improper turn
Totals 184 60 2
4 1
6
19 2 5
12. Other 11. Mechanical defect10. Improper driving9. Had been drinking
12. ROAD SURFACECONDITION InjuryFatalAll
1. Dry 130 332. Wet 36 163. Snowy or icy 3 24. Other 5. Not statedTotals 169 51
13. LIGHT CONDITION InjuryFatalAll1. Daylight 139 382. Dawn or Dusk 5 23. Darkness 25 114. Not statedTotals 169 51
11. VEHICLE TYPE InjuryFatalAll1. Passenger car 326 1002. Pass Car and trailer 3 13. Truck or truck tractor 14. Truck tractor with semi-trailer 25. Other truck combination 6. Farm tractor and/or equip. 7. Taxicab 8. Bus9. School bus 110. Motorcycle 1 111. Motor scooter or moped 12. Others and not stated Totals 334 102Special vehicles included above 13. Log trucks14. Emergency (incl. private) 15. Military vehicles 16. Other public vehicles 4 1
14. MANNER OF COLLISION InjuryFatalAll
1. Head-on2. Rear end 59 203. Angle 65 214. Sideswipe-meeting 7 35. Sideswipe-overtaking 136. Backed into 57. Other 5Totals 154 44
11. Count of vehicles, including properly parked vehicles.
Totals include participant records where gender was coded as "unknown".
10. Count of crashes. Crashes with multiple contributing circumstances are counted in all applicable categories.
MULTIPLE VEHICLE CRASHES
7 - 9. Tally of drivers by age, sex, residence & crash severity. Excludes occupants of properly & improperly parked vehicles.
177
Col
lisio
n in
volv
ing:
N
on-
coll.
N
on-
coll.
C
ollis
ion
invo
lvin
g:
Non
- co
ll.
Col
lisio
n in
volv
ing:
3C
. RU
RA
L 3A
. Inc
orpo
rate
d A
reas
3B
. UR
BA
N
SUMMARY OF MOTOR VEHICLE TRAFFIC CRASHES 2006 OREGON CRASHESForIn
1. Primary State Highways 2. Secondary State Highways 3. County and Local Roads 4. City Streets 5. Not Stated Total--Rural Area
NOTE: THIS YEAR TO DATE represents only those crashes entered onto the database as of the date above. SAME PERIOD LAST YEAR represents all crashes including late reports. MAJOR INJURIES are incapacitating injuries. MINOR INJURIES are non-incapacitating evident injuries.
3. LOCATION Total
PropertyDamage
Nonfatal Injury Fatal Property
DamageNonfatal
InjuryFatalTotalPropertyDamage
Nonfatal Injury Fatal Total Killed Injured
Total On Roadway TotalOff Roadway Number Of Crashes Number Of Persons
1. Below 1,000 2. 1,000 to 2,500 3. 2,501 to 5,000 4. 5,001 to 10,000 5. 10,001 to 25,000 6. 25,001 to 50,000 7. 50,001 to 100,000 8. 100,001 to 200,000 9. City of Portland Only Total - Municipalities
3. County and Local Roads 64 5 2 7 62 39 101 67 41 108 4. City Streets
5. Not Stated Total--Urban Area 816 2 8685212074 54 128 6. Interstate System 1 1 1 17. Other State Freeways 8. Other State Highways 19 13 6 19 13 6 17Total--Urban System 20 13 7 19 13 6 1 1 17
6. Interstate System 7. Other State Freeways 8. Other State Highways Total--Rural System
June 1, 2007
ONTARIO
178
At I
nter
sect
ion
Not
at I
nter
sect
ion
At
Inte
r. N
on -I
nter
.
ONTARIO 2006 OREGON CRASHES
4. AGE OF CASUALTY
Number of Persons Killed Number of Persons Injured Total Killed Pedestrians Pedalcyclist Total Injured Pedestrians Pedalcyclist
Total Total Total Total Total TotalMale Male Male Male Male MaleFemale Female Female Female Female Female1. 0 to 4 1 12. 5 to 9 3 4 73. 10 to 14 2 1 34. 15 to 19 8 85. 20 to 24 4 1 56. 25 to 34 1 1 4 6 107. 35 to 44 11 2 138. 45 to 54 1 10 4 14 19. 55 to 64 1 6 2 8 110. 65 to 74 7 1 811. 75 & older 4 412. Not-stated Totals 81 21 60 1 1 2 2
Directional Analysis - A crash consisting of a series of collisions, overturning, etc., is classified according to the first damage or injury producing event; includes on roadway and off roadway.5A. MULTIPLE VEH CRASH Total Fatal Injury P.D.O.
5B. MULTIPLE VEH CRASH Total Fatal Injury P.D.O. 2 1 31. Moving in opposite dir. 6 1 72. Both moving in same dir. 3 33a. One car parked 4 3 73b. One car stopped in traffic 1 14. Enter/Leave parked pos. 1 15a. Entering driveway/alley 8 3 115b. Leaving driveway/alley 1 1 26. All others
Totals 26 9 35
5C. PEDESTRIANCRASHES
All PedCrashes
Fatal Crashes Non-Fatal Injury Crashes
TotalAt
Intersection Non-
Junction TotalAt
IntersectionNon-
Junction1. Car go straight 1 1 12. Car turning right3. Car turning left 4. Car backing 5. All othersTotals 1 1 1
5D. ALL OTHER CRASHES Total Fatal Injury P.D.O.Coll-isionWith
Coll-isionWith
1. Other rd veh or railway train 1 1 2. Fixed object 1 1 3. Other object or animal4. Overturning 5. Other noncollision6. Other rd veh or railway train 1 1 7. Fixed object 2 2 4 8. Other object or animal9. Overturning 10. Other noncollision 11. Not statedTotals 34 7
6. PEDESTRIAN ACTION BY AGE
Ages of Pedstrians Killed and InjuredPedestrians Killed Total 0 to 4 5 to 9 10 to 14 15 to 19 20 to 24 25 to 44 45 to 64 65 & older Not stated
1a. X-ing at intersect or X-walk 1 1 1b. X-ing not at intersection 2a. Walking in road with traffic 2b. Same against traffic 3. Standing in roadway 4. Push or work on veh in road 5. Other working in roadway 6. Playing in roadway 7. Other in roadway 8. Not in roadway 9. Not stated
1 1 Totals
7. AGE OF DRIVER All Crashes Fatal Injury 1. 14 & younger 2. 15 3. 16 9 3 4. 17 6 3 5. 18 9 6 6. 19 16 4 7. 20 12 2 8. 21 6 2 9. 22 to 24 8 3 10. 25 to 34 32 15 11. 35 to 44 34 16 12. 45 to 54 32 15 13. 55 to 64 31 15 14. 65 to 74 27 12 15. 75 & older 23 9 16. Not stated 6 1 Totals 251 106 8. SEX OF DRIVER Injury Fatal All Crashes
1. Male 114 41 2. Female 132 64 3. Not stated 5 1 Totals 251 106
9. RESIDENCE OF DRIVER All Crashes Fatal Injury
1. Local resident 157 64 2. In-state resident 8 1 3. Non resident 80 40 4. Not stated 6 1 Totals 251 106
10. CRASHES BY CONTRIBUTING FACTOR All InjuryFatal1. Speed too fast
5
1 8 4
7. Followed too closely 10 3 2
12 9
6. Improper overtaking5. Drove left of center4. Disregard traffic signal3. Passed stop sign2. Failed to yield 56 21
13 27
8. Made improper turn
Totals 143 62 7
3
15
5 1 3
12. Other 11. Mechanical defect10. Improper driving9. Had been drinking
12. ROAD SURFACECONDITION InjuryFatalAll
1. Dry 102 412. Wet 20 123. Snowy or icy 6 14. Other 5. Not statedTotals 128 54
13. LIGHT CONDITION InjuryFatalAll1. Daylight 97 402. Dawn or Dusk 5 23. Darkness 26 124. Not statedTotals 128 54
11. VEHICLE TYPE InjuryFatalAll1. Passenger car 249 1042. Pass Car and trailer 3. Truck or truck tractor 4. Truck tractor with semi-trailer 4 15. Other truck combination 6. Farm tractor and/or equip. 7. Taxicab8. Bus 9. School bus 10. Motorcycle 11. Motor scooter or moped 12. Others and not stated Totals 253 105Special vehicles included above 13. Log trucks14. Emergency (incl. private) 1 115. Military vehicles 16. Other public vehicles
14. MANNER OF COLLISION InjuryFatalAll
1. Head-on 3 12. Rear end 28 143. Angle 82 344. Sideswipe-meeting 5. Sideswipe-overtaking 56. Backed into 17. Other 1Totals 120 49
11. Count of vehicles, including properly parked vehicles.
Totals include participant records where gender was coded as "unknown".
10. Count of crashes. Crashes with multiple contributing circumstances are counted in all applicable categories.
MULTIPLE VEHICLE CRASHES
7 - 9. Tally of drivers by age, sex, residence & crash severity. Excludes occupants of properly & improperly parked vehicles.
179
Col
lisio
n in
volv
ing:
N
on-
coll.
N
on-
coll.
C
ollis
ion
invo
lvin
g:
Non
- co
ll.
Col
lisio
n in
volv
ing:
3C
. RU
RA
L 3A
. Inc
orpo
rate
d A
reas
3B
. UR
BA
N
SUMMARY OF MOTOR VEHICLE TRAFFIC CRASHES 2006 OREGON CRASHESForIn
1. Primary State Highways 2. Secondary State Highways 3. County and Local Roads 4. City Streets 5. Not Stated Total--Rural Area
NOTE: THIS YEAR TO DATE represents only those crashes entered onto the database as of the date above. SAME PERIOD LAST YEAR represents all crashes including late reports. MAJOR INJURIES are incapacitating injuries. MINOR INJURIES are non-incapacitating evident injuries.
3. LOCATION Total
PropertyDamage
Nonfatal Injury Fatal Property
DamageNonfatal
InjuryFatalTotalPropertyDamage
Nonfatal Injury Fatal Total Killed Injured
Total On Roadway TotalOff Roadway Number Of Crashes Number Of Persons
1. Below 1,000 2. 1,000 to 2,500 3. 2,501 to 5,000 4. 5,001 to 10,000 5. 10,001 to 25,000 6. 25,001 to 50,000 7. 50,001 to 100,000 8. 100,001 to 200,000 9. City of Portland Only Total - Municipalities
3. County and Local Roads 159 17 15 32 120 91 211 137 106 243 4. City Streets
5. Not Stated Total--Urban Area 324132 27 592611871449293 214 1 508 6. Interstate System 61 28 33 52 23 29 9 5 4 477. Other State Freeways 8. Other State Highways 204 1 80 123 186 73 112 18 7 11 1 118Total--Urban System 265 1 108 156 238 1 96 141 27 12 15 1 165
6. Interstate System 7. Other State Freeways 8. Other State Highways Total--Rural System
June 1, 2007
OREGON CITY
180
At I
nter
sect
ion
Not
at I
nter
sect
ion
At
Inte
r. N
on -I
nter
.
OREGON CITY 2006 OREGON CRASHES
4. AGE OF CASUALTY
Number of Persons Killed Number of Persons Injured Total Killed Pedestrians Pedalcyclist Total Injured Pedestrians Pedalcyclist
Total Total Total Total Total TotalMale Male Male Male Male MaleFemale Female Female Female Female Female1. 0 to 4 2 4 62. 5 to 9 5 3 83. 10 to 14 2 4 6 10 24. 15 to 19 1 1 1 18 24 42 15. 20 to 24 17 19 366. 25 to 34 1 1 1 29 27 56 17. 35 to 44 30 28 588. 45 to 54 1 26 25 51 19. 55 to 64 1 19 22 41 1 1 1 1 110. 65 to 74 1 1 5 3 811. 75 & older 1 1 1 7 812. Not-stated Totals 1 1 1 1 324 168 156 4 3 1 6 6
Directional Analysis - A crash consisting of a series of collisions, overturning, etc., is classified according to the first damage or injury producing event; includes on roadway and off roadway.5A. MULTIPLE VEH CRASH Total Fatal Injury P.D.O.
Junction1. Car go straight 4 1 1 3 32. Car turning right3. Car turning left 1 1 14. Car backing5. All othersTotals 5 1 1 4 1 3
5D. ALL OTHER CRASHES Total Fatal Injury P.D.O.Coll-isionWith
Coll-isionWith
1. Other rd veh or railway train 5 5 2. Fixed object 3 3 3. Other object or animal4. Overturning 1 1 5. Other noncollision6. Other rd veh or railway train 1 1 7. Fixed object 21 20 41 8. Other object or animal 4 4 9. Overturning 1 1 2 10. Other noncollision 1 1 11. Not statedTotals 3028 58
6. PEDESTRIAN ACTION BY AGE
Ages of Pedstrians Killed and InjuredPedestrians Killed Total 0 to 4 5 to 9 10 to 14 15 to 19 20 to 24 25 to 44 45 to 64 65 & older Not stated
1a. X-ing at intersect or X-walk 1 1 1b. X-ing not at intersection 2a. Walking in road with traffic 2b. Same against traffic 3. Standing in roadway 4. Push or work on veh in road 5. Other working in roadway 6. Playing in roadway 7. Other in roadway 1 1 1 3 1 8. Not in roadway 1 1 9. Not stated
2 1 11 5 1 Totals
7. AGE OF DRIVER All Crashes Fatal Injury 1. 14 & younger 2. 15 3 3. 16 13 4 4. 17 30 15 5. 18 37 23 6. 19 33 15 7. 20 18 8 8. 21 22 14 9. 22 to 24 57 37 10. 25 to 34 155 70 11. 35 to 44 152 74 12. 45 to 54 157 71 13. 55 to 64 141 57 14. 65 to 74 40 1 15 15. 75 & older 37 16 16. Not stated 107 13 Totals 1,002 1 432 8. SEX OF DRIVER Injury Fatal All Crashes
1. Male 546 1 235 2. Female 441 193 3. Not stated 15 4 Totals 1,002 1 432
9. RESIDENCE OF DRIVER All Crashes Fatal Injury
1. Local resident 882 1 388 2. In-state resident 32 19 3. Non resident 33 14 4. Not stated 55 11 Totals 1,002 1 432
10. CRASHES BY CONTRIBUTING FACTOR All InjuryFatal1. Speed too fast
103
7 2
7. Followed too closely 226 2 1
10 8
6. Improper overtaking5. Drove left of center4. Disregard traffic signal3. Passed stop sign2. Failed to yield 105 1 38
47 89
8. Made improper turn
Totals 561 2 242 26
1 6 6 6
1
57 6
22 15 20
12. Other 11. Mechanical defect10. Improper driving9. Had been drinking
12. ROAD SURFACECONDITION InjuryFatalAll
1. Dry 343 1532. Wet 145 1 593. Snowy or icy 10 24. Other 5. Not stated 10Totals 508 1 214
13. LIGHT CONDITION InjuryFatalAll1. Daylight 377 1622. Dawn or Dusk 24 1 83. Darkness 105 444. Not stated 2Totals 508 1 214
11. VEHICLE TYPE InjuryFatalAll1. Passenger car 974 1 4232. Pass Car and trailer 8 33. Truck or truck tractor 3 14. Truck tractor with semi-trailer 16 55. Other truck combination 36. Farm tractor and/or equip. 7. Taxicab8. Bus 4 19. School bus10. Motorcycle 6 511. Motor scooter or moped 1 112. Others and not stated 5Totals 1,020 1 439Special vehicles included above 13. Log trucks14. Emergency (incl. private) 4 215. Military vehicles 16. Other public vehicles 2
14. MANNER OF COLLISION InjuryFatalAll
1. Head-on 4 42. Rear end 261 1203. Angle 121 434. Sideswipe-meeting 7 25. Sideswipe-overtaking 39 116. Backed into 97. Other 4 2Totals 445 182
11. Count of vehicles, including properly parked vehicles.
Totals include participant records where gender was coded as "unknown".
10. Count of crashes. Crashes with multiple contributing circumstances are counted in all applicable categories.
MULTIPLE VEHICLE CRASHES
7 - 9. Tally of drivers by age, sex, residence & crash severity. Excludes occupants of properly & improperly parked vehicles.
181
Col
lisio
n in
volv
ing:
N
on-
coll.
N
on-
coll.
C
ollis
ion
invo
lvin
g:
Non
- co
ll.
Col
lisio
n in
volv
ing:
3C
. RU
RA
L 3A
. Inc
orpo
rate
d A
reas
3B
. UR
BA
N
SUMMARY OF MOTOR VEHICLE TRAFFIC CRASHES 2006 OREGON CRASHESForIn
1. Primary State Highways 2. Secondary State Highways 3. County and Local Roads 4. City Streets 5. Not Stated Total--Rural Area
NOTE: THIS YEAR TO DATE represents only those crashes entered onto the database as of the date above. SAME PERIOD LAST YEAR represents all crashes including late reports. MAJOR INJURIES are incapacitating injuries. MINOR INJURIES are non-incapacitating evident injuries.
3. LOCATION Total
PropertyDamage
Nonfatal Injury Fatal Property
DamageNonfatal
InjuryFatalTotalPropertyDamage
Nonfatal Injury Fatal Total Killed Injured
Total On Roadway TotalOff Roadway Number Of Crashes Number Of Persons
1. Below 1,000 2. 1,000 to 2,500 3. 2,501 to 5,000 4. 5,001 to 10,000 5. 10,001 to 25,000 6. 25,001 to 50,000 7. 50,001 to 100,000 8. 100,001 to 200,000 9. City of Portland Only Total - Municipalities
170
170
74 96
74 96
68 80 148
68 80 148
6 16 22
6 16 22
107
107
73 5 3 8 54 49 103 59 52 111 1. Primary State Highways 2. Secondary State Highways 3. County and Local Roads
34 11 3 14 26 19 45 37 22 59 4. City Streets 5. Not Stated Total--Urban Area 10716 6 22806814896 74 170 6. Interstate System 3 1 2 1 1 2 2 17. Other State Freeways 8. Other State Highways 108 51 57 102 48 54 6 3 3 72Total--Urban System 111 52 59 103 49 54 8 3 5 73
6. Interstate System 7. Other State Freeways 8. Other State Highways Total--Rural System
June 1, 2007
PENDLETON
182
At I
nter
sect
ion
Not
at I
nter
sect
ion
At
Inte
r. N
on -I
nter
.
PENDLETON 2006 OREGON CRASHES
4. AGE OF CASUALTY
Number of Persons Killed Number of Persons Injured Total Killed Pedestrians Pedalcyclist Total Injured Pedestrians Pedalcyclist
Total Total Total Total Total TotalMale Male Male Male Male MaleFemale Female Female Female Female Female1. 0 to 4 1 1 22. 5 to 9 1 2 33. 10 to 14 2 1 34. 15 to 19 20 7 275. 20 to 24 1 2 1 5 9 14 26. 25 to 34 8 8 167. 35 to 44 8 9 178. 45 to 54 1 8 5 13 19. 55 to 64 5 1 610. 65 to 74 2 211. 75 & older 1 1 3 1 412. Not-stated Totals 107 46 61 2 2 3 3
Directional Analysis - A crash consisting of a series of collisions, overturning, etc., is classified according to the first damage or injury producing event; includes on roadway and off roadway.5A. MULTIPLE VEH CRASH Total Fatal Injury P.D.O.
5B. MULTIPLE VEH CRASH Total Fatal Injury P.D.O. 2 21. Moving in opposite dir.
15 4 192. Both moving in same dir. 4 3 73a. One car parked 7 11 183b. One car stopped in traffic 2 1 34. Enter/Leave parked pos. 6 65a. Entering driveway/alley 8 85b. Leaving driveway/alley 4 1 56. All others
Totals 48 20 68
5C. PEDESTRIANCRASHES
All PedCrashes
Fatal Crashes Non-Fatal Injury Crashes
TotalAt
Intersection Non-
Junction TotalAt
IntersectionNon-
Junction1. Car go straight 2 2 22. Car turning right3. Car turning left 4. Car backing 5. All othersTotals 2 2 2
5D. ALL OTHER CRASHES Total Fatal Injury P.D.O.Coll-isionWith
Coll-isionWith
1. Other rd veh or railway train 3 3 2. Fixed object 1 1 3. Other object or animal4. Overturning 5. Other noncollision6. Other rd veh or railway train 1 1 7. Fixed object 5 2 7 8. Other object or animal 1 1 9. Overturning 1 1 10. Other noncollision11. Not statedTotals 95 14
6. PEDESTRIAN ACTION BY AGE
Ages of Pedstrians Killed and InjuredPedestrians Killed Total 0 to 4 5 to 9 10 to 14 15 to 19 20 to 24 25 to 44 45 to 64 65 & older Not stated
1a. X-ing at intersect or X-walk 1b. X-ing not at intersection 1 1 2 2a. Walking in road with traffic 2b. Same against traffic 3. Standing in roadway 4. Push or work on veh in road 5. Other working in roadway 6. Playing in roadway 7. Other in roadway 8. Not in roadway 9. Not stated
11 2 Totals
7. AGE OF DRIVER All Crashes Fatal Injury 1. 14 & younger 2. 15 3. 16 8 5 4. 17 21 12 5. 18 12 6 6. 19 15 7 7. 20 16 8 8. 21 6 3 9. 22 to 24 18 7 10. 25 to 34 50 24 11. 35 to 44 52 30 12. 45 to 54 50 22 13. 55 to 64 28 9 14. 65 to 74 18 6 15. 75 & older 20 4 16. Not stated 10 3 Totals 324 146 8. SEX OF DRIVER Injury Fatal All Crashes
1. Male 176 77 2. Female 146 67 3. Not stated 2 2 Totals 324 146
9. RESIDENCE OF DRIVER All Crashes Fatal Injury
1. Local resident 255 121 2. In-state resident 27 15 3. Non resident 34 7 4. Not stated 8 3 Totals 324 146
10. CRASHES BY CONTRIBUTING FACTOR All InjuryFatal1. Speed too fast
22
7 2
7. Followed too closely 31 1
12 5
6. Improper overtaking5. Drove left of center4. Disregard traffic signal3. Passed stop sign2. Failed to yield 48 22
4 14
8. Made improper turn
Totals 166 71 5
2 1 6
18
11 1
25
12. Other 11. Mechanical defect10. Improper driving9. Had been drinking
12. ROAD SURFACECONDITION InjuryFatalAll
1. Dry 142 652. Wet 19 83. Snowy or icy 9 14. Other 5. Not statedTotals 170 74
13. LIGHT CONDITION InjuryFatalAll1. Daylight 146 642. Dawn or Dusk 5 23. Darkness 19 84. Not statedTotals 170 74
11. VEHICLE TYPE InjuryFatalAll1. Passenger car 316 1432. Pass Car and trailer 4 33. Truck or truck tractor 3 14. Truck tractor with semi-trailer 6 25. Other truck combination 16. Farm tractor and/or equip. 7. Taxicab 18. Bus9. School bus 210. Motorcycle 2 211. Motor scooter or moped 12. Others and not stated 1Totals 336 151Special vehicles included above 13. Log trucks 1 114. Emergency (incl. private) 115. Military vehicles 16. Other public vehicles 5 3
14. MANNER OF COLLISION InjuryFatalAll
1. Head-on 12. Rear end 43 293. Angle 85 354. Sideswipe-meeting 5. Sideswipe-overtaking 13 16. Backed into 8 17. Other 4 1Totals 154 67
11. Count of vehicles, including properly parked vehicles.
Totals include participant records where gender was coded as "unknown".
10. Count of crashes. Crashes with multiple contributing circumstances are counted in all applicable categories.
MULTIPLE VEHICLE CRASHES
7 - 9. Tally of drivers by age, sex, residence & crash severity. Excludes occupants of properly & improperly parked vehicles.
183
Col
lisio
n in
volv
ing:
N
on-
coll.
N
on-
coll.
C
ollis
ion
invo
lvin
g:
Non
- co
ll.
Col
lisio
n in
volv
ing:
3C
. RU
RA
L 3A
. Inc
orpo
rate
d A
reas
3B
. UR
BA
N
SUMMARY OF MOTOR VEHICLE TRAFFIC CRASHES 2006 OREGON CRASHESForIn
1. Primary State Highways 2. Secondary State Highways 3. County and Local Roads 4. City Streets 5. Not Stated Total--Rural Area
NOTE: THIS YEAR TO DATE represents only those crashes entered onto the database as of the date above. SAME PERIOD LAST YEAR represents all crashes including late reports. MAJOR INJURIES are incapacitating injuries. MINOR INJURIES are non-incapacitating evident injuries.
3. LOCATION Total
PropertyDamage
Nonfatal Injury Fatal Property
DamageNonfatal
InjuryFatalTotalPropertyDamage
Nonfatal Injury Fatal Total Killed Injured
Total On Roadway TotalOff Roadway Number Of Crashes Number Of Persons
1. Below 1,000 2. 1,000 to 2,500 3. 2,501 to 5,000 4. 5,001 to 10,000 5. 10,001 to 25,000 6. 25,001 to 50,000 7. 50,001 to 100,000 8. 100,001 to 200,000 9. City of Portland Only Total - Municipalities
Directional Analysis - A crash consisting of a series of collisions, overturning, etc., is classified according to the first damage or injury producing event; includes on roadway and off roadway.5A. MULTIPLE VEH CRASH Total Fatal Injury P.D.O.
5B. MULTIPLE VEH CRASH Total Fatal Injury P.D.O. 115 95 5 2151. Moving in opposite dir. 945 420 1 1,3662. Both moving in same dir. 196 52 1 2493a. One car parked
1,255 993 1 2,2493b. One car stopped in traffic 81 14 954. Enter/Leave parked pos. 59 25 845a. Entering driveway/alley
223 80 3035b. Leaving driveway/alley 111 85 1966. All others
Totals 2,985 1,764 8 4,757
5C. PEDESTRIANCRASHES
All PedCrashes
Fatal Crashes Non-Fatal Injury Crashes
TotalAt
Intersection Non-
Junction TotalAt
IntersectionNon-
Junction1. Car go straight 99 5 5 94 41 532. Car turning right 25 25 21 43. Car turning left 62 1 1 61 54 74. Car backing 3 3 35. All othersTotals 189 6 6 183 116 67
5D. ALL OTHER CRASHES Total Fatal Injury P.D.O.Coll-isionWith
Coll-isionWith
1. Other rd veh or railway train 11 135 146 2. Fixed object 53 28 2 83 3. Other object or animal 1 1 4. Overturning 1 3 4 5. Other noncollision 2 2 6. Other rd veh or railway train 5 61 66 7. Fixed object 192 158 5 355 8. Other object or animal 17 9 26 9. Overturning 5 16 2 23 10. Other noncollision 7 3 1 11 11. Not statedTotals 292415 10 717
6. PEDESTRIAN ACTION BY AGE
Ages of Pedstrians Killed and InjuredPedestrians Killed Total 0 to 4 5 to 9 10 to 14 15 to 19 20 to 24 25 to 44 45 to 64 65 & older Not stated
1a. X-ing at intersect or X-walk 9 11 42 34 9 15 4 1 2 127 6 1b. X-ing not at intersection 2 1 7 12 7 6 6 1 2 44 2a. Walking in road with traffic 1 1 2 2b. Same against traffic 2 2 3. Standing in roadway 1 2 1 4 4. Push or work on veh in road 5. Other working in roadway 1 1 6. Playing in roadway 1 1 7. Other in roadway 1 1 1 1 4 8. Not in roadway 1 3 7 2 2 15 9. Not stated
1214 55 581924113 4 200 6 Totals
7. AGE OF DRIVER All Crashes Fatal Injury 1. 14 & YOUNGER 1 2. 15 10 1 4 3. 16 135 53 4. 17 232 102 5. 18 374 193 6. 19 362 172 7. 20 391 193 8. 21 387 1 190 9. 22 to 24 1,239 3 597 10. 25 to 34 3,870 9 1,822 11. 35 to 44 3,382 7 1,544 12. 45 to 54 3,092 8 1,328 13. 55 to 64 2,152 6 914 14. 65 to 74 757 2 296 15. 75 & older 560 1 217 16. Not stated 2,748 437 Totals 19,692 38 8,062 8. SEX OF DRIVER Injury Fatal All Crashes
1. Male 10,828 29 4,283 2. Female 8,152 9 3,556 3. Not stated 712 223 Totals 19,692 38 8,062
9. RESIDENCE OF DRIVER All Crashes Fatal Injury
1. Local resident 15,522 31 6,605 2. In-state resident 754 2 344 3. Non resident 1,694 5 676 4. Not stated 1,722 437 Totals 19,692 38 8,062
10. CRASHES BY CONTRIBUTING FACTOR All InjuryFatal1. Speed too fast
1,611 21 15
369 124
7. Followed too closely 3,666 2 1 3 1
94 45
830 250
6. Improper overtaking5. Drove left of center4. Disregard traffic signal3. Passed stop sign2. Failed to yield 2,265 7 1,006
282 12 598
8. Made improper turn
Totals 11,412 47 4,747 576
29 391 157 166
2 1 8
10
1,528 66
1,210 287 573
12. Other 11. Mechanical defect10. Improper driving9. Had been drinking
12. ROAD SURFACECONDITION InjuryFatalAll
1. Dry 6,960 16 2,8832. Wet 2,628 8 1,1073. Snowy or icy 81 1 354. Other 5. Not stated 216 1 13Totals 9,885 26 4,038
13. LIGHT CONDITION InjuryFatalAll1. Daylight 7,250 10 2,9412. Dawn or Dusk 401 2 1673. Darkness 2,212 14 9274. Not stated 22 3Totals 9,885 26 4,038
11. VEHICLE TYPE InjuryFatalAll1. Passenger car 19,315 33 7,8342. Pass Car and trailer 62 173. Truck or truck tractor 157 1 654. Truck tractor with semi-trailer 315 2 985. Other truck combination 6 26. Farm tractor and/or equip. 7. Taxicab 36 208. Bus 102 1 429. School bus 25 310. Motorcycle 93 4 7211. Motor scooter or moped 19 1412. Others and not stated 55 20Totals 20,185 41 8,187Special vehicles included above 13. Log trucks14. Emergency (incl. private) 73 1 3015. Military vehicles 16. Other public vehicles 153 1 52
1. Primary State Highways 2. Secondary State Highways 3. County and Local Roads 4. City Streets 5. Not Stated Total--Rural Area
NOTE: THIS YEAR TO DATE represents only those crashes entered onto the database as of the date above. SAME PERIOD LAST YEAR represents all crashes including late reports. MAJOR INJURIES are incapacitating injuries. MINOR INJURIES are non-incapacitating evident injuries.
3. LOCATION Total
PropertyDamage
Nonfatal Injury Fatal Property
DamageNonfatal
InjuryFatalTotalPropertyDamage
Nonfatal Injury Fatal Total Killed Injured
Total On Roadway TotalOff Roadway Number Of Crashes Number Of Persons
1. Below 1,000 2. 1,000 to 2,500 3. 2,501 to 5,000 4. 5,001 to 10,000 5. 10,001 to 25,000 6. 25,001 to 50,000 7. 50,001 to 100,000 8. 100,001 to 200,000 9. City of Portland Only Total - Municipalities
1 315
315 1
131 183
131 183
1 119 167 287
1 119 167 287
12 16 28
12 16 28
193 1
193 1
107 3 8 11 89 66 155 92 74 166 1. Primary State Highways 2. Secondary State Highways 3. County and Local Roads
86 1 13 4 17 78 53 1 132 91 57 1 149 4. City Streets 5. Not Stated Total--Urban Area 193116 12 281671191287183 131 1 315 6. Interstate System 7. Other State Freeways 8. Other State Highways 166 74 92 155 66 89 11 8 3 107Total--Urban System 166 74 92 155 66 89 11 8 3 107
6. Interstate System 7. Other State Freeways 8. Other State Highways Total--Rural System
June 1, 2007
REDMOND
186
At I
nter
sect
ion
Not
at I
nter
sect
ion
At
Inte
r. N
on -I
nter
.
REDMOND 2006 OREGON CRASHES
4. AGE OF CASUALTY
Number of Persons Killed Number of Persons Injured Total Killed Pedestrians Pedalcyclist Total Injured Pedestrians Pedalcyclist
Total Total Total Total Total TotalMale Male Male Male Male MaleFemale Female Female Female Female Female1. 0 to 4 2 2 42. 5 to 9 1 1 1 2 13. 10 to 14 1 1 5 3 84. 15 to 19 27 8 355. 20 to 24 1 1 10 11 216. 25 to 34 16 16 327. 35 to 44 2 1 1 13 14 27 1 1 1 18. 45 to 54 17 11 289. 55 to 64 8 12 2010. 65 to 74 5 5 1011. 75 & older 1 1 3 2 512. Not-stated 1 1Totals 1 1 1 1 193 85 108 5 3 2 1 1
Directional Analysis - A crash consisting of a series of collisions, overturning, etc., is classified according to the first damage or injury producing event; includes on roadway and off roadway.5A. MULTIPLE VEH CRASH Total Fatal Injury P.D.O.
Junction1. Car go straight 2 2 1 12. Car turning right 1 1 13. Car turning left 1 1 14. Car backing5. All othersTotals 4 4 3 1
5D. ALL OTHER CRASHES Total Fatal Injury P.D.O.Coll-isionWith
Coll-isionWith
1. Other rd veh or railway train 1 1 2. Fixed object 4 4 3. Other object or animal4. Overturning 1 1 5. Other noncollision6. Other rd veh or railway train 1 1 7. Fixed object 6 11 17 8. Other object or animal 1 1 2 9. Overturning 1 1 10. Other noncollision11. Not statedTotals 1115 1 27
6. PEDESTRIAN ACTION BY AGE
Ages of Pedstrians Killed and InjuredPedestrians Killed Total 0 to 4 5 to 9 10 to 14 15 to 19 20 to 24 25 to 44 45 to 64 65 & older Not stated
1a. X-ing at intersect or X-walk 1 2 1 4 1b. X-ing not at intersection 1 1 2a. Walking in road with traffic 2b. Same against traffic 3. Standing in roadway 4. Push or work on veh in road 5. Other working in roadway 6. Playing in roadway 7. Other in roadway 8. Not in roadway 9. Not stated
1 211 5 Totals
7. AGE OF DRIVER All Crashes Fatal Injury 1. 14 & YOUNGER 1 1 2. 15 2 3. 16 20 10 4. 17 27 15 5. 18 17 7 6. 19 20 11 7. 20 14 6 8. 21 20 10 9. 22 to 24 35 1 18 10. 25 to 34 113 47 11. 35 to 44 93 44 12. 45 to 54 98 42 13. 55 to 64 62 25 14. 65 to 74 39 13 15. 75 & older 18 4 16. Not stated 30 3 Totals 609 1 256 8. SEX OF DRIVER Injury Fatal All Crashes
1. Male 345 140 2. Female 259 1 114 3. Not stated 5 2 Totals 609 1 256
9. RESIDENCE OF DRIVER All Crashes Fatal Injury
1. Local resident 525 222 2. In-state resident 50 23 3. Non resident 17 7 4. Not stated 17 1 4 Totals 609 1 256
10. CRASHES BY CONTRIBUTING FACTOR All InjuryFatal1. Speed too fast
37 3 2 4 9
7. Followed too closely 72 7 2
17 26
6. Improper overtaking5. Drove left of center4. Disregard traffic signal3. Passed stop sign2. Failed to yield 104 41
20 30
8. Made improper turn
Totals 390 1 171 24
17 8 6
1
54
31 12 35
12. Other 11. Mechanical defect10. Improper driving9. Had been drinking
12. ROAD SURFACECONDITION InjuryFatalAll
1. Dry 274 1 1182. Wet 24 63. Snowy or icy 13 74. Other 5. Not stated 4Totals 315 1 131
13. LIGHT CONDITION InjuryFatalAll1. Daylight 249 1 1032. Dawn or Dusk 7 33. Darkness 59 254. Not statedTotals 315 1 131
11. VEHICLE TYPE InjuryFatalAll1. Passenger car 593 1 2472. Pass Car and trailer 33. Truck or truck tractor 14. Truck tractor with semi-trailer 10 45. Other truck combination 6. Farm tractor and/or equip. 7. Taxicab 8. Bus9. School bus 3 210. Motorcycle 3 211. Motor scooter or moped 1 112. Others and not stated 2 1Totals 616 1 257Special vehicles included above 13. Log trucks14. Emergency (incl. private) 115. Military vehicles 16. Other public vehicles 3 1
1. Primary State Highways 2. Secondary State Highways 3. County and Local Roads 4. City Streets 5. Not Stated Total--Rural Area
NOTE: THIS YEAR TO DATE represents only those crashes entered onto the database as of the date above. SAME PERIOD LAST YEAR represents all crashes including late reports. MAJOR INJURIES are incapacitating injuries. MINOR INJURIES are non-incapacitating evident injuries.
3. LOCATION Total
PropertyDamage
Nonfatal Injury Fatal Property
DamageNonfatal
InjuryFatalTotalPropertyDamage
Nonfatal Injury Fatal Total Killed Injured
Total On Roadway TotalOff Roadway Number Of Crashes Number Of Persons
1. Below 1,000 2. 1,000 to 2,500 3. 2,501 to 5,000 4. 5,001 to 10,000 5. 10,001 to 25,000 6. 25,001 to 50,000 7. 50,001 to 100,000 8. 100,001 to 200,000 9. City of Portland Only Total - Municipalities
3. County and Local Roads 207 1 12 9 1 22 153 128 281 165 137 1 303 4. City Streets
5. Not Stated Total--Urban Area 267213 11 1 251971641362210 175 2 387 6. Interstate System 10 1 5 4 8 3 4 2 2 1 77. Other State Freeways 8. Other State Highways 74 33 41 73 33 40 1 1 53Total--Urban System 84 1 38 45 81 1 36 44 3 2 1 1 60
6. Interstate System 7. Other State Freeways 8. Other State Highways Total--Rural System
June 1, 2007
ROSEBURG
188
At I
nter
sect
ion
Not
at I
nter
sect
ion
At
Inte
r. N
on -I
nter
.
ROSEBURG 2006 OREGON CRASHES
4. AGE OF CASUALTY
Number of Persons Killed Number of Persons Injured Total Killed Pedestrians Pedalcyclist Total Injured Pedestrians Pedalcyclist
Total Total Total Total Total TotalMale Male Male Male Male MaleFemale Female Female Female Female Female1. 0 to 4 6 62. 5 to 9 2 5 6 11 23. 10 to 14 1 3 6 9 14. 15 to 19 1 34 16 50 1 1 15. 20 to 24 1 1 1 17 9 26 16. 25 to 34 21 10 317. 35 to 44 2 2 2 27 15 42 28. 45 to 54 2 1 2 27 19 46 19. 55 to 64 1 1 16 5 2110. 65 to 74 6 5 1111. 75 & older 10 2 12 1 112. Not-stated 1 1 1 2 1Totals 2 2 267 100 167 6 4 2 9 9
Directional Analysis - A crash consisting of a series of collisions, overturning, etc., is classified according to the first damage or injury producing event; includes on roadway and off roadway.5A. MULTIPLE VEH CRASH Total Fatal Injury P.D.O.
5B. MULTIPLE VEH CRASH Total Fatal Injury P.D.O. 8 4 121. Moving in opposite dir.
25 14 1 402. Both moving in same dir. 9 1 103a. One car parked
38 45 833b. One car stopped in traffic 3 1 44. Enter/Leave parked pos. 6 2 85a. Entering driveway/alley
19 5 245b. Leaving driveway/alley 9 7 166. All others
Totals 117 79 1 197
5C. PEDESTRIANCRASHES
All PedCrashes
Fatal Crashes Non-Fatal Injury Crashes
TotalAt
Intersection Non-
Junction TotalAt
IntersectionNon-
Junction1. Car go straight 4 4 1 32. Car turning right 1 1 13. Car turning left 1 1 14. Car backing5. All othersTotals 6 6 3 3
5D. ALL OTHER CRASHES Total Fatal Injury P.D.O.Coll-isionWith
Coll-isionWith
1. Other rd veh or railway train 7 7 2. Fixed object 2 2 3. Other object or animal4. Overturning 5. Other noncollision6. Other rd veh or railway train 2 2 7. Fixed object 3 6 1 10 8. Other object or animal 1 1 2 9. Overturning 1 1 10. Other noncollision11. Not statedTotals 419 1 24
6. PEDESTRIAN ACTION BY AGE
Ages of Pedstrians Killed and InjuredPedestrians Killed Total 0 to 4 5 to 9 10 to 14 15 to 19 20 to 24 25 to 44 45 to 64 65 & older Not stated
1a. X-ing at intersect or X-walk 1 2 3 1b. X-ing not at intersection 2 1 3 2a. Walking in road with traffic 2b. Same against traffic 3. Standing in roadway 4. Push or work on veh in road 5. Other working in roadway 6. Playing in roadway 7. Other in roadway 8. Not in roadway 9. Not stated
3 21 6 Totals
7. AGE OF DRIVER All Crashes Fatal Injury 1. 14 & YOUNGER 1 1 2. 15 3. 16 13 5 4. 17 41 22 5. 18 37 1 21 6. 19 20 7 7. 20 21 11 8. 21 14 8 9. 22 to 24 49 17 10. 25 to 34 81 48 11. 35 to 44 104 60 12. 45 to 54 123 63 13. 55 to 64 90 1 31 14. 65 to 74 59 20 15. 75 & older 55 1 23 16. Not stated 53 5 Totals 761 3 342 8. SEX OF DRIVER Injury Fatal All Crashes
1. Male 372 1 158 2. Female 378 2 180 3. Not stated 11 4 Totals 761 3 342
9. RESIDENCE OF DRIVER All Crashes Fatal Injury
1. Local resident 656 1 301 2. In-state resident 52 1 25 3. Non resident 27 1 11 4. Not stated 26 5 Totals 761 3 342
10. CRASHES BY CONTRIBUTING FACTOR All InjuryFatal1. Speed too fast
51 1 3
12 5
7. Followed too closely 83 2 7
28 9
6. Improper overtaking5. Drove left of center4. Disregard traffic signal3. Passed stop sign2. Failed to yield 125 57
18 1 33
8. Made improper turn
Totals 431 2 208 32
7 14 3 5 1
70 8
35 4
27
12. Other 11. Mechanical defect10. Improper driving9. Had been drinking
12. ROAD SURFACECONDITION InjuryFatalAll
1. Dry 304 2 1402. Wet 74 343. Snowy or icy 3 14. Other 5. Not stated 6Totals 387 2 175
13. LIGHT CONDITION InjuryFatalAll1. Daylight 305 1382. Dawn or Dusk 26 143. Darkness 56 2 234. Not statedTotals 387 2 175
11. VEHICLE TYPE InjuryFatalAll1. Passenger car 759 2 3412. Pass Car and trailer 1 13. Truck or truck tractor 34. Truck tractor with semi-trailer 5 25. Other truck combination 16. Farm tractor and/or equip. 7. Taxicab 18. Bus9. School bus10. Motorcycle 3 311. Motor scooter or moped 1 112. Others and not stated 2Totals 776 2 348Special vehicles included above 13. Log trucks14. Emergency (incl. private) 3 115. Military vehicles 16. Other public vehicles 6 4
14. MANNER OF COLLISION InjuryFatalAll
1. Head-on 2 12. Rear end 134 723. Angle 173 1 654. Sideswipe-meeting 4 15. Sideswipe-overtaking 32 96. Backed into 8 27. Other 4Totals 357 1 150
11. Count of vehicles, including properly parked vehicles.
Totals include participant records where gender was coded as "unknown".
10. Count of crashes. Crashes with multiple contributing circumstances are counted in all applicable categories.
MULTIPLE VEHICLE CRASHES
7 - 9. Tally of drivers by age, sex, residence & crash severity. Excludes occupants of properly & improperly parked vehicles.
189
Col
lisio
n in
volv
ing:
N
on-
coll.
N
on-
coll.
C
ollis
ion
invo
lvin
g:
Non
- co
ll.
Col
lisio
n in
volv
ing:
3C
. RU
RA
L 3A
. Inc
orpo
rate
d A
reas
3B
. UR
BA
N
SUMMARY OF MOTOR VEHICLE TRAFFIC CRASHES 2006 OREGON CRASHESForIn
1. Primary State Highways 2. Secondary State Highways 3. County and Local Roads 4. City Streets 5. Not Stated Total--Rural Area
NOTE: THIS YEAR TO DATE represents only those crashes entered onto the database as of the date above. SAME PERIOD LAST YEAR represents all crashes including late reports. MAJOR INJURIES are incapacitating injuries. MINOR INJURIES are non-incapacitating evident injuries.
3. LOCATION Total
PropertyDamage
Nonfatal Injury Fatal Property
DamageNonfatal
InjuryFatalTotalPropertyDamage
Nonfatal Injury Fatal Total Killed Injured
Total On Roadway TotalOff Roadway Number Of Crashes Number Of Persons
1. Below 1,000 2. 1,000 to 2,500 3. 2,501 to 5,000 4. 5,001 to 10,000 5. 10,001 to 25,000 6. 25,001 to 50,000 7. 50,001 to 100,000 8. 100,001 to 200,000 9. City of Portland Only Total - Municipalities
3. County and Local Roads 1,184 2 78 46 124 818 731 1 1,550 896 777 1 1,674 4. City Streets
5. Not Stated Total--Urban Area 1,6275105 71 1761,06897022,040 1,173 1,041 2 2,216 6. Interstate System 66 32 34 52 24 28 14 8 6 607. Other State Freeways 138 1 73 64 124 69 54 14 4 10 3 1248. Other State Highways 338 159 179 314 146 168 24 13 11 259Total--Urban System 542 1 264 277 490 1 239 250 52 25 27 3 443
6. Interstate System 7. Other State Freeways 8. Other State Highways Total--Rural System
June 1, 2007
SALEM
190
At I
nter
sect
ion
Not
at I
nter
sect
ion
At
Inte
r. N
on -I
nter
.
SALEM 2006 OREGON CRASHES
4. AGE OF CASUALTY
Number of Persons Killed Number of Persons Injured Total Killed Pedestrians Pedalcyclist Total Injured Pedestrians Pedalcyclist
Total Total Total Total Total TotalMale Male Male Male Male MaleFemale Female Female Female Female Female1. 0 to 4 17 11 282. 5 to 9 2 1 1 27 14 413. 10 to 14 4 3 2 2 39 25 64 34. 15 to 19 2 1 6 1 1 125 76 201 1 1 55. 20 to 24 4 1 2 2 120 79 199 1 1 16. 25 to 34 2 2 6 1 1 172 122 294 47. 35 to 44 4 2 7 1 3 130 122 252 1 1 58. 45 to 54 3 1 6 3 154 108 262 1 1 59. 55 to 64 3 2 2 1 88 56 144 1 1 210. 65 to 74 1 1 1 46 20 66 111. 75 & older 28 23 5112. Not-stated 2 2 5 2 10 14 25 3Totals 5 3 2 1,627 670 956 27 13 14 37 29 8
Directional Analysis - A crash consisting of a series of collisions, overturning, etc., is classified according to the first damage or injury producing event; includes on roadway and off roadway.5A. MULTIPLE VEH CRASH Total Fatal Injury P.D.O.
5B. MULTIPLE VEH CRASH Total Fatal Injury P.D.O. 18 21 1 401. Moving in opposite dir.
135 68 2032. Both moving in same dir. 38 6 443a. One car parked
234 265 4993b. One car stopped in traffic 15 2 174. Enter/Leave parked pos. 13 2 155a. Entering driveway/alley 64 24 885b. Leaving driveway/alley 31 36 676. All others
Totals 548 424 1 973
5C. PEDESTRIANCRASHES
All PedCrashes
Fatal Crashes Non-Fatal Injury Crashes
TotalAt
Intersection Non-
Junction TotalAt
IntersectionNon-
Junction1. Car go straight 10 10 2 82. Car turning right 4 4 3 13. Car turning left 11 11 10 14. Car backing 1 1 15. All othersTotals 26 26 16 10
5D. ALL OTHER CRASHES Total Fatal Injury P.D.O.Coll-isionWith
Coll-isionWith
1. Other rd veh or railway train 25 25 2. Fixed object 14 4 18 3. Other object or animal 1 1 4. Overturning 2 2 5. Other noncollision6. Other rd veh or railway train 12 12 7. Fixed object 55 55 110 8. Other object or animal 7 2 9 9. Overturning 4 4 10. Other noncollision 1 1 11. Not statedTotals 76106 182
6. PEDESTRIAN ACTION BY AGE
Ages of Pedstrians Killed and InjuredPedestrians Killed Total 0 to 4 5 to 9 10 to 14 15 to 19 20 to 24 25 to 44 45 to 64 65 & older Not stated
1a. X-ing at intersect or X-walk 1 1 4 4 2 1 3 1 17 1b. X-ing not at intersection 1 1 2 1 1 1 7 2a. Walking in road with traffic 2b. Same against traffic 3. Standing in roadway 1 1 4. Push or work on veh in road 5. Other working in roadway 6. Playing in roadway 7. Other in roadway 8. Not in roadway 1 1 2 9. Not stated
21 6 64242 27 Totals
7. AGE OF DRIVER All Crashes Fatal Injury 1. 14 & younger 2. 15 2 1 3. 16 77 42 4. 17 98 48 5. 18 146 75 6. 19 144 77 7. 20 114 55 8. 21 104 1 60 9. 22 to 24 280 141 10. 25 to 34 788 1 424 11. 35 to 44 697 1 368 12. 45 to 54 675 1 359 13. 55 to 64 453 241 14. 65 to 74 218 102 15. 75 & older 164 69 16. Not stated 481 78 Totals 4,441 4 2,140 8. SEX OF DRIVER Injury Fatal All Crashes
1. Male 2,242 3 1,035 2. Female 2,097 1 1,062 3. Not stated 102 43 Totals 4,441 4 2,140
9. RESIDENCE OF DRIVER All Crashes Fatal Injury
1. Local resident 3,795 3 1,909 2. In-state resident 292 1 129 3. Non resident 87 29 4. Not stated 267 73 Totals 4,441 4 2,140
10. CRASHES BY CONTRIBUTING FACTOR All InjuryFatal1. Speed too fast
222 7
16 104
10
7. Followed too closely 492
1 1
12 35
214 25
6. Improper overtaking5. Drove left of center4. Disregard traffic signal3. Passed stop sign2. Failed to yield 583 293
336 588
8. Made improper turn
Totals 2,546 2 1,227 153
2 31 30 23
340 5
99 51
102
12. Other 11. Mechanical defect10. Improper driving9. Had been drinking
12. ROAD SURFACECONDITION InjuryFatalAll
1. Dry 1,551 1 7422. Wet 576 1 2803. Snowy or icy 30 134. Other 5. Not stated 59 6Totals 2,216 2 1,041
13. LIGHT CONDITION InjuryFatalAll1. Daylight 1,622 7542. Dawn or Dusk 118 483. Darkness 473 2 2384. Not stated 3 1Totals 2,216 2 1,041
11. VEHICLE TYPE InjuryFatalAll1. Passenger car 4,388 4 2,0992. Pass Car and trailer 20 63. Truck or truck tractor 5 34. Truck tractor with semi-trailer 48 195. Other truck combination 3 16. Farm tractor and/or equip. 1 17. Taxicab 1 18. Bus 5 19. School bus 6 310. Motorcycle 21 1711. Motor scooter or moped 1 112. Others and not stated 7Totals 4,506 4 2,152Special vehicles included above 13. Log trucks14. Emergency (incl. private) 6 315. Military vehicles 16. Other public vehicles 18 5
14. MANNER OF COLLISION InjuryFatalAll
1. Head-on 14 1 52. Rear end 921 4813. Angle 869 1 3914. Sideswipe-meeting 9 55. Sideswipe-overtaking 131 246. Backed into 43 17. Other 21 2Totals 2,008 2 909
11. Count of vehicles, including properly parked vehicles.
Totals include participant records where gender was coded as "unknown".
10. Count of crashes. Crashes with multiple contributing circumstances are counted in all applicable categories.
MULTIPLE VEHICLE CRASHES
7 - 9. Tally of drivers by age, sex, residence & crash severity. Excludes occupants of properly & improperly parked vehicles.
191
Col
lisio
n in
volv
ing:
N
on-
coll.
N
on-
coll.
C
ollis
ion
invo
lvin
g:
Non
- co
ll.
Col
lisio
n in
volv
ing:
3C
. RU
RA
L 3A
. Inc
orpo
rate
d A
reas
3B
. UR
BA
N
SUMMARY OF MOTOR VEHICLE TRAFFIC CRASHES 2006 OREGON CRASHESForIn
1. Primary State Highways 2. Secondary State Highways 3. County and Local Roads 4. City Streets 5. Not Stated Total--Rural Area
NOTE: THIS YEAR TO DATE represents only those crashes entered onto the database as of the date above. SAME PERIOD LAST YEAR represents all crashes including late reports. MAJOR INJURIES are incapacitating injuries. MINOR INJURIES are non-incapacitating evident injuries.
3. LOCATION Total
PropertyDamage
Nonfatal Injury Fatal Property
DamageNonfatal
InjuryFatalTotalPropertyDamage
Nonfatal Injury Fatal Total Killed Injured
Total On Roadway TotalOff Roadway Number Of Crashes Number Of Persons
1. Below 1,000 2. 1,000 to 2,500 3. 2,501 to 5,000 4. 5,001 to 10,000 5. 10,001 to 25,000 6. 25,001 to 50,000 7. 50,001 to 100,000 8. 100,001 to 200,000 9. City of Portland Only Total - Municipalities
135
135
53 82
53 82
46 73 119
46 73 119
7 9 16
7 9 16
91
91
41 1 2 3 21 19 40 22 21 43 1. Primary State Highways 2. Secondary State Highways 3. County and Local Roads
50 8 5 13 52 27 79 60 32 92 4. City Streets 5. Not Stated Total--Urban Area 919 7 16734611982 53 135 6. Interstate System 7. Other State Freeways 8. Other State Highways 43 21 22 40 19 21 3 2 1 41Total--Urban System 43 21 22 40 19 21 3 2 1 41
6. Interstate System 7. Other State Freeways 8. Other State Highways Total--Rural System
June 1, 2007
SHERWOOD
192
At I
nter
sect
ion
Not
at I
nter
sect
ion
At
Inte
r. N
on -I
nter
.
SHERWOOD 2006 OREGON CRASHES
4. AGE OF CASUALTY
Number of Persons Killed Number of Persons Injured Total Killed Pedestrians Pedalcyclist Total Injured Pedestrians Pedalcyclist
Total Total Total Total Total TotalMale Male Male Male Male MaleFemale Female Female Female Female Female1. 0 to 4 1 12. 5 to 9 1 13. 10 to 14 1 1 3 4 14. 15 to 19 1 1 1 3 6 9 15. 20 to 24 4 5 96. 25 to 34 1 12 6 18 17. 35 to 44 1 8 9 17 18. 45 to 54 7 10 179. 55 to 64 2 9 1110. 65 to 74 1 1 211. 75 & older 1 112. Not-stated 1 1Totals 91 51 40 1 1 4 4
Directional Analysis - A crash consisting of a series of collisions, overturning, etc., is classified according to the first damage or injury producing event; includes on roadway and off roadway.5A. MULTIPLE VEH CRASH Total Fatal Injury P.D.O.
Junction1. Car go straight2. Car turning right 3. Car turning left 1 1 14. Car backing5. All othersTotals 1 1 1
5D. ALL OTHER CRASHES Total Fatal Injury P.D.O.Coll-isionWith
Coll-isionWith
1. Other rd veh or railway train 4 4 2. Fixed object 1 1 3. Other object or animal4. Overturning 5. Other noncollision 6. Other rd veh or railway train7. Fixed object 4 2 6 8. Other object or animal9. Overturning 1 1 10. Other noncollision11. Not statedTotals 57 12
6. PEDESTRIAN ACTION BY AGE
Ages of Pedstrians Killed and InjuredPedestrians Killed Total 0 to 4 5 to 9 10 to 14 15 to 19 20 to 24 25 to 44 45 to 64 65 & older Not stated
1a. X-ing at intersect or X-walk 1b. X-ing not at intersection 2a. Walking in road with traffic 2b. Same against traffic 3. Standing in roadway 4. Push or work on veh in road 5. Other working in roadway 6. Playing in roadway 7. Other in roadway 8. Not in roadway 1 1 9. Not stated
1 1 Totals
7. AGE OF DRIVER All Crashes Fatal Injury 1. 14 & younger 2. 15 3. 16 2 4. 17 7 5 5. 18 7 2 6. 19 6 1 7. 20 5 2 8. 21 9 3 9. 22 to 24 15 8 10. 25 to 34 49 22 11. 35 to 44 61 25 12. 45 to 54 34 17 13. 55 to 64 31 12 14. 65 to 74 8 3 15. 75 & older 5 2 16. Not stated 28 4 Totals 267 106 8. SEX OF DRIVER Injury Fatal All Crashes
1. Male 151 63 2. Female 110 42 3. Not stated 6 1 Totals 267 106
9. RESIDENCE OF DRIVER All Crashes Fatal Injury
1. Local resident 216 88 2. In-state resident 22 10 3. Non resident 12 5 4. Not stated 17 3 Totals 267 106
10. CRASHES BY CONTRIBUTING FACTOR All InjuryFatal1. Speed too fast
18
4
7. Followed too closely 51
8
6. Improper overtaking5. Drove left of center4. Disregard traffic signal3. Passed stop sign2. Failed to yield 23 7
15 27
8. Made improper turn
Totals 154 65 15
3 1 2
24
10 5 6
12. Other 11. Mechanical defect10. Improper driving9. Had been drinking
12. ROAD SURFACECONDITION InjuryFatalAll
1. Dry 87 362. Wet 43 163. Snowy or icy 2 14. Other 5. Not stated 3Totals 135 53
13. LIGHT CONDITION InjuryFatalAll1. Daylight 96 372. Dawn or Dusk 11 23. Darkness 28 144. Not statedTotals 135 53
11. VEHICLE TYPE InjuryFatalAll1. Passenger car 257 1062. Pass Car and trailer 43. Truck or truck tractor 4 44. Truck tractor with semi-trailer 35. Other truck combination 1 16. Farm tractor and/or equip. 7. Taxicab 8. Bus 9. School bus 10. Motorcycle 11. Motor scooter or moped 12. Others and not stated 7Totals 276 111Special vehicles included above 13. Log trucks14. Emergency (incl. private) 215. Military vehicles 16. Other public vehicles 1
14. MANNER OF COLLISION InjuryFatalAll
1. Head-on 12. Rear end 77 343. Angle 30 94. Sideswipe-meeting 5. Sideswipe-overtaking 9 16. Backed into 47. Other 1 1Totals 122 45
11. Count of vehicles, including properly parked vehicles.
Totals include participant records where gender was coded as "unknown".
10. Count of crashes. Crashes with multiple contributing circumstances are counted in all applicable categories.
MULTIPLE VEHICLE CRASHES
7 - 9. Tally of drivers by age, sex, residence & crash severity. Excludes occupants of properly & improperly parked vehicles.
193
Col
lisio
n in
volv
ing:
N
on-
coll.
N
on-
coll.
C
ollis
ion
invo
lvin
g:
Non
- co
ll.
Col
lisio
n in
volv
ing:
3C
. RU
RA
L 3A
. Inc
orpo
rate
d A
reas
3B
. UR
BA
N
SUMMARY OF MOTOR VEHICLE TRAFFIC CRASHES 2006 OREGON CRASHESForIn
1. Primary State Highways 2. Secondary State Highways 3. County and Local Roads 4. City Streets 5. Not Stated Total--Rural Area
NOTE: THIS YEAR TO DATE represents only those crashes entered onto the database as of the date above. SAME PERIOD LAST YEAR represents all crashes including late reports. MAJOR INJURIES are incapacitating injuries. MINOR INJURIES are non-incapacitating evident injuries.
3. LOCATION Total
PropertyDamage
Nonfatal Injury Fatal Property
DamageNonfatal
InjuryFatalTotalPropertyDamage
Nonfatal Injury Fatal Total Killed Injured
Total On Roadway TotalOff Roadway Number Of Crashes Number Of Persons
1. Below 1,000 2. 1,000 to 2,500 3. 2,501 to 5,000 4. 5,001 to 10,000 5. 10,001 to 25,000 6. 25,001 to 50,000 7. 50,001 to 100,000 8. 100,001 to 200,000 9. City of Portland Only Total - Municipalities
3. County and Local Roads 157 3 30 9 1 40 195 105 2 302 225 114 3 342 4. City Streets
5. Not Stated Total--Urban Area 2991039 21 1 613381866530377 207 7 591 6. Interstate System 7 3 4 6 2 4 1 1 57. Other State Freeways 40 1 16 23 34 14 19 6 2 4 4 188. Other State Highways 202 3 74 125 188 65 120 14 9 5 3 119Total--Urban System 249 4 93 152 228 4 81 143 21 12 9 7 142
6. Interstate System 7. Other State Freeways 8. Other State Highways Total--Rural System
June 1, 2007
SPRINGFIELD
194
At I
nter
sect
ion
Not
at I
nter
sect
ion
At
Inte
r. N
on -I
nter
.
SPRINGFIELD 2006 OREGON CRASHES
4. AGE OF CASUALTY
Number of Persons Killed Number of Persons Injured Total Killed Pedestrians Pedalcyclist Total Injured Pedestrians Pedalcyclist
Total Total Total Total Total TotalMale Male Male Male Male MaleFemale Female Female Female Female Female1. 0 to 4 3 3 6 1 12. 5 to 9 1 1 4 5 13. 10 to 14 2 2 1 4 54. 15 to 19 2 1 2 1 1 36 23 59 15. 20 to 24 1 2 1 28 20 48 1 1 26. 25 to 34 1 2 3 1 26 21 47 3 2 1 17. 35 to 44 1 1 1 30 18 48 18. 45 to 54 1 1 3 1 19 17 36 1 1 29. 55 to 64 16 3 19 3 3 1 1 1 110. 65 to 74 10 6 16 1 1 1 1 11. 75 & older 5 3 812. Not-stated 1 1 1 1 2Totals 10 7 3 2 1 1 1 1 299 123 176 9 5 4 12 8 4
Directional Analysis - A crash consisting of a series of collisions, overturning, etc., is classified according to the first damage or injury producing event; includes on roadway and off roadway.5A. MULTIPLE VEH CRASH Total Fatal Injury P.D.O.
5B. MULTIPLE VEH CRASH Total Fatal Injury P.D.O. 16 5 1 221. Moving in opposite dir. 35 12 472. Both moving in same dir. 16 5 213a. One car parked
137 75 2123b. One car stopped in traffic 4 1 54. Enter/Leave parked pos. 1 1 1 35a. Entering driveway/alley
22 6 285b. Leaving driveway/alley 22 13 356. All others
Totals 253 118 2 373
5C. PEDESTRIANCRASHES
All PedCrashes
Fatal Crashes Non-Fatal Injury Crashes
TotalAt
Intersection Non-
Junction TotalAt
IntersectionNon-
Junction1. Car go straight 8 2 2 6 1 52. Car turning right 2 2 1 13. Car turning left 1 1 14. Car backing5. All othersTotals 11 2 2 9 3 6
5D. ALL OTHER CRASHES Total Fatal Injury P.D.O.Coll-isionWith
Coll-isionWith
1. Other rd veh or railway train 7 7 2. Fixed object 4 2 6 3. Other object or animal4. Overturning 5. Other noncollision6. Other rd veh or railway train 5 1 6 7. Fixed object 17 13 30 8. Other object or animal 1 1 9. Overturning 1 1 10. Other noncollision11. Not statedTotals 2228 1 51
6. PEDESTRIAN ACTION BY AGE
Ages of Pedstrians Killed and InjuredPedestrians Killed Total 0 to 4 5 to 9 10 to 14 15 to 19 20 to 24 25 to 44 45 to 64 65 & older Not stated
1a. X-ing at intersect or X-walk 1 1 1 1 4 1 1b. X-ing not at intersection 1 1 1 3 2a. Walking in road with traffic 2b. Same against traffic 3. Standing in roadway 1 1 1 4. Push or work on veh in road 5. Other working in roadway 6. Playing in roadway 7. Other in roadway 1 1 2 8. Not in roadway 1 1 9. Not stated
11 2 2122 11 2 Totals
7. AGE OF DRIVER All Crashes Fatal Injury 1. 14 & younger 2. 15 3 3 3. 16 15 4 4. 17 30 1 17 5. 18 37 14 6. 19 39 23 7. 20 30 1 12 8. 21 29 15 9. 22 to 24 87 1 41 10. 25 to 34 175 4 62 11. 35 to 44 175 2 70 12. 45 to 54 163 2 56 13. 55 to 64 128 2 39 14. 65 to 74 68 19 15. 75 & older 35 9 16. Not stated 120 11 Totals 1,134 13 395 8. SEX OF DRIVER Injury Fatal All Crashes
1. Male 589 9 184 2. Female 511 4 203 3. Not stated 34 8 Totals 1,134 13 395
9. RESIDENCE OF DRIVER All Crashes Fatal Injury
1. Local resident 1,040 11 367 2. In-state resident 36 1 14 3. Non resident 19 1 5 4. Not stated 39 9 Totals 1,134 13 395
10. CRASHES BY CONTRIBUTING FACTOR All InjuryFatal1. Speed too fast
19 4
11 2
7. Followed too closely 43 1 1
1 1
26 6
27 7
6. Improper overtaking5. Drove left of center4. Disregard traffic signal3. Passed stop sign2. Failed to yield 184 2 73
83 2 238
8. Made improper turn
Totals 647 17 229 12
12 7 6
4 5
27
38 23 28
12. Other 11. Mechanical defect10. Improper driving9. Had been drinking
12. ROAD SURFACECONDITION InjuryFatalAll
1. Dry 451 6 1602. Wet 135 453. Snowy or icy 4 24. Other 5. Not stated 1 1Totals 591 7 207
13. LIGHT CONDITION InjuryFatalAll1. Daylight 443 2 1562. Dawn or Dusk 21 53. Darkness 127 5 464. Not statedTotals 591 7 207
11. VEHICLE TYPE InjuryFatalAll1. Passenger car 1,129 9 3922. Pass Car and trailer 2 13. Truck or truck tractor 1 14. Truck tractor with semi-trailer 9 1 15. Other truck combination 6. Farm tractor and/or equip. 7. Taxicab8. Bus 4 19. School bus 4 210. Motorcycle 7 2 411. Motor scooter or moped 1 112. Others and not stated 2 1Totals 1,159 13 403Special vehicles included above 13. Log trucks 114. Emergency (incl. private) 4 215. Military vehicles 16. Other public vehicles 7 2
14. MANNER OF COLLISION InjuryFatalAll
1. Head-on 1 12. Rear end 232 843. Angle 218 3 704. Sideswipe-meeting 10 25. Sideswipe-overtaking 51 116. Backed into 13 17. Other 4 2Totals 529 4 170
11. Count of vehicles, including properly parked vehicles.
Totals include participant records where gender was coded as "unknown".
10. Count of crashes. Crashes with multiple contributing circumstances are counted in all applicable categories.
MULTIPLE VEHICLE CRASHES
7 - 9. Tally of drivers by age, sex, residence & crash severity. Excludes occupants of properly & improperly parked vehicles.
195
Col
lisio
n in
volv
ing:
N
on-
coll.
N
on-
coll.
C
ollis
ion
invo
lvin
g:
Non
- co
ll.
Col
lisio
n in
volv
ing:
3C
. RU
RA
L 3A
. Inc
orpo
rate
d A
reas
3B
. UR
BA
N
SUMMARY OF MOTOR VEHICLE TRAFFIC CRASHES 2006 OREGON CRASHESForIn
1. Primary State Highways 2. Secondary State Highways 3. County and Local Roads 4. City Streets 5. Not Stated Total--Rural Area
NOTE: THIS YEAR TO DATE represents only those crashes entered onto the database as of the date above. SAME PERIOD LAST YEAR represents all crashes including late reports. MAJOR INJURIES are incapacitating injuries. MINOR INJURIES are non-incapacitating evident injuries.
3. LOCATION Total
PropertyDamage
Nonfatal Injury Fatal Property
DamageNonfatal
InjuryFatalTotalPropertyDamage
Nonfatal Injury Fatal Total Killed Injured
Total On Roadway TotalOff Roadway Number Of Crashes Number Of Persons
1. Below 1,000 2. 1,000 to 2,500 3. 2,501 to 5,000 4. 5,001 to 10,000 5. 10,001 to 25,000 6. 25,001 to 50,000 7. 50,001 to 100,000 8. 100,001 to 200,000 9. City of Portland Only Total - Municipalities
81
81
41 40
41 40
38 34 72
38 34 72
3 6 9
3 6 9
61
61
13 9 11 20 9 11 20 1. Primary State Highways 2. Secondary State Highways 3. County and Local Roads
48 6 3 9 25 27 52 31 30 61 4. City Streets 5. Not Stated Total--Urban Area 616 3 934387240 41 81 6. Interstate System 7. Other State Freeways 8. Other State Highways 20 11 9 20 11 9 13Total--Urban System 20 11 9 20 11 9 13
6. Interstate System 7. Other State Freeways 8. Other State Highways Total--Rural System
June 1, 2007
ST HELENS
196
At I
nter
sect
ion
Not
at I
nter
sect
ion
At
Inte
r. N
on -I
nter
.
ST HELENS 2006 OREGON CRASHES
4. AGE OF CASUALTY
Number of Persons Killed Number of Persons Injured Total Killed Pedestrians Pedalcyclist Total Injured Pedestrians Pedalcyclist
Total Total Total Total Total TotalMale Male Male Male Male MaleFemale Female Female Female Female Female1. 0 to 4 2. 5 to 9 3. 10 to 14 1 14. 15 to 19 2 3 5 7 12 15. 20 to 24 9 5 146. 25 to 34 4 3 77. 35 to 44 6 3 98. 45 to 54 4 6 109. 55 to 64 2 210. 65 to 74 1 111. 75 & older 2 212. Not-stated 3 3Totals 61 28 33 3 1 2
Directional Analysis - A crash consisting of a series of collisions, overturning, etc., is classified according to the first damage or injury producing event; includes on roadway and off roadway.5A. MULTIPLE VEH CRASH Total Fatal Injury P.D.O.
5B. MULTIPLE VEH CRASH Total Fatal Injury P.D.O. 3 31. Moving in opposite dir.
3 2 52. Both moving in same dir. 2 1 33a. One car parked 6 1 73b. One car stopped in traffic 1 14. Enter/Leave parked pos. 1 15a. Entering driveway/alley 2 1 35b. Leaving driveway/alley
1 16. All others Totals 15 9 24
5C. PEDESTRIANCRASHES
All PedCrashes
Fatal Crashes Non-Fatal Injury Crashes
TotalAt
Intersection Non-
Junction TotalAt
IntersectionNon-
Junction1. Car go straight2. Car turning right3. Car turning left 4. Car backing 5. All othersTotals
5D. ALL OTHER CRASHES Total Fatal Injury P.D.O.Coll-isionWith
Coll-isionWith
1. Other rd veh or railway train2. Fixed object 1 1 3. Other object or animal4. Overturning 5. Other noncollision6. Other rd veh or railway train 2 2 7. Fixed object 3 1 4 8. Other object or animal9. Overturning 10. Other noncollision 11. Not statedTotals 34 7
6. PEDESTRIAN ACTION BY AGE
Ages of Pedstrians Killed and InjuredPedestrians Killed Total 0 to 4 5 to 9 10 to 14 15 to 19 20 to 24 25 to 44 45 to 64 65 & older Not stated
1a. X-ing at intersect or X-walk 1b. X-ing not at intersection 2a. Walking in road with traffic 2b. Same against traffic 3. Standing in roadway 4. Push or work on veh in road 5. Other working in roadway 6. Playing in roadway 7. Other in roadway 8. Not in roadway 9. Not stated Totals
7. AGE OF DRIVER All Crashes Fatal Injury 1. 14 & younger 2. 15 1 3. 16 3 4. 17 7 5 5. 18 6 1 6. 19 6 3 7. 20 3 2 8. 21 2 2 9. 22 to 24 9 8 10. 25 to 34 22 16 11. 35 to 44 22 12 12. 45 to 54 24 14 13. 55 to 64 19 7 14. 65 to 74 6 1 15. 75 & older 7 4 16. Not stated 15 2 Totals 152 77 8. SEX OF DRIVER Injury Fatal All Crashes
1. Male 80 42 2. Female 70 34 3. Not stated 2 1 Totals 152 77
9. RESIDENCE OF DRIVER All Crashes Fatal Injury
1. Local resident 131 67 2. In-state resident 13 7 3. Non resident 3 2 4. Not stated 5 1 Totals 152 77
10. CRASHES BY CONTRIBUTING FACTOR All InjuryFatal1. Speed too fast
10
2
7. Followed too closely 18
4 4
6. Improper overtaking5. Drove left of center4. Disregard traffic signal3. Passed stop sign2. Failed to yield 34 17
3 5
8. Made improper turn
Totals 105 55 8
11 2 2
14
20 3 3
12. Other 11. Mechanical defect10. Improper driving9. Had been drinking
12. ROAD SURFACECONDITION InjuryFatalAll
1. Dry 55 312. Wet 24 103. Snowy or icy 24. Other 5. Not statedTotals 81 41
13. LIGHT CONDITION InjuryFatalAll1. Daylight 65 332. Dawn or Dusk 23. Darkness 14 84. Not statedTotals 81 41
11. VEHICLE TYPE InjuryFatalAll1. Passenger car 145 762. Pass Car and trailer 3. Truck or truck tractor 3 14. Truck tractor with semi-trailer 4 15. Other truck combination 1 16. Farm tractor and/or equip. 7. Taxicab 8. Bus9. School bus 110. Motorcycle 11. Motor scooter or moped 12. Others and not stated 3Totals 157 79Special vehicles included above 13. Log trucks14. Emergency (incl. private) 15. Military vehicles 16. Other public vehicles
14. MANNER OF COLLISION InjuryFatalAll
1. Head-on 1 12. Rear end 29 183. Angle 34 164. Sideswipe-meeting 1 15. Sideswipe-overtaking 16. Backed into 6 17. Other 2Totals 74 37
11. Count of vehicles, including properly parked vehicles.
Totals include participant records where gender was coded as "unknown".
10. Count of crashes. Crashes with multiple contributing circumstances are counted in all applicable categories.
MULTIPLE VEHICLE CRASHES
7 - 9. Tally of drivers by age, sex, residence & crash severity. Excludes occupants of properly & improperly parked vehicles.
197
Col
lisio
n in
volv
ing:
N
on-
coll.
N
on-
coll.
C
ollis
ion
invo
lvin
g:
Non
- co
ll.
Col
lisio
n in
volv
ing:
3C
. RU
RA
L 3A
. Inc
orpo
rate
d A
reas
3B
. UR
BA
N
SUMMARY OF MOTOR VEHICLE TRAFFIC CRASHES 2006 OREGON CRASHESForIn
1. Primary State Highways 2. Secondary State Highways 3. County and Local Roads 4. City Streets 5. Not Stated Total--Rural Area
NOTE: THIS YEAR TO DATE represents only those crashes entered onto the database as of the date above. SAME PERIOD LAST YEAR represents all crashes including late reports. MAJOR INJURIES are incapacitating injuries. MINOR INJURIES are non-incapacitating evident injuries.
3. LOCATION Total
PropertyDamage
Nonfatal Injury Fatal Property
DamageNonfatal
InjuryFatalTotalPropertyDamage
Nonfatal Injury Fatal Total Killed Injured
Total On Roadway TotalOff Roadway Number Of Crashes Number Of Persons
1. Below 1,000 2. 1,000 to 2,500 3. 2,501 to 5,000 4. 5,001 to 10,000 5. 10,001 to 25,000 6. 25,001 to 50,000 7. 50,001 to 100,000 8. 100,001 to 200,000 9. City of Portland Only Total - Municipalities
3. County and Local Roads 58 14 5 19 44 37 81 58 42 100 4. City Streets
5. Not Stated Total--Urban Area 7017 8 2548449265 52 117 6. Interstate System 10 6 4 5 3 2 5 3 2 77. Other State Freeways 8. Other State Highways 7 4 3 6 4 2 1 1 5Total--Urban System 17 10 7 11 7 4 6 3 3 12
6. Interstate System 7. Other State Freeways 8. Other State Highways Total--Rural System
June 1, 2007
THE DALLES
198
At I
nter
sect
ion
Not
at I
nter
sect
ion
At
Inte
r. N
on -I
nter
.
THE DALLES 2006 OREGON CRASHES
4. AGE OF CASUALTY
Number of Persons Killed Number of Persons Injured Total Killed Pedestrians Pedalcyclist Total Injured Pedestrians Pedalcyclist
Total Total Total Total Total TotalMale Male Male Male Male MaleFemale Female Female Female Female Female1. 0 to 4 2. 5 to 9 1 1 2 1 33. 10 to 14 2 2 2 4 24. 15 to 19 1 11 4 15 15. 20 to 24 1 1 2 5 76. 25 to 34 1 1 4 3 77. 35 to 44 1 1 1 1 5 3 88. 45 to 54 1 2 1 3 6 9 29. 55 to 64 2 1 1 5 5 1010. 65 to 74 3 311. 75 & older 2 2 412. Not-stated Totals 70 34 36 7 6 1 6 5 1
Directional Analysis - A crash consisting of a series of collisions, overturning, etc., is classified according to the first damage or injury producing event; includes on roadway and off roadway.5A. MULTIPLE VEH CRASH Total Fatal Injury P.D.O.
5B. MULTIPLE VEH CRASH Total Fatal Injury P.D.O. 1 11. Moving in opposite dir. 5 4 92. Both moving in same dir. 9 2 113a. One car parked 3 6 93b. One car stopped in traffic 4 44. Enter/Leave parked pos.
Junction1. Car go straight 6 6 1 52. Car turning right3. Car turning left 1 1 14. Car backing5. All othersTotals 7 7 2 5
5D. ALL OTHER CRASHES Total Fatal Injury P.D.O.Coll-isionWith
Coll-isionWith
1. Other rd veh or railway train 4 4 2. Fixed object 1 2 3 3. Other object or animal 1 1 4. Overturning5. Other noncollision6. Other rd veh or railway train 2 2 7. Fixed object 5 4 9 8. Other object or animal9. Overturning 10. Other noncollision 11. Not statedTotals 712 19
6. PEDESTRIAN ACTION BY AGE
Ages of Pedstrians Killed and InjuredPedestrians Killed Total 0 to 4 5 to 9 10 to 14 15 to 19 20 to 24 25 to 44 45 to 64 65 & older Not stated
1a. X-ing at intersect or X-walk 1 1 2 1b. X-ing not at intersection 1 1 1 3 2a. Walking in road with traffic 2b. Same against traffic 3. Standing in roadway 1 1 4. Push or work on veh in road 5. Other working in roadway 1 1 6. Playing in roadway 7. Other in roadway 8. Not in roadway 9. Not stated
3 211 7 Totals
7. AGE OF DRIVER All Crashes Fatal Injury 1. 14 & younger 2. 15 3. 16 6 3 4. 17 4 2 5. 18 8 2 6. 19 8 4 7. 20 5 2 8. 21 6 4 9. 22 to 24 12 5 10. 25 to 34 23 11 11. 35 to 44 30 13 12. 45 to 54 27 13 13. 55 to 64 28 13 14. 65 to 74 11 4 15. 75 & older 16 5 16. Not stated 17 4 Totals 201 85 8. SEX OF DRIVER Injury Fatal All Crashes
1. Male 100 43 2. Female 98 41 3. Not stated 3 1 Totals 201 85
9. RESIDENCE OF DRIVER All Crashes Fatal Injury
1. Local resident 163 70 2. In-state resident 16 7 3. Non resident 16 5 4. Not stated 6 3 Totals 201 85
10. CRASHES BY CONTRIBUTING FACTOR All InjuryFatal1. Speed too fast
7
1 1
7. Followed too closely 14 2 1 2 6
6. Improper overtaking5. Drove left of center4. Disregard traffic signal3. Passed stop sign2. Failed to yield 48 23
8 13
8. Made improper turn
Totals 127 54 5 2 6
1
15 3
18 2 3
12. Other 11. Mechanical defect10. Improper driving9. Had been drinking
12. ROAD SURFACECONDITION InjuryFatalAll
1. Dry 82 372. Wet 23 113. Snowy or icy 6 44. Other 5. Not stated 6Totals 117 52
13. LIGHT CONDITION InjuryFatalAll1. Daylight 90 382. Dawn or Dusk 33. Darkness 24 144. Not statedTotals 117 52
11. VEHICLE TYPE InjuryFatalAll1. Passenger car 202 842. Pass Car and trailer 33. Truck or truck tractor 9 24. Truck tractor with semi-trailer 1 15. Other truck combination 6. Farm tractor and/or equip. 7. Taxicab 8. Bus 9. School bus 10. Motorcycle 11. Motor scooter or moped 1 112. Others and not stated Totals 216 88Special vehicles included above 13. Log trucks14. Emergency (incl. private) 1 115. Military vehicles 16. Other public vehicles 2 1
14. MANNER OF COLLISION InjuryFatalAll
1. Head-on 12. Rear end 21 113. Angle 48 174. Sideswipe-meeting 15. Sideswipe-overtaking 12 46. Backed into 2 17. Other 6Totals 91 33
11. Count of vehicles, including properly parked vehicles.
Totals include participant records where gender was coded as "unknown".
10. Count of crashes. Crashes with multiple contributing circumstances are counted in all applicable categories.
MULTIPLE VEHICLE CRASHES
7 - 9. Tally of drivers by age, sex, residence & crash severity. Excludes occupants of properly & improperly parked vehicles.
199
Col
lisio
n in
volv
ing:
N
on-
coll.
N
on-
coll.
C
ollis
ion
invo
lvin
g:
Non
- co
ll.
Col
lisio
n in
volv
ing:
3C
. RU
RA
L 3A
. Inc
orpo
rate
d A
reas
3B
. UR
BA
N
SUMMARY OF MOTOR VEHICLE TRAFFIC CRASHES 2006 OREGON CRASHESForIn
1. Primary State Highways 2. Secondary State Highways 3. County and Local Roads 4. City Streets 5. Not Stated Total--Rural Area
NOTE: THIS YEAR TO DATE represents only those crashes entered onto the database as of the date above. SAME PERIOD LAST YEAR represents all crashes including late reports. MAJOR INJURIES are incapacitating injuries. MINOR INJURIES are non-incapacitating evident injuries.
3. LOCATION Total
PropertyDamage
Nonfatal Injury Fatal Property
DamageNonfatal
InjuryFatalTotalPropertyDamage
Nonfatal Injury Fatal Total Killed Injured
Total On Roadway TotalOff Roadway Number Of Crashes Number Of Persons
1. Below 1,000 2. 1,000 to 2,500 3. 2,501 to 5,000 4. 5,001 to 10,000 5. 10,001 to 25,000 6. 25,001 to 50,000 7. 50,001 to 100,000 8. 100,001 to 200,000 9. City of Portland Only Total - Municipalities
3. County and Local Roads 157 1 14 10 1 25 192 112 304 206 122 1 329 4. City Streets
5. Not Stated Total--Urban Area 515325 21 2 484323371770457 358 3 818 6. Interstate System 62 1 27 34 56 27 28 6 6 1 447. Other State Freeways 100 46 54 96 44 52 4 2 2 658. Other State Highways 327 1 163 163 314 0 154 160 13 1 9 3 1 249Total--Urban System 489 2 236 251 466 1 225 240 23 1 11 11 2 358
6. Interstate System 7. Other State Freeways 8. Other State Highways Total--Rural System
June 1, 2007
TIGARD
200
At I
nter
sect
ion
Not
at I
nter
sect
ion
At
Inte
r. N
on -I
nter
.
TIGARD 2006 OREGON CRASHES
4. AGE OF CASUALTY
Number of Persons Killed Number of Persons Injured Total Killed Pedestrians Pedalcyclist Total Injured Pedestrians Pedalcyclist
Total Total Total Total Total TotalMale Male Male Male Male MaleFemale Female Female Female Female Female1. 0 to 4 5 1 62. 5 to 9 6 4 103. 10 to 14 1 8 9 17 14. 15 to 19 2 2 45 12 57 1 15. 20 to 24 1 2 27 20 47 16. 25 to 34 1 68 40 108 17. 35 to 44 2 2 1 1 49 32 81 28. 45 to 54 2 3 2 49 38 87 39. 55 to 64 1 38 17 55 1 1 110. 65 to 74 1 1 12 11 23 1 1 11. 75 & older 1 10 7 17 112. Not-stated 2 4 3 7 2Totals 3 1 2 515 194 321 5 4 1 15 12 3
Directional Analysis - A crash consisting of a series of collisions, overturning, etc., is classified according to the first damage or injury producing event; includes on roadway and off roadway.5A. MULTIPLE VEH CRASH Total Fatal Injury P.D.O.
34 10 445b. Leaving driveway/alley 11 12 236. All others
Totals 285 192 1 478
5C. PEDESTRIANCRASHES
All PedCrashes
Fatal Crashes Non-Fatal Injury Crashes
TotalAt
Intersection Non-
Junction TotalAt
IntersectionNon-
Junction1. Car go straight 2 2 1 12. Car turning right 1 1 13. Car turning left 2 2 24. Car backing5. All othersTotals 5 5 4 1
5D. ALL OTHER CRASHES Total Fatal Injury P.D.O.Coll-isionWith
Coll-isionWith
1. Other rd veh or railway train 7 7 2. Fixed object 1 5 6 3. Other object or animal4. Overturning 5. Other noncollision6. Other rd veh or railway train 8 8 7. Fixed object 16 11 1 28 8. Other object or animal 1 1 9. Overturning 3 3 10. Other noncollision11. Not statedTotals 1834 1 53
6. PEDESTRIAN ACTION BY AGE
Ages of Pedstrians Killed and InjuredPedestrians Killed Total 0 to 4 5 to 9 10 to 14 15 to 19 20 to 24 25 to 44 45 to 64 65 & older Not stated
1a. X-ing at intersect or X-walk 1 2 1 4 1b. X-ing not at intersection 1 1 2a. Walking in road with traffic 2b. Same against traffic 3. Standing in roadway 4. Push or work on veh in road 5. Other working in roadway 6. Playing in roadway 7. Other in roadway 8. Not in roadway 9. Not stated
1 2 2 5 Totals
7. AGE OF DRIVER All Crashes Fatal Injury 1. 14 & younger 2. 15 3 1 3. 16 19 11 4. 17 44 18 5. 18 37 17 6. 19 45 1 33 7. 20 38 26 8. 21 36 14 9. 22 to 24 98 47 10. 25 to 34 341 1 174 11. 35 to 44 293 1 138 12. 45 to 54 251 3 120 13. 55 to 64 207 1 94 14. 65 to 74 80 2 31 15. 75 & older 53 28 16. Not stated 194 25 Totals 1,739 9 777 8. SEX OF DRIVER Injury Fatal All Crashes
1. Male 940 4 382 2. Female 772 5 384 3. Not stated 27 11 Totals 1,739 9 777
9. RESIDENCE OF DRIVER All Crashes Fatal Injury
1. Local resident 1,457 5 674 2. In-state resident 119 1 57 3. Non resident 53 22 4. Not stated 110 3 24 Totals 1,739 9 777
10. CRASHES BY CONTRIBUTING FACTOR All InjuryFatal1. Speed too fast
136 2
23 2
7. Followed too closely 311 9 1
45 5
6. Improper overtaking5. Drove left of center4. Disregard traffic signal3. Passed stop sign2. Failed to yield 161 64
75 3 155
8. Made improper turn
Totals 907 6 404 65
4 20 7 6
1 2
131 7
41 15 26
12. Other 11. Mechanical defect10. Improper driving9. Had been drinking
12. ROAD SURFACECONDITION InjuryFatalAll
1. Dry 580 3 2612. Wet 214 923. Snowy or icy 4 34. Other 5. Not stated 20 2Totals 818 3 358
13. LIGHT CONDITION InjuryFatalAll1. Daylight 593 1 2612. Dawn or Dusk 51 163. Darkness 171 2 814. Not stated 3Totals 818 3 358
11. VEHICLE TYPE InjuryFatalAll1. Passenger car 1,672 9 7572. Pass Car and trailer 6 33. Truck or truck tractor 10 24. Truck tractor with semi-trailer 17 45. Other truck combination 6. Farm tractor and/or equip. 7. Taxicab8. Bus 4 19. School bus 210. Motorcycle 10 911. Motor scooter or moped 12. Others and not stated 32 8Totals 1,753 9 784Special vehicles included above 13. Log trucks14. Emergency (incl. private) 415. Military vehicles 16. Other public vehicles 6 1
14. MANNER OF COLLISION InjuryFatalAll
1. Head-on 1 12. Rear end 464 1 2203. Angle 233 864. Sideswipe-meeting 15. Sideswipe-overtaking 44 106. Backed into 15 37. Other 2Totals 760 2 319
11. Count of vehicles, including properly parked vehicles.
Totals include participant records where gender was coded as "unknown".
10. Count of crashes. Crashes with multiple contributing circumstances are counted in all applicable categories.
MULTIPLE VEHICLE CRASHES
7 - 9. Tally of drivers by age, sex, residence & crash severity. Excludes occupants of properly & improperly parked vehicles.
201
Col
lisio
n in
volv
ing:
N
on-
coll.
N
on-
coll.
C
ollis
ion
invo
lvin
g:
Non
- co
ll.
Col
lisio
n in
volv
ing:
3C
. RU
RA
L 3A
. Inc
orpo
rate
d A
reas
3B
. UR
BA
N
SUMMARY OF MOTOR VEHICLE TRAFFIC CRASHES 2006 OREGON CRASHESForIn
1. Primary State Highways 2. Secondary State Highways 3. County and Local Roads 4. City Streets 5. Not Stated Total--Rural Area
NOTE: THIS YEAR TO DATE represents only those crashes entered onto the database as of the date above. SAME PERIOD LAST YEAR represents all crashes including late reports. MAJOR INJURIES are incapacitating injuries. MINOR INJURIES are non-incapacitating evident injuries.
3. LOCATION Total
PropertyDamage
Nonfatal Injury Fatal Property
DamageNonfatal
InjuryFatalTotalPropertyDamage
Nonfatal Injury Fatal Total Killed Injured
Total On Roadway TotalOff Roadway Number Of Crashes Number Of Persons
1. Below 1,000 2. 1,000 to 2,500 3. 2,501 to 5,000 4. 5,001 to 10,000 5. 10,001 to 25,000 6. 25,001 to 50,000 7. 50,001 to 100,000 8. 100,001 to 200,000 9. City of Portland Only Total - Municipalities
111
111
53 58
53 58
46 49 95
46 49 95
7 9 16
7 9 16
78
78
11 1 1 9 8 17 10 8 18 1. Primary State Highways 2. Secondary State Highways 3. County and Local Roads
67 8 7 15 40 38 78 48 45 93 4. City Streets 5. Not Stated Total--Urban Area 789 7 1649469558 53 111 6. Interstate System 2 1 1 2 1 1 17. Other State Freeways 8. Other State Highways 16 7 9 15 7 8 1 1 10Total--Urban System 18 8 10 17 8 9 1 1 11
6. Interstate System 7. Other State Freeways 8. Other State Highways Total--Rural System
June 1, 2007
TROUTDALE
202
At I
nter
sect
ion
Not
at I
nter
sect
ion
At
Inte
r. N
on -I
nter
.
TROUTDALE 2006 OREGON CRASHES
4. AGE OF CASUALTY
Number of Persons Killed Number of Persons Injured Total Killed Pedestrians Pedalcyclist Total Injured Pedestrians Pedalcyclist
Total Total Total Total Total TotalMale Male Male Male Male MaleFemale Female Female Female Female Female1. 0 to 4 2 22. 5 to 9 1 1 2 1 33. 10 to 14 1 1 1 14. 15 to 19 5 1 1 4 5 11 16 15. 20 to 24 1 5 8 13 16. 25 to 34 1 1 8 7 157. 35 to 44 8 2 108. 45 to 54 4 3 79. 55 to 64 3 3 610. 65 to 74 1 1 1 3 411. 75 & older 1 112. Not-stated Totals 78 39 39 8 7 1 3 2 1
Directional Analysis - A crash consisting of a series of collisions, overturning, etc., is classified according to the first damage or injury producing event; includes on roadway and off roadway.5A. MULTIPLE VEH CRASH Total Fatal Injury P.D.O.
5B. MULTIPLE VEH CRASH Total Fatal Injury P.D.O. 1 3 41. Moving in opposite dir. 4 5 92. Both moving in same dir. 2 23a. One car parked 8 7 153b. One car stopped in traffic 2 24. Enter/Leave parked pos.
Junction1. Car go straight 4 4 2 22. Car turning right 1 1 13. Car turning left 1 1 14. Car backing5. All othersTotals 6 6 3 3
5D. ALL OTHER CRASHES Total Fatal Injury P.D.O.Coll-isionWith
Coll-isionWith
1. Other rd veh or railway train 1 1 2. Fixed object 2 2 3. Other object or animal4. Overturning 5. Other noncollision6. Other rd veh or railway train 2 2 7. Fixed object 4 4 8 8. Other object or animal9. Overturning 1 1 2 10. Other noncollision11. Not statedTotals 78 15
6. PEDESTRIAN ACTION BY AGE
Ages of Pedstrians Killed and InjuredPedestrians Killed Total 0 to 4 5 to 9 10 to 14 15 to 19 20 to 24 25 to 44 45 to 64 65 & older Not stated
1a. X-ing at intersect or X-walk 1 3 4 1b. X-ing not at intersection 1 1 2a. Walking in road with traffic 2b. Same against traffic 3. Standing in roadway 1 1 4. Push or work on veh in road 5. Other working in roadway 6. Playing in roadway 7. Other in roadway 8. Not in roadway 2 2 9. Not stated
1 151 8 Totals
7. AGE OF DRIVER All Crashes Fatal Injury 1. 14 & younger 2. 15 1 3. 16 3 1 4. 17 11 5 5. 18 13 6 6. 19 9 4 7. 20 6 2 8. 21 3 2 9. 22 to 24 13 11 10. 25 to 34 37 24 11. 35 to 44 32 13 12. 45 to 54 24 8 13. 55 to 64 24 12 14. 65 to 74 8 5 15. 75 & older 3 1 16. Not stated 20 3 Totals 207 97 8. SEX OF DRIVER Injury Fatal All Crashes
1. Male 107 50 2. Female 92 44 3. Not stated 8 3 Totals 207 97
9. RESIDENCE OF DRIVER All Crashes Fatal Injury
1. Local resident 171 83 2. In-state resident 7 3 3. Non resident 16 7 4. Not stated 13 4 Totals 207 97
10. CRASHES BY CONTRIBUTING FACTOR All InjuryFatal1. Speed too fast
13
9
7. Followed too closely 32 1
12
6. Improper overtaking5. Drove left of center4. Disregard traffic signal3. Passed stop sign2. Failed to yield 26 17
10 20
8. Made improper turn
Totals 136 65 7 1 4 4
18 1
17 4 5
12. Other 11. Mechanical defect10. Improper driving9. Had been drinking
12. ROAD SURFACECONDITION InjuryFatalAll
1. Dry 78 392. Wet 29 143. Snowy or icy 24. Other 5. Not stated 2Totals 111 53
13. LIGHT CONDITION InjuryFatalAll1. Daylight 78 382. Dawn or Dusk 4 13. Darkness 29 144. Not statedTotals 111 53
11. VEHICLE TYPE InjuryFatalAll1. Passenger car 192 912. Pass Car and trailer 2 13. Truck or truck tractor 34. Truck tractor with semi-trailer 7 25. Other truck combination 6. Farm tractor and/or equip. 7. Taxicab 8. Bus9. School bus 110. Motorcycle 3 211. Motor scooter or moped 12. Others and not stated 2 1Totals 210 97Special vehicles included above 13. Log trucks14. Emergency (incl. private) 15. Military vehicles 16. Other public vehicles 1
14. MANNER OF COLLISION InjuryFatalAll
1. Head-on 2 12. Rear end 34 153. Angle 40 204. Sideswipe-meeting 1 15. Sideswipe-overtaking 8 26. Backed into 47. Other 1Totals 90 39
11. Count of vehicles, including properly parked vehicles.
Totals include participant records where gender was coded as "unknown".
10. Count of crashes. Crashes with multiple contributing circumstances are counted in all applicable categories.
MULTIPLE VEHICLE CRASHES
7 - 9. Tally of drivers by age, sex, residence & crash severity. Excludes occupants of properly & improperly parked vehicles.
203
Col
lisio
n in
volv
ing:
N
on-
coll.
N
on-
coll.
C
ollis
ion
invo
lvin
g:
Non
- co
ll.
Col
lisio
n in
volv
ing:
3C
. RU
RA
L 3A
. Inc
orpo
rate
d A
reas
3B
. UR
BA
N
SUMMARY OF MOTOR VEHICLE TRAFFIC CRASHES 2006 OREGON CRASHESForIn
1. Primary State Highways 2. Secondary State Highways 3. County and Local Roads 4. City Streets 5. Not Stated Total--Rural Area
NOTE: THIS YEAR TO DATE represents only those crashes entered onto the database as of the date above. SAME PERIOD LAST YEAR represents all crashes including late reports. MAJOR INJURIES are incapacitating injuries. MINOR INJURIES are non-incapacitating evident injuries.
3. LOCATION Total
PropertyDamage
Nonfatal Injury Fatal Property
DamageNonfatal
InjuryFatalTotalPropertyDamage
Nonfatal Injury Fatal Total Killed Injured
Total On Roadway TotalOff Roadway Number Of Crashes Number Of Persons
1. Below 1,000 2. 1,000 to 2,500 3. 2,501 to 5,000 4. 5,001 to 10,000 5. 10,001 to 25,000 6. 25,001 to 50,000 7. 50,001 to 100,000 8. 100,001 to 200,000 9. City of Portland Only Total - Municipalities
3. County and Local Roads 149 15 9 24 127 96 223 142 105 247 4. City Streets
5. Not Stated Total--Urban Area 26628 12 40193175368221 187 408 6. Interstate System 77 37 40 65 34 31 12 3 9 597. Other State Freeways 8. Other State Highways 84 45 39 80 45 35 4 4 58Total--Urban System 161 82 79 145 79 66 16 3 13 117
6. Interstate System 7. Other State Freeways 8. Other State Highways Total--Rural System
June 1, 2007
TUALATIN
204
At I
nter
sect
ion
Not
at I
nter
sect
ion
At
Inte
r. N
on -I
nter
.
TUALATIN 2006 OREGON CRASHES
4. AGE OF CASUALTY
Number of Persons Killed Number of Persons Injured Total Killed Pedestrians Pedalcyclist Total Injured Pedestrians Pedalcyclist
Total Total Total Total Total TotalMale Male Male Male Male MaleFemale Female Female Female Female Female1. 0 to 4 2 2 42. 5 to 9 1 4 53. 10 to 14 1 3 4 7 14. 15 to 19 21 10 315. 20 to 24 1 1 22 19 416. 25 to 34 1 2 27 16 43 17. 35 to 44 1 4 21 20 41 38. 45 to 54 1 1 23 26 499. 55 to 64 2 2 7 16 2310. 65 to 74 1 1 7 7 1411. 75 & older 3 2 512. Not-stated 2 1 3Totals 266 127 139 5 4 1 7 5 2
Directional Analysis - A crash consisting of a series of collisions, overturning, etc., is classified according to the first damage or injury producing event; includes on roadway and off roadway.5A. MULTIPLE VEH CRASH Total Fatal Injury P.D.O.
Junction1. Car go straight 2 2 22. Car turning right3. Car turning left 2 2 1 14. Car backing5. All othersTotals 4 4 3 1
5D. ALL OTHER CRASHES Total Fatal Injury P.D.O.Coll-isionWith
Coll-isionWith
1. Other rd veh or railway train 5 5 2. Fixed object 5 2 7 3. Other object or animal4. Overturning 5. Other noncollision6. Other rd veh or railway train 2 2 7. Fixed object 17 5 22 8. Other object or animal 3 3 9. Overturning10. Other noncollision 2 2 11. Not statedTotals 2516 41
6. PEDESTRIAN ACTION BY AGE
Ages of Pedstrians Killed and InjuredPedestrians Killed Total 0 to 4 5 to 9 10 to 14 15 to 19 20 to 24 25 to 44 45 to 64 65 & older Not stated
1a. X-ing at intersect or X-walk 3 1 4 1b. X-ing not at intersection 1 1 2a. Walking in road with traffic 2b. Same against traffic 3. Standing in roadway 4. Push or work on veh in road 5. Other working in roadway 6. Playing in roadway 7. Other in roadway 8. Not in roadway 9. Not stated
1 3 1 5 Totals
7. AGE OF DRIVER All Crashes Fatal Injury 1. 14 & younger 2. 15 3. 16 18 5 4. 17 20 12 5. 18 23 9 6. 19 15 7 7. 20 14 11 8. 21 25 15 9. 22 to 24 60 34 10. 25 to 34 147 61 11. 35 to 44 145 71 12. 45 to 54 144 89 13. 55 to 64 77 37 14. 65 to 74 30 22 15. 75 & older 19 10 16. Not stated 90 15 Totals 827 398 8. SEX OF DRIVER Injury Fatal All Crashes
1. Male 462 224 2. Female 346 169 3. Not stated 19 5 Totals 827 398
9. RESIDENCE OF DRIVER All Crashes Fatal Injury
1. Local resident 653 320 2. In-state resident 89 47 3. Non resident 38 18 4. Not stated 47 13 Totals 827 398
10. CRASHES BY CONTRIBUTING FACTOR All InjuryFatal1. Speed too fast
71 1 2
19 4
7. Followed too closely 150 3 3
29 7
6. Improper overtaking5. Drove left of center4. Disregard traffic signal3. Passed stop sign2. Failed to yield 44 17
54 90
8. Made improper turn
Totals 462 227 41
1 12 4 1
77 4
29 4
22
12. Other 11. Mechanical defect10. Improper driving9. Had been drinking
12. ROAD SURFACECONDITION InjuryFatalAll
1. Dry 283 1312. Wet 116 563. Snowy or icy 34. Other 5. Not stated 6Totals 408 187
13. LIGHT CONDITION InjuryFatalAll1. Daylight 318 1422. Dawn or Dusk 20 113. Darkness 69 344. Not stated 1Totals 408 187
11. VEHICLE TYPE InjuryFatalAll1. Passenger car 787 3772. Pass Car and trailer 4 13. Truck or truck tractor 6 44. Truck tractor with semi-trailer 19 75. Other truck combination 26. Farm tractor and/or equip. 7. Taxicab 1 18. Bus 19. School bus 110. Motorcycle 3 311. Motor scooter or moped 2 112. Others and not stated 12 6Totals 838 400Special vehicles included above 13. Log trucks14. Emergency (incl. private) 1 115. Military vehicles 16. Other public vehicles 4 1
14. MANNER OF COLLISION InjuryFatalAll
1. Head-on 12. Rear end 225 1203. Angle 101 354. Sideswipe-meeting 5. Sideswipe-overtaking 23 106. Backed into 12 27. Other 1Totals 363 167
11. Count of vehicles, including properly parked vehicles.
Totals include participant records where gender was coded as "unknown".
10. Count of crashes. Crashes with multiple contributing circumstances are counted in all applicable categories.
MULTIPLE VEHICLE CRASHES
7 - 9. Tally of drivers by age, sex, residence & crash severity. Excludes occupants of properly & improperly parked vehicles.
205
Col
lisio
n in
volv
ing:
N
on-
coll.
N
on-
coll.
C
ollis
ion
invo
lvin
g:
Non
- co
ll.
Col
lisio
n in
volv
ing:
3C
. RU
RA
L 3A
. Inc
orpo
rate
d A
reas
3B
. UR
BA
N
SUMMARY OF MOTOR VEHICLE TRAFFIC CRASHES 2006 OREGON CRASHESForIn
1. Primary State Highways 2. Secondary State Highways 3. County and Local Roads 4. City Streets 5. Not Stated Total--Rural Area
NOTE: THIS YEAR TO DATE represents only those crashes entered onto the database as of the date above. SAME PERIOD LAST YEAR represents all crashes including late reports. MAJOR INJURIES are incapacitating injuries. MINOR INJURIES are non-incapacitating evident injuries.
3. LOCATION Total
PropertyDamage
Nonfatal Injury Fatal Property
DamageNonfatal
InjuryFatalTotalPropertyDamage
Nonfatal Injury Fatal Total Killed Injured
Total On Roadway TotalOff Roadway Number Of Crashes Number Of Persons
1. Below 1,000 2. 1,000 to 2,500 3. 2,501 to 5,000 4. 5,001 to 10,000 5. 10,001 to 25,000 6. 25,001 to 50,000 7. 50,001 to 100,000 8. 100,001 to 200,000 9. City of Portland Only Total - Municipalities
2 199
199 2
89 108
89 108
1 75 93 169
1 75 93 169
1 14 15 30
1 14 15 30
130 2
130 2
90 5 5 10 64 56 120 69 61 130 1. Primary State Highways 2. Secondary State Highways 3. County and Local Roads
40 2 10 9 1 20 29 19 1 49 39 28 2 69 4. City Streets 5. Not Stated Total--Urban Area 130215 14 1 3093751169108 89 2 199 6. Interstate System 65 31 34 58 26 32 7 5 2 437. Other State Freeways 8. Other State Highways 65 30 35 62 30 32 3 3 47Total--Urban System 130 61 69 120 56 64 10 5 5 90
6. Interstate System 7. Other State Freeways 8. Other State Highways Total--Rural System
June 1, 2007
WEST LINN
206
At I
nter
sect
ion
Not
at I
nter
sect
ion
At
Inte
r. N
on -I
nter
.
WEST LINN 2006 OREGON CRASHES
4. AGE OF CASUALTY
Number of Persons Killed Number of Persons Injured Total Killed Pedestrians Pedalcyclist Total Injured Pedestrians Pedalcyclist
Total Total Total Total Total TotalMale Male Male Male Male MaleFemale Female Female Female Female Female1. 0 to 4 2 22. 5 to 9 1 1 1 1 1 1 3. 10 to 14 2 2 3 34. 15 to 19 9 2 115. 20 to 24 8 2 106. 25 to 34 10 15 25 1 1 7. 35 to 44 1 1 1 13 16 29 18. 45 to 54 1 1 18 8 269. 55 to 64 10 5 1510. 65 to 74 2 2 411. 75 & older 4 412. Not-stated Totals 2 2 1 1 130 50 80 4 1 3 1 1
Directional Analysis - A crash consisting of a series of collisions, overturning, etc., is classified according to the first damage or injury producing event; includes on roadway and off roadway.5A. MULTIPLE VEH CRASH Total Fatal Injury P.D.O.
5B. MULTIPLE VEH CRASH Total Fatal Injury P.D.O. 3 2 51. Moving in opposite dir.
11 13 242. Both moving in same dir. 4 2 63a. One car parked
52 35 873b. One car stopped in traffic 4. Enter/Leave parked pos. 5a. Entering driveway/alley
3 35b. Leaving driveway/alley 7 76. All others
Totals 80 52 132
5C. PEDESTRIANCRASHES
All PedCrashes
Fatal Crashes Non-Fatal Injury Crashes
TotalAt
Intersection Non-
Junction TotalAt
IntersectionNon-
Junction1. Car go straight 1 1 12. Car turning right 2 1 1 1 13. Car turning left 1 1 14. Car backing5. All othersTotals 4 1 1 3 1 2
5D. ALL OTHER CRASHES Total Fatal Injury P.D.O.Coll-isionWith
Coll-isionWith
1. Other rd veh or railway train 1 1 2. Fixed object 1 1 3. Other object or animal4. Overturning 1 1 5. Other noncollision6. Other rd veh or railway train7. Fixed object 10 13 1 24 8. Other object or animal 1 1 2 9. Overturning10. Other noncollision 1 1 11. Not statedTotals 1316 1 30
6. PEDESTRIAN ACTION BY AGE
Ages of Pedstrians Killed and InjuredPedestrians Killed Total 0 to 4 5 to 9 10 to 14 15 to 19 20 to 24 25 to 44 45 to 64 65 & older Not stated
1a. X-ing at intersect or X-walk 1 1 1b. X-ing not at intersection 2a. Walking in road with traffic 2b. Same against traffic 3. Standing in roadway 1 1 1 4. Push or work on veh in road 5. Other working in roadway 6. Playing in roadway 7. Other in roadway 1 1 2 8. Not in roadway 9. Not stated 1 1
1 121 5 1 Totals
7. AGE OF DRIVER All Crashes Fatal Injury 1. 14 & younger 2. 15 1 3. 16 3 1 4. 17 14 8 5. 18 16 6 6. 19 3 1 7. 20 9 5 8. 21 7 1 9. 22 to 24 21 7 10. 25 to 34 72 1 37 11. 35 to 44 65 1 36 12. 45 to 54 69 37 13. 55 to 64 53 25 14. 65 to 74 17 9 15. 75 & older 11 3 16. Not stated 33 5 Totals 394 2 181 8. SEX OF DRIVER Injury Fatal All Crashes
1. Male 212 2 98 2. Female 171 79 3. Not stated 11 4 Totals 394 2 181
9. RESIDENCE OF DRIVER All Crashes Fatal Injury
1. Local resident 328 2 151 2. In-state resident 29 18 3. Non resident 15 7 4. Not stated 22 5 Totals 394 2 181
10. CRASHES BY CONTRIBUTING FACTOR All InjuryFatal1. Speed too fast
40
3 1
7. Followed too closely 89 1 1 5 1
6. Improper overtaking5. Drove left of center4. Disregard traffic signal3. Passed stop sign2. Failed to yield 31 15
20 1 39
8. Made improper turn
Totals 218 3 100 9 1 6 3 2
1
1
19 2
15 8 7
12. Other 11. Mechanical defect10. Improper driving9. Had been drinking
12. ROAD SURFACECONDITION InjuryFatalAll
1. Dry 128 2 622. Wet 60 233. Snowy or icy 9 44. Other 5. Not stated 2Totals 199 2 89
13. LIGHT CONDITION InjuryFatalAll1. Daylight 144 2 662. Dawn or Dusk 16 83. Darkness 39 154. Not statedTotals 199 2 89
11. VEHICLE TYPE InjuryFatalAll1. Passenger car 383 1 1742. Pass Car and trailer 2 13. Truck or truck tractor 4 14. Truck tractor with semi-trailer 5 35. Other truck combination 16. Farm tractor and/or equip. 7. Taxicab 8. Bus9. School bus 3 310. Motorcycle 1 111. Motor scooter or moped 12. Others and not stated 3 1Totals 402 2 183Special vehicles included above 13. Log trucks14. Emergency (incl. private) 2 115. Military vehicles 16. Other public vehicles 2 2
14. MANNER OF COLLISION InjuryFatalAll
1. Head-on 12. Rear end 112 523. Angle 34 124. Sideswipe-meeting 3 25. Sideswipe-overtaking 10 36. Backed into 4 17. Other 1Totals 165 70
11. Count of vehicles, including properly parked vehicles.
Totals include participant records where gender was coded as "unknown".
10. Count of crashes. Crashes with multiple contributing circumstances are counted in all applicable categories.
MULTIPLE VEHICLE CRASHES
7 - 9. Tally of drivers by age, sex, residence & crash severity. Excludes occupants of properly & improperly parked vehicles.
207
Col
lisio
n in
volv
ing:
N
on-
coll.
N
on-
coll.
C
ollis
ion
invo
lvin
g:
Non
- co
ll.
Col
lisio
n in
volv
ing:
3C
. RU
RA
L 3A
. Inc
orpo
rate
d A
reas
3B
. UR
BA
N
SUMMARY OF MOTOR VEHICLE TRAFFIC CRASHES 2006 OREGON CRASHESForIn
This summary includes reports andinformation available on:
Report published by:
CRASH ANALYSIS AND REPORTING
1B. TYPE OF MOTOR VEHICLE CRASH
Number Of PersonsTotal Killed Total Injured Major Injuries Minor Injuries Possible Injuries No Injury
1. Overturning 22. Other noncollision 3. Pedestrian 1 1 1 24. MV in transport 72 4 13 55 3335. MV on other roadway 6. Parked MV 17. Railway train 8. Pedalcyclist 1 1 39. Animal 10. Fixed object 4 2 2 1911. Other object 12. Totals 1 78 5 16 57 360
2B. MILEAGE RATES ThisYearTo
Date
LastYearSamePeriod
PercentChange
1. Motor vehicle traffic deaths 2. Estimated vehicle miles traveled (in millions)
3. Death rate per 100 million vehicle miles 4. Fatal crash rate per 100 million vehicle miles
5. Crash rate per million vehicle miles 6. Fatal crashes
100%
100%
1
1
2A. TYPE OF MOTOR VEHICLE CRASH
Total On Roadway This Year To Date This Year To Date Same Period Last Year Same Period Last Year
All Crashes
Persons Killed
Persons Injured
AllCrashes
AllCrashes
AllCrashes
PersonsKilled
PersonsKilled
PersonsKilled
PersonsInjured
Persons Injured
PersonsInjured
1 1 1 1. Overturning 1 1 2 22. Other noncollision
1 1 2 1 1 2 3. Pedestrian 73 130 72 143 81 133 72 145 4. MV in transport
5. MV on other roadway 1 6. Parked MV
7. Railway train 1 1 1 1 1 1 1 1 8. Pedalcyclist
9. Animal 13 25 4 13 10. Fixed object
1 2 2 311. Other object 12.
76 134 74 1 146 100 165 78 1 163 Totals
1. Primary State Highways 2. Secondary State Highways 3. County and Local Roads 4. City Streets 5. Not Stated Total--Rural Area
NOTE: THIS YEAR TO DATE represents only those crashes entered onto the database as of the date above. SAME PERIOD LAST YEAR represents all crashes including late reports. MAJOR INJURIES are incapacitating injuries. MINOR INJURIES are non-incapacitating evident injuries.
3. LOCATION Total
PropertyDamage
Nonfatal Injury Fatal Property
DamageNonfatal
InjuryFatalTotalPropertyDamage
Nonfatal Injury Fatal Total Killed Injured
Total On Roadway TotalOff Roadway Number Of Crashes Number Of Persons
1. Below 1,000 2. 1,000 to 2,500 3. 2,501 to 5,000 4. 5,001 to 10,000 5. 10,001 to 25,000 6. 25,001 to 50,000 7. 50,001 to 100,000 8. 100,001 to 200,000 9. City of Portland Only Total - Municipalities
3. County and Local Roads 33 7 7 50 21 71 57 21 78 4. City Streets
5. Not Stated Total--Urban Area 78113 4 1792531146105 57 1 163 6. Interstate System 54 1 23 30 47 20 26 7 3 4 1 297. Other State Freeways 8. Other State Highways 31 13 18 28 12 16 3 1 2 16Total--Urban System 85 1 36 48 75 1 32 42 10 4 6 1 45
6. Interstate System 7. Other State Freeways 8. Other State Highways Total--Rural System
June 1, 2007
WILSONVILLE
208
At I
nter
sect
ion
Not
at I
nter
sect
ion
At
Inte
r. N
on -I
nter
.
WILSONVILLE 2006 OREGON CRASHES
4. AGE OF CASUALTY
Number of Persons Killed Number of Persons Injured Total Killed Pedestrians Pedalcyclist Total Injured Pedestrians Pedalcyclist
Total Total Total Total Total TotalMale Male Male Male Male MaleFemale Female Female Female Female Female1. 0 to 4 2. 5 to 9 1 3 43. 10 to 14 1 1 2 3 14. 15 to 19 4 4 85. 20 to 24 8 1 96. 25 to 34 14 4 187. 35 to 44 6 5 11 1 1 1 1 8. 45 to 54 1 1 9 3 129. 55 to 64 3 6 910. 65 to 74 2 2 411. 75 & older 12. Not-stated Totals 1 1 1 1 78 30 48 1 1 1 1
Directional Analysis - A crash consisting of a series of collisions, overturning, etc., is classified according to the first damage or injury producing event; includes on roadway and off roadway.5A. MULTIPLE VEH CRASH Total Fatal Injury P.D.O.
Junction1. Car go straight 1 1 12. Car turning right3. Car turning left 1 1 14. Car backing5. All othersTotals 2 1 1 1 1
5D. ALL OTHER CRASHES Total Fatal Injury P.D.O.Coll-isionWith
Coll-isionWith
1. Other rd veh or railway train2. Fixed object 3. Other object or animal 4. Overturning 5. Other noncollision6. Other rd veh or railway train 1 1 7. Fixed object 9 4 13 8. Other object or animal9. Overturning 1 1 10. Other noncollision11. Not statedTotals 105 15
6. PEDESTRIAN ACTION BY AGE
Ages of Pedstrians Killed and InjuredPedestrians Killed Total 0 to 4 5 to 9 10 to 14 15 to 19 20 to 24 25 to 44 45 to 64 65 & older Not stated
1a. X-ing at intersect or X-walk 1 1 1b. X-ing not at intersection 1 1 1 2a. Walking in road with traffic 2b. Same against traffic 3. Standing in roadway 4. Push or work on veh in road 5. Other working in roadway 6. Playing in roadway 7. Other in roadway 8. Not in roadway 9. Not stated
1 1 2 1 Totals
7. AGE OF DRIVER All Crashes Fatal Injury 1. 14 & younger 2. 15 1 3. 16 4 1 4. 17 3 1 5. 18 13 6 6. 19 7 4 7. 20 8 4 8. 21 8 6 9. 22 to 24 13 4 10. 25 to 34 62 25 11. 35 to 44 53 23 12. 45 to 54 47 21 13. 55 to 64 31 1 11 14. 65 to 74 10 3 15. 75 & older 4 16. Not stated 52 4 Totals 316 1 113 8. SEX OF DRIVER Injury Fatal All Crashes
1. Male 178 1 61 2. Female 135 51 3. Not stated 3 1 Totals 316 1 113
9. RESIDENCE OF DRIVER All Crashes Fatal Injury
1. Local resident 224 79 2. In-state resident 55 23 3. Non resident 17 1 8 4. Not stated 20 3 Totals 316 1 113
10. CRASHES BY CONTRIBUTING FACTOR All InjuryFatal1. Speed too fast
22
4
7. Followed too closely 65
1 9 2
6. Improper overtaking5. Drove left of center4. Disregard traffic signal3. Passed stop sign2. Failed to yield 38 13
11 26
8. Made improper turn
Totals 175 60 6
4
21 1 9
3
12. Other 11. Mechanical defect10. Improper driving9. Had been drinking
12. ROAD SURFACECONDITION InjuryFatalAll
1. Dry 115 1 382. Wet 42 173. Snowy or icy 4 24. Other 5. Not stated 2Totals 163 1 57
13. LIGHT CONDITION InjuryFatalAll1. Daylight 117 402. Dawn or Dusk 9 63. Darkness 36 1 114. Not stated 1Totals 163 1 57
11. VEHICLE TYPE InjuryFatalAll1. Passenger car 300 1102. Pass Car and trailer 2 13. Truck or truck tractor 2 14. Truck tractor with semi-trailer 11 15. Other truck combination 6. Farm tractor and/or equip. 7. Taxicab 8. Bus 9. School bus 10. Motorcycle 11. Motor scooter or moped 12. Others and not stated 3 1Totals 318 1 113Special vehicles included above 13. Log trucks 114. Emergency (incl. private) 15. Military vehicles 16. Other public vehicles
1. Primary State Highways 2. Secondary State Highways 3. County and Local Roads 4. City Streets 5. Not Stated Total--Rural Area
NOTE: THIS YEAR TO DATE represents only those crashes entered onto the database as of the date above. SAME PERIOD LAST YEAR represents all crashes including late reports. MAJOR INJURIES are incapacitating injuries. MINOR INJURIES are non-incapacitating evident injuries.
3. LOCATION Total
PropertyDamage
Nonfatal Injury Fatal Property
DamageNonfatal
InjuryFatalTotalPropertyDamage
Nonfatal Injury Fatal Total Killed Injured
Total On Roadway TotalOff Roadway Number Of Crashes Number Of Persons
1. Below 1,000 2. 1,000 to 2,500 3. 2,501 to 5,000 4. 5,001 to 10,000 5. 10,001 to 25,000 6. 25,001 to 50,000 7. 50,001 to 100,000 8. 100,001 to 200,000 9. City of Portland Only Total - Municipalities
3. County and Local Roads 49 12 4 16 31 26 57 43 30 73 4. City Streets
5. Not Stated Total--Urban Area 151217 7 2484882174101 95 2 198 6. Interstate System 9 3 6 4 2 2 5 1 4 37. Other State Freeways 8. Other State Highways 116 2 62 52 113 60 51 3 2 1 2 99Total--Urban System 125 2 65 58 117 2 62 53 8 3 5 2 102
6. Interstate System 7. Other State Freeways 8. Other State Highways Total--Rural System
June 1, 2007
WOODBURN
210
At I
nter
sect
ion
Not
at I
nter
sect
ion
At
Inte
r. N
on -I
nter
.
WOODBURN 2006 OREGON CRASHES
4. AGE OF CASUALTY
Number of Persons Killed Number of Persons Injured Total Killed Pedestrians Pedalcyclist Total Injured Pedestrians Pedalcyclist
Total Total Total Total Total TotalMale Male Male Male Male MaleFemale Female Female Female Female Female1. 0 to 4 2 22. 5 to 9 3 2 53. 10 to 14 2 3 54. 15 to 19 3 11 10 21 35. 20 to 24 8 6 146. 25 to 34 18 15 337. 35 to 44 1 1 1 1 11 13 248. 45 to 54 12 4 16 1 1 1 1 9. 55 to 64 6 7 1310. 65 to 74 1 1 5 3 8 1 1 1 1 11. 75 & older 5 2 712. Not-stated 2 1 2 3 2Totals 2 2 2 2 151 67 84 2 2 6 5 1
Directional Analysis - A crash consisting of a series of collisions, overturning, etc., is classified according to the first damage or injury producing event; includes on roadway and off roadway.5A. MULTIPLE VEH CRASH Total Fatal Injury P.D.O.
Junction1. Car go straight 3 2 2 1 12. Car turning right 3. Car turning left 4. Car backing 1 1 15. All othersTotals 4 2 2 2 1 1
5D. ALL OTHER CRASHES Total Fatal Injury P.D.O.Coll-isionWith
Coll-isionWith
1. Other rd veh or railway train 2 2 2. Fixed object 2 2 3. Other object or animal4. Overturning 1 1 5. Other noncollision6. Other rd veh or railway train 1 4 5 7. Fixed object 8 3 11 8. Other object or animal 1 1 9. Overturning10. Other noncollision 11. Not statedTotals 1111 22
6. PEDESTRIAN ACTION BY AGE
Ages of Pedstrians Killed and InjuredPedestrians Killed Total 0 to 4 5 to 9 10 to 14 15 to 19 20 to 24 25 to 44 45 to 64 65 & older Not stated
1a. X-ing at intersect or X-walk 1 1 2 1 1b. X-ing not at intersection 1 1 1 2a. Walking in road with traffic 2b. Same against traffic 3. Standing in roadway 4. Push or work on veh in road 5. Other working in roadway 6. Playing in roadway 7. Other in roadway 1 1 8. Not in roadway 9. Not stated
2 1 1 4 2 Totals
7. AGE OF DRIVER All Crashes Fatal Injury 1. 14 & younger 2. 15 3. 16 8 2 4. 17 6 1 2 5. 18 15 9 6. 19 12 1 5 7. 20 7 6 8. 21 8 6 9. 22 to 24 26 12 10. 25 to 34 93 54 11. 35 to 44 62 29 12. 45 to 54 34 20 13. 55 to 64 32 19 14. 65 to 74 20 10 15. 75 & older 16 7 16. Not stated 37 4 Totals 376 2 185 8. SEX OF DRIVER Injury Fatal All Crashes
1. Male 220 2 112 2. Female 147 71 3. Not stated 9 2 Totals 376 2 185
9. RESIDENCE OF DRIVER All Crashes Fatal Injury
1. Local resident 303 2 149 2. In-state resident 48 29 3. Non resident 9 3 4. Not stated 16 4 Totals 376 2 185
10. CRASHES BY CONTRIBUTING FACTOR All InjuryFatal1. Speed too fast
14 1 1 6 4
7. Followed too closely 36 1 4
11 7
6. Improper overtaking5. Drove left of center4. Disregard traffic signal3. Passed stop sign2. Failed to yield 64 34
34 59
8. Made improper turn
Totals 241 4 119 15
4 5 1
2 2
26
11 11 11
12. Other 11. Mechanical defect10. Improper driving9. Had been drinking
12. ROAD SURFACECONDITION InjuryFatalAll
1. Dry 140 682. Wet 50 273. Snowy or icy 24. Other 5. Not stated 6 2Totals 198 2 95
13. LIGHT CONDITION InjuryFatalAll1. Daylight 146 692. Dawn or Dusk 12 83. Darkness 40 2 184. Not statedTotals 198 2 95
11. VEHICLE TYPE InjuryFatalAll1. Passenger car 378 2 1822. Pass Car and trailer 13. Truck or truck tractor 4. Truck tractor with semi-trailer 10 55. Other truck combination 16. Farm tractor and/or equip. 7. Taxicab 8. Bus 9. School bus10. Motorcycle 1 111. Motor scooter or moped 12. Others and not stated Totals 391 2 188Special vehicles included above 13. Log trucks14. Emergency (incl. private) 2 115. Military vehicles 16. Other public vehicles
NOTE: THIS YEAR TO DATE represents only those crashes entered onto the database as of the date above. SAME PERIOD LAST YEAR represents all crashes including late reports. MAJOR INJURIES are incapacitating injuries. MINOR INJURIES are non-incapacitating evident injuries.
3. LOCATION Total
PropertyDamage
Nonfatal Injury Fatal Property
DamageNonfatal
InjuryFatalTotalPropertyDamage
Nonfatal Injury Fatal Total Killed Injured
Total On Roadway TotalOff Roadway Number Of Crashes Number Of Persons
1. Below 1,000 2. 1,000 to 2,500 3. 2,501 to 5,000 4. 5,001 to 10,000 5. 10,001 to 25,000 6. 25,001 to 50,000 7. 50,001 to 100,000 8. 100,001 to 200,000 9. City of Portland Only Total - Municipalities
1 1 1 1
52
53
21 31
21 32
18 28 46
18 29 47
3 3 6
3 3 6
26
26
9 1 2 3 10 5 15 11 7 18 1. Primary State Highways 2. Secondary State Highways
1 1 1 1 1 3. County and Local Roads 17 3 1 4 19 13 32 22 14 36 4. City Streets
5. Not Stated Total--Urban Area 274 3 729194833 22 55 6. Interstate System 3 3 2 2 1 17. Other State Freeways 8. Other State Highways 15 7 8 13 5 8 2 2 9Total--Urban System 18 7 11 15 5 10 3 2 1 9
6. Interstate System 111 2 39 70 27 1 5 21 84 1 34 49 2 587. Other State Freeways 8. Other State Highways 41 2 11 28 22 1 4 17 19 1 7 11 2 18Total--Rural System 152 4 50 98 49 2 9 38 103 2 41 60 4 76
June 1, 2007
BAKER COUNTY
216
At I
nter
sect
ion
Not
at I
nter
sect
ion
At
Inte
r. N
on -I
nter
.
BAKER COUNTY 2006 OREGON CRASHES
4. AGE OF CASUALTY
Number of Persons Killed Number of Persons Injured Total Killed Pedestrians Pedalcyclist Total Injured Pedestrians Pedalcyclist
Total Total Total Total Total TotalMale Male Male Male Male MaleFemale Female Female Female Female Female1. 0 to 4 2 22. 5 to 9 1 1 23. 10 to 14 1 14. 15 to 19 11 12 23 1 1 5. 20 to 24 8 6 146. 25 to 34 12 9 21 2 2 7. 35 to 44 10 10 208. 45 to 54 1 1 1 6 8 14 19. 55 to 64 1 4 14 18 1 1 1 1 110. 65 to 74 2 2 411. 75 & older 1 2 312. Not-stated Totals 4 4 1 1 122 64 58 1 1 2 2
Directional Analysis - A crash consisting of a series of collisions, overturning, etc., is classified according to the first damage or injury producing event; includes on roadway and off roadway.5A. MULTIPLE VEH CRASH Total Fatal Injury P.D.O.
5B. MULTIPLE VEH CRASH Total Fatal Injury P.D.O. 1 2 31. Moving in opposite dir. 7 2 92. Both moving in same dir. 4 43a. One car parked 6 3 93b. One car stopped in traffic
Junction1. Car go straight 1 1 12. Car turning right3. Car turning left 4. Car backing 5. All othersTotals 1 1 1
5D. ALL OTHER CRASHES Total Fatal Injury P.D.O.Coll-isionWith
Coll-isionWith
1. Other rd veh or railway train2. Fixed object 2 1 3 3. Other object or animal4. Overturning 5. Other noncollision6. Other rd veh or railway train 2 2 7. Fixed object 61 45 2 108 8. Other object or animal 32 5 1 38 9. Overturning 6 6 1 13 10. Other noncollision 1 1 2 11. Not statedTotals 10260 4 166
6. PEDESTRIAN ACTION BY AGE
Ages of Pedstrians Killed and InjuredPedestrians Killed Total 0 to 4 5 to 9 10 to 14 15 to 19 20 to 24 25 to 44 45 to 64 65 & older Not stated
1a. X-ing at intersect or X-walk 1b. X-ing not at intersection 1 1 2a. Walking in road with traffic 2b. Same against traffic 3. Standing in roadway 4. Push or work on veh in road 5. Other working in roadway 6. Playing in roadway 7. Other in roadway 8. Not in roadway 1 1 1 9. Not stated
2 2 1 Totals
7. AGE OF DRIVER All Crashes Fatal Injury 1. 14 & younger 2. 15 3. 16 11 3 4. 17 10 6 5. 18 10 6 6. 19 6 1 2 7. 20 6 3 8. 21 13 2 9. 22 to 24 23 8 10. 25 to 34 49 1 18 11. 35 to 44 39 1 17 12. 45 to 54 43 14 13. 55 to 64 44 1 17 14. 65 to 74 18 3 15. 75 & older 16 6 16. Not stated 8 3 Totals 296 4 108 8. SEX OF DRIVER Injury Fatal All Crashes
1. Male 195 4 61 2. Female 97 45 3. Not stated 4 2 Totals 296 4 108
9. RESIDENCE OF DRIVER All Crashes Fatal Injury
1. Local resident 142 2 58 2. In-state resident 60 1 19 3. Non resident 90 1 29 4. Not stated 4 2 Totals 296 4 108
10. CRASHES BY CONTRIBUTING FACTOR All InjuryFatal1. Speed too fast
5 1 1
1
7. Followed too closely 5 6 3 1 6
6. Improper overtaking5. Drove left of center4. Disregard traffic signal3. Passed stop sign2. Failed to yield 31 15
51 3 124
8. Made improper turn
Totals 256 5 93 8
9 2
1
1
46 1
27 4 2
12. Other 11. Mechanical defect10. Improper driving9. Had been drinking
12. ROAD SURFACECONDITION InjuryFatalAll
1. Dry 127 4 402. Wet 15 83. Snowy or icy 88 364. Other 5. Not stated 3Totals 233 4 84
13. LIGHT CONDITION InjuryFatalAll1. Daylight 130 1 502. Dawn or Dusk 24 1 73. Darkness 79 2 274. Not statedTotals 233 4 84
11. VEHICLE TYPE InjuryFatalAll1. Passenger car 254 2 932. Pass Car and trailer 9 1 23. Truck or truck tractor 4. Truck tractor with semi-trailer 30 1 95. Other truck combination 26. Farm tractor and/or equip. 7. Taxicab 8. Bus 9. School bus10. Motorcycle 5 511. Motor scooter or moped 12. Others and not stated 2Totals 302 4 109Special vehicles included above 13. Log trucks14. Emergency (incl. private) 1 115. Military vehicles 16. Other public vehicles 2
NOTE: THIS YEAR TO DATE represents only those crashes entered onto the database as of the date above. SAME PERIOD LAST YEAR represents all crashes including late reports. MAJOR INJURIES are incapacitating injuries. MINOR INJURIES are non-incapacitating evident injuries.
3. LOCATION Total
PropertyDamage
Nonfatal Injury Fatal Property
DamageNonfatal
InjuryFatalTotalPropertyDamage
Nonfatal Injury Fatal Total Killed Injured
Total On Roadway TotalOff Roadway Number Of Crashes Number Of Persons
1. Below 1,000 2. 1,000 to 2,500 3. 2,501 to 5,000 4. 5,001 to 10,000 5. 10,001 to 25,000 6. 25,001 to 50,000 7. 50,001 to 100,000 8. 100,001 to 200,000 9. City of Portland Only Total - Municipalities
24 2 4 6 2 5 7 4 9 13 3. County and Local Roads 167 1 24 17 1 42 172 110 282 196 127 1 324 4. City Streets
5. Not Stated Total--Urban Area 361332 34 1 672692142485301 248 3 552 6. Interstate System 7. Other State Freeways 8. Other State Highways 215 2 112 101 196 99 95 19 13 6 2 170Total--Urban System 215 2 112 101 196 2 99 95 19 13 6 2 170
6. Interstate System 7. Other State Freeways 8. Other State Highways 87 2 48 37 34 15 19 53 2 33 18 2 70Total--Rural System 87 2 48 37 34 15 19 53 2 33 18 2 70
June 1, 2007
BENTON COUNTY
218
At I
nter
sect
ion
Not
at I
nter
sect
ion
At
Inte
r. N
on -I
nter
.
BENTON COUNTY 2006 OREGON CRASHES
4. AGE OF CASUALTY
Number of Persons Killed Number of Persons Injured Total Killed Pedestrians Pedalcyclist Total Injured Pedestrians Pedalcyclist
Total Total Total Total Total TotalMale Male Male Male Male MaleFemale Female Female Female Female Female1. 0 to 4 2 5 72. 5 to 9 1 2 5 4 9 13. 10 to 14 3 1 3 1 2 9 9 18 24. 15 to 19 2 36 35 71 25. 20 to 24 2 3 63 33 96 16. 25 to 34 1 1 3 1 36 35 71 1 1 27. 35 to 44 1 2 5 1 40 27 67 38. 45 to 54 2 5 30 30 60 4 4 1 1 39. 55 to 64 1 1 1 1 20 18 3810. 65 to 74 2 2 11 10 21 1 1 11. 75 & older 2 1 1 13 8 2112. Not-stated 1 1Totals 6 6 1 1 480 215 265 10 6 4 24 14 10
Directional Analysis - A crash consisting of a series of collisions, overturning, etc., is classified according to the first damage or injury producing event; includes on roadway and off roadway.5A. MULTIPLE VEH CRASH Total Fatal Injury P.D.O.
Junction1. Car go straight 8 1 1 7 5 22. Car turning right3. Car turning left 2 2 24. Car backing 1 1 15. All othersTotals 11 1 1 10 7 3
5D. ALL OTHER CRASHES Total Fatal Injury P.D.O.Coll-isionWith
Coll-isionWith
1. Other rd veh or railway train 18 18 2. Fixed object 7 6 13 3. Other object or animal4. Overturning 2 2 5. Other noncollision 1 1 6. Other rd veh or railway train 8 8 7. Fixed object 43 75 4 122 8. Other object or animal 10 6 16 9. Overturning 2 5 7 10. Other noncollision 1 1 11. Not statedTotals 63121 4 188
6. PEDESTRIAN ACTION BY AGE
Ages of Pedstrians Killed and InjuredPedestrians Killed Total 0 to 4 5 to 9 10 to 14 15 to 19 20 to 24 25 to 44 45 to 64 65 & older Not stated
1a. X-ing at intersect or X-walk 3 2 2 2 9 1 1b. X-ing not at intersection 2a. Walking in road with traffic 2b. Same against traffic 3. Standing in roadway 4. Push or work on veh in road 5. Other working in roadway 6. Playing in roadway 7. Other in roadway 1 1 2 8. Not in roadway 9. Not stated
4 2 23 11 1 Totals
7. AGE OF DRIVER All Crashes Fatal Injury 1. 14 & YOUNGER 1 2. 15 3 3 3. 16 20 9 4. 17 33 14 5. 18 56 22 6. 19 71 33 7. 20 56 28 8. 21 57 31 9. 22 to 24 114 66 10. 25 to 34 172 1 95 11. 35 to 44 156 2 75 12. 45 to 54 175 3 77 13. 55 to 64 130 54 14. 65 to 74 56 1 26 15. 75 & older 58 23 16. Not stated 76 5 Totals 1,234 7 561 8. SEX OF DRIVER Injury Fatal All Crashes
1. Male 642 7 278 2. Female 586 281 3. Not stated 6 2 Totals 1,234 7 561
9. RESIDENCE OF DRIVER All Crashes Fatal Injury
1. Local resident 918 4 431 2. In-state resident 247 2 110 3. Non resident 38 1 16 4. Not stated 31 4 Totals 1,234 7 561
10. CRASHES BY CONTRIBUTING FACTOR All InjuryFatal1. Speed too fast
72 3 3
32 13
7. Followed too closely 158
1 10
7 70 31
6. Improper overtaking5. Drove left of center4. Disregard traffic signal3. Passed stop sign2. Failed to yield 153 74
49 3 83
8. Made improper turn
Totals 870 9 423 73
3 69 22 10
1 1 1 2
155 5
133 36 29
12. Other 11. Mechanical defect10. Improper driving9. Had been drinking
12. ROAD SURFACECONDITION InjuryFatalAll
1. Dry 506 5 2362. Wet 177 1 903. Snowy or icy 22 114. Other 5. Not statedTotals 705 6 337
13. LIGHT CONDITION InjuryFatalAll1. Daylight 541 5 2592. Dawn or Dusk 8 43. Darkness 156 1 744. Not statedTotals 705 6 337
11. VEHICLE TYPE InjuryFatalAll1. Passenger car 1,193 3 5262. Pass Car and trailer 6 43. Truck or truck tractor 7 34. Truck tractor with semi-trailer 25 2 95. Other truck combination 6. Farm tractor and/or equip. 7. Taxicab8. Bus 1 19. School bus 210. Motorcycle 24 1 2111. Motor scooter or moped 1 112. Others and not stated 3 1 1Totals 1,262 7 566Special vehicles included above 13. Log trucks 6 214. Emergency (incl. private) 15. Military vehicles 16. Other public vehicles 6 4
14. MANNER OF COLLISION InjuryFatalAll
1. Head-on 8 1 42. Rear end 185 893. Angle 252 984. Sideswipe-meeting 9 65. Sideswipe-overtaking 31 46. Backed into 18 47. Other 3 1Totals 506 1 206
11. Count of vehicles, including properly parked vehicles.
Totals include participant records where gender was coded as "unknown".
10. Count of crashes. Crashes with multiple contributing circumstances are counted in all applicable categories.
MULTIPLE VEHICLE CRASHES
7 - 9. Tally of drivers by age, sex, residence & crash severity. Excludes occupants of properly & improperly parked vehicles.
219
Col
lisio
n in
volv
ing:
N
on-
coll.
N
on-
coll.
C
ollis
ion
invo
lvin
g:
Non
- co
ll.
Col
lisio
n in
volv
ing:
3C
. RU
RA
L 3A
. Inc
orpo
rate
d A
reas
3B
. UR
BA
N
SUMMARY OF MOTOR VEHICLE TRAFFIC CRASHES 2006 OREGON CRASHESForIn
NOTE: THIS YEAR TO DATE represents only those crashes entered onto the database as of the date above. SAME PERIOD LAST YEAR represents all crashes including late reports. MAJOR INJURIES are incapacitating injuries. MINOR INJURIES are non-incapacitating evident injuries.
3. LOCATION Total
PropertyDamage
Nonfatal Injury Fatal Property
DamageNonfatal
InjuryFatalTotalPropertyDamage
Nonfatal Injury Fatal Total Killed Injured
Total On Roadway TotalOff Roadway Number Of Crashes Number Of Persons
1. Below 1,000 2. 1,000 to 2,500 3. 2,501 to 5,000 4. 5,001 to 10,000 5. 10,001 to 25,000 6. 25,001 to 50,000 7. 50,001 to 100,000 8. 100,001 to 200,000 9. City of Portland Only Total - Municipalities
Directional Analysis - A crash consisting of a series of collisions, overturning, etc., is classified according to the first damage or injury producing event; includes on roadway and off roadway.5A. MULTIPLE VEH CRASH Total Fatal Injury P.D.O.
Junction1. Car go straight 32 3 3 29 5 242. Car turning right 10 1 1 9 4 53. Car turning left 10 1 1 9 5 44. Car backing5. All othersTotals 52 5 1 4 47 14 33
5D. ALL OTHER CRASHES Total Fatal Injury P.D.O.Coll-isionWith
Coll-isionWith
1. Other rd veh or railway train 15 15 2. Fixed object 8 2 10 3. Other object or animal4. Overturning 1 2 3 5. Other noncollision6. Other rd veh or railway train 1 29 1 31 7. Fixed object 290 255 9 554 8. Other object or animal 39 13 52 9. Overturning 6 14 20 10. Other noncollision 4 5 1 10 11. Not statedTotals 349335 11 695
6. PEDESTRIAN ACTION BY AGE
Ages of Pedstrians Killed and InjuredPedestrians Killed Total 0 to 4 5 to 9 10 to 14 15 to 19 20 to 24 25 to 44 45 to 64 65 & older Not stated
1a. X-ing at intersect or X-walk 1 11 4 4 5 2 1 3 31 1 1b. X-ing not at intersection 1 1 2 1 2a. Walking in road with traffic 1 1 2b. Same against traffic 3. Standing in roadway 1 1 1 4. Push or work on veh in road 5. Other working in roadway 6. Playing in roadway 1 1 1 7. Other in roadway 3 5 1 1 3 2 1 16 1 8. Not in roadway 1 2 1 4 9. Not stated 1 1
4 17 105854 4 57 5 Totals
7. AGE OF DRIVER All Crashes Fatal Injury 1. 14 & younger 2. 15 12 4 3. 16 144 65 4. 17 259 131 5. 18 271 4 132 6. 19 232 2 114 7. 20 176 2 91 8. 21 162 90 9. 22 to 24 435 217 10. 25 to 34 1,251 5 630 11. 35 to 44 1,248 4 607 12. 45 to 54 1,182 13 547 13. 55 to 64 899 4 416 14. 65 to 74 341 3 142 15. 75 & older 265 108 16. Not stated 797 85 Totals 7,674 37 3,379 8. SEX OF DRIVER Injury Fatal All Crashes
1. Male 4,237 25 1,775 2. Female 3,271 12 1,559 3. Not stated 166 45 Totals 7,674 37 3,379
9. RESIDENCE OF DRIVER All Crashes Fatal Injury
1. Local resident 6,713 31 3,070 2. In-state resident 278 4 134 3. Non resident 255 2 102 4. Not stated 428 73 Totals 7,674 37 3,379
10. CRASHES BY CONTRIBUTING FACTOR All InjuryFatal1. Speed too fast
638 4
17 75 32
7. Followed too closely 1,436 1 4
1
24 37
123 64
6. Improper overtaking5. Drove left of center4. Disregard traffic signal3. Passed stop sign2. Failed to yield 1,017 5 425
418 13 867
8. Made improper turn
Totals 4,449 39 1,935 151
12 41 56 66
2
1 12
403 40
145 122 171
12. Other 11. Mechanical defect10. Improper driving9. Had been drinking
12. ROAD SURFACECONDITION InjuryFatalAll
1. Dry 2,780 17 1,2322. Wet 1,051 6 4573. Snowy or icy 157 2 584. Other 5. Not stated 45 1 4Totals 4,033 26 1,751
13. LIGHT CONDITION InjuryFatalAll1. Daylight 2,888 14 1,2692. Dawn or Dusk 195 1 783. Darkness 944 11 4034. Not stated 6 1Totals 4,033 26 1,751
11. VEHICLE TYPE InjuryFatalAll1. Passenger car 7,413 29 3,2382. Pass Car and trailer 53 1 233. Truck or truck tractor 50 194. Truck tractor with semi-trailer 101 3 385. Other truck combination 11 46. Farm tractor and/or equip. 17. Taxicab 18. Bus 21 89. School bus 11 1 510. Motorcycle 65 3 5911. Motor scooter or moped 1 112. Others and not stated 44 11Totals 7,772 37 3,406Special vehicles included above 13. Log trucks 114. Emergency (incl. private) 17 515. Military vehicles 116. Other public vehicles 32 1 16
14. MANNER OF COLLISION InjuryFatalAll
1. Head-on 50 5 322. Rear end 1,672 7603. Angle 1,125 4 4604. Sideswipe-meeting 95 395. Sideswipe-overtaking 251 1 676. Backed into 77 97. Other 16 4Totals 3,286 10 1,371
11. Count of vehicles, including properly parked vehicles.
Totals include participant records where gender was coded as "unknown".
10. Count of crashes. Crashes with multiple contributing circumstances are counted in all applicable categories.
MULTIPLE VEHICLE CRASHES
7 - 9. Tally of drivers by age, sex, residence & crash severity. Excludes occupants of properly & improperly parked vehicles.
221
Col
lisio
n in
volv
ing:
N
on-
coll.
N
on-
coll.
C
ollis
ion
invo
lvin
g:
Non
- co
ll.
Col
lisio
n in
volv
ing:
3C
. RU
RA
L 3A
. Inc
orpo
rate
d A
reas
3B
. UR
BA
N
SUMMARY OF MOTOR VEHICLE TRAFFIC CRASHES 2006 OREGON CRASHESForIn
5. Not Stated 245 7 40 51 5 96 80 84 2 166 120 135 7 262 Total--Rural Area
NOTE: THIS YEAR TO DATE represents only those crashes entered onto the database as of the date above. SAME PERIOD LAST YEAR represents all crashes including late reports. MAJOR INJURIES are incapacitating injuries. MINOR INJURIES are non-incapacitating evident injuries.
3. LOCATION Total
PropertyDamage
Nonfatal Injury Fatal Property
DamageNonfatal
InjuryFatalTotalPropertyDamage
Nonfatal Injury Fatal Total Killed Injured
Total On Roadway TotalOff Roadway Number Of Crashes Number Of Persons
1. Below 1,000 2. 1,000 to 2,500 3. 2,501 to 5,000 4. 5,001 to 10,000 5. 10,001 to 25,000 6. 25,001 to 50,000 7. 50,001 to 100,000 8. 100,001 to 200,000 9. City of Portland Only Total - Municipalities
1 14 42
212
268 1
7 7 23 19 87 124
117 150
6 6 12 18 18 36
1 78 108 187
1 102 132 235
1 1 2 5 1 6 9 16 25
15 18 33
9 40
150 1
199 1
114 1 1 5 6 65 55 1 121 66 60 1 127 1. Primary State Highways 3 1 1 2 5 1 6 6 2 8 2. Secondary State Highways 2 1 1 1 1 1 1 2 3. County and Local Roads
35 14 4 18 39 23 62 53 27 80 4. City Streets 5. Not Stated Total--Urban Area 154117 10 27109801190126 90 1 217 6. Interstate System 7. Other State Freeways 8. Other State Highways 135 1 62 72 127 56 70 8 6 2 1 117Total--Urban System 135 1 62 72 127 1 56 70 8 6 2 1 117
6. Interstate System 7. Other State Freeways 8. Other State Highways 226 6 119 101 147 2 76 69 79 4 43 32 6 215Total--Rural System 226 6 119 101 147 2 76 69 79 4 43 32 6 215
June 1, 2007
CLATSOP COUNTY
222
At I
nter
sect
ion
Not
at I
nter
sect
ion
At
Inte
r. N
on -I
nter
.
CLATSOP COUNTY 2006 OREGON CRASHES
4. AGE OF CASUALTY
Number of Persons Killed Number of Persons Injured Total Killed Pedestrians Pedalcyclist Total Injured Pedestrians Pedalcyclist
Total Total Total Total Total TotalMale Male Male Male Male MaleFemale Female Female Female Female Female1. 0 to 4 3 2 52. 5 to 9 1 3 5 8 13. 10 to 14 2 12 5 17 24. 15 to 19 1 1 38 22 60 1 1 5. 20 to 24 1 1 18 24 42 1 1 6. 25 to 34 2 2 36 25 617. 35 to 44 1 1 26 26 52 2 1 18. 45 to 54 2 1 4 1 1 29 31 60 2 1 1 39. 55 to 64 1 1 24 24 48 1 1 10. 65 to 74 1 1 11 12 2311. 75 & older 9 8 17 1 112. Not-stated 1 4 6Totals 8 5 3 399 188 210 8 3 5 8 6 2
Directional Analysis - A crash consisting of a series of collisions, overturning, etc., is classified according to the first damage or injury producing event; includes on roadway and off roadway.5A. MULTIPLE VEH CRASH Total Fatal Injury P.D.O.
5B. MULTIPLE VEH CRASH Total Fatal Injury P.D.O. 9 12 2 231. Moving in opposite dir.
22 13 352. Both moving in same dir. 9 3 123a. One car parked
39 38 773b. One car stopped in traffic 4 44. Enter/Leave parked pos. 1 1 25a. Entering driveway/alley
10 1 115b. Leaving driveway/alley 4 6 106. All others
Totals 98 74 2 174
5C. PEDESTRIANCRASHES
All PedCrashes
Fatal Crashes Non-Fatal Injury Crashes
TotalAt
Intersection Non-
Junction TotalAt
IntersectionNon-
Junction1. Car go straight 6 6 4 22. Car turning right3. Car turning left 2 2 24. Car backing5. All othersTotals 8 8 6 2
5D. ALL OTHER CRASHES Total Fatal Injury P.D.O.Coll-isionWith
Coll-isionWith
1. Other rd veh or railway train 3 3 2. Fixed object 1 3 4 3. Other object or animal 2 2 4. Overturning 1 1 5. Other noncollision6. Other rd veh or railway train 1 4 5 7. Fixed object 43 51 4 98 8. Other object or animal 24 3 27 9. Overturning 4 3 2 9 10. Other noncollision 1 1 2 11. Not statedTotals 7471 6 151
6. PEDESTRIAN ACTION BY AGE
Ages of Pedstrians Killed and InjuredPedestrians Killed Total 0 to 4 5 to 9 10 to 14 15 to 19 20 to 24 25 to 44 45 to 64 65 & older Not stated
1a. X-ing at intersect or X-walk 1 1 1 1 4 1b. X-ing not at intersection 1 2 3 2a. Walking in road with traffic 2b. Same against traffic 3. Standing in roadway 4. Push or work on veh in road 5. Other working in roadway 6. Playing in roadway 7. Other in roadway 8. Not in roadway 1 1 9. Not stated
1 2 311 8 Totals
7. AGE OF DRIVER All Crashes Fatal Injury 1. 14 & younger 2. 15 2 1 3. 16 11 6 4. 17 21 15 5. 18 38 1 14 6. 19 26 14 7. 20 20 9 8. 21 20 12 9. 22 to 24 50 2 23 10. 25 to 34 105 59 11. 35 to 44 103 3 58 12. 45 to 54 152 4 68 13. 55 to 64 125 1 56 14. 65 to 74 58 32 15. 75 & older 40 1 25 16. Not stated 53 4 Totals 824 12 396 8. SEX OF DRIVER Injury Fatal All Crashes
1. Male 491 8 230 2. Female 324 4 165 3. Not stated 9 1 Totals 824 12 396
9. RESIDENCE OF DRIVER All Crashes Fatal Injury
1. Local resident 545 8 263 2. In-state resident 162 2 84 3. Non resident 100 2 46 4. Not stated 17 3 Totals 824 12 396
10. CRASHES BY CONTRIBUTING FACTOR All InjuryFatal1. Speed too fast
55
6
7
7. Followed too closely 110
2 1
19 4 7
6. Improper overtaking5. Drove left of center4. Disregard traffic signal3. Passed stop sign2. Failed to yield 122 62
58 3 110
8. Made improper turn
Totals 632 11 310 56
6 50 7 3
4 2
113 11
114 11 10
12. Other 11. Mechanical defect10. Improper driving9. Had been drinking
12. ROAD SURFACECONDITION InjuryFatalAll
1. Dry 298 5 1452. Wet 130 2 563. Snowy or icy 42 224. Other 5. Not stated 9 1 2Totals 479 8 225
13. LIGHT CONDITION InjuryFatalAll1. Daylight 365 7 1742. Dawn or Dusk 29 173. Darkness 85 1 344. Not statedTotals 479 8 225
11. VEHICLE TYPE InjuryFatalAll1. Passenger car 776 6 3722. Pass Car and trailer 15 53. Truck or truck tractor 9 2 54. Truck tractor with semi-trailer 17 1 65. Other truck combination 4 36. Farm tractor and/or equip. 7. Taxicab8. Bus 2 29. School bus 110. Motorcycle 11 3 711. Motor scooter or moped 12. Others and not stated 7 1Totals 842 12 401Special vehicles included above 13. Log trucks 12 1 414. Emergency (incl. private) 5 115. Military vehicles 16. Other public vehicles 13 4
14. MANNER OF COLLISION InjuryFatalAll
1. Head-on 4 1 12. Rear end 158 803. Angle 105 474. Sideswipe-meeting 21 1 105. Sideswipe-overtaking 14 56. Backed into 12 27. Other 6 1Totals 320 2 146
11. Count of vehicles, including properly parked vehicles.
Totals include participant records where gender was coded as "unknown".
10. Count of crashes. Crashes with multiple contributing circumstances are counted in all applicable categories.
MULTIPLE VEHICLE CRASHES
7 - 9. Tally of drivers by age, sex, residence & crash severity. Excludes occupants of properly & improperly parked vehicles.
223
Col
lisio
n in
volv
ing:
N
on-
coll.
N
on-
coll.
C
ollis
ion
invo
lvin
g:
Non
- co
ll.
Col
lisio
n in
volv
ing:
3C
. RU
RA
L 3A
. Inc
orpo
rate
d A
reas
3B
. UR
BA
N
SUMMARY OF MOTOR VEHICLE TRAFFIC CRASHES 2006 OREGON CRASHESForIn
5. Not Stated 163 6 48 40 1 89 75 64 4 143 123 104 5 232 Total--Rural Area
NOTE: THIS YEAR TO DATE represents only those crashes entered onto the database as of the date above. SAME PERIOD LAST YEAR represents all crashes including late reports. MAJOR INJURIES are incapacitating injuries. MINOR INJURIES are non-incapacitating evident injuries.
3. LOCATION Total
PropertyDamage
Nonfatal Injury Fatal Property
DamageNonfatal
InjuryFatalTotalPropertyDamage
Nonfatal Injury Fatal Total Killed Injured
Total On Roadway TotalOff Roadway Number Of Crashes Number Of Persons
1. Below 1,000 2. 1,000 to 2,500 3. 2,501 to 5,000 4. 5,001 to 10,000 5. 10,001 to 25,000 6. 25,001 to 50,000 7. 50,001 to 100,000 8. 100,001 to 200,000 9. City of Portland Only Total - Municipalities
2 1 1 1 3 1 4 3 1 1 5 3. County and Local Roads 62 8 5 13 28 32 60 36 37 73 4. City Streets
5. Not Stated Total--Urban Area 96211 8 1 20465219957 60 2 119 6. Interstate System 7. Other State Freeways 8. Other State Highways 41 1 22 18 35 19 15 6 3 3 1 32Total--Urban System 41 1 22 18 35 1 19 15 6 3 3 1 32
6. Interstate System 7. Other State Freeways 8. Other State Highways 128 3 57 68 95 3 42 50 33 15 18 4 106Total--Rural System 128 3 57 68 95 3 42 50 33 15 18 4 106
June 1, 2007
COLUMBIA COUNTY
224
At I
nter
sect
ion
Not
at I
nter
sect
ion
At
Inte
r. N
on -I
nter
.
COLUMBIA COUNTY 2006 OREGON CRASHES
4. AGE OF CASUALTY
Number of Persons Killed Number of Persons Injured Total Killed Pedestrians Pedalcyclist Total Injured Pedestrians Pedalcyclist
Total Total Total Total Total TotalMale Male Male Male Male MaleFemale Female Female Female Female Female1. 0 to 4 1 5 62. 5 to 9 4 5 93. 10 to 14 3 5 84. 15 to 19 3 4 25 15 40 1 1 15. 20 to 24 16 17 33 1 16. 25 to 34 16 18 34 1 1 7. 35 to 44 1 1 26 18 448. 45 to 54 14 23 37 1 1 9. 55 to 64 8 13 2110. 65 to 74 5 5 10 2 2 1 1 11. 75 & older 4 7 11 2 1 1 1 1 12. Not-stated 1 1 5 1 6Totals 8 4 4 2 2 259 132 127 1 1 5 1 4
Directional Analysis - A crash consisting of a series of collisions, overturning, etc., is classified according to the first damage or injury producing event; includes on roadway and off roadway.5A. MULTIPLE VEH CRASH Total Fatal Injury P.D.O.
5B. MULTIPLE VEH CRASH Total Fatal Injury P.D.O. 7 11 3 211. Moving in opposite dir.
10 9 192. Both moving in same dir. 7 2 93a. One car parked
16 21 373b. One car stopped in traffic 2 24. Enter/Leave parked pos. 1 1 25a. Entering driveway/alley 8 2 105b. Leaving driveway/alley 3 2 56. All others
Totals 54 48 3 105
5C. PEDESTRIANCRASHES
All PedCrashes
Fatal Crashes Non-Fatal Injury Crashes
TotalAt
Intersection Non-
Junction TotalAt
IntersectionNon-
Junction1. Car go straight 2 2 22. Car turning right3. Car turning left 1 1 14. Car backing5. All othersTotals 3 2 2 1 1
5D. ALL OTHER CRASHES Total Fatal Injury P.D.O.Coll-isionWith
Coll-isionWith
1. Other rd veh or railway train 2 2 2. Fixed object 3 2 5 3. Other object or animal4. Overturning 1 1 5. Other noncollision 1 1 6. Other rd veh or railway train 2 2 7. Fixed object 46 38 2 86 8. Other object or animal 17 4 21 9. Overturning 3 7 10 10. Other noncollision 1 1 11. Not statedTotals 7057 2 129
6. PEDESTRIAN ACTION BY AGE
Ages of Pedstrians Killed and InjuredPedestrians Killed Total 0 to 4 5 to 9 10 to 14 15 to 19 20 to 24 25 to 44 45 to 64 65 & older Not stated
1a. X-ing at intersect or X-walk 1b. X-ing not at intersection 2 2 2 2a. Walking in road with traffic 2b. Same against traffic 3. Standing in roadway 4. Push or work on veh in road 5. Other working in roadway 6. Playing in roadway 7. Other in roadway 8. Not in roadway 1 1 9. Not stated
2 1 3 2 Totals
7. AGE OF DRIVER All Crashes Fatal Injury 1. 14 & younger 2. 15 4 3. 16 15 6 4. 17 23 10 5. 18 18 8 6. 19 20 1 9 7. 20 11 5 8. 21 11 7 9. 22 to 24 33 2 18 10. 25 to 34 90 3 52 11. 35 to 44 90 1 49 12. 45 to 54 102 1 56 13. 55 to 64 69 2 30 14. 65 to 74 30 13 15. 75 & older 29 1 14 16. Not stated 38 6 Totals 583 11 283 8. SEX OF DRIVER Injury Fatal All Crashes
1. Male 341 8 166 2. Female 237 3 116 3. Not stated 5 1 Totals 583 11 283
9. RESIDENCE OF DRIVER All Crashes Fatal Injury
1. Local resident 453 5 226 2. In-state resident 59 1 31 3. Non resident 55 5 23 4. Not stated 16 3 Totals 583 11 283
10. CRASHES BY CONTRIBUTING FACTOR All InjuryFatal1. Speed too fast
38
5 6 2
7. Followed too closely 66
2 11 10
7
6. Improper overtaking5. Drove left of center4. Disregard traffic signal3. Passed stop sign2. Failed to yield 90 39
38 2 72
8. Made improper turn
Totals 466 9 230 40
3 47 7 5
2
2 1
88 4
100 10
8
12. Other 11. Mechanical defect10. Improper driving9. Had been drinking
12. ROAD SURFACECONDITION InjuryFatalAll
1. Dry 212 3 1042. Wet 108 2 493. Snowy or icy 27 114. Other 5. Not stated 4 2Totals 351 7 164
13. LIGHT CONDITION InjuryFatalAll1. Daylight 234 3 1082. Dawn or Dusk 18 1 83. Darkness 99 3 484. Not statedTotals 351 7 164
11. VEHICLE TYPE InjuryFatalAll1. Passenger car 546 10 2672. Pass Car and trailer 2 13. Truck or truck tractor 9 34. Truck tractor with semi-trailer 22 1 85. Other truck combination 1 16. Farm tractor and/or equip. 7. Taxicab 8. Bus9. School bus 2 110. Motorcycle 4 411. Motor scooter or moped 12. Others and not stated 8 1Totals 594 11 286Special vehicles included above 13. Log trucks 4 1 214. Emergency (incl. private) 3 115. Military vehicles 16. Other public vehicles 5 3
14. MANNER OF COLLISION InjuryFatalAll
1. Head-on 6 3 22. Rear end 96 573. Angle 84 364. Sideswipe-meeting 13 85. Sideswipe-overtaking 8 26. Backed into 9 17. Other 3Totals 219 3 106
11. Count of vehicles, including properly parked vehicles.
Totals include participant records where gender was coded as "unknown".
10. Count of crashes. Crashes with multiple contributing circumstances are counted in all applicable categories.
MULTIPLE VEHICLE CRASHES
7 - 9. Tally of drivers by age, sex, residence & crash severity. Excludes occupants of properly & improperly parked vehicles.
225
Col
lisio
n in
volv
ing:
N
on-
coll.
N
on-
coll.
C
ollis
ion
invo
lvin
g:
Non
- co
ll.
Col
lisio
n in
volv
ing:
3C
. RU
RA
L 3A
. Inc
orpo
rate
d A
reas
3B
. UR
BA
N
SUMMARY OF MOTOR VEHICLE TRAFFIC CRASHES 2006 OREGON CRASHESForIn
NOTE: THIS YEAR TO DATE represents only those crashes entered onto the database as of the date above. SAME PERIOD LAST YEAR represents all crashes including late reports. MAJOR INJURIES are incapacitating injuries. MINOR INJURIES are non-incapacitating evident injuries.
3. LOCATION Total
PropertyDamage
Nonfatal Injury Fatal Property
DamageNonfatal
InjuryFatalTotalPropertyDamage
Nonfatal Injury Fatal Total Killed Injured
Total On Roadway TotalOff Roadway Number Of Crashes Number Of Persons
1. Below 1,000 2. 1,000 to 2,500 3. 2,501 to 5,000 4. 5,001 to 10,000 5. 10,001 to 25,000 6. 25,001 to 50,000 7. 50,001 to 100,000 8. 100,001 to 200,000 9. City of Portland Only Total - Municipalities
3 3 3 3 3. County and Local Roads 94 22 7 29 129 59 188 151 66 217 4. City Streets
5. Not Stated Total--Urban Area 18232 11 43219112331251 123 374 6. Interstate System 7. Other State Freeways 8. Other State Highways 154 57 97 140 53 87 14 4 10 88Total--Urban System 154 57 97 140 53 87 14 4 10 88
6. Interstate System 7. Other State Freeways 8. Other State Highways 187 4 93 90 112 1 54 57 75 3 39 33 5 140Total--Rural System 187 4 93 90 112 1 54 57 75 3 39 33 5 140
June 1, 2007
COOS COUNTY
226
At I
nter
sect
ion
Not
at I
nter
sect
ion
At
Inte
r. N
on -I
nter
.
COOS COUNTY 2006 OREGON CRASHES
4. AGE OF CASUALTY
Number of Persons Killed Number of Persons Injured Total Killed Pedestrians Pedalcyclist Total Injured Pedestrians Pedalcyclist
Total Total Total Total Total TotalMale Male Male Male Male MaleFemale Female Female Female Female Female1. 0 to 4 1 12. 5 to 9 1 1 3 4 13. 10 to 14 2 2 3 3 64. 15 to 19 1 2 36 17 53 2 1 1 15. 20 to 24 1 20 24 44 2 1 1 16. 25 to 34 2 2 21 28 497. 35 to 44 1 34 15 49 18. 45 to 54 1 1 31 35 66 2 2 9. 55 to 64 2 2 24 22 46 1 1 10. 65 to 74 2 2 12 21 33 2 211. 75 & older 8 6 1412. Not-stated 4 4 3 7 10Totals 9 5 4 375 181 194 13 12 1 5 4 1
Directional Analysis - A crash consisting of a series of collisions, overturning, etc., is classified according to the first damage or injury producing event; includes on roadway and off roadway.5A. MULTIPLE VEH CRASH Total Fatal Injury P.D.O.
24 5 295b. Leaving driveway/alley 19 10 296. All others
Totals 182 98 1 281
5C. PEDESTRIANCRASHES
All PedCrashes
Fatal Crashes Non-Fatal Injury Crashes
TotalAt
Intersection Non-
Junction TotalAt
IntersectionNon-
Junction1. Car go straight 7 7 3 42. Car turning right 1 1 13. Car turning left 4 4 44. Car backing5. All othersTotals 12 12 8 4
5D. ALL OTHER CRASHES Total Fatal Injury P.D.O.Coll-isionWith
Coll-isionWith
1. Other rd veh or railway train 3 3 2. Fixed object 5 2 7 3. Other object or animal 1 1 4. Overturning 1 1 5. Other noncollision6. Other rd veh or railway train 2 2 7. Fixed object 70 61 7 138 8. Other object or animal 14 6 20 9. Overturning 8 12 20 10. Other noncollision11. Not statedTotals 9986 7 192
6. PEDESTRIAN ACTION BY AGE
Ages of Pedstrians Killed and InjuredPedestrians Killed Total 0 to 4 5 to 9 10 to 14 15 to 19 20 to 24 25 to 44 45 to 64 65 & older Not stated
1a. X-ing at intersect or X-walk 3 2 1 1 7 1b. X-ing not at intersection 1 1 2 4 2a. Walking in road with traffic 1 1 2b. Same against traffic 3. Standing in roadway 1 1 4. Push or work on veh in road 5. Other working in roadway 6. Playing in roadway 7. Other in roadway 8. Not in roadway 9. Not stated
42 3 22 13 Totals
7. AGE OF DRIVER All Crashes Fatal Injury 1. 14 & younger 2. 15 3. 16 24 12 4. 17 34 2 17 5. 18 49 17 6. 19 37 15 7. 20 33 1 8 8. 21 21 9 9. 22 to 24 70 1 30 10. 25 to 34 167 62 11. 35 to 44 151 59 12. 45 to 54 217 2 87 13. 55 to 64 137 1 58 14. 65 to 74 98 2 37 15. 75 & older 70 23 16. Not stated 53 6 Totals 1,161 9 440 8. SEX OF DRIVER Injury Fatal All Crashes
1. Male 627 5 237 2. Female 526 4 200 3. Not stated 8 3 Totals 1,161 9 440
9. RESIDENCE OF DRIVER All Crashes Fatal Injury
1. Local resident 997 9 367 2. In-state resident 103 53 3. Non resident 42 14 4. Not stated 19 6 Totals 1,161 9 440
10. CRASHES BY CONTRIBUTING FACTOR All InjuryFatal1. Speed too fast
26 4
12 4 6
7. Followed too closely 52 23 24 17 10
6. Improper overtaking5. Drove left of center4. Disregard traffic signal3. Passed stop sign2. Failed to yield 198 77
80 4 182
8. Made improper turn
Totals 775 11 322 34
8 52 13
6
3
2 2
93 10
127 18 21
12. Other 11. Mechanical defect10. Improper driving9. Had been drinking
12. ROAD SURFACECONDITION InjuryFatalAll
1. Dry 477 5 1882. Wet 175 3 613. Snowy or icy 21 124. Other 5. Not stated 2Totals 675 8 261
13. LIGHT CONDITION InjuryFatalAll1. Daylight 516 3 1972. Dawn or Dusk 24 1 103. Darkness 135 4 544. Not statedTotals 675 8 261
11. VEHICLE TYPE InjuryFatalAll1. Passenger car 1,115 8 4112. Pass Car and trailer 9 33. Truck or truck tractor 4 24. Truck tractor with semi-trailer 25 1 85. Other truck combination 2 26. Farm tractor and/or equip. 7. Taxicab 1 18. Bus9. School bus 2 110. Motorcycle 15 1411. Motor scooter or moped 12. Others and not stated 11 6Totals 1,184 9 448Special vehicles included above 13. Log trucks 6 1 214. Emergency (incl. private) 2 115. Military vehicles 16. Other public vehicles 9 3
14. MANNER OF COLLISION InjuryFatalAll
1. Head-on 14 82. Rear end 177 733. Angle 206 714. Sideswipe-meeting 16 1 65. Sideswipe-overtaking 36 36. Backed into 20 27. Other 2Totals 471 1 163
11. Count of vehicles, including properly parked vehicles.
Totals include participant records where gender was coded as "unknown".
10. Count of crashes. Crashes with multiple contributing circumstances are counted in all applicable categories.
MULTIPLE VEHICLE CRASHES
7 - 9. Tally of drivers by age, sex, residence & crash severity. Excludes occupants of properly & improperly parked vehicles.
227
Col
lisio
n in
volv
ing:
N
on-
coll.
N
on-
coll.
C
ollis
ion
invo
lvin
g:
Non
- co
ll.
Col
lisio
n in
volv
ing:
3C
. RU
RA
L 3A
. Inc
orpo
rate
d A
reas
3B
. UR
BA
N
SUMMARY OF MOTOR VEHICLE TRAFFIC CRASHES 2006 OREGON CRASHESForIn
NOTE: THIS YEAR TO DATE represents only those crashes entered onto the database as of the date above. SAME PERIOD LAST YEAR represents all crashes including late reports. MAJOR INJURIES are incapacitating injuries. MINOR INJURIES are non-incapacitating evident injuries.
3. LOCATION Total
PropertyDamage
Nonfatal Injury Fatal Property
DamageNonfatal
InjuryFatalTotalPropertyDamage
Nonfatal Injury Fatal Total Killed Injured
Total On Roadway TotalOff Roadway Number Of Crashes Number Of Persons
1. Below 1,000 2. 1,000 to 2,500 3. 2,501 to 5,000 4. 5,001 to 10,000 5. 10,001 to 25,000 6. 25,001 to 50,000 7. 50,001 to 100,000 8. 100,001 to 200,000 9. City of Portland Only Total - Municipalities
3. County and Local Roads 26 3 1 4 25 18 43 28 19 47 4. City Streets
5. Not Stated Total--Urban Area 557 3 1049398856 42 98 6. Interstate System 7. Other State Freeways 8. Other State Highways 51 23 28 45 21 24 6 2 4 29Total--Urban System 51 23 28 45 21 24 6 2 4 29
6. Interstate System 7. Other State Freeways 8. Other State Highways 67 3 23 41 40 2 8 30 27 1 15 11 3 38Total--Rural System 67 3 23 41 40 2 8 30 27 1 15 11 3 38
June 1, 2007
CROOK COUNTY
228
At I
nter
sect
ion
Not
at I
nter
sect
ion
At
Inte
r. N
on -I
nter
.
CROOK COUNTY 2006 OREGON CRASHES
4. AGE OF CASUALTY
Number of Persons Killed Number of Persons Injured Total Killed Pedestrians Pedalcyclist Total Injured Pedestrians Pedalcyclist
Total Total Total Total Total TotalMale Male Male Male Male MaleFemale Female Female Female Female Female1. 0 to 4 2. 5 to 9 2 2 43. 10 to 14 1 1 1 1 1 2 14. 15 to 19 1 10 6 16 1 1 15. 20 to 24 6 5 116. 25 to 34 2 2 13 8 217. 35 to 44 8 7 15 1 18. 45 to 54 10 10 20 1 19. 55 to 64 1 2 1 9 5 14 1 1 210. 65 to 74 3 2 511. 75 & older 1 4 512. Not-stated Totals 4 2 2 113 50 63 4 3 1 4 4
Directional Analysis - A crash consisting of a series of collisions, overturning, etc., is classified according to the first damage or injury producing event; includes on roadway and off roadway.5A. MULTIPLE VEH CRASH Total Fatal Injury P.D.O.
Junction1. Car go straight 2 2 1 12. Car turning right3. Car turning left 2 2 24. Car backing5. All othersTotals 4 4 3 1
5D. ALL OTHER CRASHES Total Fatal Injury P.D.O.Coll-isionWith
Coll-isionWith
1. Other rd veh or railway train 3 3 2. Fixed object 1 1 3. Other object or animal4. Overturning 5. Other noncollision6. Other rd veh or railway train 1 1 2 7. Fixed object 33 29 2 64 8. Other object or animal 18 1 19 9. Overturning10. Other noncollision 11. Not statedTotals 5334 2 89
6. PEDESTRIAN ACTION BY AGE
Ages of Pedstrians Killed and InjuredPedestrians Killed Total 0 to 4 5 to 9 10 to 14 15 to 19 20 to 24 25 to 44 45 to 64 65 & older Not stated
1a. X-ing at intersect or X-walk 1 2 3 1b. X-ing not at intersection 1 1 2a. Walking in road with traffic 2b. Same against traffic 3. Standing in roadway 4. Push or work on veh in road 5. Other working in roadway 6. Playing in roadway 7. Other in roadway 8. Not in roadway 9. Not stated
1 21 4 Totals
7. AGE OF DRIVER All Crashes Fatal Injury 1. 14 & YOUNGER 1 2. 15 1 3. 16 8 3 4. 17 20 1 7 5. 18 17 3 6. 19 8 3 7. 20 9 4 8. 21 4 1 9. 22 to 24 18 5 10. 25 to 34 57 1 20 11. 35 to 44 64 1 26 12. 45 to 54 53 1 22 13. 55 to 64 44 1 21 14. 65 to 74 22 6 15. 75 & older 20 1 9 16. Not stated 8 Totals 354 6 130 8. SEX OF DRIVER Injury Fatal All Crashes
1. Male 209 3 63 2. Female 145 3 67 3. Not stated Totals 354 6 130
9. RESIDENCE OF DRIVER All Crashes Fatal Injury
1. Local resident 317 6 115 2. In-state resident 25 11 3. Non resident 10 4 4. Not stated 2 0 Totals 354 6 130
10. CRASHES BY CONTRIBUTING FACTOR All InjuryFatal1. Speed too fast
8
1 1 4
7. Followed too closely 15 1
2 6 8 4 9
6. Improper overtaking5. Drove left of center4. Disregard traffic signal3. Passed stop sign2. Failed to yield 42 18
48 1 112
8. Made improper turn
Totals 234 7 85 1 1 1 2
1 2
16 1
11 6 4
12. Other 11. Mechanical defect10. Improper driving9. Had been drinking
12. ROAD SURFACECONDITION InjuryFatalAll
1. Dry 169 3 692. Wet 20 23. Snowy or icy 30 104. Other 5. Not stated 2 1 1Totals 221 4 82
13. LIGHT CONDITION InjuryFatalAll1. Daylight 155 3 612. Dawn or Dusk 13 1 43. Darkness 53 174. Not statedTotals 221 4 82
11. VEHICLE TYPE InjuryFatalAll1. Passenger car 338 6 1252. Pass Car and trailer 7 23. Truck or truck tractor 24. Truck tractor with semi-trailer 65. Other truck combination 16. Farm tractor and/or equip. 7. Taxicab 8. Bus 9. School bus10. Motorcycle 3 311. Motor scooter or moped 12. Others and not stated Totals 357 6 130Special vehicles included above 13. Log trucks14. Emergency (incl. private) 215. Military vehicles 16. Other public vehicles
14. MANNER OF COLLISION InjuryFatalAll
1. Head-on 2 22. Rear end 53 263. Angle 50 144. Sideswipe-meeting 9 35. Sideswipe-overtaking 26. Backed into 57. Other 7 1Totals 128 2 44
11. Count of vehicles, including properly parked vehicles.
Totals include participant records where gender was coded as "unknown".
10. Count of crashes. Crashes with multiple contributing circumstances are counted in all applicable categories.
MULTIPLE VEHICLE CRASHES
7 - 9. Tally of drivers by age, sex, residence & crash severity. Excludes occupants of properly & improperly parked vehicles.
229
Col
lisio
n in
volv
ing:
N
on-
coll.
N
on-
coll.
C
ollis
ion
invo
lvin
g:
Non
- co
ll.
Col
lisio
n in
volv
ing:
3C
. RU
RA
L 3A
. Inc
orpo
rate
d A
reas
3B
. UR
BA
N
SUMMARY OF MOTOR VEHICLE TRAFFIC CRASHES 2006 OREGON CRASHESForIn
24 3 17 13 3 33 8 6 14 25 19 3 47 3. County and Local Roads 3 3 3 3 4. City Streets
5. Not Stated 56 3 37 25 3 65 40 17 57 77 42 3 122 Total--Rural Area
NOTE: THIS YEAR TO DATE represents only those crashes entered onto the database as of the date above. SAME PERIOD LAST YEAR represents all crashes including late reports. MAJOR INJURIES are incapacitating injuries. MINOR INJURIES are non-incapacitating evident injuries.
3. LOCATION Total
PropertyDamage
Nonfatal Injury Fatal Property
DamageNonfatal
InjuryFatalTotalPropertyDamage
Nonfatal Injury Fatal Total Killed Injured
Total On Roadway TotalOff Roadway Number Of Crashes Number Of Persons
1. Below 1,000 2. 1,000 to 2,500 3. 2,501 to 5,000 4. 5,001 to 10,000 5. 10,001 to 25,000 6. 25,001 to 50,000 7. 50,001 to 100,000 8. 100,001 to 200,000 9. City of Portland Only Total - Municipalities
13 47
60
1 12
21 26
22 38
1 9 10
18 23 41
19 32 51
3 3
3 3 6
3 6 9
2
26
28
17 2 2 4 13 13 26 15 15 30 1. Primary State Highways 2. Secondary State Highways
2 1 1 1 1 2 2 3. County and Local Roads 9 1 1 2 11 5 16 12 6 18 4. City Streets
5. Not Stated Total--Urban Area 283 4 724194327 23 50 6. Interstate System 7. Other State Freeways 8. Other State Highways 30 15 15 26 13 13 4 2 2 17Total--Urban System 30 15 15 26 13 13 4 2 2 17
6. Interstate System 7. Other State Freeways 8. Other State Highways 72 23 49 40 11 29 32 12 20 32Total--Rural System 72 23 49 40 11 29 32 12 20 32
June 1, 2007
CURRY COUNTY
230
At I
nter
sect
ion
Not
at I
nter
sect
ion
At
Inte
r. N
on -I
nter
.
CURRY COUNTY 2006 OREGON CRASHES
4. AGE OF CASUALTY
Number of Persons Killed Number of Persons Injured Total Killed Pedestrians Pedalcyclist Total Injured Pedestrians Pedalcyclist
Total Total Total Total Total TotalMale Male Male Male Male MaleFemale Female Female Female Female Female1. 0 to 4 1 12. 5 to 9 3. 10 to 14 4. 15 to 19 5 5 105. 20 to 24 4 8 126. 25 to 34 8 4 127. 35 to 44 8 4 128. 45 to 54 5 5 10 1 19. 55 to 64 3 5 810. 65 to 74 5 6 11 1 111. 75 & older 4 3 7 1 1 1 1 12. Not-stated 1 1 1 1Totals 3 3 1 1 84 41 43 1 1
Directional Analysis - A crash consisting of a series of collisions, overturning, etc., is classified according to the first damage or injury producing event; includes on roadway and off roadway.5A. MULTIPLE VEH CRASH Total Fatal Injury P.D.O.
5B. MULTIPLE VEH CRASH Total Fatal Injury P.D.O. 9 6 151. Moving in opposite dir.
11 112. Both moving in same dir. 2 23a. One car parked
14 11 253b. One car stopped in traffic 4. Enter/Leave parked pos. 5a. Entering driveway/alley
2 1 35b. Leaving driveway/alley 5 1 66. All others
Totals 43 19 62
5C. PEDESTRIANCRASHES
All PedCrashes
Fatal Crashes Non-Fatal Injury Crashes
TotalAt
Intersection Non-
Junction TotalAt
IntersectionNon-
Junction1. Car go straight 1 1 12. Car turning right 3. Car turning left4. Car backing 1 1 1 5. All othersTotals 2 1 1 1 1
5D. ALL OTHER CRASHES Total Fatal Injury P.D.O.Coll-isionWith
Coll-isionWith
1. Other rd veh or railway train2. Fixed object 1 1 3. Other object or animal4. Overturning 5. Other noncollision 6. Other rd veh or railway train7. Fixed object 37 28 2 67 8. Other object or animal 8 2 10 9. Overturning 1 1 10. Other noncollision 1 1 11. Not statedTotals 4632 2 80
6. PEDESTRIAN ACTION BY AGE
Ages of Pedstrians Killed and InjuredPedestrians Killed Total 0 to 4 5 to 9 10 to 14 15 to 19 20 to 24 25 to 44 45 to 64 65 & older Not stated
1a. X-ing at intersect or X-walk 1b. X-ing not at intersection 1 1 2a. Walking in road with traffic 2b. Same against traffic 3. Standing in roadway 4. Push or work on veh in road 5. Other working in roadway 6. Playing in roadway 7. Other in roadway 8. Not in roadway 1 1 1 9. Not stated
11 2 1 Totals
7. AGE OF DRIVER All Crashes Fatal Injury 1. 14 & younger 2. 15 3. 16 6 3 4. 17 14 5 5. 18 10 4 6. 19 3 7. 20 6 3 8. 21 3 1 9. 22 to 24 13 6 10. 25 to 34 36 1 15 11. 35 to 44 27 14 12. 45 to 54 46 1 14 13. 55 to 64 31 11 14. 65 to 74 41 1 13 15. 75 & older 16 9 16. Not stated 10 1 Totals 262 3 99 8. SEX OF DRIVER Injury Fatal All Crashes
1. Male 152 57 2. Female 108 3 42 3. Not stated 2 Totals 262 3 99
9. RESIDENCE OF DRIVER All Crashes Fatal Injury
1. Local resident 223 2 86 2. In-state resident 14 5 3. Non resident 20 1 8 4. Not stated 5 0 Totals 262 3 99
10. CRASHES BY CONTRIBUTING FACTOR All InjuryFatal1. Speed too fast
4 1 1
7. Followed too closely 2 7
11 1 2
6. Improper overtaking5. Drove left of center4. Disregard traffic signal3. Passed stop sign2. Failed to yield 34 1 13
34 86
8. Made improper turn
Totals 193 5 76 11
1 7 3 1
1 1 1 1
21 3
14 6 6
12. Other 11. Mechanical defect10. Improper driving9. Had been drinking
12. ROAD SURFACECONDITION InjuryFatalAll
1. Dry 121 3 442. Wet 43 183. Snowy or icy 8 34. Other 5. Not statedTotals 172 3 65
13. LIGHT CONDITION InjuryFatalAll1. Daylight 126 2 462. Dawn or Dusk 7 1 13. Darkness 39 184. Not statedTotals 172 3 65
11. VEHICLE TYPE InjuryFatalAll1. Passenger car 253 2 962. Pass Car and trailer 3. Truck or truck tractor 2 1 14. Truck tractor with semi-trailer 5 15. Other truck combination 6. Farm tractor and/or equip. 7. Taxicab 8. Bus 9. School bus10. Motorcycle 1 111. Motor scooter or moped 12. Others and not stated 3Totals 264 3 99Special vehicles included above 13. Log trucks14. Emergency (incl. private) 115. Military vehicles 16. Other public vehicles 2 2
198 11 81 71 8 160 94 71 3 168 175 142 11 328 3. County and Local Roads 2 2 1 3 2 1 3 4 2 6 4. City Streets
5. Not Stated 384 22 144 128 10 282 199 122 9 330 343 250 19 612 Total--Rural Area
NOTE: THIS YEAR TO DATE represents only those crashes entered onto the database as of the date above. SAME PERIOD LAST YEAR represents all crashes including late reports. MAJOR INJURIES are incapacitating injuries. MINOR INJURIES are non-incapacitating evident injuries.
3. LOCATION Total
PropertyDamage
Nonfatal Injury Fatal Property
DamageNonfatal
InjuryFatalTotalPropertyDamage
Nonfatal Injury Fatal Total Killed Injured
Total On Roadway TotalOff Roadway Number Of Crashes Number Of Persons
1. Below 1,000 2. 1,000 to 2,500 3. 2,501 to 5,000 4. 5,001 to 10,000 5. 10,001 to 25,000 6. 25,001 to 50,000 7. 50,001 to 100,000 8. 100,001 to 200,000 9. City of Portland Only Total - Municipalities
2 3 1 1 2 2 1 3 3 1 1 5 3. County and Local Roads 408 5 65 34 3 102 399 261 2 662 464 295 5 764 4. City Streets
5. Not Stated Total--Urban Area 7361479 56 4 13959645171,054675 507 11 1,193 6. Interstate System 7. Other State Freeways 8. Other State Highways 424 5 211 208 389 189 195 35 22 13 6 326Total--Urban System 424 5 211 208 389 5 189 195 35 22 13 6 326
6. Interstate System 7. Other State Freeways 8. Other State Highways 278 8 106 164 159 6 50 103 119 2 56 61 11 184Total--Rural System 278 8 106 164 159 6 50 103 119 2 56 61 11 184
June 1, 2007
DESCHUTES COUNTY
232
At I
nter
sect
ion
Not
at I
nter
sect
ion
At
Inte
r. N
on -I
nter
.
DESCHUTES COUNTY 2006 OREGON CRASHES
4. AGE OF CASUALTY
Number of Persons Killed Number of Persons Injured Total Killed Pedestrians Pedalcyclist Total Injured Pedestrians Pedalcyclist
Total Total Total Total Total TotalMale Male Male Male Male MaleFemale Female Female Female Female Female1. 0 to 4 10 5 152. 5 to 9 2 11 8 19 23. 10 to 14 2 1 3 1 1 19 11 30 24. 15 to 19 1 1 3 1 116 74 190 4 4 25. 20 to 24 1 4 1 46 80 126 7 5 2 46. 25 to 34 3 8 99 96 195 6 4 2 2 1 1 57. 35 to 44 4 1 2 2 85 80 165 7 7 1 1 18. 45 to 54 2 2 4 1 1 95 62 157 3 3 1 1 29. 55 to 64 2 1 2 70 52 122 7 6 1 110. 65 to 74 1 34 20 54 111. 75 & older 1 1 1 14 23 37 2 1 1 112. Not-stated 6 4 10Totals 36 26 10 3 2 1 1 1 1,120 515 605 13 7 6 28 21 7
Directional Analysis - A crash consisting of a series of collisions, overturning, etc., is classified according to the first damage or injury producing event; includes on roadway and off roadway.5A. MULTIPLE VEH CRASH Total Fatal Injury P.D.O.
Junction1. Car go straight 10 2 2 8 2 62. Car turning right 3 1 1 2 1 13. Car turning left 1 1 14. Car backing5. All othersTotals 14 3 1 2 11 4 7
5D. ALL OTHER CRASHES Total Fatal Injury P.D.O.Coll-isionWith
Coll-isionWith
1. Other rd veh or railway train 19 19 2. Fixed object 20 11 31 3. Other object or animal 1 1 4. Overturning 3 2 5 5. Other noncollision6. Other rd veh or railway train 10 1 11 7. Fixed object 172 152 13 337 8. Other object or animal 49 10 1 60 9. Overturning 5 6 11 10. Other noncollision 1 1 2 11. Not statedTotals 251210 16 477
6. PEDESTRIAN ACTION BY AGE
Ages of Pedstrians Killed and InjuredPedestrians Killed Total 0 to 4 5 to 9 10 to 14 15 to 19 20 to 24 25 to 44 45 to 64 65 & older Not stated
1a. X-ing at intersect or X-walk 1 2 1 1 5 1b. X-ing not at intersection 3 1 1 5 1 2a. Walking in road with traffic 1 1 1 2b. Same against traffic 3. Standing in roadway 4. Push or work on veh in road 5. Other working in roadway 1 1 6. Playing in roadway 7. Other in roadway 8. Not in roadway 2 2 4 1 9. Not stated
1 5 6112 16 3 Totals
7. AGE OF DRIVER All Crashes Fatal Injury 1. 14 & YOUNGER 2 2 2. 15 10 2 3. 16 84 44 4. 17 115 62 5. 18 110 1 53 6. 19 111 1 58 7. 20 84 44 8. 21 74 3 35 9. 22 to 24 198 6 88 10. 25 to 34 535 8 237 11. 35 to 44 494 8 223 12. 45 to 54 529 4 225 13. 55 to 64 386 7 161 14. 65 to 74 163 1 66 15. 75 & older 112 3 41 16. Not stated 198 20 Totals 3,205 42 1,361 8. SEX OF DRIVER Injury Fatal All Crashes
1. Male 1,838 32 734 2. Female 1,329 10 617 3. Not stated 38 10 Totals 3,205 42 1,361
9. RESIDENCE OF DRIVER All Crashes Fatal Injury
1. Local resident 2,607 26 1,146 2. In-state resident 354 7 142 3. Non resident 139 8 56 4. Not stated 105 1 17 Totals 3,205 42 1,361
10. CRASHES BY CONTRIBUTING FACTOR All InjuryFatal1. Speed too fast
161 16 12 30 33
7. Followed too closely 362 1 3
1
35 36 65 81
6. Improper overtaking5. Drove left of center4. Disregard traffic signal3. Passed stop sign2. Failed to yield 415 1 194
198 12 473
8. Made improper turn
Totals 2,169 54 912 112
2 92 38 24
3
17 16
296 6
223 81 96
12. Other 11. Mechanical defect10. Improper driving9. Had been drinking
12. ROAD SURFACECONDITION InjuryFatalAll
1. Dry 1,273 29 5512. Wet 157 813. Snowy or icy 358 1 1244. Other 5. Not stated 17 1Totals 1,805 30 757
13. LIGHT CONDITION InjuryFatalAll1. Daylight 1,360 18 5732. Dawn or Dusk 57 2 243. Darkness 383 10 1584. Not stated 5 2Totals 1,805 30 757
11. VEHICLE TYPE InjuryFatalAll1. Passenger car 3,074 31 1,3022. Pass Car and trailer 41 103. Truck or truck tractor 9 24. Truck tractor with semi-trailer 59 5 185. Other truck combination 2 16. Farm tractor and/or equip. 17. Taxicab 1 18. Bus 3 19. School bus 11 310. Motorcycle 37 6 2711. Motor scooter or moped 2 212. Others and not stated 8 4Totals 3,248 42 1,371Special vehicles included above 13. Log trucks 114. Emergency (incl. private) 7 215. Military vehicles 16. Other public vehicles 20 5
14. MANNER OF COLLISION InjuryFatalAll
1. Head-on 43 8 192. Rear end 511 1 2323. Angle 618 2 2494. Sideswipe-meeting 41 115. Sideswipe-overtaking 60 166. Backed into 38 97. Other 3Totals 1,314 11 536
11. Count of vehicles, including properly parked vehicles.
Totals include participant records where gender was coded as "unknown".
10. Count of crashes. Crashes with multiple contributing circumstances are counted in all applicable categories.
MULTIPLE VEHICLE CRASHES
7 - 9. Tally of drivers by age, sex, residence & crash severity. Excludes occupants of properly & improperly parked vehicles.
233
Col
lisio
n in
volv
ing:
N
on-
coll.
N
on-
coll.
C
ollis
ion
invo
lvin
g:
Non
- co
ll.
Col
lisio
n in
volv
ing:
3C
. RU
RA
L 3A
. Inc
orpo
rate
d A
reas
3B
. UR
BA
N
SUMMARY OF MOTOR VEHICLE TRAFFIC CRASHES 2006 OREGON CRASHESForIn
256 13 46 72 8 126 72 77 4 153 118 149 12 279 3. County and Local Roads 21 3 2 5 23 8 31 26 10 36 4. City Streets
5. Not Stated 563 27 143 185 14 342 196 154 10 360 339 339 24 702 Total--Rural Area
NOTE: THIS YEAR TO DATE represents only those crashes entered onto the database as of the date above. SAME PERIOD LAST YEAR represents all crashes including late reports. MAJOR INJURIES are incapacitating injuries. MINOR INJURIES are non-incapacitating evident injuries.
3. LOCATION Total
PropertyDamage
Nonfatal Injury Fatal Property
DamageNonfatal
InjuryFatalTotalPropertyDamage
Nonfatal Injury Fatal Total Killed Injured
Total On Roadway TotalOff Roadway Number Of Crashes Number Of Persons
1. Below 1,000 2. 1,000 to 2,500 3. 2,501 to 5,000 4. 5,001 to 10,000 5. 10,001 to 25,000 6. 25,001 to 50,000 7. 50,001 to 100,000 8. 100,001 to 200,000 9. City of Portland Only Total - Municipalities
1 1 1 1
2
17 27 78
387
510 2
2 15 9 18
42 36 175 210
228 280
1 13 14 8 15 23
36 29 65 1 164 197 362
1 209 255 465
1 2 3 1 3 4 6 7 13
1 11 13 25
1 19 25 45
3 18 71
267 2
359 2
108 3 14 14 1 29 36 45 2 83 50 59 3 112 1. Primary State Highways 70 1 2 3 49 42 91 50 44 94 2. Secondary State Highways 19 1 4 5 7 7 14 8 11 19 3. County and Local Roads
231 1 15 10 1 26 158 142 300 173 152 1 326 4. City Streets 5. Not Stated Total--Urban Area 428431 30 2 632502362488281 266 4 551 6. Interstate System 68 2 34 32 40 1 21 18 28 1 13 14 2 637. Other State Freeways 8. Other State Highways 138 1 69 68 134 66 67 4 3 1 1 115Total--Urban System 206 3 103 100 174 2 87 85 32 1 16 15 3 178
6. Interstate System 154 1 64 89 59 1 18 40 95 46 49 1 867. Other State Freeways 8. Other State Highways 233 11 116 106 117 5 51 61 116 6 65 45 13 200Total--Rural System 387 12 180 195 176 6 69 101 211 6 111 94 14 286
June 1, 2007
DOUGLAS COUNTY
234
At I
nter
sect
ion
Not
at I
nter
sect
ion
At
Inte
r. N
on -I
nter
.
DOUGLAS COUNTY 2006 OREGON CRASHES
4. AGE OF CASUALTY
Number of Persons Killed Number of Persons Injured Total Killed Pedestrians Pedalcyclist Total Injured Pedestrians Pedalcyclist
Total Total Total Total Total TotalMale Male Male Male Male MaleFemale Female Female Female Female Female1. 0 to 4 8 15 23 1 1 2. 5 to 9 2 20 21 41 23. 10 to 14 5 19 22 41 54. 15 to 19 1 2 1 90 63 153 5 2 3 25. 20 to 24 1 1 1 62 54 116 5 4 1 16. 25 to 34 1 1 1 69 66 135 2 2 17. 35 to 44 2 2 2 69 52 121 4 2 2 28. 45 to 54 3 1 3 83 72 155 5 4 1 1 1 19. 55 to 64 2 1 1 60 38 98 4 3 1 1 1 10. 65 to 74 32 28 60 2 2 11. 75 & older 1 21 23 44 3 1 2 112. Not-stated 1 3 1 4 1Totals 31 21 10 2 2 991 455 536 10 6 4 16 16
Directional Analysis - A crash consisting of a series of collisions, overturning, etc., is classified according to the first damage or injury producing event; includes on roadway and off roadway.5A. MULTIPLE VEH CRASH Total Fatal Injury P.D.O.
5B. MULTIPLE VEH CRASH Total Fatal Injury P.D.O. 22 36 6 641. Moving in opposite dir. 84 40 1 1252. Both moving in same dir. 14 6 203a. One car parked 76 95 1713b. One car stopped in traffic
Junction1. Car go straight 8 2 2 6 2 42. Car turning right 1 1 13. Car turning left 1 1 14. Car backing5. All others 1 1 1Totals 11 2 2 9 4 5
5D. ALL OTHER CRASHES Total Fatal Injury P.D.O.Coll-isionWith
Coll-isionWith
1. Other rd veh or railway train 13 13 2. Fixed object 6 5 11 3. Other object or animal 1 1 4. Overturning 1 4 5 5. Other noncollision6. Other rd veh or railway train 3 3 7. Fixed object 133 176 14 323 8. Other object or animal 42 11 1 54 9. Overturning 16 29 3 48 10. Other noncollision 2 2 11. Not statedTotals 201241 18 460
6. PEDESTRIAN ACTION BY AGE
Ages of Pedstrians Killed and InjuredPedestrians Killed Total 0 to 4 5 to 9 10 to 14 15 to 19 20 to 24 25 to 44 45 to 64 65 & older Not stated
1a. X-ing at intersect or X-walk 2 2 4 1b. X-ing not at intersection 3 1 1 5 1 2a. Walking in road with traffic 2b. Same against traffic 3. Standing in roadway 4. Push or work on veh in road 5. Other working in roadway 6. Playing in roadway 7. Other in roadway 2 2 1 8. Not in roadway 1 1 9. Not stated
7 311 12 2 Totals
7. AGE OF DRIVER All Crashes Fatal Injury 1. 14 & YOUNGER 2 1 2. 15 4 3. 16 42 2 20 4. 17 71 2 40 5. 18 91 1 53 6. 19 58 1 30 7. 20 51 30 8. 21 49 1 28 9. 22 to 24 130 4 57 10. 25 to 34 269 5 143 11. 35 to 44 292 7 152 12. 45 to 54 339 6 174 13. 55 to 64 262 4 133 14. 65 to 74 177 3 74 15. 75 & older 129 3 59 16. Not stated 116 10 Totals 2,082 39 1,004 8. SEX OF DRIVER Injury Fatal All Crashes
1. Male 1,176 27 537 2. Female 879 12 461 3. Not stated 27 6 Totals 2,082 39 1,004
9. RESIDENCE OF DRIVER All Crashes Fatal Injury
1. Local resident 1,582 28 801 2. In-state resident 321 10 145 3. Non resident 117 1 49 4. Not stated 62 9 Totals 2,082 39 1,004
10. CRASHES BY CONTRIBUTING FACTOR All InjuryFatal1. Speed too fast
111 7
22 14 12
7. Followed too closely 193 2 6
23 45 32 17
6. Improper overtaking5. Drove left of center4. Disregard traffic signal3. Passed stop sign2. Failed to yield 252 1 123
159 11 292
8. Made improper turn
Totals 1,400 47 677 103
15 75 20 16
10 14
3
252 25
176 42 51
12. Other 11. Mechanical defect10. Improper driving9. Had been drinking
12. ROAD SURFACECONDITION InjuryFatalAll
1. Dry 843 17 4042. Wet 348 9 1853. Snowy or icy 37 134. Other 5. Not stated 25 2 3Totals 1,253 28 605
13. LIGHT CONDITION InjuryFatalAll1. Daylight 888 15 4362. Dawn or Dusk 83 3 383. Darkness 280 10 1314. Not stated 2Totals 1,253 28 605
11. VEHICLE TYPE InjuryFatalAll1. Passenger car 1,946 33 9352. Pass Car and trailer 31 123. Truck or truck tractor 9 44. Truck tractor with semi-trailer 81 2 345. Other truck combination 5 26. Farm tractor and/or equip. 2 1 17. Taxicab 18. Bus 2 19. School bus 2 210. Motorcycle 22 2 1911. Motor scooter or moped 2 112. Others and not stated 15 6Totals 2,118 38 1,017Special vehicles included above 13. Log trucks 4 1 314. Emergency (incl. private) 7 315. Military vehicles 16. Other public vehicles 16 9
14. MANNER OF COLLISION InjuryFatalAll
1. Head-on 24 3 152. Rear end 305 1663. Angle 329 3 1474. Sideswipe-meeting 22 2 105. Sideswipe-overtaking 69 146. Backed into 21 27. Other 12 1Totals 782 8 355
11. Count of vehicles, including properly parked vehicles.
Totals include participant records where gender was coded as "unknown".
10. Count of crashes. Crashes with multiple contributing circumstances are counted in all applicable categories.
MULTIPLE VEHICLE CRASHES
7 - 9. Tally of drivers by age, sex, residence & crash severity. Excludes occupants of properly & improperly parked vehicles.
235
Col
lisio
n in
volv
ing:
N
on-
coll.
N
on-
coll.
C
ollis
ion
invo
lvin
g:
Non
- co
ll.
Col
lisio
n in
volv
ing:
3C
. RU
RA
L 3A
. Inc
orpo
rate
d A
reas
3B
. UR
BA
N
SUMMARY OF MOTOR VEHICLE TRAFFIC CRASHES 2006 OREGON CRASHESForIn
2 2 1 1 3 3 3. County and Local Roads 1 1 1 1 4. City Streets
5. Not Stated 29 1 9 17 1 27 8 4 12 17 21 1 39 Total--Rural Area
NOTE: THIS YEAR TO DATE represents only those crashes entered onto the database as of the date above. SAME PERIOD LAST YEAR represents all crashes including late reports. MAJOR INJURIES are incapacitating injuries. MINOR INJURIES are non-incapacitating evident injuries.
3. LOCATION Total
PropertyDamage
Nonfatal Injury Fatal Property
DamageNonfatal
InjuryFatalTotalPropertyDamage
Nonfatal Injury Fatal Total Killed Injured
Total On Roadway TotalOff Roadway Number Of Crashes Number Of Persons
1. Below 1,000 2. 1,000 to 2,500 3. 2,501 to 5,000 4. 5,001 to 10,000 5. 10,001 to 25,000 6. 25,001 to 50,000 7. 50,001 to 100,000 8. 100,001 to 200,000 9. City of Portland Only Total - Municipalities
3 1 2 1 2 2 1 1
3 1 2 2 2 1 1 1
1. Primary State Highways 2. Secondary State Highways 3. County and Local Roads 4. City Streets 5. Not Stated Total--Urban Area 6. Interstate System 7. Other State Freeways 8. Other State Highways Total--Urban System
6. Interstate System 20 11 9 6 2 4 14 9 5 177. Other State Freeways 8. Other State Highways 15 1 10 4 4 2 2 11 1 8 2 1 12Total--Rural System 35 1 21 13 10 4 6 25 1 17 7 1 29
June 1, 2007
GILLIAM COUNTY
236
At I
nter
sect
ion
Not
at I
nter
sect
ion
At
Inte
r. N
on -I
nter
.
GILLIAM COUNTY 2006 OREGON CRASHES
4. AGE OF CASUALTY
Number of Persons Killed Number of Persons Injured Total Killed Pedestrians Pedalcyclist Total Injured Pedestrians Pedalcyclist
Total Total Total Total Total TotalMale Male Male Male Male MaleFemale Female Female Female Female Female1. 0 to 4 2. 5 to 9 3. 10 to 14 4. 15 to 19 3 3 65. 20 to 24 1 2 36. 25 to 34 2 3 57. 35 to 44 1 1 28. 45 to 54 3 1 49. 55 to 64 2 4 6 1 1 10. 65 to 74 1 111. 75 & older 1 1 212. Not-stated Totals 1 1 29 15 14
Directional Analysis - A crash consisting of a series of collisions, overturning, etc., is classified according to the first damage or injury producing event; includes on roadway and off roadway.5A. MULTIPLE VEH CRASH Total Fatal Injury P.D.O.
1. Entering at angle 2a. Same dir.- both straight 2b. Same-1 turn, 1 straight 2c. Same-one stopped 2d. Same-all others 3a. Opposite dir.- both straight 3b. Opposite-1 turn, 1 straight 3c. Opposite-all others 1 1 4. Not stated Totals 1 1
5B. MULTIPLE VEH CRASH Total Fatal Injury P.D.O. 1 1 21. Moving in opposite dir. 3 2 52. Both moving in same dir.
1 13a. One car parked 3b. One car stopped in traffic 4. Enter/Leave parked pos. 5a. Entering driveway/alley
Junction1. Car go straight2. Car turning right3. Car turning left 4. Car backing 5. All othersTotals
5D. ALL OTHER CRASHES Total Fatal Injury P.D.O.Coll-isionWith
Coll-isionWith
1. Other rd veh or railway train2. Fixed object 3. Other object or animal 4. Overturning 5. Other noncollision 6. Other rd veh or railway train 7. Fixed object 8 9 17 8. Other object or animal 2 1 3 9. Overturning 1 7 1 9 10. Other noncollision11. Not statedTotals 1117 1 29
6. PEDESTRIAN ACTION BY AGE
Ages of Pedstrians Killed and InjuredPedestrians Killed Total 0 to 4 5 to 9 10 to 14 15 to 19 20 to 24 25 to 44 45 to 64 65 & older Not stated
1a. X-ing at intersect or X-walk 1b. X-ing not at intersection 2a. Walking in road with traffic 2b. Same against traffic 3. Standing in roadway 4. Push or work on veh in road 5. Other working in roadway 6. Playing in roadway 7. Other in roadway 8. Not in roadway 9. Not stated Totals
7. AGE OF DRIVER All Crashes Fatal Injury 1. 14 & younger 2. 15 3. 16 2 4. 17 1 1 5. 18 3 2 6. 19 7. 20 1 8. 21 3 2 9. 22 to 24 2 1 10. 25 to 34 9 5 11. 35 to 44 3 1 12. 45 to 54 9 4 13. 55 to 64 13 1 6 14. 65 to 74 1 1 15. 75 & older 1 1 16. Not stated 2 1 Totals 50 1 25 8. SEX OF DRIVER Injury Fatal All Crashes
1. Male 34 1 17 2. Female 15 8 3. Not stated 1 Totals 50 1 25
9. RESIDENCE OF DRIVER All Crashes Fatal Injury
1. Local resident 16 1 6 2. In-state resident 17 9 3. Non resident 15 9 4. Not stated 2 1 Totals 50 1 25
10. CRASHES BY CONTRIBUTING FACTOR All InjuryFatal1. Speed too fast
1
7. Followed too closely 1
26. Improper overtaking5. Drove left of center4. Disregard traffic signal3. Passed stop sign2. Failed to yield 1
14 19
8. Made improper turn
Totals 38 21 5 1
11 1 3
12. Other 11. Mechanical defect10. Improper driving9. Had been drinking
12. ROAD SURFACECONDITION InjuryFatalAll
1. Dry 25 1 132. Wet 6 23. Snowy or icy 8 64. Other 5. Not statedTotals 39 1 21
13. LIGHT CONDITION InjuryFatalAll1. Daylight 26 1 132. Dawn or Dusk 23. Darkness 11 84. Not statedTotals 39 1 21
11. VEHICLE TYPE InjuryFatalAll1. Passenger car 40 1 212. Pass Car and trailer 1 13. Truck or truck tractor 4. Truck tractor with semi-trailer 9 35. Other truck combination 16. Farm tractor and/or equip. 7. Taxicab 8. Bus 9. School bus10. Motorcycle 1 111. Motor scooter or moped 12. Others and not stated Totals 52 1 26Special vehicles included above 13. Log trucks14. Emergency (incl. private) 15. Military vehicles 16. Other public vehicles 2 1
14. MANNER OF COLLISION InjuryFatalAll
1. Head-on 1 12. Rear end 2 13. Angle4. Sideswipe-meeting 15. Sideswipe-overtaking 4 26. Backed into 27. OtherTotals 10 4
11. Count of vehicles, including properly parked vehicles.
Totals include participant records where gender was coded as "unknown".
10. Count of crashes. Crashes with multiple contributing circumstances are counted in all applicable categories.
MULTIPLE VEHICLE CRASHES
7 - 9. Tally of drivers by age, sex, residence & crash severity. Excludes occupants of properly & improperly parked vehicles.
237
Col
lisio
n in
volv
ing:
N
on-
coll.
N
on-
coll.
C
ollis
ion
invo
lvin
g:
Non
- co
ll.
Col
lisio
n in
volv
ing:
3C
. RU
RA
L 3A
. Inc
orpo
rate
d A
reas
3B
. UR
BA
N
SUMMARY OF MOTOR VEHICLE TRAFFIC CRASHES 2006 OREGON CRASHESForIn
47 2 13 17 1 31 8 16 1 25 21 33 2 56 1. Primary State Highways 6 1 1 1 1 2 2 1 3 2. Secondary State Highways 6 5 4 9 1 1 2 6 5 11 3. County and Local Roads 1 1 1 1 1 1 1 2 4. City Streets
5. Not Stated 60 2 19 22 1 42 11 18 1 30 30 40 2 72 Total--Rural Area
NOTE: THIS YEAR TO DATE represents only those crashes entered onto the database as of the date above. SAME PERIOD LAST YEAR represents all crashes including late reports. MAJOR INJURIES are incapacitating injuries. MINOR INJURIES are non-incapacitating evident injuries.
3. LOCATION Total
PropertyDamage
Nonfatal Injury Fatal Property
DamageNonfatal
InjuryFatalTotalPropertyDamage
Nonfatal Injury Fatal Total Killed Injured
Total On Roadway TotalOff Roadway Number Of Crashes Number Of Persons
1. Below 1,000 2. 1,000 to 2,500 3. 2,501 to 5,000 4. 5,001 to 10,000 5. 10,001 to 25,000 6. 25,001 to 50,000 7. 50,001 to 100,000 8. 100,001 to 200,000 9. City of Portland Only Total - Municipalities
2 1 1 3 2 1 1 8
10
6 2
7 3
3 2 5
4 3 7
3 3
3 3
6
9
1. Primary State Highways 2. Secondary State Highways 3. County and Local Roads 4. City Streets 5. Not Stated Total--Urban Area 6. Interstate System 7. Other State Freeways 8. Other State Highways Total--Urban System
6. Interstate System 7. Other State Freeways 8. Other State Highways 59 2 34 23 27 1 17 9 32 1 17 14 2 53Total--Rural System 59 2 34 23 27 1 17 9 32 1 17 14 2 53
June 1, 2007
GRANT COUNTY
238
At I
nter
sect
ion
Not
at I
nter
sect
ion
At
Inte
r. N
on -I
nter
.
GRANT COUNTY 2006 OREGON CRASHES
4. AGE OF CASUALTY
Number of Persons Killed Number of Persons Injured Total Killed Pedestrians Pedalcyclist Total Injured Pedestrians Pedalcyclist
Total Total Total Total Total TotalMale Male Male Male Male MaleFemale Female Female Female Female Female1. 0 to 4 1 12. 5 to 9 3. 10 to 14 4. 15 to 19 9 7 16 1 15. 20 to 24 2 1 36. 25 to 34 4 1 5 1 1 7. 35 to 44 4 1 58. 45 to 54 3 6 99. 55 to 64 5 8 1310. 65 to 74 1 3 411. 75 & older 2 1 312. Not-stated 1 1Totals 2 1 1 60 29 31
Directional Analysis - A crash consisting of a series of collisions, overturning, etc., is classified according to the first damage or injury producing event; includes on roadway and off roadway.5A. MULTIPLE VEH CRASH Total Fatal Injury P.D.O.
1. Entering at angle 1 1 2 2a. Same dir.- both straight 2b. Same-1 turn, 1 straight 1 1 2c. Same-one stopped 1 1 2d. Same-all others 3a. Opposite dir.- both straight 3b. Opposite-1 turn, 1 straight 3c. Opposite-all others 4. Not stated Totals 1 3 4
5B. MULTIPLE VEH CRASH Total Fatal Injury P.D.O. 1 3 1 51. Moving in opposite dir.
2 22. Both moving in same dir. 1 13a. One car parked
1 3 43b. One car stopped in traffic 1 1 24. Enter/Leave parked pos.
Junction1. Car go straight2. Car turning right3. Car turning left 4. Car backing 5. All othersTotals
5D. ALL OTHER CRASHES Total Fatal Injury P.D.O.Coll-isionWith
Coll-isionWith
1. Other rd veh or railway train2. Fixed object 3. Other object or animal 4. Overturning 5. Other noncollision 6. Other rd veh or railway train 7. Fixed object 14 10 1 25 8. Other object or animal 7 5 12 9. Overturning 5 12 17 10. Other noncollision11. Not statedTotals 2627 1 54
6. PEDESTRIAN ACTION BY AGE
Ages of Pedstrians Killed and InjuredPedestrians Killed Total 0 to 4 5 to 9 10 to 14 15 to 19 20 to 24 25 to 44 45 to 64 65 & older Not stated
1a. X-ing at intersect or X-walk 1b. X-ing not at intersection 2a. Walking in road with traffic 2b. Same against traffic 3. Standing in roadway 4. Push or work on veh in road 5. Other working in roadway 6. Playing in roadway 7. Other in roadway 8. Not in roadway 9. Not stated Totals
7. AGE OF DRIVER All Crashes Fatal Injury 1. 14 & younger 2. 15 3. 16 4 3 4. 17 6 4 5. 18 7 1 5 6. 19 1 7. 20 8. 21 2 1 9. 22 to 24 1 1 10. 25 to 34 8 1 5 11. 35 to 44 13 7 12. 45 to 54 15 1 9 13. 55 to 64 22 1 13 14. 65 to 74 9 5 15. 75 & older 5 3 16. Not stated 1 Totals 94 4 56 8. SEX OF DRIVER Injury Fatal All Crashes
1. Male 56 3 29 2. Female 38 1 27 3. Not stated Totals 94 4 56
9. RESIDENCE OF DRIVER All Crashes Fatal Injury
1. Local resident 56 2 33 2. In-state resident 22 1 15 3. Non resident 15 1 8 4. Not stated 1 0 Totals 94 4 56
10. CRASHES BY CONTRIBUTING FACTOR All InjuryFatal1. Speed too fast
3 3 1
7. Followed too closely 4 3 2
6. Improper overtaking5. Drove left of center4. Disregard traffic signal3. Passed stop sign2. Failed to yield 4 2
19 2 36
8. Made improper turn
Totals 70 3 39 8
3 1
15 1 1 4
12. Other 11. Mechanical defect10. Improper driving9. Had been drinking
12. ROAD SURFACECONDITION InjuryFatalAll
1. Dry 42 1 262. Wet 13 93. Snowy or icy 15 1 44. Other 5. Not stated 2 1Totals 72 2 40
13. LIGHT CONDITION InjuryFatalAll1. Daylight 44 1 302. Dawn or Dusk 43. Darkness 24 1 104. Not statedTotals 72 2 40
11. VEHICLE TYPE InjuryFatalAll1. Passenger car 83 4 482. Pass Car and trailer 13. Truck or truck tractor 14. Truck tractor with semi-trailer 1 15. Other truck combination 6. Farm tractor and/or equip. 7. Taxicab 8. Bus9. School bus 110. Motorcycle 7 711. Motor scooter or moped 12. Others and not stated 1 1Totals 95 4 57Special vehicles included above 13. Log trucks 1 114. Emergency (incl. private) 15. Military vehicles 16. Other public vehicles 1
14. MANNER OF COLLISION InjuryFatalAll
1. Head-on 2 1 12. Rear end 7 63. Angle 4 34. Sideswipe-meeting 3 25. Sideswipe-overtaking 6. Backed into 7. Other 2 1Totals 18 1 13
11. Count of vehicles, including properly parked vehicles.
Totals include participant records where gender was coded as "unknown".
10. Count of crashes. Crashes with multiple contributing circumstances are counted in all applicable categories.
MULTIPLE VEHICLE CRASHES
7 - 9. Tally of drivers by age, sex, residence & crash severity. Excludes occupants of properly & improperly parked vehicles.
239
Col
lisio
n in
volv
ing:
N
on-
coll.
N
on-
coll.
C
ollis
ion
invo
lvin
g:
Non
- co
ll.
Col
lisio
n in
volv
ing:
3C
. RU
RA
L 3A
. Inc
orpo
rate
d A
reas
3B
. UR
BA
N
SUMMARY OF MOTOR VEHICLE TRAFFIC CRASHES 2006 OREGON CRASHESForIn
NOTE: THIS YEAR TO DATE represents only those crashes entered onto the database as of the date above. SAME PERIOD LAST YEAR represents all crashes including late reports. MAJOR INJURIES are incapacitating injuries. MINOR INJURIES are non-incapacitating evident injuries.
3. LOCATION Total
PropertyDamage
Nonfatal Injury Fatal Property
DamageNonfatal
InjuryFatalTotalPropertyDamage
Nonfatal Injury Fatal Total Killed Injured
Total On Roadway TotalOff Roadway Number Of Crashes Number Of Persons
1. Below 1,000 2. 1,000 to 2,500 3. 2,501 to 5,000 4. 5,001 to 10,000 5. 10,001 to 25,000 6. 25,001 to 50,000 7. 50,001 to 100,000 8. 100,001 to 200,000 9. City of Portland Only Total - Municipalities
3 15
18
2 1 7 8
9 9
2 1 3 6 7 13
8 8 16
1 1 2
1 1 2
2 9
11
1. Primary State Highways 2. Secondary State Highways 3. County and Local Roads 4. City Streets 5. Not Stated Total--Urban Area 6. Interstate System 7. Other State Freeways 8. Other State Highways Total--Urban System
6. Interstate System 7. Other State Freeways 8. Other State Highways 67 1 41 25 28 1 14 13 39 27 12 1 54Total--Rural System 67 1 41 25 28 1 14 13 39 27 12 1 54
June 1, 2007
HARNEY COUNTY
240
At I
nter
sect
ion
Not
at I
nter
sect
ion
At
Inte
r. N
on -I
nter
.
HARNEY COUNTY 2006 OREGON CRASHES
4. AGE OF CASUALTY
Number of Persons Killed Number of Persons Injured Total Killed Pedestrians Pedalcyclist Total Injured Pedestrians Pedalcyclist
Total Total Total Total Total TotalMale Male Male Male Male MaleFemale Female Female Female Female Female1. 0 to 4 2. 5 to 9 1 13. 10 to 14 1 14. 15 to 19 7 6 13 1 1 5. 20 to 24 3 6 96. 25 to 34 2 7 97. 35 to 44 3 5 88. 45 to 54 5 4 9 1 1 9. 55 to 64 6 2 810. 65 to 74 4 3 711. 75 & older 2 3 512. Not-stated 1 1Totals 2 2 71 36 35
Directional Analysis - A crash consisting of a series of collisions, overturning, etc., is classified according to the first damage or injury producing event; includes on roadway and off roadway.5A. MULTIPLE VEH CRASH Total Fatal Injury P.D.O.
1. Entering at angle 5 5 10 2a. Same dir.- both straight 2b. Same-1 turn, 1 straight 2c. Same-one stopped 1 1 2 2d. Same-all others 3a. Opposite dir.- both straight 3b. Opposite-1 turn, 1 straight 1 1 3c. Opposite-all others 4. Not stated Totals 6 7 13
5B. MULTIPLE VEH CRASH Total Fatal Injury P.D.O. 3 2 51. Moving in opposite dir. 3 1 42. Both moving in same dir.
3a. One car parked 1 3 43b. One car stopped in traffic 1 14. Enter/Leave parked pos.
Junction1. Car go straight2. Car turning right3. Car turning left 4. Car backing 5. All othersTotals
5D. ALL OTHER CRASHES Total Fatal Injury P.D.O.Coll-isionWith
Coll-isionWith
1. Other rd veh or railway train2. Fixed object 2 2 3. Other object or animal4. Overturning 5. Other noncollision 6. Other rd veh or railway train7. Fixed object 6 12 1 19 8. Other object or animal 4 3 7 9. Overturning 8 17 1 26 10. Other noncollision 2 2 11. Not statedTotals 1836 2 56
6. PEDESTRIAN ACTION BY AGE
Ages of Pedstrians Killed and InjuredPedestrians Killed Total 0 to 4 5 to 9 10 to 14 15 to 19 20 to 24 25 to 44 45 to 64 65 & older Not stated
1a. X-ing at intersect or X-walk 1b. X-ing not at intersection 2a. Walking in road with traffic 2b. Same against traffic 3. Standing in roadway 4. Push or work on veh in road 5. Other working in roadway 6. Playing in roadway 7. Other in roadway 8. Not in roadway 9. Not stated Totals
7. AGE OF DRIVER All Crashes Fatal Injury 1. 14 & younger 2. 15 3. 16 2 1 4. 17 6 1 2 5. 18 4 4 6. 19 4 2 7. 20 3 3 8. 21 1 9. 22 to 24 10 6 10. 25 to 34 14 10 11. 35 to 44 14 7 12. 45 to 54 16 1 9 13. 55 to 64 19 8 14. 65 to 74 9 6 15. 75 & older 6 4 16. Not stated 2 Totals 110 2 62 8. SEX OF DRIVER Injury Fatal All Crashes
1. Male 71 2 36 2. Female 38 26 3. Not stated 1 Totals 110 2 62
9. RESIDENCE OF DRIVER All Crashes Fatal Injury
1. Local resident 60 34 2. In-state resident 26 15 3. Non resident 23 2 13 4. Not stated 1 0 Totals 110 2 62
10. CRASHES BY CONTRIBUTING FACTOR All InjuryFatal1. Speed too fast
5 1 1 2
7. Followed too closely 6 2 3 2
6. Improper overtaking5. Drove left of center4. Disregard traffic signal3. Passed stop sign2. Failed to yield 8 4
28 1 41
8. Made improper turn
Totals 90 3 53 8
2 2
1 1
16 1 7 3 1
12. Other 11. Mechanical defect10. Improper driving9. Had been drinking
12. ROAD SURFACECONDITION InjuryFatalAll
1. Dry 55 2 332. Wet 8 63. Snowy or icy 20 104. Other 5. Not stated 1Totals 84 2 49
13. LIGHT CONDITION InjuryFatalAll1. Daylight 63 2 372. Dawn or Dusk 3 23. Darkness 18 104. Not statedTotals 84 2 49
11. VEHICLE TYPE InjuryFatalAll1. Passenger car 98 2 542. Pass Car and trailer 4 23. Truck or truck tractor 4. Truck tractor with semi-trailer 6 35. Other truck combination 6. Farm tractor and/or equip. 7. Taxicab 8. Bus 9. School bus10. Motorcycle 6 311. Motor scooter or moped 12. Others and not stated Totals 114 2 62Special vehicles included above 13. Log trucks14. Emergency (incl. private) 15. Military vehicles 16. Other public vehicles 2 2
14. MANNER OF COLLISION InjuryFatalAll
1. Head-on 2 22. Rear end 8 53. Angle 13 64. Sideswipe-meeting 25. Sideswipe-overtaking 6. Backed into 7. Other 3Totals 28 13
11. Count of vehicles, including properly parked vehicles.
Totals include participant records where gender was coded as "unknown".
10. Count of crashes. Crashes with multiple contributing circumstances are counted in all applicable categories.
MULTIPLE VEHICLE CRASHES
7 - 9. Tally of drivers by age, sex, residence & crash severity. Excludes occupants of properly & improperly parked vehicles.
241
Col
lisio
n in
volv
ing:
N
on-
coll.
N
on-
coll.
C
ollis
ion
invo
lvin
g:
Non
- co
ll.
Col
lisio
n in
volv
ing:
3C
. RU
RA
L 3A
. Inc
orpo
rate
d A
reas
3B
. UR
BA
N
SUMMARY OF MOTOR VEHICLE TRAFFIC CRASHES 2006 OREGON CRASHESForIn
NOTE: THIS YEAR TO DATE represents only those crashes entered onto the database as of the date above. SAME PERIOD LAST YEAR represents all crashes including late reports. MAJOR INJURIES are incapacitating injuries. MINOR INJURIES are non-incapacitating evident injuries.
3. LOCATION Total
PropertyDamage
Nonfatal Injury Fatal Property
DamageNonfatal
InjuryFatalTotalPropertyDamage
Nonfatal Injury Fatal Total Killed Injured
Total On Roadway TotalOff Roadway Number Of Crashes Number Of Persons
1. Below 1,000 2. 1,000 to 2,500 3. 2,501 to 5,000 4. 5,001 to 10,000 5. 10,001 to 25,000 6. 25,001 to 50,000 7. 50,001 to 100,000 8. 100,001 to 200,000 9. City of Portland Only Total - Municipalities
3. County and Local Roads 6 7 7 16 6 22 23 6 29 4. City Streets
5. Not Stated Total--Urban Area 2011 2 1341175852 19 71 6. Interstate System 6 2 4 1 1 5 2 3 37. Other State Freeways 8. Other State Highways 36 11 25 35 11 24 1 1 11Total--Urban System 42 13 29 36 11 25 6 2 4 14
6. Interstate System 69 2 20 47 29 3 26 40 2 17 21 2 257. Other State Freeways 8. Other State Highways 75 1 34 40 44 1 20 23 31 14 17 1 56Total--Rural System 144 3 54 87 73 1 23 49 71 2 31 38 3 81
June 1, 2007
HOOD RIVER COUNTY
242
At I
nter
sect
ion
Not
at I
nter
sect
ion
At
Inte
r. N
on -I
nter
.
HOOD RIVER COUNTY 2006 OREGON CRASHES
4. AGE OF CASUALTY
Number of Persons Killed Number of Persons Injured Total Killed Pedestrians Pedalcyclist Total Injured Pedestrians Pedalcyclist
Total Total Total Total Total TotalMale Male Male Male Male MaleFemale Female Female Female Female Female1. 0 to 4 1 1 2 1 12. 5 to 9 2 3 53. 10 to 14 1 2 2 4 14. 15 to 19 11 6 175. 20 to 24 10 9 19 1 1 6. 25 to 34 10 14 24 1 1 7. 35 to 44 11 12 23 1 1 8. 45 to 54 1 1 7 15 229. 55 to 64 9 6 1510. 65 to 74 3 2 511. 75 & older 3 3 1 1 12. Not-stated Totals 5 4 1 139 73 66 1 1 1 1
Directional Analysis - A crash consisting of a series of collisions, overturning, etc., is classified according to the first damage or injury producing event; includes on roadway and off roadway.5A. MULTIPLE VEH CRASH Total Fatal Injury P.D.O.
5B. MULTIPLE VEH CRASH Total Fatal Injury P.D.O. 5 1 1 71. Moving in opposite dir.
23 2 252. Both moving in same dir. 5 1 63a. One car parked
23 19 423b. One car stopped in traffic 1 14. Enter/Leave parked pos. 1 15a. Entering driveway/alley
10 2 125b. Leaving driveway/alley 6 1 76. All others
Totals 74 26 1 101
5C. PEDESTRIANCRASHES
All PedCrashes
Fatal Crashes Non-Fatal Injury Crashes
TotalAt
Intersection Non-
Junction TotalAt
IntersectionNon-
Junction1. Car go straight 1 1 12. Car turning right3. Car turning left 4. Car backing 5. All othersTotals 1 1 1
5D. ALL OTHER CRASHES Total Fatal Injury P.D.O.Coll-isionWith
Coll-isionWith
1. Other rd veh or railway train 1 1 2. Fixed object3. Other object or animal 4. Overturning 5. Other noncollision6. Other rd veh or railway train 1 1 7. Fixed object 54 44 3 101 8. Other object or animal 7 3 10 9. Overturning 4 9 1 14 10. Other noncollision 1 1 2 11. Not statedTotals 6758 4 129
6. PEDESTRIAN ACTION BY AGE
Ages of Pedstrians Killed and InjuredPedestrians Killed Total 0 to 4 5 to 9 10 to 14 15 to 19 20 to 24 25 to 44 45 to 64 65 & older Not stated
1a. X-ing at intersect or X-walk 1b. X-ing not at intersection 1 1 2a. Walking in road with traffic 2b. Same against traffic 3. Standing in roadway 4. Push or work on veh in road 5. Other working in roadway 6. Playing in roadway 7. Other in roadway 8. Not in roadway 9. Not stated
1 1 Totals
7. AGE OF DRIVER All Crashes Fatal Injury 1. 14 & younger 2. 15 3. 16 10 6 4. 17 18 6 5. 18 26 6 6. 19 9 4 7. 20 10 6 8. 21 13 7 9. 22 to 24 24 2 11 10. 25 to 34 66 3 27 11. 35 to 44 58 24 12. 45 to 54 75 20 13. 55 to 64 52 17 14. 65 to 74 22 1 10 15. 75 & older 14 5 16. Not stated 31 1 Totals 428 6 150 8. SEX OF DRIVER Injury Fatal All Crashes
1. Male 253 4 86 2. Female 171 2 64 3. Not stated 4 Totals 428 6 150
9. RESIDENCE OF DRIVER All Crashes Fatal Injury
1. Local resident 283 5 119 2. In-state resident 69 18 3. Non resident 68 1 13 4. Not stated 8 0 Totals 428 6 150
10. CRASHES BY CONTRIBUTING FACTOR All InjuryFatal1. Speed too fast
4 1 2 1 3
7. Followed too closely 6
1 20
6 1 5
6. Improper overtaking5. Drove left of center4. Disregard traffic signal3. Passed stop sign2. Failed to yield 35 9
55 1 129
8. Made improper turn
Totals 284 5 107 10
1 16 3 2
2 1
23 1
41 7
10
12. Other 11. Mechanical defect10. Improper driving9. Had been drinking
12. ROAD SURFACECONDITION InjuryFatalAll
1. Dry 156 4 572. Wet 56 243. Snowy or icy 66 204. Other 5. Not stated 2 1 1Totals 280 5 102
13. LIGHT CONDITION InjuryFatalAll1. Daylight 199 3 692. Dawn or Dusk 17 123. Darkness 64 2 214. Not statedTotals 280 5 102
11. VEHICLE TYPE InjuryFatalAll1. Passenger car 410 5 1392. Pass Car and trailer 4 13. Truck or truck tractor 4. Truck tractor with semi-trailer 17 35. Other truck combination 16. Farm tractor and/or equip. 7. Taxicab 8. Bus9. School bus 210. Motorcycle 7 711. Motor scooter or moped 12. Others and not stated 2 1 1Totals 443 6 151Special vehicles included above 13. Log trucks14. Emergency (incl. private) 115. Military vehicles 16. Other public vehicles 13 2
14. MANNER OF COLLISION InjuryFatalAll
1. Head-on 2 12. Rear end 58 243. Angle 56 164. Sideswipe-meeting 3 15. Sideswipe-overtaking 24 16. Backed into 6 17. Other 1Totals 150 1 43
11. Count of vehicles, including properly parked vehicles.
Totals include participant records where gender was coded as "unknown".
10. Count of crashes. Crashes with multiple contributing circumstances are counted in all applicable categories.
MULTIPLE VEHICLE CRASHES
7 - 9. Tally of drivers by age, sex, residence & crash severity. Excludes occupants of properly & improperly parked vehicles.
243
Col
lisio
n in
volv
ing:
N
on-
coll.
N
on-
coll.
C
ollis
ion
invo
lvin
g:
Non
- co
ll.
Col
lisio
n in
volv
ing:
3C
. RU
RA
L 3A
. Inc
orpo
rate
d A
reas
3B
. UR
BA
N
SUMMARY OF MOTOR VEHICLE TRAFFIC CRASHES 2006 OREGON CRASHESForIn
208 3 44 74 3 121 59 68 127 103 142 3 248 3. County and Local Roads 5 1 1 2 4 6 3 4 7 4. City Streets
5. Not Stated 395 13 117 145 9 271 113 132 2 247 230 277 11 518 Total--Rural Area
NOTE: THIS YEAR TO DATE represents only those crashes entered onto the database as of the date above. SAME PERIOD LAST YEAR represents all crashes including late reports. MAJOR INJURIES are incapacitating injuries. MINOR INJURIES are non-incapacitating evident injuries.
3. LOCATION Total
PropertyDamage
Nonfatal Injury Fatal Property
DamageNonfatal
InjuryFatalTotalPropertyDamage
Nonfatal Injury Fatal Total Killed Injured
Total On Roadway TotalOff Roadway Number Of Crashes Number Of Persons
1. Below 1,000 2. 1,000 to 2,500 3. 2,501 to 5,000 4. 5,001 to 10,000 5. 10,001 to 25,000 6. 25,001 to 50,000 7. 50,001 to 100,000 8. 100,001 to 200,000 9. City of Portland Only Total - Municipalities
1 2 2
13 45 40
254 999
1,351 5
7 6 14 30 20 20
126 126
489 508
656 690
7 4 11 1 13 27 41
20 19 39 1 105 105 211
1 453 470 924
3 598 625 1,226
2 2 1 3 4
1 1 1 21 21 43
1 36 38 75
2 58 65 125
11 32 1 31
182 2
706 2
962 5
347 3 21 19 2 42 175 214 1 390 196 233 3 432 1. Primary State Highways 33 2 2 16 14 30 16 16 32 2. Secondary State Highways 80 12 7 19 42 43 85 54 50 104 3. County and Local Roads
718 3 56 49 1 106 507 452 2 961 563 501 3 1,067 4. City Streets 5. Not Stated Total--Urban Area 1,178689 77 3 16974072331,466829 800 6 1,635 6. Interstate System 69 2 37 30 45 1 24 20 24 1 13 10 2 587. Other State Freeways 8. Other State Highways 395 1 212 182 375 0 204 171 20 1 8 11 1 322Total--Urban System 464 3 249 212 420 1 228 191 44 2 21 21 3 380
6. Interstate System 88 4 38 46 38 1 17 20 50 3 21 26 4 547. Other State Freeways 8. Other State Highways 175 4 93 78 76 1 43 32 99 3 50 46 6 128Total--Rural System 263 8 131 124 114 2 60 52 149 6 71 72 10 182
June 1, 2007
JACKSON COUNTY
244
At I
nter
sect
ion
Not
at I
nter
sect
ion
At
Inte
r. N
on -I
nter
.
JACKSON COUNTY 2006 OREGON CRASHES
4. AGE OF CASUALTY
Number of Persons Killed Number of Persons Injured Total Killed Pedestrians Pedalcyclist Total Injured Pedestrians Pedalcyclist
Total Total Total Total Total TotalMale Male Male Male Male MaleFemale Female Female Female Female Female1. 0 to 4 1 6 9 15 1 1 1 1 12. 5 to 9 4 4 24 23 473. 10 to 14 6 2 3 4 2 38 29 67 14. 15 to 19 3 2 1 2 132 102 234 5 4 1 25. 20 to 24 4 2 9 4 102 99 201 3 3 76. 25 to 34 3 2 6 1 2 126 106 232 47. 35 to 44 2 1 8 2 142 97 239 5 3 2 2 1 1 78. 45 to 54 5 1 5 5 130 105 235 1 1 1 1 49. 55 to 64 1 3 1 73 85 158 310. 65 to 74 3 2 2 1 39 29 68 2 1 1 211. 75 & older 2 1 2 34 23 57 2 2 1 1 112. Not-stated 1 2 4 1 5 6 20 2Totals 19 14 5 4 2 2 1 1 1,573 713 851 34 23 11 44 34 10
Directional Analysis - A crash consisting of a series of collisions, overturning, etc., is classified according to the first damage or injury producing event; includes on roadway and off roadway.5A. MULTIPLE VEH CRASH Total Fatal Injury P.D.O.
5B. MULTIPLE VEH CRASH Total Fatal Injury P.D.O. 40 42 1 831. Moving in opposite dir.
137 82 2192. Both moving in same dir. 26 13 393a. One car parked
192 224 4163b. One car stopped in traffic 12 1 134. Enter/Leave parked pos. 15 10 255a. Entering driveway/alley 65 20 855b. Leaving driveway/alley 32 30 626. All others
Totals 519 422 1 942
5C. PEDESTRIANCRASHES
All PedCrashes
Fatal Crashes Non-Fatal Injury Crashes
TotalAt
Intersection Non-
Junction TotalAt
IntersectionNon-
Junction1. Car go straight 26 4 4 22 4 182. Car turning right 6 6 4 23. Car turning left 3 3 2 14. Car backing 1 1 15. All othersTotals 36 4 4 32 10 22
5D. ALL OTHER CRASHES Total Fatal Injury P.D.O.Coll-isionWith
Coll-isionWith
1. Other rd veh or railway train 22 22 2. Fixed object 22 8 30 3. Other object or animal 2 2 4. Overturning 3 2 5 5. Other noncollision6. Other rd veh or railway train 22 22 7. Fixed object 136 177 10 323 8. Other object or animal 18 11 29 9. Overturning 14 20 34 10. Other noncollision 4 1 1 6 11. Not statedTotals 199263 11 473
6. PEDESTRIAN ACTION BY AGE
Ages of Pedstrians Killed and InjuredPedestrians Killed Total 0 to 4 5 to 9 10 to 14 15 to 19 20 to 24 25 to 44 45 to 64 65 & older Not stated
1a. X-ing at intersect or X-walk 2 2 2 1 4 1 12 1b. X-ing not at intersection 3 5 1 2 11 1 2a. Walking in road with traffic 2b. Same against traffic 3. Standing in roadway 1 1 2 4. Push or work on veh in road 5. Other working in roadway 6. Playing in roadway 1 1 1 1 4 1 7. Other in roadway 1 1 2 1 8. Not in roadway 1 1 1 2 1 1 7 1 9. Not stated
16 6 74364 1 38 4 Totals
7. AGE OF DRIVER All Crashes Fatal Injury 1. 14 & YOUNGER 2 2 2. 15 7 3 3. 16 94 52 4. 17 129 75 5. 18 143 2 78 6. 19 113 1 64 7. 20 121 75 8. 21 111 2 54 9. 22 to 24 230 3 111 10. 25 to 34 620 1 327 11. 35 to 44 578 3 316 12. 45 to 54 616 2 322 13. 55 to 64 470 1 242 14. 65 to 74 217 2 101 15. 75 & older 184 2 93 16. Not stated 270 1 44 Totals 3,905 20 1,959 8. SEX OF DRIVER Injury Fatal All Crashes
1. Male 2,084 15 1,000 2. Female 1,754 4 936 3. Not stated 67 1 23 Totals 3,905 20 1,959
9. RESIDENCE OF DRIVER All Crashes Fatal Injury
1. Local resident 3,384 13 1,747 2. In-state resident 220 5 108 3. Non resident 156 1 67 4. Not stated 145 1 37 Totals 3,905 20 1,959
10. CRASHES BY CONTRIBUTING FACTOR All InjuryFatal1. Speed too fast
272 12 30 76 13
7. Followed too closely 503
1 36 51
128 26
6. Improper overtaking5. Drove left of center4. Disregard traffic signal3. Passed stop sign2. Failed to yield 478 1 241
139 5 255
8. Made improper turn
Totals 2,575 20 1,322 193
25 210 51 60
1
5 7
401 37
419 82
159
12. Other 11. Mechanical defect10. Improper driving9. Had been drinking
12. ROAD SURFACECONDITION InjuryFatalAll
1. Dry 1,610 12 8292. Wet 379 5 1893. Snowy or icy 137 554. Other 5. Not stated 27 4Totals 2,153 17 1,077
13. LIGHT CONDITION InjuryFatalAll1. Daylight 1,627 8 7982. Dawn or Dusk 114 2 573. Darkness 407 7 2194. Not stated 5 3Totals 2,153 17 1,077
11. VEHICLE TYPE InjuryFatalAll1. Passenger car 3,754 16 1,8682. Pass Car and trailer 30 123. Truck or truck tractor 4 24. Truck tractor with semi-trailer 77 3 335. Other truck combination 11 36. Farm tractor and/or equip. 17. Taxicab 18. Bus 7 19. School bus 6 210. Motorcycle 48 1 4611. Motor scooter or moped 3 312. Others and not stated 15 3Totals 3,957 20 1,973Special vehicles included above 13. Log trucks 2 114. Emergency (incl. private) 10 315. Military vehicles 16. Other public vehicles 25 7
14. MANNER OF COLLISION InjuryFatalAll
1. Head-on 20 152. Rear end 700 3953. Angle 695 1 3204. Sideswipe-meeting 32 1 145. Sideswipe-overtaking 125 296. Backed into 50 67. Other 22 3Totals 1,644 2 782
11. Count of vehicles, including properly parked vehicles.
Totals include participant records where gender was coded as "unknown".
10. Count of crashes. Crashes with multiple contributing circumstances are counted in all applicable categories.
MULTIPLE VEHICLE CRASHES
7 - 9. Tally of drivers by age, sex, residence & crash severity. Excludes occupants of properly & improperly parked vehicles.
245
Col
lisio
n in
volv
ing:
N
on-
coll.
N
on-
coll.
C
ollis
ion
invo
lvin
g:
Non
- co
ll.
Col
lisio
n in
volv
ing:
3C
. RU
RA
L 3A
. Inc
orpo
rate
d A
reas
3B
. UR
BA
N
SUMMARY OF MOTOR VEHICLE TRAFFIC CRASHES 2006 OREGON CRASHESForIn
NOTE: THIS YEAR TO DATE represents only those crashes entered onto the database as of the date above. SAME PERIOD LAST YEAR represents all crashes including late reports. MAJOR INJURIES are incapacitating injuries. MINOR INJURIES are non-incapacitating evident injuries.
3. LOCATION Total
PropertyDamage
Nonfatal Injury Fatal Property
DamageNonfatal
InjuryFatalTotalPropertyDamage
Nonfatal Injury Fatal Total Killed Injured
Total On Roadway TotalOff Roadway Number Of Crashes Number Of Persons
1. Below 1,000 2. 1,000 to 2,500 3. 2,501 to 5,000 4. 5,001 to 10,000 5. 10,001 to 25,000 6. 25,001 to 50,000 7. 50,001 to 100,000 8. 100,001 to 200,000 9. City of Portland Only Total - Municipalities
1 1 1 1 3. County and Local Roads 5 3 1 4 7 2 9 10 3 13 4. City Streets
5. Not Stated Total--Urban Area 266 3 924133730 16 46 6. Interstate System 7. Other State Freeways 8. Other State Highways 32 13 19 27 11 16 5 2 3 21Total--Urban System 32 13 19 27 11 16 5 2 3 21
6. Interstate System 7. Other State Freeways 8. Other State Highways 95 4 51 40 49 3 25 21 46 1 26 19 4 81Total--Rural System 95 4 51 40 49 3 25 21 46 1 26 19 4 81
June 1, 2007
JEFFERSON COUNTY
246
At I
nter
sect
ion
Not
at I
nter
sect
ion
At
Inte
r. N
on -I
nter
.
JEFFERSON COUNTY 2006 OREGON CRASHES
4. AGE OF CASUALTY
Number of Persons Killed Number of Persons Injured Total Killed Pedestrians Pedalcyclist Total Injured Pedestrians Pedalcyclist
Total Total Total Total Total TotalMale Male Male Male Male MaleFemale Female Female Female Female Female1. 0 to 4 1 12. 5 to 9 3 1 43. 10 to 14 2 2 44. 15 to 19 1 1 8 9 175. 20 to 24 8 9 17 3 2 16. 25 to 34 12 11 23 1 1 7. 35 to 44 15 8 238. 45 to 54 1 1 9 9 189. 55 to 64 3 4 710. 65 to 74 5 6 1111. 75 & older 1 2 312. Not-stated 2 2Totals 4 3 1 130 63 67 2 2
Directional Analysis - A crash consisting of a series of collisions, overturning, etc., is classified according to the first damage or injury producing event; includes on roadway and off roadway.5A. MULTIPLE VEH CRASH Total Fatal Injury P.D.O.
Junction1. Car go straight2. Car turning right3. Car turning left 4. Car backing 5. All othersTotals
5D. ALL OTHER CRASHES Total Fatal Injury P.D.O.Coll-isionWith
Coll-isionWith
1. Other rd veh or railway train2. Fixed object 2 2 3. Other object or animal4. Overturning 5. Other noncollision 6. Other rd veh or railway train7. Fixed object 32 36 1 69 8. Other object or animal 10 4 14 9. Overturning 1 1 10. Other noncollision 1 1 11. Not statedTotals 4541 1 87
6. PEDESTRIAN ACTION BY AGE
Ages of Pedstrians Killed and InjuredPedestrians Killed Total 0 to 4 5 to 9 10 to 14 15 to 19 20 to 24 25 to 44 45 to 64 65 & older Not stated
1a. X-ing at intersect or X-walk 1b. X-ing not at intersection 2a. Walking in road with traffic 1 1 2b. Same against traffic 3. Standing in roadway 4. Push or work on veh in road 5. Other working in roadway 6. Playing in roadway 7. Other in roadway 8. Not in roadway 1 1 9. Not stated
1 1 2 Totals
7. AGE OF DRIVER All Crashes Fatal Injury 1. 14 & YOUNGER 1 2. 15 3. 16 7 4 4. 17 12 5 5. 18 4 3 6. 19 5 3 7. 20 4 2 1 8. 21 13 1 5 9. 22 to 24 16 2 6 10. 25 to 34 47 1 25 11. 35 to 44 52 23 12. 45 to 54 40 21 13. 55 to 64 30 13 14. 65 to 74 17 1 9 15. 75 & older 7 2 16. Not stated 12 4 Totals 267 7 124 8. SEX OF DRIVER Injury Fatal All Crashes
1. Male 168 5 73 2. Female 95 2 48 3. Not stated 4 3 Totals 267 7 124
9. RESIDENCE OF DRIVER All Crashes Fatal Injury
1. Local resident 147 2 68 2. In-state resident 95 5 45 3. Non resident 19 8 4. Not stated 6 3 Totals 267 7 124
10. CRASHES BY CONTRIBUTING FACTOR All InjuryFatal1. Speed too fast
6 4 2 2 2
7. Followed too closely 15 6 2 2 6
6. Improper overtaking5. Drove left of center4. Disregard traffic signal3. Passed stop sign2. Failed to yield 23 1 13
33 3 65
8. Made improper turn
Totals 196 9 88 9
11 3 3
2 3
32 1
32 7 5
12. Other 11. Mechanical defect10. Improper driving9. Had been drinking
12. ROAD SURFACECONDITION InjuryFatalAll
1. Dry 110 2 512. Wet 17 2 63. Snowy or icy 48 254. Other 5. Not stated 1Totals 176 4 82
13. LIGHT CONDITION InjuryFatalAll1. Daylight 103 2 422. Dawn or Dusk 23. Darkness 71 2 404. Not statedTotals 176 4 82
11. VEHICLE TYPE InjuryFatalAll1. Passenger car 238 7 1122. Pass Car and trailer 9 33. Truck or truck tractor 14. Truck tractor with semi-trailer 17 85. Other truck combination 16. Farm tractor and/or equip. 7. Taxicab8. Bus 2 19. School bus 110. Motorcycle 2 211. Motor scooter or moped 12. Others and not stated 1 1Totals 272 7 127Special vehicles included above 13. Log trucks14. Emergency (incl. private) 1 115. Military vehicles 16. Other public vehicles 1
14. MANNER OF COLLISION InjuryFatalAll
1. Head-on 7 1 62. Rear end 21 83. Angle 36 1 214. Sideswipe-meeting 8 1 35. Sideswipe-overtaking 10 26. Backed into 57. Other 2 1Totals 89 3 41
11. Count of vehicles, including properly parked vehicles.
Totals include participant records where gender was coded as "unknown".
10. Count of crashes. Crashes with multiple contributing circumstances are counted in all applicable categories.
MULTIPLE VEHICLE CRASHES
7 - 9. Tally of drivers by age, sex, residence & crash severity. Excludes occupants of properly & improperly parked vehicles.
247
Col
lisio
n in
volv
ing:
N
on-
coll.
N
on-
coll.
C
ollis
ion
invo
lvin
g:
Non
- co
ll.
Col
lisio
n in
volv
ing:
3C
. RU
RA
L 3A
. Inc
orpo
rate
d A
reas
3B
. UR
BA
N
SUMMARY OF MOTOR VEHICLE TRAFFIC CRASHES 2006 OREGON CRASHESForIn
145 7 29 49 3 81 30 44 4 78 59 93 7 159 3. County and Local Roads 2 2 1 3 2 1 3 4. City Streets
5. Not Stated 344 14 61 116 6 183 93 108 7 208 154 224 13 391 Total--Rural Area
NOTE: THIS YEAR TO DATE represents only those crashes entered onto the database as of the date above. SAME PERIOD LAST YEAR represents all crashes including late reports. MAJOR INJURIES are incapacitating injuries. MINOR INJURIES are non-incapacitating evident injuries.
3. LOCATION Total
PropertyDamage
Nonfatal Injury Fatal Property
DamageNonfatal
InjuryFatalTotalPropertyDamage
Nonfatal Injury Fatal Total Killed Injured
Total On Roadway TotalOff Roadway Number Of Crashes Number Of Persons
1. Below 1,000 2. 1,000 to 2,500 3. 2,501 to 5,000 4. 5,001 to 10,000 5. 10,001 to 25,000 6. 25,001 to 50,000 7. 50,001 to 100,000 8. 100,001 to 200,000 9. City of Portland Only Total - Municipalities
2
12
584
596 2
7 5
294 288
301 293
5 5 10
2 277 253 532
2 282 258 542
2 2
17 35 52
19 35 54
8
410 2
418 2
268 3 12 11 1 24 133 171 2 306 145 182 3 330 1. Primary State Highways 12 1 1 16 11 27 17 11 28 2. Secondary State Highways 16 1 2 3 12 9 21 13 11 24 3. County and Local Roads
141 26 9 35 106 99 205 132 108 240 4. City Streets 5. Not Stated Total--Urban Area 437340 22 1 632672902559307 312 3 622 6. Interstate System 13 2 6 5 5 1 3 1 8 1 3 4 2 117. Other State Freeways 8. Other State Highways 345 1 187 157 328 179 148 17 8 9 1 269Total--Urban System 358 3 193 162 333 2 182 149 25 1 11 13 3 280
6. Interstate System 80 40 40 40 16 24 40 24 16 537. Other State Freeways 8. Other State Highways 149 6 90 53 87 3 47 37 62 3 43 16 7 144Total--Rural System 229 6 130 93 127 3 63 61 102 3 67 32 7 197
June 1, 2007
JOSEPHINE COUNTY
248
At I
nter
sect
ion
Not
at I
nter
sect
ion
At
Inte
r. N
on -I
nter
.
JOSEPHINE COUNTY 2006 OREGON CRASHES
4. AGE OF CASUALTY
Number of Persons Killed Number of Persons Injured Total Killed Pedestrians Pedalcyclist Total Injured Pedestrians Pedalcyclist
Total Total Total Total Total TotalMale Male Male Male Male MaleFemale Female Female Female Female Female1. 0 to 4 1 1 5 3 82. 5 to 9 1 4 4 8 13. 10 to 14 1 2 15 6 21 14. 15 to 19 1 1 55 59 114 2 1 15. 20 to 24 2 1 1 1 57 40 97 1 1 16. 25 to 34 2 5 2 56 50 106 2 2 57. 35 to 44 2 2 3 2 72 43 115 4 2 2 1 1 18. 45 to 54 2 1 2 80 47 127 2 1 1 19. 55 to 64 4 2 2 45 41 86 3 3 10. 65 to 74 30 24 5411. 75 & older 3 1 1 2 25 15 40 3 2 1 112. Not-stated 1 3 2 5 1Totals 17 11 6 1 1 781 334 447 16 11 5 16 12 4
Directional Analysis - A crash consisting of a series of collisions, overturning, etc., is classified according to the first damage or injury producing event; includes on roadway and off roadway.5A. MULTIPLE VEH CRASH Total Fatal Injury P.D.O.
5B. MULTIPLE VEH CRASH Total Fatal Injury P.D.O. 18 20 3 411. Moving in opposite dir. 50 49 1 1002. Both moving in same dir. 12 4 163a. One car parked 56 89 1453b. One car stopped in traffic
25 4 295b. Leaving driveway/alley 9 7 166. All others
Totals 180 181 4 365
5C. PEDESTRIANCRASHES
All PedCrashes
Fatal Crashes Non-Fatal Injury Crashes
TotalAt
Intersection Non-
Junction TotalAt
IntersectionNon-
Junction1. Car go straight 8 1 1 7 1 62. Car turning right 5 5 3 23. Car turning left 2 2 1 14. Car backing 1 1 15. All othersTotals 16 1 1 15 5 10
5D. ALL OTHER CRASHES Total Fatal Injury P.D.O.Coll-isionWith
Coll-isionWith
1. Other rd veh or railway train 9 9 2. Fixed object 14 11 25 3. Other object or animal4. Overturning 1 1 5. Other noncollision6. Other rd veh or railway train 7 7 7. Fixed object 68 106 6 180 8. Other object or animal 17 10 27 9. Overturning 8 20 1 29 10. Other noncollision 1 2 3 11. Not statedTotals 108163 10 281
6. PEDESTRIAN ACTION BY AGE
Ages of Pedstrians Killed and InjuredPedestrians Killed Total 0 to 4 5 to 9 10 to 14 15 to 19 20 to 24 25 to 44 45 to 64 65 & older Not stated
1a. X-ing at intersect or X-walk 1 1 2 1 1 6 1b. X-ing not at intersection 2 3 1 6 2a. Walking in road with traffic 1 1 2b. Same against traffic 3. Standing in roadway 1 1 1 4. Push or work on veh in road 5. Other working in roadway 6. Playing in roadway 7. Other in roadway 8. Not in roadway 2 1 3 9. Not stated
3 6 52 1 17 1 Totals
7. AGE OF DRIVER All Crashes Fatal Injury 1. 14 & younger 2. 15 2 1 3. 16 34 20 4. 17 63 29 5. 18 70 37 6. 19 61 1 36 7. 20 50 33 8. 21 47 2 25 9. 22 to 24 94 2 58 10. 25 to 34 231 1 133 11. 35 to 44 271 5 149 12. 45 to 54 278 4 161 13. 55 to 64 208 5 107 14. 65 to 74 159 84 15. 75 & older 124 2 56 16. Not stated 81 14 Totals 1,773 22 943 8. SEX OF DRIVER Injury Fatal All Crashes
1. Male 944 18 479 2. Female 809 4 455 3. Not stated 20 9 Totals 1,773 22 943
9. RESIDENCE OF DRIVER All Crashes Fatal Injury
1. Local resident 1,439 17 777 2. In-state resident 164 2 100 3. Non resident 116 3 52 4. Not stated 54 14 Totals 1,773 22 943
10. CRASHES BY CONTRIBUTING FACTOR All InjuryFatal1. Speed too fast
135 12 18 42 12
7. Followed too closely 216 2 3
29 30 79 25
6. Improper overtaking5. Drove left of center4. Disregard traffic signal3. Passed stop sign2. Failed to yield 163 2 80
80 8 135
8. Made improper turn
Totals 1,236 26 660 98 14
110 31 28
4 7
201 24
203 49 82
12. Other 11. Mechanical defect10. Improper driving9. Had been drinking
12. ROAD SURFACECONDITION InjuryFatalAll
1. Dry 676 10 3572. Wet 305 5 1653. Snowy or icy 25 1 134. Other 5. Not stated 7 1Totals 1,013 16 536
13. LIGHT CONDITION InjuryFatalAll1. Daylight 734 12 3792. Dawn or Dusk 58 323. Darkness 221 4 1254. Not statedTotals 1,013 16 536
11. VEHICLE TYPE InjuryFatalAll1. Passenger car 1,712 15 9042. Pass Car and trailer 33 153. Truck or truck tractor 3 1 14. Truck tractor with semi-trailer 29 1 145. Other truck combination 2 26. Farm tractor and/or equip. 7. Taxicab 8. Bus9. School bus 3 210. Motorcycle 20 4 1611. Motor scooter or moped 12. Others and not stated 3 1Totals 1,805 22 954Special vehicles included above 13. Log trucks14. Emergency (incl. private) 115. Military vehicles 16. Other public vehicles 5 2
14. MANNER OF COLLISION InjuryFatalAll
1. Head-on 10 3 52. Rear end 267 1663. Angle 334 2 1464. Sideswipe-meeting 17 105. Sideswipe-overtaking 64 236. Backed into 15 37. Other 9 5Totals 716 5 358
11. Count of vehicles, including properly parked vehicles.
Totals include participant records where gender was coded as "unknown".
10. Count of crashes. Crashes with multiple contributing circumstances are counted in all applicable categories.
MULTIPLE VEHICLE CRASHES
7 - 9. Tally of drivers by age, sex, residence & crash severity. Excludes occupants of properly & improperly parked vehicles.
249
Col
lisio
n in
volv
ing:
N
on-
coll.
N
on-
coll.
C
ollis
ion
invo
lvin
g:
Non
- co
ll.
Col
lisio
n in
volv
ing:
3C
. RU
RA
L 3A
. Inc
orpo
rate
d A
reas
3B
. UR
BA
N
SUMMARY OF MOTOR VEHICLE TRAFFIC CRASHES 2006 OREGON CRASHESForIn
NOTE: THIS YEAR TO DATE represents only those crashes entered onto the database as of the date above. SAME PERIOD LAST YEAR represents all crashes including late reports. MAJOR INJURIES are incapacitating injuries. MINOR INJURIES are non-incapacitating evident injuries.
3. LOCATION Total
PropertyDamage
Nonfatal Injury Fatal Property
DamageNonfatal
InjuryFatalTotalPropertyDamage
Nonfatal Injury Fatal Total Killed Injured
Total On Roadway TotalOff Roadway Number Of Crashes Number Of Persons
1. Below 1,000 2. 1,000 to 2,500 3. 2,501 to 5,000 4. 5,001 to 10,000 5. 10,001 to 25,000 6. 25,001 to 50,000 7. 50,001 to 100,000 8. 100,001 to 200,000 9. City of Portland Only Total - Municipalities
8 4 4 5 4 4 4 4
3 229
237 3
82 144
86 148
3 71 118 192
3 71 122 196
11 26 37
15 26 41
117 3
122 3
81 1 26 7 33 62 50 1 113 88 57 1 146 1. Primary State Highways 17 7 4 11 5 8 13 12 12 24 2. Secondary State Highways 82 1 11 9 20 39 37 1 77 50 46 1 97 3. County and Local Roads
101 2 18 9 27 99 59 2 160 117 68 2 187 4. City Streets 5. Not Stated Total--Urban Area 281462 29 912051544363267 183 4 454 6. Interstate System 7. Other State Freeways 8. Other State Highways 170 1 69 100 126 58 67 44 11 33 1 98Total--Urban System 170 1 69 100 126 1 58 67 44 11 33 1 98
6. Interstate System 7. Other State Freeways 8. Other State Highways 342 10 153 179 153 5 67 81 189 5 86 98 19 265Total--Rural System 342 10 153 179 153 5 67 81 189 5 86 98 19 265
June 1, 2007
KLAMATH COUNTY
250
At I
nter
sect
ion
Not
at I
nter
sect
ion
At
Inte
r. N
on -I
nter
.
KLAMATH COUNTY 2006 OREGON CRASHES
4. AGE OF CASUALTY
Number of Persons Killed Number of Persons Injured Total Killed Pedestrians Pedalcyclist Total Injured Pedestrians Pedalcyclist
Total Total Total Total Total TotalMale Male Male Male Male MaleFemale Female Female Female Female Female1. 0 to 4 3 7 102. 5 to 9 6 6 12 2 2 3. 10 to 14 2 3 2 19 10 29 2 1 1 34. 15 to 19 3 1 1 2 1 47 29 76 2 2 5. 20 to 24 34 36 70 1 1 1 1 6. 25 to 34 1 1 47 35 82 3 2 1 1 1 7. 35 to 44 1 1 39 35 74 6 3 38. 45 to 54 1 1 56 38 94 7 4 3 1 19. 55 to 64 46 36 82 2 1 1 1 110. 65 to 74 16 17 33 2 1 111. 75 & older 15 14 29 2 2 12. Not-stated 1 4 2 7 1Totals 29 18 11 2 1 1 2 2 598 265 332 8 3 5 5 4 1
Directional Analysis - A crash consisting of a series of collisions, overturning, etc., is classified according to the first damage or injury producing event; includes on roadway and off roadway.5A. MULTIPLE VEH CRASH Total Fatal Injury P.D.O.
5B. MULTIPLE VEH CRASH Total Fatal Injury P.D.O. 26 23 6 551. Moving in opposite dir. 43 22 652. Both moving in same dir. 12 7 193a. One car parked 47 41 1 893b. One car stopped in traffic
14 4 185b. Leaving driveway/alley 6 10 166. All others
Totals 158 112 7 277
5C. PEDESTRIANCRASHES
All PedCrashes
Fatal Crashes Non-Fatal Injury Crashes
TotalAt
Intersection Non-
Junction TotalAt
IntersectionNon-
Junction1. Car go straight 7 2 2 5 3 22. Car turning right3. Car turning left 2 2 24. Car backing5. All othersTotals 9 2 2 7 5 2
5D. ALL OTHER CRASHES Total Fatal Injury P.D.O.Coll-isionWith
Coll-isionWith
1. Other rd veh or railway train 1 2 3 2. Fixed object 8 4 12 3. Other object or animal4. Overturning 2 2 5. Other noncollision 1 1 6. Other rd veh or railway train 3 3 7. Fixed object 115 114 8 237 8. Other object or animal 36 15 51 9. Overturning 24 15 1 40 10. Other noncollision 7 5 12 11. Not statedTotals 190160 11 361
6. PEDESTRIAN ACTION BY AGE
Ages of Pedstrians Killed and InjuredPedestrians Killed Total 0 to 4 5 to 9 10 to 14 15 to 19 20 to 24 25 to 44 45 to 64 65 & older Not stated
1a. X-ing at intersect or X-walk 1 1 2 1 5 1b. X-ing not at intersection 1 1 2a. Walking in road with traffic 2b. Same against traffic 3. Standing in roadway 1 1 1 4. Push or work on veh in road 5. Other working in roadway 6. Playing in roadway 7. Other in roadway 1 1 1 8. Not in roadway 1 1 2 9. Not stated
1 3132 10 2 Totals
7. AGE OF DRIVER All Crashes Fatal Injury 1. 14 & YOUNGER 1 1 2. 15 5 4 3. 16 29 13 4. 17 43 18 5. 18 38 17 6. 19 46 19 7. 20 36 1 16 8. 21 20 1 8 9. 22 to 24 87 1 48 10. 25 to 34 189 2 94 11. 35 to 44 229 7 84 12. 45 to 54 245 6 106 13. 55 to 64 179 3 84 14. 65 to 74 92 4 40 15. 75 & older 64 2 27 16. Not stated 72 9 Totals 1,375 28 587 8. SEX OF DRIVER Injury Fatal All Crashes
1. Male 809 20 318 2. Female 557 8 264 3. Not stated 9 5 Totals 1,375 28 587
9. RESIDENCE OF DRIVER All Crashes Fatal Injury
1. Local resident 968 13 414 2. In-state resident 231 7 105 3. Non resident 154 7 61 4. Not stated 22 1 7 Totals 1,375 28 587
10. CRASHES BY CONTRIBUTING FACTOR All InjuryFatal1. Speed too fast
56 13
9 8
10
7. Followed too closely 122 1
2 1
26 20 25 15
6. Improper overtaking5. Drove left of center4. Disregard traffic signal3. Passed stop sign2. Failed to yield 141 1 61
113 9 262
8. Made improper turn
Totals 990 29 428 64
1 64 17 12
8 7
155 5
155 30 34
12. Other 11. Mechanical defect10. Improper driving9. Had been drinking
12. ROAD SURFACECONDITION InjuryFatalAll
1. Dry 494 13 2272. Wet 73 313. Snowy or icy 301 6 1114. Other 5. Not stated 1 1Totals 869 20 369
13. LIGHT CONDITION InjuryFatalAll1. Daylight 601 12 2572. Dawn or Dusk 17 93. Darkness 249 7 1034. Not stated 2 1Totals 869 20 369
11. VEHICLE TYPE InjuryFatalAll1. Passenger car 1,275 20 5372. Pass Car and trailer 19 1 53. Truck or truck tractor 10 24. Truck tractor with semi-trailer 75 5 275. Other truck combination 6. Farm tractor and/or equip. 7. Taxicab 1 18. Bus9. School bus 4 310. Motorcycle 24 2 2211. Motor scooter or moped 12. Others and not stated 2 1Totals 1,410 28 598Special vehicles included above 13. Log trucks14. Emergency (incl. private) 7 315. Military vehicles 16. Other public vehicles 25 8
14. MANNER OF COLLISION InjuryFatalAll
1. Head-on 26 3 142. Rear end 178 1 713. Angle 219 904. Sideswipe-meeting 22 3 95. Sideswipe-overtaking 31 126. Backed into 18 47. Other 5 2Totals 499 7 202
11. Count of vehicles, including properly parked vehicles.
Totals include participant records where gender was coded as "unknown".
10. Count of crashes. Crashes with multiple contributing circumstances are counted in all applicable categories.
MULTIPLE VEHICLE CRASHES
7 - 9. Tally of drivers by age, sex, residence & crash severity. Excludes occupants of properly & improperly parked vehicles.
251
Col
lisio
n in
volv
ing:
N
on-
coll.
N
on-
coll.
C
ollis
ion
invo
lvin
g:
Non
- co
ll.
Col
lisio
n in
volv
ing:
3C
. RU
RA
L 3A
. Inc
orpo
rate
d A
reas
3B
. UR
BA
N
SUMMARY OF MOTOR VEHICLE TRAFFIC CRASHES 2006 OREGON CRASHESForIn
8 1 2 5 1 8 3 1 4 5 6 1 12 3. County and Local Roads 1 1 2 2 3 3 4. City Streets
5. Not Stated 49 5 11 20 3 34 19 8 1 28 30 28 4 62 Total--Rural Area
NOTE: THIS YEAR TO DATE represents only those crashes entered onto the database as of the date above. SAME PERIOD LAST YEAR represents all crashes including late reports. MAJOR INJURIES are incapacitating injuries. MINOR INJURIES are non-incapacitating evident injuries.
3. LOCATION Total
PropertyDamage
Nonfatal Injury Fatal Property
DamageNonfatal
InjuryFatalTotalPropertyDamage
Nonfatal Injury Fatal Total Killed Injured
Total On Roadway TotalOff Roadway Number Of Crashes Number Of Persons
1. Below 1,000 2. 1,000 to 2,500 3. 2,501 to 5,000 4. 5,001 to 10,000 5. 10,001 to 25,000 6. 25,001 to 50,000 7. 50,001 to 100,000 8. 100,001 to 200,000 9. City of Portland Only Total - Municipalities
6
6
2 4
2 4
1 3 4
1 3 4
1 1 2
1 1 2
2
2
1. Primary State Highways 2. Secondary State Highways 3. County and Local Roads 4. City Streets 5. Not Stated Total--Urban Area 6. Interstate System 7. Other State Freeways 8. Other State Highways Total--Urban System
6. Interstate System 7. Other State Freeways 8. Other State Highways 47 3 22 22 22 1 7 14 25 2 15 8 4 41Total--Rural System 47 3 22 22 22 1 7 14 25 2 15 8 4 41
June 1, 2007
LAKE COUNTY
252
At I
nter
sect
ion
Not
at I
nter
sect
ion
At
Inte
r. N
on -I
nter
.
LAKE COUNTY 2006 OREGON CRASHES
4. AGE OF CASUALTY
Number of Persons Killed Number of Persons Injured Total Killed Pedestrians Pedalcyclist Total Injured Pedestrians Pedalcyclist
Total Total Total Total Total TotalMale Male Male Male Male MaleFemale Female Female Female Female Female1. 0 to 4 2. 5 to 9 2 2 1 1 3. 10 to 14 1 14. 15 to 19 2 3 55. 20 to 24 2 5 76. 25 to 34 2 3 57. 35 to 44 4 3 7 2 1 18. 45 to 54 3 3 6 1 1 9. 55 to 64 2 8 10 1 1 10. 65 to 74 2 1 311. 75 & older 1 2 312. Not-stated Totals 5 4 1 49 31 18
Directional Analysis - A crash consisting of a series of collisions, overturning, etc., is classified according to the first damage or injury producing event; includes on roadway and off roadway.5A. MULTIPLE VEH CRASH Total Fatal Injury P.D.O.
1. Entering at angle 1 1 2 2a. Same dir.- both straight 2b. Same-1 turn, 1 straight 2 2 2c. Same-one stopped 1 1 2d. Same-all others 3a. Opposite dir.- both straight 3b. Opposite-1 turn, 1 straight 3c. Opposite-all others 4. Not stated 1 1 Totals 2 4 6
5B. MULTIPLE VEH CRASH Total Fatal Injury P.D.O. 3 2 51. Moving in opposite dir. 2 1 32. Both moving in same dir.
3a. One car parked 1 13b. One car stopped in traffic
Junction1. Car go straight2. Car turning right3. Car turning left 4. Car backing 5. All othersTotals
5D. ALL OTHER CRASHES Total Fatal Injury P.D.O.Coll-isionWith
Coll-isionWith
1. Other rd veh or railway train2. Fixed object 3. Other object or animal 4. Overturning 5. Other noncollision 6. Other rd veh or railway train 7. Fixed object 8 20 3 31 8. Other object or animal 8 8 9. Overturning 3 3 10. Other noncollision11. Not statedTotals 1920 3 42
6. PEDESTRIAN ACTION BY AGE
Ages of Pedstrians Killed and InjuredPedestrians Killed Total 0 to 4 5 to 9 10 to 14 15 to 19 20 to 24 25 to 44 45 to 64 65 & older Not stated
1a. X-ing at intersect or X-walk 1b. X-ing not at intersection 2a. Walking in road with traffic 2b. Same against traffic 3. Standing in roadway 4. Push or work on veh in road 5. Other working in roadway 6. Playing in roadway 7. Other in roadway 8. Not in roadway 9. Not stated Totals
7. AGE OF DRIVER All Crashes Fatal Injury 1. 14 & younger 2. 15 3. 16 4. 17 2 2 5. 18 2 2 6. 19 3 2 7. 20 4 2 8. 21 1 1 9. 22 to 24 2 10. 25 to 34 10 2 3 11. 35 to 44 11 6 12. 45 to 54 17 2 4 13. 55 to 64 14 1 8 14. 65 to 74 10 3 15. 75 & older 3 3 16. Not stated 1 Totals 80 5 36 8. SEX OF DRIVER Injury Fatal All Crashes
1. Male 54 4 25 2. Female 26 1 11 3. Not stated Totals 80 5 36
9. RESIDENCE OF DRIVER All Crashes Fatal Injury
1. Local resident 41 4 16 2. In-state resident 20 11 3. Non resident 19 1 9 4. Not stated Totals 80 5 36
10. CRASHES BY CONTRIBUTING FACTOR All InjuryFatal1. Speed too fast
1 1
1
7. Followed too closely 2 1
2
6. Improper overtaking5. Drove left of center4. Disregard traffic signal3. Passed stop sign2. Failed to yield 6 1
14 1 21
8. Made improper turn
Totals 63 4 29 2 1 6 2
1
2
14 1
14 2
12. Other 11. Mechanical defect10. Improper driving9. Had been drinking
12. ROAD SURFACECONDITION InjuryFatalAll
1. Dry 43 4 202. Wet 3 13. Snowy or icy 16 74. Other 5. Not statedTotals 62 4 28
13. LIGHT CONDITION InjuryFatalAll1. Daylight 41 4 182. Dawn or Dusk 4 13. Darkness 17 94. Not statedTotals 62 4 28
11. VEHICLE TYPE InjuryFatalAll1. Passenger car 66 4 302. Pass Car and trailer 4 13. Truck or truck tractor 4. Truck tractor with semi-trailer 9 35. Other truck combination 6. Farm tractor and/or equip. 1 17. Taxicab8. Bus 9. School bus10. Motorcycle 1 111. Motor scooter or moped 12. Others and not stated 1 1Totals 82 5 36Special vehicles included above 13. Log trucks14. Emergency (incl. private) 2 1 115. Military vehicles 16. Other public vehicles 1 1
14. MANNER OF COLLISION InjuryFatalAll
1. Head-on 2 12. Rear end 4 33. Angle 9 1 34. Sideswipe-meeting 1 15. Sideswipe-overtaking 16. Backed into 27. Other 1Totals 20 1 8
11. Count of vehicles, including properly parked vehicles.
Totals include participant records where gender was coded as "unknown".
10. Count of crashes. Crashes with multiple contributing circumstances are counted in all applicable categories.
MULTIPLE VEHICLE CRASHES
7 - 9. Tally of drivers by age, sex, residence & crash severity. Excludes occupants of properly & improperly parked vehicles.
253
Col
lisio
n in
volv
ing:
N
on-
coll.
N
on-
coll.
C
ollis
ion
invo
lvin
g:
Non
- co
ll.
Col
lisio
n in
volv
ing:
3C
. RU
RA
L 3A
. Inc
orpo
rate
d A
reas
3B
. UR
BA
N
SUMMARY OF MOTOR VEHICLE TRAFFIC CRASHES 2006 OREGON CRASHESForIn
184 15 62 76 7 145 106 55 3 164 168 131 10 309 3. County and Local Roads 10 2 2 33 10 43 35 10 45 4. City Streets
5. Not Stated 530 34 179 177 15 371 336 171 12 519 515 348 27 890 Total--Rural Area
NOTE: THIS YEAR TO DATE represents only those crashes entered onto the database as of the date above. SAME PERIOD LAST YEAR represents all crashes including late reports. MAJOR INJURIES are incapacitating injuries. MINOR INJURIES are non-incapacitating evident injuries.
3. LOCATION Total
PropertyDamage
Nonfatal Injury Fatal Property
DamageNonfatal
InjuryFatalTotalPropertyDamage
Nonfatal Injury Fatal Total Killed Injured
Total On Roadway TotalOff Roadway Number Of Crashes Number Of Persons
1. Below 1,000 2. 1,000 to 2,500 3. 2,501 to 5,000 4. 5,001 to 10,000 5. 10,001 to 25,000 6. 25,001 to 50,000 7. 50,001 to 100,000 8. 100,001 to 200,000 9. City of Portland Only Total - Municipalities
Directional Analysis - A crash consisting of a series of collisions, overturning, etc., is classified according to the first damage or injury producing event; includes on roadway and off roadway.5A. MULTIPLE VEH CRASH Total Fatal Injury P.D.O.
Junction1. Car go straight 28 4 4 24 3 212. Car turning right 7 7 3 43. Car turning left 11 11 10 14. Car backing 1 1 15. All others 1 1 1Totals 48 5 5 43 16 27
5D. ALL OTHER CRASHES Total Fatal Injury P.D.O.Coll-isionWith
Coll-isionWith
1. Other rd veh or railway train 44 44 2. Fixed object 10 11 21 3. Other object or animal4. Overturning 2 2 5. Other noncollision6. Other rd veh or railway train 1 40 3 44 7. Fixed object 267 230 14 511 8. Other object or animal 33 6 39 9. Overturning 4 4 8 10. Other noncollision 1 1 1 3 11. Not statedTotals 316338 18 672
6. PEDESTRIAN ACTION BY AGE
Ages of Pedstrians Killed and InjuredPedestrians Killed Total 0 to 4 5 to 9 10 to 14 15 to 19 20 to 24 25 to 44 45 to 64 65 & older Not stated
1a. X-ing at intersect or X-walk 4 2 5 2 3 1 2 19 1 1b. X-ing not at intersection 2 2 1 4 1 3 5 18 2 2a. Walking in road with traffic 1 1 2b. Same against traffic 3. Standing in roadway 1 1 2 1 4. Push or work on veh in road 5. Other working in roadway 6. Playing in roadway 7. Other in roadway 1 1 2 8. Not in roadway 2 2 2 2 8 1 9. Not stated
76 9 9757 50 5 Totals
7. AGE OF DRIVER All Crashes Fatal Injury 1. 14 & YOUNGER 1 2. 15 8 7 3. 16 110 1 35 4. 17 175 1 73 5. 18 228 91 6. 19 216 3 99 7. 20 212 3 82 8. 21 214 2 93 9. 22 to 24 483 6 224 10. 25 to 34 1,070 11 432 11. 35 to 44 941 4 395 12. 45 to 54 1,067 13 437 13. 55 to 64 758 12 281 14. 65 to 74 377 6 136 15. 75 & older 248 2 85 16. Not stated 661 67 Totals 6,769 64 2,537 8. SEX OF DRIVER Injury Fatal All Crashes
1. Male 3,613 44 1,268 2. Female 3,027 20 1,233 3. Not stated 129 36 Totals 6,769 64 2,537
9. RESIDENCE OF DRIVER All Crashes Fatal Injury
1. Local resident 6,007 48 2,280 2. In-state resident 423 13 174 3. Non resident 146 3 39 4. Not stated 193 44 Totals 6,769 64 2,537
10. CRASHES BY CONTRIBUTING FACTOR All InjuryFatal1. Speed too fast
137 39 30 73 21
7. Followed too closely 260 2 2 4 2 1
193 76
143 46
6. Improper overtaking5. Drove left of center4. Disregard traffic signal3. Passed stop sign2. Failed to yield 892 3 350
630 15 1,619
8. Made improper turn
Totals 3,878 58 1,492 53
4 69 55 31
4 1
10 14
167 9
244 99
130
12. Other 11. Mechanical defect10. Improper driving9. Had been drinking
12. ROAD SURFACECONDITION InjuryFatalAll
1. Dry 2,698 26 1,0162. Wet 829 12 3193. Snowy or icy 111 1 444. Other 5. Not stated 2 1Totals 3,640 40 1,379
13. LIGHT CONDITION InjuryFatalAll1. Daylight 2,679 23 1,0112. Dawn or Dusk 171 1 573. Darkness 788 16 3114. Not stated 2Totals 3,640 40 1,379
11. VEHICLE TYPE InjuryFatalAll1. Passenger car 6,618 50 2,4592. Pass Car and trailer 51 2 113. Truck or truck tractor 20 2 54. Truck tractor with semi-trailer 93 5 285. Other truck combination 3 16. Farm tractor and/or equip. 1 17. Taxicab8. Bus 18 79. School bus 9 210. Motorcycle 61 4 5211. Motor scooter or moped 1 112. Others and not stated 13 1 2Totals 6,888 65 2,568Special vehicles included above 13. Log trucks 8 2 314. Emergency (incl. private) 13 615. Military vehicles 16. Other public vehicles 37 3 14
5. Not Stated 249 8 74 68 5 147 123 90 3 216 197 158 8 363 Total--Rural Area
NOTE: THIS YEAR TO DATE represents only those crashes entered onto the database as of the date above. SAME PERIOD LAST YEAR represents all crashes including late reports. MAJOR INJURIES are incapacitating injuries. MINOR INJURIES are non-incapacitating evident injuries.
3. LOCATION Total
PropertyDamage
Nonfatal Injury Fatal Property
DamageNonfatal
InjuryFatalTotalPropertyDamage
Nonfatal Injury Fatal Total Killed Injured
Total On Roadway TotalOff Roadway Number Of Crashes Number Of Persons
1. Below 1,000 2. 1,000 to 2,500 3. 2,501 to 5,000 4. 5,001 to 10,000 5. 10,001 to 25,000 6. 25,001 to 50,000 7. 50,001 to 100,000 8. 100,001 to 200,000 9. City of Portland Only Total - Municipalities
1 1 1 1 1 3. County and Local Roads 35 17 6 23 52 21 73 69 27 96 4. City Streets
5. Not Stated Total--Urban Area 144225 12 1 38169951265194 107 2 303 6. Interstate System 7. Other State Freeways 8. Other State Highways 206 2 79 125 192 1 74 117 14 1 5 8 2 108Total--Urban System 206 2 79 125 192 1 74 117 14 1 5 8 2 108
6. Interstate System 7. Other State Freeways 8. Other State Highways 277 5 124 148 175 3 76 96 102 2 48 52 5 206Total--Rural System 277 5 124 148 175 3 76 96 102 2 48 52 5 206
June 1, 2007
LINCOLN COUNTY
256
At I
nter
sect
ion
Not
at I
nter
sect
ion
At
Inte
r. N
on -I
nter
.
LINCOLN COUNTY 2006 OREGON CRASHES
4. AGE OF CASUALTY
Number of Persons Killed Number of Persons Injured Total Killed Pedestrians Pedalcyclist Total Injured Pedestrians Pedalcyclist
Total Total Total Total Total TotalMale Male Male Male Male MaleFemale Female Female Female Female Female1. 0 to 4 3 3 62. 5 to 9 3 2 53. 10 to 14 1 3 44. 15 to 19 4 1 2 2 35 28 63 15. 20 to 24 23 23 46 1 1 6. 25 to 34 1 1 40 31 71 2 2 7. 35 to 44 1 1 1 29 22 51 18. 45 to 54 2 1 2 35 23 58 1 1 1 1 19. 55 to 64 3 1 3 25 20 45 110. 65 to 74 1 1 7 12 19 2 2 1 111. 75 & older 10 8 18 4 3 1 1 1 12. Not-stated 3 4 7Totals 10 9 1 2 2 1 1 393 179 214 12 7 5 4 4
Directional Analysis - A crash consisting of a series of collisions, overturning, etc., is classified according to the first damage or injury producing event; includes on roadway and off roadway.5A. MULTIPLE VEH CRASH Total Fatal Injury P.D.O.
18 2 205b. Leaving driveway/alley 14 13 276. All others
Totals 230 127 357
5C. PEDESTRIANCRASHES
All PedCrashes
Fatal Crashes Non-Fatal Injury Crashes
TotalAt
Intersection Non-
Junction TotalAt
IntersectionNon-
Junction1. Car go straight 10 2 2 8 82. Car turning right 1 1 13. Car turning left 3 3 34. Car backing5. All othersTotals 14 2 2 12 4 8
5D. ALL OTHER CRASHES Total Fatal Injury P.D.O.Coll-isionWith
Coll-isionWith
1. Other rd veh or railway train 2 2 2. Fixed object 2 1 3 3. Other object or animal4. Overturning 5. Other noncollision6. Other rd veh or railway train 2 2 7. Fixed object 84 69 6 159 8. Other object or animal 15 6 1 22 9. Overturning 5 7 12 10. Other noncollision11. Not statedTotals 10687 7 200
6. PEDESTRIAN ACTION BY AGE
Ages of Pedstrians Killed and InjuredPedestrians Killed Total 0 to 4 5 to 9 10 to 14 15 to 19 20 to 24 25 to 44 45 to 64 65 & older Not stated
1a. X-ing at intersect or X-walk 1 3 4 1b. X-ing not at intersection 1 6 2 1 10 2 2a. Walking in road with traffic 2b. Same against traffic 3. Standing in roadway 4. Push or work on veh in road 5. Other working in roadway 6. Playing in roadway 7. Other in roadway 8. Not in roadway 9. Not stated
2 6 24 14 2 Totals
7. AGE OF DRIVER All Crashes Fatal Injury 1. 14 & younger 2. 15 3. 16 19 5 4. 17 53 29 5. 18 36 17 6. 19 24 11 7. 20 23 9 8. 21 23 1 8 9. 22 to 24 62 1 30 10. 25 to 34 158 2 68 11. 35 to 44 157 1 64 12. 45 to 54 187 1 78 13. 55 to 64 164 1 65 14. 65 to 74 80 2 26 15. 75 & older 80 2 35 16. Not stated 65 3 Totals 1,131 11 448 8. SEX OF DRIVER Injury Fatal All Crashes
1. Male 634 9 241 2. Female 486 2 205 3. Not stated 11 2 Totals 1,131 11 448
9. RESIDENCE OF DRIVER All Crashes Fatal Injury
1. Local resident 775 8 305 2. In-state resident 246 2 107 3. Non resident 92 1 32 4. Not stated 18 4 Totals 1,131 11 448
10. CRASHES BY CONTRIBUTING FACTOR All InjuryFatal1. Speed too fast
19 6
16 5 4
7. Followed too closely 27
1
29 45
9 7
6. Improper overtaking5. Drove left of center4. Disregard traffic signal3. Passed stop sign2. Failed to yield 134 3 57
132 5 319
8. Made improper turn
Totals 731 14 303 16
1 29 14
4
1
4
46 2
72 25 16
12. Other 11. Mechanical defect10. Improper driving9. Had been drinking
12. ROAD SURFACECONDITION InjuryFatalAll
1. Dry 463 4 1762. Wet 165 5 723. Snowy or icy 35 174. Other 5. Not stated 3 1Totals 666 10 265
13. LIGHT CONDITION InjuryFatalAll1. Daylight 497 7 1872. Dawn or Dusk 32 163. Darkness 137 3 624. Not statedTotals 666 10 265
11. VEHICLE TYPE InjuryFatalAll1. Passenger car 1,087 8 4212. Pass Car and trailer 13 1 53. Truck or truck tractor 6 1 24. Truck tractor with semi-trailer 21 1 55. Other truck combination 16. Farm tractor and/or equip. 7. Taxicab8. Bus 19. School bus 110. Motorcycle 20 1811. Motor scooter or moped 12. Others and not stated 2Totals 1,152 11 451Special vehicles included above 13. Log trucks 2 1 114. Emergency (incl. private) 1 115. Military vehicles 16. Other public vehicles 6 1
14. MANNER OF COLLISION InjuryFatalAll
1. Head-on 6 32. Rear end 205 873. Angle 140 1 554. Sideswipe-meeting 42 145. Sideswipe-overtaking 34 46. Backed into 147. Other 11 3Totals 452 1 166
11. Count of vehicles, including properly parked vehicles.
Totals include participant records where gender was coded as "unknown".
10. Count of crashes. Crashes with multiple contributing circumstances are counted in all applicable categories.
MULTIPLE VEHICLE CRASHES
7 - 9. Tally of drivers by age, sex, residence & crash severity. Excludes occupants of properly & improperly parked vehicles.
257
Col
lisio
n in
volv
ing:
N
on-
coll.
N
on-
coll.
C
ollis
ion
invo
lvin
g:
Non
- co
ll.
Col
lisio
n in
volv
ing:
3C
. RU
RA
L 3A
. Inc
orpo
rate
d A
reas
3B
. UR
BA
N
SUMMARY OF MOTOR VEHICLE TRAFFIC CRASHES 2006 OREGON CRASHESForIn
NOTE: THIS YEAR TO DATE represents only those crashes entered onto the database as of the date above. SAME PERIOD LAST YEAR represents all crashes including late reports. MAJOR INJURIES are incapacitating injuries. MINOR INJURIES are non-incapacitating evident injuries.
3. LOCATION Total
PropertyDamage
Nonfatal Injury Fatal Property
DamageNonfatal
InjuryFatalTotalPropertyDamage
Nonfatal Injury Fatal Total Killed Injured
Total On Roadway TotalOff Roadway Number Of Crashes Number Of Persons
1. Below 1,000 2. 1,000 to 2,500 3. 2,501 to 5,000 4. 5,001 to 10,000 5. 10,001 to 25,000 6. 25,001 to 50,000 7. 50,001 to 100,000 8. 100,001 to 200,000 9. City of Portland Only Total - Municipalities
29 10 19 14 21 7 14 8 3 5
1 1 2
8 5
41 113 472
668 4
3 5 3 2
20 20 52 60
230 240
318 346
2 2 4 3 1 4
16 15 31 1 50 55 106 2 217 213 432
3 295 300 598
1 3 4 1 1
1 4 5 10 2 5 7
13 27 40
1 23 46 70
4 3
24 2 79 1
376 4
500 7
273 5 8 9 1 18 155 163 2 320 163 172 3 338 1. Primary State Highways 1 1 1 1 1 1 1 2 2. Secondary State Highways 7 1 3 2 1 6 13 3 16 16 5 1 22 3. County and Local Roads
215 3 30 11 41 128 126 2 256 158 137 2 297 4. City Streets 5. Not Stated Total--Urban Area 496941 23 2 662972924593338 315 6 659 6. Interstate System 14 1 5 8 11 4 6 3 1 2 1 57. Other State Freeways 8. Other State Highways 326 2 168 156 310 1 159 150 16 1 9 6 4 269Total--Urban System 340 3 173 164 321 2 163 156 19 1 10 8 5 274
6. Interstate System 62 3 21 38 40 2 13 25 22 1 8 13 3 347. Other State Freeways 8. Other State Highways 291 9 121 161 191 8 80 103 100 1 41 58 12 213Total--Rural System 353 12 142 199 231 10 93 128 122 2 49 71 15 247
June 1, 2007
LINN COUNTY
258
At I
nter
sect
ion
Not
at I
nter
sect
ion
At
Inte
r. N
on -I
nter
.
LINN COUNTY 2006 OREGON CRASHES
4. AGE OF CASUALTY
Number of Persons Killed Number of Persons Injured Total Killed Pedestrians Pedalcyclist Total Injured Pedestrians Pedalcyclist
Total Total Total Total Total TotalMale Male Male Male Male MaleFemale Female Female Female Female Female1. 0 to 4 2 7 92. 5 to 9 1 1 2 1 15 22 37 13. 10 to 14 2 2 2 16 11 27 1 1 1 1 24. 15 to 19 1 2 89 44 133 5 3 2 1 1 15. 20 to 24 1 4 1 70 56 126 5 3 2 46. 25 to 34 1 1 4 1 66 77 143 4 4 37. 35 to 44 3 5 1 2 67 65 132 3 3 58. 45 to 54 1 1 4 1 69 71 140 7 5 2 1 1 39. 55 to 64 2 1 1 1 39 46 85 3 2 1 110. 65 to 74 2 1 1 1 1 26 19 45 3 2 111. 75 & older 26 17 4312. Not-stated 2 2 6Totals 31 22 9 3 2 1 926 437 487 13 8 5 25 20 5
Directional Analysis - A crash consisting of a series of collisions, overturning, etc., is classified according to the first damage or injury producing event; includes on roadway and off roadway.5A. MULTIPLE VEH CRASH Total Fatal Injury P.D.O.
5B. MULTIPLE VEH CRASH Total Fatal Injury P.D.O. 23 37 9 691. Moving in opposite dir. 81 44 1 1262. Both moving in same dir. 14 4 183a. One car parked 84 98 1823b. One car stopped in traffic 11 1 124. Enter/Leave parked pos. 13 3 165a. Entering driveway/alley 32 11 435b. Leaving driveway/alley 11 12 236. All others
Totals 269 210 10 489
5C. PEDESTRIANCRASHES
All PedCrashes
Fatal Crashes Non-Fatal Injury Crashes
TotalAt
Intersection Non-
Junction TotalAt
IntersectionNon-
Junction1. Car go straight 9 3 3 6 2 42. Car turning right 3 3 33. Car turning left 4 4 44. Car backing5. All othersTotals 16 3 3 13 9 4
5D. ALL OTHER CRASHES Total Fatal Injury P.D.O.Coll-isionWith
Coll-isionWith
1. Other rd veh or railway train 14 14 2. Fixed object 13 10 23 3. Other object or animal4. Overturning 1 1 5. Other noncollision6. Other rd veh or railway train 1 12 13 7. Fixed object 125 121 8 254 8. Other object or animal 25 4 29 9. Overturning 8 8 2 18 10. Other noncollision 1 2 3 11. Not statedTotals 174171 10 355
6. PEDESTRIAN ACTION BY AGE
Ages of Pedstrians Killed and InjuredPedestrians Killed Total 0 to 4 5 to 9 10 to 14 15 to 19 20 to 24 25 to 44 45 to 64 65 & older Not stated
1a. X-ing at intersect or X-walk 2 2 3 1 1 9 1b. X-ing not at intersection 1 1 1 3 2a. Walking in road with traffic 2 2 1 2b. Same against traffic 3. Standing in roadway 1 1 1 4. Push or work on veh in road 5. Other working in roadway 6. Playing in roadway 7. Other in roadway 8. Not in roadway 1 1 1 9. Not stated
2 4 41131 16 3 Totals
7. AGE OF DRIVER All Crashes Fatal Injury 1. 14 & younger 2. 15 3 3. 16 45 19 4. 17 62 1 26 5. 18 91 41 6. 19 77 1 40 7. 20 76 3 47 8. 21 51 1 32 9. 22 to 24 135 3 70 10. 25 to 34 344 10 170 11. 35 to 44 327 4 164 12. 45 to 54 353 7 177 13. 55 to 64 236 6 116 14. 65 to 74 143 3 61 15. 75 & older 104 47 16. Not stated 153 22 Totals 2,200 39 1,032 8. SEX OF DRIVER Injury Fatal All Crashes
1. Male 1,223 28 532 2. Female 941 11 487 3. Not stated 36 13 Totals 2,200 39 1,032
9. RESIDENCE OF DRIVER All Crashes Fatal Injury
1. Local resident 1,722 22 840 2. In-state resident 343 13 145 3. Non resident 66 3 27 4. Not stated 69 1 20 Totals 2,200 39 1,032
10. CRASHES BY CONTRIBUTING FACTOR All InjuryFatal1. Speed too fast
116 7
13 33 24
7. Followed too closely 226
5
1
21 34 59 39
6. Improper overtaking5. Drove left of center4. Disregard traffic signal3. Passed stop sign2. Failed to yield 271 1 132
164 12 349
8. Made improper turn
Totals 1,491 39 721 88
4 90 35 15
1
11 8
200 10
180 51 51
12. Other 11. Mechanical defect10. Improper driving9. Had been drinking
12. ROAD SURFACECONDITION InjuryFatalAll
1. Dry 823 16 3982. Wet 302 6 1463. Snowy or icy 108 3 354. Other 5. Not stated 16 1Totals 1,249 25 580
13. LIGHT CONDITION InjuryFatalAll1. Daylight 918 13 4162. Dawn or Dusk 59 3 263. Darkness 266 7 1374. Not stated 6 2 1Totals 1,249 25 580
11. VEHICLE TYPE InjuryFatalAll1. Passenger car 2,092 35 9812. Pass Car and trailer 27 113. Truck or truck tractor 64. Truck tractor with semi-trailer 58 1 185. Other truck combination 6. Farm tractor and/or equip. 4 37. Taxicab8. Bus 1 19. School bus 4 210. Motorcycle 24 2 2111. Motor scooter or moped 1 112. Others and not stated 13 1 4Totals 2,230 39 1,042Special vehicles included above 13. Log trucks 3 1 214. Emergency (incl. private) 7 315. Military vehicles 16. Other public vehicles 9 7
NOTE: THIS YEAR TO DATE represents only those crashes entered onto the database as of the date above. SAME PERIOD LAST YEAR represents all crashes including late reports. MAJOR INJURIES are incapacitating injuries. MINOR INJURIES are non-incapacitating evident injuries.
3. LOCATION Total
PropertyDamage
Nonfatal Injury Fatal Property
DamageNonfatal
InjuryFatalTotalPropertyDamage
Nonfatal Injury Fatal Total Killed Injured
Total On Roadway TotalOff Roadway Number Of Crashes Number Of Persons
1. Below 1,000 2. 1,000 to 2,500 3. 2,501 to 5,000 4. 5,001 to 10,000 5. 10,001 to 25,000 6. 25,001 to 50,000 7. 50,001 to 100,000 8. 100,001 to 200,000 9. City of Portland Only Total - Municipalities
4 1 1 2 3 5 3 3 6 3. County and Local Roads 64 5 2 7 62 39 101 67 41 108 4. City Streets
5. Not Stated Total--Urban Area 928 5 13725813080 63 143 6. Interstate System 4 2 2 1 1 3 2 1 27. Other State Freeways 8. Other State Highways 25 17 8 23 16 7 2 1 1 22Total--Urban System 29 19 10 24 16 8 5 3 2 24
6. Interstate System 33 12 21 13 4 9 20 8 12 187. Other State Freeways 8. Other State Highways 170 2 84 84 73 32 41 97 2 52 43 2 119Total--Rural System 203 2 96 105 86 36 50 117 2 60 55 2 137
June 1, 2007
MALHEUR COUNTY
260
At I
nter
sect
ion
Not
at I
nter
sect
ion
At
Inte
r. N
on -I
nter
.
MALHEUR COUNTY 2006 OREGON CRASHES
4. AGE OF CASUALTY
Number of Persons Killed Number of Persons Injured Total Killed Pedestrians Pedalcyclist Total Injured Pedestrians Pedalcyclist
Total Total Total Total Total TotalMale Male Male Male Male MaleFemale Female Female Female Female Female1. 0 to 4 4 3 72. 5 to 9 1 1 7 7 143. 10 to 14 5 3 84. 15 to 19 1 1 27 10 375. 20 to 24 9 17 266. 25 to 34 1 1 17 25 427. 35 to 44 24 13 378. 45 to 54 1 24 19 43 2 2 19. 55 to 64 1 11 9 20 110. 65 to 74 11 7 1811. 75 & older 7 2 912. Not-stated 1 1Totals 2 2 262 115 147 3 2 1 2 2
Directional Analysis - A crash consisting of a series of collisions, overturning, etc., is classified according to the first damage or injury producing event; includes on roadway and off roadway.5A. MULTIPLE VEH CRASH Total Fatal Injury P.D.O.
5B. MULTIPLE VEH CRASH Total Fatal Injury P.D.O. 6 5 111. Moving in opposite dir.
11 8 192. Both moving in same dir. 3 3 63a. One car parked
10 7 173b. One car stopped in traffic 2 24. Enter/Leave parked pos. 4 1 55a. Entering driveway/alley
11 3 145b. Leaving driveway/alley 1 2 36. All others
Totals 48 29 77
5C. PEDESTRIANCRASHES
All PedCrashes
Fatal Crashes Non-Fatal Injury Crashes
TotalAt
Intersection Non-
Junction TotalAt
IntersectionNon-
Junction1. Car go straight 3 3 32. Car turning right3. Car turning left 4. Car backing 5. All othersTotals 3 3 3
5D. ALL OTHER CRASHES Total Fatal Injury P.D.O.Coll-isionWith
Coll-isionWith
1. Other rd veh or railway train 1 1 2. Fixed object 6 6 12 3. Other object or animal4. Overturning 1 1 2 5. Other noncollision6. Other rd veh or railway train 1 1 7. Fixed object 66 73 2 141 8. Other object or animal 29 11 40 9. Overturning 3 3 6 10. Other noncollision 1 1 11. Not statedTotals 10696 2 204
6. PEDESTRIAN ACTION BY AGE
Ages of Pedstrians Killed and InjuredPedestrians Killed Total 0 to 4 5 to 9 10 to 14 15 to 19 20 to 24 25 to 44 45 to 64 65 & older Not stated
1a. X-ing at intersect or X-walk 1 1 1 3 1b. X-ing not at intersection 2a. Walking in road with traffic 2b. Same against traffic 3. Standing in roadway 4. Push or work on veh in road 5. Other working in roadway 6. Playing in roadway 7. Other in roadway 8. Not in roadway 9. Not stated
111 3 Totals
7. AGE OF DRIVER All Crashes Fatal Injury 1. 14 & younger 2. 15 1 3. 16 19 10 4. 17 16 7 5. 18 21 13 6. 19 31 11 7. 20 21 6 8. 21 19 6 9. 22 to 24 29 18 10. 25 to 34 83 40 11. 35 to 44 77 41 12. 45 to 54 98 2 49 13. 55 to 64 70 29 14. 65 to 74 54 21 15. 75 & older 39 14 16. Not stated 11 2 Totals 589 2 267 8. SEX OF DRIVER Injury Fatal All Crashes
1. Male 347 2 142 2. Female 235 123 3. Not stated 7 2 Totals 589 2 267
9. RESIDENCE OF DRIVER All Crashes Fatal Injury
1. Local resident 307 136 2. In-state resident 47 16 3. Non resident 225 2 113 4. Not stated 10 2 Totals 589 2 267
10. CRASHES BY CONTRIBUTING FACTOR All InjuryFatal1. Speed too fast
8 2 7 9
11
7. Followed too closely 13 8
11 14 17
6. Improper overtaking5. Drove left of center4. Disregard traffic signal3. Passed stop sign2. Failed to yield 77 29
108 204
8. Made improper turn
Totals 445 1 211 26
7 2 2
1
70
15 5
11
12. Other 11. Mechanical defect10. Improper driving9. Had been drinking
12. ROAD SURFACECONDITION InjuryFatalAll
1. Dry 258 2 1152. Wet 47 263. Snowy or icy 88 404. Other 5. Not stated 3Totals 396 2 181
13. LIGHT CONDITION InjuryFatalAll1. Daylight 246 2 1092. Dawn or Dusk 18 83. Darkness 132 644. Not statedTotals 396 2 181
11. VEHICLE TYPE InjuryFatalAll1. Passenger car 541 2 2402. Pass Car and trailer 11 63. Truck or truck tractor 4. Truck tractor with semi-trailer 30 135. Other truck combination 6. Farm tractor and/or equip. 1 17. Taxicab8. Bus9. School bus 1 110. Motorcycle 4 311. Motor scooter or moped 12. Others and not stated 1 1Totals 589 2 265Special vehicles included above 13. Log trucks14. Emergency (incl. private) 1 115. Military vehicles 16. Other public vehicles 2 2
14. MANNER OF COLLISION InjuryFatalAll
1. Head-on 10 62. Rear end 46 243. Angle 115 484. Sideswipe-meeting 15. Sideswipe-overtaking 10 46. Backed into 57. Other 2Totals 189 82
11. Count of vehicles, including properly parked vehicles.
Totals include participant records where gender was coded as "unknown".
10. Count of crashes. Crashes with multiple contributing circumstances are counted in all applicable categories.
MULTIPLE VEHICLE CRASHES
7 - 9. Tally of drivers by age, sex, residence & crash severity. Excludes occupants of properly & improperly parked vehicles.
261
Col
lisio
n in
volv
ing:
N
on-
coll.
N
on-
coll.
C
ollis
ion
invo
lvin
g:
Non
- co
ll.
Col
lisio
n in
volv
ing:
3C
. RU
RA
L 3A
. Inc
orpo
rate
d A
reas
3B
. UR
BA
N
SUMMARY OF MOTOR VEHICLE TRAFFIC CRASHES 2006 OREGON CRASHESForIn
NOTE: THIS YEAR TO DATE represents only those crashes entered onto the database as of the date above. SAME PERIOD LAST YEAR represents all crashes including late reports. MAJOR INJURIES are incapacitating injuries. MINOR INJURIES are non-incapacitating evident injuries.
3. LOCATION Total
PropertyDamage
Nonfatal Injury Fatal Property
DamageNonfatal
InjuryFatalTotalPropertyDamage
Nonfatal Injury Fatal Total Killed Injured
Total On Roadway TotalOff Roadway Number Of Crashes Number Of Persons
1. Below 1,000 2. 1,000 to 2,500 3. 2,501 to 5,000 4. 5,001 to 10,000 5. 10,001 to 25,000 6. 25,001 to 50,000 7. 50,001 to 100,000 8. 100,001 to 200,000 9. City of Portland Only Total - Municipalities
18 9 9 17 14 7 7 4 2 2
2
2
21 45 97
198 193
2,062 2,634 4
8 13 19 26 40 57 95 101 99 94
967 1,093
1,237 1,393
7 12 19 18 21 39 37 48 85
2 88 84 174 90 79 169
2 905 1,008 1,915
4 1,152 1,259 2,415
1 1 2 1 5 6 3 9 12 7 17 24 9 15 24
62 85 147
85 134 219
10 28 53
151 2 151
1,524 5
1,934 7
422 2 24 24 48 246 232 2 480 270 256 2 528 1. Primary State Highways 121 3 2 3 5 49 65 1 115 51 68 1 120 2. Secondary State Highways 229 8 8 16 133 130 263 141 138 279 3. County and Local Roads
1,375 2 102 59 161 948 840 1 1,789 1,050 899 1 1,950 4. City Streets 5. Not Stated Total--Urban Area 2,1477136 94 2301,3761,26742,647 1,512 1,361 4 2,877 6. Interstate System 107 50 57 84 39 45 23 11 12 907. Other State Freeways 112 1 60 51 109 59 49 3 1 2 3 1038. Other State Highways 429 2 214 213 402 199 201 27 15 12 2 350Total--Urban System 648 3 324 321 595 3 297 295 53 27 26 5 543
6. Interstate System 146 3 56 87 92 1 42 49 54 2 14 38 3 927. Other State Freeways 8. Other State Highways 304 6 159 139 218 3 114 101 86 3 45 38 7 266Total--Rural System 450 9 215 226 310 4 156 150 140 5 59 76 10 358
June 1, 2007
MARION COUNTY
262
At I
nter
sect
ion
Not
at I
nter
sect
ion
At
Inte
r. N
on -I
nter
.
MARION COUNTY 2006 OREGON CRASHES
4. AGE OF CASUALTY
Number of Persons Killed Number of Persons Injured Total Killed Pedestrians Pedalcyclist Total Injured Pedestrians Pedalcyclist
Total Total Total Total Total TotalMale Male Male Male Male MaleFemale Female Female Female Female Female1. 0 to 4 33 23 562. 5 to 9 2 1 2 46 24 70 13. 10 to 14 5 1 6 2 3 62 43 105 54. 15 to 19 8 1 11 4 4 227 165 392 4 3 1 105. 20 to 24 4 1 2 2 201 169 370 4 4 16. 25 to 34 2 2 5 1 1 285 240 525 6 4 2 37. 35 to 44 7 3 9 1 6 219 198 417 6 4 2 68. 45 to 54 6 1 6 5 1 236 174 410 4 3 1 1 1 59. 55 to 64 3 2 2 1 124 97 221 2 1 1 210. 65 to 74 3 2 1 2 80 43 123 1 1 1 1 211. 75 & older 2 1 1 1 54 47 101 1 1 112. Not-stated 4 2 6 1 3 19 19 39 4Totals 28 20 8 2 2 2,829 1,242 1,586 46 26 20 50 40 10
Directional Analysis - A crash consisting of a series of collisions, overturning, etc., is classified according to the first damage or injury producing event; includes on roadway and off roadway.5A. MULTIPLE VEH CRASH Total Fatal Injury P.D.O.
5B. MULTIPLE VEH CRASH Total Fatal Injury P.D.O. 52 53 6 1111. Moving in opposite dir.
227 134 1 3622. Both moving in same dir. 65 15 1 813a. One car parked
364 401 1 7663b. One car stopped in traffic 18 2 204. Enter/Leave parked pos. 21 9 1 315a. Entering driveway/alley
102 43 1455b. Leaving driveway/alley 53 53 1066. All others
Totals 902 710 10 1,622
5C. PEDESTRIANCRASHES
All PedCrashes
Fatal Crashes Non-Fatal Injury Crashes
TotalAt
Intersection Non-
Junction TotalAt
IntersectionNon-
Junction1. Car go straight 22 2 2 20 7 132. Car turning right 8 8 6 23. Car turning left 14 14 13 14. Car backing 2 2 1 15. All othersTotals 46 2 2 44 27 17
5D. ALL OTHER CRASHES Total Fatal Injury P.D.O.Coll-isionWith
Coll-isionWith
1. Other rd veh or railway train 33 33 2. Fixed object 19 18 1 38 3. Other object or animal 1 1 4. Overturning 3 1 4 5. Other noncollision6. Other rd veh or railway train 1 17 18 7. Fixed object 182 194 9 385 8. Other object or animal 21 7 28 9. Overturning 4 21 25 10. Other noncollision 1 1 11. Not statedTotals 230293 10 533
6. PEDESTRIAN ACTION BY AGE
Ages of Pedstrians Killed and InjuredPedestrians Killed Total 0 to 4 5 to 9 10 to 14 15 to 19 20 to 24 25 to 44 45 to 64 65 & older Not stated
1a. X-ing at intersect or X-walk 2 4 7 6 2 4 3 2 30 1 1b. X-ing not at intersection 2 1 2 4 2 11 1 2a. Walking in road with traffic 2b. Same against traffic 3. Standing in roadway 1 1 4. Push or work on veh in road 5. Other working in roadway 6. Playing in roadway 7. Other in roadway 1 1 8. Not in roadway 1 1 1 2 5 9. Not stated
46 10 94852 48 2 Totals
7. AGE OF DRIVER All Crashes Fatal Injury 1. 14 & younger 2. 15 9 4 3. 16 130 65 4. 17 175 2 82 5. 18 240 1 129 6. 19 240 1 129 7. 20 188 103 8. 21 186 2 111 9. 22 to 24 488 3 241 10. 25 to 34 1,327 10 711 11. 35 to 44 1,066 4 565 12. 45 to 54 1,019 7 545 13. 55 to 64 708 5 369 14. 65 to 74 341 164 15. 75 & older 273 1 126 16. Not stated 717 108 Totals 7,107 36 3,452 8. SEX OF DRIVER Injury Fatal All Crashes
1. Male 3,796 30 1,771 2. Female 3,130 6 1,615 3. Not stated 181 66 Totals 7,107 36 3,452
9. RESIDENCE OF DRIVER All Crashes Fatal Injury
1. Local resident 5,919 24 2,992 2. In-state resident 591 8 285 3. Non resident 183 4 76 4. Not stated 414 99 Totals 7,107 36 3,452
10. CRASHES BY CONTRIBUTING FACTOR All InjuryFatal1. Speed too fast
289 19 38
130 29
7. Followed too closely 686 1 8 1
48 105 262
63
6. Improper overtaking5. Drove left of center4. Disregard traffic signal3. Passed stop sign2. Failed to yield 929 1 475
718 19 1,295
8. Made improper turn
Totals 4,338 43 2,111 261
2 42 68 40
4 9
534 9
148 113 146
12. Other 11. Mechanical defect10. Improper driving9. Had been drinking
12. ROAD SURFACECONDITION InjuryFatalAll
1. Dry 2,547 14 1,2452. Wet 951 5 4753. Snowy or icy 100 3 394. Other 5. Not stated 98 2 5Totals 3,696 24 1,764
13. LIGHT CONDITION InjuryFatalAll1. Daylight 2,611 10 1,2382. Dawn or Dusk 232 1 1023. Darkness 847 13 4234. Not stated 6 1Totals 3,696 24 1,764
11. VEHICLE TYPE InjuryFatalAll1. Passenger car 6,964 30 3,3452. Pass Car and trailer 53 2 223. Truck or truck tractor 24. Truck tractor with semi-trailer 103 2 405. Other truck combination 4 16. Farm tractor and/or equip. 7 57. Taxicab 1 18. Bus 5 29. School bus 9 510. Motorcycle 56 2 4811. Motor scooter or moped 1 112. Others and not stated 8Totals 7,213 36 3,470Special vehicles included above 13. Log trucks14. Emergency (incl. private) 12 515. Military vehicles 16. Other public vehicles 22 8
11 6 4 10 3 3 6 9 7 16 3. County and Local Roads 2 1 1 2 2 1 2 3 4. City Streets
5. Not Stated 36 3 13 15 2 30 9 13 1 23 22 28 3 53 Total--Rural Area
NOTE: THIS YEAR TO DATE represents only those crashes entered onto the database as of the date above. SAME PERIOD LAST YEAR represents all crashes including late reports. MAJOR INJURIES are incapacitating injuries. MINOR INJURIES are non-incapacitating evident injuries.
3. LOCATION Total
PropertyDamage
Nonfatal Injury Fatal Property
DamageNonfatal
InjuryFatalTotalPropertyDamage
Nonfatal Injury Fatal Total Killed Injured
Total On Roadway TotalOff Roadway Number Of Crashes Number Of Persons
1. Below 1,000 2. 1,000 to 2,500 3. 2,501 to 5,000 4. 5,001 to 10,000 5. 10,001 to 25,000 6. 25,001 to 50,000 7. 50,001 to 100,000 8. 100,001 to 200,000 9. City of Portland Only Total - Municipalities
3 3
6
2 1 2 1
4 2
2 1 3 2 2
4 1 5
1 1
1 1
2 2
4
1. Primary State Highways 2. Secondary State Highways 3. County and Local Roads 4. City Streets 5. Not Stated Total--Urban Area 6. Interstate System 7. Other State Freeways 8. Other State Highways Total--Urban System
6. Interstate System 15 1 9 5 6 3 3 9 1 6 2 1 97. Other State Freeways 8. Other State Highways 19 2 10 7 9 1 5 3 10 1 5 4 2 14Total--Rural System 34 3 19 12 15 1 8 6 19 2 11 6 3 23
June 1, 2007
MORROW COUNTY
264
At I
nter
sect
ion
Not
at I
nter
sect
ion
At
Inte
r. N
on -I
nter
.
MORROW COUNTY 2006 OREGON CRASHES
4. AGE OF CASUALTY
Number of Persons Killed Number of Persons Injured Total Killed Pedestrians Pedalcyclist Total Injured Pedestrians Pedalcyclist
Total Total Total Total Total TotalMale Male Male Male Male MaleFemale Female Female Female Female Female1. 0 to 4 2. 5 to 9 3. 10 to 14 1 14. 15 to 19 4 5 9 1 1 5. 20 to 24 1 2 36. 25 to 34 2 5 77. 35 to 44 2 4 68. 45 to 54 2 2 49. 55 to 64 1 1 1 110. 65 to 74 1 2 3 1 1 11. 75 & older 1 112. Not-stated 1Totals 3 2 1 36 21 14
Directional Analysis - A crash consisting of a series of collisions, overturning, etc., is classified according to the first damage or injury producing event; includes on roadway and off roadway.5A. MULTIPLE VEH CRASH Total Fatal Injury P.D.O.
1. Entering at angle 1 1 2a. Same dir.- both straight 1 1 2b. Same-1 turn, 1 straight 2c. Same-one stopped 2 2 2d. Same-all others 3a. Opposite dir.- both straight 3b. Opposite-1 turn, 1 straight 3c. Opposite-all others 4. Not stated Totals 1 3 4
5B. MULTIPLE VEH CRASH Total Fatal Injury P.D.O.1. Moving in opposite dir.
1 4 52. Both moving in same dir. 1 1 23a. One car parked
3b. One car stopped in traffic 2 24. Enter/Leave parked pos.
Junction1. Car go straight2. Car turning right3. Car turning left 4. Car backing 5. All othersTotals
5D. ALL OTHER CRASHES Total Fatal Injury P.D.O.Coll-isionWith
Coll-isionWith
1. Other rd veh or railway train2. Fixed object 3 2 5 3. Other object or animal4. Overturning 1 1 5. Other noncollision6. Other rd veh or railway train7. Fixed object 6 2 1 9 8. Other object or animal 6 1 7 9. Overturning 4 13 1 18 10. Other noncollision11. Not statedTotals 1918 3 40
6. PEDESTRIAN ACTION BY AGE
Ages of Pedstrians Killed and InjuredPedestrians Killed Total 0 to 4 5 to 9 10 to 14 15 to 19 20 to 24 25 to 44 45 to 64 65 & older Not stated
1a. X-ing at intersect or X-walk 1b. X-ing not at intersection 2a. Walking in road with traffic 2b. Same against traffic 3. Standing in roadway 4. Push or work on veh in road 5. Other working in roadway 6. Playing in roadway 7. Other in roadway 8. Not in roadway 9. Not stated Totals
7. AGE OF DRIVER All Crashes Fatal Injury 1. 14 & younger 2. 15 3. 16 4 2 4. 17 4 2 5. 18 3 3 6. 19 3 1 2 7. 20 4 2 8. 21 9. 22 to 24 2 10. 25 to 34 16 9 11. 35 to 44 9 6 12. 45 to 54 7 5 13. 55 to 64 5 1 1 14. 65 to 74 3 1 2 15. 75 & older 2 1 16. Not stated 2 2 Totals 64 3 37 8. SEX OF DRIVER Injury Fatal All Crashes
1. Male 43 2 24 2. Female 19 1 11 3. Not stated 2 2 Totals 64 3 37
9. RESIDENCE OF DRIVER All Crashes Fatal Injury
1. Local resident 35 1 22 2. In-state resident 17 10 3. Non resident 10 2 3 4. Not stated 2 2 Totals 64 3 37
10. CRASHES BY CONTRIBUTING FACTOR All InjuryFatal1. Speed too fast
3 1
7. Followed too closely 3 1
1
6. Improper overtaking5. Drove left of center4. Disregard traffic signal3. Passed stop sign2. Failed to yield 3 2
13 2 24
8. Made improper turn
Totals 53 3 29 7
1 2
1 16
1 3 1
12. Other 11. Mechanical defect10. Improper driving9. Had been drinking
12. ROAD SURFACECONDITION InjuryFatalAll
1. Dry 44 3 252. Wet 5 13. Snowy or icy 3 24. Other 5. Not stated 1Totals 53 3 28
13. LIGHT CONDITION InjuryFatalAll1. Daylight 30 2 182. Dawn or Dusk 4 13. Darkness 19 1 94. Not statedTotals 53 3 28
11. VEHICLE TYPE InjuryFatalAll1. Passenger car 56 2 322. Pass Car and trailer 3 33. Truck or truck tractor 1 14. Truck tractor with semi-trailer 6 1 25. Other truck combination 6. Farm tractor and/or equip. 7. Taxicab8. Bus 9. School bus 10. Motorcycle 11. Motor scooter or moped 12. Others and not stated Totals 66 3 38Special vehicles included above 13. Log trucks14. Emergency (incl. private) 15. Military vehicles 16. Other public vehicles 1 1
14. MANNER OF COLLISION InjuryFatalAll
1. Head-on2. Rear end 8 73. Angle 2 14. Sideswipe-meeting 5. Sideswipe-overtaking 16. Backed into 7. Other 2 2Totals 13 10
11. Count of vehicles, including properly parked vehicles.
Totals include participant records where gender was coded as "unknown".
10. Count of crashes. Crashes with multiple contributing circumstances are counted in all applicable categories.
MULTIPLE VEHICLE CRASHES
7 - 9. Tally of drivers by age, sex, residence & crash severity. Excludes occupants of properly & improperly parked vehicles.
265
Col
lisio
n in
volv
ing:
N
on-
coll.
N
on-
coll.
C
ollis
ion
invo
lvin
g:
Non
- co
ll.
Col
lisio
n in
volv
ing:
3C
. RU
RA
L 3A
. Inc
orpo
rate
d A
reas
3B
. UR
BA
N
SUMMARY OF MOTOR VEHICLE TRAFFIC CRASHES 2006 OREGON CRASHESForIn
NOTE: THIS YEAR TO DATE represents only those crashes entered onto the database as of the date above. SAME PERIOD LAST YEAR represents all crashes including late reports. MAJOR INJURIES are incapacitating injuries. MINOR INJURIES are non-incapacitating evident injuries.
3. LOCATION Total
PropertyDamage
Nonfatal Injury Fatal Property
DamageNonfatal
InjuryFatalTotalPropertyDamage
Nonfatal Injury Fatal Total Killed Injured
Total On Roadway TotalOff Roadway Number Of Crashes Number Of Persons
1. Below 1,000 2. 1,000 to 2,500 3. 2,501 to 5,000 4. 5,001 to 10,000 5. 10,001 to 25,000 6. 25,001 to 50,000 7. 50,001 to 100,000 8. 100,001 to 200,000 9. City of Portland Only Total - Municipalities
Directional Analysis - A crash consisting of a series of collisions, overturning, etc., is classified according to the first damage or injury producing event; includes on roadway and off roadway.5A. MULTIPLE VEH CRASH Total Fatal Injury P.D.O.
5B. MULTIPLE VEH CRASH Total Fatal Injury P.D.O. 141 130 5 2761. Moving in opposite dir.
1,032 469 2 1,5032. Both moving in same dir. 211 63 1 2753a. One car parked
1,432 1,128 2 2,5623b. One car stopped in traffic 87 15 1024. Enter/Leave parked pos. 69 31 1005a. Entering driveway/alley
274 95 3695b. Leaving driveway/alley 146 109 2556. All others
Totals 3,392 2,040 10 5,442
5C. PEDESTRIANCRASHES
All PedCrashes
Fatal Crashes Non-Fatal Injury Crashes
TotalAt
Intersection Non-
Junction TotalAt
IntersectionNon-
Junction1. Car go straight 124 7 5 2 117 48 692. Car turning right 32 32 26 63. Car turning left 71 1 1 70 61 94. Car backing 3 3 35. All others 1 1 1Totals 231 8 6 2 223 135 88
5D. ALL OTHER CRASHES Total Fatal Injury P.D.O.Coll-isionWith
Coll-isionWith
1. Other rd veh or railway train 12 159 171 2. Fixed object 67 38 2 107 3. Other object or animal 1 1 4. Overturning 1 4 5 5. Other noncollision 2 1 3 6. Other rd veh or railway train 5 72 1 78 7. Fixed object 271 241 7 519 8. Other object or animal 26 16 42 9. Overturning 7 30 2 39 10. Other noncollision 12 3 1 16 11. Not statedTotals 402565 14 981
6. PEDESTRIAN ACTION BY AGE
Ages of Pedstrians Killed and InjuredPedestrians Killed Total 0 to 4 5 to 9 10 to 14 15 to 19 20 to 24 25 to 44 45 to 64 65 & older Not stated
1a. X-ing at intersect or X-walk 9 12 47 38 13 21 7 1 4 152 6 1b. X-ing not at intersection 3 1 8 15 9 10 7 3 3 59 1 2a. Walking in road with traffic 1 1 2 2b. Same against traffic 2 2 3. Standing in roadway 1 2 1 1 5 4. Push or work on veh in road 5. Other working in roadway 1 1 6. Playing in roadway 2 2 7. Other in roadway 1 1 1 1 4 8. Not in roadway 1 1 3 8 2 5 1 21 1 9. Not stated
1415 61 662538157 7 248 8 Totals
7. AGE OF DRIVER All Crashes Fatal Injury 1. 14 & YOUNGER 3 1 2. 15 15 1 5 3. 16 192 81 4. 17 328 150 5. 18 485 1 251 6. 19 451 221 7. 20 465 1 227 8. 21 466 1 231 9. 22 to 24 1,441 5 704 10. 25 to 34 4,358 15 2,095 11. 35 to 44 3,802 10 1,759 12. 45 to 54 3,530 11 1,532 13. 55 to 64 2,430 7 1,060 14. 65 to 74 898 2 353 15. 75 & older 636 1 251 16. Not stated 3,060 1 472 Totals 22,560 56 9,393 8. SEX OF DRIVER Injury Fatal All Crashes
1. Male 12,404 43 4,990 2. Female 9,360 12 4,158 3. Not stated 796 1 245 Totals 22,560 56 9,393
9. RESIDENCE OF DRIVER All Crashes Fatal Injury
1. Local resident 17,978 43 7,783 2. In-state resident 852 4 394 3. Non resident 1,848 8 747 4. Not stated 1,882 1 469 Totals 22,560 56 9,393
10. CRASHES BY CONTRIBUTING FACTOR All InjuryFatal1. Speed too fast
1,864 26 25
425 129
7. Followed too closely 4,191 3 1 3 2 2
104 58
932 265
6. Improper overtaking5. Drove left of center4. Disregard traffic signal3. Passed stop sign2. Failed to yield 2,615 9 1,174
406 17 820
8. Made improper turn
Totals 13,285 67 5,666 685
37 510 201 184
6 1
10 13
1,760 81
1,477 349 633
12. Other 11. Mechanical defect10. Improper driving9. Had been drinking
12. ROAD SURFACECONDITION InjuryFatalAll
1. Dry 7,996 23 3,3742. Wet 3,049 11 1,3203. Snowy or icy 128 1 484. Other 5. Not stated 244 3 15Totals 11,417 38 4,757
13. LIGHT CONDITION InjuryFatalAll1. Daylight 8,298 16 3,4312. Dawn or Dusk 471 2 1953. Darkness 2,620 19 1,1264. Not stated 28 1 5Totals 11,417 38 4,757
11. VEHICLE TYPE InjuryFatalAll1. Passenger car 22,115 47 9,1252. Pass Car and trailer 79 273. Truck or truck tractor 170 2 684. Truck tractor with semi-trailer 355 3 1145. Other truck combination 7 26. Farm tractor and/or equip. 7. Taxicab 36 208. Bus 107 1 439. School bus 39 1010. Motorcycle 121 6 9311. Motor scooter or moped 21 1512. Others and not stated 61 22Totals 23,111 59 9,539Special vehicles included above 13. Log trucks14. Emergency (incl. private) 88 3 3315. Military vehicles 116. Other public vehicles 177 1 63
NOTE: THIS YEAR TO DATE represents only those crashes entered onto the database as of the date above. SAME PERIOD LAST YEAR represents all crashes including late reports. MAJOR INJURIES are incapacitating injuries. MINOR INJURIES are non-incapacitating evident injuries.
3. LOCATION Total
PropertyDamage
Nonfatal Injury Fatal Property
DamageNonfatal
InjuryFatalTotalPropertyDamage
Nonfatal Injury Fatal Total Killed Injured
Total On Roadway TotalOff Roadway Number Of Crashes Number Of Persons
1. Below 1,000 2. 1,000 to 2,500 3. 2,501 to 5,000 4. 5,001 to 10,000 5. 10,001 to 25,000 6. 25,001 to 50,000 7. 50,001 to 100,000 8. 100,001 to 200,000 9. City of Portland Only Total - Municipalities
1 1 1 1 2
89 84
154 330
1 1
45 44 38 46
74 80
158 172
1 1 2
39 34 73 35 37 72
65 60 125
140 133 273
6 10 16 3 9 12
9 20 29
18 39 57
2
69 57
103
231
60 11 5 16 28 34 62 39 39 78 1. Primary State Highways 91 3 6 9 59 53 112 62 59 121 2. Secondary State Highways 14 4 4 5 4 9 5 8 13 3. County and Local Roads 98 25 9 34 56 62 118 81 71 152 4. City Streets
5. Not Stated Total--Urban Area 26339 24 63148153301187 177 364 6. Interstate System 7. Other State Freeways 35 16 19 23 12 11 12 4 8 258. Other State Highways 164 82 82 151 75 76 13 7 6 126Total--Urban System 199 98 101 174 87 87 25 11 14 151
6. Interstate System 7. Other State Freeways 8. Other State Highways 230 4 122 104 154 3 84 67 76 1 38 37 5 229Total--Rural System 230 4 122 104 154 3 84 67 76 1 38 37 5 229
June 1, 2007
POLK COUNTY
268
At I
nter
sect
ion
Not
at I
nter
sect
ion
At
Inte
r. N
on -I
nter
.
POLK COUNTY 2006 OREGON CRASHES
4. AGE OF CASUALTY
Number of Persons Killed Number of Persons Injured Total Killed Pedestrians Pedalcyclist Total Injured Pedestrians Pedalcyclist
Total Total Total Total Total TotalMale Male Male Male Male MaleFemale Female Female Female Female Female1. 0 to 4 3 7 102. 5 to 9 2 1 1 11 11 223. 10 to 14 1 2 12 5 17 14. 15 to 19 3 1 3 45 43 88 15. 20 to 24 3 1 1 1 2 47 44 916. 25 to 34 1 1 1 29 52 81 2 1 1 17. 35 to 44 1 2 1 45 38 83 2 2 28. 45 to 54 2 45 33 78 4 3 1 29. 55 to 64 3 1 2 39 24 6310. 65 to 74 1 1 14 11 25 1 1 11. 75 & older 2 12 12 24 212. Not-stated 2 2 6 8 2Totals 9 5 4 590 286 304 14 9 5 13 11 2
Directional Analysis - A crash consisting of a series of collisions, overturning, etc., is classified according to the first damage or injury producing event; includes on roadway and off roadway.5A. MULTIPLE VEH CRASH Total Fatal Injury P.D.O.
5B. MULTIPLE VEH CRASH Total Fatal Injury P.D.O. 12 25 2 391. Moving in opposite dir. 27 28 552. Both moving in same dir. 17 9 263a. One car parked 45 57 1023b. One car stopped in traffic
20 3 235b. Leaving driveway/alley 9 3 126. All others
Totals 136 128 2 266
5C. PEDESTRIANCRASHES
All PedCrashes
Fatal Crashes Non-Fatal Injury Crashes
TotalAt
Intersection Non-
Junction TotalAt
IntersectionNon-
Junction1. Car go straight 7 7 3 42. Car turning right3. Car turning left 2 2 24. Car backing5. All othersTotals 9 9 5 4
5D. ALL OTHER CRASHES Total Fatal Injury P.D.O.Coll-isionWith
Coll-isionWith
1. Other rd veh or railway train 7 7 2. Fixed object 11 2 13 3. Other object or animal 1 1 4. Overturning 2 2 5. Other noncollision 1 1 6. Other rd veh or railway train 6 1 7 7. Fixed object 63 80 1 144 8. Other object or animal 16 5 21 9. Overturning 4 10 2 16 10. Other noncollision11. Not statedTotals 95113 4 212
6. PEDESTRIAN ACTION BY AGE
Ages of Pedstrians Killed and InjuredPedestrians Killed Total 0 to 4 5 to 9 10 to 14 15 to 19 20 to 24 25 to 44 45 to 64 65 & older Not stated
1a. X-ing at intersect or X-walk 2 2 1 1 6 1b. X-ing not at intersection 1 1 1 3 2a. Walking in road with traffic 2b. Same against traffic 3. Standing in roadway 4. Push or work on veh in road 1 1 5. Other working in roadway 6. Playing in roadway 7. Other in roadway 8. Not in roadway 1 3 4 9. Not stated
1 3 2332 14 Totals
7. AGE OF DRIVER All Crashes Fatal Injury 1. 14 & younger 2. 15 1 1 3. 16 28 15 4. 17 39 25 5. 18 62 33 6. 19 47 24 7. 20 42 22 8. 21 39 1 18 9. 22 to 24 101 1 60 10. 25 to 34 168 4 93 11. 35 to 44 160 2 95 12. 45 to 54 184 4 104 13. 55 to 64 158 84 14. 65 to 74 52 1 27 15. 75 & older 45 22 16. Not stated 77 7 Totals 1,203 13 630 8. SEX OF DRIVER Injury Fatal All Crashes
1. Male 679 10 341 2. Female 516 3 288 3. Not stated 8 1 Totals 1,203 13 630
9. RESIDENCE OF DRIVER All Crashes Fatal Injury
1. Local resident 983 12 519 2. In-state resident 164 1 91 3. Non resident 29 16 4. Not stated 27 4 Totals 1,203 13 630
10. CRASHES BY CONTRIBUTING FACTOR All InjuryFatal1. Speed too fast
75 3
11 5 8
7. Followed too closely 144
1 1
5 23
9 13
6. Improper overtaking5. Drove left of center4. Disregard traffic signal3. Passed stop sign2. Failed to yield 176 2 92
88 1 144
8. Made improper turn
Totals 928 16 507 89 11 93 23
9
1 1 6 3
174 19
169 33 19
12. Other 11. Mechanical defect10. Improper driving9. Had been drinking
12. ROAD SURFACECONDITION InjuryFatalAll
1. Dry 471 6 2472. Wet 170 923. Snowy or icy 39 184. Other 5. Not stated 15 1 2Totals 695 7 359
13. LIGHT CONDITION InjuryFatalAll1. Daylight 481 4 2482. Dawn or Dusk 46 2 233. Darkness 167 1 874. Not stated 1 1Totals 695 7 359
11. VEHICLE TYPE InjuryFatalAll1. Passenger car 1,162 9 6142. Pass Car and trailer 13 1 33. Truck or truck tractor 15 74. Truck tractor with semi-trailer 17 35. Other truck combination 4 16. Farm tractor and/or equip. 7. Taxicab 1 18. Bus 3 29. School bus 110. Motorcycle 15 3 1011. Motor scooter or moped 12. Others and not stated 8 2Totals 1,239 13 643Special vehicles included above 13. Log trucks 4 114. Emergency (incl. private) 7 115. Military vehicles 16. Other public vehicles 6 2
14. MANNER OF COLLISION InjuryFatalAll
1. Head-on 20 1 122. Rear end 228 1213. Angle 173 1 864. Sideswipe-meeting 20 1 125. Sideswipe-overtaking 17 26. Backed into 10 17. Other 6 3Totals 474 3 237
11. Count of vehicles, including properly parked vehicles.
Totals include participant records where gender was coded as "unknown".
10. Count of crashes. Crashes with multiple contributing circumstances are counted in all applicable categories.
MULTIPLE VEHICLE CRASHES
7 - 9. Tally of drivers by age, sex, residence & crash severity. Excludes occupants of properly & improperly parked vehicles.
269
Col
lisio
n in
volv
ing:
N
on-
coll.
N
on-
coll.
C
ollis
ion
invo
lvin
g:
Non
- co
ll.
Col
lisio
n in
volv
ing:
3C
. RU
RA
L 3A
. Inc
orpo
rate
d A
reas
3B
. UR
BA
N
SUMMARY OF MOTOR VEHICLE TRAFFIC CRASHES 2006 OREGON CRASHESForIn
NOTE: THIS YEAR TO DATE represents only those crashes entered onto the database as of the date above. SAME PERIOD LAST YEAR represents all crashes including late reports. MAJOR INJURIES are incapacitating injuries. MINOR INJURIES are non-incapacitating evident injuries.
3. LOCATION Total
PropertyDamage
Nonfatal Injury Fatal Property
DamageNonfatal
InjuryFatalTotalPropertyDamage
Nonfatal Injury Fatal Total Killed Injured
Total On Roadway TotalOff Roadway Number Of Crashes Number Of Persons
1. Below 1,000 2. 1,000 to 2,500 3. 2,501 to 5,000 4. 5,001 to 10,000 5. 10,001 to 25,000 6. 25,001 to 50,000 7. 50,001 to 100,000 8. 100,001 to 200,000 9. City of Portland Only Total - Municipalities
4 1 3 1 4 1 3
4 1 3 1 3 4 1
1. Primary State Highways 2. Secondary State Highways 3. County and Local Roads 4. City Streets 5. Not Stated Total--Urban Area 6. Interstate System 7. Other State Freeways 8. Other State Highways Total--Urban System
6. Interstate System 6 3 3 1 1 0 5 2 3 77. Other State Freeways 8. Other State Highways 26 1 15 10 6 2 4 20 1 13 6 1 26Total--Rural System 32 1 18 13 7 3 4 25 1 15 9 1 33
June 1, 2007
SHERMAN COUNTY
270
At I
nter
sect
ion
Not
at I
nter
sect
ion
At
Inte
r. N
on -I
nter
.
SHERMAN COUNTY 2006 OREGON CRASHES
4. AGE OF CASUALTY
Number of Persons Killed Number of Persons Injured Total Killed Pedestrians Pedalcyclist Total Injured Pedestrians Pedalcyclist
Total Total Total Total Total TotalMale Male Male Male Male MaleFemale Female Female Female Female Female1. 0 to 4 2. 5 to 9 3. 10 to 14 1 1 24. 15 to 19 4 45. 20 to 24 3 1 46. 25 to 34 2 1 37. 35 to 44 3 6 98. 45 to 54 1 2 39. 55 to 64 2 4 6 1 1 10. 65 to 74 1 1 211. 75 & older 12. Not-stated 3 1 4Totals 1 1 37 17 20
Directional Analysis - A crash consisting of a series of collisions, overturning, etc., is classified according to the first damage or injury producing event; includes on roadway and off roadway.5A. MULTIPLE VEH CRASH Total Fatal Injury P.D.O.
1. Entering at angle 2 2 2a. Same dir.- both straight 2b. Same-1 turn, 1 straight 2c. Same-one stopped 2d. Same-all others 3a. Opposite dir.- both straight 3b. Opposite-1 turn, 1 straight 3c. Opposite-all others 4. Not stated Totals 2 2
5B. MULTIPLE VEH CRASH Total Fatal Injury P.D.O. 1 11. Moving in opposite dir.
1 12. Both moving in same dir. 3a. One car parked
1 13b. One car stopped in traffic 4. Enter/Leave parked pos. 5a. Entering driveway/alley 5b. Leaving driveway/alley 6. All others Totals 2 1 3
5C. PEDESTRIANCRASHES
All PedCrashes
Fatal Crashes Non-Fatal Injury Crashes
TotalAt
Intersection Non-
Junction TotalAt
IntersectionNon-
Junction1. Car go straight2. Car turning right3. Car turning left 4. Car backing 5. All othersTotals
5D. ALL OTHER CRASHES Total Fatal Injury P.D.O.Coll-isionWith
Coll-isionWith
1. Other rd veh or railway train2. Fixed object 1 1 2 3. Other object or animal4. Overturning 5. Other noncollision 6. Other rd veh or railway train7. Fixed object 8 12 1 21 8. Other object or animal 1 1 9. Overturning 3 6 9 10. Other noncollision 2 2 11. Not statedTotals 1321 1 35
6. PEDESTRIAN ACTION BY AGE
Ages of Pedstrians Killed and InjuredPedestrians Killed Total 0 to 4 5 to 9 10 to 14 15 to 19 20 to 24 25 to 44 45 to 64 65 & older Not stated
1a. X-ing at intersect or X-walk 1b. X-ing not at intersection 2a. Walking in road with traffic 2b. Same against traffic 3. Standing in roadway 4. Push or work on veh in road 5. Other working in roadway 6. Playing in roadway 7. Other in roadway 8. Not in roadway 9. Not stated Totals
7. AGE OF DRIVER All Crashes Fatal Injury 1. 14 & younger 2. 15 3. 16 1 4. 17 5. 18 2 1 6. 19 1 7. 20 2 1 8. 21 1 1 9. 22 to 24 3 1 10. 25 to 34 4 2 11. 35 to 44 9 1 5 12. 45 to 54 5 3 13. 55 to 64 10 5 14. 65 to 74 3 3 15. 75 & older 1 16. Not stated 3 1 Totals 45 1 23 8. SEX OF DRIVER Injury Fatal All Crashes
1. Male 29 1 15 2. Female 15 7 3. Not stated 1 1 Totals 45 1 23
9. RESIDENCE OF DRIVER All Crashes Fatal Injury
1. Local resident 16 9 2. In-state resident 12 1 7 3. Non resident 14 6 4. Not stated 3 1 Totals 45 1 23
10. CRASHES BY CONTRIBUTING FACTOR All InjuryFatal1. Speed too fast
17. Followed too closely 1
16. Improper overtaking5. Drove left of center4. Disregard traffic signal3. Passed stop sign2. Failed to yield 2
9 17
8. Made improper turn
Totals 37 1 19 6
2
1 1
8 1 5 1 1
12. Other 11. Mechanical defect10. Improper driving9. Had been drinking
12. ROAD SURFACECONDITION InjuryFatalAll
1. Dry 24 1 132. Wet 4 33. Snowy or icy 11 64. Other 5. Not stated 1Totals 40 1 22
13. LIGHT CONDITION InjuryFatalAll1. Daylight 22 112. Dawn or Dusk 5 33. Darkness 13 1 84. Not statedTotals 40 1 22
11. VEHICLE TYPE InjuryFatalAll1. Passenger car 35 1 172. Pass Car and trailer 3. Truck or truck tractor 4. Truck tractor with semi-trailer 7 35. Other truck combination 6. Farm tractor and/or equip. 7. Taxicab 8. Bus 9. School bus10. Motorcycle 3 311. Motor scooter or moped 12. Others and not stated Totals 45 1 23Special vehicles included above 13. Log trucks14. Emergency (incl. private) 15. Military vehicles 16. Other public vehicles
14. MANNER OF COLLISION InjuryFatalAll
1. Head-on2. Rear end 1 13. Angle 24. Sideswipe-meeting 15. Sideswipe-overtaking 6. Backed into 17. OtherTotals 5 1
11. Count of vehicles, including properly parked vehicles.
Totals include participant records where gender was coded as "unknown".
10. Count of crashes. Crashes with multiple contributing circumstances are counted in all applicable categories.
MULTIPLE VEHICLE CRASHES
7 - 9. Tally of drivers by age, sex, residence & crash severity. Excludes occupants of properly & improperly parked vehicles.
271
Col
lisio
n in
volv
ing:
N
on-
coll.
N
on-
coll.
C
ollis
ion
invo
lvin
g:
Non
- co
ll.
Col
lisio
n in
volv
ing:
3C
. RU
RA
L 3A
. Inc
orpo
rate
d A
reas
3B
. UR
BA
N
SUMMARY OF MOTOR VEHICLE TRAFFIC CRASHES 2006 OREGON CRASHESForIn
28 2 27 19 1 47 20 6 1 27 47 25 2 74 3. County and Local Roads 12 3 3 17 9 26 20 9 29 4. City Streets
5. Not Stated 209 4 71 70 1 142 133 74 2 209 204 144 3 351 Total--Rural Area
NOTE: THIS YEAR TO DATE represents only those crashes entered onto the database as of the date above. SAME PERIOD LAST YEAR represents all crashes including late reports. MAJOR INJURIES are incapacitating injuries. MINOR INJURIES are non-incapacitating evident injuries.
3. LOCATION Total
PropertyDamage
Nonfatal Injury Fatal Property
DamageNonfatal
InjuryFatalTotalPropertyDamage
Nonfatal Injury Fatal Total Killed Injured
Total On Roadway TotalOff Roadway Number Of Crashes Number Of Persons
1. Below 1,000 2. 1,000 to 2,500 3. 2,501 to 5,000 4. 5,001 to 10,000 5. 10,001 to 25,000 6. 25,001 to 50,000 7. 50,001 to 100,000 8. 100,001 to 200,000 9. City of Portland Only Total - Municipalities
15 9 6 12 13 7 6 2 2 9
67
91
6 3 12 55
27 64
6 3 9 11 48 59
24 57 81
1 7 8
3 7 10
12 16
40
1. Primary State Highways 2. Secondary State Highways 3. County and Local Roads 4. City Streets 5. Not Stated Total--Urban Area 6. Interstate System 7. Other State Freeways 8. Other State Highways Total--Urban System
6. Interstate System 7. Other State Freeways 8. Other State Highways 248 1 110 137 156 1 59 96 92 51 41 2 169Total--Rural System 248 1 110 137 156 1 59 96 92 51 41 2 169
June 1, 2007
TILLAMOOK COUNTY
272
At I
nter
sect
ion
Not
at I
nter
sect
ion
At
Inte
r. N
on -I
nter
.
TILLAMOOK COUNTY 2006 OREGON CRASHES
4. AGE OF CASUALTY
Number of Persons Killed Number of Persons Injured Total Killed Pedestrians Pedalcyclist Total Injured Pedestrians Pedalcyclist
Total Total Total Total Total TotalMale Male Male Male Male MaleFemale Female Female Female Female Female1. 0 to 4 1 12. 5 to 9 1 1 2 3 53. 10 to 14 4 1 54. 15 to 19 1 1 2 1 22 17 39 15. 20 to 24 1 1 1 9 8 17 1 1 16. 25 to 34 14 12 267. 35 to 44 18 11 29 1 18. 45 to 54 15 16 319. 55 to 64 17 7 2410. 65 to 74 11 9 20 2 1 111. 75 & older 4 3 712. Not-stated 1 1 1 4 5Totals 4 2 2 209 92 117 3 2 1 4 2 2
Directional Analysis - A crash consisting of a series of collisions, overturning, etc., is classified according to the first damage or injury producing event; includes on roadway and off roadway.5A. MULTIPLE VEH CRASH Total Fatal Injury P.D.O.
Junction1. Car go straight 3 3 1 22. Car turning right3. Car turning left 4. Car backing 5. All othersTotals 3 3 1 2
5D. ALL OTHER CRASHES Total Fatal Injury P.D.O.Coll-isionWith
Coll-isionWith
1. Other rd veh or railway train 1 1 2. Fixed object 3 3 3. Other object or animal4. Overturning 5. Other noncollision6. Other rd veh or railway train 3 3 7. Fixed object 55 61 1 117 8. Other object or animal 20 4 24 9. Overturning 6 4 10 10. Other noncollision 1 1 11. Not statedTotals 8474 1 159
6. PEDESTRIAN ACTION BY AGE
Ages of Pedstrians Killed and InjuredPedestrians Killed Total 0 to 4 5 to 9 10 to 14 15 to 19 20 to 24 25 to 44 45 to 64 65 & older Not stated
1a. X-ing at intersect or X-walk 1 1 1b. X-ing not at intersection 1 1 2 2a. Walking in road with traffic 2b. Same against traffic 3. Standing in roadway 4. Push or work on veh in road 5. Other working in roadway 6. Playing in roadway 7. Other in roadway 8. Not in roadway 9. Not stated
111 3 Totals
7. AGE OF DRIVER All Crashes Fatal Injury 1. 14 & younger 2. 15 3. 16 11 7 4. 17 25 14 5. 18 17 7 6. 19 12 5 7. 20 10 5 8. 21 11 3 9. 22 to 24 27 1 7 10. 25 to 34 77 1 29 11. 35 to 44 71 1 34 12. 45 to 54 92 1 38 13. 55 to 64 78 36 14. 65 to 74 46 1 20 15. 75 & older 33 12 16. Not stated 32 2 Totals 542 5 219 8. SEX OF DRIVER Injury Fatal All Crashes
1. Male 344 4 121 2. Female 193 1 97 3. Not stated 5 1 Totals 542 5 219
9. RESIDENCE OF DRIVER All Crashes Fatal Injury
1. Local resident 366 2 145 2. In-state resident 121 2 52 3. Non resident 49 1 21 4. Not stated 6 1 Totals 542 5 219
10. CRASHES BY CONTRIBUTING FACTOR All InjuryFatal1. Speed too fast
3 4
10
4
7. Followed too closely 3 1 18
23 3 4
6. Improper overtaking5. Drove left of center4. Disregard traffic signal3. Passed stop sign2. Failed to yield 49 1 22
79 1 169
8. Made improper turn
Totals 360 5 147 6 1
13 3 2
1 1
29 2
41 7
12
12. Other 11. Mechanical defect10. Improper driving9. Had been drinking
12. ROAD SURFACECONDITION InjuryFatalAll
1. Dry 220 1 882. Wet 94 2 403. Snowy or icy 37 164. Other 5. Not statedTotals 351 3 144
13. LIGHT CONDITION InjuryFatalAll1. Daylight 263 3 1132. Dawn or Dusk 7 33. Darkness 81 284. Not statedTotals 351 3 144
11. VEHICLE TYPE InjuryFatalAll1. Passenger car 503 3 1962. Pass Car and trailer 13 53. Truck or truck tractor 5 1 34. Truck tractor with semi-trailer 12 45. Other truck combination 6. Farm tractor and/or equip. 2 17. Taxicab8. Bus 19. School bus10. Motorcycle 10 1011. Motor scooter or moped 1 112. Others and not stated 7 1 1Totals 554 5 221Special vehicles included above 13. Log trucks14. Emergency (incl. private) 115. Military vehicles 16. Other public vehicles 6 1
14. MANNER OF COLLISION InjuryFatalAll
1. Head-on 11 2 42. Rear end 62 273. Angle 67 274. Sideswipe-meeting 14 65. Sideswipe-overtaking 17 26. Backed into 127. Other 6 1Totals 189 2 67
11. Count of vehicles, including properly parked vehicles.
Totals include participant records where gender was coded as "unknown".
10. Count of crashes. Crashes with multiple contributing circumstances are counted in all applicable categories.
MULTIPLE VEHICLE CRASHES
7 - 9. Tally of drivers by age, sex, residence & crash severity. Excludes occupants of properly & improperly parked vehicles.
273
Col
lisio
n in
volv
ing:
N
on-
coll.
N
on-
coll.
C
ollis
ion
invo
lvin
g:
Non
- co
ll.
Col
lisio
n in
volv
ing:
3C
. RU
RA
L 3A
. Inc
orpo
rate
d A
reas
3B
. UR
BA
N
SUMMARY OF MOTOR VEHICLE TRAFFIC CRASHES 2006 OREGON CRASHESForIn
NOTE: THIS YEAR TO DATE represents only those crashes entered onto the database as of the date above. SAME PERIOD LAST YEAR represents all crashes including late reports. MAJOR INJURIES are incapacitating injuries. MINOR INJURIES are non-incapacitating evident injuries.
3. LOCATION Total
PropertyDamage
Nonfatal Injury Fatal Property
DamageNonfatal
InjuryFatalTotalPropertyDamage
Nonfatal Injury Fatal Total Killed Injured
Total On Roadway TotalOff Roadway Number Of Crashes Number Of Persons
1. Below 1,000 2. 1,000 to 2,500 3. 2,501 to 5,000 4. 5,001 to 10,000 5. 10,001 to 25,000 6. 25,001 to 50,000 7. 50,001 to 100,000 8. 100,001 to 200,000 9. City of Portland Only Total - Municipalities
9 2 2 7 7 2 7 9 3. County and Local Roads 67 20 7 27 52 42 94 72 49 121 4. City Streets
5. Not Stated Total--Urban Area 195132 14 461421251268174 139 1 314 6. Interstate System 4 2 2 1 1 3 1 2 27. Other State Freeways 8. Other State Highways 180 1 81 98 166 75 90 14 6 8 1 117Total--Urban System 184 1 83 100 167 1 76 90 17 7 10 1 119
6. Interstate System 111 3 47 61 38 1 17 20 73 2 30 41 3 977. Other State Freeways 8. Other State Highways 125 2 56 67 75 2 31 42 50 25 25 2 88Total--Rural System 236 5 103 128 113 3 48 62 123 2 55 66 5 185
June 1, 2007
UMATILLA COUNTY
274
At I
nter
sect
ion
Not
at I
nter
sect
ion
At
Inte
r. N
on -I
nter
.
UMATILLA COUNTY 2006 OREGON CRASHES
4. AGE OF CASUALTY
Number of Persons Killed Number of Persons Injured Total Killed Pedestrians Pedalcyclist Total Injured Pedestrians Pedalcyclist
Total Total Total Total Total TotalMale Male Male Male Male MaleFemale Female Female Female Female Female1. 0 to 4 1 1 6 3 92. 5 to 9 1 1 7 8 15 1 1 3. 10 to 14 2 2 1 1 11 20 31 24. 15 to 19 2 51 34 85 2 2 25. 20 to 24 2 2 2 29 31 60 26. 25 to 34 40 26 66 2 1 1 1 1 7. 35 to 44 27 29 56 1 1 8. 45 to 54 1 1 1 29 28 57 2 2 19. 55 to 64 16 8 2410. 65 to 74 5 7 1211. 75 & older 1 1 9 7 16 1 1 1 1 12. Not-stated 2 2Totals 9 6 3 2 1 1 433 203 230 8 6 2 7 7
Directional Analysis - A crash consisting of a series of collisions, overturning, etc., is classified according to the first damage or injury producing event; includes on roadway and off roadway.5A. MULTIPLE VEH CRASH Total Fatal Injury P.D.O.
Junction1. Car go straight 9 2 1 1 7 2 52. Car turning right 3. Car turning left 4. Car backing 1 1 15. All othersTotals 10 2 1 1 8 2 6
5D. ALL OTHER CRASHES Total Fatal Injury P.D.O.Coll-isionWith
Coll-isionWith
1. Other rd veh or railway train 4 4 2. Fixed object 4 3 7 3. Other object or animal4. Overturning5. Other noncollision 1 1 2 6. Other rd veh or railway train 2 3 5 7. Fixed object 64 39 103 8. Other object or animal 24 9 33 9. Overturning 32 32 3 67 10. Other noncollision 4 3 1 8 11. Not statedTotals 13194 4 229
6. PEDESTRIAN ACTION BY AGE
Ages of Pedstrians Killed and InjuredPedestrians Killed Total 0 to 4 5 to 9 10 to 14 15 to 19 20 to 24 25 to 44 45 to 64 65 & older Not stated
1a. X-ing at intersect or X-walk 1 1 1 3 1 1b. X-ing not at intersection 1 1 1 1 4 2a. Walking in road with traffic 1 1 1 2b. Same against traffic 3. Standing in roadway 4. Push or work on veh in road 5. Other working in roadway 6. Playing in roadway 1 1 2 7. Other in roadway 8. Not in roadway 9. Not stated
2 1 1221 1 10 2 Totals
7. AGE OF DRIVER All Crashes Fatal Injury 1. 14 & younger 2. 15 4 2 3. 16 20 1 10 4. 17 48 25 5. 18 37 1 17 6. 19 34 1 16 7. 20 40 25 8. 21 25 12 9. 22 to 24 60 29 10. 25 to 34 192 1 85 11. 35 to 44 164 3 76 12. 45 to 54 163 3 76 13. 55 to 64 88 32 14. 65 to 74 61 1 27 15. 75 & older 52 1 17 16. Not stated 46 14 Totals 1,034 12 463 8. SEX OF DRIVER Injury Fatal All Crashes
1. Male 578 10 249 2. Female 436 2 205 3. Not stated 20 9 Totals 1,034 12 463
9. RESIDENCE OF DRIVER All Crashes Fatal Injury
1. Local resident 720 8 339 2. In-state resident 114 2 45 3. Non resident 171 2 68 4. Not stated 29 11 Totals 1,034 12 463
10. CRASHES BY CONTRIBUTING FACTOR All InjuryFatal1. Speed too fast
45 5 5
13 8
7. Followed too closely 75 1
1 11 11 23 15
6. Improper overtaking5. Drove left of center4. Disregard traffic signal3. Passed stop sign2. Failed to yield 129 1 65
79 4 180
8. Made improper turn
Totals 645 9 284 29
2 13 9
11
1
1
95 5
46 14 41
12. Other 11. Mechanical defect10. Improper driving9. Had been drinking
12. ROAD SURFACECONDITION InjuryFatalAll
1. Dry 447 7 2132. Wet 86 1 333. Snowy or icy 95 294. Other 5. Not stated 12 1 2Totals 640 9 277
13. LIGHT CONDITION InjuryFatalAll1. Daylight 445 6 2022. Dawn or Dusk 50 2 163. Darkness 144 1 594. Not stated 1Totals 640 9 277
11. VEHICLE TYPE InjuryFatalAll1. Passenger car 958 10 4322. Pass Car and trailer 21 83. Truck or truck tractor 10 44. Truck tractor with semi-trailer 54 1 175. Other truck combination 5 26. Farm tractor and/or equip. 17. Taxicab 18. Bus9. School bus 210. Motorcycle 13 1 1111. Motor scooter or moped 12. Others and not stated 8 1Totals 1,073 12 475Special vehicles included above 13. Log trucks 4 114. Emergency (incl. private) 115. Military vehicles 16. Other public vehicles 9 4
14. MANNER OF COLLISION InjuryFatalAll
1. Head-on 11 2 62. Rear end 121 1 663. Angle 193 874. Sideswipe-meeting 4 15. Sideswipe-overtaking 42 96. Backed into 23 47. Other 7 2Totals 401 3 175
11. Count of vehicles, including properly parked vehicles.
Totals include participant records where gender was coded as "unknown".
10. Count of crashes. Crashes with multiple contributing circumstances are counted in all applicable categories.
MULTIPLE VEHICLE CRASHES
7 - 9. Tally of drivers by age, sex, residence & crash severity. Excludes occupants of properly & improperly parked vehicles.
275
Col
lisio
n in
volv
ing:
N
on-
coll.
N
on-
coll.
C
ollis
ion
invo
lvin
g:
Non
- co
ll.
Col
lisio
n in
volv
ing:
3C
. RU
RA
L 3A
. Inc
orpo
rate
d A
reas
3B
. UR
BA
N
SUMMARY OF MOTOR VEHICLE TRAFFIC CRASHES 2006 OREGON CRASHESForIn
NOTE: THIS YEAR TO DATE represents only those crashes entered onto the database as of the date above. SAME PERIOD LAST YEAR represents all crashes including late reports. MAJOR INJURIES are incapacitating injuries. MINOR INJURIES are non-incapacitating evident injuries.
3. LOCATION Total
PropertyDamage
Nonfatal Injury Fatal Property
DamageNonfatal
InjuryFatalTotalPropertyDamage
Nonfatal Injury Fatal Total Killed Injured
Total On Roadway TotalOff Roadway Number Of Crashes Number Of Persons
1. Below 1,000 2. 1,000 to 2,500 3. 2,501 to 5,000 4. 5,001 to 10,000 5. 10,001 to 25,000 6. 25,001 to 50,000 7. 50,001 to 100,000 8. 100,001 to 200,000 9. City of Portland Only Total - Municipalities
5 1 4 1 5 1 4 4
75
84
4
17 58
18 66
4 4
15 53 68
16 61 77
2 5 7
2 5 7
22
23
9 3 1 4 15 6 21 18 7 25 1. Primary State Highways 2. Secondary State Highways 3. County and Local Roads
14 2 1 3 38 10 48 40 11 51 4. City Streets 5. Not Stated Total--Urban Area 235 2 753166958 18 76 6. Interstate System 2 2 2 27. Other State Freeways 8. Other State Highways 23 7 16 21 6 15 2 1 1 9Total--Urban System 25 7 18 21 6 15 4 1 3 9
6. Interstate System 93 2 38 53 25 8 17 68 2 30 36 2 527. Other State Freeways 8. Other State Highways 47 2 24 21 26 1 9 16 21 1 15 5 2 32Total--Rural System 140 4 62 74 51 1 17 33 89 3 45 41 4 84
June 1, 2007
UNION COUNTY
276
At I
nter
sect
ion
Not
at I
nter
sect
ion
At
Inte
r. N
on -I
nter
.
UNION COUNTY 2006 OREGON CRASHES
4. AGE OF CASUALTY
Number of Persons Killed Number of Persons Injured Total Killed Pedestrians Pedalcyclist Total Injured Pedestrians Pedalcyclist
Total Total Total Total Total TotalMale Male Male Male Male MaleFemale Female Female Female Female Female1. 0 to 4 1 1 2 22. 5 to 9 2 23. 10 to 14 1 2 1 3 3 6 24. 15 to 19 14 15 295. 20 to 24 1 1 2 6 8 1 1 6. 25 to 34 5 12 17 2 2 7. 35 to 44 7 7 148. 45 to 54 7 15 22 1 1 9. 55 to 64 5 8 1310. 65 to 74 3 6 911. 75 & older 2 212. Not-stated Totals 4 4 124 74 50 3 3 2 2
Directional Analysis - A crash consisting of a series of collisions, overturning, etc., is classified according to the first damage or injury producing event; includes on roadway and off roadway.5A. MULTIPLE VEH CRASH Total Fatal Injury P.D.O.
5B. MULTIPLE VEH CRASH Total Fatal Injury P.D.O. 11 6 171. Moving in opposite dir.
9 8 172. Both moving in same dir. 3 1 43a. One car parked
24 5 293b. One car stopped in traffic 1 1 24. Enter/Leave parked pos. 1 15a. Entering driveway/alley 7 1 85b. Leaving driveway/alley 5 56. All others
Totals 61 22 83
5C. PEDESTRIANCRASHES
All PedCrashes
Fatal Crashes Non-Fatal Injury Crashes
TotalAt
Intersection Non-
Junction TotalAt
IntersectionNon-
Junction1. Car go straight 2 2 22. Car turning right3. Car turning left 1 1 14. Car backing5. All othersTotals 3 3 1 2
5D. ALL OTHER CRASHES Total Fatal Injury P.D.O.Coll-isionWith
Coll-isionWith
1. Other rd veh or railway train 2 2 2. Fixed object 2 2 3. Other object or animal4. Overturning 1 1 5. Other noncollision6. Other rd veh or railway train 1 1 7. Fixed object 49 54 2 105 8. Other object or animal 13 3 16 9. Overturning 1 1 1 3 10. Other noncollision 1 1 11. Not statedTotals 6860 3 131
6. PEDESTRIAN ACTION BY AGE
Ages of Pedstrians Killed and InjuredPedestrians Killed Total 0 to 4 5 to 9 10 to 14 15 to 19 20 to 24 25 to 44 45 to 64 65 & older Not stated
1a. X-ing at intersect or X-walk 1 1 1b. X-ing not at intersection 1 1 2 2a. Walking in road with traffic 2b. Same against traffic 3. Standing in roadway 4. Push or work on veh in road 5. Other working in roadway 6. Playing in roadway 7. Other in roadway 8. Not in roadway 9. Not stated
11 1 3 Totals
7. AGE OF DRIVER All Crashes Fatal Injury 1. 14 & younger 2. 15 2 1 3. 16 12 9 4. 17 14 7 5. 18 16 1 4 6. 19 12 7 7. 20 9 8. 21 8 2 9. 22 to 24 23 7 10. 25 to 34 46 2 16 11. 35 to 44 49 20 12. 45 to 54 79 1 28 13. 55 to 64 43 13 14. 65 to 74 22 5 15. 75 & older 14 3 16. Not stated 32 1 Totals 381 5 122 8. SEX OF DRIVER Injury Fatal All Crashes
1. Male 238 5 79 2. Female 138 42 3. Not stated 5 1 Totals 381 5 122
9. RESIDENCE OF DRIVER All Crashes Fatal Injury
1. Local resident 252 2 69 2. In-state resident 46 24 3. Non resident 74 3 28 4. Not stated 9 1 Totals 381 5 122
10. CRASHES BY CONTRIBUTING FACTOR All InjuryFatal1. Speed too fast
2 3 4 2 1
7. Followed too closely 5 7 8 5 6
6. Improper overtaking5. Drove left of center4. Disregard traffic signal3. Passed stop sign2. Failed to yield 45 1 9
63 3 146
8. Made improper turn
Totals 304 5 116 6
21 4 1
1
23 1
51 5 2
12. Other 11. Mechanical defect10. Improper driving9. Had been drinking
12. ROAD SURFACECONDITION InjuryFatalAll
1. Dry 152 3 592. Wet 25 1 43. Snowy or icy 81 304. Other 5. Not stated 1Totals 259 4 93
13. LIGHT CONDITION InjuryFatalAll1. Daylight 162 2 632. Dawn or Dusk 13 43. Darkness 84 2 264. Not statedTotals 259 4 93
11. VEHICLE TYPE InjuryFatalAll1. Passenger car 333 4 1052. Pass Car and trailer 8 23. Truck or truck tractor 4 14. Truck tractor with semi-trailer 37 1 145. Other truck combination 26. Farm tractor and/or equip. 17. Taxicab8. Bus 9. School bus10. Motorcycle 2 211. Motor scooter or moped 12. Others and not stated Totals 387 5 124Special vehicles included above 13. Log trucks 1 114. Emergency (incl. private) 1 115. Military vehicles 16. Other public vehicles 1
14. MANNER OF COLLISION InjuryFatalAll
1. Head-on 2 22. Rear end 32 93. Angle 54 1 84. Sideswipe-meeting 12 65. Sideswipe-overtaking 12 46. Backed into 97. Other 4 1Totals 125 1 30
11. Count of vehicles, including properly parked vehicles.
Totals include participant records where gender was coded as "unknown".
10. Count of crashes. Crashes with multiple contributing circumstances are counted in all applicable categories.
MULTIPLE VEHICLE CRASHES
7 - 9. Tally of drivers by age, sex, residence & crash severity. Excludes occupants of properly & improperly parked vehicles.
277
Col
lisio
n in
volv
ing:
N
on-
coll.
N
on-
coll.
C
ollis
ion
invo
lvin
g:
Non
- co
ll.
Col
lisio
n in
volv
ing:
3C
. RU
RA
L 3A
. Inc
orpo
rate
d A
reas
3B
. UR
BA
N
SUMMARY OF MOTOR VEHICLE TRAFFIC CRASHES 2006 OREGON CRASHESForIn
11 9 8 17 5 2 7 14 10 24 1. Primary State Highways 1 1 1 1 1 2 2 1 3 2. Secondary State Highways 5 2 3 3 1 7 3 1 4 6 4 1 11 3. County and Local Roads 4 1 1 5 3 8 6 3 9 4. City Streets
5. Not Stated 21 2 14 11 1 26 14 7 21 28 18 1 47 Total--Rural Area
NOTE: THIS YEAR TO DATE represents only those crashes entered onto the database as of the date above. SAME PERIOD LAST YEAR represents all crashes including late reports. MAJOR INJURIES are incapacitating injuries. MINOR INJURIES are non-incapacitating evident injuries.
3. LOCATION Total
PropertyDamage
Nonfatal Injury Fatal Property
DamageNonfatal
InjuryFatalTotalPropertyDamage
Nonfatal Injury Fatal Total Killed Injured
Total On Roadway TotalOff Roadway Number Of Crashes Number Of Persons
1. Below 1,000 2. 1,000 to 2,500 3. 2,501 to 5,000 4. 5,001 to 10,000 5. 10,001 to 25,000 6. 25,001 to 50,000 7. 50,001 to 100,000 8. 100,001 to 200,000 9. City of Portland Only Total - Municipalities
1 1 1 1 10
11
3 7
3 8
3 6 9
3 7 10
1 1
1 1
4
4
1. Primary State Highways 2. Secondary State Highways 3. County and Local Roads 4. City Streets 5. Not Stated Total--Urban Area 6. Interstate System 7. Other State Freeways 8. Other State Highways Total--Urban System
6. Interstate System 7. Other State Freeways 8. Other State Highways 27 11 16 9 3 6 18 8 10 12Total--Rural System 27 11 16 9 3 6 18 8 10 12
June 1, 2007
WALLOWA COUNTY
278
At I
nter
sect
ion
Not
at I
nter
sect
ion
At
Inte
r. N
on -I
nter
.
WALLOWA COUNTY 2006 OREGON CRASHES
4. AGE OF CASUALTY
Number of Persons Killed Number of Persons Injured Total Killed Pedestrians Pedalcyclist Total Injured Pedestrians Pedalcyclist
Total Total Total Total Total TotalMale Male Male Male Male MaleFemale Female Female Female Female Female1. 0 to 4 2. 5 to 9 3. 10 to 14 1 14. 15 to 19 5 2 75. 20 to 24 1 16. 25 to 34 2 2 1 1 7. 35 to 44 1 1 2 1 1 8. 45 to 54 2 3 59. 55 to 64 3 310. 65 to 74 11. 75 & older 12. Not-stated Totals 2 2 21 11 10
Directional Analysis - A crash consisting of a series of collisions, overturning, etc., is classified according to the first damage or injury producing event; includes on roadway and off roadway.5A. MULTIPLE VEH CRASH Total Fatal Injury P.D.O.
1. Entering at angle 1 1 2a. Same dir.- both straight 2b. Same-1 turn, 1 straight 2c. Same-one stopped 2d. Same-all others 3a. Opposite dir.- both straight 3b. Opposite-1 turn, 1 straight 2 2 3c. Opposite-all others 4. Not stated Totals 3 3
5B. MULTIPLE VEH CRASH Total Fatal Injury P.D.O. 2 21. Moving in opposite dir.
1 1 22. Both moving in same dir. 3a. One car parked
3 2 53b. One car stopped in traffic 1 14. Enter/Leave parked pos.
Junction1. Car go straight2. Car turning right3. Car turning left 4. Car backing 5. All othersTotals
5D. ALL OTHER CRASHES Total Fatal Injury P.D.O.Coll-isionWith
Coll-isionWith
1. Other rd veh or railway train2. Fixed object 1 1 3. Other object or animal4. Overturning 5. Other noncollision 6. Other rd veh or railway train7. Fixed object 12 11 1 24 8. Other object or animal 5 5 9. Overturning10. Other noncollision 1 1 11. Not statedTotals 1812 1 31
6. PEDESTRIAN ACTION BY AGE
Ages of Pedstrians Killed and InjuredPedestrians Killed Total 0 to 4 5 to 9 10 to 14 15 to 19 20 to 24 25 to 44 45 to 64 65 & older Not stated
1a. X-ing at intersect or X-walk 1b. X-ing not at intersection 2a. Walking in road with traffic 2b. Same against traffic 3. Standing in roadway 4. Push or work on veh in road 5. Other working in roadway 6. Playing in roadway 7. Other in roadway 8. Not in roadway 9. Not stated Totals
7. AGE OF DRIVER All Crashes Fatal Injury 1. 14 & younger 2. 15 3. 16 2 1 4. 17 2 2 5. 18 5 4 6. 19 1 7. 20 1 8. 21 9. 22 to 24 2 1 10. 25 to 34 5 1 11. 35 to 44 15 1 6 12. 45 to 54 11 4 13. 55 to 64 8 4 14. 65 to 74 3 15. 75 & older 3 16. Not stated 5 2 Totals 63 1 25 8. SEX OF DRIVER Injury Fatal All Crashes
1. Male 35 1 12 2. Female 25 11 3. Not stated 3 2 Totals 63 1 25
9. RESIDENCE OF DRIVER All Crashes Fatal Injury
1. Local resident 48 18 2. In-state resident 6 3 3. Non resident 7 1 2 4. Not stated 2 2 Totals 63 1 25
10. CRASHES BY CONTRIBUTING FACTOR All InjuryFatal1. Speed too fast
1 1
7. Followed too closely 2 16. Improper overtaking
5. Drove left of center4. Disregard traffic signal3. Passed stop sign2. Failed to yield 3
12 1 25
8. Made improper turn
Totals 58 2 22 1
5 1 1
1
7 1
15 2 2
12. Other 11. Mechanical defect10. Improper driving9. Had been drinking
12. ROAD SURFACECONDITION InjuryFatalAll
1. Dry 30 1 112. Wet 2 13. Snowy or icy 15 64. Other 5. Not statedTotals 47 1 18
13. LIGHT CONDITION InjuryFatalAll1. Daylight 32 122. Dawn or Dusk 23. Darkness 13 1 64. Not statedTotals 47 1 18
11. VEHICLE TYPE InjuryFatalAll1. Passenger car 57 1 202. Pass Car and trailer 3 23. Truck or truck tractor 14. Truck tractor with semi-trailer 1 15. Other truck combination 6. Farm tractor and/or equip. 7. Taxicab 8. Bus 9. School bus10. Motorcycle 3 311. Motor scooter or moped 12. Others and not stated Totals 65 1 26Special vehicles included above 13. Log trucks14. Emergency (incl. private) 115. Military vehicles 16. Other public vehicles
14. MANNER OF COLLISION InjuryFatalAll
1. Head-on 1 12. Rear end 3 23. Angle 5 14. Sideswipe-meeting 5. Sideswipe-overtaking 1 16. Backed into 47. Other 2 1Totals 16 6
11. Count of vehicles, including properly parked vehicles.
Totals include participant records where gender was coded as "unknown".
10. Count of crashes. Crashes with multiple contributing circumstances are counted in all applicable categories.
MULTIPLE VEHICLE CRASHES
7 - 9. Tally of drivers by age, sex, residence & crash severity. Excludes occupants of properly & improperly parked vehicles.
279
Col
lisio
n in
volv
ing:
N
on-
coll.
N
on-
coll.
C
ollis
ion
invo
lvin
g:
Non
- co
ll.
Col
lisio
n in
volv
ing:
3C
. RU
RA
L 3A
. Inc
orpo
rate
d A
reas
3B
. UR
BA
N
SUMMARY OF MOTOR VEHICLE TRAFFIC CRASHES 2006 OREGON CRASHESForIn
NOTE: THIS YEAR TO DATE represents only those crashes entered onto the database as of the date above. SAME PERIOD LAST YEAR represents all crashes including late reports. MAJOR INJURIES are incapacitating injuries. MINOR INJURIES are non-incapacitating evident injuries.
3. LOCATION Total
PropertyDamage
Nonfatal Injury Fatal Property
DamageNonfatal
InjuryFatalTotalPropertyDamage
Nonfatal Injury Fatal Total Killed Injured
Total On Roadway TotalOff Roadway Number Of Crashes Number Of Persons
1. Below 1,000 2. 1,000 to 2,500 3. 2,501 to 5,000 4. 5,001 to 10,000 5. 10,001 to 25,000 6. 25,001 to 50,000 7. 50,001 to 100,000 8. 100,001 to 200,000 9. City of Portland Only Total - Municipalities
7 3 4 4 3 1 2 4 2 2
117
124
52 65
55 69
44 48 92
45 50 95
8 17 25
10 19 29
70
74
11 4 3 7 7 6 13 11 9 20 1. Primary State Highways 1 1 1 1 1 2. Secondary State Highways 3 1 1 2 1 1 1 2 3 3. County and Local Roads
58 14 5 19 44 37 81 58 42 100 4. City Streets 5. Not Stated Total--Urban Area 7319 9 2851459670 54 124 6. Interstate System 13 6 7 7 3 4 6 3 3 77. Other State Freeways 8. Other State Highways 8 4 4 7 4 3 1 1 5Total--Urban System 21 10 11 14 7 7 7 3 4 12
6. Interstate System 42 18 24 17 8 9 25 10 15 217. Other State Freeways 8. Other State Highways 62 5 30 27 23 3 11 9 39 2 19 18 9 52Total--Rural System 104 5 48 51 40 3 19 18 64 2 29 33 9 73
June 1, 2007
WASCO COUNTY
280
At I
nter
sect
ion
Not
at I
nter
sect
ion
At
Inte
r. N
on -I
nter
.
WASCO COUNTY 2006 OREGON CRASHES
4. AGE OF CASUALTY
Number of Persons Killed Number of Persons Injured Total Killed Pedestrians Pedalcyclist Total Injured Pedestrians Pedalcyclist
Total Total Total Total Total TotalMale Male Male Male Male MaleFemale Female Female Female Female Female1. 0 to 4 2 1 3 1 1 2. 5 to 9 1 1 2 1 33. 10 to 14 1 2 1 4 2 6 24. 15 to 19 1 18 6 24 2 1 1 15. 20 to 24 1 1 7 12 19 2 1 16. 25 to 34 1 1 16 11 277. 35 to 44 1 1 1 1 9 11 20 2 2 8. 45 to 54 1 2 1 9 13 22 29. 55 to 64 2 1 1 12 18 30 1 110. 65 to 74 1 7 8 1 111. 75 & older 5 3 812. Not-stated 1 1 2Totals 9 5 4 172 86 86 8 6 2 6 5 1
Directional Analysis - A crash consisting of a series of collisions, overturning, etc., is classified according to the first damage or injury producing event; includes on roadway and off roadway.5A. MULTIPLE VEH CRASH Total Fatal Injury P.D.O.
Junction1. Car go straight 6 6 1 52. Car turning right 1 1 13. Car turning left 1 1 14. Car backing5. All othersTotals 8 8 2 6
5D. ALL OTHER CRASHES Total Fatal Injury P.D.O.Coll-isionWith
Coll-isionWith
1. Other rd veh or railway train 4 4 2. Fixed object 3 4 7 3. Other object or animal 1 1 4. Overturning 1 1 5. Other noncollision6. Other rd veh or railway train 2 2 7. Fixed object 42 34 1 77 8. Other object or animal 19 3 1 23 9. Overturning 5 13 2 20 10. Other noncollision 1 1 2 11. Not statedTotals 7261 4 137
6. PEDESTRIAN ACTION BY AGE
Ages of Pedstrians Killed and InjuredPedestrians Killed Total 0 to 4 5 to 9 10 to 14 15 to 19 20 to 24 25 to 44 45 to 64 65 & older Not stated
1a. X-ing at intersect or X-walk 1 1 2 1b. X-ing not at intersection 1 1 1 3 2a. Walking in road with traffic 2b. Same against traffic 3. Standing in roadway 1 1 2 4. Push or work on veh in road 5. Other working in roadway 1 1 6. Playing in roadway 7. Other in roadway 8. Not in roadway 9. Not stated
3 2111 8 Totals
7. AGE OF DRIVER All Crashes Fatal Injury 1. 14 & younger 2. 15 3. 16 8 5 4. 17 6 3 5. 18 10 3 6. 19 19 8 7. 20 12 1 3 8. 21 9 5 9. 22 to 24 26 1 11 10. 25 to 34 58 1 29 11. 35 to 44 61 2 30 12. 45 to 54 56 24 13. 55 to 64 58 1 28 14. 65 to 74 18 1 7 15. 75 & older 25 11 16. Not stated 22 4 Totals 388 7 171 8. SEX OF DRIVER Injury Fatal All Crashes
1. Male 211 6 94 2. Female 172 1 76 3. Not stated 5 1 Totals 388 7 171
9. RESIDENCE OF DRIVER All Crashes Fatal Injury
1. Local resident 245 4 108 2. In-state resident 77 2 39 3. Non resident 57 1 21 4. Not stated 9 3 Totals 388 7 171
10. CRASHES BY CONTRIBUTING FACTOR All InjuryFatal1. Speed too fast
13
1 1
7. Followed too closely 20 2 3 2 6
6. Improper overtaking5. Drove left of center4. Disregard traffic signal3. Passed stop sign2. Failed to yield 51 24
44 3 93
8. Made improper turn
Totals 331 9 147 18
4 36 5 1
1
3 2
55 7
80 9 3
12. Other 11. Mechanical defect10. Improper driving9. Had been drinking
12. ROAD SURFACECONDITION InjuryFatalAll
1. Dry 164 1 712. Wet 45 3 233. Snowy or icy 51 1 254. Other 5. Not stated 9 1Totals 269 5 120
13. LIGHT CONDITION InjuryFatalAll1. Daylight 173 1 802. Dawn or Dusk 16 1 13. Darkness 80 3 394. Not statedTotals 269 5 120
11. VEHICLE TYPE InjuryFatalAll1. Passenger car 364 7 1602. Pass Car and trailer 10 43. Truck or truck tractor 11 24. Truck tractor with semi-trailer 23 95. Other truck combination 6. Farm tractor and/or equip. 7. Taxicab 8. Bus 9. School bus10. Motorcycle 2 211. Motor scooter or moped 1 112. Others and not stated Totals 411 7 178Special vehicles included above 13. Log trucks 2 114. Emergency (incl. private) 4 215. Military vehicles 16. Other public vehicles 3 1
14. MANNER OF COLLISION InjuryFatalAll
1. Head-on 6 1 22. Rear end 33 203. Angle 52 184. Sideswipe-meeting 35. Sideswipe-overtaking 17 96. Backed into 3 17. Other 10 1Totals 124 1 51
11. Count of vehicles, including properly parked vehicles.
Totals include participant records where gender was coded as "unknown".
10. Count of crashes. Crashes with multiple contributing circumstances are counted in all applicable categories.
MULTIPLE VEHICLE CRASHES
7 - 9. Tally of drivers by age, sex, residence & crash severity. Excludes occupants of properly & improperly parked vehicles.
281
Col
lisio
n in
volv
ing:
N
on-
coll.
N
on-
coll.
C
ollis
ion
invo
lvin
g:
Non
- co
ll.
Col
lisio
n in
volv
ing:
3C
. RU
RA
L 3A
. Inc
orpo
rate
d A
reas
3B
. UR
BA
N
SUMMARY OF MOTOR VEHICLE TRAFFIC CRASHES 2006 OREGON CRASHESForIn
205 6 45 71 3 119 90 73 3 166 135 144 6 285 3. County and Local Roads 6 1 1 2 3 3 6 4 4 8 4. City Streets
5. Not Stated 387 16 72 105 7 184 144 132 8 284 216 237 15 468 Total--Rural Area
NOTE: THIS YEAR TO DATE represents only those crashes entered onto the database as of the date above. SAME PERIOD LAST YEAR represents all crashes including late reports. MAJOR INJURIES are incapacitating injuries. MINOR INJURIES are non-incapacitating evident injuries.
3. LOCATION Total
PropertyDamage
Nonfatal Injury Fatal Property
DamageNonfatal
InjuryFatalTotalPropertyDamage
Nonfatal Injury Fatal Total Killed Injured
Total On Roadway TotalOff Roadway Number Of Crashes Number Of Persons
1. Below 1,000 2. 1,000 to 2,500 3. 2,501 to 5,000 4. 5,001 to 10,000 5. 10,001 to 25,000 6. 25,001 to 50,000 7. 50,001 to 100,000 8. 100,001 to 200,000 9. City of Portland Only Total - Municipalities
Directional Analysis - A crash consisting of a series of collisions, overturning, etc., is classified according to the first damage or injury producing event; includes on roadway and off roadway.5A. MULTIPLE VEH CRASH Total Fatal Injury P.D.O.
Junction1. Car go straight 36 3 1 2 33 12 212. Car turning right 16 16 11 53. Car turning left 21 21 19 24. Car backing5. All othersTotals 73 3 1 2 70 42 28
5D. ALL OTHER CRASHES Total Fatal Injury P.D.O.Coll-isionWith
Coll-isionWith
1. Other rd veh or railway train 54 2 56 2. Fixed object 40 26 1 67 3. Other object or animal4. Overturning 2 3 5 5. Other noncollision 1 3 4 6. Other rd veh or railway train 28 1 29 7. Fixed object 216 224 12 452 8. Other object or animal 19 5 1 25 9. Overturning 10 18 28 10. Other noncollision 4 9 13 11. Not statedTotals 292370 17 679
6. PEDESTRIAN ACTION BY AGE
Ages of Pedstrians Killed and InjuredPedestrians Killed Total 0 to 4 5 to 9 10 to 14 15 to 19 20 to 24 25 to 44 45 to 64 65 & older Not stated
1a. X-ing at intersect or X-walk 5 16 13 4 6 4 48 1 1b. X-ing not at intersection 2 2 9 1 3 2 1 20 1 2a. Walking in road with traffic 2b. Same against traffic 3. Standing in roadway 1 1 2 1 4. Push or work on veh in road 5. Other working in roadway 6. Playing in roadway 7. Other in roadway 1 1 8. Not in roadway 2 2 3 1 8 9. Not stated
19 21 2551161 79 3 Totals
7. AGE OF DRIVER All Crashes Fatal Injury 1. 14 & younger 2. 15 14 3 3. 16 219 101 4. 17 278 139 5. 18 327 2 150 6. 19 266 3 143 7. 20 281 2 148 8. 21 286 2 151 9. 22 to 24 750 5 370 10. 25 to 34 2,369 12 1,134 11. 35 to 44 2,132 8 1,031 12. 45 to 54 1,798 8 897 13. 55 to 64 1,168 4 534 14. 65 to 74 437 4 190 15. 75 & older 334 2 137 16. Not stated 1,219 1 153 Totals 11,878 53 5,281 8. SEX OF DRIVER Injury Fatal All Crashes
1. Male 6,348 33 2,746 2. Female 5,304 20 2,468 3. Not stated 226 67 Totals 11,878 53 5,281
9. RESIDENCE OF DRIVER All Crashes Fatal Injury
1. Local resident 10,233 41 4,701 2. In-state resident 625 4 297 3. Non resident 340 5 143 4. Not stated 680 3 140 Totals 11,878 53 5,281
10. CRASHES BY CONTRIBUTING FACTOR All InjuryFatal1. Speed too fast
768 20 34
206 40
7. Followed too closely 1,879 4
1
67 72
382 81
6. Improper overtaking5. Drove left of center4. Disregard traffic signal3. Passed stop sign2. Failed to yield 1,203 5 529
681 16 1,262
8. Made improper turn
Totals 6,678 56 3,010 440
25 122 76 69
3
11 15
1
921 49
359 139 264
12. Other 11. Mechanical defect10. Improper driving9. Had been drinking
12. ROAD SURFACECONDITION InjuryFatalAll
1. Dry 4,155 24 1,8922. Wet 1,559 7 6783. Snowy or icy 122 1 474. Other 5. Not stated 141 1 12Totals 5,977 33 2,629
13. LIGHT CONDITION InjuryFatalAll1. Daylight 4,204 12 1,8262. Dawn or Dusk 384 2 1453. Darkness 1,372 18 6554. Not stated 17 1 3Totals 5,977 33 2,629
11. VEHICLE TYPE InjuryFatalAll1. Passenger car 11,425 51 5,0892. Pass Car and trailer 52 173. Truck or truck tractor 67 244. Truck tractor with semi-trailer 97 355. Other truck combination 6 26. Farm tractor and/or equip. 17. Taxicab 3 38. Bus 27 139. School bus 22 910. Motorcycle 96 2 7811. Motor scooter or moped 5 412. Others and not stated 204 44Totals 12,005 53 5,318Special vehicles included above 13. Log trucks 1 114. Emergency (incl. private) 30 1315. Military vehicles 1 116. Other public vehicles 73 26
15 2 10 12 2 2 4 4 12 16 1. Primary State Highways 2 1 1 1 1 2 2 2. Secondary State Highways 5 1 1 1 1 1 2 1 1 1 3 3. County and Local Roads
4. City Streets 5. Not Stated
22 1 2 11 1 14 3 4 7 5 15 1 21 Total--Rural Area
NOTE: THIS YEAR TO DATE represents only those crashes entered onto the database as of the date above. SAME PERIOD LAST YEAR represents all crashes including late reports. MAJOR INJURIES are incapacitating injuries. MINOR INJURIES are non-incapacitating evident injuries.
3. LOCATION Total
PropertyDamage
Nonfatal Injury Fatal Property
DamageNonfatal
InjuryFatalTotalPropertyDamage
Nonfatal Injury Fatal Total Killed Injured
Total On Roadway TotalOff Roadway Number Of Crashes Number Of Persons
1. Below 1,000 2. 1,000 to 2,500 3. 2,501 to 5,000 4. 5,001 to 10,000 5. 10,001 to 25,000 6. 25,001 to 50,000 7. 50,001 to 100,000 8. 100,001 to 200,000 9. City of Portland Only Total - Municipalities
1 1 1 1 1
1 1 1 1 1
1. Primary State Highways 2. Secondary State Highways 3. County and Local Roads 4. City Streets 5. Not Stated Total--Urban Area 6. Interstate System 7. Other State Freeways 8. Other State Highways Total--Urban System
6. Interstate System 7. Other State Freeways 8. Other State Highways 18 14 4 5 3 2 13 11 2 17Total--Rural System 18 14 4 5 3 2 13 11 2 17
June 1, 2007
WHEELER COUNTY
284
At I
nter
sect
ion
Not
at I
nter
sect
ion
At
Inte
r. N
on -I
nter
.
WHEELER COUNTY 2006 OREGON CRASHES
4. AGE OF CASUALTY
Number of Persons Killed Number of Persons Injured Total Killed Pedestrians Pedalcyclist Total Injured Pedestrians Pedalcyclist
Total Total Total Total Total TotalMale Male Male Male Male MaleFemale Female Female Female Female Female1. 0 to 4 1 12. 5 to 9 3. 10 to 14 1 14. 15 to 19 2 1 35. 20 to 24 6. 25 to 34 3 37. 35 to 44 2 3 58. 45 to 54 1 2 3 1 1 9. 55 to 64 1 3 410. 65 to 74 1 111. 75 & older 1 112. Not-stated Totals 1 1 22 15 7
Directional Analysis - A crash consisting of a series of collisions, overturning, etc., is classified according to the first damage or injury producing event; includes on roadway and off roadway.5A. MULTIPLE VEH CRASH Total Fatal Injury P.D.O.
1. Entering at angle 1 1 2a. Same dir.- both straight 2b. Same-1 turn, 1 straight 2c. Same-one stopped 2d. Same-all others 3a. Opposite dir.- both straight 3b. Opposite-1 turn, 1 straight 3c. Opposite-all others 4. Not stated Totals 1 1
5B. MULTIPLE VEH CRASH Total Fatal Injury P.D.O. 1 11. Moving in opposite dir.
2. Both moving in same dir. 3a. One car parked
1 13b. One car stopped in traffic 4. Enter/Leave parked pos. 5a. Entering driveway/alley 5b. Leaving driveway/alley 6. All others Totals 1 1 2
5C. PEDESTRIANCRASHES
All PedCrashes
Fatal Crashes Non-Fatal Injury Crashes
TotalAt
Intersection Non-
Junction TotalAt
IntersectionNon-
Junction1. Car go straight2. Car turning right3. Car turning left 4. Car backing 5. All othersTotals
5D. ALL OTHER CRASHES Total Fatal Injury P.D.O.Coll-isionWith
Coll-isionWith
1. Other rd veh or railway train2. Fixed object 3. Other object or animal 4. Overturning 5. Other noncollision 6. Other rd veh or railway train 7. Fixed object 2 7 1 10 8. Other object or animal 1 3 4 9. Overturning 1 3 4 10. Other noncollision11. Not statedTotals 413 1 18
6. PEDESTRIAN ACTION BY AGE
Ages of Pedstrians Killed and InjuredPedestrians Killed Total 0 to 4 5 to 9 10 to 14 15 to 19 20 to 24 25 to 44 45 to 64 65 & older Not stated
1a. X-ing at intersect or X-walk 1b. X-ing not at intersection 2a. Walking in road with traffic 2b. Same against traffic 3. Standing in roadway 4. Push or work on veh in road 5. Other working in roadway 6. Playing in roadway 7. Other in roadway 8. Not in roadway 9. Not stated Totals
7. AGE OF DRIVER All Crashes Fatal Injury 1. 14 & younger 2. 15 3. 16 4. 17 5. 18 1 1 6. 19 1 1 7. 20 8. 21 9. 22 to 24 10. 25 to 34 3 2 11. 35 to 44 4 4 12. 45 to 54 5 1 3 13. 55 to 64 5 4 14. 65 to 74 1 1 15. 75 & older 3 1 16. Not stated 1 Totals 24 1 17 8. SEX OF DRIVER Injury Fatal All Crashes
1. Male 18 1 13 2. Female 6 4 3. Not stated Totals 24 1 17
9. RESIDENCE OF DRIVER All Crashes Fatal Injury
1. Local resident 6 4 2. In-state resident 14 1 10 3. Non resident 4 3 4. Not stated Totals 24 1 17
10. CRASHES BY CONTRIBUTING FACTOR All InjuryFatal1. Speed too fast
2
7. Followed too closely 1
26. Improper overtaking5. Drove left of center4. Disregard traffic signal3. Passed stop sign2. Failed to yield
9 10
8. Made improper turn
Totals 22 2 15 2
2 1 1
5
3 1
12. Other 11. Mechanical defect10. Improper driving9. Had been drinking
12. ROAD SURFACECONDITION InjuryFatalAll
1. Dry 15 122. Wet 3 23. Snowy or icy 2 14. Other 5. Not stated 1 1Totals 21 1 15
13. LIGHT CONDITION InjuryFatalAll1. Daylight 15 112. Dawn or Dusk 1 13. Darkness 4 34. Not stated 1 1Totals 21 1 15
11. VEHICLE TYPE InjuryFatalAll1. Passenger car 15 1 112. Pass Car and trailer 13. Truck or truck tractor 4. Truck tractor with semi-trailer 15. Other truck combination 6. Farm tractor and/or equip. 7. Taxicab 8. Bus 9. School bus10. Motorcycle 7 611. Motor scooter or moped 12. Others and not stated Totals 24 1 17Special vehicles included above 13. Log trucks14. Emergency (incl. private) 15. Military vehicles 16. Other public vehicles 1 1
14. MANNER OF COLLISION InjuryFatalAll
1. Head-on2. Rear end 13. Angle 1 14. Sideswipe-meeting 1 15. Sideswipe-overtaking 6. Backed into 7. OtherTotals 3 2
11. Count of vehicles, including properly parked vehicles.
Totals include participant records where gender was coded as "unknown".
10. Count of crashes. Crashes with multiple contributing circumstances are counted in all applicable categories.
MULTIPLE VEHICLE CRASHES
7 - 9. Tally of drivers by age, sex, residence & crash severity. Excludes occupants of properly & improperly parked vehicles.
285
Col
lisio
n in
volv
ing:
N
on-
coll.
N
on-
coll.
C
ollis
ion
invo
lvin
g:
Non
- co
ll.
Col
lisio
n in
volv
ing:
3C
. RU
RA
L 3A
. Inc
orpo
rate
d A
reas
3B
. UR
BA
N
SUMMARY OF MOTOR VEHICLE TRAFFIC CRASHES 2006 OREGON CRASHESForIn
137 5 27 56 3 86 27 31 2 60 54 87 5 146 3. County and Local Roads 10 3 3 9 7 16 12 7 19 4. City Streets
5. Not Stated 447 11 50 117 7 174 131 155 4 290 181 272 11 464 Total--Rural Area
NOTE: THIS YEAR TO DATE represents only those crashes entered onto the database as of the date above. SAME PERIOD LAST YEAR represents all crashes including late reports. MAJOR INJURIES are incapacitating injuries. MINOR INJURIES are non-incapacitating evident injuries.
3. LOCATION Total
PropertyDamage
Nonfatal Injury Fatal Property
DamageNonfatal
InjuryFatalTotalPropertyDamage
Nonfatal Injury Fatal Total Killed Injured
Total On Roadway TotalOff Roadway Number Of Crashes Number Of Persons
1. Below 1,000 2. 1,000 to 2,500 3. 2,501 to 5,000 4. 5,001 to 10,000 5. 10,001 to 25,000 6. 25,001 to 50,000 7. 50,001 to 100,000 8. 100,001 to 200,000 9. City of Portland Only Total - Municipalities
3. County and Local Roads 104 3 18 10 28 84 64 3 151 102 74 3 179 4. City Streets
5. Not Stated Total--Urban Area 314524 17 1 422221944420246 211 5 462 6. Interstate System 7. Other State Freeways 8. Other State Highways 283 2 137 144 269 1 130 138 14 1 7 6 2 210Total--Urban System 283 2 137 144 269 1 130 138 14 1 7 6 2 210
6. Interstate System 7. Other State Freeways 8. Other State Highways 299 6 178 115 214 2 117 95 85 4 61 20 6 300Total--Rural System 299 6 178 115 214 2 117 95 85 4 61 20 6 300
June 1, 2007
YAMHILL COUNTY
286
At I
nter
sect
ion
Not
at I
nter
sect
ion
At
Inte
r. N
on -I
nter
.
YAMHILL COUNTY 2006 OREGON CRASHES
4. AGE OF CASUALTY
Number of Persons Killed Number of Persons Injured Total Killed Pedestrians Pedalcyclist Total Injured Pedestrians Pedalcyclist
Total Total Total Total Total TotalMale Male Male Male Male MaleFemale Female Female Female Female Female1. 0 to 4 5 4 92. 5 to 9 8 12 203. 10 to 14 2 1 5 1 1 13 14 27 1 1 44. 15 to 19 3 1 3 3 79 79 158 1 1 25. 20 to 24 48 56 104 3 2 16. 25 to 34 1 2 1 55 56 111 27. 35 to 44 2 1 1 1 46 59 105 18. 45 to 54 1 1 48 49 97 6 5 19. 55 to 64 1 31 26 57 1 1 110. 65 to 74 1 25 18 43 2 1 1 1 1 111. 75 & older 12 11 23 2 2 12. Not-stated 3 4 7Totals 16 11 5 1 1 761 388 373 9 3 6 13 11 2
Directional Analysis - A crash consisting of a series of collisions, overturning, etc., is classified according to the first damage or injury producing event; includes on roadway and off roadway.5A. MULTIPLE VEH CRASH Total Fatal Injury P.D.O.
5B. MULTIPLE VEH CRASH Total Fatal Injury P.D.O. 18 26 3 471. Moving in opposite dir. 50 22 722. Both moving in same dir. 19 5 243a. One car parked 68 54 1223b. One car stopped in traffic
15 2 175b. Leaving driveway/alley 6 12 186. All others
Totals 186 122 3 311
5C. PEDESTRIANCRASHES
All PedCrashes
Fatal Crashes Non-Fatal Injury Crashes
TotalAt
Intersection Non-
Junction TotalAt
IntersectionNon-
Junction1. Car go straight 4 4 1 32. Car turning right3. Car turning left 3 3 34. Car backing 1 1 15. All othersTotals 8 1 1 7 4 3
5D. ALL OTHER CRASHES Total Fatal Injury P.D.O.Coll-isionWith
Coll-isionWith
1. Other rd veh or railway train 9 9 2. Fixed object 1 2 3 3. Other object or animal4. Overturning5. Other noncollision 2 2 6. Other rd veh or railway train 2 4 6 7. Fixed object 48 98 7 153 8. Other object or animal 12 5 17 9. Overturning 5 28 1 34 10. Other noncollision 1 3 1 5 11. Not statedTotals 69151 9 229
6. PEDESTRIAN ACTION BY AGE
Ages of Pedstrians Killed and InjuredPedestrians Killed Total 0 to 4 5 to 9 10 to 14 15 to 19 20 to 24 25 to 44 45 to 64 65 & older Not stated
1a. X-ing at intersect or X-walk 1 2 1 1 5 1 1b. X-ing not at intersection 1 1 1 3 2a. Walking in road with traffic 2b. Same against traffic 3. Standing in roadway 4. Push or work on veh in road 5. Other working in roadway 6. Playing in roadway 7. Other in roadway 8. Not in roadway 1 1 2 9. Not stated
1 1 332 10 1 Totals
7. AGE OF DRIVER All Crashes Fatal Injury 1. 14 & YOUNGER 1 2. 15 2 1 3. 16 41 19 4. 17 58 1 32 5. 18 61 2 39 6. 19 63 1 38 7. 20 53 34 8. 21 55 26 9. 22 to 24 105 2 62 10. 25 to 34 257 2 149 11. 35 to 44 258 3 140 12. 45 to 54 238 6 120 13. 55 to 64 180 3 83 14. 65 to 74 83 1 44 15. 75 & older 75 2 38 16. Not stated 113 17 Totals 1,643 23 842 8. SEX OF DRIVER Injury Fatal All Crashes
1. Male 948 18 485 2. Female 670 5 352 3. Not stated 25 5 Totals 1,643 23 842
9. RESIDENCE OF DRIVER All Crashes Fatal Injury
1. Local resident 1,301 17 681 2. In-state resident 241 4 128 3. Non resident 46 2 20 4. Not stated 55 13 Totals 1,643 23 842
10. CRASHES BY CONTRIBUTING FACTOR All InjuryFatal1. Speed too fast
92 10 20 21 17
7. Followed too closely 176
3
1
17 36 39 27
6. Improper overtaking5. Drove left of center4. Disregard traffic signal3. Passed stop sign2. Failed to yield 227 2 118
104 6 162
8. Made improper turn
Totals 939 18 488 44
5 32 13 12
1
2 3
107 8
79 22 39
12. Other 11. Mechanical defect10. Improper driving9. Had been drinking
12. ROAD SURFACECONDITION InjuryFatalAll
1. Dry 612 10 3072. Wet 267 5 1563. Snowy or icy 31 1 164. Other 5. Not stated 16 4Totals 926 16 483
13. LIGHT CONDITION InjuryFatalAll1. Daylight 663 9 3392. Dawn or Dusk 70 1 333. Darkness 192 6 1114. Not stated 1Totals 926 16 483
11. VEHICLE TYPE InjuryFatalAll1. Passenger car 1,561 22 7922. Pass Car and trailer 21 103. Truck or truck tractor 20 1 64. Truck tractor with semi-trailer 42 225. Other truck combination 6. Farm tractor and/or equip. 3 27. Taxicab8. Bus 2 19. School bus 5 210. Motorcycle 16 2 1411. Motor scooter or moped 12. Others and not stated 12 1 3Totals 1,682 26 852Special vehicles included above 13. Log trucks 9 614. Emergency (incl. private) 6 315. Military vehicles 16. Other public vehicles 14 6
14. MANNER OF COLLISION InjuryFatalAll
1. Head-on 18 4 112. Rear end 265 1343. Angle 322 2 1594. Sideswipe-meeting 23 115. Sideswipe-overtaking 33 76. Backed into 19 37. Other 9Totals 689 6 325
11. Count of vehicles, including properly parked vehicles.
Totals include participant records where gender was coded as "unknown".
10. Count of crashes. Crashes with multiple contributing circumstances are counted in all applicable categories.
MULTIPLE VEHICLE CRASHES
7 - 9. Tally of drivers by age, sex, residence & crash severity. Excludes occupants of properly & improperly parked vehicles.
287
This page intentionally left blank.
288
This page intentionally left blank.
OREGON DEPARTMENT OF TRANSPORTATION
Crash Analysis and Reporting Unit 555 13th Street NE, Suite 2 Salem, Oregon 97301-4178


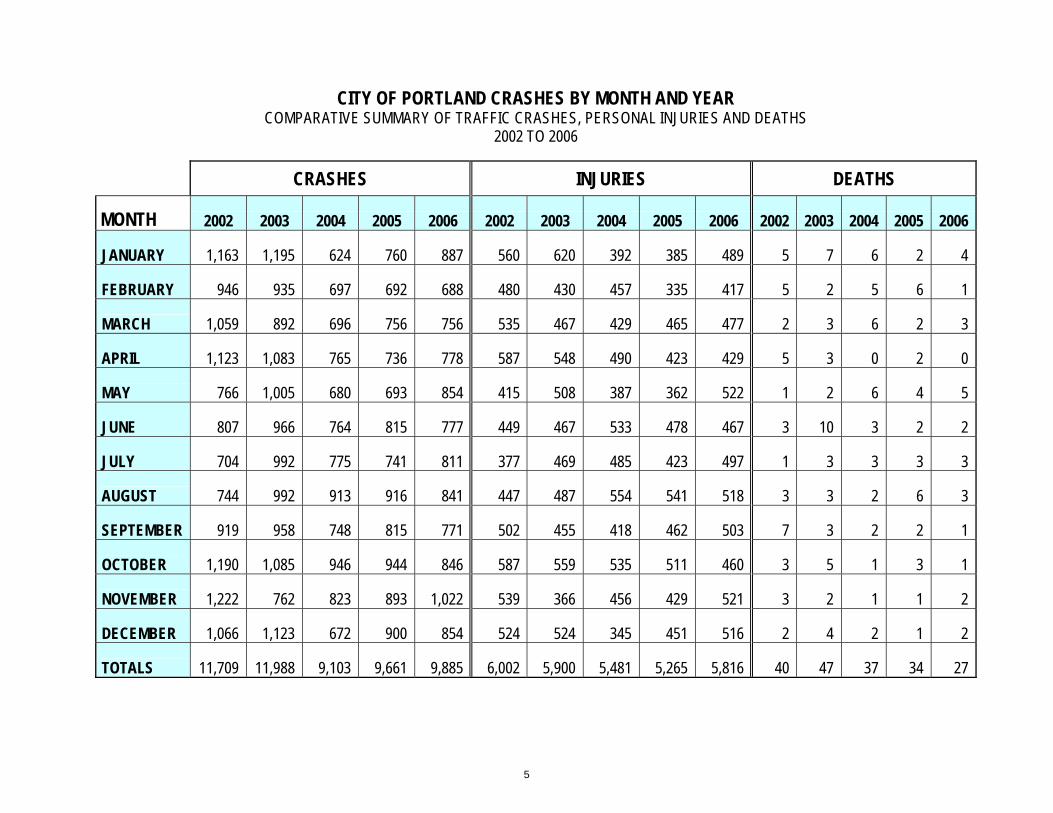


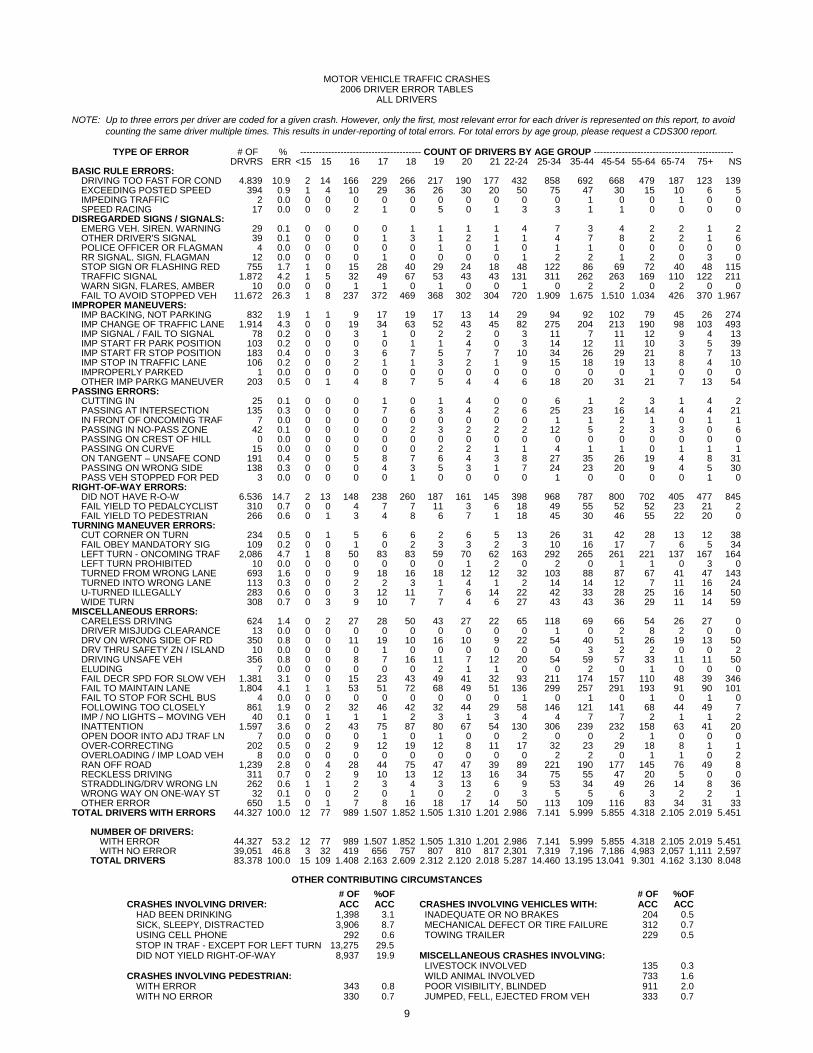


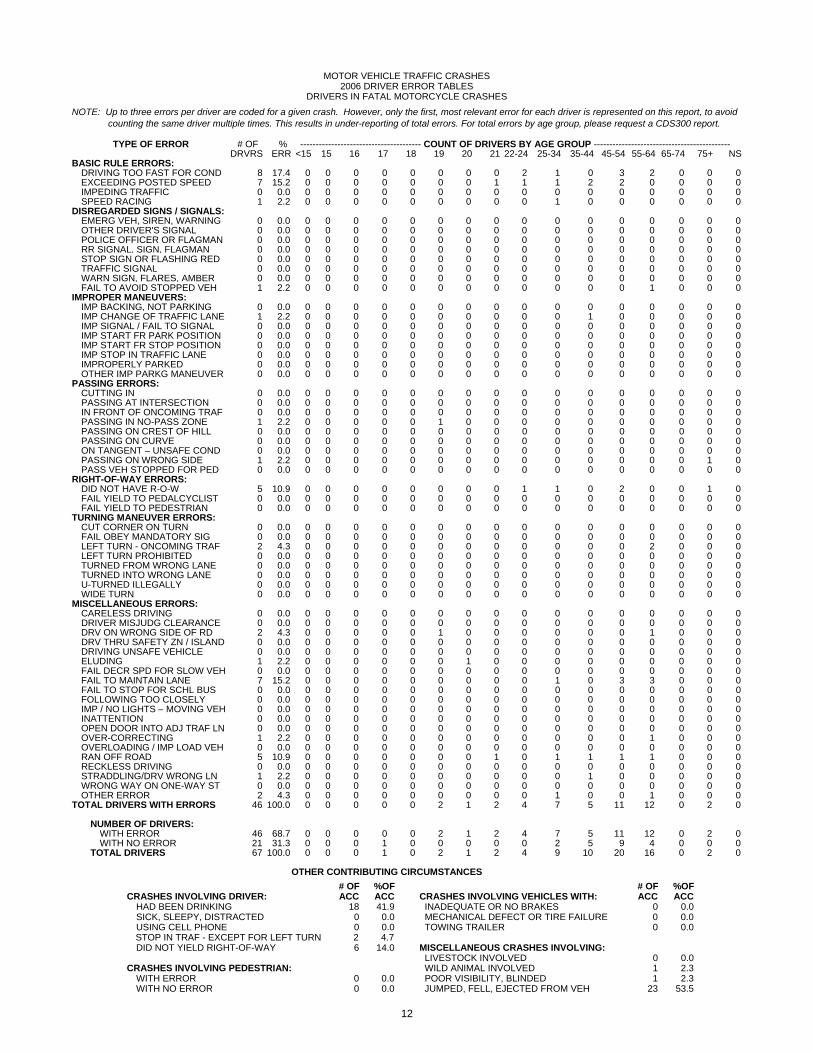


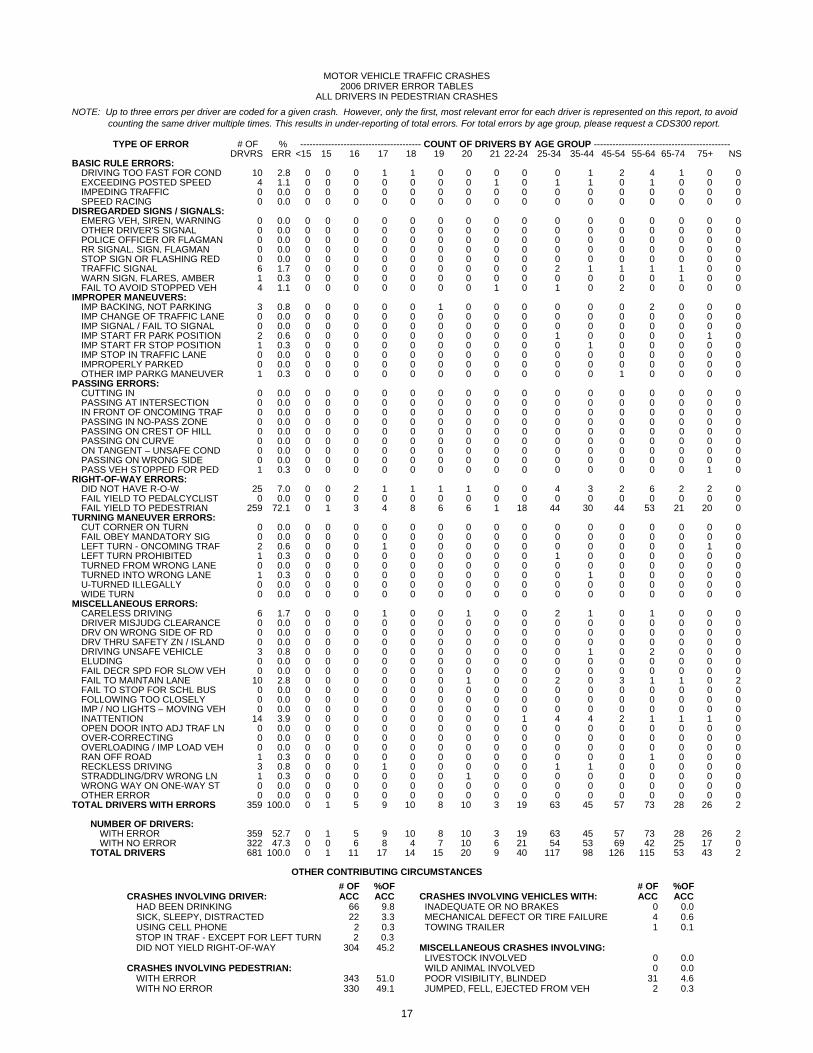


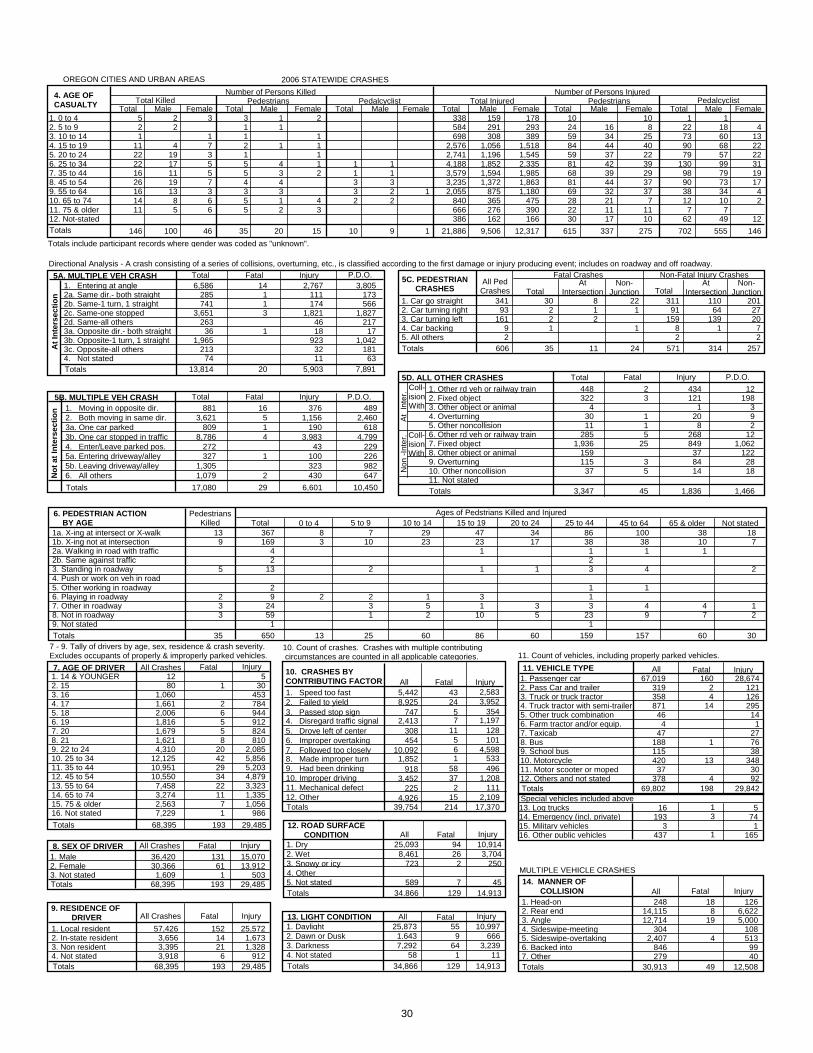


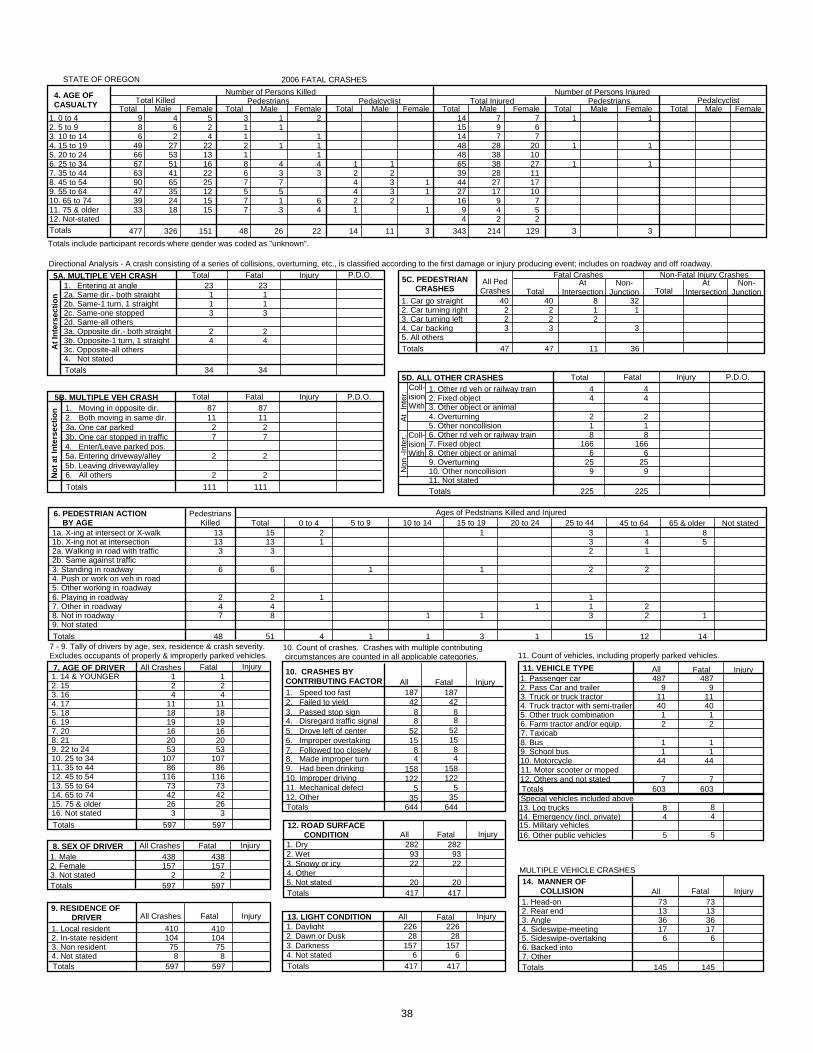
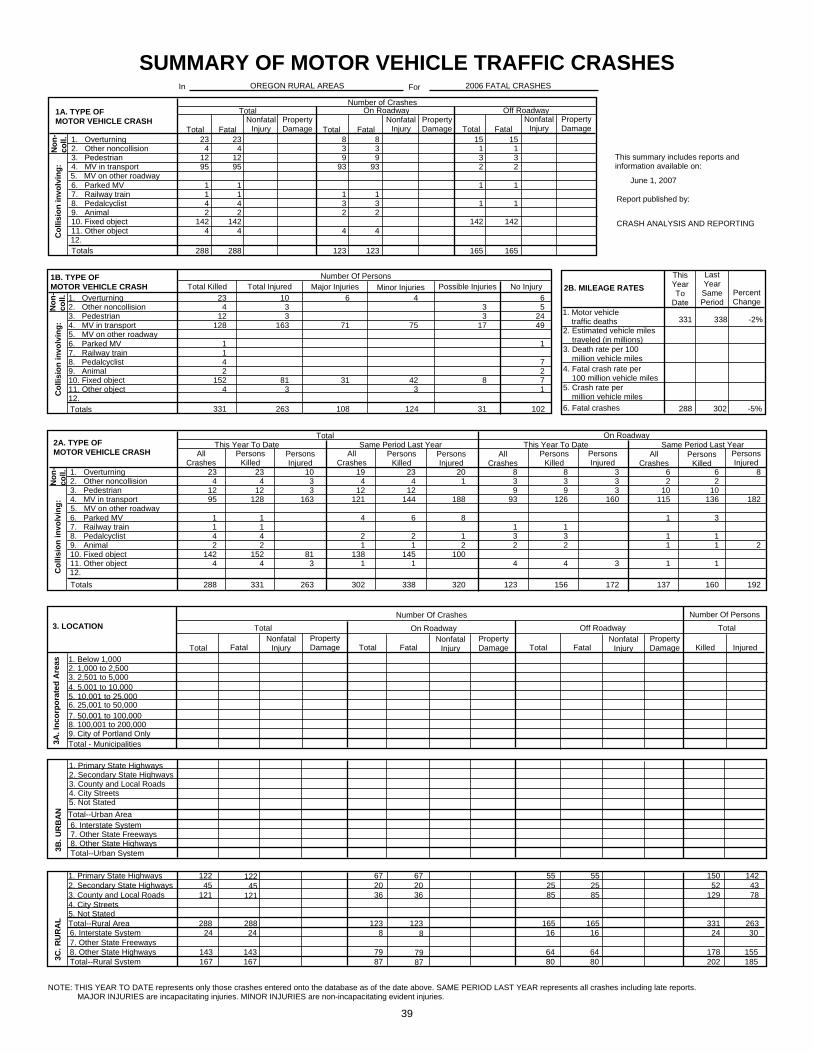


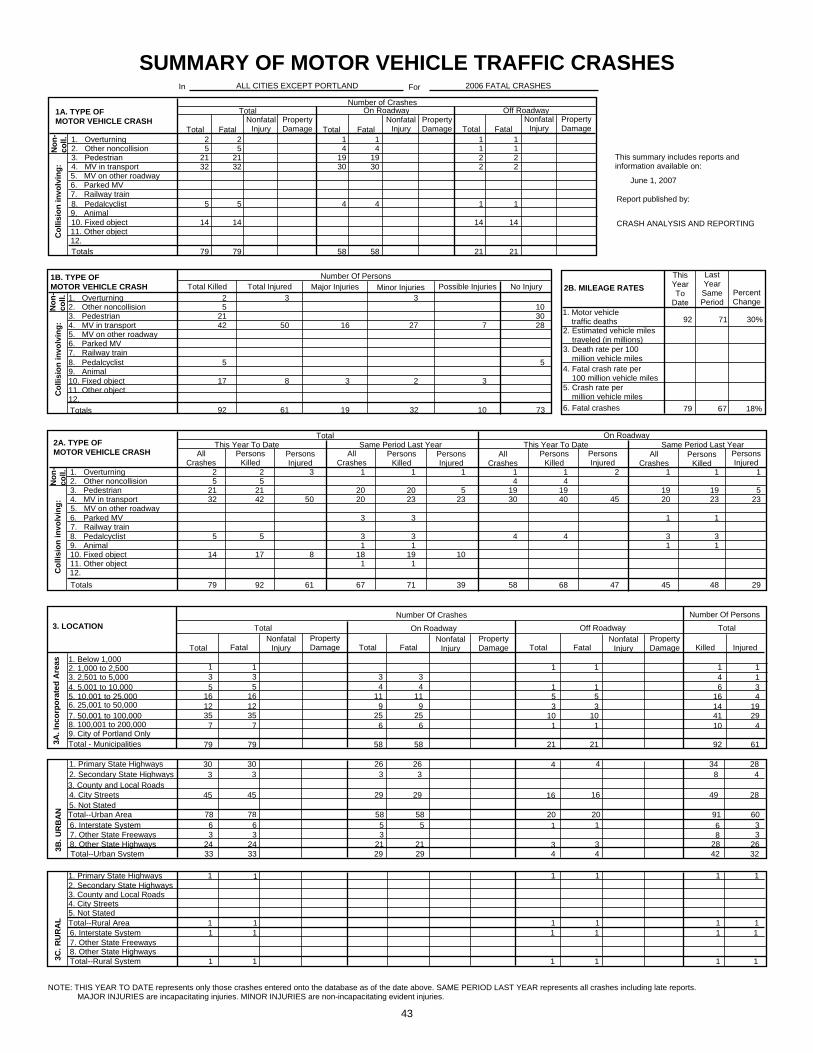


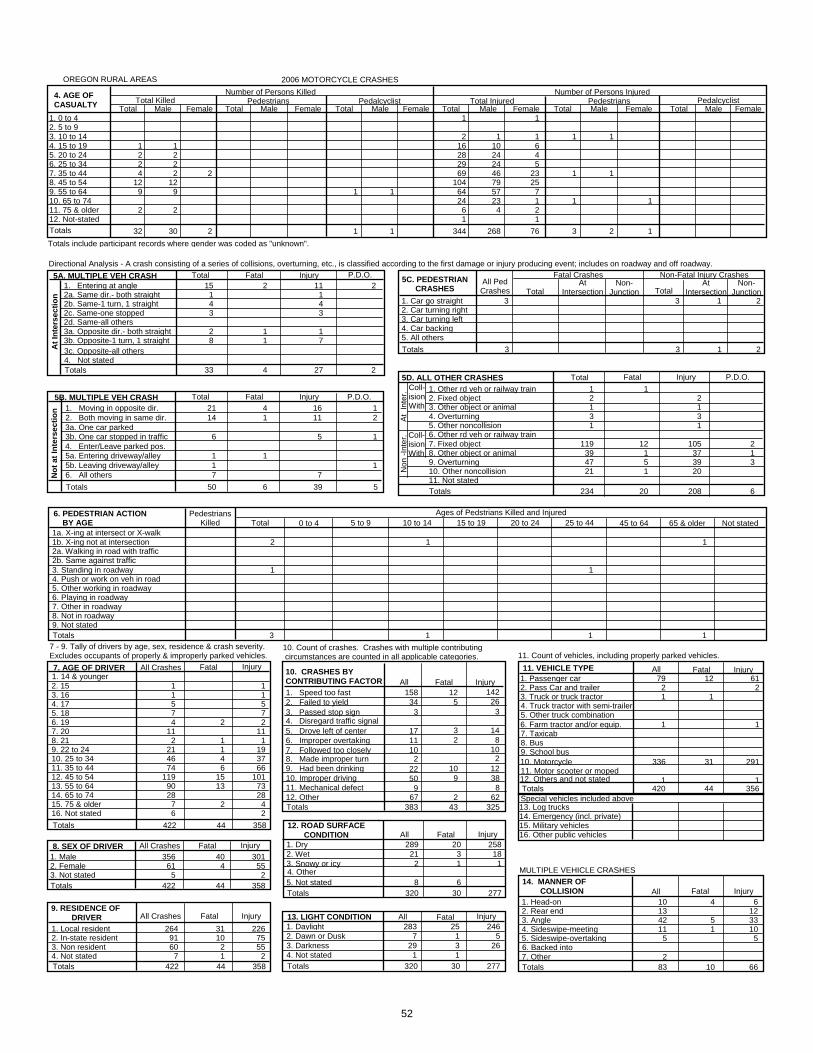


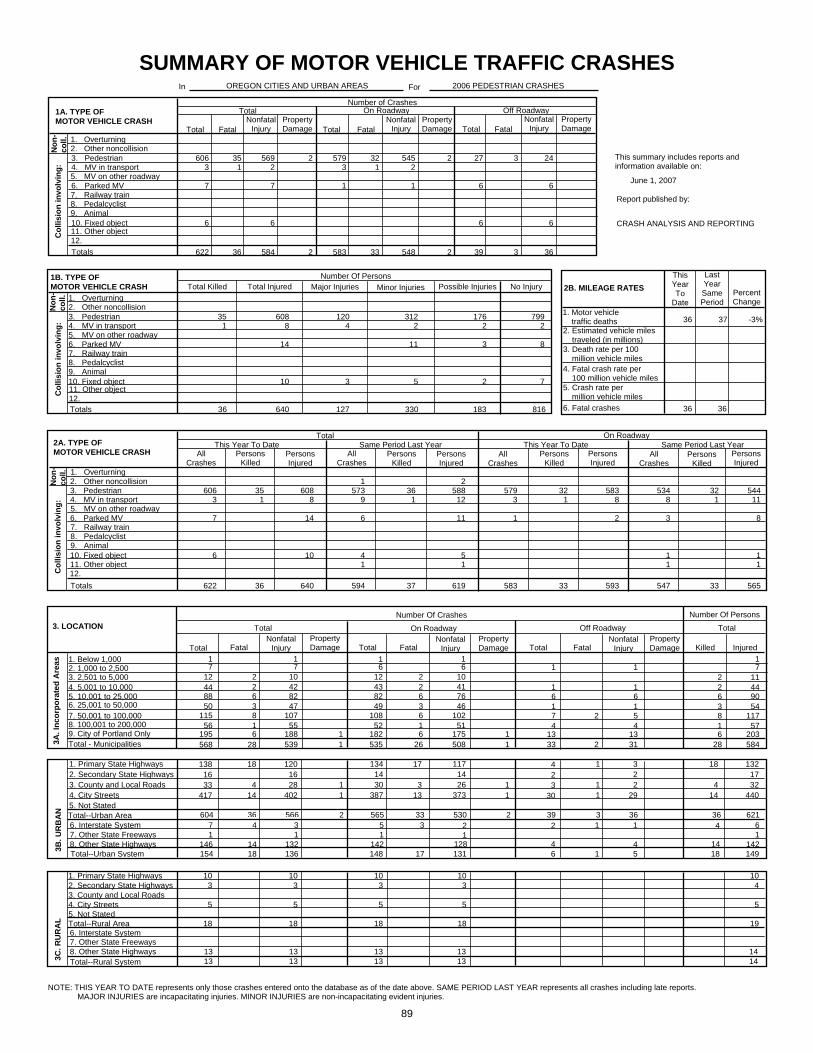


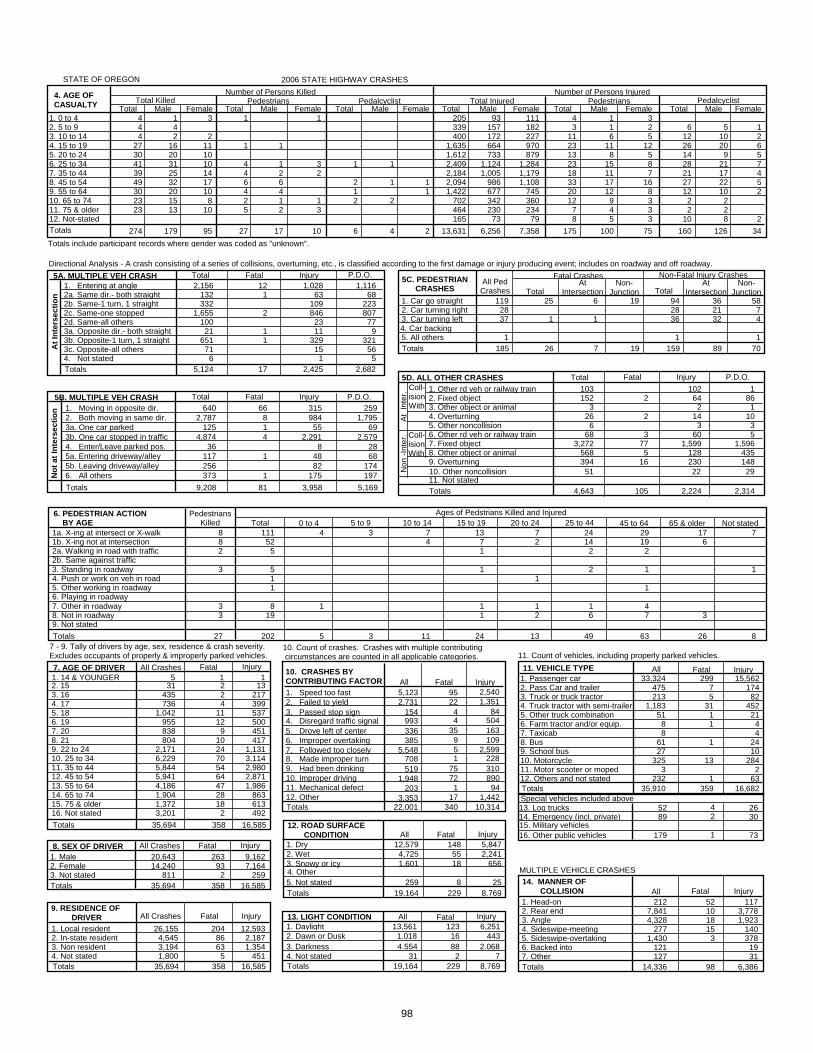


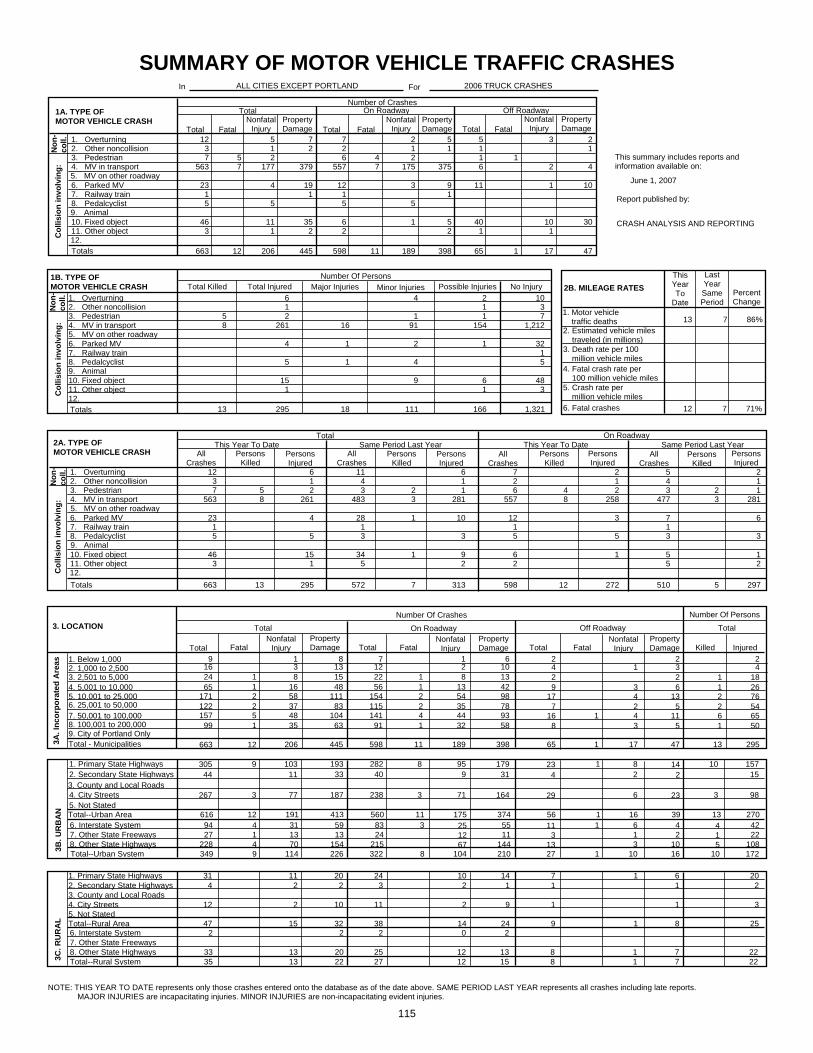


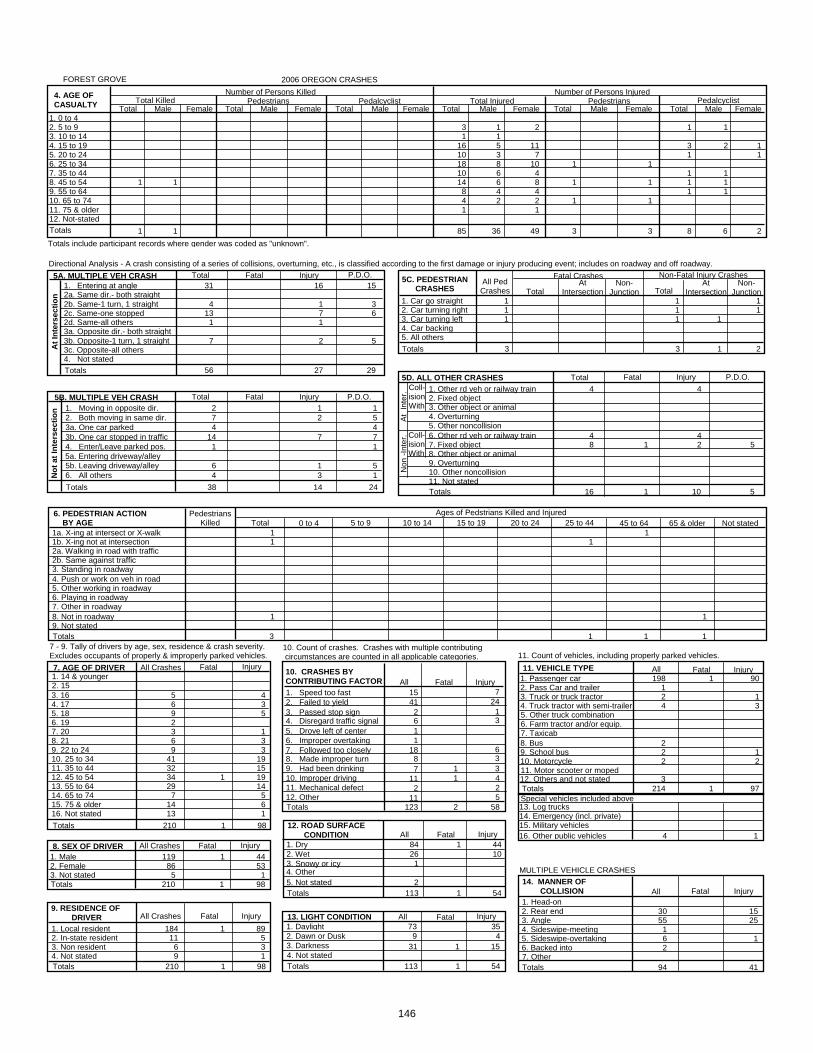


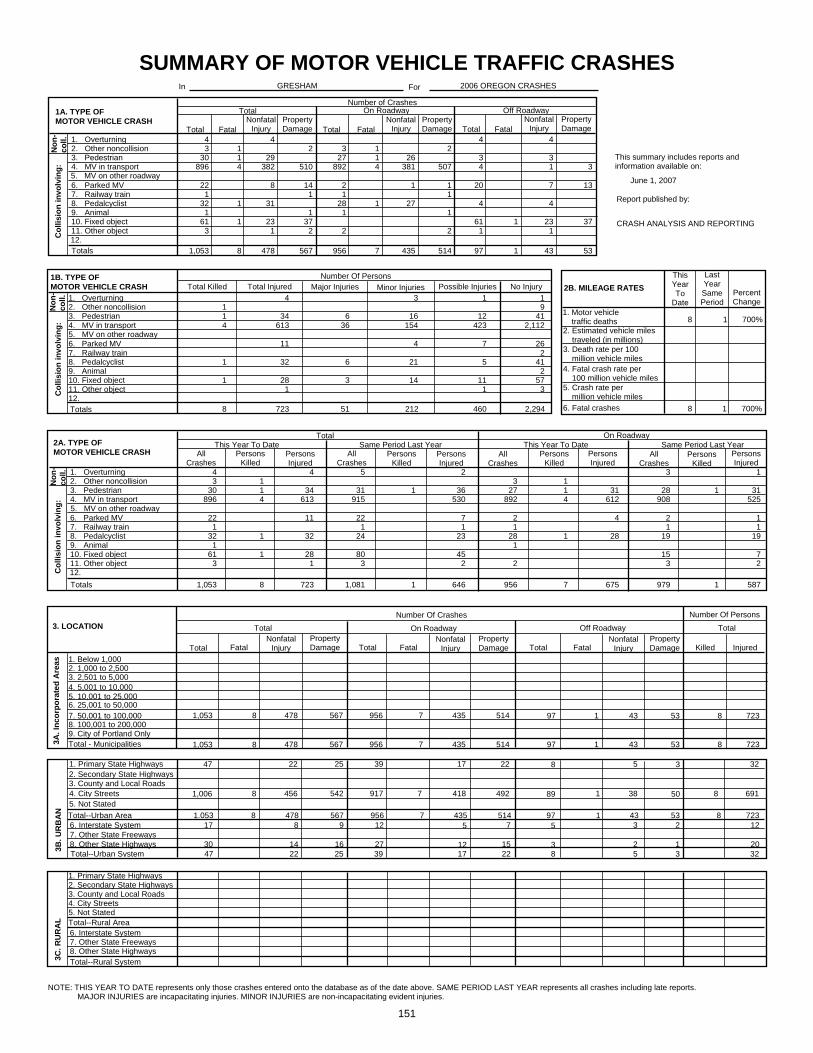


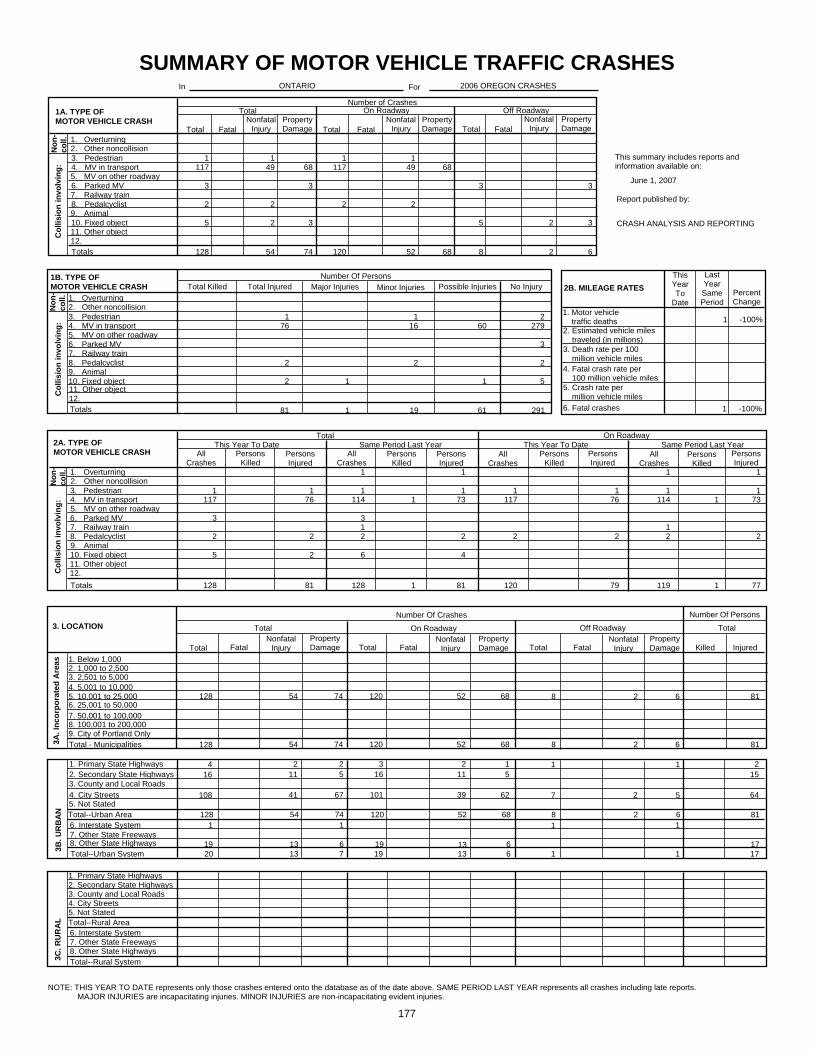

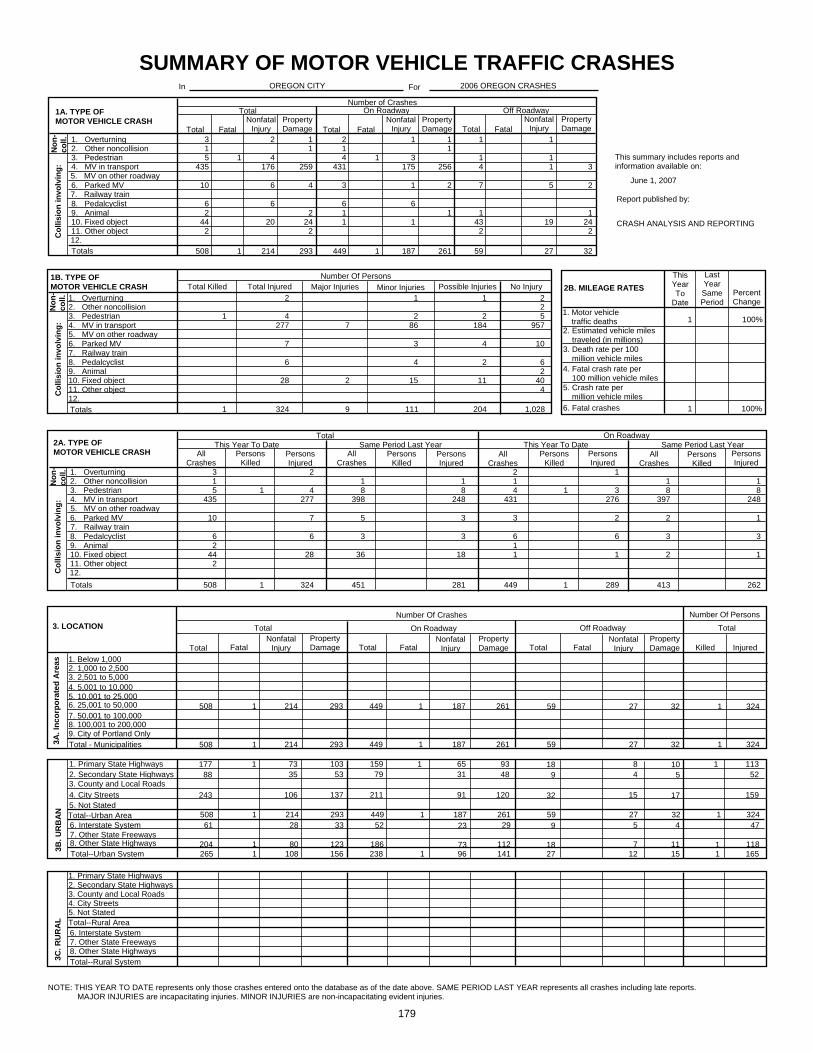


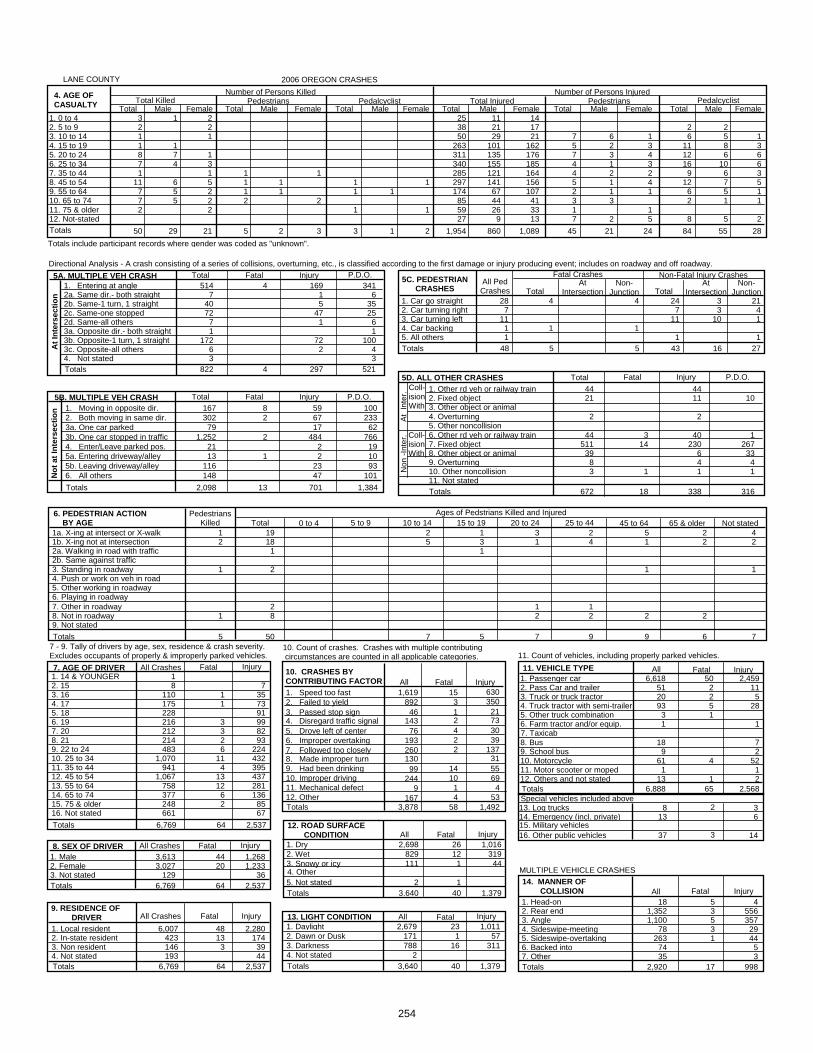
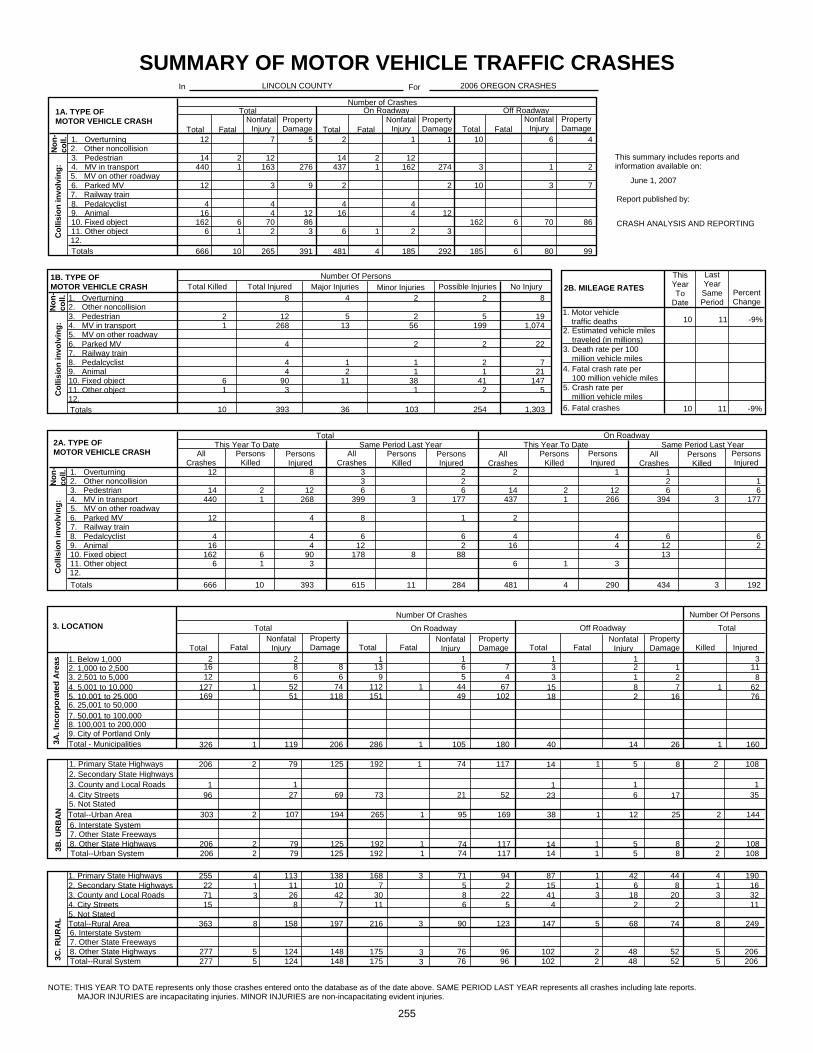

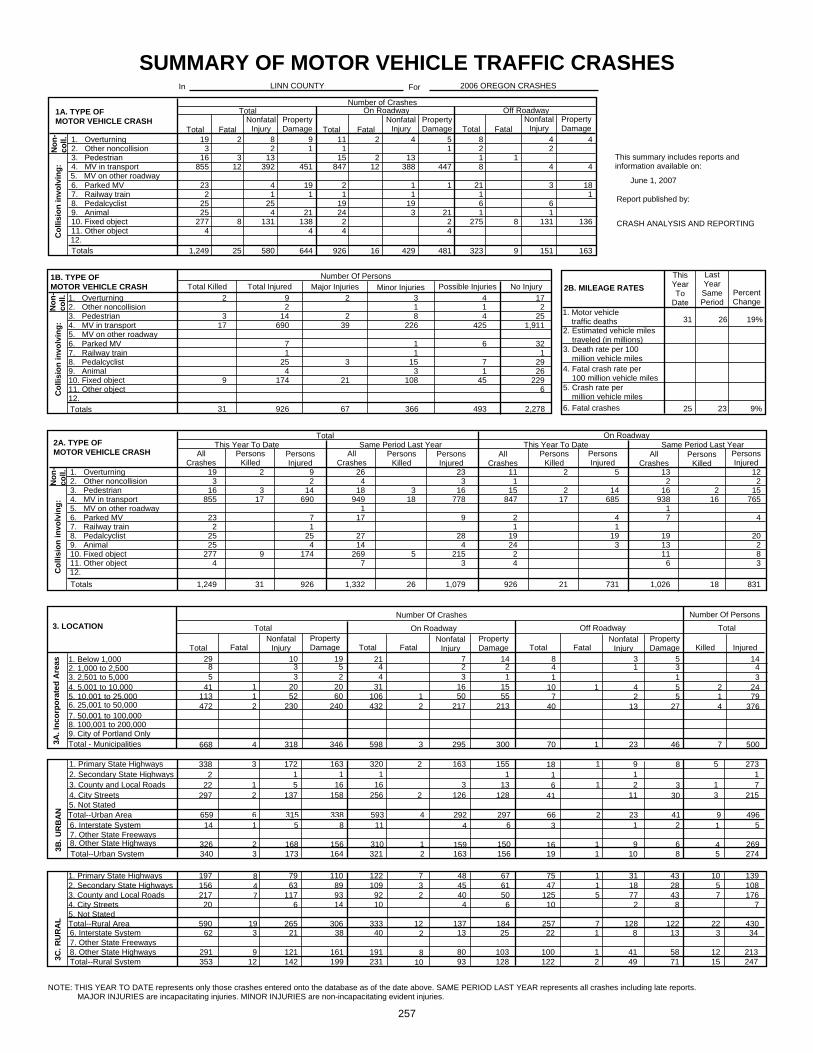


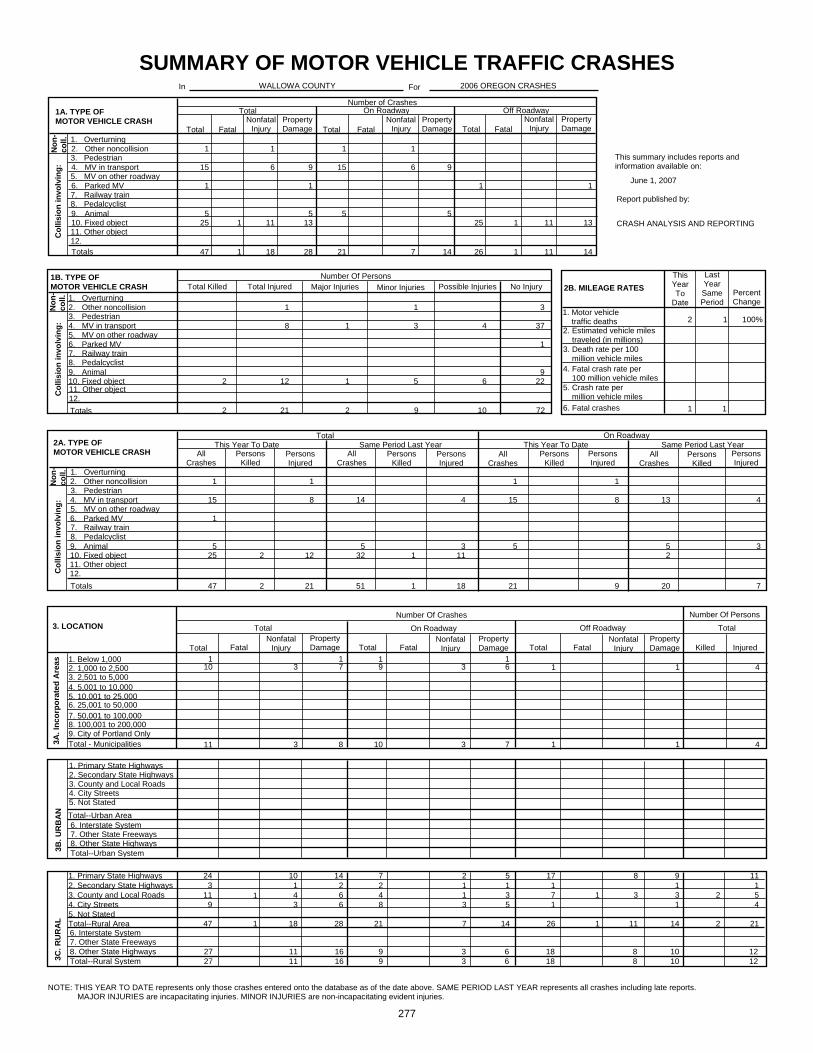


![Instruction Manual - Oregon Police Traffic Crash Report ... · Police reports of traf¿c crashes are the foundation of traf ... The department shall tabulate and may analy]e crash](https://static.documents.pub/doc/80x56/5b5e4a8c7f8b9a6d448bfeac/instruction-manual-oregon-police-traffic-crash-report-police-reports-of.jpg)


