208
2012 Profile of Home Buyers and Sellers Florida Report Prepared for: Florida REALTORS ® Prepared by: NATIONAL ASSOCIATION OF REALTORS ® Research Division December 2012

2012 Profile of Home Buyers and Sellers
Florida Report
Prepared for:
Florida REALTORS® Prepared by:
NATIONAL ASSOCIATION OF REALTORS®
Research Division
December 2012

2012 Profile of Home Buyers and Sellers 1
NATIONAL ASSOCIATION OF REALTORS®
2012 Profile of Home Buyers and Sellers
Florida Report
Table of Contents
Introduction ....................................................................................................................................................... 2
Highlights ........................................................................................................................................................... 4
Conclusion ......................................................................................................................................................... 7
Report Prepared
by:
Jessica Lautz
202-383-1155
2012 Profile of Home Buyers and Sellers 2
NATIONAL ASSOCIATION OF REALTORS®
2012 Profile of Home Buyers and Sellers
Florida Report
Introduction
For most home buyers, the purchase of real estate is one of the largest financial transactions
they will make. Buyers purchase a home not only for the desire to own a home of their own, but
also because of changes in jobs, family situations, and the need for a smaller or larger living
area. This annual survey conducted by the NATIONAL ASSOCIATION OF REALTORS® of recent
home buyers and sellers helps to gain insight into detailed information about their experiences
with this important transaction. The information provided supplies understanding, from the
consumer level, of the trends that are transpiring and the changes seen. The survey covers
information on demographics, housing characteristics and the experience of consumers in the
housing market. Buyers and sellers also provide valuable information on the role that real estate
professionals play in home sales transactions.
Many buyers are now facing tighter credit standards than seen in previous years. For this reason,
the buyers we see are different from past years. For example, this year’s report displayed the
highest share of married couples and the lowest share of single buyers that has been seen since
2001. Married couples who purchased a home have the advantage of more buying power and
added financial stability—their typical household incomes are higher than single households.
The selling market continues to show tightened inventory in many areas of the country. Buyers
are looking at fewer homes than in past years. Twenty percent of for-sale-by-owner sellers who
did not know the buyer before the sale reported selling by this method because a home buyer
contacted them directly to purchase their home.
Buyers need the help of a real estate professional to help them find the right home for them,
help them understand the process, and negotiate terms of sale. Sellers, as well, turn to
professionals to help sell their homes within a specific timeframe, market their home effectively
and find the right buyer. As the market changes and evolves, the need for a professional to help
has increased. More buyers and sellers are turning to professionals to help them with this
transaction. Satisfaction with agents continues to be high.
This report provides real estate professionals with insights into the needs and expectations of their
clients. What do consumers want when choosing a real estate professional? How do home
buyers begin the process of searching for a home? Why do some sellers choose to forego the
assistance of an agent? The answers to these questions, along with other findings in this report,
will help real estate professionals better understand the housing market and also provide the
information necessary to address the needs of America’s real estate consumers.

2012 Profile of Home Buyers and Sellers
NATIONAL ASSOCIATION OF REALTORS® 3
The Housing Environment
Housing economists agree that the real estate market is showing signs of stabilization, both in
sales and pricing. The commercial real estate market continues to grow as vacancy rates lower
and rental rates rise in many areas of the country. REALTOR® members are seeing home prices
increase as demand for homes in many areas increases. The mortgage market, while showing
historically low rates, also has historically tightened lending standards. Overall in the economy,
GDP continues to at a below normal growth level, but there are signs of improvement in the
employment market, retail and auto sales, and consumer confidence.
It is important to note that while the economy as a whole does affect the housing market, most
buyers purchase for the plain desire to own a home and establish a household of their own.
Homeowners, who purchase a property as their primary residence, are also buying in to a
neighborhood. A long and distinguished body of academic research has shown that
homeownership strengthens the community; homeowners have a stake in the community and
are likely to invest through their participation in civic activities such as voting or volunteering their
time. Moreover, it is now well-documented that homeowners and their families benefit in a
number of ways ranging from more positive feelings about the future to better health. Although
the financial aspects of homeownership are important, they do not stand alone as the primary
motivators for the purchase of a home.

2012 Profile of Home Buyers and Sellers
NATIONAL ASSOCIATION OF REALTORS® 4
2012 Profile of Home Buyers and Sellers
Florida Report
Highlights
The real estate market offers a variety of choices, opportunities and challenges for home buyers,
sellers, and real estate professionals helping them with their transactions. For home buyers, there
are numerous ways to search for and find a home, a variety of mortgage products to finance
their home and a growing list of services that their agent can provide to assist them in the
process.
Home sellers can choose to sell their home themselves or enlist the professional assistance of an
agent who can provide various levels of service to best suit each home seller’s needs. Because
the real estate market is always evolving, it is important for real estate professionals to have a
clear picture of today’s home buyers and sellers. The 2012 Profile of Home Buyers and Sellers
describes the characteristics and motivations of recent home buyers and sellers in Florida and in
so doing helps real estate professionals track the changing demands of consumers in a dynamic
market.
Characteristics of Home Buyers
Twenty-five percent of recent home buyers were first-time buyers in Florida, compared to
a national level of 39 percent, which is a slight rise from 2011.
The typical buyer in Florida was 55 years old, while nationally the typical buyer was 42 years
old, a modest decrease from 45 in 2011.
The 2011 median household income of buyers was $74,200 in Florida and $78,600
nationally. The median income was $55,600 among first-time buyers and $82,200 among
repeat buyers, compared to $61,800 among first-time buyers and $93,100 among repeat
buyers nationally.
Nationally, 65 percent of recent home buyers were married couples—the highest share
since 2001. In Florida, the figure was 66 percent. Sixteen percent of recent home buyers
were single females nationally—the lowest share since 2001; 16 percent were single
females in Florida.
For 30 percent of recent home buyers nationally, the primary reason for the recent home
purchase was a desire to own a home. In Florida, this was the primary reason for 22
percent of recent home buyers.
Characteristics of Homes Purchased
New home purchases continue to drag at a share of 16 percent of all recent home
purchases on a national level. This is reflective of conditions in Florida, where 20 percent
of homes were new.
76 percent of home buyers purchased a detached single-family home in Florida,
compared to seventy-nine percent of home buyers nationally.
The quality of the neighborhood, convenience to job, and overall affordability of homes
are the top three factors influencing neighborhood choice; however, neighborhood
choice varies considerably among household compositions.
When considering the purchase of a home, heating and cooling costs were at least
somewhat important to 87 percent of buyers and commuting costs were considered at
least somewhat important by 76 percent of buyers nationally, compared to 84 percent
and 63 percent of buyers in Florida respectively.

2012 Profile of Home Buyers and Sellers
NATIONAL ASSOCIATION OF REALTORS® 5
The Home Search Process
For 41 percent of home buyers, the first step in the home-buying process was looking
online for properties and 11 percent of home buyers first looked online for information
about the home buying process on a national level. In Florida, 40 percent of home
buyers looked online for properties as a first step and 10 percent searched for information
about the process online.
The use of the Internet in the home search rose slightly on a national level to 90 percent
and for buyers under the age of 44 this share increased to 96 percent. In Florida, this
number was 86 percent of all buyers and 95 percent of buyers under the age of 44.
Real estate agents were viewed as a useful information source by 99 percent of buyers
who used an agent while searching for a home in Florida, compared to 97 percent of
buyers nationally.
The typical home buyer in Florida searched for 10 weeks and viewed 10 homes,
compared to 12 weeks and 10 homes on a national level.
Nine in ten recent buyers were satisfied with the home buying process nationally, the
same percentage of buyers satisfied with the process in Florida.
Home Buying and Real Estate Professionals
Nationally, eighty-nine percent of buyers purchased their home through a real estate
agent or broker—a share that has steadily increased from 69 percent in 2001. In Florida,
this share was 84 percent.
Forty percent of buyers found their agent through a referral from a friend or family
member and 10 percent used an agent they had used before to buy or sell a home on a
national level. In Florida, 35 percent used a referral to find an agent and 8 percent used
an agent they had used previously.
About two-thirds of recent buyers nationally only interviewed one agent before they
found the agent they worked with, slightly more than the 57 percent figure reported in
Florida.
Nearly nine in ten buyers nationally would use their agent again or recommend them to
others. In Florida, that number is 87 percent.
Financing the Home Purchase
On a national level, 87 percent of home buyers financed their recent home purchase.
Among those who financed their home purchase, the buyers typically financed 91
percent. In Florida, 70 percent of buyers financed their recent purchase and 89 percent
of the purchase was financed.
The share of first-time buyers who financed their home purchase was 95 percent
compared to 81 percent of repeat buyers, nationally. In Florida, that share was 87
percent of first-time buyers and 64 percent of repeat buyers.
More than a third of home buyers nationally reported they have made some sacrifices
such as reducing spending on luxury items, entertainment or clothing. This also holds true
in Florida.
Nationally, 23 percent of buyers reported the mortgage application and approval
process was somewhat more difficult than expected and 17 percent reported it was
much more difficult than expected. These numbers are roughly equivalent to the Florida
numbers, where 25 percent of buyers reported the process was somewhat more difficult
than expected and 19 percent reported it was much more difficult than expected.
Home Sellers and Their Selling Experience

2012 Profile of Home Buyers and Sellers
NATIONAL ASSOCIATION OF REALTORS® 6
The typical national seller lived in their home for nine years. The median tenure has
increased in recent years. In 2007, the typical tenure in home was only six years. In
Florida, the median tenure is 11 years.
Eighty-eight percent of sellers were assisted by a real estate agent when selling their
home nationally, and 92 percent were assisted in Florida.
Nationally, recent sellers typically sold their homes for 95 percent of the listing price, and
60 percent reported they reduced the asking price at least once. In Florida, recent
sellers sold their homes for 93 percent of the listing price and 67 percent reduced the
asking price at least once.
Forty percent of sellers offered incentives to attract buyers nationally, most often
assistance with home warranty policies and closing costs. In Florida, 32 percent of sellers
offered incentives.
Home Selling and Real Estate Professionals
Nationally, 38 percent of sellers who used a real estate agent found their agents through a
referral by friends or family, and 23 percent used the agent they worked with previously to
buy or sell a home. In Florida, the share of sellers found their agents through a referral was
40 percent and 16 percent used an agent they had worked with before.
Two-thirds of home sellers only contacted one agent before selecting the one to assist with
their home sale on a national level, and this was also true in Florida.
Ninety-three percent of sellers reported that their home was listed or advertised on the
Internet nationally, and 88 percent in Florida.
Among recent sellers nationally who used an agent, 84 percent reported they would
definitely (66 percent) or probably (18 percent) use that real estate agent again or
recommend to others. In Florida, 81 percent of sellers reported they would definitely (66
percent) or probably (15 percent) use the real estate agent again or recommend to
others.
For-Sale-by-Owner (FSBO) Sellers
The share of home sellers who sold their home without the assistance of a real estate
agent was nine percent nationally. Thirty-three percent of those sellers knew the buyer
prior to home purchase. In Florida, the share was five percent and forty percent knew
the buyer.
The primary reason that sellers choose to sell their home without the assistance of a real
estate agent to a buyer they did not know was that they did not want to pay a fee or
commission (43 percent), at the national level. In Florida, 36 percent did not want to pay
a fee or commission.
One-third of FSBO sellers nationally took no action to market their home, and 60 percent
did not offer any incentives to attract buyers. These numbers are elevated in Florida,
where 46 percent of FSBO sellers took no action to market the home and 68 percent did
not offer any incentives.

2012 Profile of Home Buyers and Sellers
NATIONAL ASSOCIATION OF REALTORS® 7
2012 Profile of Home Buyers and Sellers
Florida Report
Conclusion
Home buying and selling remains an important segment of the national and local economies,
especially due to the housing sector’s unique power to revitalize the economy during
challenging times. With historically low mortgage rates, buyers and sellers continue to have
opportunities to trade up, trade down, relocate or purchase a second home. First-time buyers
are now 50 percent of the market, are discovering and capturing the benefits of
homeownership, which contributes to significant wealth accumulation, among other financial,
social, and personal rewards.
Consumers rely on the experience and expertise of real estate professionals to assist when
buying and selling a home. Working in an extremely competitive environment, agents and
brokers provide high levels of service to meet the varied needs of home buyers and sellers. The
value that consumers place on the services offered by real estate professionals is reflected in the
large majority of both buyers and sellers who would use their agents again or recommend them
to others.
2012 Profile of Home Buyers and Sellers
NATIONAL ASSOCIATION OF REALTORS® 8
Methodology
In July 2012, NAR mailed out a question survey to a random sample of 93,502 recent home
buyers. The recent home buyers had to have purchased a home between July of 2011 and June
of 2012. The Tailored Survey Design Method was used to survey the sample, which includes a
pre-postcard mailing, the survey, a follow-up letter and a re-mailing of the survey. Using this
method, a total of 8,501 responses were received. After accounting for undeliverable
questionnaires, the survey had an adjusted response rate of 9.1 percent. For Florida there were
557 responses, accounting for a response rate of 8.9 percent.
Consumer names and addresses were obtained from Experian, a firm that maintains an
extensive database of recent home buyers derived from county records. Information about
sellers comes from those buyers who also sold a home.
All information in this Profile is characteristic of the 12-month period ending June 2012, with the
exception of income data, which are reported for 2011. In some sections comparisons are also
given for results obtained in previous surveys. Not all results are directly comparable due to
changes in questionnaire design and sample size. Some results are presented for the four U.S.
Census regions: Northeast, Midwest, South and West. Survey responses were weighted to be
representative of state level sales. The median is the primary statistical measure used throughout
this report. Due to rounding and omissions for space, percentage distributions may not add to
100 percent.

Florida2012 Profile of Home Buyers and Sellers
Prepared by:NATIONAL ASSOCIATION OF REALTORS®
Research Division
November 2012
2012 National Association of Realtors® Profile of Home Buyers and Sellers

CHARACTERISTICS OF HOME BUYERS
Exhibit 1-1 AGE OF HOME BUYERS, BY REGIONExhibit 1-2 HOUSEHOLD INCOME OF HOME BUYERS, BY REGION, 2011Exhibit 1-3 ADULT COMPOSITION OF HOME BUYER HOUSEHOLDS, 2001-2012Exhibit 1-4 NUMBER OF CHILDREN UNDER THE AGE OF 18 RESIDING IN HOUSEHOLDExhibit 1-5 RACE/ETHNICITY OF HOME BUYERS, BY REGIONExhibit 1-6 RACE/ETHNICITY OF HOME BUYERS, BY ADULT COMPOSITION OF HOUSEHOLDExhibit 1-7 PRIMARY LANGUAGE SPOKEN IN HOME BUYER HOUSEHOLD, BY REGIONExhibit 1-8 NATIONAL ORIGIN OF HOME BUYERS, BY REGIONExhibit 1-9 FIRST-TIME HOME BUYERSExhibit 1-10 FIRST-TIME HOME BUYERS, BY REGIONExhibit 1-11 FIRST-TIME AND REPEAT HOME BUYERS BY HOUSEHOLD TYPEExhibit 1-12 FIRST-TIME AND REPEAT HOME BUYERS BY CHILDREN IN HOUSEHOLDExhibit 1-13 AGE OF FIRST-TIME AND REPEAT BUYERSExhibit 1-14 HOUSEHOLD INCOME OF FIRST-TIME AND REPEAT BUYERS, 2011Exhibit 1-15 RACE/ETHNICITY OF FIRST-TIME AND REPEAT BUYERSExhibit 1-16 PRIMARY LANGUAGE SPOKEN IN FIRST-TIME AND REPEAT BUYER HOUSEHOLDSExhibit 1-17 NATIONAL ORIGIN OF FIRST-TIME AND REPEAT BUYERSExhibit 1-18 PRIOR LIVING ARRANGEMENT OF FIRST-TIME AND REPEAT BUYERSExhibit 1-19 PRIOR LIVING ARRANGEMENT, BY ADULT COMPOSITION OF HOUSEHOLDExhibit 1-20 PRIMARY REASON FOR PURCHASING A HOME, FIRST-TIME AND REPEAT BUYERSExhibit 1-21 PRIMARY REASON FOR PURCHASING A HOME, BY AGEExhibit 1-22 PRIMARY REASON FOR PURCHASING A HOME, BY ADULT COMPOSITION OF HOUSEHOLDExhibit 1-23 PRIMARY REASON FOR THE TIMING OF HOME PURCHASE, FIRST-TIME AND REPEAT BUYERSExhibit 1-24 PRIMARY REASON FOR THE TIMING OF HOME PURCHASE, BY AGEExhibit 1-25 NUMBER OF HOMES CURRENTLY OWNED, BY AGEExhibit 1-26 OTHER HOMES OWNED, BY AGE
2012 National Association of Realtors® Profile of Home Buyers and Sellers

CHARACTERISTICS OF HOME BUYERS
Florida Number of Total Respondents = 557
Exhibit 1-1AGE OF HOME BUYERS, BY REGION(Percentage Distribution)
Florida U.S. Northeast Midwest South West18 to 24 years 3% 3% 2% 4% 4% 3%25 to 34 years 16 30 34 35 27 2735 to 44 years 14 21 24 22 20 1945 to 54 years 17 18 17 16 19 1855 to 64 years 24 16 13 13 16 1965 to 74 years 20 10 8 7 11 1275 years or older 7 3 3 3 4 3Median age (years) 55 42 40 39 44 45
BUYERS WHO PURCHASED A HOME IN THE
2012 National Association of Realtors® Profile of Home Buyers and Sellers

CHARACTERISTICS OF HOME BUYERS
Exhibit 1-2HOUSEHOLD INCOME OF HOME BUYERS, BY REGION, 2011(Percentage Distribution)
Florida U.S. Northeast Midwest South WestLess than $25,000 8% 5% 2% 5% 6% 5%$25,000 to $34,999 6 7 5 8 7 6$35,000 to $44,999 11 9 7 9 9 9$45,000 to $54,999 8 9 9 11 9 9$55,000 to $64,999 9 8 9 10 8 8$65,000 to $74,999 9 9 9 11 8 10$75,000 to $84,999 9 9 10 10 8 9$85,000 to $99,999 10 11 12 10 10 11$100,000 to $124,999 12 12 13 13 12 12$125,000 to $149,999 7 7 9 6 8 7$150,000 to $174,999 4 4 4 4 5 4$175,000 to $199,999 2 3 3 1 3 3$200,000 or more 5 8 8 5 8 8Median income (2011) $74,200 $78,600 $83,300 $72,900 $80,400 $79,000
BUYERS WHO PURCHASED A HOME IN THE
2012 National Association of Realtors® Profile of Home Buyers and Sellers

CHARACTERISTICS OF HOME BUYERS
Exhibit 1-3ADULT COMPOSITION OF HOME BUYER HOUSEHOLDS, 2001-2012(Percentage Distribution)
Florida
2012Married couple 66%Single female 16Single male 9Unmarried couple 7Other 2
U.S.
2001 2003 2004 2005 2006 2007 2008 2009 2010 2011 2012Married couple 68% 59% 62% 61% 61% 62% 61% 60% 58% 64% 65%Single female 15 21 18 21 22 20 20 21 20 18 16Single male 7 11 8 9 9 9 10 10 12 10 9Unmarried couple 7 8 9 7 7 7 7 8 8 7 8Other 3 1 2 2 1 2 2 1 1 1 2
2012 National Association of Realtors® Profile of Home Buyers and Sellers

CHARACTERISTICS OF HOME BUYERS
Exhibit 1-4NUMBER OF CHILDREN UNDER THE AGE OF 18 RESIDING IN HOUSEHOLD(Percentage Distribution of Households)
Florida
One 10%Two 10%Three or more 6%None 74%
U.S.
One 18%Two 16%Three or more 7%None 59%
One, 10%Two, 10%
Three or more, 6%
None, 74%
NUMBER OF CHILDREN UNDER THE AGE OF 18 RESIDING IN HOUSEHOLD
(Percentage Distribution of Households)
Florida
One, 18%
Two, 16%
Three or more, 7%
None, 59%
NUMBER OF CHILDREN UNDER THE AGE OF 18 RESIDING IN HOUSEHOLD
(Percentage Distribution of Households)
U.S.
2012 National Association of Realtors® Profile of Home Buyers and Sellers

CHARACTERISTICS OF HOME BUYERS
Exhibit 1-5 RACE/ETHNICITY OF HOME BUYERS, BY REGION(Percent of Respondents)
Florida U.S. Northeast Midwest South WestWhite/Caucasian 84% 85% 89% 92% 84% 78%Hispanic/Latino 10 7 3 2 7 12Black/African-American 4 4 3 3 7 2Asian/Pacific Islander 1 4 4 3 3 8Other 3 2 2 1 2 3
Note: Respondents were permitted to select as many races and ethnicities as they felt applicable. The percentage distribution may therefore sum to more than 100 percent.
BUYERS WHO PURCHASED A HOME IN THE
2012 National Association of Realtors® Profile of Home Buyers and Sellers

CHARACTERISTICS OF HOME BUYERS
Exhibit 1-6 RACE/ETHNICITY OF HOME BUYERS, BY ADULT COMPOSITION OF HOUSEHOLD(Percent of Respondents)
Florida
All BuyersMarried couple
Single female
Single male
Unmarried couple Other
Children under 18 in home
No children in home
White/Caucasian 84% 85% 85% 80% 87% 67% 74% 89%Black/African-American 4 3 6 4 5 8 5 3Hispanic/Latino 10 9 9 13 8 17 21 5Asian/Pacific Islander 1 1 * 2 3 * 1 1Other 3 3 1 2 3 8 2 2
* Less than 1 percent
U.S.
All BuyersMarried couple
Single female
Single male
Unmarried couple Other
Children under 18 in home
No children in home
White/Caucasian 85% 86% 79% 84% 85% 73% 81% 88%Hispanic/Latino 7 7 6 7 8 9 10 4Black/African-American 4 3 9 4 6 13 5 4Asian/Pacific Islander 4 5 4 4 3 2 5 4Other 2 2 3 3 3 4 2 2
Note: Respondents were permitted to select as many races and ethnicities as they felt applicable. The percentage distribution may therefore sum to more than 100 percent.
ADULT COMPOSITION OF HOUSEHOLD
ADULT COMPOSITION OF HOUSEHOLD CHILDREN IN HOME
CHILDREN IN HOME
2012 National Association of Realtors® Profile of Home Buyers and Sellers

CHARACTERISTICS OF HOME BUYERS
Exhibit 1-7PRIMARY LANGUAGE SPOKEN IN HOME BUYER HOUSEHOLD, BY REGION(Percentage Distribution)
Florida U.S. Northeast Midwest South WestEnglish 94% 96% 97% 98% 95% 94%Other 6 4 3 3 5 6
BUYERS WHO PURCHASED A HOME IN THE
2012 National Association of Realtors® Profile of Home Buyers and Sellers

CHARACTERISTICS OF HOME BUYERS
Exhibit 1-8NATIONAL ORIGIN OF HOME BUYERS, BY REGION(Percentage Distribution)
Florida U.S. Northeast Midwest South WestBorn in U.S. 86% 90% 90% 94% 91% 86%Not born in U.S. 14 10 10 6 9 14
BUYERS WHO PURCHASED A HOME IN THE
2012 National Association of Realtors® Profile of Home Buyers and Sellers

CHARACTERISTICS OF HOME BUYERS
Exhibit 1-9FIRST-TIME HOME BUYERS(Percent of all Home Buyers)
Year Percentage2001 42%2003 40%2004 40%2005 40%2006 36%2007 39%2008 41%2009 47%2010 50%2011 37%2012 US 39%
2012 Florida 25%
42%40% 40% 40%
36%39%
41%
47%50%
37%39%
25%
20%
25%
30%
35%
40%
45%
50%
55%
60%
65%
70%
75%
80%
2001 2003 2004 2005 2006 2007 2008 2009 2010 2011 2012 2012
FIRST-TIME HOME BUYERS(Percent of all Home Buyers)
U.S.
2012 National Association of Realtors® Profile of Home Buyers and Sellers

CHARACTERISTICS OF HOME BUYERS
Exhibit 1-10FIRST-TIME HOME BUYERS, BY REGION(Percent of all Home Buyers)
Florida 25%U.S. 39%Northeast 45%Midwest 40%South 37%West 39%
25%
39%
45%40%
37% 39%
20%
25%
30%
35%
40%
45%
50%
55%
60%
65%
70%
75%
80%
Florida U.S. Northeast Midwest South West
FIRST-TIME HOME BUYERS, BY REGION(Percent of all Home Buyers)
2012 National Association of Realtors® Profile of Home Buyers and Sellers

CHARACTERISTICS OF HOME BUYERS
Exhibit 1-11FIRST-TIME AND REPEAT HOME BUYERS BY HOUSEHOLD TYPE(Percentage Distribution of Households)
Florida Florida
Married couple 53% Married couple 70%Single female 17% Single female 16%Single male 14% Single male 7%Unmarried couple 13% Unmarried couple 5%Other 2% Other 2%
U.S. U.S.
Married couple 55% Married couple 72%Single female 19% Single female 14%Single male 11% Single male 8%Unmarried couple 14% Unmarried couple 5%Other 1% Other 2%
Married couple, 53%
Single female, 17%
Single male, 14%
Unmarried couple, 13%
Other, 2%
FIRST-TIME HOME BUYERS(Percentage Distribution)
Florida
Married couple, 55%
Single female, 19%
Single male, 11%
Unmarried couple, 14%
Other, 1%
FIRST-TIME HOME BUYERS(Percentage Distribution)
U.S.
Married couple, 70%
Single female, 16%
Single male, 7%
Unmarried couple, 5% Other, 2%
REPEAT HOME BUYERS(Percentage Distribution)
Florida
Married couple, 72%
Single female, 14%
Single male, 8%
Unmarried couple, 5% Other, 2%
REPEAT HOME BUYERS(Percentage Distribution)
U.S.
2012 National Association of Realtors® Profile of Home Buyers and Sellers

CHARACTERISTICS OF HOME BUYERS
Exhibit 1-12FIRST-TIME AND REPEAT HOME BUYERS BY CHILDREN IN HOUSEHOLD(Percentage Distribution of Households)
Florida Florida
One 21% One 7%Two 13% Two 9%Three or more 6% Three or more 6%None 60% None 78%
U.S. U.S.
One 22% One 15%Two 13% Two 17%Three or more 7% Three or more 8%None 58% None 59%
One, 21%
Two, 13%
Three or more, 6%
None, 60%
FIRST-TIME HOME BUYERS(Percentage Distribution)
Florida
One, 22%
Two, 13%
Three or more, 7%
None, 58%
FIRST-TIME HOME BUYERS(Percentage Distribution)
U.S.
One, 7%
Two, 9%
Three or more, 6%
None, 78%
REPEAT HOME BUYERS(Percentage Distribution)
Florida
One, 15%
Two, 17%
Three or more, 8%
None, 59%
REPEAT HOME BUYERS(Percentage Distribution)
U.S
2012 National Association of Realtors® Profile of Home Buyers and Sellers

CHARACTERISTICS OF HOME BUYERS
Exhibit 1-13AGE OF FIRST-TIME AND REPEAT BUYERS(Percentage Distribution)
Florida
All Buyers First-time Buyers Repeat Buyers18 to 24 years 3% 9% 0%25 to 34 years 16 42 735 to 44 years 14 25 1045 to 54 years 17 15 1855 to 64 years 24 5 3065 to 74 years 20 3 2675 years or older 7 1 9Median age (years) 55 34 60
Married couple 56 34 60Single female 58 38 60Single male 56 37 64Unmarried couple 38 28 56Other 53 36 57
U.S.
All Buyers First-time Buyers Repeat Buyers18 to 24 years 3% 9% *25 to 34 years 30 54 1435 to 44 years 21 19 2245 to 54 years 18 10 2255 to 64 years 16 5 2265 to 74 years 10 2 1575 years or older 3 * 5Median age (years) 42 31 51
Married couple 42 31 49Single female 48 35 55Single male 46 29 55Unmarried couple 33 28 49Other 55 47 57
* Less than 1 percent
2012 National Association of Realtors® Profile of Home Buyers and Sellers

CHARACTERISTICS OF HOME BUYERS
Exhibit 1-14HOUSEHOLD INCOME OF FIRST-TIME AND REPEAT BUYERS, 2011(Percentage Distribution)
Florida
All Buyers First-time Buyers Repeat BuyersLess than $25,000 8% 11% 7%$25,000 to $34,999 6 9 4$35,000 to $44,999 11 18 8$45,000 to $54,999 8 11 7$55,000 to $64,999 9 11 9$65,000 to $74,999 9 10 9$75,000 to $84,999 9 7 9$85,000 to $99,999 10 5 12$100,000 to $124,999 12 8 13$125,000 to $149,999 7 5 8$150,000 to $174,999 4 3 5$175,000 to $199,999 2 2 2$200,000 or more 5 1 7Median income (2011) $74,200 $55,600 $82,200
Married couple $85,700 $68,300 $91,000Single female $44,300 $38,600 $49,500Single male $44,200 $39,100 $53,300Unmarried couple $82,400 $62,500 $94,800Other $55,100 $30,000 $60,000
* Less than 1 percent
U.S.All Buyers First-time Buyers Repeat Buyers
Less than $25,000 5% 7% 4%$25,000 to $34,999 7 10 5$35,000 to $44,999 9 13 6$45,000 to $54,999 9 13 7$55,000 to $64,999 8 12 6$65,000 to $74,999 9 11 8$75,000 to $84,999 9 9 9$85,000 to $99,999 11 8 12$100,000 to $124,999 12 8 15$125,000 to $149,999 7 5 9$150,000 to $174,999 4 2 6$175,000 to $199,999 3 1 4$200,000 or more 8 2 11Median income (2011) $78,600 $61,800 $93,100
Married couple $90,400 $70,900 $102,600Single female $51,900 $46,600 $59,900Single male $57,900 $53,100 $68,000Unmarried couple $70,100 $59,600 $97,300Other $53,600 $42,500 $62,100
2012 National Association of Realtors® Profile of Home Buyers and Sellers

CHARACTERISTICS OF HOME BUYERS
Exhibit 1-15RACE/ETHNICITY OF FIRST-TIME AND REPEAT BUYERS(Percent of Respondents)
Florida
All Buyers First-time Buyers Repeat BuyersWhite/Caucasian 84% 74% 88%Black/African-American 4 6 3Asian/Pacific Islander 10 3 1Hispanic/Latino 1 17 7Other 3 3 2
* Less than 1 percent
U.S.
All Buyers First-time Buyers Repeat BuyersWhite/Caucasian 85% 77% 90%Hispanic/Latino 7 10 5Black/African-American 4 7 3Asian/Pacific Islander 4 7 3Other 2 3 2
Note: Respondents were permitted to select as many races and ethnicities as they felt applicable. The percentage distribution may therefore sum to more than 100 percent.
2012 National Association of Realtors® Profile of Home Buyers and Sellers

CHARACTERISTICS OF HOME BUYERS
Exhibit 1-16PRIMARY LANGUAGE SPOKEN IN FIRST-TIME AND REPEAT BUYER HOUSEHOLDS(Percentage Distribution)
Florida
All Buyers First-time Buyers Repeat BuyersEnglish 94% 90% 96%Other 6 10 4
U.S.
All Buyers First-time Buyers Repeat BuyersEnglish 96% 93% 98%Other 4 7 2
2012 National Association of Realtors® Profile of Home Buyers and Sellers

CHARACTERISTICS OF HOME BUYERS
Exhibit 1-17NATIONAL ORIGIN OF FIRST-TIME AND REPEAT BUYERS(Percentage Distribution)
Florida
All Buyers First-time Buyers Repeat BuyersBorn in U.S. 86% 76% 90%Not born in U.S. 14 24 10
U.S.
All Buyers First-time Buyers Repeat BuyersBorn in U.S. 90% 87% 92%Not born in U.S. 10 13 8
2012 National Association of Realtors® Profile of Home Buyers and Sellers

CHARACTERISTICS OF HOME BUYERS
Exhibit 1-18PRIOR LIVING ARRANGEMENT OF FIRST-TIME AND REPEAT BUYERS(Percentage Distribution)
Florida
All BuyersFirst-time
BuyersRepeat Buyers
Rented an apartment or house 40% 75% 29%Owned previous residence 50 3 65Lived with parents, relatives or friends 9 20 5Rented the home buyer ultimately purchased 1 1 1
* Less than 1 percent
U.S.
All BuyersFirst-time
BuyersRepeat Buyers
Rented an apartment or house 46% 76% 26%Owned previous residence 42 3 67Lived with parents, relatives or friends 11 20 6Rented the home buyer ultimately purchased 1 1 1
Note: After selling their previous home, buyers may have rented a home or apartment beforepurchasing their next home. A first-time buyer could have acquired ownership of their previous home(as an inheritance or gift, for example) without having been the buyer of the home. Thus, a first-time buyer could have owned a home prior to their first home purchase.
2012 National Association of Realtors® Profile of Home Buyers and Sellers

CHARACTERISTICS OF HOME BUYERS
Exhibit 1-19PRIOR LIVING ARRANGEMENT, BY ADULT COMPOSITION OF HOUSEHOLD(Percentage Distribution)
Florida
All Buyers
Married couple
Single female
Single male
Unmarried couple Other
Children under 18 in home
No children in home
Rented an apartment or house 40% 40% 31% 47% 57% 33% 61% 33%Owned previous residence 50 55 47 33 32 50 26 58Lived with parents, relatives or friends 9 5 21 18 8 17 12 8Rented the home buyer ultimately purchased 1 0 1 2 3 * 1 1
U.S.
All Buyers
Married couple
Single female
Single male
Unmarried couple Other
Children under 18 in home
No children in home
Rented an apartment or house 46% 42% 47% 52% 63% 37% 50% 44%Owned previous residence 42 49 34 27 20 47 39 44Lived with parents, relatives or friends 11 7 18 20 16 14 10 12Rented the home buyer ultimately purchased 1 1 1 1 1 2 1 1
* Less than 1 percent
Note: After selling their previous home, buyers may have rented a home or apartment beforepurchasing their next home. A first-time buyer could have acquired ownership of their previous home(as an inheritance or gift, for example) without having been the buyer of the home. Thus, a first-time buyer could have owned a home prior to their first home purchase.
ADULT COMPOSITION OF HOUSEHOLD
ADULT COMPOSITION OF HOUSEHOLD CHILDREN IN HOME
CHILDREN IN HOME
2012 National Association of Realtors® Profile of Home Buyers and Sellers

CHARACTERISTICS OF HOME BUYERS
Exhibit 1-20PRIMARY REASON FOR PURCHASING A HOME, FIRST-TIME AND REPEAT BUYERS(Percentage Distribution)
Florida
All BuyersFirst-time
BuyersRepeat Buyers
Desire to own a home 22% 58% 10%Job-related relocation or move 8 2 11Desire for larger home 5 1 7Desire to be closer to family/friends/relatives 8 1 10Change in family situation 4 7 3Desire for a home in a better area 7 2 8Retirement 15 1 20Affordability of homes 10 17 7Tax benefits 0 * 1Desire to be closer to job/school/transit 2 2 2Greater choice of homes on the market 2 2 2Desire for smaller home 5 1 6Desire for a newly built or custom-built home 1 1 1Establish household 2 4 1Financial security 3 1 3Purchased home for family member or relative 1 * 1Desire for vacation home/investment property 1 * 2Other 5 * 7
U.S.
All BuyersFirst-time
BuyersRepeat Buyers
Desire to own a home of my own 30% 60% 11%Desire for larger home 11 3 16Job-related relocation or move 9 3 13Change in family situation 8 9 8Affordability of homes 7 11 5Desire to be closer to family/friends/relatives 6 1 9Desire for a home in a better area 6 3 7Retirement 4 1 7Desire for smaller home 4 * 6Desire to be closer to job/school/transit 4 2 5Establish household 2 3 1Desire for a newly built or custom-built home 2 1 2Financial security 1 1 1Desire for vacation home/investment property 1 * 1Purchased home for family member or relative 1 1 1Tax benefits 1 1 1Greater number of homes on the market for sale/better choic 1 1 1Other 4 2 5
* Less than 1 percent
2012 National Association of Realtors® Profile of Home Buyers and Sellers

CHARACTERISTICS OF HOME BUYERS
Exhibit 1-21PRIMARY REASON FOR PURCHASING A HOME, BY AGE(Percentage Distribution)
Florida
All Buyers 18 to 24 25 to 44 45 to 64
65 or older
Desire to own a home 22% 31% 42% 17% 7%Job-related relocation or move 8 8 11 13 1Desire for larger home 5 * 10 4 3Desire to be closer to family/friends/relatives 8 * 3 7 13Change in family situation 4 8 3 6 2Desire for a home in a better area 7 15 3 6 13Retirement 15 * 1 15 31Affordability of homes 10 31 15 9 5Tax benefits 0 * * 1 1Desire to be closer to job/school/transit 2 * 1 3 1Greater choice of homes on the market 2 * 1 * 3Desire for smaller home 5 * 1 4 9Desire for a newly built or custom-built home 1 * 1 1 2Establish household 2 8 3 1 *Financial security 3 * 1 4 3Purchased home for family member or relative 1 * 1 * 2Desire for vacation home/investment property 1 * * 2 1Other 5 * 3 7 6
U.S.
All Buyers 18 to 24 25 to 44 45 to 64
65 or older
Desire to own a home of my own 30% 51% 41% 20% 8%Desire for larger home 11 3 14 9 6Job-related relocation or move 9 1 9 13 1Change in family situation 8 15 8 9 5Affordability of homes 7 15 8 6 3Desire to be closer to family/friends/relatives 6 * 2 6 24Desire for a home in a better area 6 3 5 6 8Retirement 4 * * 6 16Desire for smaller home 4 * * 6 13Desire to be closer to job/school/transit 4 3 3 5 1Establish household 2 5 3 1 *Desire for a newly built or custom-built home 2 * 1 2 2Financial security 1 1 1 2 2Desire for vacation home/investment property 1 * * 2 2Purchased home for family member or relative 1 * * 1 2Tax benefits 1 * 1 1 1Greater number of homes on the market for sale/better c 1 1 1 1 1Other 4 1 2 5 7
* Less than 1 percentN/A- not applicable
AGE OF HOME BUYER
AGE OF HOME BUYER
2012 National Association of Realtors® Profile of Home Buyers and Sellers

CHARACTERISTICS OF HOME BUYERS
Exhibit 1-22PRIMARY REASON FOR PURCHASING A HOME, BY ADULT COMPOSITION OF HOUSEHOLD(Percentage Distribution)
Florida
All Buyers
Married couple
Single female
Single male
Unmarried couple Other
Children under 18 in home
No children in home
Desire to own a home 22% 17% 33% 33% 27% 33% 33% 19%Job-related relocation or move 8 10 4 4 8 8 17 6Desire for larger home 5 6 4 * 11 8 11 4Desire to be closer to family/friends/relatives 8 8 11 9 * * 4 10Change in family situation 4 2 12 7 5 8 4 4Desire for a home in a better area 7 8 5 9 5 8 5 8Retirement 15 18 9 11 8 8 2 20Affordability of homes 10 9 6 18 19 8 14 9Tax benefits 0 0 1 * * * * 0Desire to be closer to job/school/transit 2 2 1 2 * * 2 1Greater choice of homes on the market 2 2 * * 5 * * 2Desire for smaller home 5 5 7 * 3 8 1 6Desire for a newly built or custom-built home 1 1 * * 3 * 2 1Establish household 2 2 * 2 * * 2 1Financial security 3 3 4 * * * 2 2Purchased home for family member or relative 1 1 1 * * * * 1Desire for vacation home/investment property 1 1 * 2 3 * 2 1Other 5 6 5 2 3 8 2 6
U.S.
All Buyers
Married couple
Single female
Single male
Unmarried couple Other
Children under 18 in home
No children in home
Desire to own a home of my own 30% 24% 41% 36% 48% 39% 29% 31%Desire for larger home 11 14 4 3 8 12 19 6Job-related relocation or move 9 12 3 4 3 2 12 7Change in family situation 8 6 14 11 8 16 10 7Affordability of homes 7 5 8 14 12 7 5 9Desire to be closer to family/friends/relatives 6 7 7 5 1 4 3 8Desire for a home in a better area 6 7 3 4 4 2 6 5Retirement 4 5 3 5 2 4 1 7Desire for smaller home 4 4 5 3 2 7 1 6Desire to be closer to job/school/transit 4 4 2 3 2 * 5 3Establish household 2 2 1 2 4 * 3 2Desire for a newly built or custom-built home 2 2 1 1 1 * 1 2Financial security 1 1 2 2 1 * 1 1Desire for vacation home/investment property 1 1 * 1 * 2 * 1Purchased home for family member or relative 1 1 1 1 * 4 1 1Tax benefits 1 1 1 1 1 * 1 1Greater number of homes on the market for sale/better ch 1 1 1 1 1 * 1 1Other 4 4 4 3 3 3 2 5
* Less than 1 percent
ADULT COMPOSITION OF HOUSEHOLD
ADULT COMPOSITION OF HOUSEHOLD CHILDREN IN HOME
CHILDREN IN HOME
2012 National Association of Realtors® Profile of Home Buyers and Sellers

CHARACTERISTICS OF HOME BUYERS
Exhibit 1-23PRIMARY REASON FOR THE TIMING OF HOME PURCHASE, FIRST-TIME AND REPEAT BUYERS(Percentage Distribution)
Florida
All BuyersFirst-time
BuyersRepeat Buyers
It was just the right time, the buyer was ready to buy a home
33% 42% 30%
It was the best time because of affordability of homes
21 24 20
Did not have much choice, had to purchase 16 12 17It was the best time because of availability of homes for sale
9 9 9
It was the best time because of mortgage financing options available
10 10 10
Other 9 1 12The buyer wished they had waited 2 1 3
U.S.
All BuyersFirst-time
BuyersRepeat Buyers
It was just the right time for me, I was ready to buy a home
37% 43% 34%
It was the best time for me because of affordability of homes
19 22 17
I did not have much choice, I had to purchase when I did
14 9 18
It was the best time for me because of mortgage financing options available
12 16 10
It was the best time for me because of availability of homes for sale
7 5 8
Other 9 5 11I wish I had waited 2 1 2
2012 National Association of Realtors® Profile of Home Buyers and Sellers

CHARACTERISTICS OF HOME BUYERS
Exhibit 1-24PRIMARY REASON FOR THE TIMING OF HOME PURCHASE, BY AGE(Percentage Distribution)
Florida
All Buyers 18 to 24 25 to 44 45 to 64 65 or olderIt was just the right time, the buyer was ready to buy a home
33% 54% 36% 29% 36%
Did not have much choice, had to purchase 16 15 15 18 14It was the best time because of affordability of homes
21 8 24 22 19
It was the best time because of availability of homes for sale
9 15 7 8 8
It was the best time because of mortgage financing options available
10 8 13 12 5
Other 9 * 3 9 16The buyer wished they had waited 2 * 1 3 2
U.S.
All Buyers 18 to 24 25 to 44 45 to 64 65 or olderIt was just the right time for me, I was ready to buy a home
37% 44% 39% 34% 40%
It was the best time for me because of affordability of homes
1922 20 17 16
I did not have much choice, I had to purchase when I did
14 6 12 20 13
It was the best time for me because of mortgage financing options available
12 15 15 11 7
It was the best time for me because of availability of homes for sale
7 5 6 7 8
Other 9 6 7 10 14I wish I had waited 2 2 1 2 2
AGE OF HOME BUYER
AGE OF HOME BUYER
2012 National Association of Realtors® Profile of Home Buyers and Sellers

CHARACTERISTICS OF HOME BUYERS
Exhibit 1-25NUMBER OF HOMES CURRENTLY OWNED, BY AGE(Percentage Distribution)
Florida
All Buyers 18 to 24 25 to 44 45 to 64 65 or olderOne 79% 92% 83% 76% 81%Two 16 8 15 18 16Three or more 4 * 2 7 3
U.S.
All Buyers 18 to 24 25 to 44 45 to 64 65 or olderOne 81% 99% 85% 74% 76%Two 15 1 12 19 18Three or more 5 * 3 7 7
AGE OF HOME BUYER
AGE OF HOME BUYER
2012 National Association of Realtors® Profile of Home Buyers and Sellers

CHARACTERISTICS OF HOME BUYERS
Exhibit 1-26OTHER HOMES OWNED, BY AGE(Percentage Distribution)
Florida
All Buyers 18 to 24 25 to 44 45 to 64 65 or olderRecently purchased home only 75% 92% 80% 73% 75%One or more vacation homes 4 * 2 4 4One or more investment properties 10 8 11 12 7Primary residence 5 * 2 5 6Previous homes that buyer is trying to sell 5 * 4 4 7Other 3 * 2 3 4
U.S.
All Buyers 18 to 24 25 to 44 45 to 64 65 or olderRecently purchased home only 77% 97% 83% 69% 67%One or more investment properties 11 1 10 13 11Previous homes that buyer is trying to sell 5 * 3 6 9Primary residence 5 2 3 7 8One or more vacation homes 4 * 2 5 8Other 3 * 1 4 4
* Less than 1 percent
AGE OF HOME BUYER
AGE OF HOME BUYER
2012 National Association of Realtors® Profile of Home Buyers and Sellers

CHARACTERISTICS OF HOMES PURCHASED
Exhibit 2-1 NEW AND PREVIOUSLY OWNED HOMES PURCHASED, 2001-2012Exhibit 2-2 NEW AND PREVIOUSLY OWNED HOMES PURCHASED, BY REGIONExhibit 2-3 TYPE OF HOME PURCHASED, BY LOCATIONExhibit 2-4 TYPE OF HOME PURCHASED BY FIRST-TIME AND REPEAT BUYERS, AND BUYERS OF NEW
AND PREVIOUSLY OWNED HOMESExhibit 2-5 TYPE OF HOME PURCHASED, BY ADULT COMPOSITION OF HOUSEHOLDExhibit 2-6 LOCATION OF HOME PURCHASED, BY REGIONExhibit 2-7 LOCATION OF HOME PURCHASED BY FIRST-TIME AND REPEAT BUYERS, AND BUYERS OF
NEW AND PREVIOUSLY OWNED HOMESExhibit 2-8 LOCATION OF HOME PURCHASED VERSUS LOCATION OF HOME SOLDExhibit 2-9 SENIOR RELATED HOUSING BY TYPE OF HOME PURCHASED AND LOCATIONExhibit 2-10 DISTANCE BETWEEN HOME PURCHASED AND PREVIOUS RESIDENCEExhibit 2-11 FACTORS INFLUENCING NEIGHBORHOOD CHOICE, BY LOCATIONExhibit 2-12 FACTORS INFLUENCING NEIGHBORHOOD CHOICE, BY ADULT COMPOSITION OF
HOUSEHOLD AND CHILDREN IN HOUSHOLDExhibit 2-13 PRICE OF HOME PURCHASED, BY REGIONExhibit 2-14 PRICE OF HOME PURCHASED, NEW AND PREVIOUSLY OWNED HOMESExhibit 2-15 PRICE OF HOME PURCHASED, FIRST-TIME AND REPEAT BUYERSExhibit 2-16 PURCHASE PRICE COMPARED WITH ASKING PRICE, BY REGIONExhibit 2-17 SIZE OF HOME PURCHASED, FIRST-TIME AND REPEAT BUYERS, AND BUYERS OF NEW
AND PREVIOUSLY OWNED HOMESExhibit 2-18 SIZE OF HOME PURCHASED, BY ADULT COMPOSITION OF HOUSEHOLDExhibit 2-19 HOME SIZE AND PRICE PER SQUARE FOOT, BY REGIONExhibit 2-20 NUMBER OF BEDROOMS AND BATHROOMS, BY FIRST-TIME AND REPEAT BUYERS, AND
BUYERS OF NEW AND PREVIOUSLY OWNED HOMESExhibit 2-21 NUMBER OF BEDROOMS AND BATHROOMS, BY ADULT HOUSEHOLD COMPOSITION AND
CHILDREN IN HOUSEHOLDExhibit 2-22 YEAR HOME BUILT, BY REGIONExhibit 2-23 IMPORTANCE OF COMMUTING COSTSExhibit 2-24 IMPORTANCE OF HOME'S ENVIRONMENTALLY FRIENDLY FEATURESExhibit 2-25 ENVIRONMENTALLY FRIENDLY FEATURES CONSIDERED "VERY IMPORTANT", BY REGIONExhibit 2-26 ENVIRONMENTALLY FRIENDLY FEATURES CONSIDERED "VERY IMPORTANT", BY YEAR
HOME WAS BUILTExhibit 2-27 CHARACTERISTICS OF HOME ON WHICH BUYER COMPROMISED, BY LOCATIONExhibit 2-28 CHARACTERISTICS OF HOME ON WHICH BUYER COMPROMISED, FIRST-TIME AND REPEAT
BUYERS, AND BUYERS OF NEW AND PREVIOUSLY OWNED HOMESExhibit 2-29 CHARACTERISTICS OF HOME ON WHICH BUYER COMPROMISED, BY ADULT COMPOSITION
OF HOUSEHOLDExhibit 2-30 EXPECTED LENGTH OF TENURE IN HOME PURCHASED, FIRST-TIME AND REPEAT BUYERS,
AND BUYERS OF NEW AND PREVIOUSLY OWNED HOMESExhibit 2-31 EXPECTED LENGTH OF TENURE IN HOME PURCHASED, BY AGEExhibit 2-32 TYPE OF HOME, PRIMARY RESIDENCE AND SECOND HOMEExhibit 2-33 LOCATION OF HOME, PRIMARY RESIDENCE AND SECOND HOME
2012 National Association of Realtors® Profile of Home Buyers and Sellers

CHARACTERISTICS OF HOMES PURCHASED
Exhibit 2-1NEW AND PREVIOUSLY OWNED HOMES PURCHASED, 2001-2012(Percentage Distribution)
NewPreviously
Owned2012 20% 80%
Florida
20%
80%
0%
20%
40%
60%
80%
100%
2012
NEW AND PREVIOUSLY OWNED HOMES PURCHASED(Percentage Distribution)
New Previously Owned
Florida
2012 National Association of Realtors® Profile of Home Buyers and Sellers

U.S.
NewPreviously
Owned2001 21% 79%2003 28% 72%2004 21% 79%2005 23% 77%2006 22% 78%2007 23% 77%2008 21% 79%2009 18% 82%2010 15% 85%2011 16% 84%2012 16% 84%
21%28%
21% 23% 22% 23% 21% 18% 15% 16% 16%
79%72%
79% 77% 78% 77% 79% 82% 85% 84% 84%
0%
20%
40%
60%
80%
100%
2001 2003 2004 2005 2006 2007 2008 2009 2010 2011 2012
NEW AND PREVIOUSLY OWNED HOMES PURCHASED(Percentage Distribution)
New Previously Owned
U.S.
2012 National Association of Realtors® Profile of Home Buyers and Sellers

CHARACTERISTICS OF HOMES PURCHASED
Exhibit 2-2NEW AND PREVIOUSLY OWNED HOMES PURCHASED, BY REGION(Percentage Distribution)
U.S. Northeast Midwest South WestNew 20% 16% 9% 11% 21% 15%Previously Owned 80 84 91 89 79 85
BUYERS WHO PURCHASED A HOME IN THE
Florida
2012 National Association of Realtors® Profile of Home Buyers and Sellers

CHARACTERISTICS OF HOMES PURCHASED
Exhibit 2-3TYPE OF HOME PURCHASED, BY LOCATION(Percentage Distribution)
Florida
All Buyers
Suburb/ Subdivision
Small town
Urban/ Central city
Rural area
Resort/ Recreation
areaDetached single-family home 76% 80% 77% 66% 80% 63%Townhouse/row house 5 5 2 9 2 3Apartment/condo in building with 5 or more units
9 6 7 22 2 20
Duplex/apartment/condo in 2 to 4 unit building
3 4 4 2 0 7
Other 7 5 10 2 17 7
* Less than 1 percent
U.S.
All Buyers
Suburb/ Subdivision
Small town
Urban/ Central city
Rural area
Resort/ Recreation
areaDetached single-family home 79% 85% 81% 64% 79% 63%Townhouse/row house 7 6 5 11 3 5Apartment/condo in building with 5 or more units
6 4 3 16 1 15
Duplex/apartment/condo in 2 to 4 unit building
2 1 2 3 2 3
Other 7 4 8 6 15 14
BUYERS WHO PURCHASED A HOME IN A
BUYERS WHO PURCHASED A HOME IN A
2012 National Association of Realtors® Profile of Home Buyers and Sellers

CHARACTERISTICS OF HOMES PURCHASED
Exhibit 2-4
(Percentage Distribution)
Florida
All Buyers
First-time Buyers
Repeat Buyers
New Homes
Previously Owned Homes
Detached single-family home 76% 84% 73% 70% 77%Townhouse/row house 5 8 4 14 3Apartment/condo in building with 5 or more units 9 0 12 7 10Duplex/apartment/condo in 2 to 4 unit building 3 1 4 2 4Other 7 7 7 7 7
* Less than 1 percent
U.S.
All Buyers
First-time Buyers
Repeat Buyers
New Homes
Previously Owned Homes
Detached single-family home 79% 77% 81% 79% 79%Townhouse/row house 7 8 6 9 6Apartment/condo in building with 5 or more units 6 6 6 5 6Duplex/apartment/condo in 2 to 4 unit building 2 2 2 2 2Other 7 7 6 5 7
BUYERS OF
BUYERS OF
TYPE OF HOME PURCHASED BY FIRST-TIME AND REPEAT BUYERS, AND BUYERS OF NEW AND PREVIOUSLY OWNED HOMES
2012 National Association of Realtors® Profile of Home Buyers and Sellers

CHARACTERISTICS OF HOMES PURCHASED
Exhibit 2-5
(Percentage Distribution)
Florida
All Buyers
Married couple
Single female
Single male
Unmarried couple Other
Children under 18 in home
No children in home
Detached single-family home 76% 78% 67% 65% 90% 73% 88% 72%Townhouse/row house 5 5 4 11 0 0 4 5Apartment/condo in building with 5 or more units 9 6 20 13 5 9 3 11Duplex/apartment/condo in 2 to 4 unit building 3 3 4 7 3 0 0 4Other 7 7 6 4 3 18 5 7
* Less than 1 percent
U.S.
All Buyers
Married couple
Single female
Single male
Unmarried couple Other
Children under 18 in home
No children in home
Detached single-family home 79% 84% 67% 69% 80% 80% 86% 75%Townhouse/row house 7 5 10 11 8 4 5 8Apartment/condo in building with 5 or more units 6 3 11 12 5 3 2 8Duplex/apartment/condo in 2 to 4 unit building 2 2 4 3 1 3 1 2Other 7 7 8 6 6 10 6 7
TYPE OF HOME PURCHASED, BY ADULT COMPOSITION OF HOUSEHOLD
ADULT COMPOSITION OF HOUSEHOLD
ADULT COMPOSITION OF HOUSEHOLD CHILDREN IN HOME
CHILDREN IN HOME
2012 National Association of Realtors® Profile of Home Buyers and Sellers

CHARACTERISTICS OF HOMES PURCHASED
Exhibit 2-6LOCATION OF HOME PURCHASED, BY REGION(Percentage Distribution)
U.S Northeast Midwest South WestSuburb/Subdivision 51% 51% 38% 56% 57% 45%Small town 15 18 30 19 14 17Urban area/Central city 12 17 15 16 15 22Rural area 11 12 16 9 11 13Resort/Recreation area 11 3 2 0 4 3
BUYERS WHO PURCHASED A HOME IN THEFlorida
2012 National Association of Realtors® Profile of Home Buyers and Sellers

CHARACTERISTICS OF HOMES PURCHASED
Exhibit 2-7
(Percentage Distribution)
Florida
All Buyers
First-time Buyers
Repeat Buyers
New Homes
Previously Owned Homes
Suburb/Subdivision 51% 53% 50% 56% 50%Small town 15 17 14 11 16Urban area/Central city 12 16 11 13 12Rural area 11 13 10 8 11Resort/Recreation area 11 1 15 12 11
U.S.
All Buyers
First-time Buyers
Repeat Buyers
New Homes
Previously Owned Homes
Suburb/Subdivision 51% 47% 54% 62% 49%Small town 18 19 17 14 18Urban area/Central city 17 23 13 11 18Rural area 12 11 12 10 12Resort/Recreation area 3 1 4 3 3
BUYERS OF
LOCATION OF HOME PURCHASED BY FIRST-TIME AND REPEAT BUYERS, AND BUYERS OF NEW AND PREVIOUSLY OWNED HOMES
BUYERS OF
2012 National Association of Realtors® Profile of Home Buyers and Sellers

CHARACTERISTICS OF HOMES PURCHASED
Exhibit 2-8LOCATION OF HOME PURCHASED VERSUS LOCATION OF HOME SOLD(Percentage Distribution Among those that Sold a Home)
Florida
Suburb/ Subdivision
Small town
Urban/ Central city
Rural area
Resort/ Recreation
areaSuburb/Subdivision 30% 3% 4% 5% 9%Small town 7 5 1 2 3Urban area/Central city 3 2 4 1 1Rural area 8 3 1 3 1Resort/Recreation area 2 0 0 0 3
U.S.
Suburb/ Subdivision
Small town
Urban/ Central city
Rural area
Resort/ Recreation
areaSuburb/Subdivision 26% 9% 8% 6% 1%Small town 10 3 3 2 1Urban area/Central city 7 3 2 2 1Rural area 7 2 2 2 1Resort/Recreation area 1 * * * *
* Less than 1 percent
LOCATION OF HOME
SOLD
LOCATION OF HOME PURCHASED
LOCATION OF HOME PURCHASED
LOCATION OF HOME
SOLD
2012 National Association of Realtors® Profile of Home Buyers and Sellers

CHARACTERISTICS OF HOMES PURCHASED
Exhibit 2-9SENIOR RELATED HOUSING BY TYPE OF HOME PURCHASED AND LOCATION(Percentage Distribution)
FloridaAll buyers over
50Share who purchased a home in senior related housing 27%
Type of home purchasedDetached single-family home 57%Townhouse/row house 4Apartment/condo in building with 5 or more units 16Duplex/apartment/condo in 2 to 4 unit building 10Other 14LocationSuburb/ Subdivision 42%Small town 18Urban/ Central city 3Rural area 8Resort/ Recreation area 30
U.S.All buyers over
50Share who purchased a home in senior related housing 14%
Type of home purchasedDetached single-family home 63%Townhouse/row house 8Apartment/condo in building with 5 or more units 12Duplex/apartment/condo in 2 to 4 unit building 7Other 11LocationSuburb/ Subdivision 45%Small town 21Urban/ Central city 10Rural area 7Resort/ Recreation area 17
Buyers over 50 who purchased senior related housing:
Buyers over 50 who purchased senior related housing:
2012 National Association of Realtors® Profile of Home Buyers and Sellers

CHARACTERISTICS OF HOMES PURCHASED
Exhibit 2-10DISTANCE BETWEEN HOME PURCHASED AND PREVIOUS RESIDENCE(Median Miles)
MilesFlorida 5U.S. 11Northeast 9Midwest 10South 14West 12
5
11
910
14
12
0
2
4
6
8
10
12
14
16
18
20
Florida U.S. Northeast Midwest South West
DISTANCE BETWEEN HOME PURCHASED AND PREVIOUS RESIDENCE
(Median Miles)
2012 National Association of Realtors® Profile of Home Buyers and Sellers

CHARACTERISTICS OF HOMES PURCHASED
Exhibit 2-11FACTORS INFLUENCING NEIGHBORHOOD CHOICE, BY LOCATION(Percent of Respondents)
Florida
All Buyers
Suburb/ Subdivision
Small town
Urban/ Central
cityRural area
Resort/ Recreation
areaQuality of the neighborhood 59% 62% 61% 61% 38% 55%Convenient to job 33 35 38 46 29 13Overall affordability of homes 36 39 37 30 41 18Convenient to friends/family 31 33 34 33 21 30Convenient to shopping 29 31 21 29 21 43Quality of the school district 15 18 12 15 14 3Design of neighborhood 29 32 22 32 19 30Convenient to schools 18 21 15 29 14 2Convenient to entertainment/leisure activities 24 19 17 35 10 58Convenient to parks/recreational facilities 17 14 21 21 7 28Availability of larger lots or acreage 11 9 12 8 35 #N/AConvenient to health facilities 15 14 15 9 12 32Home in a planned community 15 16 11 5 5 33Convenient to public transportation 3 3 0 6 2 2Green (environmentally friendly) community features 7 8 4 5 3 10Convenient to airport 10 10 5 9 9 20Other 7 4 9 6 12 #N/A
* Less than 1 percent
BUYERS WHO PURCHASED A HOME IN A
2012 National Association of Realtors® Profile of Home Buyers and Sellers

U.S.
All Buyers
Suburb/ Subdivision
Small town
Urban/ Central
cityRural area
Resort/ Recreation
areaQuality of the neighborhood 61% 68% 55% 61% 41% 53%Convenient to job 43 47 36 51 33 13Overall affordability of homes 39 41 39 38 34 21Convenient to friends/family 35 37 34 35 34 24Design of neighborhood 26 29 20 28 18 29Convenient to shopping 26 28 18 31 19 24Quality of the school district 25 30 22 15 22 6Convenient to schools 22 25 22 20 19 3Convenient to entertainment/leisure activities 19 20 10 33 8 34Convenient to parks/recreational facilities 18 18 15 22 11 29Availability of larger lots or acreage 16 14 16 7 45 4Convenient to health facilities 10 10 9 12 9 19Home in a planned community 8 10 6 3 4 29Convenient to public transportation 6 4 3 21 2 2Convenient to airport 5 5 3 8 3 14Green (environmentally friendly) community features 5 5 4 5 3 7Other 5 4 5 5 8 14
BUYERS WHO PURCHASED A HOME IN A
2012 National Association of Realtors® Profile of Home Buyers and Sellers

CHARACTERISTICS OF HOMES PURCHASED
Exhibit 2-12FACTORS INFLUENCING NEIGHBORHOOD CHOICE, BY ADULT COMPOSITION OF HOUSEHOLD AND CHILDREN IN HOUSHOLD(Percent of Respondents)
Florida
All Buyers
Married couple
Single female
Single male
Unmarried couple Other
Children under 18 in home
No children in home
Quality of the neighborhood 59% 61% 55% 51% 68% 25% 60% 59%Convenient to job 33 31 37 38 49 25 44 31Overall affordability of homes 36 32 45 47 32 50 42 34Convenient to friends/family 31 28 48 31 22 17 28 34Convenient to shopping 29 31 22 44 19 25 24 32Quality of the school district 15 17 14 2 14 8 43 6Design of neighborhood 29 33 21 18 27 33 26 31Convenient to schools 18 20 17 11 14 8 57 5Convenient to entertainment/leisure activities 24 26 18 24 19 25 13 27Convenient to parks/recreational facilities 17 19 11 16 14 8 16 16Availability of larger lots or acreage 11 13 7 7 5 8 12 11Convenient to health facilities 15 17 11 18 5 8 7 18Home in a planned community 15 19 7 2 8 17 5 18Convenient to public transportation 3 3 2 2 0 0 2 3Green (environmentally friendly) community features 7 6 8 16 0 8 8 7Convenient to airport 10 12 2 7 8 17 7 10Other 7 6 7 7 5 17 5 7
* Less than 1 percent
ADULT COMPOSITION OF HOUSEHOLD CHILDREN IN HOME
2012 National Association of Realtors® Profile of Home Buyers and Sellers

U.S.
All Buyers
Married couple
Single female
Single male
Unmarried couple Other
Children under 18 in home
No children in home
Quality of the neighborhood 61% 64% 57% 51% 61% 41% 63% 61%Convenient to job 43 43 42 42 50 25 46 42Overall affordability of homes 39 37 41 42 44 37 38 39Convenient to friends/family 35 33 45 37 37 31 32 38Design of neighborhood 26 27 24 21 27 26 24 28Convenient to shopping 26 25 28 27 27 24 21 29Quality of the school district 25 30 13 11 21 11 46 11Convenient to schools 22 27 14 11 19 13 44 8Convenient to entertainment/leisure activities 19 18 19 23 27 10 14 23Convenient to parks/recreational facilities 18 19 13 17 18 13 20 16Availability of larger lots or acreage 16 19 9 12 15 14 19 15Convenient to health facilities 10 11 10 10 7 9 6 13Home in a planned community 8 8 8 7 5 11 6 9Convenient to public transportation 6 5 8 6 9 2 4 7Convenient to airport 5 6 4 3 5 4 4 6Green (environmentally friendly) community features 5 5 6 5 4 3 4 5Other 5 5 7 5 4 13 4 6
ADULT COMPOSITION OF HOUSEHOLD CHILDREN IN HOME
2012 National Association of Realtors® Profile of Home Buyers and Sellers

CHARACTERISTICS OF HOMES PURCHASED
Exhibit 2-13PRICE OF HOME PURCHASED, BY REGION(Percentage Distribution)
U.S. Northeast Midwest South WestLess than $75,000 12% 8% 6% 12% 8% 4%$75,000 to $99,999 10 8 7 11 9 5$100,000 to $124,999 9 9 7 13 10 7$125,000 to $149,999 12 10 7 13 10 8$150,000 to $174,999 11 10 11 10 10 8$175,000 to $199,999 7 8 9 9 7 10$200,000 to $249,999 14 14 16 12 14 15$250,000 to $299,999 8 9 10 7 10 10$300,000 to $349,999 5 7 8 5 6 9$350,000 to $399,999 4 5 7 3 4 5$400,000 to $499,999 4 5 6 3 5 7$500,000 or more 5 8 8 3 7 12Median price $164,500 $189,700 $215,000 $152,400 $185,000 $224,900
BUYERS WHO PURCHASED A HOME IN THE
Florida
2012 National Association of Realtors® Profile of Home Buyers and Sellers

CHARACTERISTICS OF HOMES PURCHASED
Exhibit 2-14PRICE OF HOME PURCHASED, NEW AND PREVIOUSLY OWNED HOMES(Percentage Distribution)
Florida
All Buyers New Home Previously Owned HomeLess than $75,000 12% 2% 15%$75,000 to $99,999 10 6 12$100,000 to $124,999 9 5 10$125,000 to $149,999 12 10 12$150,000 to $174,999 11 11 11$175,000 to $199,999 7 10 6$200,000 to $249,999 14 27 11$250,000 to $299,999 8 11 7$300,000 to $349,999 5 7 5$350,000 to $399,999 4 7 3$400,000 to $499,999 4 6 4$500,000 or more 5 0 6Median price $164,500 $211,000 $154,000
* Less than 1 percent
U.S.
All Buyers New Home Previously Owned HomeLess than $75,000 8% 1% 9%$75,000 to $99,999 8 1 9$100,000 to $124,999 9 5 10$125,000 to $149,999 10 7 10$150,000 to $174,999 10 12 10$175,000 to $199,999 8 10 8$200,000 to $249,999 14 21 13$250,000 to $299,999 9 15 8$300,000 to $349,999 7 9 6$350,000 to $399,999 5 5 4$400,000 to $499,999 5 6 5$500,000 or more 8 8 7Median price $189,700 $232,000 $179,900
BUYERS WHO PURCHASED A
BUYERS WHO PURCHASED A
2012 National Association of Realtors® Profile of Home Buyers and Sellers

CHARACTERISTICS OF HOMES PURCHASED
Exhibit 2-15PRICE OF HOME PURCHASED, FIRST-TIME AND REPEAT BUYERS(Percentage Distribution)
Florida
All Buyers First-time Buyers Repeat BuyersLess than $75,000 12% 13% 12%$75,000 to $99,999 10 16 8$100,000 to $124,999 9 15 7$125,000 to $149,999 12 21 8$150,000 to $174,999 11 8 12$175,000 to $199,999 7 4 8$200,000 to $249,999 14 12 15$250,000 to $299,999 8 7 8$300,000 to $349,999 5 0 7$350,000 to $399,999 4 1 5$400,000 to $499,999 4 0 6$500,000 or more 5 4 5Median price $164,500 $131,500 $187,000
Married couple $210,000 $146,000 $243,450Single female $142,000 $140,556 $145,000Single male $139,000 $130,250 $149,000Unmarried couple $142,000 $142,000 $150,500Other $147,000 $75,000 $226,000
* Less than 1 percent
U.S.All Buyers First-time Buyers Repeat Buyers
Less than $75,000 8% 10% 6%$75,000 to $99,999 8 12 6$100,000 to $124,999 9 13 7$125,000 to $149,999 10 13 8$150,000 to $174,999 10 10 10$175,000 to $199,999 8 9 8$200,000 to $249,999 14 12 15$250,000 to $299,999 9 7 11$300,000 to $349,999 7 5 8$350,000 to $399,999 5 2 6$400,000 to $499,999 5 3 6$500,000 or more 8 4 10Median price $189,700 $154,100 $220,000
Married couple $215,900 $172,000 $240,000Single female $146,200 $127,700 $165,000Single male $155,000 $138,000 $161,300Unmarried couple $152,000 $135,700 $220,000Other $151,200 $149,900 $153,200
2012 National Association of Realtors® Profile of Home Buyers and Sellers

CHARACTERISTICS OF HOMES PURCHASED
Exhibit 2-16PURCHASE PRICE COMPARED WITH ASKING PRICE, BY REGION(Percentage Distribution)
Percent of asking price: U.S. Northeast Midwest South WestLess than 90% 21% 17% 22% 18% 18% 13%90% to 94% 23 20 23 22 21 1595% to 99% 27 32 32 36 31 29100% 21 22 17 17 22 27101% to 110% 6 8 6 5 6 14More than 110% 2 2 1 2 1 3Median (purchase price as a percent of asking price)
95% 97% 95% 96% 96% 98%
Florida
BUYERS WHO PURCHASED A HOME IN THE
2012 National Association of Realtors® Profile of Home Buyers and Sellers

CHARACTERISTICS OF HOMES PURCHASED
Exhibit 2-17
(Percentage Distribution)
Florida
All BuyersFirst-time
BuyersRepeat Buyers
New Homes
Previously Owned Homes
1,000 sq ft or less 0% 0% 1% 0% 1%1,001 to 1,500 sq ft 13 20 10 5 151,501 to 2,000 sq ft 32 38 30 27 332,001 to 2,500 sq ft 27 26 28 32 262,501 to 3,000 sq ft 15 10 17 22 143,001 to 3,500 sq ft 9 5 10 13 83,501 sq ft or more 4 1 5 1 5Median (sq ft) 1,800 1,600 1,910 2,000 1,800Median (sq ft) 1,800 1,600 1,910 2,000 1,800
U.S.
All BuyersFirst-time
BuyersRepeat Buyers
New Homes
Previously Owned Homes
1,000 sq ft or less 1% 2% 1% * 1%1,001 to 1,500 sq ft 14 23 9 5 161,501 to 2,000 sq ft 27 35 22 24 282,001 to 2,500 sq ft 24 24 25 26 242,501 to 3,000 sq ft 15 10 17 18 143,001 to 3,500 sq ft 10 5 13 14 93,501 sq ft or more 9 3 13 12 8Median (sq ft) 1,900 1,600 2,100 2,100 1,800
* Less than 1 percent
SIZE OF HOME PURCHASED, FIRST-TIME AND REPEAT BUYERS, AND BUYERS OF NEW AND PREVIOUSLY OWNED HOMES
BUYERS OF
BUYERS OF
2012 National Association of Realtors® Profile of Home Buyers and Sellers

CHARACTERISTICS OF HOMES PURCHASED
Exhibit 2-18SIZE OF HOME PURCHASED, BY ADULT COMPOSITION OF HOUSEHOLD(Percentage Distribution)
Florida
All BuyersMarried couple
Single female
Single male
Unmarried couple Other
Children under 18 in home
No children in home
1,000 sq ft or less 0% 1% 0% 0% 0% 0% 0% 0%1,001 to 1,500 sq ft 13 7 31 24 8 10 6 61,501 to 2,000 sq ft 32 27 41 49 29 40 25 252,001 to 2,500 sq ft 27 32 15 16 29 20 26 262,501 to 3,000 sq ft 15 18 10 7 13 20 23 233,001 to 3,500 sq ft 9 11 1 4 13 0 12 123,501 sq ft or more 4 5 1 0 8 10 9 9Median (sq ft) 1,800 2,000 1,500 1,500 2,000 1,780 2,060 1,800
U.S.
All BuyersMarried couple
Single female
Single male
Unmarried couple Other
Children under 18 in home
No children in home
1,000 sq ft or less 1% 1% 2% 2% 2% 1% * 2%1,001 to 1,500 sq ft 14 9 27 27 18 16 10 171,501 to 2,000 sq ft 27 23 36 33 30 30 22 302,001 to 2,500 sq ft 24 25 21 23 25 27 24 252,501 to 3,000 sq ft 15 18 6 8 13 14 18 123,001 to 3,500 sq ft 10 12 5 4 9 7 13 83,501 sq ft or more 9 12 3 3 4 5 14 6Median (sq ft) 1,900 2,080 1,530 1,500 1,750 1,800 2,100 1,780
* Less than 1 percent
ADULT COMPOSITION OF HOUSEHOLD
ADULT COMPOSITION OF HOUSEHOLD CHILDREN IN HOME
CHILDREN IN HOME
2012 National Association of Realtors® Profile of Home Buyers and Sellers

CHARACTERISTICS OF HOMES PURCHASED
Exhibit 2-19HOME SIZE AND PRICE PER SQUARE FOOT, BY REGION(Median)
U.S. Northeast Midwest South WestAll homes purchased
Square feet 1,800 1,900 1,000 1,800 2,000 1,800Price per square foot $89 $100 $120 $90 $90 $120
Detached single-family homeSquare feet 2,000 2,000 1,900 1,900 2,100 1,920Price per square foot $89 $100 $120 $90 $90 $120
Townhouse or row houseSquare feet 1,530 1,620 1,490 1,670 1,700 1,600Price per square foot $103 $120 $130 $90 $130 $130
Duplex/apartment/condo in 2-4 unit buildingSquare feet 1,450 1,500 1,850 1,700 1,500 1,300Price per square foot $92 $100 $110 $90 $80 $140
Apartment/condo in building with 5 or more unitsSquare feet 1,290 1,140 1,050 1,360 1,200 1,040Price per square foot $79 $150 $220 $90 $120 $240
BUYERS WHO PURCHASED A HOME IN THE
Florida
2012 National Association of Realtors® Profile of Home Buyers and Sellers

CHARACTERISTICS OF HOMES PURCHASED
Exhibit 2-20NUMBER OF BEDROOMS AND BATHROOMS, BY FIRST-TIME AND REPEAT BUYERS, AND BUYERS OF NEW VS PREVIOUSLY OWNED HOMES(Percentage Distribution)
Florida
All Buyers
First-time Buyers
Repeat Buyers
New Homes
Previously Owned Homes
One bedroom 2% 1% 2% 1% 2%Two bedrooms 22 14 25 15 24Three bedrooms or more 76 86 73 85 74Median number of bedrooms 3 3 3 3 3One full bathroom 6 13 4 1 7Two full bathrooms 76 77 76 74 77Three full bathrooms or more 18 10 21 26 16Median number of full bathrooms 2 2 0 2 2
U.S.
All Buyers
First-time Buyers
Repeat Buyers
New Homes
Previously Owned Homes
One bedroom 2% 2% 1% 2% 2%Two bedrooms 15 16 15 11 16Three bedrooms or more 83 82 84 88 82Median number of bedrooms 3 3 3 3 3One full bathroom 17 28 10 4 20Two full bathrooms 59 60 59 65 58Three full bathrooms or more 23 12 31 31 22Median number of full bathrooms 2 2 2 2 2
BUYERS OF
BUYERS OF
2012 National Association of Realtors® Profile of Home Buyers and Sellers
CHARACTERISTICS OF HOMES PURCHASED
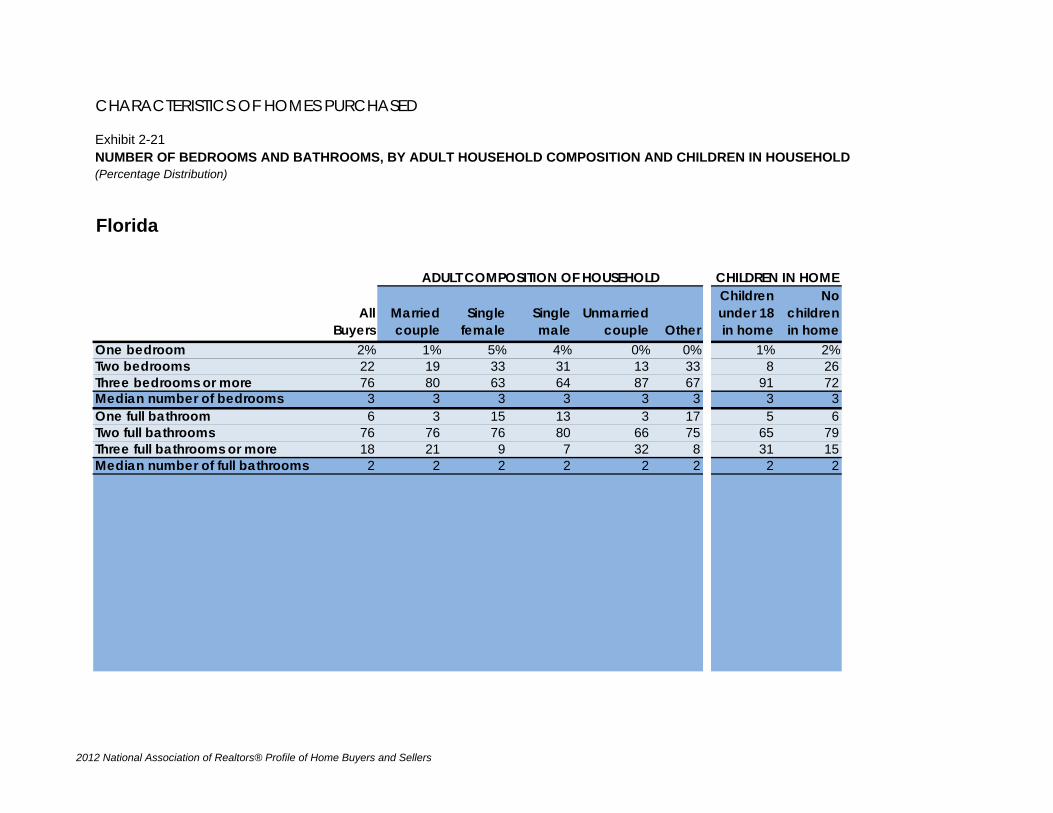
Exhibit 2-21NUMBER OF BEDROOMS AND BATHROOMS, BY ADULT HOUSEHOLD COMPOSITION AND CHILDREN IN HOUSEHOLD(Percentage Distribution)
Florida
All Buyers
Married couple
Single female
Single male
Unmarried couple Other
Children under 18 in home
No children in home
One bedroom 2% 1% 5% 4% 0% 0% 1% 2%Two bedrooms 22 19 33 31 13 33 8 26Three bedrooms or more 76 80 63 64 87 67 91 72Median number of bedrooms 3 3 3 3 3 3 3 3One full bathroom 6 3 15 13 3 17 5 6Two full bathrooms 76 76 76 80 66 75 65 79Three full bathrooms or more 18 21 9 7 32 8 31 15Median number of full bathrooms 2 2 2 2 2 2 2 2
ADULT COMPOSITION OF HOUSEHOLD CHILDREN IN HOME
2012 National Association of Realtors® Profile of Home Buyers and Sellers

U.S.
All Buyers
Married couple
Single female
Single male
Unmarried couple Other
Children under 18 in home
No children in home
One bedroom 2% 1% 4% 6% 2% 1% * 3%Two bedrooms 15 11 29 23 17 18 7 21Three bedrooms or more 83 89 68 71 82 82 93 77Median number of bedrooms 3 3 3 3 3 3 3 3One full bathroom 17 12 28 28 26 17 16 19Two full bathrooms 59 59 61 61 57 59 54 63Three full bathrooms or more 23 29 11 11 17 24 30 19Median number of full bathrooms 2 2 2 2 2 2 2 2
* Less than 1 percent
ADULT COMPOSITION OF HOUSEHOLD CHILDREN IN HOME
2012 National Association of Realtors® Profile of Home Buyers and Sellers

CHARACTERISTICS OF HOMES PURCHASED
Exhibit 2-22YEAR HOME BUILT, BY REGION(Median)
Florida U.S. Northeast Midwest South West2011 17% 14% 7% 9% 18% 13%2008 through 2010 3 4 2 3 5 42005 through 2007 10 9 4 9 11 102000 through 2004 13 11 8 10 12 111985 through 1999 26 21 16 20 24 211960 through 1984 24 23 25 24 19 261911 through 1959 7 16 31 21 10 141910 or earlier 0 2 8 4 1 1
Median 1955 1992 1969 1985 1998 1992
BUYERS WHO PURCHASED A HOME IN THE
2012 National Association of Realtors® Profile of Home Buyers and Sellers
CHARACTERISTICS OF HOMES PURCHASED
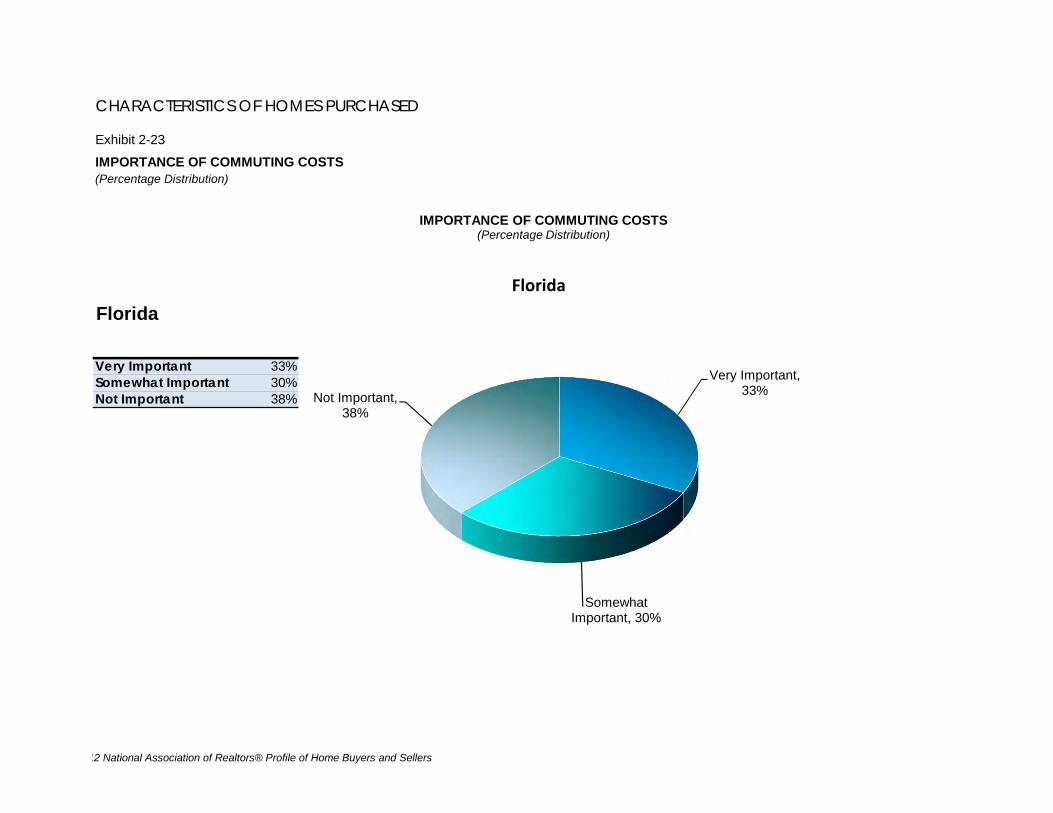
Exhibit 2-23
IMPORTANCE OF COMMUTING COSTS(Percentage Distribution)
Florida
Very Important 33%Somewhat Important 30%Not Important 38%
Very Important, 33%
Somewhat Important, 30%
Not Important, 38%
IMPORTANCE OF COMMUTING COSTS(Percentage Distribution)
Florida
12 National Association of Realtors® Profile of Home Buyers and Sellers

U.S.
Very Important 37%Somewhat Important 39%Not Important 25%
Very Important, 37%
Somewhat Important, 39%
Not Important, 25%
IMPORTANCE OF COMMUTING COSTS(Percentage Distribution)
U.S.
12 National Association of Realtors® Profile of Home Buyers and Sellers

CHARACTERISTICS OF HOMES PURCHASED
Exhibit 2-24IMPORTANCE OF HOME'S ENVIRONMENTALLY FRIENDLY FEATURES(Percentage Distribution)
Florida
Very Important
Somewhat Important
Not Important
Heating and cooling costs 37% 47% 16%Energy efficient appliances 25 43 31Energy efficient lighting 22 47 31Landscaping for energy conservation
13 41 47
Environmentally friendly community features
13 40 47
U.S.
Very Important
Somewhat Important
Not Important
Heating and cooling costs 39% 48% 14%Energy efficient appliances 24 47 29Energy efficient lighting 24 45 31Landscaping for energy conservation
11 39 50
Environmentally friendly community features
11 38 51
2012 National Association of Realtors® Profile of Home Buyers and Sellers

37%
25%
22%
13%
13%
47%
43%
47%
41%
40%
16%
31%
31%
47%
47%
0% 20% 40% 60% 80% 100%
Heating and cooling costs
Energy efficient appliances
Energy efficient lighting
Landscaping for energyconservation
Environmentally friendlycommunity features
IMPORTANCE OF HOME'S ENVIRONMENTALLY FRIENDLY FEATURES
(Percentage Distribution)
Very Important Somewhat Important Not Important
Florida
39%
24%
24%
11%
11%
48%
47%
45%
39%
38%
14%
29%
31%
50%
51%
0% 20% 40% 60% 80% 100%
Heating and cooling costs
Energy efficient appliances
Energy efficient lighting
Landscaping for energyconservation
Environmentally friendlycommunity features
IMPORTANCE OF HOME'S ENVIRONMENTALLY FRIENDLY FEATURES
(Percentage Distribution)
Very Important Somewhat Important Not Important
U.S.
2012 National Association of Realtors® Profile of Home Buyers and Sellers

CHARACTERISTICS OF HOMES PURCHASED
Exhibit 2-25
ENVIRONMENTALLY FRIENDLY FEATURES CONSIDERED "VERY IMPORTANT", BY REGION(Percentage Distribution)
U.S. Northeast Midwest South WestHeating and cooling costs 37% 39% 42% 38% 42% 33%Energy efficient appliances 25 24 21 21 27 22Energy efficient lighting 22 24 22 19 28 24Landscaping for energy conservation
13 11 8 7 13 13
Environmentally friendly community features
13 11 8 7 13 11
BUYERS WHO PURCHASED A HOME IN THEFlorida
2012 National Association of Realtors® Profile of Home Buyers and Sellers

CHARACTERISTICS OF HOMES PURCHASED
Exhibit 2-26
ENVIRONMENTALLY FRIENDLY FEATURES CONSIDERED "VERY IMPORTANT", BY YEAR HOME WAS BUILT(Percentage Distribution)
U.S. 2011
2008 through
2010
2005 through
2007
2000 through
2004
1985 through
1999
1960 through
1984
1911 through
19591910 or earlier
Heating and cooling costs 37% 39% 57% 42% 41% 32% 33% 36% 38% 29%Energy efficient appliances 25 24 49 31 28 21 17 18 19 16Energy efficient lighting 22 24 45 32 26 21 18 20 21 19Landscaping for energy conservation
13 11 19 14 12 11 9 9 10 7
Environmentally friendly community features
13 11 23 13 11 10 8 9 7 10
Florida
2012 National Association of Realtors® Profile of Home Buyers and Sellers

CHARACTERISTICS OF HOMES PURCHASED
Exhibit 2-27CHARACTERISTICS OF HOME ON WHICH BUYER COMPROMISED, BY LOCATION(Percent of Respondents)
Florida
All BuyersSuburb/
SubdivisionSmall town
Urban/ Central
city Rural
Resort/ Recreation
areaPrice of home 16% 14% 19% 20% 11% 22%Size of home 16 14 14 18 23 17Condition of home 18 13 20 29 19 22Distance from job 8 10 6 3 16 3Lot size 10 11 10 5 12 8Style of home 11 9 17 12 7 18Distance from friends or family 6 6 3 6 7 8Quality of the neighborhood 6 5 5 8 5 12Quality of the schools 1 1 0 5 4 0Distance from school 1 1 0 5 0 0Other compromises not listed 5 6 4 9 4 mple MarketNone - Made no compromises 43 45 42 38 44 37
U.S.
All BuyersSuburb/
SubdivisionSmall town
Urban/ Central
city Rural
Resort/ Recreation
areaPrice of home 18% 17% 15% 21% 17% 16%Size of home 16 15 18 21 16 18Condition of home 16 15 15 20 19 19Lot size 13 14 14 11 10 9Style of home 12 13 13 13 11 12Distance from job 12 13 13 9 15 5Distance from friends or family 6 6 6 5 8 5Quality of the neighborhood 5 4 6 8 5 6Quality of the schools 3 3 1 6 2 *Distance from school 2 2 1 1 2 *None - Made no compromises 37 37 39 31 40 47Other compromises not listed 8 7 7 10 8 4
* Less than 1 percent
BUYERS WHO PURCHASED A HOME IN A
BUYERS WHO PURCHASED A HOME IN A
2012 National Association of Realtors® Profile of Home Buyers and Sellers

CHARACTERISTICS OF HOMES PURCHASED
Exhibit 2-28
(Percentage of Respondents)
Florida
All Buyers
First-time Buyers
Repeat Buyers
New Homes
Previously Owned Homes
Price of home 16% 19% 15% 9% 17%Size of home 16 20 14 15 17Condition of home 18 18 18 3 21Distance from job 8 15 6 9 8Lot size 10 17 7 13 9Style of home 11 15 10 11 11Distance from friends or family 6 6 5 7 5Quality of the neighborhood 6 8 5 6 6Quality of the schools 1 2 1 2 1Distance from school 1 3 1 1 1Other compromises not listed 5 10 4 5 5None - Made no compromises 43 31 47 50 41
U.S.
All Buyers
First-time Buyers
Repeat Buyers
New Homes
Previously Owned Homes
Price of home 18% 19% 16% 16% 18%Size of home 16 20 14 16 17Condition of home 16 16 16 3 19Lot size 13 14 12 19 12Style of home 12 14 12 13 12Distance from job 12 16 10 15 12Distance from friends or family 6 7 5 7 6Quality of the neighborhood 5 7 4 5 5Quality of the schools 3 4 2 4 3Distance from school 2 2 1 2 2None - Made no compromises 37 31 41 42 36Other compromises not listed 8 8 7 6 8
BUYERS OF
BUYERS OF
CHARACTERISTICS OF HOME ON WHICH BUYER COMPROMISED, FIRST-TIME AND REPEAT BUYERS, AND BUYERS OF NEW AND PREVIOUSLY OWNED HOMES
2012 National Association of Realtors® Profile of Home Buyers and Sellers

CHARACTERISTICS OF HOMES PURCHASED
Exhibit 2-29
(Percentage of Respondents)
Florida
All Buyers
Married couple
Single female
Single male
Unmarried couple Other
Children under 18 in home
No children in home
Price of home 16% 16% 17% 4% 14% 25% 15% 15%Size of home 16 17 9 16 11 33 18 14Condition of home 18 17 26 11 6 8 22 16Distance from job 8 9 4 4 8 17 15 5Lot size 10 10 5 16 14 8 14 9Style of home 11 11 11 9 11 8 12 11Distance from friends or family 6 4 6 7 11 8 8 4Quality of the neighborhood 6 6 7 0 6 25 7 5Quality of the schools 1 1 2 0 3 0 5 0Distance from school 1 1 2 0 3 0 5 0Other compromises not listed 5 5 5 2 6 0 3 6None - Made no compromises 43 43 45 47 50 17 34 47
* Less than 1 percent
ADULT COMPOSITION OF HOUSEHOLD
CHARACTERISTICS OF HOME ON WHICH BUYER COMPROMISED, BY ADULT COMPOSITION OF HOUSEHOLD
CHILDREN IN HOME
2012 National Association of Realtors® Profile of Home Buyers and Sellers

U.S.
All Buyers
Married couple
Single female
Single male
Unmarried couple Other
Children under 18 in home
No children in home
Price of home 18% 16% 19% 19% 20% 17% 18% 16%Size of home 16 15 18 16 19 20 17 16Condition of home 16 16 18 15 16 22 17 16Lot size 13 14 10 13 13 10 14 12Style of home 12 12 13 11 12 10 14 11Distance from job 12 13 11 11 14 9 14 11Distance from friends or family 6 6 6 6 6 3 6 6Quality of the neighborhood 5 5 6 5 5 6 5 5Quality of the schools 3 3 2 1 4 2 4 2Distance from school 2 2 1 1 1 2 3 1None - Made no compromises 37 38 37 39 35 32 33 40Other compromises not listed 8 7 10 6 7 9 8 8
ADULT COMPOSITION OF HOUSEHOLD CHILDREN IN HOME
2012 National Association of Realtors® Profile of Home Buyers and Sellers
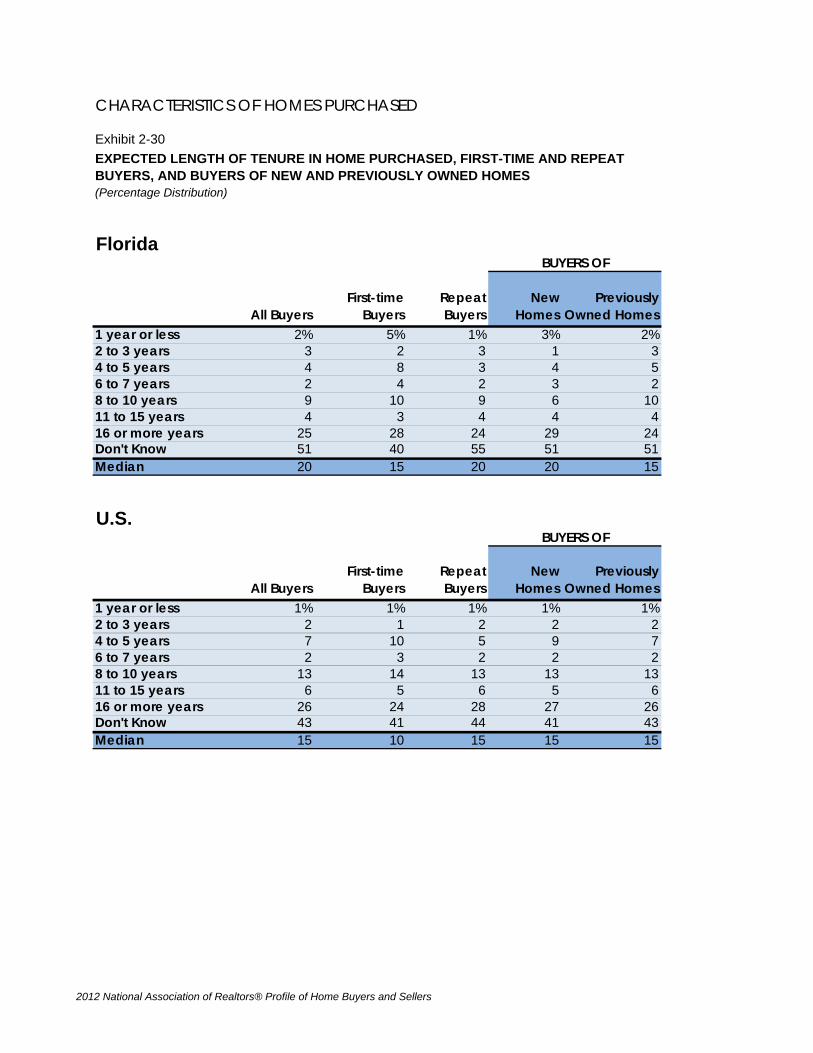
CHARACTERISTICS OF HOMES PURCHASED
Exhibit 2-30
(Percentage Distribution)
Florida
All BuyersFirst-time
BuyersRepeat Buyers
New Homes
Previously Owned Homes
1 year or less 2% 5% 1% 3% 2%2 to 3 years 3 2 3 1 34 to 5 years 4 8 3 4 56 to 7 years 2 4 2 3 28 to 10 years 9 10 9 6 1011 to 15 years 4 3 4 4 416 or more years 25 28 24 29 24Don't Know 51 40 55 51 51Median 20 15 20 20 15
U.S.
All BuyersFirst-time
BuyersRepeat Buyers
New Homes
Previously Owned Homes
1 year or less 1% 1% 1% 1% 1%2 to 3 years 2 1 2 2 24 to 5 years 7 10 5 9 76 to 7 years 2 3 2 2 28 to 10 years 13 14 13 13 1311 to 15 years 6 5 6 5 616 or more years 26 24 28 27 26Don't Know 43 41 44 41 43Median 15 10 15 15 15
EXPECTED LENGTH OF TENURE IN HOME PURCHASED, FIRST-TIME AND REPEAT BUYERS, AND BUYERS OF NEW AND PREVIOUSLY OWNED HOMES
BUYERS OF
BUYERS OF
2012 National Association of Realtors® Profile of Home Buyers and Sellers

CHARACTERISTICS OF HOMES PURCHASED
Exhibit 2-31EXPECTED LENGTH OF TENURE IN HOME PURCHASED, BY AGE(Percentage Distribution)
Florida
All Buyers 18 to 24 25 to 44 45 to 64 65 or older1 year or less 2% 0% 3% 1% 2%2 to 3 years 3 0 4 1 44 to 5 years 4 0 9 3 26 to 7 years 2 0 5 2 08 to 10 years 9 15 8 9 1011 to 15 years 4 8 2 4 416 or more years 25 46 30 27 17Don't Know 51 31 39 53 61Median 20 25 15 20 14
* Less than 1 percent
U.S.
All Buyers 18 to 24 25 to 44 45 to 64 65 or older1 year or less 1% * 1% 1% 2%2 to 3 years 2 2 2 1 24 to 5 years 7 14 10 4 26 to 7 years 2 1 4 1 08 to 10 years 13 17 15 12 911 to 15 years 6 8 5 5 716 or more years 26 18 27 32 18Don't Know 43 39 37 43 61Median 15 10 12 20 15
* Less than 1 percent
AGE OF HOME BUYER
AGE OF HOME BUYER
2012 National Association of Realtors® Profile of Home Buyers and Sellers

CHARACTERISTICS OF HOMES PURCHASED
Exhibit 2-32TYPE OF HOME, PRIMARY RESIDENCE AND SECOND HOME(Percentage Distribution)
Florida
All BuyersPrimary
Residence
Non-primary Residence/
Second HomeDetached single-family home 76% 76% 75%Townhouse/row house 5 5 6Apartment/condo in building with 5 or more units 9 9 13Duplex/apartment/condo in 2 to 4 unit building 3 3 0Other 7 7 6
U.S.
All BuyersPrimary
Residence
Non-primary Residence/
Second HomeDetached single-family home 79% 80% 62%Townhouse/row house 7 7 6Apartment/condo in building with 5 or more units 6 5 13Duplex/apartment/condo in 2 to 4 unit building 2 2 7Other 7 7 13
BUYERS WHO PURCHASED A
BUYERS WHO PURCHASED A
2012 National Association of Realtors® Profile of Home Buyers and Sellers

CHARACTERISTICS OF HOMES PURCHASED
Exhibit 2-33LOCATION OF HOME, PRIMARY RESIDENCE AND SECOND HOME(Percentage Distribution)
Florida
All Buyers Primary Residence
Non-primary Residence/ Second
HomeSuburb/Subdivision 51% 51% 44%Small town 15 15 13Urban area/Central city 12 12 25Rural area 11 11 6Resort/Recreation area 11 11 13
* Less than 1 percent
U.S.
All Buyers Primary Residence
Non-primary Residence/ Second
HomeSuburb/Subdivision 51% 52% 27%Small town 18 18 21Urban area/Central city 17 17 22Rural area 12 11 18Resort/Recreation area 3 2 12
BUYERS WHO PURCHASED A
BUYERS WHO PURCHASED A
2012 National Association of Realtors® Profile of Home Buyers and Sellers

THE HOME SEARCH PROCESS
Exhibit 3-1 FIRST STEP TAKEN DURING THE HOME BUYING PROCESS, FIRST-TIME AND REPEAT BUYERS
Exhibit 3-2 FIRST STEP TAKEN DURING THE HOME BUYING PROCESS, BY AGEExhibit 3-3 INFORMATION SOURCES USED IN HOME SEARCH, BY FIRST-TIME AND REPEAT BUYERS,
AND BUYERS OF NEW AND PREVIOUSLY OWNED HOMESExhibit 3-4 INFORMATION SOURCES USED IN HOME SEARCH, BY AGEExhibit 3-5 FREQUENCY OF USE OF DIFFERENT INFORMATION SOURCESExhibit 3-6 USEFULNESS OF INFORMATION SOURCESExhibit 3-7 LENGTH OF SEARCH, BY REGIONExhibit 3-8 LENGTH OF SEARCH FOR BUYERS WHO USED AN AGENT, BY FIRST-TIME AND REPEAT
BUYERSExhibit 3-9 WHERE BUYER FOUND THE HOME THEY PURCHASED, 2001-2012Exhibit 3-10 BUYER INTEREST IN PURCHASING A HOME IN FORECLOSURE, BY FIRST-TIME AND REPEAT
BUYERS, AND BUYERS OF NEW AND PREVIOUSLY OWNED HOMESExhibit 3-11 MOST DIFFICULT STEPS OF HOME BUYING PROCESS BY FIRST-TIME AND REPEAT BUYERS
AND BUYERS OF NEW AND PREVIOUSLY OWNED HOMESExhibit 3-12 USE OF INTERNET TO SEARCH FOR HOMES, 2003-2012Exhibit 3-13 ACTIONS TAKEN AS A RESULT OF INTERNET HOME SEARCH, FIRST-TIME AND REPEAT
BUYERSExhibit 3-14 CHARACTERISTICS OF HOME SEARCHERS AND SEARCH ACTIVITY, BY USE OF INTERNETExhibit 3-15 INFORMATION SOURCES USED IN HOME SEARCH, BY USE OF INTERNETExhibit 3-16 WHERE BUYERS FOUND THE HOME THEY PURCHASED, BY USE OF INTERNETExhibit 3-17 METHOD OF HOME PURCHASE, BY USE OF INTERNETExhibit 3-18 VALUE OF WEB SITE FEATURESExhibit 3-19 WEB SITES USED IN HOME SEARCH BY FIRST-TIME AND REPEAT BUYERSExhibit 3-20 WEB SITES USED IN HOME SEARCH, BY AGEExhibit 3-21 SATISFACTION IN BUYING PROCESS
2012 National Association of Realtors® Profile of Home Buyers and Sellers

THE HOME SEARCH PROCESS
Exhibit 3-1FIRST STEP TAKEN DURING THE HOME BUYING PROCESS, FIRST-TIME AND REPEAT BUYERS(Percentage Distribution)
Florida
All Buyers
First-time Buyers
Repeat Buyers
Looked online for properties for sale 40% 36% 42%Contacted a real estate agent 21 14 23Looked online for information about the home buying process 10 14 9Drove-by homes/neighborhoods 8 6 9Talked with a friend or relative about home buying process 7 11 5Contacted a bank or mortgage lender 4 6 3Visited open houses 3 2 3Looked in newspapers, magazines, or home buying guides 2 1 2Contacted builder/visited builder models 2 2 2Contacted a home seller directly 2 1 2Attended a home buying seminar 0 1 *Looked up information about different neightborhoods or areas (schools, local lifestyle/nightlife, parks, public transpo
2 2 2
Read books or guides about the home buying process 1 2 *Other 0 * 0
U.S.
All Buyers
First-time Buyers
Repeat Buyers
Looked online for properties for sale 41% 35% 45%Contacted a real estate agent 18 14 20Looked online for information about the home buying process 11 17 8Drove-by homes/neighborhoods 8 5 9Talked with a friend or relative about home buying process 6 11 3Contacted a bank or mortgage lender 6 9 4Visited open houses 3 3 4Looked in newspapers, magazines, or home buying guides 1 1 2Contacted builder/visited builder models 1 1 1Contacted a home seller directly 1 1 2Attended a home buying seminar 1 2 *Looked up information about different neightborhoods or areas (schools, local lifestyle/nightlife, parks, public transpo
1 1 1
Read books or guides about the home buying process * 1 *Other 1 1 1
* Less than 1 percent
2012 National Association of Realtors® Profile of Home Buyers and Sellers

THE HOME SEARCH PROCESS
Exhibit 3-2FIRST STEP TAKEN DURING THE HOME BUYING PROCESS, BY AGE(Percentage Distribution)
Florida
18-24 25-44 45-64 65 or older
Looked online for properties for sale 40% 39% 44% 49% 26%Contacted a real estate agent 21 23 13 18 28Looked online for information about the home buying process 10 15 13 9 8Drove-by homes/neighborhoods 8 8 7 7 14Talked with a friend or relative about home buying process 7 15 7 3 9Contacted a bank or mortgage lender 4 * 7 3 2Visited open houses 3 * 1 2 6Looked in newspapers, magazines, or home buying guides 2 * 1 2 2Contacted builder/visited builder models 2 * 2 1 2Contacted a home seller directly 2 * 1 2 2Attended a home buying seminar 0 * 1 1 *Looked up information about different neightborhoods or areas (schools, local lifestyle/nightlife, parks, public transpo
2 * 2 2 2
Read books or guides about the home buying process 1 * 1 * 1Other 0 * * 1 *
U.S.
18-24 25-44 45-64 65 or older
Looked online for properties for sale 41% 38% 44% 44% 29%Contacted a real estate agent 18 10 14 20 29Looked online for information about the home buying process 11 17 14 9 5Drove-by homes/neighborhoods 8 6 6 8 14Talked with a friend or relative about home buying process 6 16 7 3 5Contacted a bank or mortgage lender 6 9 7 5 3Visited open houses 3 * 2 4 5Looked in newspapers, magazines, or home buying guides 1 1 2 3Contacted builder/visited builder models 1 1 1 1 2Contacted a home seller directly 1 * 1 1 3Attended a home buying seminar 1 * 1 1Looked up information about different neightborhoods or areas (schools, local lifestyle/nightlife, parks, public transpo
1 * 1 1 1
Read books or guides about the home buying process * * 1 * *Other 1 1 * 1 1* Less than 1 percent
AGE OF HOME BUYER
All Buyers
AGE OF HOME BUYER
All Buyers
2012 National Association of Realtors® Profile of Home Buyers and Sellers

THE HOME SEARCH PROCESS
Exhibit 3-3
(Percent of Respondents)
Florida
All Buyers
First-time Buyers
Repeat Buyers
New Homes
Previously Owned Homes
Internet 86% 92% 85% 88% 86%Real estate agent 88 83 90 82 90Yard sign 50 51 49 39 53Open house 34 27 37 38 33Print newspaper advertisement 29 24 31 32 28Home book or magazine 19 20 19 26 18Home builder 19 18 19 58 8Television 5 5 4 8 4Billboard 5 4 5 13 3Relocation company 3 2 3 5 2
U.S.
All Buyers
First-time Buyers
Repeat Buyers
New Homes
Previously Owned Homes
Internet 90% 93% 89% 87% 91%Real estate agent 87 87 88 79 89Yard sign 53 49 55 43 54Open house 45 42 46 52 43Print newspaper advertisement 27 25 29 27 27Home builder 17 13 19 60 8Home book or magazine 18 17 19 24 17Relocation company 4 3 4 7 3Television 5 5 4 9 4Billboard 5 5 5 14 3
BUYERS OF
BUYERS OF
INFORMATION SOURCES USED IN HOME SEARCH, BY FIRST-TIME AND REPEAT BUYERS, AND BUYERS OF NEW AND PREVIOUSLY OWNED HOMES
2012 National Association of Realtors® Profile of Home Buyers and Sellers

THE HOME SEARCH PROCESS
Exhibit 3-4INFORMATION SOURCES USED IN HOME SEARCH, BY AGE(Percent of Respondents)
Florida
18 to 24 25 to 44 45 to 64 65 or olderInternet 86% 100% 95% 91% 70%Real estate agent 88 92 85 90 89Yard sign 50 33 55 51 41Open house 34 33 30 36 41Print newspaper advertisement 29 * 22 35 32Home book or magazine 19 8 13 25 19Home builder 19 25 17 20 14Television 5 * 6 3 5Billboard 5 * 5 4 6Relocation company 3 * 3 2 2
* Less than 1 percent
U.S.
18 to 24 25 to 44 45 to 64 65 or olderInternet 90% 96% 96% 90% 69%Real estate agent 87 88 87 87 89Yard sign 53 45 51 54 52Open house 45 28 46 45 41Print newspaper advertisement 27 24 23 31 34Home builder 17 18 16 17 19Home book or magazine 18 20 16 20 18Relocation company 4 2 3 4 2Television 5 6 5 5 2Billboard 5 3 5 5 3
All BuyersAGE OF HOME BUYER
All BuyersAGE OF HOME BUYER
2012 National Association of Realtors® Profile of Home Buyers and Sellers

THE HOME SEARCH PROCESS
Exhibit 3-5FREQUENCY OF USE OF DIFFERENT INFORMATION SOURCES(Percentage Distribution)
Florida
Frequently OccasionallyRarely or not at all
Internet 73% 13% 14%Real estate agent 71 17 12Yard sign 18 32 50Print newspaper advertisement 6 24 71Open house 8 27 66Home book or magazine 5 14 81Home builder 8 11 81Television 0 4 95Relocation company 0 2 97Billboard 2 3 95
* Less than 1 percent
U.S.
Frequently OccasionallyRarely or not at all
Internet 79% 11% 10%Real estate agent 67 21 13Yard sign 18 34 48Open house 12 32 55Print newspaper advertisement 6 22 73Home builder 6 11 83Home book or magazine 3 15 82Relocation company 1 2 96Television 1 4 95Billboard 1 4 95
2012 National Association of Realtors® Profile of Home Buyers and Sellers

73
71
18
6
8
5
8
0
0
2
13
17
32
24
27
14
11
4
2
3
14
12
50
71
66
81
81
95
97
95
0% 20% 40% 60% 80% 100%
Internet
Real estate agent
Yard sign
Print newspaper advertisement
Open house
Home book or magazine
Home builder
Television
Relocation company
Billboard
FREQUENCY OF USE OF DIFFERENT INFORMATION SOURCES(Percentage Distribution)
Frequently Occasionally Rarely or not at all
Florida
79
67
18
12
6
6
3
1
1
11
21
34
32
22
11
15
2
4
10
13
48
55
73
83
82
96
95
0% 20% 40% 60% 80% 100%
Internet
Real estate agent
Yard sign
Open house
Print newspaper advertisement
Home builder
Home book or magazine
Relocation company
Television
FREQUENCY OF USE OF DIFFERENT INFORMATION SOURCES(Percentage Distribution)
Frequently Occasionally Rarely or not at all
U.S.
2012 National Association of Realtors® Profile of Home Buyers and Sellers

THE HOME SEARCH PROCESS
Exhibit 3-6USEFULNESS OF INFORMATION SOURCES(Percentage Distribution Among Buyers that Used Each Source)
Florida
Very Useful
Somewhat Useful
Not Useful
Internet 82% 17% 1%Real estate agent 83 16 1Home builder 60 38 2Yard sign 33 57 10Open house 29 67 4Print newspaper advertisement 21 68 11Relocation company 10 80 10Home book or magazine 32 56 12Billboard 50 39 11Television 13 75 13
U.S.
Very Useful
Somewhat Useful
Not Useful
Internet 82% 16% 2%Real estate agent 78 19 3Home builder 47 44 9Open house 38 53 9Yard sign 34 57 9Relocation company 30 51 19Billboard 26 54 20Print newspaper advertisement 21 64 15Home book or magazine 19 60 21Television 19 59 22
2012 National Association of Realtors® Profile of Home Buyers and Sellers

82
83
60
33
29
21
10
32
50
13
17
16
38
57
67
68
80
56
39
75
1
1
2
10
4
11
10
12
11
13
0% 20% 40% 60% 80% 100%
Internet
Real estate agent
Home builder
Yard sign
Open house
Print newspaper advertisement
Relocation company
Home book or magazine
Billboard
Television
USEFULNESS OF INFORMATION SOURCES(Percentage Distribution Among Buyers that Used Each Source)
Very Useful Somewhat Useful Not Useful
Florida
82
78
47
38
34
30
26
21
19
19
16
19
44
53
57
51
54
64
60
59
2
3
9
9
9
19
20
15
21
22
0% 20% 40% 60% 80% 100%
Internet
Real estate agent
Home builder
Open house
Yard sign
Relocation company
Billboard
Print newspaper advertisement
Home book or magazine
Television
USEFULNESS OF INFORMATION SOURCES(Percentage Distribution Among Buyers that Used Each Source)
Very Useful Somewhat Useful Not Useful
U.S.
2012 National Association of Realtors® Profile of Home Buyers and Sellers

THE HOME SEARCH PROCESS
Exhibit 3-7LENGTH OF SEARCH, BY REGION(Median)
Number of Weeks Searched Northeast Midwest South West2001 7 7 7 7 72003 8 10 8 8 62004 8 12 8 8 82005 8 10 8 8 62006 8 12 8 8 82007 8 12 8 8 82008 10 12 10 8 102009 12 12 10 10 122010 12 14 10 10 122011 12 12 10 10 122012 10 12 12 12 10 12Number of homes viewed 10 10 10 12 10 12
BUYERS WHO PURCHASED A HOME IN THE
U.S.Florida
2012 National Association of Realtors® Profile of Home Buyers and Sellers

THE HOME SEARCH PROCESS
Exhibit 3-8LENGTH OF SEARCH FOR BUYERS WHO USED AN AGENT, BY FIRST-TIME AND REPEAT BUYERS(Median Weeks)
Florida
All Buyers
Buyers who Used an Agent
First-time Buyers
Repeat Buyers
Total number of weeks searched 10 10 12 10Number of weeks searched before contacting agent
NA 3 3 3
10 10
12
10
3 3 3
0
2
4
6
8
10
12
14
All Buyers Buyers who Used anAgent
First-time Buyers Repeat Buyers
LENGTH OF SEARCH FOR BUYERS WHO USED AN AGENT, BY AGE AND BY FIRST-TIME AND REPEAT BUYERS
(Median)
Total number of weeks searched Number of weeks searched before contacting agent
Florida
2012 National Association of Realtors® Profile of Home Buyers and Sellers

U.S.
All Buyers
Buyers who Used an Agent
First-time Buyers
Repeat Buyers
Total number of weeks searched 12 12 12 10Number of weeks searched before contacting agent
NA 3 3 3
NA=Not applicable
12 12 12
10
3 3 3
0
2
4
6
8
10
12
14
All Buyers Buyers who Used anAgent
First-time Buyers Repeat Buyers
LENGTH OF SEARCH FOR BUYERS WHO USED AN AGENT, BY AGE AND BY FIRST-TIME AND REPEAT BUYERS
(Median)
Total number of weeks searched Number of weeks searched before contacting agent
U.S.
2012 National Association of Realtors® Profile of Home Buyers and Sellers

THE HOME SEARCH PROCESS
Exhibit 3-9WHERE BUYER FOUND THE HOME THEY PURCHASED, 2001-2012(Percentage Distribution)
Florida
2012Real estate agent 42%Internet 32Yard sign/open house sign 9Friend, relative or neighbor 8Home builder or their agent 5Print newspaper advertisement 1Directly from sellers/Knew the sellers 2Home book or magazine 1Other --
U.S.
2001 2003 2004 2005 2006 2007 2008 2009 2010 2011 2012Internet 8% 11% 15% 24% 24% 29% 32% 36% 37% 40% 42%Real estate agent 48 41 38 36 36 34 34 36 38 35 34Yard sign/open house sign 15 16 16 15 15 14 15 12 11 11 10Friend, relative or neighbor 8 7 7 7 8 8 7 6 6 6 6Home builder or their agent 3 7 7 7 8 8 7 5 4 5 5Directly from sellers/Knew the sellers 4 4 5 3 3 3 2 2 2 2 2Print newspaper advertisement 7 7 5 5 5 3 3 2 2 2 1Home book or magazine 2 1 2 1 1 1 1 * * * *Other 3 6 4 -- -- -- -- -- -- -- --
* Less than 1 percent
2012 National Association of Realtors® Profile of Home Buyers and Sellers

THE HOME SEARCH PROCESS
Exhibit 3-10
(Percent of Respondents)
Florida
All BuyersFirst-time
BuyersRepeat Buyers
New Homes
Previously Owned Homes
Did not consider purchasing a home in foreclosure 43 30 47 50 40Considered purchasing a home in foreclosure, but did not:
Could not find the right home 25 30 24 29 25The process was too difficult or complex 21 22 20 17 22The home was in poor condition 16 27 12 15 16The home price was too high 5 9 3 8 4The neighborhood was undesirable 5 7 4 6 4Financing options were not attractive 3 4 2 4 3
U.S.
All BuyersFirst-time
BuyersRepeat Buyers
New Homes
Previously Owned Homes
Did not consider purchasing a home in foreclosure 44 35 49 60 41Considered purchasing a home in foreclosure, but did not:
Could not find the right home 29 33 27 24 30The home was in poor condition 16 21 13 13 16The process was too difficult or complex 15 17 14 12 16The home price was too high 5 6 4 3 5The neighborhood was undesirable 4 6 3 2 5Financing options were not attractive 3 4 2 2 3
N/A- Not Applicable
BUYERS OF
BUYERS OF
BUYER INTEREST IN PURCHASING A HOME IN FORECLOSURE, BY FIRST-TIME AND REPEAT BUYERS, AND BUYERS OF NEW AND PREVIOUSLY OWNED HOMES
2012 National Association of Realtors® Profile of Home Buyers and Sellers

THE HOME SEARCH PROCESS
Exhibit 3-11MOST DIFFICULT STEPS OF HOME BUYING PROCESS BY FIRST-TIME AND REPEAT BUYERS AND BUYERS OF NEW AND PREVIOUSLY OWNED HOMES(Percentage Distribution)
Florida
All Buyers First-time Buyers Repeat BuyersNew
HomesPreviously
Owned HomesFinding the right property 46% 40% 48% 44% 46%Paperwork 21 31 18 22 21Understanding the process and steps 10 22 6 14 9No difficult steps 22 12 25 28 20Getting a mortgage 13 12 13 11 14Saving for the down payment 6 12 4 8 6Appraisal of the property 5 6 5 3 6Other 8 12 6 5 8
U.S.
All Buyers First-time Buyers Repeat BuyersNew
HomesPreviously
Owned HomesFinding the right property 51% 50% 52% 44% 53%Paperwork 23 31 19 23 24No difficult steps 16 9 21 20 15Understanding the process and steps 16 30 7 17 16Getting a mortgage 13 15 12 14 13Saving for the down payment 11 17 7 10 11Appraisal of the property 6 6 5 3 6Other 5 5 6 5 6
BUYERS OF
BUYERS OF
2012 National Association of Realtors® Profile of Home Buyers and Sellers

THE HOME SEARCH PROCESS
Exhibit 3-12USE OF INTERNET TO SEARCH FOR HOMES, 2003-2012
Frequently Occasionally42% 29%53% 24%57% 22%59% 21%66% 18%69% 18%76% 13%74% 15%75% 13%
2012 79% 11%73% 13%Florida
200320042005200520072008
201120102009
U.S.
42%53% 57% 59%
66% 69%76% 74% 75% 79%
73%
29%
24%22% 21%
18%18%
13% 15% 13%11%
13%
0%
10%
20%
30%
40%
50%
60%
70%
80%
90%
100%
2003 2004 2005 2005 2007 2008 2009 2010 2011 2012 Florida
USE OF INTERNET TO SEARCH FOR HOMES
Frequently Occasionally
2012 National Association of Realtors® Profile of Home Buyers and Sellers

THE HOME SEARCH PROCESS
Exhibit 3-13ACTIONS TAKEN AS A RESULT OF INTERNET HOME SEARCH, FIRST-TIME AND REPEAT BUYERS(Percent of Respondents Among Buyers Who Used the Internet)
Florida
All Buyers
First-time Buyers
Repeat Buyers
Drove by or viewed home 69% 75% 66%Walked through home viewed online 54 58 53Found the agent used to search for or buy home 41 36 43Requested more information 25 32 22Pre-qualified for a mortgage online 14 18 12Looked for more information on how to get a mortgage and general home buyer tips 13 22 9Applied for a mortgage online 7 8 7Contacted builder/developer 9 10 9Found a mortgage lender online 6 7 5
U.S.
All Buyers
First-time Buyers
Repeat Buyers
Drove by or viewed home 76% 77% 76%Walked through home viewed online 62 60 63Found the agent used to search for or buy home 32 33 30Requested more information 22 27 19Pre-qualified for a mortgage online 13 16 12Looked for more information on how to get a mortgage and general home buyer tips 13 23 7Applied for a mortgage online 8 9 7Contacted builder/developer 7 6 8Found a mortgage lender online 6 7 4
2012 National Association of Realtors® Profile of Home Buyers and Sellers
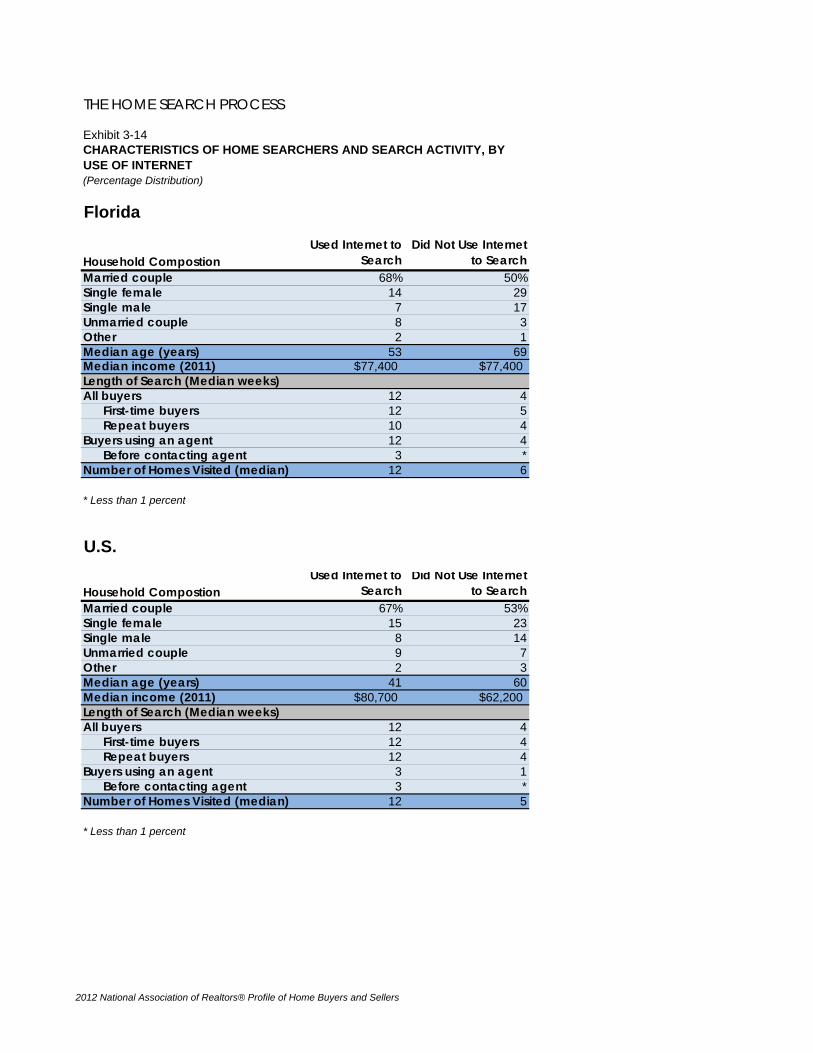
THE HOME SEARCH PROCESS
Exhibit 3-14
(Percentage Distribution)
Florida
Household CompostionUsed Internet to
SearchDid Not Use Internet
to SearchMarried couple 68% 50%Single female 14 29Single male 7 17Unmarried couple 8 3Other 2 1Median age (years) 53 69Median income (2011) $77,400 $77,400Length of Search (Median weeks)All buyers 12 4
First-time buyers 12 5Repeat buyers 10 4
Buyers using an agent 12 4Before contacting agent 3 *
Number of Homes Visited (median) 12 6
* Less than 1 percent
U.S.
Household CompostionUsed Internet to
SearchDid Not Use Internet
to SearchMarried couple 67% 53%Single female 15 23Single male 8 14Unmarried couple 9 7Other 2 3Median age (years) 41 60Median income (2011) $80,700 $62,200Length of Search (Median weeks)All buyers 12 4
First-time buyers 12 4Repeat buyers 12 4
Buyers using an agent 3 1Before contacting agent 3 *
Number of Homes Visited (median) 12 5
* Less than 1 percent
CHARACTERISTICS OF HOME SEARCHERS AND SEARCH ACTIVITY, BY USE OF INTERNET
2012 National Association of Realtors® Profile of Home Buyers and Sellers
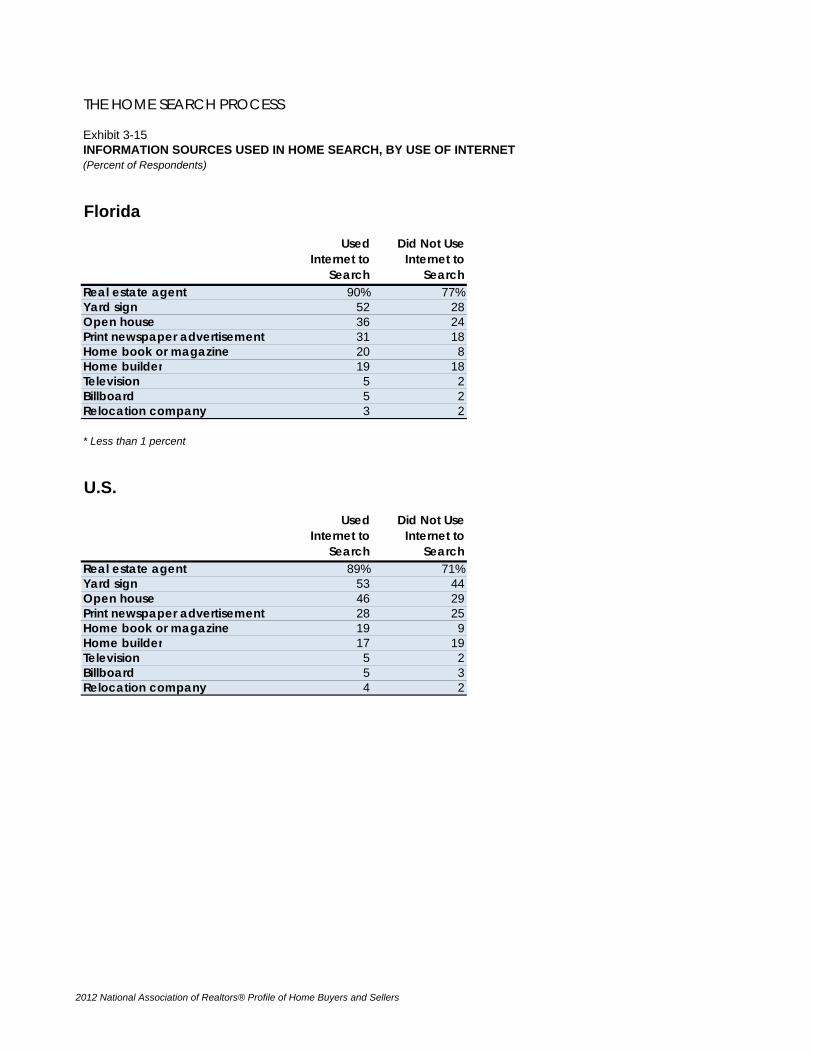
THE HOME SEARCH PROCESS
Exhibit 3-15INFORMATION SOURCES USED IN HOME SEARCH, BY USE OF INTERNET(Percent of Respondents)
Florida
Used Internet to
Search
Did Not Use Internet to
SearchReal estate agent 90% 77%Yard sign 52 28Open house 36 24Print newspaper advertisement 31 18Home book or magazine 20 8Home builder 19 18Television 5 2Billboard 5 2Relocation company 3 2
* Less than 1 percent
U.S.
Used Internet to
Search
Did Not Use Internet to
SearchReal estate agent 89% 71%Yard sign 53 44Open house 46 29Print newspaper advertisement 28 25Home book or magazine 19 9Home builder 17 19Television 5 2Billboard 5 3Relocation company 4 2
2012 National Association of Realtors® Profile of Home Buyers and Sellers

THE HOME SEARCH PROCESS
Exhibit 3-16WHERE BUYERS FOUND THE HOME THEY PURCHASED, BY USE OF INTERNET(Percentage Distribution)
Florida
Used Internet to Search
Did Not Use Internet to Search
Internet 37% 4%Real estate agent 41 46Yard sign/open house sign 9 14Home builder or their agent 5 8Friend, relative or neighbor 6 19Print newspaper advertisement 1 3Directly from sellers/Knew the sellers 1 7Home book or magazine 1 *
* Less than 1 percent
U.S.
Used Internet to Search
Did Not Use Internet to Search
Internet 47% NAReal estate agent 33 40Yard sign/open house sign 9 19Friend, relative or neighbor 5 19Home builder or their agent 4 7Directly from sellers/Knew the sellers 1 8Print newspaper advertisement 1 4Home book or magazine * *
* Less than 1 percent
2012 National Association of Realtors® Profile of Home Buyers and Sellers

THE HOME SEARCH PROCESS
Exhibit 3-17METHOD OF HOME PURCHASE, BY USE OF INTERNET(Percentage Distribution)
Florida
Used Internet to Search
Did Not Use Internet to Search
Through a real estate agent/broker 86% 74%Directly from builder or builder's agent 9 7Directly from previous owner whom buyer didn't know 3 4Directly from previous owner whom buyer knew 2 12Other 1 3
* Less than 1 percent
U.S.
Used Internet to Search
Did Not Use Internet to Search
Through a real estate agent/broker 91% 71%Directly from builder or builder's agent 5 11Directly from previous owner whom buyer didn't know 2 5Directly from previous owner whom buyer knew 1 12Other 1 1
2012 National Association of Realtors® Profile of Home Buyers and Sellers

THE HOME SEARCH PROCESS
Exhibit 3-18VALUE OF WEB SITE FEATURES(Percentage Distribution Among Buyers Who Used the Internet)
Florida
Very Useful
Somewhat Useful
Not Useful
Did not use/Not
AvailablePhotos 78% 19% 2% 2%Detailed information about properties for sale 76 23 0 1Virtual tours 49 29 8 14Real estate agent contact information 50 29 12 9Neighborhood information 36 40 13 12Interactive maps 37 31 12 20Pending sales/contract status 28 32 21 19Detailed information about recently sold properties 35 40 14 11Information about upcoming open houses 11 26 25 38
* Less than 1 percent
U.S.
Very Useful
Somewhat Useful
Not Useful
Did not use/Not
AvailablePhotos 84% 14% 1% 1%Detailed information about properties for sale 79 19 0 1Virtual video tours 45 33 10 12Real estate agent contact information 44 34 13 10Interactive maps 41 34 11 15Neighborhood information 34 44 12 9Detailed information about recently sold properties 33 41 15 11Pending sales/contract status 30 35 19 17Videos 21 33 20 27Information about upcoming open houses 20 31 25 24Real estate news or articles 8 26 29 37
2012 National Association of Realtors® Profile of Home Buyers and Sellers

THE HOME SEARCH PROCESS
Exhibit 3-19WEB SITES USED IN HOME SEARCH BY FIRST-TIME AND REPEAT BUYERS(Percent of Respondents Among Buyers Who Used the Internet)
Florida
All BuyersFirst-time
BuyersRepeat Buyers
Multiple Listing Service (MLS) Web site 53% 61% 50%REALTOR.com® 60 60 59Real estate company Web site 37 38 37Real estate agent Web site 44 49 43For-sale-by-owner Web site 16 12 18Newspaper Web site 6 10 5Real estate magazine Web site 5 4 6Social networking Web sites (e.g. Facebook, MySpace, etc.) 0 * 0Video hosting Web sites (e.g. YouTube, etc.) 1 * 1Other Web sites with real estate listings 31 36 29
U.S.
All BuyersFirst-time
BuyersRepeat Buyers
Multiple Listing Service (MLS) Web site 54% 53% 54%REALTOR.com® 51 48 53Real estate agent Web site 47 46 47Real estate company Web site 39 40 39Other Web sites with real estate listings 27 30 25Search engine 19 23 16Mobile or tablet apps 13 16 11For-sale-by-owner Web site 13 10 14Mobile or tablet websites 12 15 10Mobile or tablet search engine 11 13 9Newspaper Web site 6 7 5Real estate magazine Web site 4 4 4Video hosting Web sites (e.g. YouTube, etc.) 2 2 2Social networking Web sites (e.g. Facebook, Twitter, etc.) 1 1 1Other 16 16 15
2012 National Association of Realtors® Profile of Home Buyers and Sellers

THE HOME SEARCH PROCESS
Exhibit 3-20WEB SITES USED IN HOME SEARCH, BY AGE(Percent of Respondents Among Buyers Who Used the Internet)
Florida
All Buyers 18 to 24 25 to 44 45 to 64 65 or older
Multiple Listing Service (MLS) Web site 53% 77% 58% 51% 43%REALTOR.com® 60 54 72 60 45Real estate company Web site 37 46 39 32 40Real estate agent Web site 44 46 49 41 42For-sale-by-owner Web site 16 15 15 15 18Newspaper Web site 6 * 9 5 3Real estate magazine Web site 5 * 4 6 8Social networking Web sites (e.g. Facebook, MySpace, etc.) 0 * 1 * *Video hosting Web sites (e.g. YouTube, etc.) 1 * * 1 1Other Web sites with real estate listings 31 39 33 28 31
U.S.
All Buyers 18 to 24 25 to 44 45 to 64 65 or older
Multiple Listing Service (MLS) Web site 54% 52% 56% 51% 53%REALTOR.com® 51 57 52 50 44Real estate agent Web site 47 52 47 46 47Real estate company Web site 39 44 40 39 38Other Web sites with real estate listings 27 30 29 26 26Search engine 19 27 20 17 12Mobile or tablet apps 13 18 18 8 3For-sale-by-owner Web site 13 9 13 14 11Mobile or tablet websites 12 16 17 7 3Mobile or tablet search engine 11 21 13 8 3Newspaper Web site 6 11 6 6 5Real estate magazine Web site 4 7 3 5 4Video hosting Web sites (e.g. YouTube, etc.) 2 0 2 2 2Social networking Web sites (e.g. Facebook, Twitter, etc.) 1 1 2 0 0Other 16 14 18 14 9
AGE OF HOME BUYER
AGE OF HOME BUYER
2012 National Association of Realtors® Profile of Home Buyers and Sellers

THE HOME SEARCH PROCESS
Exhibit 3-21SATISFACTION IN BUYING PROCESS(Percentage Distribution)
FloridaVery Satisfied 62%Somewhat Satisfied 28Somewhat Dissatisfied 7Very Dissatisfied 3
U.S.Very Satisfied 61%Somewhat Satisfied 31Somewhat Dissatisfied 6Very Dissatisfied 2
Very Satisfied61%
Somewhat Satisfied31%
Somewhat Dissatisfied
6%
Very Dissatisfied2%
SATISFACTION IN BUYING PROCESS
Very Satisfied62%
Somewhat Satisfied28%
Somewhat Dissatisfied
7%
Very Dissatisfied
3%
SATISFACTION IN BUYING PROCESS
2012 National Association of Realtors® Profile of Home Buyers and Sellers

HOME BUYING AND REAL ESTATE PROFESSIONALS
Exhibit 4-1 METHOD OF HOME PURCHASE, 2001-2012Exhibit 4-2 METHOD OF HOME PURCHASE, BY REGIONExhibit 4-3 METHOD OF HOME PURCHASE, NEW AND PREVIOUSLY OWNED HOMESExhibit 4-4 METHOD OF HOME PURCHASE, BY ADULT COMPOSITION OF HOUSEHOLDExhibit 4-5 AGENT REPRESENTATION DISCLOSURE, FIRST-TIME AND REPEAT BUYERSExhibit 4-6 BUYER REPRESENTATIVE ARRANGEMENT WITH AGENT, FIRST-TIME AND REPEAT BUYERSExhibit 4-7 HOW REAL ESTATE AGENT WAS COMPENSATEDExhibit 4-8 WHAT BUYERS WANT MOST FROM REAL ESTATE AGENTSExhibit 4-9 WHAT BUYERS WANT MOST FROM REAL ESTATE AGENTS, FIRST-TIME AND REPEAT BUYERS,
AND BUYERS OF NEW AND PREVIOUSLY OWNED HOMESExhibit 4-10 WHAT BUYERS WANT MOST FROM REAL ESTATE AGENTS, BY ADULT COMPOSITION OF Exhibit 4-11 BENEFITS PROVIDED BY REAL ESTATE AGENT DURING HOME PURCHASE PROCESS, FIRST-
TIME AND REPEAT BUYERSExhibit 4-12 HOW BUYER FOUND REAL ESTATE AGENT, FIRST-TIME AND REPEAT BUYERSExhibit 4-13 HOW BUYER FOUND REAL ESTATE AGENT, BY ADULT COMPOSITION OF HOUSEHOLDExhibit 4-14 NUMBER OF REAL ESTATE AGENTS INTERVIEWED BY FIRST-TIME AND REPEAT BUYERSExhibit 4-15 MOST IMPORTANT FACTORS WHEN CHOOSING AN AGENTExhibit 4-16 IMPORTANCE OF REAL ESTATE AGENT SKILLS AND QUALITIESExhibit 4-17 AGENT SKILLS AND QUALITIES CONSIDERED 'VERY IMPORTANT' BY FIRST-TIME AND REPEAT
BUYERS, AND BUYERS OF NEW AND PREVIOUSLY OWNED HOMESExhibit 4-18 AGENT SKILLS AND QUALITIES CONSIDERED 'VERY IMPORTANT' BY ADULT COMPOSITION OF
HOUSEHOLDExhibit 4-19 SATISFACTION WITH REAL ESTATE AGENT SKILLS AND QUALITIESExhibit 4-20 WOULD BUYER USE REAL ESTATE AGENT AGAIN OR RECOMMEND TO OTHERS
2012 National Association of Realtors® Profile of Home Buyers and Sellers

HOME BUYING AND REAL ESTATE PROFESSIONALS
Exhibit 4-1METHOD OF HOME PURCHASE, 2001-2012(Percentage Distribution)
Florida
2012Through a real estate agent or broker 84%Directly from builder or builder's agent 9Directly from the previous owner 6
U.S.
2001 2003 2004 2005 2006 2007 2008 2009 2010 2011 2012Through a real estate agent or broker 69% 75% 77% 77% 77% 79% 81% 77% 83% 89% 89%Directly from builder or builder's agent 15 14 12 12 13 12 10 8 6 7 6Directly from the previous owner 15 9 9 9 9 7 6 5 5 4 5
*Less than 1 percent
2012 National Association of Realtors® Profile of Home Buyers and Sellers

HOME BUYING AND REAL ESTATE PROFESSIONALS
Exhibit 4-2METHOD OF HOME PURCHASE, BY REGION(Percentage Distribution)
Florida U.S. Northeast Midwest South WestThrough a real estate agent or broker 84% 89% 90% 89% 86% 91%Directly from builder or builder's agent 9 6 4 4 8 5Directly from the previous owner 6 5 5 7 5 3 Knew previous owner 3 3 3 3 3 2 Did not know previous owner 3 2 3 4 2 1
BUYERS WHO PURCHASED A HOME IN THE
2012 National Association of Realtors® Profile of Home Buyers and Sellers

HOME BUYING AND REAL ESTATE PROFESSIONALS
Exhibit 4-3METHOD OF HOME PURCHASE, NEW AND PREVIOUSLY OWNED HOMES(Percentage Distribution)
Florida
All Buyers New HomesPreviously
Owned HomesThrough a real estate agent or broker 84% 56% 92%Directly from builder or builder's agent 9 44 *Directly from the previous owner 6 N/A 7 Knew previous owner 3 N/A 4 Did not know previous owner 3 N/A 4
*Less than 1 percent
U.S.
All Buyers New HomesPreviously
Owned HomesThrough a real estate agent or broker 89% 63% 93%Directly from builder or builder's agent 6 36 NADirectly from the previous owner 5 NA 6 Knew previous owner 3 NA 3 Did not know previous owner 2 NA 3
NA- Not Applicable
BUYERS OF
BUYERS OF
2012 National Association of Realtors® Profile of Home Buyers and Sellers

HOME BUYING AND REAL ESTATE PROFESSIONALS
Exhibit 4-4METHOD OF HOME PURCHASE, BY ADULT COMPOSITION OF HOUSEHOLD(Percentage Distribution)
Florida
All BuyersMarried couple
Single female
Single male
Unmarried couple Other
Through a real estate agent or broker 84% 86% 81% 71% 84% 82%Directly from builder or builder's agent 9 9 9 13 8 *Directly from the previous owner 6 4 8 11 8 18 Knew previous owner 3 2 5 7 3 * Did not know previous owner 3 2 4 4 5 18
*Less than 1 percent
U.S.
All Buyers
Married couple
Single female
Single male
Unmarried couple Other
Through a real estate agent or broker 89% 89% 88% 87% 90% 86%Directly from builder or builder's agent 6 6 5 6 5 2Directly from the previous owner 5 5 5 5 4 12 Knew previous owner 3 2 3 4 2 7 Did not know previous owner 2 2 3 2 2 5
ADULT COMPOSITION OF HOUSEHOLD
ADULT COMPOSITION OF HOUSEHOLD
2012 National Association of Realtors® Profile of Home Buyers and Sellers

HOME BUYING AND REAL ESTATE PROFESSIONALS
Exhibit 4-5AGENT REPRESENTATION DISCLOSURE, FIRST-TIME AND REPEAT BUYERS(Percentage Distribution)
Florida
Disclosure Statement Signed? All Buyers First-time Buyers Repeat BuyersYes, at first meeting 19% 11% 21%Yes, when contract was written 14 12 15Yes, at some other time 7 5 8No 34 41 32Don’t know 26 32 25
U.S.
Disclosure Statement Signed? All Buyers First-time Buyers Repeat BuyersYes, at first meeting 29% 26% 31%Yes, when contract was written 20 19 22Yes, at some other time 11 12 10No 21 24 20Don’t know 19 20 18
2012 National Association of Realtors® Profile of Home Buyers and Sellers
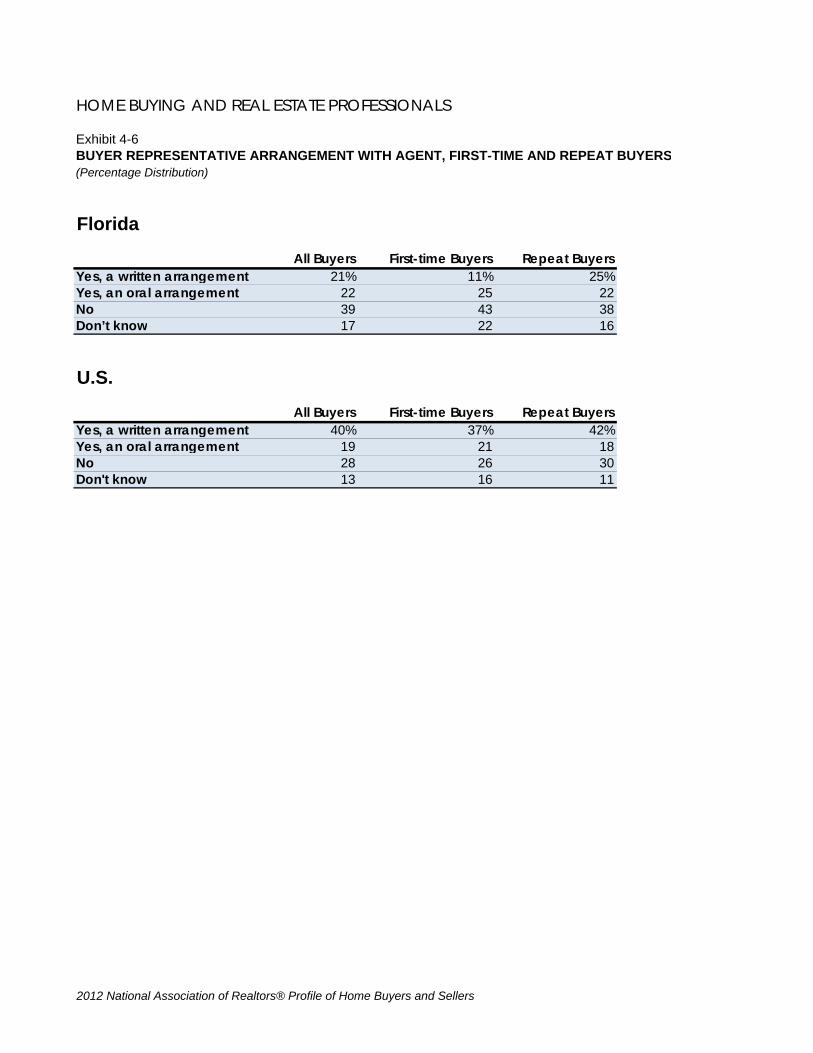
HOME BUYING AND REAL ESTATE PROFESSIONALS
Exhibit 4-6BUYER REPRESENTATIVE ARRANGEMENT WITH AGENT, FIRST-TIME AND REPEAT BUYERS(Percentage Distribution)
Florida
All Buyers First-time Buyers Repeat BuyersYes, a written arrangement 21% 11% 25%Yes, an oral arrangement 22 25 22No 39 43 38Don’t know 17 22 16
U.S.
All Buyers First-time Buyers Repeat BuyersYes, a written arrangement 40% 37% 42%Yes, an oral arrangement 19 21 18No 28 26 30Don't know 13 16 11
2012 National Association of Realtors® Profile of Home Buyers and Sellers

HOME BUYING AND REAL ESTATE PROFESSIONALS
Exhibit 4-7HOW REAL ESTATE AGENT WAS COMPENSATED(Percentage Distribution)
Florida
All Types of Representation Buyer Only
Seller or Seller and Buyer
Paid by seller 63% 63% 63%Paid by buyer and seller 10 9 10Paid by buyer only 19 21 16
Percent of sales price 14 15 14Flat fee 1 2 1Other * * *Don’t know 3 4 2
Other 2 2 3Don't know 7 5 8
U.S.
All Types of Representation Buyer Only
Seller or Seller and Buyer
Paid by seller 59% 61% 57%Paid by buyer and seller 12 11 12Paid by buyer only 17 19 15
Percent of sales price 13 15 11Flat fee 1 2 1Other * * *Don't know 2 2 3
Other 2 2 3Don’t know 10 8 13
*Less than 1 percent
TYPE OF AGENT REPRESENTATION
TYPE OF AGENT REPRESENTATION
2012 National Association of Realtors® Profile of Home Buyers and Sellers

HOME BUYING AND REAL ESTATE PROFESSIONALS
Exhibit 4-8WHAT BUYERS WANT MOST FROM REAL ESTATE AGENTS(Percentage Distribution)
Florida U.S.Help find the right home to purchase 53% 50%Help with the price negotiations 13% 12%Help buyer negotiate the terms of sale 9% 12%Determine what comparable homes were selling for 7% 8%Help with paperwork 9% 7%Help determining how much home buyer can afford 2% 4%Help find and arrange financing 3% 3%Help teach buyer more about neighborhood or area (restaurants, parks, public transportation) 2% 2%Other 2% 2%
Help find the right home to purchase,
53%
Help with the price negotiations, 13%
Help buyer negotiate the terms of sale, 9%
Determine what comparable homes were selling for, 7%
Help with paperwork, 9%
Help determining how much home buyer can
afford, 2% Help find and arrange financing, 3%
Help teach buyer more about neighborhood or
area (restaurants, parks, public
transportation), 2%
Other, 2%
WHAT BUYERS WANT MOST FROM REAL ESTATE PROFESSIONALS(Percentage Distribution)
Florida
WHAT BUYERS WANT MOST FROM REAL ESTATE PROFESSIONALS(Percentage Distribution)
2012 National Association of Realtors® Profile of Home Buyers and Sellers

Help
Help with the price negotiations, 12%
Help buyer negotiate the terms of sale, 12%
Determine what comparable homes were selling for, 8%
Help with paperwork, 7%
Help determining how much home buyer can afford, 4%
Help find and arrange financing, 3%
Help teach buyer more about neighborhood or area
(restaurants, parks, public transportation), 2%
Other, 2%
U.S.
2012 National Association of Realtors® Profile of Home Buyers and Sellers

HOME BUYING AND REAL ESTATE PROFESSIONALS
Exhibit 4-9
(Percentage Distribution)
Florida
All Buyers
First-time Buyers
Repeat Buyers
New Homes
Previously Owned Homes
Help find the right home to purchase 53% 48% 55% 56% 52%Help with the price negotiations 13 13 13 14 13Help buyer negotiate the terms of sale 9 12 9 7 10Determine what comparable homes were selling for 7 5 8 9 7Help with paperwork 9 10 8 7 9Help determining how much home buyer can afford 2 5 1 3 2Help find and arrange financing 3 5 3 3 3Help teach buyer more about neighborhood or area (restaurants, parks, public transportation)
2 2 2 * 2
Other 2 3 2 2 2
*Less than 1 percent
U.S.All
BuyersFirst-time
BuyersRepeat Buyers
New Homes
Previously Owned Homes
Help find the right home to purchase 50% 50% 49% 49% 50%Help with the price negotiations 12 13 12 11 12Help buyer negotiate the terms of sale 12 11 12 12 12Determine what comparable homes were selling for 8 8 8 10 8Help with paperwork 7 7 7 8 7Help determining how much home buyer can afford 4 5 3 3 4Help find and arrange financing 3 3 3 3 3Help teach buyer more about neighborhood or area (restaurants, parks, public transportation)
2 2 2 2 2
Other 2 * 4 2 2
*Less than 1 percent
WHAT BUYERS WANT MOST FROM REAL ESTATE AGENTS, FIRST-TIME AND REPEAT BUYERS, AND BUYERS OF NEW AND PREVIOUSLY OWNED HOMES
BUYERS OF
BUYERS OF
2012 National Association of Realtors® Profile of Home Buyers and Sellers

HOME BUYING AND REAL ESTATE PROFESSIONALS
Exhibit 4-10WHAT BUYERS WANT MOST FROM REAL ESTATE AGENTS, BY ADULT COMPOSITION OF HOUSEHOLD(Percentage Distribution)
Florida
All Buyers
Married couple
Single female
Single male
Unmarried couple Other
Help find the right home to purchase 53% 53% 61% 44% 58% 22%Help with the price negotiations 13 13 12 16 3 33Help buyer negotiate the terms of sale 9 9 9 13 10 22Determine what comparable homes were selling for 7 7 9 3 3 11Help with paperwork 9 10 6 9 3 *Help determining how much home buyer can afford 2 2 * 3 3 11Help find and arrange financing 3 3 3 9 3 *Help teach buyer more about neighborhood or area (restaurants, parks, public transportation)
2 2 * * 3 *
Other 2 1 * 3 10 *
U.S.All
BuyersMarried couple
Single female
Single male
Unmarried couple Other
Help find the right home to purchase 50% 49% 51% 46% 54% 50%Help with the price negotiations 12 12 12 12 12 7Help buyer negotiate the terms of sale 12 12 12 12 8 12Determine what comparable homes were selling for 8 8 10 7 5 12Help with paperwork 7 7 6 9 7 8Help determining how much home buyer can afford 4 4 3 5 4 2Help find and arrange financing 3 3 2 4 5 2Help teach buyer more about neighborhood or area (re 2 1 2 2 3 5Other 2 2 2 3 2 3
ADULT COMPOSITION OF HOUSEHOLD
ADULT COMPOSITION OF HOUSEHOLD
2012 National Association of Realtors® Profile of Home Buyers and Sellers

HOME BUYING AND REAL ESTATE PROFESSIONALS
Exhibit 4-11
(Percent of Respondents)
Florida
All BuyersFirst-time
BuyersRepeat Buyers
Helped buyer understand the process 49% 75% 41%Pointed out unnoticed features/faults with property 44 47 43Negotiated better sales contract terms 36 42 33Improved buyer's knowledge of search areas 46 38 49Provided a better list of service providers 39 43 37Negotiated a better price 34 33 34Shortened buyer's home search 31 35 30Provided better list of mortgage lenders 18 26 15Narrowed buyer's search area 19 18 20Expanded buyer's search area 17 20 16Other 1 3 1None of the above 9 9 9
U.S.
All BuyersFirst-time
BuyersRepeat Buyers
Helped buyer understand the process 60% 78% 48%Pointed out unnoticed features/faults with property 53 55 52Provided a better list of service providers 43 44 43Improved buyer's knowledge of search areas 43 41 44Negotiated better sales contract terms 42 44 41Negotiated a better price 35 35 35Shortened buyer's home search 28 30 27Provided better list of mortgage lenders 21 22 20Expanded buyer's search area 20 22 18Narrowed buyer's search area 17 16 17None of the above 6 6 6Other 1 1 2
BENEFITS PROVIDED BY REAL ESTATE AGENT DURING HOME PURCHASE PROCESS, FIRST-TIME AND REPEAT BUYERS
2012 National Association of Realtors® Profile of Home Buyers and Sellers

HOME BUYING AND REAL ESTATE PROFESSIONALS
Exhibit 4-12HOW BUYER FOUND REAL ESTATE AGENT, FIRST-TIME AND REPEAT BUYERS(Percentage Distribution)
FloridaAll
BuyersFirst-time
BuyersRepeat Buyers
Referred by (or is) a friend, neighbor or relative 35% 48% 31%Internet Web site 14 12 15Used agent previously to buy or sell a home 8 1 10Saw contact information on For Sale/Open House sign 8 11 7Visited an open house and met agent 4 1 5Referred by another real estate agent or broker 4 5 4Personal contact by agent (telephone, email, etc.) 4 4 4Referred through employer or relocation company 1 2 1Walked into or called office and agent was on duty 6 4 6Search engine 1 * 1Newspaper, Yellow Pages or home book ad 0 * 0Direct mail (newsletter, flyer, postcard, etc.) 1 1 1Advertising specialty (calendar, magnet, etc.) 0 * 0Mobile or tablet application 0 * 0Other 14 13 15
U.S.All
BuyersFirst-time
BuyersRepeat Buyers
Referred by (or is) a friend, neighbor or relative 40% 49% 34%Internet Web site 11 12 9Used agent previously to buy or sell a home 10 2 16Saw contact information on For Sale/Open House sign 6 7 6Visited an open house and met agent 6 5 6Referred by another real estate agent or broker 5 5 6Personal contact by agent (telephone, email, etc.) 4 4 4Referred through employer or relocation company 4 2 5Walked into or called office and agent was on duty 3 2 3Search engine 1 1 1Newspaper, Yellow Pages or home book ad * * 1Direct mail (newsletter, flyer, postcard, etc.) * * *Advertising specialty (calendar, magnet, etc.) * * *Mobile or tablet application * * *Other 10 10 10
*Less than 1 percent
2012 National Association of Realtors® Profile of Home Buyers and Sellers

HOME BUYING AND REAL ESTATE PROFESSIONALS
Exhibit 4-13HOW BUYER FOUND REAL ESTATE AGENT, BY ADULT COMPOSITION OF HOUSEHOLD(Percentage Distribution)
FloridaAll
BuyersMarried couple
Single female
Single male
Unmarried couple Other
Referred by (or is) a friend, neighbor or relative 35% 28% 48% 53% 55% 33%Internet Web site 14 17 10 6 7 11Used agent previously to buy or sell a home 8 10 6 3 * 11Saw contact information on For Sale/Open House sign 8 9 9 * 7 *Visited an open house and met agent 4 4 2 3 3 11Referred by another real estate agent or broker 4 5 3 * 7 *Personal contact by agent (telephone, email, etc.) 4 4 3 9 3 *Referred through employer or relocation company 1 1 * * * *Walked into or called office and agent was on duty 6 6 5 13 3 *Search engine 1 1 2 * * *Newspaper, Yellow Pages or home book ad 0 0 * * * *Direct mail (newsletter, flyer, postcard, etc.) 1 1 * * * *Advertising specialty (calendar, magnet, etc.) 0 0 * * * *Mobile or tablet application 0 0 * * * *Other 14 13 13 13 16 33
U.S.All
BuyersMarried couple
Single female
Single male
Unmarried couple Other
Referred by (or is) a friend, neighbor or relative 40% 38% 44% 44% 43% 26%Internet Web site 11 11 9 10 14 6Used agent previously to buy or sell a home 10 11 11 11 6 14Saw contact information on For Sale/Open House sign 6 6 6 4 12 10Visited an open house and met agent 6 6 5 5 6 4Referred by another real estate agent or broker 5 6 5 6 3 6Personal contact by agent (telephone, email, etc.) 4 4 3 4 4 4Referred through employer or relocation company 4 4 2 3 2 *Walked into or called office and agent was on duty 3 3 2 5 2 9Search engine 1 1 1 1 * 2Newspaper, Yellow Pages or home book ad * * * 1 * 3Direct mail (newsletter, flyer, postcard, etc.) * * * 1 * *Advertising specialty (calendar, magnet, etc.) * * * * * *Mobile or tablet application * * * * * *Other 10 10 12 7 9 15
*Less than 1 percent
ADULT COMPOSITION OF HOUSEHOLD
ADULT COMPOSITION OF HOUSEHOLD
2012 National Association of Realtors® Profile of Home Buyers and Sellers
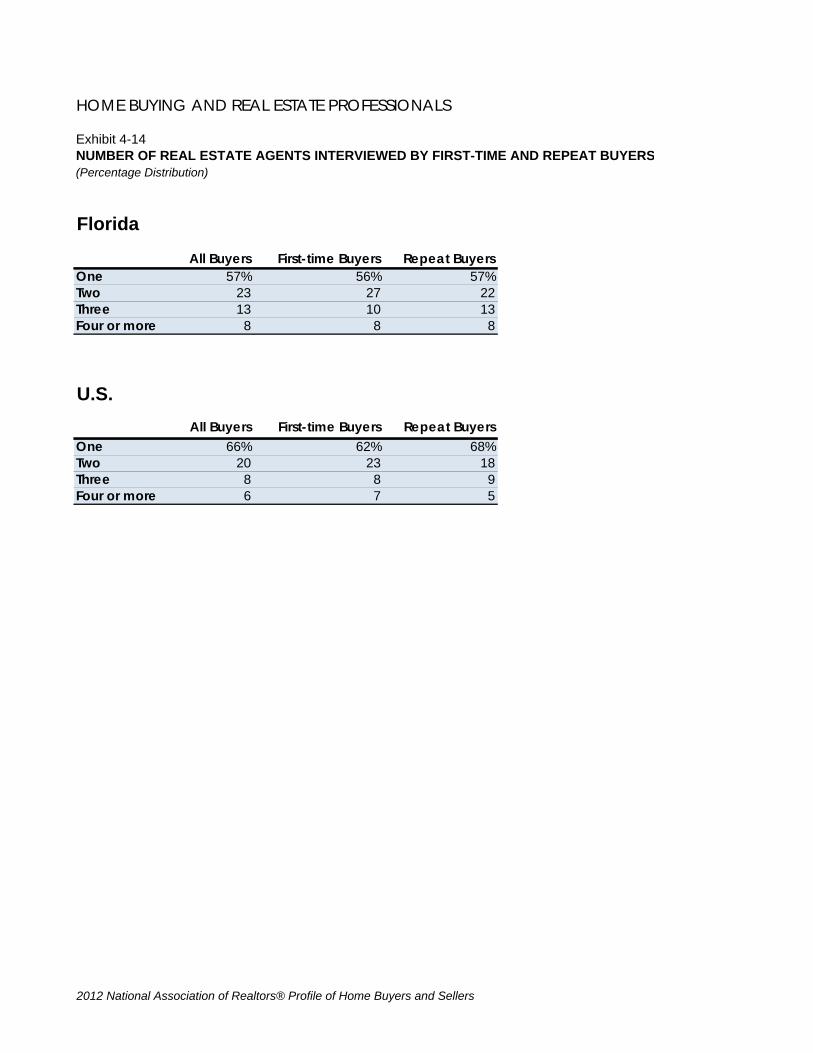
HOME BUYING AND REAL ESTATE PROFESSIONALS
Exhibit 4-14NUMBER OF REAL ESTATE AGENTS INTERVIEWED BY FIRST-TIME AND REPEAT BUYERS(Percentage Distribution)
Florida
All Buyers First-time Buyers Repeat BuyersOne 57% 56% 57%Two 23 27 22Three 13 10 13Four or more 8 8 8
U.S.All Buyers First-time Buyers Repeat Buyers
One 66% 62% 68%Two 20 23 18Three 8 8 9Four or more 6 7 5
2012 National Association of Realtors® Profile of Home Buyers and Sellers

HOME BUYING AND REAL ESTATE PROFESSIONALS
Exhibit 4-15MOST IMPORTANT FACTORS WHEN CHOOSING AN AGENT(Percentage Distribution)
Florida U.S.Agent is honest and trustworthy 23% 24%Reputation of agent 19% 21%Agent is friend or family member 12% 15%Agent’s knowledge of the neighborhood 20% 12%Agent has caring personality/good listener 6% 9%Agent is timely with responses 8% 6%Agent’s association with a particular firm 4% 4%Agent seems 100% accessible because of use of technology like tablet or smartphone 3% 3%Professional designations held by agent 2% 2%Other 3% 4%
Agent is honest and trustworthy, 23%
Reputation of agent, 19%
Agent is friend or family member, 12%
Agent’s knowledge of the neighborhood,
20%
Agent has caring personality/good
listener, 6%
Agent is timely with responses, 8%
Agent’s association with a particular firm,
4%
Agent seems 100% accessible because of use of technology
like tablet or smartphone, 3%
MOST IMPORTANT FACTORS IN CHOOSING AN AGENT(Percentage Distribution)
Florida
2012 National Association of Realtors® Profile of Home Buyers and Sellers

Agent is honest and trustworthy, 24%
Reputation of agent, 21%
Agent is friend or family member, 15%
Agent’s knowledge of the neighborhood, 12%
Agent has caring personality/good
listener, 9%
Agent is timely with responses, 6%
Agent’s association with a particular firm,
4%
Agent seems 100% accessible because of use of technology like tablet or smartphone,
3%
Professional designations held
by agent, 2%
Other, 4%
MOST IMPORTANT FACTORS IN CHOOSING AN AGENT(Percentage Distribution)
U.S.
2012 National Association of Realtors® Profile of Home Buyers and Sellers

HOME BUYING AND REAL ESTATE PROFESSIONALS
Exhibit 4-16IMPORTANCE OF REAL ESTATE AGENT SKILLS AND QUALITIES(Percentage Distribution)
Florida
Very Important
Somewhat Important
Not Important
Honesty and integrity 97% 2% 1%Knowledge of purchase process 91 8 1Responsiveness 92 7 1Knowledge of real estate market 90 9 1Communication skills 84 15 1Negotiation skills 81 16 3People skills 80 18 2Knowledge of local area 80 17 3Skills with technology 45 49 6
U.S.
Very Important
Somewhat Important
Not Important
Honesty and integrity 97% 3% *Knowledge of purchase process 93 6 1Responsiveness 92 7 *Knowledge of real estate market 91 8 1Communication skills 86 13 1Negotiation skills 84 15 1People skills 81 18 1Knowledge of local area 77 21 2Skills with technology 43 48 9
*Less than 1 percent
2012 National Association of Realtors® Profile of Home Buyers and Sellers

HOME BUYING AND REAL ESTATE PROFESSIONALS
Exhibit 4-17
(Percent of Respondents)
Florida
All BuyersFirst-time
BuyersRepeat Buyers
New Homes
Previously Owned Homes
Honesty and integrity 97% 96% 98% 98% 97%Knowledge of purchase process 91 95 89 85 91Responsiveness 92 89 93 95 91Knowledge of real estate market 90 87 90 91 89Communication skills 84 82 84 78 85Negotiation skills 81 81 81 81 81People skills 80 77 81 83 80Knowledge of local area 80 72 83 86 79Skills with technology 45 37 48 40 46
U.S.
All BuyersFirst-time
BuyersRepeat Buyers
New Homes
Previously Owned Homes
Honesty and integrity 97% 97% 97% 97% 97%Knowledge of purchase process 93 93 92 93 93Responsiveness 92 92 92 90 93Knowledge of real estate market 91 92 91 90 91Communication skills 86 86 86 84 86Negotiation skills 84 86 83 84 84People skills 81 83 79 80 81Knowledge of local area 77 78 76 78 77Skills with technology 43 43 43 46 43
AGENT SKILLS AND QUALITIES CONSIDERED 'VERY IMPORTANT' BY FIRST-TIME AND REPEAT BUYERS, AND BUYERS OF NEW AND PREVIOUSLY OWNED HOMES
BUYERS OF
BUYERS OF
2012 National Association of Realtors® Profile of Home Buyers and Sellers

HOME BUYING AND REAL ESTATE PROFESSIONALS
Exhibit 4-18
(Percentage Distribution)
Florida
All BuyersMarried couple
Single female
Single male
Unmarried couple Other
Honesty and integrity 97% 96% 100% 97% 97% 100%Knowledge of purchase process 91 91 92 94 87 89Responsiveness 92 92 93 94 93 89Knowledge of real estate market 90 89 95 90 84 100Communication skills 84 84 91 84 71 89Negotiation skills 81 81 88 81 73 78People skills 80 80 92 68 77 89Knowledge of local area 80 82 82 87 74 44Skills with technology 45 42 66 47 27 44
U.S.
All BuyersMarried couple
Single female
Single male
Unmarried couple Other
Honesty and integrity 97% 97% 96% 99% 96% 97%Knowledge of purchase process 93 92 95 93 92 94Responsiveness 92 93 91 95 90 91Knowledge of real estate market 91 91 92 92 87 98Communication skills 86 86 84 90 82 90Negotiation skills 84 84 83 88 84 80People skills 81 81 77 84 78 85Knowledge of local area 77 78 75 78 76 90Skills with technology 43 44 38 42 44 55
AGENT SKILLS AND QUALITIES CONSIDERED 'VERY IMPORTANT' BY ADULT COMPOSITION OF HOUSEHOLD
ADULT COMPOSITION OF HOUSEHOLD
ADULT COMPOSITION OF HOUSEHOLD
2012 National Association of Realtors® Profile of Home Buyers and Sellers

HOME BUYING AND REAL ESTATE PROFESSIONALS
Exhibit 4-19SATISFACTION WITH REAL ESTATE AGENT SKILLS AND QUALITIES(Percentage Distribution)
Florida
Very Satisfied Somewhat Satisfied Not SatisfiedKnowledge of purchase process 83% 14% 3%Honesty and integrity 88 9 3Knowledge of real estate market 86 12 2People skills 84 12 4Responsiveness 83 15 3Knowledge of local area 85 12 3Communication skills 80 17 3Skills with technology 73 23 4Negotiation skills 76 17 7
U.S.
Very Satisfied Somewhat Satisfied Not SatisfiedHonesty and integrity 87% 10% 3%Knowledge of purchase process 87 11 2Knowledge of real estate market 85 13 2People skills 84 13 2Responsiveness 83 14 3Communication skills 81 16 4Knowledge of local area 80 17 3Skills with technology 75 22 3Negotiation skills 73 21 5
2012 National Association of Realtors® Profile of Home Buyers and Sellers

HOME BUYING AND REAL ESTATE PROFESSIONALS
Exhibit 4-20WOULD BUYER USE REAL ESTATE AGENT AGAIN OR RECOMMEND TO OTHERS(Percentage distribution)
Florida
Definitely 76%Probably 11%Probably Not 6%Definitely Not 5%Don’t Know 2%
76%
11%
6% 5%2%
0%
10%
20%
30%
40%
50%
60%
70%
80%
Definitely Probably Probably Not Definitely Not Don’t Know
WOULD BUYER USE ESTATE AGENT AGAIN OR RECOMMEND TO OTHERS
(Percentage Distribution)
2012 National Association of Realtors® Profile of Home Buyers and Sellers
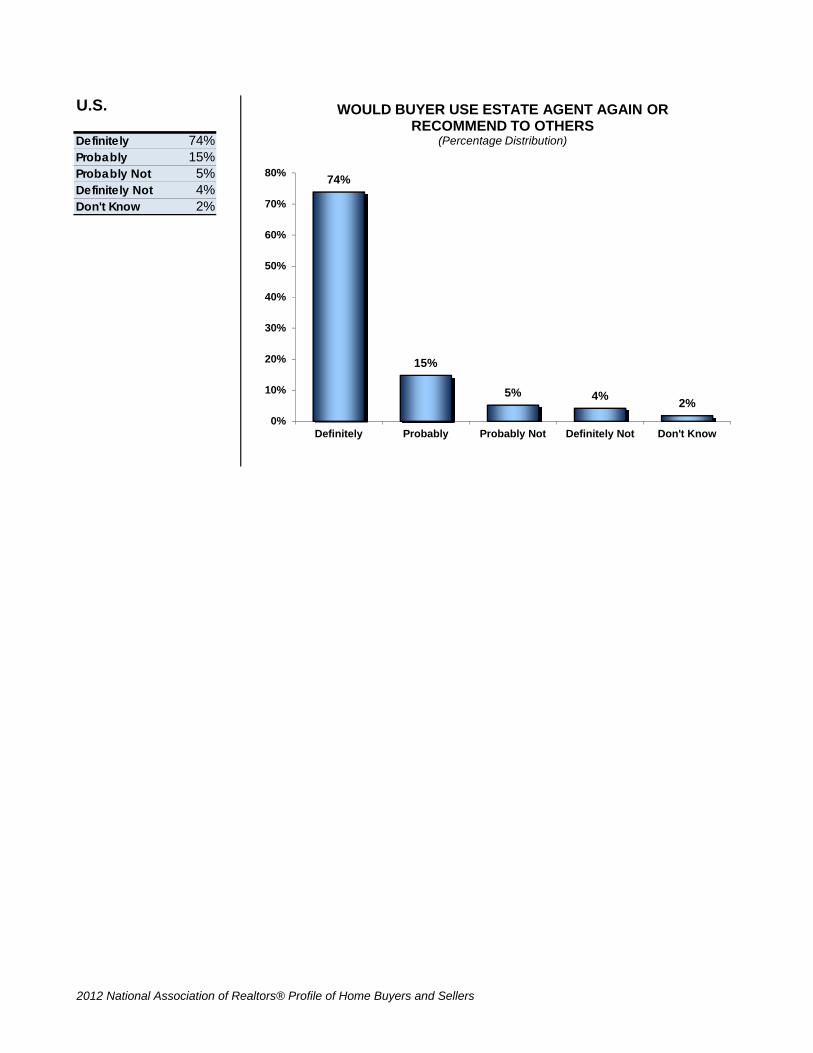
U.S.
Definitely 74%Probably 15%Probably Not 5%Definitely Not 4%Don't Know 2%
74%
15%
5% 4% 2%0%
10%
20%
30%
40%
50%
60%
70%
80%
Definitely Probably Probably Not Definitely Not Don't Know
WOULD BUYER USE ESTATE AGENT AGAIN OR RECOMMEND TO OTHERS
(Percentage Distribution)
2012 National Association of Realtors® Profile of Home Buyers and Sellers

FINANCING THE HOME PURCHASE
Exhibit 5-1 BUYERS WHO FINANCED THEIR HOME PURCHASE, BY AGEExhibit 5-2 BUYERS WHO FINANCED THEIR HOME PURCHASE, BY ADULT COMPOSITION OF HOUSEHOLDExhibit 5-3 PERCENT OF HOME FINANCED BY FIRST-TIME AND REPEAT BUYERS, AND BUYERS OF NEW AND
PREVIOUSLY OWNED HOMESExhibit 5-4 SOURCES OF DOWNPAYMENT, FIRST-TIME AND REPEAT BUYERSExhibit 5-5 SOURCES OF DOWNPAYMENT, BY ADULT COMPOSITION OF HOUSEHOLDExhibit 5-6 SACRIFICES MADE TO PURCHASE HOME, BY FIRST-TIME AND REPEAT BUYERSExhibit 5-7 SACRIFICES MADE TO PURCHASE HOME, BY ADULT COMPOSITION OF HOUSEHOLDExhibit 5-8 DIFFICULTY OF MORTGAGE APPLICATION AND APPROVAL PROCESS, BY FIRST-TIME AND REPEAT
BUYERSExhibit 5-9 DIFFICULTY OF MORTGAGE APPLICATION AND APPROVAL PROCESS, BY ADULT COMPOSITION OF
HOUSEHOLDExhibit 5-10 TYPE OF MORTGAGE, FIRST-TIME AND REPEAT BUYERSExhibit 5-11 TYPE OF LOAN, FIRST-TIME AND REPEAT BUYERSExhibit 5-12 BUYERS' VIEW OF HOMES AS A FINANCIAL INVESTMENT, FIRST-TIME AND REPEAT BUYERS, AND
BUYERS OF NEW AND PREVIOUSLY OWNED HOMESExhibit 5-13 BUYERS' VIEW OF HOMES AS A FINANCIAL INVESTMENT, BY ADULT COMPOSITION OF HOUSEHOLD
2012 National Association of Realtors® Profile of Home Buyers and Sellers

FINANCING THE HOME PURCHASE
Exhibit 5-1BUYERS WHO FINANCED THEIR HOME PURCHASE, BY AGE(Percent of Respondents)
Florida
All Buyers 70%18 to 24 85%25 to 44 94%45 to 64 70%65 or older 41%
U.S.
All Buyers 87%18 to 24 96%25 to 44 97%45 to 64 83%65 or older 56%
70%
85%94%
70%
41%
0%
20%
40%
60%
80%
100%
All Buyers 18 to 24 25 to 44 45 to 64 65 or older
BUYERS WHO FINANCED THEIR HOME PURCHASE, BY AGE
(Percent of Respondents)
Florida
87%
96% 97%
83%
56%
0
20
40
60
80
100
All Buyers 18 to 24 25 to 44 45 to 64 65 or older
BUYERS WHO FINANCED THEIR HOME PURCHASE, BY AGE
(Percent of Respondents)
Age
U.S.
Age
2012 National Association of Realtors® Profile of Home Buyers and Sellers

FINANCING THE HOME PURCHASE
Exhibit 5-2BUYERS WHO FINANCED THEIR HOME PURCHASE, BY ADULT COMPOSITION OF HOUSEHOLD(Percent of Respondents)
Florida
All buyersMarried couple
Single female
Single male
Unmarried couple Other
All Buyers 70% 70% 61% 76% 68% 82%First-time Buyers 87 86 83 95 83 100Repeat Buyers 64 66 52 63 55 78
U.S.
All buyersMarried couple
Single female
Single male
Unmarried couple Other
All Buyers 87% 88% 82% 83% 92% 76%First-time Buyers 95 96 94 94 96 82Repeat Buyers 81 84 71 74 84 73
ADULT COMPOSITION OF HOUSEHOLD
ADULT COMPOSITION OF HOUSEHOLD
2012 National Association of Realtors® Profile of Home Buyers and Sellers

FINANCING THE HOME PURCHASE
Exhibit 5-3
(Percentage Distribution)
Florida
All BuyersFirst-time
BuyersRepeat Buyers
New Homes
Previously Owned Homes
Less than 50% 9% 2% 13% 13% 9%50% to 59% 3 2 4 6 260% to 69% 6 1 8 8 570% to 79% 15 12 17 13 1680% to 89% 18 14 20 16 1990% to 94% 10 12 9 9 1095% to 99% 21 30 17 14 23100% – Financed the entire purchase price with a mortgage
18 28 13 23 16
Median percent financed 89% 96% 84% 87% 90%
* Less than 1 percent
U.S.
All BuyersFirst-time
BuyersRepeat Buyers
New Homes
Previously Owned Homes
Less than 50% 9% 7% 10% 11% 8%50% to 59% 3 1 4 5 360% to 69% 4 1 6 4 470% to 79% 11 6 15 12 1180% to 89% 20 16 23 17 2190% to 94% 13 13 13 12 1395% to 99% 25 33 19 21 26100% – Financed the entire purchase price with a mortgage
15 22 10 19 14
Median percent financed 91% 96% 87% 91% 91%
PERCENT OF HOME FINANCED BY FIRST-TIME AND REPEAT BUYERS, AND BUYERS OF NEW AND PREVIOUSLY OWNED HOMES
BUYERS OF
BUYERS OF
2012 National Association of Realtors® Profile of Home Buyers and Sellers

FINANCING THE HOME PURCHASE
Exhibit 5-4SOURCES OF DOWNPAYMENT, FIRST-TIME AND REPEAT BUYERS(Percent of Respondents Among those who Made a Downpayment)
Florida
All Buyers
First-time Buyers
Repeat Buyers
Savings 54% 74% 47%Proceeds from sale of primary residence 34 1 45Gift from relative or friend 10 26 5Sale of stocks or bonds 8 7 8401k/pension fund including a loan 8 7 8Loan from relative or friend 3 6 2Equity from primary residence buyer continue to own 1 * 1Inheritance 4 7 3Individual Retirement Account (IRA) 4 1 5Loan or financial assistance from source other than employer 0 * 1Proceeds from sale of real estate other than primary residence 2 1 2Loan from financial institution other than a mortgage 1 1 1Loan or financial assistance through employer 0 * 1Other 5 6 5
U.S.All
BuyersFirst-time
BuyersRepeat Buyers
Savings 65% 76% 59%Proceeds from sale of primary residence 25 1 40Gift from relative or friend 14 24 8401k/pension fund including a loan 9 11 9Sale of stocks or bonds 8 6 9Individual Retirement Account (IRA) 5 5 5Loan from relative or friend 4 6 3Inheritance 4 4 4Loan or financial assistance from source other than employer 2 5 1Equity from primary residence buyer continue to own 2 * 3Proceeds from sale of real estate other than primary residence 1 1 2Loan from financial institution other than a mortgage 1 1 1Loan or financial assistance through employer 1 1 1Other 4 5 4
* Less than 1 percent
2012 National Association of Realtors® Profile of Home Buyers and Sellers

FINANCING THE HOME PURCHASE
Exhibit 5-5SOURCES OF DOWNPAYMENT, BY ADULT COMPOSITION OF HOUSEHOLD(Percent of Respondents Among those who Made a Downpayment)
Florida
All BuyersMarried couple
Single female
Single male
Unmarried couple Other
Savings 54% 52% 49% 69% 69% 30%Proceeds from sale of primary residence 34 39 35 14 22 20Gift from relative or friend 10 9 13 3 16 *Sale of stocks or bonds 8 7 4 22 3 10401k/pension fund including a loan 8 7 9 6 16 20Loan from relative or friend 3 3 4 6 * *Equity from primary residence buyer continue to own 1 1 * * * 10Inheritance 4 3 4 6 9 *Individual Retirement Account (IRA) 4 5 3 6 3 *Loan or financial assistance from source other than employer 0 * * 3 * 10Proceeds from sale of real estate other than primary residence 2 2 3 * 3 *Loan from financial institution other than a mortgage 1 1 1 * * 10Loan or financial assistance through employer 0 0 * 3 * *Other 5 4 7 8 * 30
U.S.
All BuyersMarried couple
Single female
Single male
Unmarried couple Other
Savings 65% 65% 58% 70% 71% 57%Proceeds from sale of primary residence 25 29 25 14 13 24Gift from relative or friend 14 12 14 15 22 8401k/pension fund including a loan 9 9 10 10 11 8Sale of stocks or bonds 8 9 7 11 5 5Individual Retirement Account (IRA) 5 5 4 7 4 1Loan from relative or friend 4 4 4 5 5 4Inheritance 4 4 4 2 5 8Loan or financial assistance from source other than employer 2 2 4 2 4 4Equity from primary residence buyer continue to own 2 3 1 3 1 2Proceeds from sale of real estate other than primary residence 1 1 2 1 1 1Loan from financial institution other than a mortgage 1 1 1 1 1 3Loan or financial assistance through employer 1 1 1 1 1 *Other 4 4 4 5 6 7
* Less than 1 percent
ADULT COMPOSITION OF HOUSEHOLD
ADULT COMPOSITION OF HOUSEHOLD
2012 National Association of Realtors® Profile of Home Buyers and Sellers

FINANCING THE HOME PURCHASE
Exhibit 5-6SACRIFICES MADE TO PURCHASE HOME, BY FIRST-TIME AND REPEAT BUYERS(Percent of Respondents)
Florida
All Buyers
First-time Buyers
Repeat Buyers
Cut spending on luxury items or non-essential items 26% 42% 21%Cut spending on entertainment 21 34 16Cut spending on clothes 16 27 12Canceled vacation plans 10 12 9Earned extra income through a second job 4 7 3Sold a vehicle or decided not to purchase a vehicle 7 6 7Other 5 6 5Did not need to make any sacrifices 60 45 66
U.S.All
BuyersFirst-time
BuyersRepeat Buyers
Cut spending on luxury items or non-essential items 32% 42% 26%Cut spending on entertainment 26 35 20Cut spending on clothes 20 27 15Canceled vacation plans 13 14 11Sold a vehicle or decided not to purchase a vehicle 6 7 6Earned extra income through a second job 6 8 4Other 5 5 5Did not need to make any sacrifices 53 42 61
2012 National Association of Realtors® Profile of Home Buyers and Sellers

FINANCING THE HOME PURCHASE
Exhibit 5-7SACRIFICES MADE TO PURCHASE HOME, BY ADULT COMPOSITION OF HOUSEHOLD(Percent of Respondents)
Florida
All Buyers
Married couple
Single female
Single male
Unmarried couple Other
Cut spending on luxury items or non-essential items 26% 27% 25% 26% 30% 18%Cut spending on entertainment 21 20 24 20 19 27Cut spending on clothes 16 17 21 9 11 9Canceled vacation plans 10 10 9 4 8 9Earned extra income through a second job 4 4 3 2 8 *Sold a vehicle or decided not to purchase a vehicle 7 7 6 7 5 *Other 5 4 5 11 5 18Did not need to make any sacrifices 60 61 62 61 57 55
U.S.
All Buyers
Married couple
Single female
Single male
Unmarried couple Other
Cut spending on luxury items or non-essential items 32% 31% 36% 32% 34% 38%Cut spending on entertainment 26 24 30 28 30 17Cut spending on clothes 20 18 28 16 21 16Canceled vacation plans 13 12 12 16 12 13Sold a vehicle or decided not to purchase a vehicle 6 6 6 7 7 4Earned extra income through a second job 6 5 6 5 7 2Other 5 4 5 5 6 12Did not need to make any sacrifices 53 55 51 53 48 45
ADULT COMPOSITION OF HOUSEHOLD
ADULT COMPOSITION OF HOUSEHOLD
2012 National Association of Realtors® Profile of Home Buyers and Sellers

FINANCING THE HOME PURCHASE
Exhibit 5-8
(Percentage Distribution Among those who Financed their Home Purchase)
Florida
All BuyersFirst-time
BuyersRepeat Buyers
Much more difficult than expected 19% 15% 21%Somewhat more difficult than expected 25 29 23Not difficult/No more difficult than expected 40 36 42Easier than expected 16 20 14
* Less than 1 percent
U.S.
All BuyersFirst-time
BuyersRepeat Buyers
Much more difficult than expected 17% 16% 17%Somewhat more difficult than expected 23 26 21Not difficult/No more difficult than expected 44 39 47Easier than expected 17 19 15
DIFFICULTY OF MORTGAGE APPLICATION AND APPROVAL PROCESS, BY FIRST-TIME AND REPEAT BUYERS
2012 National Association of Realtors® Profile of Home Buyers and Sellers

FINANCING THE HOME PURCHASE
Exhibit 5-9
(Percentage Distribution Among those who Financed their Home Purchase)
Florida
All BuyersMarried couple
Single female
Single male
Unmarried couple Other
Much more difficult than expected 19% 19% 17% 14% 24% 33%Somewhat more difficult than expected 25 25 23 31 20 22Not difficult/No more difficult than expected 40 40 40 34 52 22Easier than expected 16 16 19 20 4 22
* Less than 1 percent
U.S.
All BuyersMarried couple
Single female
Single male
Unmarried couple Other
Much more difficult than expected 17% 16% 15% 18% 18% 25%Somewhat more difficult than expected 23 24 20 25 23 22Not difficult/No more difficult than expected 44 45 43 40 42 36Easier than expected 17 15 22 17 17 18
ADULT COMPOSITION OF HOUSEHOLD
ADULT COMPOSITION OF HOUSEHOLD
DIFFICULTY OF MORTGAGE APPLICATION AND APPROVAL PROCESS, BY ADULT COMPOSITION OF HOUSEHOLD
2012 National Association of Realtors® Profile of Home Buyers and Sellers

FINANCING THE HOME PURCHASE
Exhibit 5-10TYPE OF MORTGAGE, FIRST-TIME AND REPEAT BUYERS(Percentage Distribution Among those who Financed their Home Purchase)
Florida
All BuyersFirst-time
Buyers Repeat BuyersFixed-rate mortgage 88% 90% 88%Fixed- then adjustable-rate mortgage 5 2 6Adjustable-rate mortgage 4 2 5Don't know 2 5 1Other 1 2 0
* Less than 1 percent
U.S.
All BuyersFirst-time
Buyers Repeat BuyersFixed-rate mortgage 92% 93% 91%Fixed- then adjustable-rate mortgage 4 3 5Adjustable-rate mortgage 2 1 3Don't know 1 2 1Other 1 1 2
* Less than 1 percent
2012 National Association of Realtors® Profile of Home Buyers and Sellers

FINANCING THE HOME PURCHASE
Exhibit 5-11TYPE OF LOAN, FIRST-TIME AND REPEAT BUYERS(Percentage Distribution Among those who Financed their Home Purchase)
Florida
All BuyersFirst-time
Buyers Repeat BuyersConventional 46% 27% 55%VA 14 11 15FHA 31 48 23Don't know 4 7 2Other 6 8 4
* Less than 1 percent
U.S.
All BuyersFirst-time
Buyers Repeat BuyersConventional 49% 33% 61%FHA 33 46 24VA 10 10 10Don't Know 4 6 3Other 4 6 3
2012 National Association of Realtors® Profile of Home Buyers and Sellers

FINANCING THE HOME PURCHASE
Exhibit 5-12
(Percentage Distribution)
Florida
All BuyersFirst-time
BuyersRepeat Buyers
New Homes
Previously Owned Homes
Good financial investment 75% 87% 71% 75% 75%Better than stocks 42 51 40 35 45About as good as stocks 25 31 23 24 25Not as good as stocks 8 5 9 16 6
Not a good financial investment 8 4 9 7 8Don’t know 17 9 20 19 17
* Less than 1 percent
U.S.
All BuyersFirst-time
BuyersRepeat Buyers
New Homes
Previously Owned Homes
Good financial investment 78% 82% 75% 78% 78%Better than stocks 46 52 41 43 46About as good as stocks 23 23 24 26 23Not as good as stocks 9 7 10 9 9
Not a good financial investment 6 4 8 7 6Don't know 16 14 17 15 16
BUYERS' VIEW OF HOMES AS A FINANCIAL INVESTMENT, FIRST-TIME AND REPEAT BUYERS, AND BUYERS OF NEW AND PREVIOUSLY OWNED HOMES
BUYERS OF
BUYERS OF
2012 National Association of Realtors® Profile of Home Buyers and Sellers

FINANCING THE HOME PURCHASE
Exhibit 5-13BUYERS' VIEW OF HOMES AS A FINANCIAL INVESTMENT, BY ADULT COMPOSITION OF HOUSEHOLD(Percentage Distribution)
Florida
All BuyersMarried couple
Single female
Single male
Unmarried couple Other
Good financial investment 75% 75% 70% 83% 81% 64%Better than stocks 42 41 44 41 46 64About as good as stocks 25 26 22 24 35 *Not as good as stocks 8 9 4 17 * *
Not a good financial investment 8 9 9 2 5 *Don’t know 17 16 22 15 14 36
* Less than 1 percent
U.S.
All BuyersMarried couple
Single female
Single male
Unmarried couple Other
Good financial investment 78% 77% 76% 80% 85% 67%Better than stocks 46 44 48 47 50 42About as good as stocks 23 24 22 23 26 19Not as good as stocks 9 10 5 10 8 6
Not a good financial investment 6 7 6 6 2 7Don't know 16 16 19 14 13 26
ADULT COMPOSITION OF HOUSEHOLD
ADULT COMPOSITION OF HOUSEHOLD
2012 National Association of Realtors® Profile of Home Buyers and Sellers

HOME SELLERS AND THEIR SELLING EXPERIENCE
Exhibit 6-1 AGE OF HOME SELLERS, BY REGIONExhibit 6-2 HOUSEHOLD INCOME OF HOME SELLERS, 2011Exhibit 6-3 ADULT COMPOSITION OF HOME SELLER HOUSEHOLDSExhibit 6-4 NUMBER OF CHILDREN UNDER THE AGE OF 18 RESIDING IN HOME SELLER HOUSEHOLDExhibit 6-5 RACE/ETHNICITY OF HOME SELLERS, BY REGIONExhibit 6-6 PRIMARY LANGUAGE SPOKEN IN HOME SELLER HOUSEHOLD, BY REGIONExhibit 6-7 HOME SELLING SITUATION AMONG REPEAT BUYERSExhibit 6-8 FIRST-TIME OR REPEAT SELLERExhibit 6-9 HOMES SOLD AND FOR SALE, BY REGIONExhibit 6-10 LOCATION OF HOME SOLDExhibit 6-11 PROXIMITY OF HOME SOLD TO HOME PURCHASEDExhibit 6-12 TYPE OF HOME SOLD, BY LOCATIONExhibit 6-13 SIZE OF HOME PURCHASED COMPARED TO HOME RECENTLY SOLDExhibit 6-14 SIZE OF HOME PURCHASED COMPARED TO HOME RECENTLY SOLD, BY AGE OF SELLERExhibit 6-16 AGE OF HOME PURCHASED COMPARED TO HOME RECENTLY SOLDExhibit 6-15 NUMBER OF BEDROOMS, BATHROOMS BY ADULT COMPOSITION OF HOUSEHOLD, CHILDREN Exhibit 6-16 AGE OF HOME PURCHASED COMPARED TO HOME RECENTLY SOLDExhibit 6-17 PRICE OF HOME PURCHASED COMPARED TO HOME RECENTLY SOLDExhibit 6-18 PRICE OF HOME PURCHASED COMPARED TO HOME RECENTLY SOLD, BY AGE OF SELLERExhibit 6-19 PRIMARY REASON FOR SELLING PREVIOUS HOME, BY AGEExhibit 6-20 TENURE IN PREVIOUS HOME, BY TYPE OF HOMEExhibit 6-21 TENURE IN PREVIOUS HOME, BY AGE OF SELLERExhibit 6-22 DISTANCE BETWEEN HOME PURCHASED AND HOME RECENTLY SOLD, BY REGIONExhibit 6-23 DISTANCE BETWEEN HOME PURCHASED AND HOME RECENTLY SOLD, BY AGEExhibit 6-24 METHOD USED TO SELL HOME, BY REGIONExhibit 6-25 METHOD USED TO SELL HOME, BY SELLER URGENCYExhibit 6-26 METHOD OF SALE, BY BUYER AND SELLER RELATIONSHIPExhibit 6-27 METHOD USED TO SELL HOME, 2001-2012Exhibit 6-28 SALES PRICE COMPARED WITH LISTING PRICE, BY REGIONExhibit 6-29 SALES PRICE COMPARED WITH LISTING PRICE, BY SELLER URGENCYExhibit 6-30 NUMBER OF WEEKS RECENTLY SOLD HOME WAS ON THE MARKET, BY REGIONExhibit 6-31 SALES PRICE COMPARED WITH LISTING PRICE, BY NUMBER OF WEEKS HOME WAS ON THE
MARKETExhibit 6-32 NUMBER OF TIMES ASKING PRICE WAS REDUCED, BY NUMBER OF WEEKS HOME WAS ON
THE MARKETExhibit 6-33 INCENTIVES OFFERED TO ATTRACT BUYERS, BY REGIONExhibit 6-34 INCENTIVES OFFERED TO ATTRACT BUYERS, BY NUMBER OF WEEKS HOME WAS ON THE
MARKETExhibit 6-35 EQUITY EARNED IN HOME RECENTLY SOLD, BY TENURE IN HOME Exhibit 6-36 SATISFACTION WITH THE SELLING PROCESS
2012 National Association of Realtors® Profile of Home Buyers and Sellers

HOME SELLERS AND THEIR SELLING EXPERIENCE
Exhibit 6-1AGE OF HOME SELLERS, BY REGION(Percentage Distribution)
U.S. Northeast Midwest South West18 to 34 years 4% 13% 9% 16% 13% 9%35 to 44 years 7 21 22 24 21 1645 to 54 years 16 20 21 19 20 2155 to 64 years 29 22 26 21 21 2465 to 74 years 33 18 18 15 19 2175 years or older 11 7 5 6 6 9Median age (years) 63 53 54 51 53 56
* Less than 1 percent
SELLERS WHO SOLD A HOME IN THEFlorida
2012 National Association of Realtors® Profile of Home Buyers and Sellers

HOME SELLERS AND THEIR SELLING EXPERIENCE
Exhibit 6-2HOUSEHOLD INCOME OF HOME SELLERS, 2011(Percentage Distribution)
U.S. Northeast Midwest South WestLess than $25,000 6% 4% 2% 2% 4% 5%$25,000 to $34,999 5 4 3 4 4 5$35,000 to $44,999 8 6 6 6 4 9$45,000 to $54,999 7 6 8 5 4 9$55,000 to $64,999 9 6 5 8 6 5$65,000 to $74,999 7 7 6 10 6 7$75,000 to $84,999 10 8 8 10 9 7$85,000 to $99,999 14 13 12 12 13 15$100,000 to $124,999 10 16 17 17 16 15$125,000 to $149,999 11 9 13 9 10 6$150,000 to $174,999 3 6 6 5 7 5$175,000 to $199,999 2 3 5 2 3 3$200,000 or more 8 12 10 10 13 12Median income (2011) $83,200 $95,400 $100,800 $90,600 $100,600 $90,600
SELLERS WHO SOLD A HOME IN THE
Florida
2012 National Association of Realtors® Profile of Home Buyers and Sellers

HOME SELLERS AND THEIR SELLING EXPERIENCE
Exhibit 6-3ADULT COMPOSITION OF HOME SELLER HOUSEHOLDS(Percentage Distribution)
Florida
2012Married couple 75%Single female 14Single male 5Unmarried couple 5Other 1
* Less than 1 percent
U.S.
2004 2005 2006 2007 2008 2009 2010 2011 2012Married couple 74% 71% 72% 75% 74% 75% 75% 77% 76%Single female 15 17 17 15 15 14 16 16 14Single male 5 6 6 6 7 6 6 6 5Unmarried couple 5 3 4 3 3 4 3 3 4Other 1 1 1 1 1 1 1 1 1
2012 National Association of Realtors® Profile of Home Buyers and Sellers

HOME SELLERS AND THEIR SELLING EXPERIENCE
Exhibit 6-4NUMBER OF CHILDREN UNDER THE AGE OF 18 RESIDING IN HOME SELLER HOUSEHOLD(Percentage Distribution of Home Seller Households)
One 5%Two 7%Three or more 4%None 85%
U.S.
One 15%Two 17%Three or more 7%None 60%
Florida
One, 5% Two, 7%
Three or more, 4%
None, 85%
NUMBER OF CHILDREN UNDER THE AGE OF 18 RESIDING IN HOME SELLER HOUSEHOLD
(Percentage Distribution)
F
One, 15%
Two, 17%
Three or more, 7%
None, 60%
NUMBER OF CHILDREN UNDER THE AGE OF 18 RESIDING IN HOME SELLER HOUSEHOLD
(Percentage Distribution)
U.S.
12 National Association of Realtors® Profile of Home Buyers and Sellers

HOME SELLERS AND THEIR SELLING EXPERIENCE
Exhibit 6-5RACE/ETHNICITY OF HOME SELLERS, BY REGION(Percent of Respondents)
U.S. Northeast Midwest South WestWhite/Caucasian 93% 93% 94% 96% 93% 89%Black/African-American 1 2 2 1 2 1Asian/Pacific Islander 1 2 2 1 2 5Hispanic/Latino 3 3 2 1 3 7Other 3 2 1 2 2 2
Note: Respondents were permitted to select as many races and ethnicities as they felt applicable. The percentage distribution may therefore sum to more than 100 percent.
SELLERS WHO SOLD A HOME IN THEFlorida
2012 National Association of Realtors® Profile of Home Buyers and Sellers

HOME SELLERS AND THEIR SELLING EXPERIENCE
Exhibit 6-6PRIMARY LANGUAGE SPOKEN IN HOME SELLER HOUSEHOLD, BY REGION(Percentage Distribution)
U.S. Northeast Midwest South WestEnglish 96% 98% 99% 99% 98% 97%Other 4 2 1 1 2 3
SELLERS WHO SOLD A HOME IN THE
Florida
2012 National Association of Realtors® Profile of Home Buyers and Sellers

HOME SELLERS AND THEIR SELLING EXPERIENCE
Exhibit 6-7HOME SELLING SITUATION AMONG REPEAT BUYERS(Percentage Distribution)
Sold in 2012 28%Sold in 2011 30%Sold in 2010 or earlier
17%
Home has not yet sold and is currently vacant
4%
Home has not yet sold, but currently renting to others
4%
Do not plan to sell previous home
10%
Did not own previous home
6%
U.S.
Sold in 2012 30%Sold in 2011 26%Sold in 2010 or earlier
15%
Home has not yet sold and is currently vacant
6%
Home has not yet sold, but currently renting to others
6%
Do not plan to sell previous home
12%
Did not own previous home
5%
Florida
Sold in 2012, 30%
Sold in 2011, 26%
Sold in 2010 or earlier, 15%
Home has not yet sold and is
currently vacant, 6%
Home has not yet sold, but
currently renting to
others, 6%
Do not plan to sell previous home, 12%
Did not own previous home,
5%
HOME SELLING SITUATION AMONG REPEAT BUYERS(Percentage Distribution
U.S.
Sold in 2012, 28%
Sold in 2011, 30%
Sold in 2010 or earlier, 17%
Home has not yet sold and is
currently vacant, 4%
Home has not yet sold, but
currently renting to
others, 4%
Do not plan to sell previous home, 10%
Did not own previous home,
6%
HOME SELLING SITUATION AMONG REPEAT BUYERS(Percentage Distribution
Florida
12 National Association of Realtors® Profile of Home Buyers and Sellers

HOME SELLERS AND THEIR SELLING EXPERIENCE
Exhibit 6-8FIRST-TIME OR REPEAT SELLER(Percentage Distribution)
First-time seller 23%Repeat seller
77%
U.S.
First-time seller
34%
Repeat seller
66%
Florida
First-time se34%
Repeat seller, 66%
FIRST-TIME OR REPEAT SELLER(Percentage Distribution
U.S.
First-time seller, 23%
Repeat seller, 77%
FIRST-TIME OR REPEAT SELLER(Percentage Distribution
12 National Association of Realtors® Profile of Home Buyers and Sellers

HOME SELLERS AND THEIR SELLING EXPERIENCE
Exhibit 6-9HOMES SOLD AND FOR SALE, BY REGION(Percentage Distribution)
U.S.
Homes Sold
Home has not yet sold and is
currently vacant
Home has not yet sold, but currently
renting to othersNortheast 16% 14% 16%Midwest 26 24 24South 38 39 39West 20 23 20
2012 National Association of Realtors® Profile of Home Buyers and Sellers

HOME SELLERS AND THEIR SELLING EXPERIENCE
Exhibit 6-10LOCATION OF HOME SOLD(Percentage Distribution)
Florida
Homes Sold
Home has not yet sold and is
currently vacant
Home has not yet sold, but currently
renting to othersSuburb/Subdivision 53% 35% 54%Small town 18 18 *Urban area/Central city 9 6 23Rural area 14 24 15Resort/Recreation area 6 18 8
* Less than 1 percent
U.S.
Homes Sold
Home has not yet sold and is
currently vacant
Home has not yet sold, but currently
renting to othersSuburb/Subdivision 51% 52% 53%Small town 17 23 15Urban area/Central city 17 7 20Rural area 12 16 10Resort/Recreation area 2 2 2
2012 National Association of Realtors® Profile of Home Buyers and Sellers

HOME SELLERS AND THEIR SELLING EXPERIENCE
Exhibit 6-11PROXIMITY OF HOME SOLD TO HOME PURCHASED(Percentage Distribution)
Florida
Same state 48%Same region 21%Other region 31%
U.S.
Same state 68%Same region 15%Other region 17%
Same state, 48%
Same region, 21%
Other region, 31%
PROXIMITY OF HOME SOLD TO HOME PURCHASED(Percentage Distribution of Households)
Same state, 68%
Same region, 15%
Other region, 17%
PROXIMITY OF HOME SOLD TO HOME PURCHASED(Percentage Distribution of Households)
U.S.
12 National Association of Realtors® Profile of Home Buyers and Sellers

HOME SELLERS AND THEIR SELLING EXPERIENCE
Exhibit 6-12TYPE OF HOME SOLD, BY LOCATION(Percentage Distribution)
Florida
All Sellers
Suburb/ Subdivision
Small town
Urban/ Central city
Rural area
Resort/ Recreation
areaDetached single-family home 78% 84% 83% 48% 81% 54%Townhouse/row house 6 8 * 14 * *Apartment/condo in a building with 5 or more units
8 5 2 29 * 31
Duplex/apartment/condo in 2 to 4 unit building
2 2 * 5 3 8
Other 7 2 15 5 16 8
U.S.
All Sellers
Suburb/ Subdivision
Small town
Urban/ Central city
Rural area
Resort/ Recreation
areaDetached single-family home 81% 80% 81% 82% 79% 84%Townhouse/row house 7 8 3 3 10Apartment/condo in a building with 5 or more units
5 5 4 5 6 3
Duplex/apartment/condo in 2 to 4 unit building
2 2 1 2 3 *
Other 6 5 11 8 2 13
* Less than 1 percent
SELLERS WHO SOLD A HOME IN A
SELLERS WHO SOLD A HOME IN A
2012 National Association of Realtors® Profile of Home Buyers and Sellers

HOME SELLERS AND THEIR SELLING EXPERIENCE
Exhibit 6-13SIZE OF HOME PURCHASED COMPARED TO HOME RECENTLY SOLD(Percentage Distribution)
Florida
1,000 sq ft or less
1,001 sq ft to 1,500 sq ft
1,501 sq ft to 2,000 sq ft
2,001 sq ft to 2,500 sq ft
2,501 sq ft to 3,000 sq ft
More than 3,000 sq ft
1,000 sq ft or less * 1% * * * *1,001 to 1,500 sq ft 1 3 7 1 1 11,501 to 2,000 sq ft * 3 9 5 5 12,001 to 2,500 sq ft * 1 8 10 7 82,501 to 3,000 sq ft * * 3 6 3 2More than 3,000 sq ft * 1 1 7 3 4
U.S.
1,000 sq ft or less
1,001 sq ft to 1,500 sq ft
1,501 sq ft to 2,000 sq ft
2,001 sq ft to 2,500 sq ft
2,501 sq ft to 3,000 sq ft
More than 3,000 sq ft
1,000 sq ft or less * * * * * *1,001 to 1,500 sq ft * 2 4 3 2 11,501 to 2,000 sq ft * 2 7 6 5 52,001 to 2,500 sq ft * 1 4 7 5 82,501 to 3,000 sq ft * 1 2 4 2 6More than 3,000 sq ft * 1 2 5 4 9
46% Trading Up
* Less than 1 percent 29% Remaining at the same size range
25% Trading Down
SIZE OF HOME SOLD
SIZE OF HOME PURCHASED
SIZE OF HOME PURCHASED
SIZE OF HOME SOLD
2012 National Association of Realtors® Profile of Home Buyers and Sellers

HOME SELLERS AND THEIR SELLING EXPERIENCE
Exhibit 6-14SIZE OF HOME PURCHASED COMPARED TO HOME RECENTLY SOLD, BY AGE OF SELLER(Median Square Feet)
Florida
Size of home sold
Size of home purchased Difference
18 to 34 years 1,950 2,540 59035 to 44 years 1,700 2,700 1,00045 to 54 years 2,000 2,010 1055 to 64 years 2,000 2,000 *65 to 74 years 2,050 1,830 -22075 years or older 1,800 1,615 -185
U.S.
Size of home sold
Size of home purchased Difference
18 to 34 years 1,560 2,450 89035 to 44 years 1,840 2,600 76045 to 54 years 2,200 2,400 20055 to 64 years 2,000 2,040 4065 to 74 years 2,100 1,850 -25075 years or older 1,860 1,700 -160
2012 National Association of Realtors® Profile of Home Buyers and Sellers

HOME SELLERS AND THEIR SELLING EXPERIENCE
Exhibit 6-15NUMBER OF BEDROOMS AND BATHROOMS BY ADULT COMPOSITION OF HOUSEHOLD AND CHILDREN IN HOUSEHOLD(Precentage Distribution)
Florida
All SellersMarried couple
Single female
Single male
Unmarried couple Other
Children under 18 in home
No children in home
One bedroom 0% 1% * * * * * 1%Two bedrooms 18 14 32 33 17 33 16 19Three bedrooms or more 82 85 68 67 83 67 84 81Median number of bedrooms 3 3 3 3 3 3 3 *One full bathroom 9 7 16 22 8 33 #N/A #N/ATwo full bathrooms 68 68 68 78 67 * #N/A #N/AThree full bathrooms or more 23 25 16 * 25 67 #N/A #N/AMedian number of full bathrooms 2 2 2 2 2 3 2 2
U.S.
All SellersMarried couple
Single female
Single male
Unmarried couple Other
Children under 18 in home
No children in home
One bedroom 1% 1% 1% 2% 4% * 1% 1%Two bedrooms 13 12 18 17 16 31 11 15Three bedrooms or more 86 88 81 82 81 69 89 84Median number of bedrooms 3 3 3 3 3 3 3 3One full bathroom 16 16 16 17 18 30 19 15Two full bathrooms 59 59 56 62 64 61 60 58Three full bathrooms or more 25 26 28 22 18 9 22 27Median number of full bathrooms 2 2 2 2 2 2 2 2
* Less than 1 percent
ADULT COMPOSITION OF HOUSEHOLD
ADULT COMPOSITION OF HOUSEHOLD CHILDREN IN HOME
CHILDREN IN HOME
2012 National Association of Realtors® Profile of Home Buyers and Sellers

HOME SELLERS AND THEIR SELLING EXPERIENCE
Exhibit 6-16AGE OF HOME PURCHASED COMPARED TO HOME RECENTLY SOLD(Median Square Feet)
Florida
2011
2008 through
2010
2005 through
2007
2000 through
2004
1985 through
1999
1960 through
1984
1911 through
1959
1750 through
19102011 * * * * * 1 * *2008 through 2010 1 * 1 * 1 * * *2005 through 2007 2 1 1 1 2 1 * *2000 through 2004 4 1 2 4 5 1 * *1985 through 1999 4 * 5 6 14 4 1 *1960 through 1984 5 1 3 6 8 9 * *1911 through 1959 1 1 1 3 1 1 1 *1750 through 1910 * 1 * * 1 * * *
* Less than 1 percent
U.S.
2011
2008 through
2010
2005 through
2007
2000 through
2004
1985 through
1999
1960 through
1984
1911 through
1959
1750 through
19102011 * * * * * * * *2008 through 2010 1 * * * 1 * * *2005 through 2007 2 1 1 1 2 1 * *2000 through 2004 4 1 3 2 3 2 1 *1985 through 1999 5 2 3 4 8 4 2 *1960 through 1984 4 1 3 4 8 7 2 11911 through 1959 1 * 1 2 4 4 3 11750 through 1910 1 * * * 1 1 1 *
* Less than 1 percent17% Purchased Older Home
21% Purchased a Home the Same Age
62% Purchased a Newer Home
YEAR PURCHASED HOME WAS BUILT
Year home sold was built
YEAR PURCHASED HOME WAS BUILT
Year home sold was built
2012 National Association of Realtors® Profile of Home Buyers and Sellers

HOME SELLERS AND THEIR SELLING EXPERIENCE
Exhibit 6-17PRICE OF HOME PURCHASED COMPARED TO HOME RECENTLY SOLD(Percentage Distribution)
Florida
Less than $100,000
$100,000 to
$149,999
$150,000 to
$199,999
$200,000 to
$249,999
$250,000 to
$299,999
$300,000 to
$349,999
$350,000 to
$399,999
$400,000 to
$499,999$500,000 or more
Less than $100,000 6 2 0 2 1 * * * 1$100,000 to $149,999 3 4 0 1 1 * 1 * *$150,000 to $199,999 3 7 0 3 3 3 1 1 *$200,000 to $249,999 1 3 0 3 1 3 1 1 1$250,000 to $299,999 2 1 0 2 1 * 1 1 *$300,000 to $349,999 * * 0 1 * 1 * 1 1$350,000 to $399,999 * 1 0 1 2 1 * 1 *$400,000 to $499,999 * * * * 1 1 1 1 *$500,000 or more * * 0 1 2 1 2 2 5
U.S.
Less than $100,000
$100,000 to
$149,999
$150,000 to
$199,999
$200,000 to
$249,999
$250,000 to
$299,999
$300,000 to
$349,999
$350,000 to
$399,999
$400,000 to
$499,999$500,000 or more
Less than $100,000 3% 2% 3% 1% 1% * * * *$100,000 to $149,999 1 5 4 3 2 1 * * *$150,000 to $199,999 1 3 5 4 2 2 1 1 1$200,000 to $249,999 1 1 3 4 3 2 2 1 1$250,000 to $299,999 * * 1 2 2 1 1 1 1$300,000 to $349,999 * * 1 1 * 1 1 1 2$350,000 to $399,999 * * * 1 1 1 * 1 1$400,000 to $499,999 * 1 1 1 1 1 1 1 2$500,000 or more * * * * * 1 1 2 4
* Less than 1 percent 47% Trading Up
25% Remaining at the same price range29% Trading Down
PRICE OF HOME SOLD
PRICE OF HOME SOLD
PRICE OF HOME PURCHASED
PRICE OF HOME PURCHASED
2012 National Association of Realtors® Profile of Home Buyers and Sellers
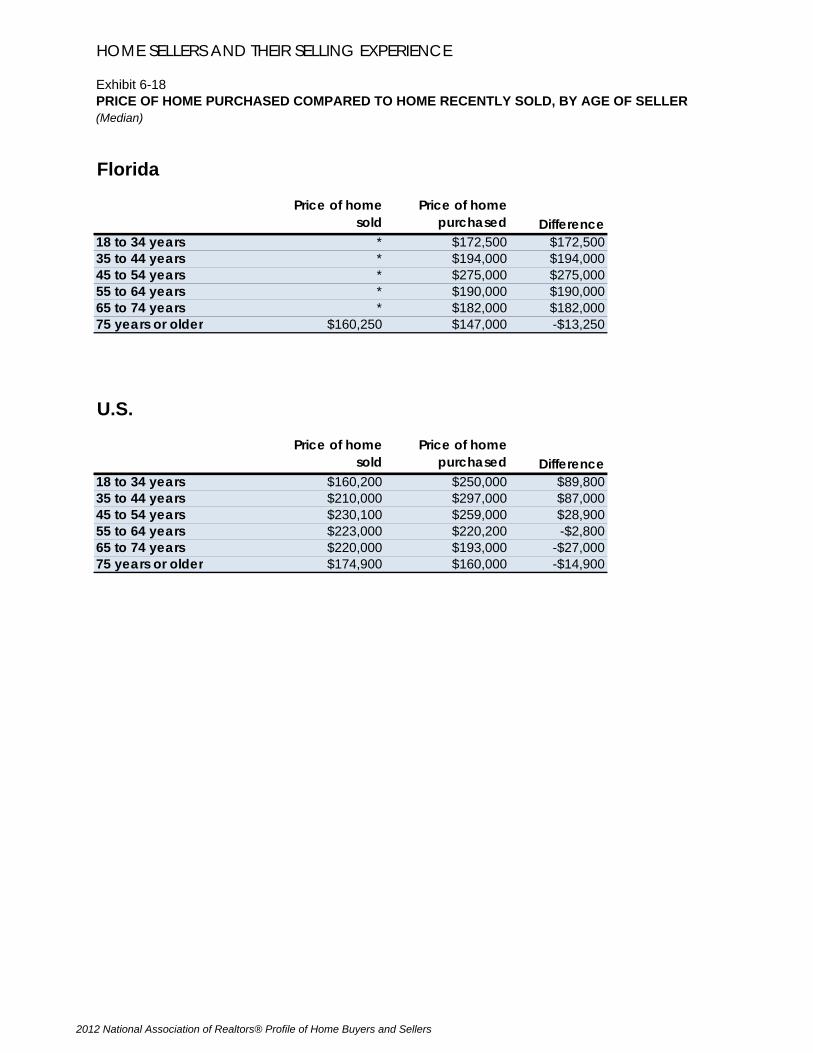
HOME SELLERS AND THEIR SELLING EXPERIENCE
Exhibit 6-18PRICE OF HOME PURCHASED COMPARED TO HOME RECENTLY SOLD, BY AGE OF SELLER(Median)
Florida
Price of home sold
Price of home purchased Difference
18 to 34 years * $172,500 $172,50035 to 44 years * $194,000 $194,00045 to 54 years * $275,000 $275,00055 to 64 years * $190,000 $190,00065 to 74 years * $182,000 $182,00075 years or older $160,250 $147,000 -$13,250
U.S.
Price of home sold
Price of home purchased Difference
18 to 34 years $160,200 $250,000 $89,80035 to 44 years $210,000 $297,000 $87,00045 to 54 years $230,100 $259,000 $28,90055 to 64 years $223,000 $220,200 -$2,80065 to 74 years $220,000 $193,000 -$27,00075 years or older $174,900 $160,000 -$14,900
2012 National Association of Realtors® Profile of Home Buyers and Sellers

HOME SELLERS AND THEIR SELLING EXPERIENCEExhibit 6-19PRIMARY REASON FOR SELLING PREVIOUS HOME, BY AGE(Percentage Distribution)
Florida
All Sellers18 to 34
years35 to 44
years45 to 54
years55 to 64
years65 to 74
years75 years or older
Job relocation 12% 67% 50% 33% 5% * *Home is too small 6 11 7 * 7 * *Change in family situation (e.g., marriage, birth of a child, divorce)
4 11 7 3 5 3 *
Want to move closer to friends or family 16 * 7 6 16 14 33Neighborhood has become less desirable 10 * 14 15 10 10 8Home is too large 7 * * 9 5 9 8Moving due to retirement 22 N/App * 6 34 29 21Want to move closer to current job 3 * 7 6 * 4 *Upkeep of home is too difficult due to health or financial limitations
6 * 7 3 2 10 13
Can not afford the mortgage and other expenses of owning home
4 * * 6 3 4 *
Other 10 * * 12 15 10 8
U.S.
All Sellers18 to 34
years35 to 44
years45 to 54
years55 to 64
years65 to 74
years75 years or older
Job relocation 16% 26% 25% 25% 12% 1% *Home is too small 16 38 31 12 6 7 2Want to move closer to friends or family 14 4 5 3 16 31 29Neighborhood has become less desirable 11 10 15 11 11 8 8Change in family situation (e.g., marriage, birth of a child, divorce)
9 9 6 11 11 6 7
Home is too large 8 * 1 9 11 11 14Moving due to retirement 6 * 1 3 12 14 5Want to move closer to current job 5 7 7 10 3 2 *Upkeep of home is too difficult due to health or financial limitations
5 1 3 5 10 23
Can not afford the mortgage and other expenses of owning home
3 1 2 4 4 4 1
To avoid possible foreclosure 1 2 * 2 * * *Other 7 1 7 7 8 8 11
AGE OF HOME SELLER
AGE OF HOME SELLER
2012 National Association of Realtors® Profile of Home Buyers and Sellers

HOME SELLERS AND THEIR SELLING EXPERIENCE
Exhibit 6-20TENURE IN PREVIOUS HOME, BY TYPE OF HOME(Percentage Distribution)
Florida
All TypesCabin/
cottage
Duplex/ apartment/ condo in 2
to 4 unit structure
Apartment/ condo in
building with 5 or more
unitsTownhouse/
row house
Detached single-family home
Mobile/ manufactured
home Other1 year or less 6% * * * 15% 6% 22% *2 to 3 years 6 * * 18 * 6 * *4 to 5 years 8 * 20 6 23 7 11 *6 to 7 years 11 * 40 18 * 9 * 258 to 10 years 18 * 20 24 39 17 22 2511 to 15 years 18 100 * 12 8 19 11 *16 to 20 years 9 * * 6 8 10 33 *21 years or more 24 * 20 18 8 26 * 50Median 11 14 7 8 8 12 12 16
U.S.
All TypesCabin/
cottage
Duplex/ apartment/
condo in 2-4 unit
structure
Apartment/condo in
building with 5 or more
unitsTownhouse/
row house
Detached single-family home
Mobile/ manufactured
home Other1 year or less 3% * * 3% 5% 3% 8% 5%2 to 3 years 7 * 18 7 6 7 12 24 to 5 years 12 38 28 18 17 11 4 146 to 7 years 15 6 10 22 23 15 20 128 to 10 years 18 25 14 25 19 18 12 1011 to 15 years 19 25 6 13 15 20 20 1216 to 20 years 9 * * 4 13 9 9 1421 years or more 16 6 26 7 2 17 15 31Median 9 8 7 8 7 10 8 10
* Less than 1 percent
2012 National Association of Realtors® Profile of Home Buyers and Sellers

HOME SELLERS AND THEIR SELLING EXPERIENCE
Exhibit 6-21TENURE IN PREVIOUS HOME, BY AGE OF SELLER(Percentage Distribution)
Florida
All Sellers18 to 34
years35 to 44
years45 to 54
years55 to 64
years65 to 74
years75 years or older
1 year or less 6% * 7% * 3% 6% 4%2 to 3 years 6 22 * 9 8 4 44 to 5 years 8 33 * 12 8 7 *6 to 7 years 11 44 29 6 15 3 98 to 10 years 18 * 21 24 16 22 411 to 15 years 18 * 29 36 16 16 916 to 20 years 9 #N/A 7 6 11 7 2221 years or more 24 NA 7 6 23 35 48Median 11 5 8 10 14 13 18
U.S.
All Sellers18 to 34
years35 to 44
years45 to 54
years55 to 64
years65 to 74
years75 years or older
1 year or less 3% 4% 3% 3% 2% 4% 1%2 to 3 years 7 16 7 7 7 4 54 to 5 years 12 31 15 11 6 9 36 to 7 years 15 30 21 17 6 11 48 to 10 years 18 18 28 13 17 14 1111 to 15 years 19 2 22 29 21 15 2016 to 20 years 9 N/A 4 12 16 10 1621 years or more 16 N/A 1 9 25 34 41Median 9 5 8 10 13 13 17
N/A- Not Available
AGE OF HOME SELLER
AGE OF HOME SELLER
2012 National Association of Realtors® Profile of Home Buyers and Sellers

HOME SELLERS AND THEIR SELLING EXPERIENCE
Exhibit 6-22DISTANCE BETWEEN HOME PURCHASED AND HOME RECENTLY SOLD, BY REGION(Median Miles)
Florida U.S. Northeast Midwest South West2010 368 19 17 21 24 19
SELLERS WHO SOLD A HOME IN THE:
368
19 17 21 24 19
0
50
100
150
200
250
300
350
400
Florida U.S. Northeast Midwest South West
DISTANCE BETWEEN HOME PURCHASED AND HOME RECENTLY SOLD, BY REGION
(Median Miles)
Region of Home Sold
2012 National Association of Realtors® Profile of Home Buyers and Sellers

HOME SELLERS AND THEIR SELLING EXPERIENCE
Exhibit 6-23DISTANCE BETWEEN HOME PURCHASED AND HOME RECENTLY SOLD, BY AGE(Percentage Distribution)
Florida
All Sellers18 to 34
years35 to 44
years45 to 54
years55 to 64
years65 to 74
years75 years or older
5 miles or less 15% * 8% 21% 14% 15% 13%6 to 10 miles 10 * 8 24 6 6 1711 to 15 miles 4 * 8 * 6 1 416 to 20 miles 4 11 * * 5 7 *21 to 50 miles 8 22 8 * 8 9 851 to 100 miles 4 * * 3 2 6 4101 to 500 miles 8 * 17 3 10 9 4501 to 1,000 miles 15 33 17 24 21 9 81,001 miles or more 32 33 33 27 29 39 42Median (miles) 368 752 504 503 472 404 491
U.S.
All Sellers18 to 34
years35 to 44
years45 to 54
years55 to 64
years65 to 74
years75 years or older
5 miles or less 24% 24% 32% 22% 20% 20% 23%6 to 10 miles 14 19 14 16 13 8 1811 to 15 miles 8 11 7 7 8 8 816 to 20 miles 6 7 6 9 6 4 521 to 50 miles 10 9 10 9 11 9 651 to 100 miles 5 4 3 4 6 6 4101 to 500 miles 11 11 10 10 9 13 10501 to 1,000 miles 9 9 5 9 14 9 81,001 miles or more 15 7 13 14 13 25 18Median (miles) 19 14 14 18 29 71 17
AGE OF HOME SELLER
AGE OF HOME SELLER
2012 National Association of Realtors® Profile of Home Buyers and Sellers

HOME SELLERS AND THEIR SELLING EXPERIENCE
Exhibit 6-24METHOD USED TO SELL HOME, BY REGION(Percentage Distribution)
Florida U.S. Northeast Midwest South WestSold home using an agent or broker 92% 88% 91% 86% 87% 93%
Seller used agent/broker only 89 87 89 83 85 92Seller first tried to sell it themselves, but then used an agent 4 2 1 3 2 0
For-sale-by-owner (FSBO) 6 9 7 12 9 6Seller sold home without using a real estate agent or broker 5 7 6 9 7 5First listed with an agent, but then sold home themselves 1 2 1 3 2 1
Sold home to a homebuying company * 1 * * 1 1Other 2 2 2 2 3 1
* Less than 1 percent
SELLERS WHO SOLD A HOME IN THE:
2012 National Association of Realtors® Profile of Home Buyers and Sellers

HOME SELLERS AND THEIR SELLING EXPERIENCE
Exhibit 6-25METHOD USED TO SELL HOME, BY SELLER URGENCY(Percentage Distribution)
Florida
All SellersVery
urgentlySomewhat
urgentlyNot
urgentlySold home using an agent or broker 92% 92% 94% 92%
Seller used agent/broker only 89 83 93 87Seller first tried to sell it themselves, but then used an agent 4 8 1 4
For-sale-by-owner (FSBO) 6 6 4 7Seller sold home without using a real estate agent or broker 5 6 3 7First listed with an agent, but then sold home themselves 1 * 1 *
Sold home to a homebuying company * * * *Other 2 3 3 1
U.S.
All SellersVery
urgentlySomewhat
urgentlyNot
urgentlySold home using an agent or broker 88% 88% 91% 86%
Seller used agent/broker only 87 86 90 84Seller first tried to sell it themselves, but then used an agent 2 1 2 2
For-sale-by-owner (FSBO) 9 7 7 11Seller sold home without using a real estate agent or broker 7 7 6 8First listed with an agent, but then sold home themselves 2 * 2 3
Sold home to a homebuying company 1 2 1 *Other 2 3 1 2
* Less than 1 percent
SELLER NEEDED TO SELL
SELLER NEEDED TO SELL
2012 National Association of Realtors® Profile of Home Buyers and Sellers

HOME SELLERS AND THEIR SELLING EXPERIENCE
Exhibit 6-26METHOD OF SALE, BY BUYER AND SELLER RELATIONSHIP(Percentage Distribution)
Florida
Buyer and Seller RelationshipSeller Knew
BuyerSeller did not
Know BuyerAll sellers 7% 93%Sold home using an agent or broker 4 96
Seller used agent/broker only 4 96Seller first tried to sell it themselves, but then used an agent * 100
For-sale-by-owner (FSBO) 46 55Sold home without using a real estate agent or broker 40 60First listed with an agent, but then sold home themselves 100 *
Other 60 40
Method of Home SaleAll
SellersSeller Knew
BuyerSeller did not
Know BuyerSold home using an agent or broker 92% 50% 96%
Seller used agent/broker only 89 50 92Seller first tried to sell it themselves, but then used an agent 4 * 4
For-sale-by-owner (FSBO) 6 31 3Sold home without using a real estate agent or broker 5 25 3First listed with an agent, but then sold home themselves 1 6 *
Other 2 19 1
* Less than 1 percent
U.S.
Buyer and Seller RelationshipSeller Knew
BuyerSeller did not
Know BuyerAll sellers 8% 92%Sold home using an agent or broker 5 95
Seller used agent/broker only 5 95Seller first tried to sell it themselves, but then used an agent 14 86
For-sale-by-owner (FSBO) 37 63Sold home without using a real estate agent or broker 37 63First listed with an agent, but then sold home themselves 37 63
Other 18 82
Method of Home SaleAll
SellersSeller Knew
BuyerSeller did not
Know BuyerSold home using an agent or broker 88% 53% 91%
Seller used agent/broker only 87 50 90Seller first tried to sell it themselves, but then used an agent 2 3 2
For-sale-by-owner (FSBO) 9 40 6Sold home without using a real estate agent or broker 7 32 5First listed with an agent, but then sold home themselves 2 9 1
Other 3 6 3
2012 National Association of Realtors® Profile of Home Buyers and Sellers

HOME SELLERS AND THEIR SELLING EXPERIENCE
Exhibit 6-27METHOD USED TO SELL HOME, 2001-2012(Percentage Distribution)
Florida
2012Sold home using an agent or broker 92%For-sale-by-owner (FSBO) 6Sold it to a home buying company *Other 2
U.S.
2001 2003 2004 2005 2006 2007 2008 2009 2010 2011 2012Sold home using an agent or broker 79% 83% 82% 85% 84% 85% 84% 85% 88% 87% 88%For-sale-by-owner (FSBO) 13 14 14 13 12 12 13 11 9 9 9Sold to home buying company 1 1 1 1 1 1 1 1 1 1 1Other 7 3 3 2 3 2 2 3 3 3 2
2012 National Association of Realtors® Profile of Home Buyers and Sellers

HOME SELLERS AND THEIR SELLING EXPERIENCE
Exhibit 6-28SALES PRICE COMPARED WITH LISTING PRICE, BY REGION(Percentage Distribution of Sales Price as a Percent of List Price)
U.S. Northeast Midwest South WestLess than 90% 31% 23% 25% 28% 19% 20%90% to 94% 27 22 26 22 21 1995% to 99% 24 35 33 32 39 35100% 14 15 10 15 15 18101% to 110% 3 4 5 3 2 8More than 110% 2 2 1 1 3 1Median (sales price as a percent of listing price)
93% 95% 94% 95% 96% 96%
SELLERS WHO SOLD A HOME IN THE
Florida
2012 National Association of Realtors® Profile of Home Buyers and Sellers

HOME SELLERS AND THEIR SELLING EXPERIENCE
Exhibit 6-29SALES PRICE COMPARED WITH LISTING PRICE, BY SELLER URGENCY(Percentage Distribution of Sales Price as a Percent of Listing Price)
Florida
Very urgently
Somewhat urgently
Not urgently
Less than 90% 31% 44% 35% 21%90% to 94% 27 15 31 2995% to 99% 24 27 22 26100% 14 12 8 19101% to 110% 3 * 3 3More than 110% 2 3 1 2Median (sales price as a percent of listing price)
93% 92% 92% 95%
* Less than 1 percent
U.S.
All SellersVery
urgentlySomewhat
urgentlyNot
urgentlyLess than 90% 23% 28% 27% 16%90% to 94% 22 19 25 2095% to 99% 35 36 33 37100% 15 12 11 20101% to 110% 4 3 4 5More than 110% 2 3 1 2Median (sales price as a percent of listing price)
95% 95% 94% 96%
All Sellers
SELLER NEEDED TO SELL
SELLER NEEDED TO SELL
2012 National Association of Realtors® Profile of Home Buyers and Sellers

HOME SELLERS AND THEIR SELLING EXPERIENCE
Exhibit 6-30NUMBER OF WEEKS RECENTLY SOLD HOME WAS ON THE MARKET, BY REGION(Percentage Distribution)
U.S. Northeast Midwest South WestLess than 1 week 5% 4% 4% 4% 5% 6%1 to 2 weeks 18 20 22 17 17 263 to 4 weeks 9 11 9 12 11 105 to 6 weeks 6 5 5 5 4 67 to 8 weeks 3 5 5 6 6 39 to 10 weeks 5 4 4 4 4 511 to 12 weeks 10 9 8 8 10 913 to 16 weeks 6 8 8 8 8 717 to 24 weeks 12 10 8 11 10 1125 to 36 weeks 8 8 9 9 8 637 to 52 weeks 7 8 8 7 8 853 or more weeks 11 9 9 10 10 5Median weeks 12 12 12 12 12 8
SELLERS WHO SOLD A HOME IN THE
Florida
2012 National Association of Realtors® Profile of Home Buyers and Sellers

HOME SELLERS AND THEIR SELLING EXPERIENCE
Exhibit 6-31SALES PRICE COMPARED WITH LISTING PRICE, BY NUMBER OF WEEKS HOME WAS ON THE MARK(Percentage Distribution of Sales Price as a Percent of Listing Price)
Florida
All SellersLess than
1 week1 to 2
weeks3 to 4
weeks5 to 8
weeks9 to 16 weeks
17 or more
weeksLess than 90% 31% 10% 8% 18% 33% 31% 47%90% to 94% 27 * 14 24 28 36 3195% to 99% 24 50 33 41 17 22 16100% 14 40 33 18 17 7 4101% to 110% 3 * 8 * * 2 1More than 110% 2 * 3 * 6 2 1Median (sales price as a percent of listing price)
93% 97% 99% 95% 94% 92% 90%
* Less than 1 percent
U.S.
All SellersLess than
1 week1 to 2
weeks3 to 4
weeks5 to 8
weeks9 to 16 weeks
17 or more
weeksLess than 90% 23% 12% 3% 11% 13% 21% 43%90% to 94% 22 3 9 21 28 30 2595% to 99% 35 27 43 40 48 38 25100% 15 50 32 22 9 8 4101% to 110% 4 8 12 4 2 1 1More than 110% 2 1 2 2 * 2 2Median (sales price as a percent of listing price)
95% 100% 99% 97% 96% 94% 91%
* Less than 1 percent
SELLERS WHOSE HOME WAS ON THE MARKET FOR
SELLERS WHOSE HOME WAS ON THE MARKET FOR
2012 National Association of Realtors® Profile of Home Buyers and Sellers

HOME SELLERS AND THEIR SELLING EXPERIENCE
Exhibit 6-32NUMBER OF TIMES ASKING PRICE WAS REDUCED, BY NUMBER OF WEEKS HOME WAS ON THE MARKET(Percentage Distribution)
Florida
All SellersLess than
1 week1 to 2
weeks3 to 4
weeks5 to 8
weeks9 to 16 weeks
17 or more
weeksNone, did not reduce the asking price
33% 64% 66% 59% 56% 26% 6%
One 26 18 32 35 22 29 22Two 19 9 3 6 11 29 28Three 13 9 * * 11 12 24Four or more 9 * * * * 5 19
U.S.
All SellersLess than
1 week1 to 2
weeks3 to 4
weeks5 to 8
weeks9 to 16 weeks
17 or more
weeksNone, did not reduce the asking price
40% 86% 80% 64% 44% 28% 9%
One 25 12 16 32 40 33 21Two 17 1 3 5 10 28 26Three 10 1 * * 5 8 23Four or more 8 * 1 * 1 4 21
* Less than 1 percent
SELLERS WHOSE HOME WAS ON THE MARKET FOR
SELLERS WHOSE HOME WAS ON THE MARKET FOR
2012 National Association of Realtors® Profile of Home Buyers and Sellers

HOME SELLERS AND THEIR SELLING EXPERIENCE
Exhibit 6-33INCENTIVES OFFERED TO ATTRACT BUYERS, BY REGION(Percent of Respondents)
Florida U.S. Northeast Midwest South WestNone 68% 60% 68% 55% 55% 70%Home warranty policies 14 22 13 27 27 15Assistance with closing costs 14 17 11 19 21 12Credit toward remodeling or repairs 4 7 6 5 8 7Other incentives, such as a car, flat screen TV, etc. 3 3 3 3 4 1Assistance with condo association fees * * 1 * * *Other 7 5 6 5 5 5
* Less than 1 percent
SELLERS WHO SOLD A HOME IN THE
2012 National Association of Realtors® Profile of Home Buyers and Sellers

HOME SELLERS AND THEIR SELLING EXPERIENCE
Exhibit 6-34INCENTIVES OFFERED TO ATTRACT BUYERS, BY NUMBER OF WEEKS HOME WAS ON THE MARKET(Percent of Respondents)
Florida
Less than 1 week
1 to 2 weeks
3 to 4 weeks
5 to 8 weeks
9 to 16 weeks
17 or more weeks
None 68% 91% 69% 84% 47% 67% 65%Assistance with closing costs 14 * 15 * 32 18 15Home warranty policies 14 * 10 16 16 20 15Credit toward remodeling or repairs 4 * * * 11 * 8Other incentives, such as a car, flat screen TV, etc. 3 9 * * 5 * 5Assistance with condo association fees * #N/A * * * * *Other 7 * 8 * 11 9 6
U.S.
Less than 1 week
1 to 2 weeks
3 to 4 weeks
5 to 8 weeks
9 to 16 weeks
17 or more weeks
None 60% 87% 64% 58% 59% 58% 55%Home warranty policies 22 6 19 27 22 26 24Assistance with closing costs 17 4 14 15 21 17 21Credit toward remodeling or repairs 7 3 6 6 6 5 9Other incentives, such as a car, flat screen TV, etc. 3 2 1 3 2 2 6Assistance with condo association fees * * * * * * 1Other 5 3 5 4 5 5 5
* Less than 1 percent
All Sellers
All Sellers
SELLERS WHOSE HOME WAS ON THE MARKET FOR
SELLERS WHOSE HOME WAS ON THE MARKET FOR
2012 National Association of Realtors® Profile of Home Buyers and Sellers

HOME SELLERS AND THEIR SELLING EXPERIENCE
Exhibit 6-35EQUITY EARNED IN HOME RECENTLY SOLD, BY TENURE IN HOME (Percent of Respondents)
TENURE IN HOMEDollar value Percent Dollar value Percent
1 year or less * * Median $25,000 14%2 to 3 years $3,000 2%4 to 5 years -$16,000 -8%6 to 7 years * *8 to 10 years $10,000 6%11 to 15 years $54,000 31%16 to 20 years $76,300 58%21 years or more $106,000 144%Median $20,000 12%
FloridaU.S.
2012 National Association of Realtors® Profile of Home Buyers and Sellers

HOME SELLERS AND THEIR SELLING EXPERIENCEExhibit 6-36SATISFACTION WITH THE SELLING PROCESS(Percentage Distribution)
U.S.Very Satisfied 55% 54%Somewhat Satisfied 30 30Somewhat Dissatisfied 7 10Very Dissatisfied 8 6
Very Satisfied, 55%
Somewhat Satisfied, 30%
Somewhat Dissatisfied, 7%
Very Dissatisfied, 8%
Satisfaction with Selling Process(Percentage Distribution)
Very Satisfied, 54%
Somewhat Satisfied, 30
Somewhat Dissatisfied, 10
Very Dissatisfied, 6
Satisfaction with Selling Process(Percentage Distribution)
U.S.
12 National Association of Realtors® Profile of Home Buyers and Sellers

HOME SELLING AND REAL ESTATE PROFESSIONALS
Exhibit 7-1 METHOD USED TO FIND REAL ESTATE AGENTExhibit 7-2 NUMBER OF AGENTS CONTACTED BEFORE SELECTING ONE TO ASSIST WITH SALE OF
HOMEExhibit 7-3 DID SELLER USE THE SAME REAL ESTATE AGENT FOR THEIR HOME PURCHASE?Exhibit 7-4 HOME LISTED ON MULTIPLE LISTING SERVICEExhibit 7-5 LEVEL OF SERVICE PROVIDED BY THE REAL ESTATE AGENTExhibit 7-6 WHAT SELLERS MOST WANT FROM REAL ESTATE AGENTS, BY LEVEL OF SERVICE
PROVIDED BY THE AGENTExhibit 7-7 MOST IMPORTANT FACTOR IN CHOOSING A REAL ESTATE AGENT TO SELL HOME, BY LEVEL
OF SERVICE PROVIDED BY THE AGENTExhibit 7-8 METHODS REAL ESTATE AGENT USED TO MARKET HOME, BY TYPE OF HOME SOLDExhibit 7-9 HOW REAL ESTATE AGENT WAS COMPENSATEDExhibit 7-10 NEGOTIATING THE COMMISSION RATE OR FEE WITH THE REAL ESTATE AGENTExhibit 7-11 WOULD SELLER USE REAL ESTATE AGENT AGAIN OR RECOMMEND TO OTHERS
2012 National Association of Realtors® Profile of Home Buyers and Sellers

HOME SELLING AND REAL ESTATE PROFESSIONALS
Exhibit 7-1METHOD USED TO FIND REAL ESTATE AGENT(Percentage Distribution)
Florida
Referred by (or is) a friend, neighbor or relative 40%Used agent previously to buy or sell a home 16Visited an open house and met agent 1Referred through employer or relocation company 1Personal contact by agent (telephone, email, etc.) 8Saw contact information on For Sale/Open House sign 3Internet Web site 4Referred by another real estate or broker 4Walked into or called office and agent was on duty 3Direct mail (newsletter, flyer, postcard, etc.) 2Newspaper, Yellow pages or home book ad 3Advertising specialty (calendar, magnet, etc.) 1Other 13
U.S.
Referred by (or is) a friend, neighbor or relative 38%Used agent previously to buy or sell a home 23Personal contact by agent (telephone, email, etc.) 5Referred through employer or relocation company 4Saw contact information on For Sale/Open House sign 4Referred by another real estate or broker 4Visited an open house and met agent 4Internet Web site 3Walked into or called office and agent was on duty 2Direct mail (newsletter, flyer, postcard, etc.) 2Newspaper, Yellow pages or home book ad 1Advertising specialty (calendar, magnet, etc.) 1Other 11
2012 National Association of Realtors® Profile of Home Buyers and Sellers

HOME SELLING AND REAL ESTATE PROFESSIONALS
Exhibit 7-2NUMBER OF AGENTS CONTACTED BEFORE SELECTING ONE TO ASSIST WITH SALE OF HOME(Percentage Distribution)
Florida
One 65%Two 21%Three 10%Four 2%Five or more 3%
* Less than 1 percent
U.S.
One 65%Two 20Three 11Four 3Five or more 2
65%
21%
10%2% 3%
0%
10%
20%
30%
40%
50%
60%
70%
80%
90%
One Two Three Four Five or more
NUMBER OF AGENTS CONTACTED BEFORE SELECTING ONE TO ASSIST WITH SALE OF HOME
(Percentage Distribution)
Florida
65%
20%
11%
3% 2%0%
10%
20%
30%
40%
50%
60%
70%
One Two Three Four Five or more
NUMBER OF AGENTS CONTACTED BEFORE SELECTING ONE TO ASSIST WITH SALE OF HOME
(Percentage Distribution)
U.S
2012 National Association of Realtors® Profile of Home Buyers and Sellers

HOME SELLING AND REAL ESTATE PROFESSIONALS
Exhibit 7-3DID SELLER USE THE SAME REAL ESTATE AGENT FOR THEIR HOME PURCHASE?(Percentage Distribution Among Sellers Who Used an Agent to Purchase a Home)
Florida
Yes 27%No 73%
U.S.
Yes 47%No 53%
Yes, 27%
No, 73%
DID SELLER USE THE SAME AGENT FOR THEIR HOME PURCHASE?
(Percentage Distribution Among Sellers Who Used an Agent to Purchase a Home)
Florida
Yes, 47%
No, 53%
DID SELLER USE THE SAME AGENT FOR THEIR HOME PURCHASE?
(Percentage Distribution Among Sellers Who Used an Agent to Purchase a Home)
U.S.
2012 National Association of Realtors® Profile of Home Buyers and Sellers

HOME SELLING AND REAL ESTATE PROFESSIONALS
Exhibit 7-4HOME LISTED ON MULTIPLE LISTING SERVICE(Percentage Distribution)
Florida
Yes 91%No 3%Don't know 6%
U.S.
Yes 91%No 3%Don't know 5%
Yes, 91%
No, 3%
Don't know, 6%
HOME LISTED ON MULTIPLE LISTING SERVICE(Percentage Distribution)
Florida
Yes, 91%
No, 3%
Don't know, 5%
HOME LISTED ON MULTIPLE LISTING SERVICE(Percentage Distribution)
U.S.
2012 National Association of Realtors® Profile of Home Buyers and Sellers

HOME SELLING AND REAL ESTATE PROFESSIONALS
Exhibit 7-5LEVEL OF SERVICE PROVIDED BY THE REAL ESTATE AGENT(Percentage Distribution)
Florida
A broad range of services and management of most aspects of the home sale
74%
A limited set of services as requested by the seller
8%
The agent listed the home on the MLS and performed few if any additional services
18%
U.S.
A broad range of services and management of most aspects of the home sale
80%
A limited set of services as requested by the seller
8%
The agent listed the home on the MLS and performed few if any additional services
12%
A broad range of services and
management of most aspects of the home sale,
74%
A limited set of services as
requested by the seller, 8%
The agent listed the home on the
MLS and performed few if any additional services, 18%
LEVEL OF SERVICE PROVIDED BY THE REAL ESTATE AGENT
(Percentage Distribution)
Florida
A broad range of services and
management of most aspects of the home sale,
80%A limited set of services as
requested by the seller, 8%
The agent listed the home on the
MLS and performed few if any additional services, 12%
LEVEL OF SERVICE PROVIDED BY THE REAL ESTATE AGENT
(Percentage Distribution)
U.S.
2012 National Association of Realtors® Profile of Home Buyers and Sellers

HOME SELLING AND REAL ESTATE PROFESSIONALSExhibit 7-6WHAT SELLERS MOST WANT FROM REAL ESTATE AGENTS, BY LEVEL OF SERVICE PROVIDED BY THE AGENT(Percentage Distribution)
Florida
All sellers
A broad range of services and
management of most aspects of the
home sale
A limited set of services as
requested by the seller
The agent listed the home on the MLS
and performed few if any additional
servicesHelp price home competitively 21% 22% 25% 17%Help sell the home within specific timeframe 19 19 13 26Help find a buyer for home 23 20 38 29Help seller market home to potential buyers 22 24 13 17Help seller find ways to fix up home to sell it for more 5 4 13 3Help with negotiation and dealing with buyers 4 5 * 3Help with paperwork/inspections/preparing for settlement 3 3 * 3Help seller see homes available to purchase * * * *Other 3 3 * 3* Less than 1 percent
U.S.
All sellers
A broad range of services and
management of most aspects of the
home sale
A limited set of services as
requested by the seller
The agent listed the home on the MLS
and performed few if any additional
servicesHelp sell the home within specific timeframe 22% 22% 24% 22%Help seller market home to potential buyers 21 23 15 11Help find a buyer for home 19 18 23 23Help price home competitively 18 18 16 16Help seller find ways to fix up home to sell it for more 10 10 10 7Help with negotiation and dealing with buyers 5 4 5 10Help with paperwork/inspections/preparing for settlement 3 3 6 3Help seller see homes available to purchase 1 1 1 3Help create and post videos to provide tour of my home 1 1 * 1Other 1 1 1 3
LEVEL OF SERVICE SOUGHT FROM THE AGENT BY THE SELLER
LEVEL OF SERVICE SOUGHT FROM THE AGENT BY THE SELLER
2012 National Association of Realtors® Profile of Home Buyers and Sellers

HOME SELLING AND REAL ESTATE PROFESSIONALS
Exhibit 7-7MOST IMPORTANT FACTOR IN CHOOSING A REAL ESTATE AGENT TO SELL HOME, BY LEVEL OF SERVICE PROVIDED BY THE AGENT(Percentage Distribution)
Florida
All sellers
A broad range of services and
management of most aspects of the
home sale
A limited set of services as
requested by the seller
The agent listed the home on the MLS and performed few if any
additional servicesReputation of agent 35% 41% 13% 21%Agent is honest and trustworthy 16 17 6 12Agent is friend or family member 9 7 25 9Agent’s knowledge of the neighborhood 18 16 25 24Agent’s association with a particular firm 7 5 6 15Agent has caring personality/good listener 2 1 * 3Agent's commission 4 3 6 3Agent seems 100% accessible because of use of technolo 7 7 * 9Professional designations held by agent 1 1 6 *Other 4 2 13 6
LEVEL OF SERVICE SOUGHT FROM THE AGENT BY THE SELLER
2012 National Association of Realtors® Profile of Home Buyers and Sellers

U.S.
All sellers
A broad range of services and
management of most aspects of the
home sale
A limited set of services as
requested by the seller
The agent listed the home on the MLS and performed few if any
additional servicesReputation of agent 37% 39% 35% 28%Agent is honest and trustworthy 19 19 22 20Agent is friend or family member 13 13 11 11Agent’s knowledge of the neighborhood 12 12 11 9Agent’s association with a particular firm 4 3 7 7Agent has caring personality/good listener 4 4 2 3Agent's commission 3 3 5 6Agent seems 100% accessible because of use of technology like tablet or smartphone 3 3 2 3Professional designations held by agent 1 1 1 *Other 5 4 6 12
* Less than 1 percent
LEVEL OF SERVICE SOUGHT FROM THE AGENT BY THE SELLER
2012 National Association of Realtors® Profile of Home Buyers and Sellers

HOME SELLING AND REAL ESTATE PROFESSIONALS
Exhibit 7-8METHODS REAL ESTATE AGENT USED TO MARKET HOME, BY TYPE OF HOME SOLD(Percent of Respondents Among Sellers Who Used an Agent)
Florida
All HomesCabin/
cottage
Duplex/ apartment/
condo in 2-4 unit
structure
Apartment/condo in building with 5 or
more units
Town-house/
row house
Detached single-family home
Mobile/ manufac
tured home Other
Listing on the Internet 88% 100% 40% 82% 83% 91% 100% 33%Yard sign 70 100 20 6 50 78 100 100Open house 46 * 20 53 75 43 60 33Print newspaper advertisement 32 100 20 29 42 32 40 *Real estate magazine 28 100 20 24 * 30 40 *Direct mail (flyers, postcards, etc.) 19 100 * 18 17 19 * 33Video 21 100 * 35 8 22 * * Social networking Web sites (e.g. Twitter, FaceBook, etc.) 8 100 40 6 17 6 * 33Video hosting Web sites (e.g. YouTube, etc) 8 * * 6 17 8 * *Other Web sites with real estate listings (e.g. Google 30 100 20 18 * 34 20 *Television 2 * 20 * * 2 * *Other 4 * 20 12 17 1 * *
* Less than 1 percent
TYPE OF HOME SOLD
2012 National Association of Realtors® Profile of Home Buyers and Sellers

U.S.
All HomesCabin/
cottage
Duplex/ apartment/
condo in 2-4 unit
structure
Apartment/condo in building with 5 or
more units
Town-house/
row house
Detached single-family home
Mobile/ manufac
tured home Other
Listing on the Internet 93% 91% 80% 92% 93% 94% 79% 86% Other Web sites with real estate listings (e.g. Yahoo, Google, etc. 28 50 19 28 26 29 27 21 Social networking Web sites (e.g. Twitter, FaceBook, etc.) 7 9 5 4 3 8 2 5
Video hosting Web sites (e.g., YouTube, etc.) 4 * * 3 3 4 * 2Yard sign 79 91 56 32 68 83 86 79Open house 55 25 44 62 67 55 31 51Print newspaper advertisement 27 64 21 18 24 28 33 27Real estate magazine 21 67 23 11 14 21 35 16Direct mail (flyers, postcards, etc.) 17 17 16 18 17 18 10 19Video 14 9 2 16 5 15 4 18Television 2 * 5 1 * 3 3 7Other 3 * 5 7 3 3 3 *
* Less than 1 percent
TYPE OF HOME SOLD
2012 National Association of Realtors® Profile of Home Buyers and Sellers

HOME SELLING AND REAL ESTATE PROFESSIONALS
Exhibit 7-9HOW REAL ESTATE AGENT WAS COMPENSATED(Percentage Distribution)
Florida
Paid by seller 86% Percent of sales price 7 Flat fee 0 Per task fee * Other * Don't Know 0Paid by buyer and seller 6Paid by buyer only 5Other 3Don't Know 1
U.S.
Paid by seller 80% Percent of sales price 74 Flat fee 3 Per task fee * Other * Don't Know 2Paid by buyer and seller 8Paid by buyer only 4Other 5Don't Know 3
* Less than 1 percent
2012 National Association of Realtors® Profile of Home Buyers and Sellers

HOME SELLING AND REAL ESTATE PROFESSIONALS
Exhibit 7-10NEGOTIATING THE COMMISSION RATE OR FEE WITH THE REAL ESTATE AGENT(Percentage Distribution)
Florida
Real estate agent initiated discussion of compensation
48%
Client brought up the topic and the real estate agent was able and willing to negotiate their commission or fee
18
Client brought up the topic and the real estate agent was unwilling or unable to negotiate their commission or fee
12
Client did know commissions and fees could be negotiated but did not bring up the topic
8
Client did not know commissions and fees could be negotiated
14
U.S.
Real estate agent initiated discussion of compensation
43%
Client brought up the topic and the real estate agent was able and willing to negotiate their commission or fee
22
Client brought up the topic and the real estate agent was unwilling or unable to negotiate their commission or fee
9
Client did know commissions and fees could be negotiated but did not bring up the topic
11
Client did not know commissions and fees could be negotiated
15
2012 National Association of Realtors® Profile of Home Buyers and Sellers
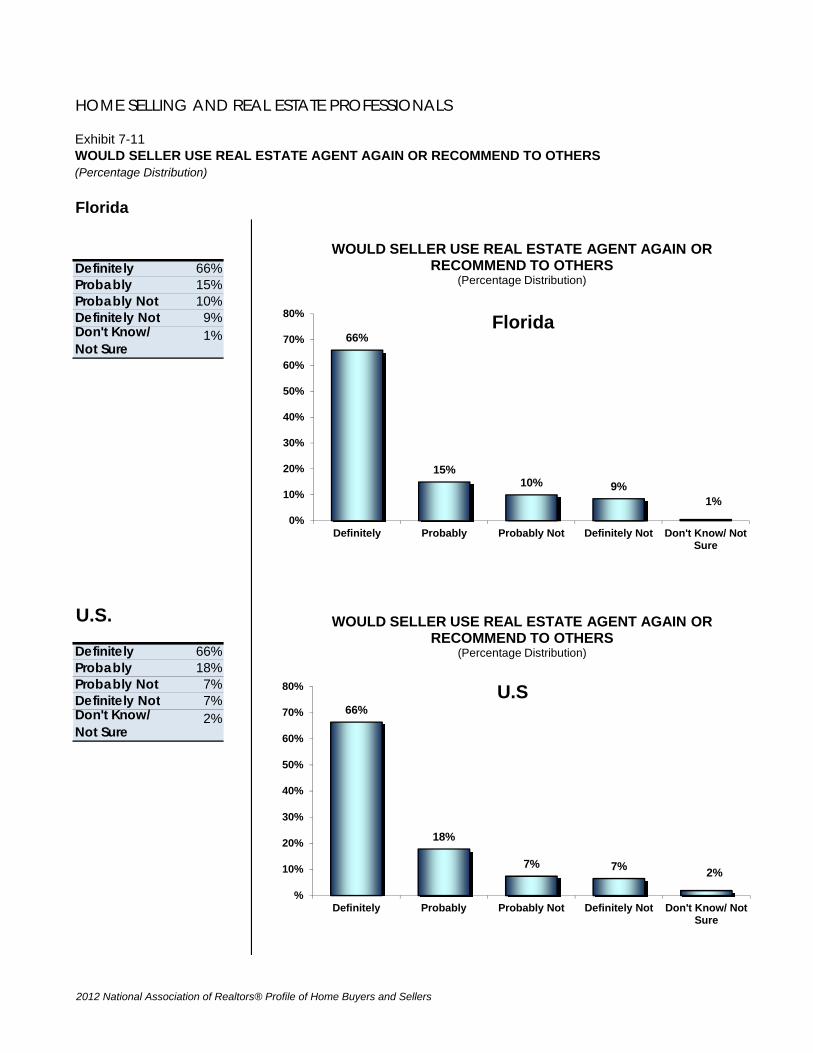
HOME SELLING AND REAL ESTATE PROFESSIONALS
Exhibit 7-11WOULD SELLER USE REAL ESTATE AGENT AGAIN OR RECOMMEND TO OTHERS(Percentage Distribution)
Florida
Definitely 66%Probably 15%Probably Not 10%Definitely Not 9%Don't Know/ Not Sure
1%
U.S.
Definitely 66%Probably 18%Probably Not 7%Definitely Not 7%Don't Know/ Not Sure
2%
66%
15%10% 9%
1%0%
10%
20%
30%
40%
50%
60%
70%
80%
Definitely Probably Probably Not Definitely Not Don't Know/ NotSure
WOULD SELLER USE REAL ESTATE AGENT AGAIN OR RECOMMEND TO OTHERS
(Percentage Distribution)
Florida
66%
18%
7% 7% 2%
%
10%
20%
30%
40%
50%
60%
70%
80%
Definitely Probably Probably Not Definitely Not Don't Know/ NotSure
WOULD SELLER USE REAL ESTATE AGENT AGAIN OR RECOMMEND TO OTHERS
(Percentage Distribution)
U.S
2012 National Association of Realtors® Profile of Home Buyers and Sellers

FOR SALE BY OWNERS SELLERS
Exhibit 8-1 FSBO AND AGENT-ASSISTED SALES, BY LOCATIONExhibit 8-2 FSBO AND AGENT-ASSISTED SALES, 2003-2012Exhibit 8-3 CHARACTERISTICS OF FSBO AND AGENT-ASSISTED SELLERSExhibit 8-4 TYPE OF HOME SOLD, FSBO AND AGENT-ASSISTED SELLERSExhibit 8-5 LOCATION OF HOME SOLD, FSBO AND AGENT-ASSISTED SELLERSExhibit 8-6 SELLING PRICE, FSBO AND AGENT-ASSISTED SELLERSExhibit 8-7 TIME ON THE MARKET, FSBO AND AGENT-ASSISTED SELLERSExhibit 8-8 SELLER URGENCY, FSBO AND AGENT-ASSISTED SELLERSExhibit 8-9 INCENTIVES OFFERED TO ATTRACT BUYERS, FSBO AND AGENT-ASSISTED SELLERSExhibit 8-10 MOST IMPORTANT REASON FOR SELLING HOME AS FSBOExhibit 8-11 METHOD USED BY FSBO SELLERS TO MARKET HOMEExhibit 8-12 MOST DIFFICULT TASK FOR FSBO SELLERSExhibit 8-13 HOW FSBO SELLERS WILL SELL THEIR CURRENT HOME
2012 National Association of Realtors® Profile of Home Buyers and Sellers

FOR SALE BY OWNERS SELLERS
Exhibit 8-1FSBO AND AGENT-ASSISTED SALES, BY LOCATION(Percentage Distribution)
Florida
All SellersSuburb/
Subdivision Small town
Urban/ Central
cityRural area
Resort/ Recreation
areaFor-sale-by-owner (FSBO) 5% 2% 8% 14% 10% *
Seller knew buyer 2 1 3 10 3 *Seller did not know buyer 3 1 5 5 7 *
Agent-assisted 93 97 92 81 83 100Other 2 2 * 5 7 *
U.S.
Suburb/ Subdivision Small town
Urban/ Central
cityRural area
Resort/ Recreation
areaFor-sale-by-owner (FSBO) 9% 9% 8% 13% 3% *
Seller knew buyer 3 4 5 5 1 *Seller did not know buyer 6 6 3 8 2 *
Agent-assisted 88 88 89 83 94 100Other 3 3 3 5 3 *
* Less than 1 percent
SELLERS WHO SOLD A HOME IN A
All Sellers
SELLERS WHO SOLD A HOME IN A
2012 National Association of Realtors® Profile of Home Buyers and Sellers

FOR SALE BY OWNERS SELLERS
Exhibit 8-2FSBO AND AGENT-ASSISTED SALES, 2003-2012(Percentage Distribution)
Florida
2012All FSBO (For-sale-by-owner) 5%
Seller knew buyer 2Seller did not know buyer 3
Agent-assisted 93Other 2
U.S.
2003 2004 2005 2006 2007 2008 2009 2010 2011 2012All FSBO (For-sale-by-owner) 14% 14% 13% 12% 12% 13% 11% 9% 10% 9%
Seller knew buyer 5 5 5 5 5 6 5 5 4 3Seller did not know buyer 9 10 8 7 7 7 6 5 6 6
Agent-assisted 83 82 85 84 85 84 85 88 87 88Other 4 4 2 3 3 3 4 3 3 2
2012 National Association of Realtors® Profile of Home Buyers and Sellers

FOR SALE BY OWNERS SELLERS
Exhibit 8-3CHARACTERISTICS OF FSBO AND AGENT-ASSISTED SELLERS
Florida
All Sellers All FSBO
Seller Knew Buyer
Seller did not Know
BuyerAll Agent-
assisted
Agent-assisted
only
First FSBO, then Agent-
assistedMedian age 63 66 65 67 63 63 62Median income (2011) $83,200 $75,000 $80,000 $60,000 $84,200 $83,800 $88,700Household composition
Married couple 75% 75% 60% 100% 76% 76% 88%Single female 14 8 20 * 14 14 13Single male 5 * * * 4 4 *Unmarried couple 5 17 20 * 5 5 *Other 1 * * * 2 2 *
U.S.
All Sellers All FSBO
Seller Knew Buyer
Seller did not Know
BuyerAll Agent-
assisted
Agent-assisted
only
First FSBO, then Agent-
assistedMedian age 53 53 56 52 53 53 62Median income (2011) $95,400 $80,400 $83,200 $78,300 $97,600 $98,000 $81,700Household composition
Married couple 76% 72% 67% 75% 77% 77% 90%Single female 14 16 23 12 13 13 4Single male 5 6 4 7 5 5 2Unmarried couple 4 4 6 3 4 4 2Other 1 2 * 3 1 1 2
* Less than 1 percentN/A- Not Available
FSBO
FSBO AGENT-ASSISTED
AGENT-ASSISTED
2012 National Association of Realtors® Profile of Home Buyers and Sellers

FOR SALE BY OWNERS SELLERS
Exhibit 8-4TYPE OF HOME SOLD, FSBO AND AGENT-ASSISTED SELLERS(Percentage Distribution)
Florida
All Sellers All FSBO
Seller Knew Buyer
Seller did not Know
BuyerAgent-
AssistedDetached single-family home 78% 58% 40% 67% 78%Townhouse/row house 6 8 20 * 6Duplex/apartment/condo in 2 to 4 unit building 2 * * * 3Apartment/condo in a building with 5 or more units 8 * * * 9Mobile/manufactured home 4 25 20 33 3Other 3 8 20 * 2
* Less than 1 percent
U.S.
All Sellers All FSBO
Seller Knew Buyer
Seller did not Know
BuyerAgent-
AssistedDetached single-family home 81% 75% 66% 79% 82%Townhouse/row house 7 6 9 3 7Duplex/apartment/condo in 2 to 4 unit building 2 1 2 2Apartment/condo in a building with 5 or more units 5 3 2 3 5Mobile/manufactured home 3 10 15 8 2Other 3 6 6 6 2
FSBO
FSBO
2012 National Association of Realtors® Profile of Home Buyers and Sellers

FOR SALE BY OWNERS SELLERS
Exhibit 8-5LOCATION OF HOME SOLD, FSBO AND AGENT-ASSISTED SELLERS(Percentage Distribution)
Florida
All Sellers All FSBOSeller Knew
BuyerSeller did not
Know Buyer Agent-AssistedSuburb/Subdivision 53% 17% 20% 17% 55%Small town 18 33 20 33 17Urban area/Central city 9 25 40 17 9Rural area 14 25 20 33 13Resort/Recreation area 6 * * * 6
* Less than 1 percent
U.S.
All Sellers All FSBOSeller Knew
BuyerSeller did not
Know Buyer Agent-AssistedSuburb/Subdivision 42% 45% 39% 49% 42%Small town 17 15 21 11 17Urban area/Central city 17 24 23 25 16Rural area 15 11 7 13 15Resort/Recreation area 10 5 10 2 10
* Less than 1 percent
FSBO
FSBO
2012 National Association of Realtors® Profile of Home Buyers and Sellers

FOR SALE BY OWNERS SELLERSExhibit 8-6SELLING PRICE, FSBO AND AGENT-ASSISTED SELLERS(Percentage Distribution)
Florida
All Sellers All FSBOSeller Knew
Buyer
Seller did not Know
BuyerAll Agent-
assistedAgent-
assisted only
First FSBO, then Agent-
assistedMedian selling price $200,000 $170,000 $160,000 $172,000 $205,000 $204,000 $245,000Lowest selling price * $10,000 $10,000 $28,000 $11,000 $11,000 $147,000Highest selling price $7,300,000 $435,000 $315,000 $265,000 $7,300,000 $7,300,000 $560,000Sample size 207 12 5 6 187 179 8Sales price compared with asking price:Less than 90% 31% 33% 40% 33% 31% 31% 25%90% to 94% 27 8 * 17 28 28 3895% to 99% 24 50 40 50 22 22 38100% 14 8 20 * 14 15 *101% to 110% 3 * * * 3 3 *More than 110% 2 * * * 2 2 *Median (sales price as a percent of asking price)
93% 95% 95% 93% 93% 93% 92%
Number of times asking price was reduced:None 33% 25% 20% 17% 32% 32% 25%One 26 50 60 50 25 25 25Two 19 8 * 17 20 21 13Three 13 8 20 * 14 15 13Four or more 9 8 * 17 8 7 25
FSBO AGENT-ASSISTED
CAUTIONARY NOTE: Small sample sizes in some cases do not allow statistically robust results to be obtained. Please use caution when interpreting the results in cases where sample sizes are small.
2012 National Association of Realtors® Profile of Home Buyers and Sellers

U.S.
All Sellers All FSBOSeller Knew
Buyer
Seller did not Know
BuyerAll Agent-
assistedAgent-
assisted only
First FSBO, then Agent-
assistedMedian selling price $210,000 $174,900 $151,600 $191,600 $215,000 $215,000 $175,000Sales price compared with asking price:Less than 90% 23% 18% 17% 19% 23% 23% 28%90% to 94% 22 13 13 13 23 23 2895% to 99% 35 33 11 45 36 36 28100% 15 32 56 20 13 13 9101% to 110% 4 3 1 4 4 4 2More than 110% 2 1 3 * 2 2 6Median (sales price as a percent of asking price)
95% 97% 100% 96% 95% 95% 92%
Number of times asking price was reduced:None 40% 50% 66% 41% 39% 39% 19%One 25 28 24 31 25 25 33Two 17 13 8 16 17 17 19Three 10 6 3 8 10 10 12Four or more 8 3 * 4 9 9 19
* Less than 1 percentN/A- Not Available
FSBO AGENT-ASSISTED
2012 National Association of Realtors® Profile of Home Buyers and Sellers

FOR SALE BY OWNERS SELLERS
Exhibit 8-7TIME ON THE MARKET, FSBO AND AGENT-ASSISTED SELLERS(Percentage Distribution)
Florida
All Sellers All FSBO
Seller Knew Buyer
Seller did not Know
BuyerAll Agent-
assisted
Agent-assisted
only
First FSBO, then Agent-
assistedLess than 1 week 5% 50% 80% 17% 2% 2% *1 to 2 weeks 18 * * * 19 20 133 to 4 weeks 9 8 * 17 9 9 *5 to 6 weeks 6 8 20 * 6 6 137 to 8 weeks 3 * * * 2 2 *9 to 10 weeks 5 * * * 5 5 *11 to 12 weeks 10 8 * 17 11 11 1313 to 16 weeks 6 8 * 17 6 6 1317 to 24 weeks 12 8 * 17 13 13 1325 to 36 weeks 8 * * * 9 10 * 37 to 52 weeks 7 8 * 17 7 7 *53 or more weeks 11 * * * 12 11 38Median weeks 12 2 * 14 12 12 20
* Less than 1 percentN/A- Not Available
U.S.
All Sellers All FSBO
Seller Knew Buyer
Seller did not Know
BuyerAll Agent-
assisted
Agent-assisted
only
First FSBO, then Agent-
assistedLess than 1 week 4% 22% 45% 8% 2% 2% *1 to 2 weeks 20 12 10 14 21 21 123 to 4 weeks 11 8 6 9 11 11 65 to 6 weeks 5 5 6 5 5 5 47 to 8 weeks 5 8 6 10 5 5 109 to 10 weeks 4 2 * 3 4 4 211 to 12 weeks 9 10 5 13 9 9 413 to 16 weeks 8 4 * 5 8 8 1217 to 24 weeks 10 6 1 8 10 11 825 to 36 weeks 8 3 1 4 9 8 16 37 to 52 weeks 8 11 8 13 8 8 253 or more weeks 9 10 11 9 9 8 26Median weeks 12 8 1 12 12 12 20
* Less than 1 percent
FSBO
FSBO AGENT-ASSISTED
AGENT-ASSISTED
2012 National Association of Realtors® Profile of Home Buyers and Sellers

FOR SALE BY OWNERS SELLERS
Exhibit 8-8SELLER URGENCY, FSBO AND AGENT-ASSISTED SELLERS(Percentage Distribution)
Florida
Sellers needed to sell: All Sellers All FSBO
Seller Knew Buyer
Seller did not Know
BuyerAll Agent-
assisted
Agent-assisted
only
First FSBO, then Agent-
assistedVery urgently 17% 17% 40% * 17% 16% 38%Somewhat urgently 38 25 20 33 39 40 13Not urgently 45 58 40 67 44 44 50
* Less than 1 percentN/A- Not Available
U.S.
Sellers needed to sell: All Sellers All FSBO
Seller Knew Buyer
Seller did not Know
BuyerAll Agent-
assisted
Agent-assisted
only
First FSBO, then Agent-
assistedVery urgently 18% 15% 18% 13% 18% 18% 14%Somewhat urgently 40 32 31 33 42 42 36Not urgently 41 53 52 54 40 40 50
FSBO
FSBO AGENT-ASSISTED
AGENT-ASSISTED
2012 National Association of Realtors® Profile of Home Buyers and Sellers
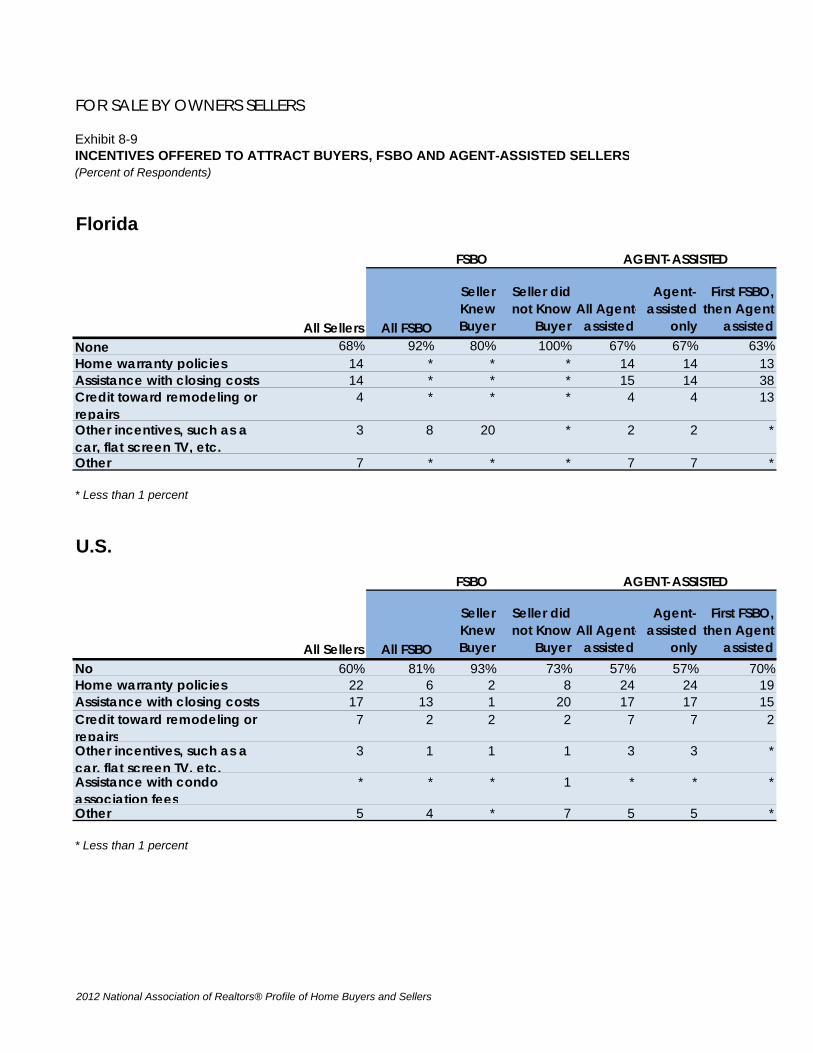
FOR SALE BY OWNERS SELLERS
Exhibit 8-9INCENTIVES OFFERED TO ATTRACT BUYERS, FSBO AND AGENT-ASSISTED SELLERS(Percent of Respondents)
Florida
All Sellers All FSBO
Seller Knew Buyer
Seller did not Know
BuyerAll Agent-
assisted
Agent-assisted
only
First FSBO, then Agent-
assistedNone 68% 92% 80% 100% 67% 67% 63%Home warranty policies 14 * * * 14 14 13Assistance with closing costs 14 * * * 15 14 38Credit toward remodeling or repairs
4 * * * 4 4 13
Other incentives, such as a car, flat screen TV, etc.
3 8 20 * 2 2 *
Other 7 * * * 7 7 *
* Less than 1 percent
U.S.
All Sellers All FSBO
Seller Knew Buyer
Seller did not Know
BuyerAll Agent-
assisted
Agent-assisted
only
First FSBO, then Agent-
assistedNo 60% 81% 93% 73% 57% 57% 70%Home warranty policies 22 6 2 8 24 24 19Assistance with closing costs 17 13 1 20 17 17 15Credit toward remodeling or repairs
7 2 2 2 7 7 2
Other incentives, such as a car, flat screen TV, etc.
3 1 1 1 3 3 *
Assistance with condo association fees
* * * 1 * * *
Other 5 4 * 7 5 5 *
* Less than 1 percent
FSBO AGENT-ASSISTED
FSBO AGENT-ASSISTED
2012 National Association of Realtors® Profile of Home Buyers and Sellers

FOR SALE BY OWNERS SELLERS
Exhibit 8-10MOST IMPORTANT REASON FOR SELLING HOME AS FSBO(Percentage Distribution)
Florida
All FSBOSeller Knew
BuyerSeller did not
Know BuyerDid not want to pay a commission or fee 36% 40% 33%Sold it to a relative, friend or neighbor 18 20 *Buyers contacted seller directly 18 20 58Did not want to deal with an agent 27 * *Agent was unable to sell home * 20 *Seller has real estate license * * *Could not find an agent to handle transaction * * *Other * * 8
* Less than 1 percent
U.S.
All FSBOSeller Knew
BuyerSeller did not
Know BuyerDid not want to pay a commission or fee 43% 20% 55%Sold it to a relative, friend or neighbor 25 65 3Buyers contacted seller directly 15 5 20Did not want to deal with an agent 8 3 12Agent was unable to sell home 6 1 9Seller has real estate license 1 * 1Could not find an agent to handle transaction * * *Other 2 5 1
* Less than 1 percent
2012 National Association of Realtors® Profile of Home Buyers and Sellers

FOR SALE BY OWNERS SELLERS
Exhibit 8-11METHOD USED BY FSBO SELLERS TO MARKET HOME(Percent of Respondents)
Florida
All FSBOSeller Knew
BuyerSeller did not
Know BuyerYard sign 27% * 60%Friends, relatives, or neighbors 36 40 40Listing on the Internet 18 * 40Print newspaper advertisement 9 * 20For-sale-by-owner Web site 9 * 20Open house * * *Other Web sites with real estate listings 9 * 20Direct mail (flyers, postcards, etc) * * *For-sale-by-owner magazine 9 * 20Social networking Web sites (e.g. Facebook, MySpace, etc.) * * *Television * * *Video * * *Other * * *None - Did not actively market home 46 60 20
U.S.
All FSBOSeller Knew
BuyerSeller did not
Know BuyerYard sign 48% 8% 69%Listing on the Internet 32 1 49 For-sale-by-owner Web site 20 * 31 Other Web sites with real estate listings (e.g. Yahoo, Google, etc. 11 * 18 Social networking Web sites (e.g. Facebook, Twitter, etc.) 10 1 15 Video hosting Web sites (e.g. YouTube, etc.) 2 * 3Friends, relatives, or neighbors 30 41 24Print newspaper advertisement 14 3 20Open house 12 3 *Direct mail (flyers, postcards, etc) 2 * 3Video 1 * 2For-sale-by-owner magazine 1 * 2Television * * *None - Did not actively market home 31 57 15Other 2 * 4
* Less than 1 percent
2012 National Association of Realtors® Profile of Home Buyers and Sellers

FOR SALE BY OWNERS SELLERS
Exhibit 8-12MOST DIFFICULT TASK FOR FSBO SELLERS(Percentage of Distribution)
Florida
All FSBOSeller Knew
BuyerSeller did not
Know BuyerUnderstanding and performing paperwork 10% 20% *Preparing or fixing up the home for sale 10 * 20Getting the price right 30 20 40Selling within the length of time planned * * *Attracting potential buyers * * *Having enough time to devote to all aspects of the sale 10 20 *Helping buyer obtain financing 10 20 *None/Nothing 20 20 20
* Less than 1 percent
U.S.
All FSBOSeller Knew
BuyerSeller did not
Know BuyerUnderstanding and performing paperwork 18% 17% 19%Getting the price right 14 12 15Preparing or fixing up the home for sale 11 3 15Helping buyer obtain financing 6 6 6Attracting potential buyers 6 5 7Selling within the length of time planned 6 6 5Having enough time to devote to all aspects of the sale 1 3 2Other 1 * 2None/Nothing 37 49 30
* Less than 1 percent
2012 National Association of Realtors® Profile of Home Buyers and Sellers

FOR SALE BY OWNERS SELLERS
Exhibit 8-13HOW FSBO SELLERS WILL SELL THEIR CURRENT HOME(Percentage of Distribution)
Florida
Sell Themselves 14%Use a Real Estate Agent
38%
Don't Know/ Not Sure
48%
Sell Themselves 38%Use a Real Estate Agent
13%
Don't Know/ Not Sure
49%
FSBO- Seller Did Not Know Buyer
FSBO- Seller Knew Buyer
Sell Themselves,
38%
Use a Real Estate Agent,
13%
Don't Know/ Not Sure,
49%
HOW FSBO SELLERS WILL SELL THEIR CURRENT HOME - FSBO, Seller Did Not Know
Buyer (Percentage Distribution)
Florida
Sell Themselves,
14%
Use a Real Estate Agent,
38%
Don't Know/ Not Sure,
48%
HOW FSBO SELLERS WILL SELL THEIR CURRENT HOME - FSBO, Seller Knew Buyer
(Percentage Distribution)
Florida
2012 National Association of Realtors® Profile of Home Buyers and Sellers

FOR SALE BY OWNERS SELLERS
HOW FSBO SELLERS WILL SELL THEIR CURRENT HOME(Percentage of Distribution)
U.S.
Sell Themselves 7%Use a Real Estate Agent
45%
Don't Know/ Not Sure
48%
Sell Themselves 38%Use a Real Estate Agent
20%
Don't Know/ Not Sure
43%
FSBO- Seller Did Not Know Buyer
FSBO- Seller Knew Buyer
Sell Themselves,
38%
Use a Real Estate Agent,
20%
Don't Know/ Not Sure,
43%
HOW FSBO SELLERS WILL SELL THEIR CURRENT HOME - FSBO, Seller Did Not Know
Buyer (Percentage Distribution)
U.S.
Sell Themselves,
7%
Use a Real Estate Agent,
45%
Don't Know/ Not Sure, 48%
HOW FSBO SELLERS WILL SELL THEIR CURRENT HOME - FSBO, Seller Knew Buyer
(Percentage Distribution)
U.S.
2012 National Association of Realtors® Profile of Home Buyers and Sellers


