128
RESTAURANT INDUSTRY OPERATIONS REPORT 2007–2008 EDITION and

REstauRant IndustRy o p e r a t i o n s r e p o r t
2 0 0 7 – 2 0 0 8 E d I t I o n
and

Restaurant Industry Operations Report 2007/2008 Edition
4 List of Exhibits
6 The Restaurant Industry
9 Highlights from the Restaurant Industry Dollar
10 Understanding Medians and Means
12 Explanation of Terms
13 Introduction to Analysis of Data and Explanatory Notes
14 Section A—Full Service Restaurants (Average Check Per Person Under $15)
42 Section B—Full Service Restaurants (Average Check Per Person $15 to $24.99)
68 Section C—Full Service Restaurants (Average Check Per Person $25 and Over)
94 Section D—Limited Service Restaurants
119 Analyze Your Operation
120 Worksheet
121 Sample Survey
124 Information Regarding Regional and State Restaurant Industry Operations Reports
125 Additional Information

ISBN # 1-931400-64-4

�
Dear Reader:
The National Restaurant Association and Deloitte & Touche LLP are pleased to present the 2007/2008 edition of the Restaurant Industry Operations Report.
The Restaurant Industry Operations Report is based on financial and operating data for 2006 provided by members of the National Restaurant Association and members of various state restaurant associations. The data processing was performed by Deloitte & Touche LLP, and the report was published in conjunction with the National Restaurant Association. More than 700 questionnaires were received from restaurant operators, which form the basis of this report. This unique study of the operating results of restaurants principally in 2006 includes specific financial information on full service restaurants segregated by average check of less than $15 per person, average check per person $15 to $24.99, average check equal to or greater than $25 per person, and limited service restaurants.
The data has been presented by type of restaurant, location, sales volume, and menu theme, among other methods. The report presents operating results as amounts per restaurant seat and as ratios to total sales, which are the most common bases used in the industry. Unless otherwise noted, amounts and ratios in the text and exhibits are the medians and upper and lower quartiles of the survey data. This data is not intended to be standards or goals for individual restaurants, nor is this report an attempt by the National Restaurant Association or Deloitte & Touche LLP to set or adjust industry prices or operating ratios. Rather, the data and related worksheet at the back of the report are intended to be used as management tools to help you compare your restaurant’s performance with that of similar restaurants.
This year’s survey is based on substantial effort and support provided by the Research Department of the National Restaurant Association in Washington, D.C., and by the Restaurant & Hospitality practice of Deloitte & Touche, LLP, including Nicole Bell, Ha Na Ko, and Ryan Huynh. Their efforts are very much appreciated.
We would like to thank the restaurant operators who supplied complete information about their restaurants, making this study possible.
Dawn Sweeney Steven SteinhauserPresident and Chief Executive Officer Director, Restaurant Industry PracticeNational Restaurant Association Deloitte & Touche LLP
© 2008 by the National Restaurant Association and Deloitte & Touche LLP

�
© 2008 by the National Restaurant Association and Deloitte & Touche LLP
Exhibit Page
The Restaurant Industry 6
Percent Change in Dollar Sales 2005-2007 8
The Restaurant Industry Dollar 9
Section A Full Service Restaurants(Average Check Per Person Under $15)
Profile of Contributors
Highlights 14
Characteristics 14
Composition of Participating Restaurants A-1 15
Performance Measurements
Average Check A-2 16
Average Daily Seat Turnover A-3 17
Cost per Dollar of Sales A-4 18
Number of Employees A-5 19
Annual Employee Turnover A-6 20
Employee Information A-7 21
Take-Out/Drive-Through, Outside CateringAnd Banquet Service – Ratio to Total Sales
A-8 22
Statement of Income and Expenses
Amount per Seat and Ratio to Total Sales:All Full Service Restaurants(Average Check Per Person Under $15) A-9 23
Amount per Square Foot A-10 24
Amount per Seat by:Type of Establishment A-11 26
Affiliation A-13 28
Sales Volume A-15 30
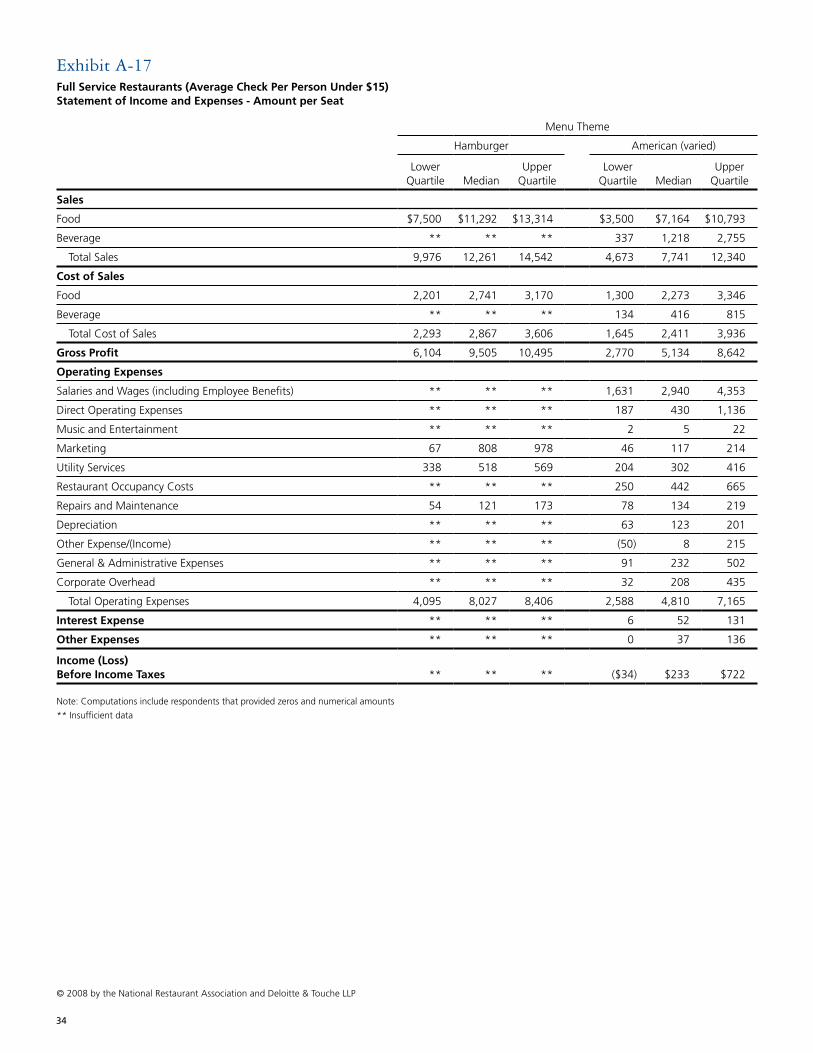
Menu Theme A-17 34
Location A-19 36
Average Check A-21 38
Ratio to Total Sales by:Type of Establishment A-12 27
Affiliation A-14 29
Sales Volume A-16 32
Menu Theme A-18 35
Location A-20 37
Average Check A-22 39
Income Differential A-23 40
List of ExhibitsExhibit Page
Section B Full Service Restaurants(Average Check Per Person $15 to $24.99)
Profile of Contributors
Highlights 42
Characteristics 42
Composition of Participating Restaurants B-1 43
Performance Measurements
Average Check B-2 44
Average Daily Seat Turnover B-3 45
Cost per Dollar of Sales B-4 46
Number of Employees B-5 47
Annual Employee Turnover B-6 48
Employee Information B-7 49
Take-Out/Drive-Through, Outside Catering and Banquet Service – Ratio to Total Sales B-8 50
Statement of Income and Expenses
Amount per Seat and Ratio to Total Sales:All Full Service Restaurants(Average Check Per Person $15 to $24.99) B-9 51
Amount per Square Foot B-10 52
Amount per Seat by:Type of Establishment B-11 54
Affiliation B-13 56
Sales Volume B-15 58
Menu Theme B-17 60
Location B-19 64
Average Check B-21 66
Ratio to Total Sales by:Type of Establishment B-12 55
Affiliation B-14 57
Sales Volume B-16 59
Menu Theme B-18 61
Location B-20 63
Average Check B-22 65
Income Differential B-23 66

�
© 2008 by the National Restaurant Association and Deloitte & Touche LLP
Exhibit Page
Section C Full Service Restaurants(Average Check Per Person $25 and Over)
Profile of Contributors
Highlights 68
Characteristics 68
Composition of Participating Restaurants C-1 69
Performance Measurements
Average Check C-2 70
Average Daily Seat Turnover C-3 71
Cost per Dollar of Sales C-4 72
Number of Employees C-5 73
Annual Employee Turnover C-6 74
Employee Information C-7 75
Take-Out/Drive-Through, Outside Cateringand Banquet Service – Ratio to Total Sales
C-8 76
Statement of Income and Expenses
Amount per Seat and Ratio to Total Sales:All Full Service Restaurants(Average Check Per Person $25 and Over) C-9 77
Amount per Square Foot C-10 78
Amount per Seat by:Type of Establishment C-11 80
Affiliation C-13 82
Sales Volume C-15 84
Menu Theme C-17 86
Location C-19 88
Average Check C-21 90
Ratio to Total Sales by:Type of Establishment C-12 81
Affiliation C-14 83
Sales Volume C-16 85
Menu Theme C-18 87
Location C-20 89
Average Check C-22 91
Income Differential C-23 93
Exhibit Page
Section DLimited Service Restaurants
Profile of Contributors
Highlights 94
Characteristics 94
Composition of Participating Restaurants D-1 95
Performance Measurements
Average Check D-2 96
Average Daily Seat Turnover D-3 97
Cost per Dollar of Sales D-4 98
Number of Employees D-5 99
Annual Employee Turnover D-6 100
Employee Information D-7 101
Take-Out/Drive-Through, Outside Cateringand Banquet Service – Ratio to Total Sales
D-8 102
Statement of Income and Expenses
Amount per Seat and Ratio to Total Sales:All Limited Service Restaurants D-9 103
Amount per Square Foot D-10 104
Amount per Seat by:Type of Establishment D-11 106
Affiliation D-13 108
Sales Volume D-15 110
Menu Theme D-17 112
Location D-19 114
Average Check D-21 116
Ratio to Total Sales by:Type of Establishment D-12 107
Affiliation D-14 109
Sales Volume D-16 111
Menu Theme D-18 113
Location D-20 115
Average Check D-22 117
Income Differential D-23 118
List of Exhibits – continued

�
© 2008 by the National Restaurant Association and Deloitte & Touche LLP
The restaurant industry is a large and diverse business:
• Restaurant-industry sales are forecast to reach $558.3 billion in 2008 – an increase of 4.4 percent over 2007, or 0.9 percent in inflation-adjusted terms.
• The restaurant industry will mark the 17th consecutive year of real sales growth in 2008.
• On a typical day in 2008, the restaurant industry will post average sales of more than $1.5 billion.
• Sales at full service restaurants are projected to reach $187.4 billion in 2008.
• Sales at quick service restaurants are forecast to increase to $156.8 billion in 2008, while snack and non-alcoholic-beverage bar sales rise to $20.9 billion.
As the restaurant industry heads into an expected 17th consecutive year of real sales growth, the National Restaurant Association anticipates slower growth in industry sales for 2008. Elevated gas prices, higher food costs (wholesale and menu), and other factors likely will cause consumers to become more discriminating in their spending. Nevertheless, consumers continue to demand the variety, convenience, and socialization restaurants provide. The ability of dining establishments to provide customers with an assortment of food and beverage options, while maintaining value pricing, will be essential to competitive differentiation in the upcoming year.
Association research indicates that unfulfilled demand for restaurant services continues at respectable levels, resulting in a rise in industry employment. As food and labor costs climb, operators will rely more on technology to help manage costs and boost productivity. Although growth in 2008 is expected to be more modest than in previous years, the industry is expected to post real sales gain in the coming year.
Several notable industry trends expected in 2008 are:• More creative menus: Driven by more sophisticated and
demanding customers, the restaurant industry has seen an explosion of new tastes, flavors, and preparation methods. That trend will accelerate in 2008.
• Employee recruitment and retention: Restaurateurs already say recruitment and retention are top concerns – and that’s even before the industry adds 2 million jobs by 2018. Strong training, productivity gains, good employee-relations strategies, and immigration reform are more important than ever, especially in areas of the country where restaurant sales growth is the strongest.
• Green practices: Energy conservation practices among restaurateurs are on the rise – a majority of restaurant operators indicate that they are actively working to cut energy costs.
• Enhancing food safety: Food safety and security will continue to be a top public policy issue for the industry during 2008.
• Nutrition-conscious patrons: Three in four adults are trying to eat more healthfully in restaurants than they were two years ago. Restaurant operators will need to continue to deliver an expanding variety of tasty choices – in a wider array of portion options – to their guests.
• Convenience: Customers demand the meals they want, when and how they want them. Look for innovations in take-out, drive-thru, delivery, online ordering, self-service options, and at-table ordering and payment options.
• Better margins through improved technology: Higher energy and food costs will add to margin pressure. Greater capital investment in technology will be needed to boost productivity.
FULL SERVICE OUTLOOKFull Service restaurant sales are forecast to reach $187.4 billion in 2008, an increase of roughly $7.7 billion, or 4.3 percent, over 2007 sales.
A majority of full service operators expect their business to improve in 2008: 59 percent of fine-dining operators, 57 percent of casual-dining operators, and 45 percent of family-dining operators expect improved sales figures in the upcoming year.
WHAT TO WATCHFull service restaurants will need to pay close attention to the three Cs in 2008 – choice, convenience, and customers. According to the National Restaurant Association’s October 2007 survey of table service operators, customers are exerting more influence than ever before, and they will reward those operators who can give them the food they want where and when they want it – whether it is delivered to their car or ordered online.
The Restaurant Industry
RESTAURANT INDUSTRY SALES – 2007 AND 2008 ($000)
2006 2007
Total Restaurant Industry $534,720,701 $558,318,575
Commercial Restaurant Services
488,290,700 510,430,349
Eating Places 360,722,002 376,738,661
Full Service Restaurants 179,679,723 187,405,951
Limited Service Restaurants
150,217,108 156,826,661
Noncommercial Restaurant Services
44,535,085 45,874,762
Military Restaurant Services
1,894,916 2,013,464
Note: 2007 and 2008 figures are projected
Source: National Restaurant Association, 2008 Restaurant Industry Forecast

�
© 2008 by the National Restaurant Association and Deloitte & Touche LLP
Trends to look for in 2008 include:• Customers hungry for choices: From curbside to online, operators
are delivering more choices to their customers. Take-out is becoming more prevalent, especially among family-dining and casual-dining restaurants; according to Association research, nine out of ten family-dining and casual-dining operators believe that the take-out trend will become more popular in the future. Although not as prevalent as take-out, delivery from full service restaurants also is a service that will likely increase in popularity.
• Techno-savvy service: Full service operators continue to attract patrons with improved in-restaurant technology. Technology-related offerings gaining favor include wireless Internet access for customers. Though not as prevalent, electronic ordering and electronic payment systems at the table will become more popular in the future.
• Take the experience home: More full service operators are allowing customers to take the dining experience home with them – or share it with others – by selling food and merchandise as well as gift cards. The Association’s October 2007 survey found that a majority of family-dining and casual-dining operators believe merchandise and food items available for retail sale will become increasingly more popular. Additionally, Association research has found that restaurant gift cards continue to grow in popularity among consumers.
QUICK SERVICE OUTLOOKThe quick service-restaurant segment is forecast to post sales of $156.8 billion in 2008, a 4.4 percent increase over its 2007 sales of $150.2 billion.
The National Restaurant Association defines quick service restaurants as operations where patrons generally order at a cash register or a drive-thru, or select items from a food bar and pay before they eat.
A majority of quick service operators expect their business to improve – 69 percent of quick service operators anticipate sales to be higher in 2008 than they were in 2007.
WHAT TO WATCHThe National Restaurant Association’s October 2008 survey of quick service operators found that more food choices topped the list of hot trends for the coming year. Thirty percent of quick service operators cited more food choices as a top trend, 19 percent picked healthy alternatives, 17 percent listed more value for the price, 14 percent listed more beverage choices, and 11 percent chose improved food quality.
Trends to look for in 2008 include:• Serving up options: Quick service will continue to play to its
strength of providing convenience to time-pressed consumers, including via takeout, delivery, and drive-thru services.
• Tapping into technology: Quick service operators are using technology to satisfy customers’ hunger for choice. From wireless Internet access to self-serve ordering terminals to digital menu boards, quick service operators are employing a variety of technology-related options to improve operational efficiency as well as distinguish themselves from the competition.
• An appetite for variety: Quick service operators are striving to fulfill consumers’ hunger for more food and beverage choices. According to the Association’s October 2007 survey, 90 percent of quick service operators said they added new food items in 2007, while 84 percent said they plan to add new food items in 2008.
MENU TRENDSThe name of the game for restaurant menus in 2008 will be “more” – more food choices; more beverage choices; more portion-size choices; more healthy options; and more tastes, flavors, and innovation. Restaurant operators, customers, and chefs surveyed by the National Restaurant Association in October 2007 point to an explosion of choices on restaurant menus as restaurant operators deliver new items as well as menu standards with new twists. The trend toward variety extends to expanding beverages options too, with restaurants serving a range of alcoholic and nonalcoholic beverages.
• Small is big. Bite-size desserts and small plates/tapas/mezze are among the hottest trends, according to the National Restaurant Association’s second annual “What’s Hot, What’s Not,” survey of more than 1,200 chefs who are members of the American Culinary Federation.
• Many restaurants now feature alternative-source ingredients. Local produce, organics, sustainable seafood, grass-fed, and free-range items all ranked high on the Top 20 hot items in the chef survey. Full service-restaurant operators surveyed by the Association also said locally produced items continued to grow more popular, especially at fine-dining establishments, where 86 percent of operators said they serve locally sourced items (compared with about three of five family-dining and casual-dining operators). A majority of operators across all full service segments believe locally sourced items will become more popular in the future.
• Specialty alcohol is on tap as a strong trend. Chefs ranked craft beer, signature cocktails, and organic wine among the top 20 restaurant trends. National Restaurant Association operator surveys show that full service restaurants are shaking up their beverage-alcohol options with new offerings.
• Americans want healthful options. According to National Restaurant Association research, three of four adults – and about the same percentage of teenagers – say they are trying to eat more healthfully in restaurants today. More than eight out of 10 consumers say that they see more “healthy” options on restaurant menus than they did two years ago. Nearly one in four adults has used the Internet to research nutrition information for restaurant foods. Quick service operators said “healthy alternatives” are the No. 2 trend for their segment in 2008.

�
© 2008 by the National Restaurant Association and Deloitte & Touche LLP
OPERATIONAL SPENDING TRENDSRecent Association research shows that full service and quick service operators plan to concentrate their spending on improved food safety practice, better technology, and remodeling.
Percentage of full service restaurant operators, by type of operation, planning to allocate a larger proportion of their budget to selected items in 2008:
Percentage of quick service restaurant operators planning to allocate a larger proportion of their budget to selected items in 2008:
OUTLOOK FOR RESTAURANTS IN 2008Economic factors play an ongoing and critical role in determining the performance of the restaurant industry. Because business conditions within the industry mirror general economic conditions, it is important to understand how the economy is expected to perform in 2008 in order to determine what will occur with restaurant sales over the years ahead. Real GDP growth in 2008 around the 2 percent range is anticipated. An expanding economy signals growth in the restaurant industry as well, with a high correlation traditionally existing between changes in real GDP and changes in inflation-adjusted industry sales.
The rate of increase in disposable income is another indicator of restaurant industry performance. Changes in real disposable income are positively related to changes in restaurant sales. In general, as the rate of change in disposable incomes rises or falls, similar behavior is observed for restaurant sales. Advances in real disposable income in 2008 are expected to be in the 2 to 3 percent range.
National Restaurant AssociationResearch and Information Services Division
Family dining
Casual dining
Fine dining
Food safety/security 36% 45% 34%
Training 36% 34% 34%
Technology 30% 34% 36%
Remodeling 29% 37% 28%
Green initiatives 23% 31% 32%
Advertising/promotion 27% 20% 22%
Unit expansion 10% 10% 19%
Source: National Restaurant Association, 2007
Technology 55%
Unit expansion 46%
Remodeling 46%
Food safety/security 43%
Training 40%
Advertising/promotion 29%
Green initiatives 21%
Source: National Restaurant Association, 2007
Restaurant Industry Percent Change In Dollar Sales, 2005-2007
Current $ 2006
Current $ 2007
Current $ 2008
0.80.8
1.9
0.70.3
1.2
0.90.8
1.54.4
4.64.7
4.34.1
4.5
4.44.5
5.0
Restaurant industry sales include all meals and snack sales at commercial restaurants, institutional organizations, hotel/motel restaurants and retail host restaurants, among others.Constant dollar sales are adjusted for inflation.
Note: 2006 and 2007 figures are projected.Source: National Restaurant Association, 2007 Restaurant Industry Forecast
Constant $ 2006
Constant $ 2007
Constant $ 2008
Total Industry Sales
Fullservice Restaurant Sales
Quickservice Restaurant Sales

�
© 2008 by the National Restaurant Association and Deloitte & Touche LLP
Highlights From The Restaurant Industry Dollar• Full Service Restaurants (Average Check Per Person Under $15)
reported income before income taxes of approximately 5.6% of total sales.
• Full Service Restaurants (Average Check Per Person $15 to $24.99) reported salaries and wages of approximately 33.5% of total sales.
• Full Service Restaurants (Average Check Per Person $25 and Over) reported cost of food and beverage sales of approximately 32.4% of total sales.
• Limited Service Restaurants reported cost of food and beverage sales of approximately 30.4% of total sales.
The following schedule presents selected median values for full service and limited service restaurants.
The Restaurant Industry Dollar1
Full Service Restaurants Limited Service RestaurantsAverage Check Per Person
Under $15 $15 to $24.99
$25 and Over
Where It Came From:
Food and Beverage Sales 100% 100% 100% 100%
Where It Went:
Cost of Food and Beverage Sales 31.9% 33.1% 32.4% 30.4%
Salaries and Wages2 32.5% 33.5% 34.5% 28.6%
Restaurant Occupancy Costs 6.0% 6.0% 6.9% 8.6%
Income Before Income Taxes 5.6% 3.6% 4.1% 9.7%
1 All amounts are median values2 Includes employee benefits

10
© 2008 by the National Restaurant Association and Deloitte & Touche LLP
The annual studies written by the Restaurant/Hospitality Advisors of Deloitte & Touche LLP utilize medians for the majority of their reported results. This article will give an in-depth explanation of medians and quartiles as well as briefly discuss means, along with practical uses of both.
A median is defined as the middle value of all amounts calculated for a specific line item. For example, if we received nine responses for number of full-time employees – 8,4,2,6,9,7,5,1,3 – these numbers would be arranged sequentially (in order of size) – 1,2,3,4,5,6,7,8,9 – and the middle value, 5, would be the median, since 50% of the responses received are below the value and 50% are above.
In conjunction with medians, lower and upper quartiles are used to give a further description of the sample results. Occasionally, we use means (arithmetic average) to report data, but we believe the median is the more appropriate method to report our results. This is because the median gives less biased results. Medians keep results from being skewed by a few abnormal respondents. For example, if a few responding restaurants incurred very large operating losses, those losses would be divided evenly among all restaurants in the sample (when using mean calculations) and would reduce the average net profit of the entire group which, for the most part, may have reported respectable profits.
Quartiles divide the responses into four equal parts, with the median still being the middle value. The “lower quartile” is the value that separates the lowest 25% of the responses from the rest of the sample when arranged sequentially, while the “upper quartile” defines the boundary of the upper 25% of the responses from the lower 75%. Stated another way, 50% of all responses fall between the lower and upper quartiles. For example, if we receive 99 responses for a specific item and the responses (conveniently) were numbered 1 through 99, the median (or middle value) would be 50, the lower quartile would be 25 (25% of responses would be above 75). Fifty percent (or half) of the responses would fall between the lower and upper quartiles (see chart below).
It will become evident in the reading of this report that columns do not total when medians are involved. The reason behind this is, EACH LINE ITEM IS ANALYZED SEPARATELY! In Table I, when all amounts are arranged sequentially, the median total sales amount per seat is $5,197. This figure is based on the 354 restaurants* that gave us information for this specific line item. The median amounts per seat for total food and beverage sales were $2,163 and $1,091, respectively. These two amounts were analyzed on a sample of 326 and 254 restaurants, respectively, that gave us separate food sales and beverage sales figures. Different sample sizes are one reason why figures do not add to the totals shown.
There is another major reason that columns in the tables do not total. When using medians, it is important to remember that the median food sales, the median beverage sales and the median total sales figures reported probably represent the results of three different restaurants, even though the sample size of each may be equal. This also holds true for lower and upper quartile figures.
The terms MEAN, AVERAGE, and ARITHMETIC MEAN are all synonymous. A mean is calculated by summing the results and dividing by the number of responses. In Table II, Column 1, the sum of the number of restaurant seats is 1,940. Divide this by the 9 respondents and the mean (average) is 216 seats per restaurant. By comparison, the median number of seats is 140. It is obvious that the average is skewed by the two restaurants with 500 and 600 seats.
Table II shows a group of restaurants that provided their total number of seats. They also provided the number of guests served, so the average daily seat turnover was calculated. The average number of seats for this sample is approximately 216 (1,940 seats divided by nine responses), and the median number of seats is 140 (the middle value of all respondents when responses are arranged sequentially). The average daily customers is 206, and the median is 200. With this information, the mean and median for the number of daily seat turnover can be calculated.
Understanding Medians And Means

11
© 2008 by the National Restaurant Association and Deloitte & Touche LLP
• The median daily seat turnover is 1.6 (the middle value of a sequential sort of Column 3).
• To compute the average daily seat turnover, divide the average daily customers served (Column 2) of 206 by the average number of seats per restaurant (Column 1) of 216. This gives the average daily seat turnover of approximately 1.0. The mean daily seat turnover is greatly influenced by the large restaurants with 500 and 600 seats with low daily seat turnover statistics, due perhaps to inclusion of seating for large banquet facilities.
As shown, median and means both have their uses, with medians not being affected by one or two responses that vary significantly from the rest of the sample. This is the main reason the accompanying studies report the data using medians.
* The numbers used for sample sizes are representative and are not actual sample sizes.
Understanding Medians*
Table INet Profit
Amount per Seat
Lower Quartile
Median Upper Quartile
Sales
Food $2,787 $2,163 $6,246
Beverage 555 1,091 2,254
Total Sales 3,381 5,197 7,788
Cost of Sales
Food 1,030 1,499 2,331
Beverage 139 306 587
Total Cost of Sales 1,154 1,877 2,637
Gross Profit 2,110 3,313 5,154
Other Income 13 41 113
Total Income $2,213 $3,446 $5,362
Note: Detail amounts do not sum to totals due to presentation of median values.
Table IIRestaurant Seating
Responding Restaurants
Column 1 Number of Seats
Column 2 Average Daily
Customers Served
Column 3 Average Daily Seat Turnover
(Column 2/Column 1)
Sequential Order of Column 3
A 60 90 1.5 3
B 80 128 1.6 4
C 100 200 2.0 9
D 120 204 1.7 6
E 140 250 1.8 7
F 160 290 1.8 8
G 180 290 1.6 5 Actual Median
H 500 200 0.4 2
I 600 200 0.3 1
Total 1,940 1,852 N/A
Median (middle value of column)
140 200 1.6 (ª)
Average (mean) 216 206 1.0
(ª) The median daily seat turnover is 1.6 (the middle value of a sequential sort of Column 3). Notice that this is not equal to the product of the median average daily customers served (200) divided by the median number of seats (140), which is 1.4. It is incorrect to use medians in calculations, such as addition or multiplication.

12
© 2008 by the National Restaurant Association and Deloitte & Touche LLP
Food salesThis category includes revenue derived from the sale of food in the restaurant. Food sales also include the sale of coffee, tea, milk and fruit juices, which usually are served as part of a meal. If there is no service of liquor, beer or wines, the soft drink sales also would be included in this category.
Beverage salesThis category includes revenue from the sale of wine, spirits, liqueurs, beer, and ale. These sales do not include coffee, tea, milk, or fruit juices, which normally are served with meals and, therefore, are considered food.
Prime costPrime cost is the total of the following: cost of food sold, cost of beverage sold and the associated payroll costs and employee benefit costs.
Salaries and wagesThis category includes the regular salaries and wages, extra wages, overtime, vacation pay and any commission or bonus payments made to employees. The entire restaurant payroll generally is included under this category.
Employee benefitsThis category includes federal retirement (Social Security) tax (FICA), federal and state unemployment taxes and state health insurance tax. Other items considered benefits are worker’s compensation insurance premiums, welfare plan payments, pension plan payments, accident and health insurance premiums and hospitalization, Blue Cross/Blue Shield and group insurance premiums. Also listed under employee benefits are education expenses, employee parties, employee sports activities, credit union, awards and prizes, and transportation and housing.
Direct operating expensesExpenses directly involved in providing service to the customer, such as uniforms, laundry, linen, china, and cleaning and paper supplies, are considered operating expenses. Also included are utensils, kitchen fuel, menus and drink lists, flowers and decorations, contract cleaning, auto or truck expense, parking, and licenses and permits.
MarketingThis group of expenses includes selling and promotion expenses, such as direct mail and entertainment costs in promotion of business (including gratis meals to customers). Also, the cost of advertising through newspapers, magazines or trade journals, outdoor signs, and radio and television is included. Public relations and publicity (including fees and commissions to advertising or promotional agencies) and royalties are found in this category.
Utility servicesThis section is composed of the costs of all fuel except that charged to direct operating expenses in the account “kitchen fuel.” Water, ice and refrigeration supplies, and the removal of waste are also included. The cost of oils, boiler compound, fuses, grease and other supplies, plus any small tools used in the operation or maintenance of the mechanical and electrical equipment, should also be charged to this account.
Restaurant occupancy costsRent, taxes and property insurance are occupancy costs. These are sometimes called “fixed charges,” since they usually are determined by the financial setup of the restaurant and usually not by the trend of its business.
Repairs and maintenanceThe following items are repairs and maintenance expenses: painting and decorating; plastering; upholstering; mending curtains; and maintenance contracts on elevators, signs and office machinery. Repairs to dining room furniture, refrigeration, air conditioning, buildings, floors, plumbing and heating are charged to this category as well. Repairs to dishwashing and sanitation equipment, kitchen equipment and office equipment are also included here.
General and administrative expensesThis group of expenses is commonly considered as overhead and includes items that are necessary to the operation of the business rather than those connected directly with the service and comfort of the customer. This account should be charged with the cost of all printed matter not devoted to advertising and promotion, such as accounting forms, account books, restaurant checks, office supplies, cash register and other checking supplies, letterheads, bills and envelopes. All postage, except amounts applicable to advertising, should be charged here. The cost of telephone equipment rental, local and long-distance calls should be charged to this account, with the exception of calls chargeable to marketing. Other items charged to this account are data processing costs, dues and subscriptions and insurance costs (other than those included as employee benefits or fire and extended coverage on the premises and contents). Commissions on credit card charges collection fees, cash shortages, professional dues and protective services are also considered general and administrative expenses.
Corporate overheadThis category consists of costs or fees charged or allocated by the central office or a management organization of a chain operation for executive supervision and management.
*Definitions and examples have been taken from “Uniform System of Accounts for Restaurants.”
Explanation Of Terms*

1�
© 2008 by the National Restaurant Association and Deloitte & Touche LLP
IntroductionThe 2007/2008 edition of the Restaurant Industry Operations Report is divided into four sections. Each section provides analysis on one of the following types of operations:
Section A: Full Service Restaurants (Average Check Per Person Under $15)
Section B: Full Service Restaurants (Average Check Per Person $15 to $24.99)
Section C: Full Service Restaurants (Average Check Per Person $25 and Over)
Section D: Limited Service Restaurants
Respondents were asked to select which of the above categories most closely represents their operation. The data in each section is presented in individual exhibits that characterize the operating statistics of various types of establishments based upon the tabulation of the actual survey responses. Each section provides financial, operational and performance information, for 2006, which is presented in the following breakdowns:
Type of Establishment (Food Only/Food and Beverage)
Affiliation (Single Unit/Multi-Unit)
Sales Volume
Menu Theme
Restaurant Location
Average Check
Profit Versus Loss
More than 700 restaurants throughout the United States responded to our survey, which forms the basis for this publication. A sample copy of the survey can be found at the end of this publication.
Explanatory NotesReaders should be aware that the operators who participated in this study are not identical with those who participated in prior years’ studies. This makes comparisons with previous data difficult, because reporting ratios can be vastly different. However, comparisons of the information in past reports may be useful in identifying certain financial trends.
As in previous years, medians and quartiles are used extensively in data presentation. Medians are the middle values of all amounts calculated for a particular item when placed in sequential order. Half of all values reported are below the median, and half are above. Readers should be aware that medians are calculated only from respondents reporting information for each individual line item.
To provide readers with a better understanding of the range of reported values, lower and upper quartiles are also presented. These are the midpoints of each group bounded by the median. In other words, the sample is broken into four equal parts when arranged in sequential order. The lower quartile divides the sample into the lowest quarter and higher three-quarters of the sample; the upper quartile divides the sample into the highest quarter and lower three-quarters of the sample. It is important to note that columns composed of medians and quartiles may not add to the totals shown in the exhibits of this report, because all participants did not respond to every line item.
Computations within each exhibit include respondents that provided zeros and numerical amounts.
By Steven Steinhauser Director, Restaurant Industry Practice Deloitte & Touche LLP 2 California Plaza 350 South Grand Avenue Los Angeles, California 90071 (213) 688-3231
Introduction To Analysis Of Data And Explanatory Notes

1�
© 2008 by the National Restaurant Association and Deloitte & Touche LLP
Exhibit A-1 presents the characteristics of the 223 respondents in the Full Service Restaurants (Average Check Per Person Under $15) category of this year’s study. Approximately three-fifths (60.5%) of the respondents represent independent restaurants and 57.9% reported that they were the sole occupant of their location. Restaurants with American menu themes represent 50.2% of this sample.
The median ratio of income before income taxes to total sales is 5.6% or $395 per seat.
Highlights• Median average check is $10.00.
• Median total sales per full-time equivalent employee is $47,543.
• Median food sales are $7,976 per seat and median beverage sales are $1,110 per seat.
• Median total sales per square foot is $281.
• Median income before income taxes is 5.6% of total sales.
• Median total cost of sales is 31.9% of total sales.
Characteristics• 60.5% of full service (average check under $15) restaurants are
single units, i.e., independents.
• 57.0% of the responding establishments have sales volume of $1,000,000 and over.
• 50.2% of the respondents report an American menu theme.
• 81.6% of the respondents operate their businesses in locations with less than 7,500 square feet and 69.0% of the respondents have less than 200 seats.
Section A-Full Service Restaurants (Average Check Per Person Under $15)

1�
© 2008 by the National Restaurant Association and Deloitte & Touche LLP
Exhibit A-1Composition of Participating Full Service Restaurants(Average Check Per Person Under $15)Number of Respondents: 223
Percentage of Respondents
Percentage of Respondents
Type of Establishment: Ownership:Food Only 38.1% Sole Proprietorship 16.6%Food and Beverage 61.9 Partnership 16.6
Public Corporation 4.5Years in Business: Private Corporation 61.91 to 5 Years 19.3% Not Specified 0.45 to 10 Years 16.1 Over 10 Years 64.6 Menu Theme:
Hamburger 9.9%Region: 1 Steak/Seafood 4.5Northeast 17.9% Pizza 1.8North Central 27.4 Sandwiches/Subs/Deli 4.1South 27.4 American (varied) 50.2West 25.1 Mexican 4.9Not Specified 2.2 Italian 4.0
Other 20.6Average Check: 2
Under $10.00 39.9% Sales Volume: 3
$10.00 to $14.99 60.1 Under $500,000 18.4%$500,000 to $999,999 24.6
Affiliation: $1,000,000 to $1,999,999 35.0Single Unit - Independent 60.5% $2,000,000 and Over 22.0Single Unit - Franchise Operated 6.3Multi-Unit - Company Operated 19.3 Restaurant Location:Multi-Unit - Franchise Operated 13.9 Hotel 2.7%
Shopping Center or Mall 21.5Profit versus Loss: 3 Sole Occupant 57.9Profit 76.9% Other 17.0Loss 23.1 Not Specified 0.9
Lease versus Own: Total Number of Seats:Own Land and Building 30.9% Under 100 30.5%Lease Land and Building 32.3 100 to 149 19.7Lease Land and Own Building 5.4 150 to 199 18.8Own Land and Lease Building 0.4 200 to 399 26.0Not Specified 31.0 400 and Over 3.2
Not Specified 1.8
Total Restaurant Square Footage:Under 2,500 21.5%2,500 to 4,999 32.75,000 to 7,499 27.47,500 and Over 15.7Not Specified 2.7
¹ Regions:
Northeast: CT, ME, MA, NH, NJ, NY, PA, RI, VT
North Central: IL, IN, IA, KS, MI, MN, MO, NE, ND, OH, SD, WI
South: AL, AR, DC, DE, FL, GA, KY, LA, MD, MS, OK, NC, SC, TN, TX, VA, WV
West: AK, AZ, CA, CO, HI, ID, MT, NV, NM, OR, UT, WA, WY
² Per person, all meals
³ For respondents specifying

1�
© 2008 by the National Restaurant Association and Deloitte & Touche LLP
Exhibit A-2Full Service Restaurants (Average Check Per Person Under $15)Average Check
Total
Lower Quartile Median
Upper Quartile
All Restaurants $8.00 $10.00 $12.00
Type of Establishment
Food Only $7.00 $8.00 $9.00
Food and Beverage 10.00 12.00 13.00
Restaurant Location
Hotel ** ** **
Shopping Center or Mall $7.75 $10.00 $12.00
Sole Occupant 8.00 10.00 12.00
Other 9.00 11.00 13.00
Profit versus Loss
Profit $8.00 $10.00 $12.00
Loss 9.00 10.00 12.50
Menu Theme
Hamburger $8.25 $11.00 $12.00
Steak/Seafood ** ** **
Pizza ** ** **
Sandwiches/Subs/Deli ** ** **
American (varied) 8.00 10.00 12.00
Mexican ** ** **
Italian ** ** **
Other 8.00 9.50 12.00
Affiliation
Single Unit - Independent $9.00 $10.00 $13.00
Single Unit - Franchise Operated ** ** **
Multi-Unit - Company Operated 7.00 10.00 12.00
Multi-Unit - Franchise Operated 8.50 9.00 11.00
Ownership
Sole Proprietorship $9.00 $12.00 $14.00
Partnership 9.00 10.00 12.00
Public Corporation ** ** **
Private Corporation 8.00 10.00 12.00
Sales Volume
Under $500,000 $7.00 $9.00 $12.00
$500,000 to $999,999 9.00 10.00 12.00
$1,000,000 to $1,999,999 8.00 10.00 13.00
$2,000,000 and Over 10.00 11.00 12.00
** Insufficient data

1�
© 2008 by the National Restaurant Association and Deloitte & Touche LLP
Exhibit A-3Full Service Restaurants (Average Check Per Person Under $15)Average Daily Seat Turnover
Total
Lower Quartile Median
Upper Quartile
All Restaurants 1.7 2.5 3.6
Type of Establishment
Food Only 1.8 2.6 4.4
Food and Beverage 1.5 2.5 3.2
Restaurant Location
Hotel ** ** **
Shopping Center or Mall 1.9 2.7 4.2
Sole Occupant 1.7 2.4 3.2
Other 1.5 2.5 3.6
Profit versus Loss
Profit 1.7 2.7 3.7
Loss 1.3 2.0 3.2
Menu Theme
Hamburger 2.2 2.8 3.2
Steak/Seafood ** ** **
Pizza ** ** **
Sandwiches/Subs/Deli ** ** **
American (varied) 1.4 2.2 3.2
Mexican ** ** **
Asian ** ** **
Italian ** ** **
Other 2.1 2.7 3.9
Average Check
Under $10.00 1.9 2.7 4.7
$10.00 to $14.99 1.3 2.4 3.2
Affiliation
Single Unit - Independent 1.4 2.1 3.2
Single Unit - Franchise Operated ** ** **
Multi-Unit - Company Operated 1.7 2.7 4.2
Multi-Unit - Franchise Operated 2.3 2.8 3.6
Ownership
Sole Proprietorship 1.4 2.1 2.8
Partnership 1.2 1.8 2.7
Public Corporation ** ** **
Private Corporation 1.7 2.7 3.9
Sales Volume
Under $500,000 0.7 1.3 2.4
$500,000 to $999,999 1.3 2.2 2.9
$1,000,000 to $1,999,999 1.8 2.5 3.7
$2,000,000 and Over 2.7 3.2 4.0
** Insufficient data

1�
© 2008 by the National Restaurant Association and Deloitte & Touche LLP
Exhibit A-4Full Service Restaurants (Average Check Per Person Under $15)Cost per Dollar of Sales*
Total Cost of Sales
Total Payroll and Benefits Prime Cost
All Restaurants 31.9¢ 32.5¢ 65.1¢
Type of Establishment
Food Only 33.3¢ 33.6¢ 66.6¢
Food and Beverage 31.5 31.7 63.6
Restaurant Location
Hotel ** ** **
Shopping Center or Mall 31.9¢ 32.0¢ 64.6¢
Sole Occupant 32.0 32.1 63.9
Other 32.1 35.5 68.7
Profit versus Loss
Profit 31.8¢ 31.1¢ 63.3¢
Loss 33.6 39.3 70.1
Menu Theme
Hamburger ** 31.7¢ **
Steak/Seafood ** ** **
Pizza ** ** **
Sandwiches/Subs/Deli ** ** **
American (varied) 32.4¢ 34.0 67.2¢
Mexican ** ** **
Italian ** ** **
Other 31.3 33.4 64.0
Average Check
Under $10.00 33.2¢ 32.8¢ 65.3¢
$10.00 to $14.99 31.6 32.2 64.4
Affiliation
Single Unit - Independent 32.1¢ 34.4¢ 67.5¢
Single Unit - Franchise Operated ** ** **
Multi-Unit - Company Operated 31.9 34.6 64.1
Multi-Unit - Franchise Operated 29.9 31.5 62.2
Ownership
Sole Proprietorship 33.1¢ 31.2¢ 64.5¢
Partnership 33.2 30.6 65.3
Public Corporation ** ** **
Private Corporation 31.3 33.1 64.9
Sales Volume
Under $500,000 ** ** 68.1¢
$500,000 to $999,999 33.2¢ 33.6¢ 68.5
$1,000,000 to $1,999,999 31.9 31.1 64.0
$2,000,000 and Over 29.0 33.0 61.9
* All amounts are medians** Insufficient data

1�
© 2008 by the National Restaurant Association and Deloitte & Touche LLP
Exhibit A-5Full Service Restaurants (Average Check Per Person Under $15)Number of Employees*
Number of Employees per Restaurant
Full TimePart Time
(20-34 Hours)
Part-Part-Time (Under 20
Hours)
All Restaurants 10 14 6
Type of Establishment
Food Only 9 9 5
Food and Beverage 11 15 8
Restaurant Location
Hotel ** ** **
Shopping Center or Mall 13 10 5
Sole Occupant 10 16 10
Other 10 12 6
Profit versus Loss
Profit 11 14 7
Loss 8 15 6
Menu Theme
Hamburger 13 23 43
Steak/Seafood ** ** **
Pizza ** ** **
Sandwiches/Subs/Deli ** ** **
American (varied) 10 15 6
Mexican ** ** **
Italian ** ** **
Other 9 7 5
Average Check
Under $10.00 9 9 5
$10.00 to $14.99 12 15 10
Affiliation
Single Unit - Independent 8 12 6
Single Unit - Franchise Operated ** ** **
Multi-Unit - Company Operated 19 ** 4
Multi-Unit - Franchise Operated 13 22 23
Ownership
Sole Proprietorship 6 12 7
Partnership 11 20 12
Public Corporation ** ** **
Private Corporation 11 13 5
Sales Volume
Under $500,000 3 7 3
$500,000 to $999,999 6 9 5
$1,000,000 to $1,999,999 13 15 10
$2,000,000 and Over 26 25 20
* All amounts are medians
** Insufficient data

20
© 2008 by the National Restaurant Association and Deloitte & Touche LLP
Exhibit A-6Full Service Restaurants (Average Check Per Person Under $15)Annual Employee Turnover*
All Employees
Salaried Employees
Hourly Employees
All Restaurants 82% 37% 89%
Type of Establishment
Food Only 79% 27% 86%
Food and Beverage 84 50 90
Restaurant Location
Hotel ** ** **
Shopping Center or Mall 76% 31% 92%
Sole Occupant 91 50 100
Other 63 ** 67
Profit versus Loss
Profit 76% 33% 85%
Loss 94 67 100
Menu Theme
Hamburger 126% 60% 128%
Steak/Seafood ** ** **
Pizza ** ** **
Sandwiches/Subs/Deli ** ** **
American (varied) 76 33 86
Mexican ** ** **
Italian ** ** **
Other 115 33 125
Average Check
Under $10.00 83% 25% 90%
$10.00 to $14.99 81 50 89
Affiliation
Single Unit - Independent 63% ** 70%
Single Unit - Franchise Operated ** ** **
Multi-Unit - Company Operated 88 50% 91
Multi-Unit - Franchise Operated 136 67 139
Ownership
Sole Proprietorship 95% 25% 100%
Partnership 85 67 100
Public Corporation ** ** **
Private Corporation 81 33 88
Sales Volume
Under $500,000 ** ** **
$500,000 to $999,999 67% ** 76%
$1,000,000 to $1,999,999 84 50% 85
$2,000,000 and Over 89 50 104
* Amounts for all employees and hourly employees are medians; amounts for salaried employees are upper quartiles.
All amounts are derived from the number of W-2’s and the number of employees
** Insufficient data

21
© 2008 by the National Restaurant Association and Deloitte & Touche LLP
Exhibit A-7Full Service Restaurants (Average Check Per Person Under $15)Employee Information*
Full-Time Equivalent EmployeesAmount per Full-Time Equivalent Employee
TotalPer 100
Restaurant SeatsPer 100 Average
Daily Covers Total SalesTotal Payroll and Benefits
All Restaurants 25.5 19.2 7.7 $47,543 $15,843
Type of Establishment
Food Only 22.3 18.4 6.6 $44,729 $14,764
Food and Beverage 26.4 19.6 8.5 50,766 16,481
Restaurant Location
Hotel ** ** ** ** **
Shopping Center or Mall 25.6 21.0 8.2 $46,407 $15,776
Sole Occupant 27.0 19.0 7.6 47,543 15,447
Other 20.2 18.3 7.7 48,564 16,837
Profit versus Loss
Profit 25.4 20.1 7.7 $48,592 $15,730
Loss 25.8 18.3 8.3 42,642 16,276
Menu Theme
Hamburger 45.6 23.2 7.8 $52,239 $16,913
Steak/Seafood ** ** ** ** **
Pizza ** ** ** ** **
Sandwiches/Subs/Deli ** ** ** ** **
American (varied) 27.5 18.0 7.4 46,216 15,370
Mexican ** ** ** ** **
Italian ** ** ** ** **
Other 15.4 18.6 7.3 49,532 16,843
Average Check
Under $10.00 21.9 18.3 6.3 $46,525 $15,145
$10.00 to $14.99 28.6 20.0 9.1 48,845 16,204
Affiliation
Single Unit - Independent 21.9 18.5 7.6 $46,198 $16,056
Single Unit - Franchise Operated ** ** ** ** **
Multi-Unit - Company Operated 38.5 22.4 9.2 44,843 15,674
Multi-Unit - Franchise Operated 43.0 21.9 7.3 51,341 15,911
Ownership
Sole Proprietorship 18.5 17.6 8.8 $45,892 $15,447
Partnership 31.0 18.0 7.7 48,789 15,572
Public Corporation ** ** ** ** **
Private Corporation 24.6 20.3 7.6 47,426 15,911
Sales Volume
Under $500,000 8.7 11.9 8.9 $33,854 **
$500,000 to $999,999 15.9 18.0 8.1 46,525 $16,172
$1,000,000 to $1,999,999 29.5 19.2 7.4 47,426 15,616
$2,000,000 and Over 55.8 23.9 7.6 52,337 17,013
* All amounts are medians. Based on 35 hours per week. Factors used to compute full-time equivalent employees are as follows: full-time (35 hours or more) equals 1.0; part-time (20-34 hours) equals 0.7; part-part-time (less than 20 hours) equals 0.35
** Insufficient data

22
© 2008 by the National Restaurant Association and Deloitte & Touche LLP
Exhibit A-8Full Service Restaurants (Average Check Per Person Under $15)Take-Out/Drive Through, Outside Catering andBanquet Service - Ratio to Total Sales*
Take-Out/ Drive Through
Outside Catering
Banquet Service
All Restaurants 7% 5% 5%
Type of Establishment
Food Only 10% 5% 2%
Food and Beverage 6 3 5
Restaurant Location
Hotel ** ** **
Shopping Center or Mall 10% ** **
Sole Occupant 6 5% 5%
Other 7 ** **
Profit versus Loss
Profit 8% 3% 5%
Loss 6 ** 4
Menu Theme
Hamburger ** ** **
Steak/Seafood ** ** **
Pizza ** ** **
Sandwiches/Subs/Deli ** ** **
American (varied) 5% 4% 5%
Mexican ** ** **
Italian ** ** **
Other ** ** **
Average Check
Under $10.00 9% 5% 2%
$10.00 to $14.99 7 3 5
Affiliation
Single Unit - Independent 10% 5% 5%
Single Unit - Franchise Operated ** ** **
Multi-Unit - Company Operated 10 5 **
Multi-Unit - Franchise Operated 5 ** **
Ownership
Sole Proprietorship 11% ** **
Partnership 5 ** 2%
Public Corporation ** ** **
Private Corporation 7 5% 5
Sales Volume
Under $500,000 9% ** **
$500,000 to $999,999 10 ** **
$1,000,000 to $1,999,999 7 3% 2%
$2,000,000 and Over 6 ** **
* All amounts are medians
** Insufficient data

2�
© 2008 by the National Restaurant Association and Deloitte & Touche LLP
Exhibit A-9Full Service Restaurants (Average Check Per Person Under $15)Statement of Income and Expenses
All Restaurants
Amount per Seat Ratio to Total Sales*
Lower Quartile Median
Upper Quartile
Lower Quartile Median
Upper Quartile
Sales
Food $4,444 $7,976 $11,839 81.2% 95.7% 100.0%
Beverage 518 1,110 2,602 4.6 11.1 27.3
Total Sales 5,611 9,199 13,610 100.0 100.0 100.0
Cost of Sales
Food 1,571 2,579 3,584 28.9 33.0 37.2
Beverage 135 279 752 24.7 28.0 34.0
Total Cost of Sales 1,906 2,803 4,044 28.6 31.9 35.5
Gross Profit 3,589 6,133 9,522 64.5 68.0 71.4
Operating Expenses
Salaries and Wages (including Employee Benefits) 1,897 3,300 4,364 28.4 32.5 37.8
Direct Operating Expenses 244 580 1,122 3.9 6.3 10.2
Music and Entertainment 4 16 86 0.0 0.1 1.0
Marketing 64 146 313 0.9 2.0 3.8
Utility Services 229 327 482 2.9 3.8 5.0
Restaurant Occupancy Costs 271 528 857 4.0 6.0 8.3
Repairs and Maintenance 80 138 218 1.1 1.6 2.4
Depreciation 81 148 322 0.9 1.8 3.7
Other Expense/(Income) (62) 51 350 (0.6) 0.6 5.2
General & Administrative Expenses 123 248 476 1.6 3.2 5.4
Corporate Overhead 158 248 492 1.6 3.0 4.7
Total Operating Expenses 3,157 5,385 8,354 52.5 60.9 67.7
Interest Expense 29 109 215 0.3 1.2 2.6
Other Expenses 20 89 249 0.3 1.0 2.2
Income (Loss) Before Income Taxes $23 $395 $1,091 0.3% 5.6% 12.4%
Note: Computations include respondents that provided zeros and numerical amounts
* All ratios are based as a percentage of total sales except food and beverage costs, which are based on their respective sales

2�
© 2008 by the National Restaurant Association and Deloitte & Touche LLP
Exhibit A-10Full Service Restaurants (Average Check Per Person Under $15)Statement of Income and Expenses - Amount per Square Foot*
All Restaurants Type of Establishment Menu Theme Menu Theme Average Check Restaurant Location Sales Volume ($000s)
Lower Quartile Median
Upper Quartile Food Only
Food and Beverage Hamburger
Steak/ Seafood Pizza
Sandwiches/Subs/Deli
American (varied) Mexican Italian Other
Under $10.00
$10.00 to$14.99 Hotel Other
Shopping Center or Mall
Sole Occupant
Under $500
$500 to $999
$1,000 to $1,999
$2,000 and Over
Sales
Food $155.43 $259.38 $363.64 $237.50 $272.64 $368.36 ** ** ** $243.71 ** ** $264.90 $247.55 $271.96 ** $230.20 $233.33 $271.11 $118.73 $214.40 $272.98 $356.44
Beverage 8.70 31.61 73.90 N/A 36.29 ** ** ** ** 42.00 ** ** 28.73 ** 37.72 ** 40.17 20.12 33.16 ** 18.96 50.00 32.69
Total Sales 176.88 280.50 421.91 237.50 315.15 399.91 ** ** ** 269.28 ** ** 271.67 250.63 314.65 ** 258.47 265.49 295.38 125.72 241.07 311.74 427.86
Gross Profit on Sales 108.44 190.74 294.34 151.93 218.82 286.29 ** ** ** 179.68 ** ** 203.23 171.33 216.44 ** 180.42 184.28 203.82 83.71 161.11 210.12 300.10
Utility Services 7.06 10.27 14.29 9.40 11.48 18.55 ** ** ** 10.17 ** ** 10.42 9.75 11.54 ** 8.85 10.09 10.98 6.63 9.44 11.28 14.54
Restaurant Occupancy Costs 9.23 16.32 24.21 14.44 17.46 ** ** ** ** 14.76 ** ** 19.20 16.03 16.52 ** 15.28 15.38 16.33 10.00 13.16 16.76 21.27
Note: Computations include respondents that provided zeros and numerical amounts
* All amounts are medians unless otherwise stated
** Insufficient data
N/A Not applicable

2�
© 2008 by the National Restaurant Association and Deloitte & Touche LLP
Exhibit A-11Full Service Restaurants (Average Check Per Person Under $15)Statement of Income and Expenses - Amount per Seat
Type of Establishment
Food Only Food and Beverage
Lower Quartile Median
Upper Quartile
Lower Quartile Median
Upper Quartile
Sales
Food $5,392 $8,345 $12,351 $4,120 $7,904 $11,771
Beverage N/A N/A N/A 513 1,122 2,635
Total Sales 5,392 8,345 12,351 5,665 10,000 13,640
Cost of Sales
Food 1,862 2,588 3,872 1,444 2,563 3,444
Beverage N/A N/A N/A 134 280 754
Total Cost of Sales 1,862 2,588 3,872 1,957 2,904 4,139
Gross Profit 3,496 5,702 8,753 3,755 6,371 9,925
Operating Expenses
Salaries and Wages (including Employee Benefits) 1,826 2,995 4,223 2,138 3,557 4,413
Direct Operating Expenses 197 479 1,065 275 609 1,127
Music and Entertainment 0 3 10 2 11 118
Marketing 54 147 318 64 134 297
Utility Services 213 292 450 235 337 491
Restaurant Occupancy Costs 253 507 873 257 528 816
Repairs and Maintenance 69 130 214 81 143 217
Depreciation 59 133 322 87 154 277
Other Expense/(Income) (48) 16 239 (66) 40 347
General & Administrative Expenses 97 229 476 116 246 457
Corporate Overhead 99 196 275 0 110 397
Total Operating Expenses 2,915 4,874 8,269 3,397 5,615 8,376
Interest Expense 17 83 150 9 76 215
Other Expenses 1 24 130 0 3 162
Income (Loss) Before Income Taxes $11 $334 $936 $23 $469 $1,213
Note: Computations include respondents that provided zeros and numerical amounts
** Insufficient data
N/A Not applicable

2�
© 2008 by the National Restaurant Association and Deloitte & Touche LLP
Exhibit A-12Full Service Restaurants (Average Check Per Person Under $15)Statement of Income and Expenses - Ratio to Total Sales*
Type of Establishment
Food Only Food and Beverage
Lower Quartile Median
Upper Quartile
Lower Quartile Median
Upper Quartile
Sales
Food 100.0% 100.0% 100.0% 71.5% 86.8% 93.8%
Beverage N/A N/A N/A 6.2 13.2 28.5
Total Sales 100.0 100.0 100.0 100.0 100.0 100.0
Cost of Sales
Food 29.8 33.3 36.8 28.7 32.5 37.7
Beverage N/A N/A N/A 24.6 28.0 34.0
Total Cost of Sales 29.8 33.3 36.8 28.1 31.5 35.1
Gross Profit 63.2 66.7 70.2 64.9 68.5 71.9
Operating Expenses
Salaries and Wages (includeing Employee Benefits) 29.0 33.6 39.6 27.7 31.7 37.4
Direct Operating Expenses 3.0 5.6 9.2 4.3 6.6 10.3
Music and Entertainment 0.0 0.0 0.1 0.0 0.1 1.1
Marketing 0.8 1.5 3.5 0.9 1.9 4.3
Utility Services 2.8 3.7 4.9 2.9 3.9 4.9
Restaurant Occupancy Costs 4.3 6.2 8.5 3.2 5.4 7.9
Repairs and Maintenance 1.0 1.6 2.1 1.1 1.6 2.4
Depreciation 0.8 1.7 3.2 0.7 1.8 4.1
Other Expense/(Income) (0.7) 0.2 4.2 (0.5) 0.5 4.4
General & Administrative Expenses 1.1 3.8 6.0 1.7 2.6 5.0
Corporate Overhead 1.1 2.7 4.5 0.0 0.9 3.1
Total Operating Expenses 50.4 60.7 67.1 53.3 61.1 67.8
Interest Expense 0.2 0.9 2.2 0.1 0.9 2.3
Other Expenses 0.0 0.3 1.3 0.0 0.0 1.6
Income (Loss) Before Income Taxes 0.2% 5.4% 12.8% 0.3% 5.5% 11.4%
Note: Computations include respondents that provided zeros and numerical amounts
* All ratios are based as a percentage of total sales except food and beverage costs, which are based on their respective sales
N/A Not applicable

2�
© 2008 by the National Restaurant Association and Deloitte & Touche LLP
Exhibit A-13Full Service Restaurants (Average Check Per Person Under $15)Statement of Income and Expenses - Amount per Seat
Affiliation
Single Unit - Independent Multi-Unit - Company Operated Multi-Unit - Franchise Operated
Lower Quartile Median
Upper Quartile
Lower Quartile Median
Upper Quartile
Lower Quartile Median
Upper Quartile
Sales
Food $3,600 $7,638 $11,111 $4,500 $9,500 $12,424 $7,850 $10,558 $12,994
Beverage 250 1,049 2,500 514 1,558 2,869 ** ** **
Total Sales 5,000 8,395 12,374 5,402 10,300 14,928 8,361 11,070 14,024
Cost of Sales
Food 1,345 2,412 3,371 1,479 2,879 4,263 2,286 2,835 3,396
Beverage 101 278 724 100 492 873 ** ** **
Total Cost of Sales 1,864 2,652 3,932 1,560 3,188 4,933 2,412 2,993 3,427
Gross Profit 3,314 5,629 8,709 3,573 7,083 10,653 5,242 7,875 10,485
Operating Expenses
Salaries and Wages (including Employee Benefits) 1,667 3,192 4,188 2,471 3,981 5,008 2,501 3,777 4,286
Direct Operating Expenses 228 531 1,088 318 585 1,150 202 798 949
Music and Entertainment 0 11 74 0 16 146 2 3 4
Marketing 52 110 255 63 117 237 229 438 899
Utility Services 206 314 423 234 327 567 284 458 589
Restaurant Occupancy Costs 185 479 816 311 571 739 469 598 1,442
Repairs and Maintenance 71 133 216 79 159 324 93 138 168
Depreciation 53 125 271 54 153 269 123 250 552
Other Expense/(Income) 0 96 515 (30) 107 314 (83) (69) (51)
General & Administrative Expenses 84 188 461 119 277 646 230 260 371
Corporate Overhead 0 158 391 ** ** ** ** ** **
Total Operating Expenses 2,778 4,881 7,188 2,914 5,013 8,723 4,861 8,014 9,018
Interest Expense 9 93 177 31 60 239 14 46 216
Other Expenses 0 20 166 ** ** ** ** ** **
Income (Loss) Before Income Taxes $8 $300 $938 $89 $626 $1,460 $62 $644 $1,352
Note: Computations include respondents that provided zeros and numerical amounts
** Insufficient data

2�
© 2008 by the National Restaurant Association and Deloitte & Touche LLP
Exhibit A-14Full Service Restaurants (Average Check Per Person Under $15)Statement of Income and Expenses - Ratio to Total Sales*
Affiliation
Single Unit - Independent Multi-Unit - Company Operated Multi-Unit - Franchise Operated
Lower Quartile Median
Upper Quartile
Lower Quartile Median
Upper Quartile
Lower Quartile Median
Upper Quartile
Sales
Food 69.0% 87.2% 96.0% 74.7% 88.3% 95.1% 92.3% 93.3% 94.2%
Beverage 4.0 12.8 31.0 4.9 11.7 25.3 ** ** **
Total Sales 100.0 100.0 100.0 100.0 100.0 100.0 100.0 100.0 100.0
Cost of Sales
Food 29.9 33.3 38.5 30.0 33.3 35.8 22.6 30.0 34.5
Beverage 25.4 29.1 34.8 ** ** ** ** ** **
Total Cost of Sales 29.6 32.1 37.1 28.1 31.9 34.6 22.4 29.9 34.5
Gross Profit 62.9 67.9 70.5 65.4 68.1 71.9 65.5 70.1 77.6
Operating Expenses
Salaries and Wages (including Employee Benefits) 27.9 34.4 38.3 27.7 34.6 39.0 29.7 31.5 33.0
Direct Operating Expenses 4.0 5.9 11.2 4.0 6.3 9.3 3.4 6.6 7.5
Music and Entertainment 0.0 0.1 0.9 0.0 0.1 1.1 0.0 0.0 0.0
Marketing 0.7 1.5 3.0 0.6 1.7 2.6 3.3 4.2 7.0
Utility Services 2.8 3.7 5.0 2.6 3.5 5.0 3.6 4.1 4.9
Restaurant Occupancy Costs 3.1 5.3 7.9 3.0 5.0 7.8 5.7 7.6 9.5
Repairs and Maintenance 1.0 1.6 2.3 1.2 1.7 2.6 1.0 1.4 1.8
Depreciation 0.6 1.5 3.0 0.8 1.7 3.7 1.7 2.3 4.9
Other Expense/(Income) 0.0 0.3 1.7 ** ** ** ** ** **
General & Administrative Expenses 1.1 2.5 4.9 1.1 4.1 5.3 1.8 2.8 6.0
Corporate Overhead 0.0 1.5 4.0 ** ** ** ** ** **
Total Operating Expenses 51.6 59.3 67.6 50.1 60.9 67.0 60.8 62.5 67.9
Interest Expense 0.1 1.1 2.4 0.2 0.7 1.8 0.1 0.7 2.1
Other Expenses 0.0 0.3 1.7 ** ** ** ** ** **
Income (Loss) Before Income Taxes 0.2% 5.3% 12.8% 1.1% 6.0% 11.5% 1.3% 5.5% 11.0%
Note: Computations include respondents that provided zeros and numerical amounts
* All ratios are based as a percentage of total sales except food and beverage costs, which are based on their respective sales
** Insufficient data

�0
© 2008 by the National Restaurant Association and Deloitte & Touche LLP
Exhibit A-15Full Service Restaurants (Average Check Per Person Under $15)Statement of Income and Expenses - Amount per Seat
Sales Volume ($000) Sales Volume ($000)
Under $500 Between $500 and $999 Between $1,000 and $1,999 $2,000 and Over
Lower Quartile Median
Upper Quartile
Lower Quartile Median
Upper Quartile
Lower Quartile Median
Upper Quartile
Lower Quartile Median
Upper Quartile
Sales
Food $2,255 $3,333 $6,241 $3,813 $7,043 $9,561 $5,714 $7,904 $12,133 $10,368 $11,652 $13,738
Beverage ** ** ** 206 725 2,041 546 1,667 2,500 613 1,001 2,785
Total Sales 2,317 3,502 6,570 5,247 7,370 9,997 6,429 9,899 12,719 10,904 13,648 15,834
Cost of Sales
Food 739 1,200 2,446 1,371 2,213 2,774 1,987 2,773 3,582 2,664 3,303 3,959
Beverage ** ** ** 59 190 515 210 522 767 155 226 866
Total Cost of Sales 792 1,258 2,532 1,935 2,280 2,990 2,173 3,088 4,153 2,845 3,640 4,610
Gross Profit 1,504 2,189 4,160 3,291 5,000 7,101 4,120 6,419 9,382 7,739 9,961 11,378
Operating Expenses
Salaries and Wages (including Employee Benefits) ** ** ** 1,561 3,040 3,500 2,079 3,097 3,966 3,800 4,325 5,347
Direct Operating Expenses 122 209 569 175 453 1,011 258 563 1,099 590 909 1,212
Music and Entertainment ** ** ** 1 11 49 2 8 63 1 4 17
Marketing 30 90 241 53 91 189 94 177 312 111 256 753
Utility Services 135 204 292 230 310 354 235 339 450 324 495 597
Restaurant Occupancy Costs 123 253 814 188 486 726 263 496 793 497 686 1,318
Repairs and Maintenance 34 60 103 59 116 177 112 154 249 144 205 301
Depreciation 58 138 859 27 111 212 64 140 233 121 215 457
Other Expense/(Income) ** ** ** 0 51 485 (34) 119 470 (92) (67) 0
General & Administrative Expenses 74 141 192 61 160 467 152 296 466 191 253 524
Corporate Overhead ** ** ** ** ** ** 129 211 286 0 196 626
Total Operating Expenses 1,156 1,992 3,578 2,778 4,399 6,262 3,917 5,359 8,205 6,327 8,351 9,874
Interest Expense ** ** ** 3 82 149 14 55 159 17 120 336
Other Expenses ** ** ** ** ** ** 2 20 214 0 2 94
Income (Loss) Before Income Taxes ($143) $205 $504 $9 $339 $961 $6 $471 $1,218 $160 $827 $1,592
Note: Computations include respondents that provided zeros and numerical amounts
** Insufficient data

�1
© 2008 by the National Restaurant Association and Deloitte & Touche LLP
Exhibit A-15Full Service Restaurants (Average Check Per Person Under $15)Statement of Income and Expenses - Amount per Seat
Sales Volume ($000) Sales Volume ($000)
Under $500 Between $500 and $999 Between $1,000 and $1,999 $2,000 and Over
Lower Quartile Median
Upper Quartile
Lower Quartile Median
Upper Quartile
Lower Quartile Median
Upper Quartile
Lower Quartile Median
Upper Quartile
Sales
Food $2,255 $3,333 $6,241 $3,813 $7,043 $9,561 $5,714 $7,904 $12,133 $10,368 $11,652 $13,738
Beverage ** ** ** 206 725 2,041 546 1,667 2,500 613 1,001 2,785
Total Sales 2,317 3,502 6,570 5,247 7,370 9,997 6,429 9,899 12,719 10,904 13,648 15,834
Cost of Sales
Food 739 1,200 2,446 1,371 2,213 2,774 1,987 2,773 3,582 2,664 3,303 3,959
Beverage ** ** ** 59 190 515 210 522 767 155 226 866
Total Cost of Sales 792 1,258 2,532 1,935 2,280 2,990 2,173 3,088 4,153 2,845 3,640 4,610
Gross Profit 1,504 2,189 4,160 3,291 5,000 7,101 4,120 6,419 9,382 7,739 9,961 11,378
Operating Expenses
Salaries and Wages (including Employee Benefits) ** ** ** 1,561 3,040 3,500 2,079 3,097 3,966 3,800 4,325 5,347
Direct Operating Expenses 122 209 569 175 453 1,011 258 563 1,099 590 909 1,212
Music and Entertainment ** ** ** 1 11 49 2 8 63 1 4 17
Marketing 30 90 241 53 91 189 94 177 312 111 256 753
Utility Services 135 204 292 230 310 354 235 339 450 324 495 597
Restaurant Occupancy Costs 123 253 814 188 486 726 263 496 793 497 686 1,318
Repairs and Maintenance 34 60 103 59 116 177 112 154 249 144 205 301
Depreciation 58 138 859 27 111 212 64 140 233 121 215 457
Other Expense/(Income) ** ** ** 0 51 485 (34) 119 470 (92) (67) 0
General & Administrative Expenses 74 141 192 61 160 467 152 296 466 191 253 524
Corporate Overhead ** ** ** ** ** ** 129 211 286 0 196 626
Total Operating Expenses 1,156 1,992 3,578 2,778 4,399 6,262 3,917 5,359 8,205 6,327 8,351 9,874
Interest Expense ** ** ** 3 82 149 14 55 159 17 120 336
Other Expenses ** ** ** ** ** ** 2 20 214 0 2 94
Income (Loss) Before Income Taxes ($143) $205 $504 $9 $339 $961 $6 $471 $1,218 $160 $827 $1,592
Note: Computations include respondents that provided zeros and numerical amounts
** Insufficient data

�2
© 2008 by the National Restaurant Association and Deloitte & Touche LLP
Exhibit A-16Full Service Restaurants (Average Check Per Person Under $15)Statement of Income and Expenses - Ratio to Total Sales*
Sales Volume ($000) Sales Volume ($000)
Under $500 Between $500 and $999 Between $1,000 and $1,999 $2,000 and Over
Lower Quartile Median
Upper Quartile
Lower Quartile Median
Upper Quartile
Lower Quartile Median
Upper Quartile
Lower Quartile Median
Upper Quartile
Sales
Food 71.7% 90.6% 97.4% 65.8% 86.1% 96.6% 73.6% 87.0% 94.4% 80.2% 91.5% 94.3%
Beverage ** ** ** 3.4 13.9 34.2 5.6 13.0 26.4 5.7 8.5 19.8
Total Sales 100.0 100.0 100.0 100.0 100.0 100.0 100.0 100.0 100.0 100.0 100.0 100.0
Cost of Sales
Food 32.1 35.8 43.6 29.2 33.8 41.2 30.0 33.2 35.8 22.9 30.3 32.6
Beverage ** ** ** 25.8 28.7 34.1 25.5 29.1 34.1 20.0 25.1 30.0
Total Cost of Sales 30.9 35.4 43.8 29.3 33.2 38.4 29.9 31.9 35.2 24.3 29.0 32.2
Gross Profit 56.3 64.6 69.1 61.6 66.8 70.7 64.8 68.0 70.1 67.8 71.0 75.7
Operating Expenses
Salaries and Wages (including Employee Benefits) 22.4 29.8 37.0 29.0 33.6 38.3 28.3 31.1 37.0 30.1 33.0 38.1
Direct Operating Expenses 4.4 6.5 10.3 3.2 5.9 10.9 3.3 5.2 9.9 4.5 6.7 9.2
Music and Entertainment ** ** ** 0.0 0.1 0.8 0.0 0.1 0.6 0.0 0.0 0.1
Marketing 1.1 2.5 4.6 0.7 1.3 2.5 0.9 1.9 3.4 0.8 2.3 6.0
Utility Services 3.2 4.9 7.3 2.9 3.7 4.7 2.8 3.3 4.6 2.9 3.7 4.7
Restaurant Occupancy Costs 2.4 5.7 12.1 3.2 6.0 8.0 3.7 5.6 7.8 4.3 5.8 7.9
Repairs and Maintenance 0.7 1.6 2.2 1.0 1.3 1.9 1.1 1.7 2.4 1.2 1.7 2.5
Depreciation 1.3 3.9 5.4 0.5 1.5 3.5 0.7 1.6 2.6 1.1 1.8 3.1
Other Expense/(Income) ** ** ** 0.0 0.7 6.0 (0.4) 1.2 5.2 (0.8) (0.5) 0.0
General & Administrative Expenses 1.5 4.0 5.3 1.0 2.6 5.3 1.7 3.2 5.7 1.3 2.0 4.1
Corporate Overhead ** ** ** ** ** ** 1.0 2.4 4.0 0.0 2.3 3.9
Total Operating Expenses 48.2 54.7 68.6 50.5 60.5 67.1 53.5 60.9 66.9 58.4 63.4 68.3
Interest Expense 0.8 2.6 3.7 0.1 0.9 2.2 0.1 0.7 1.7 0.1 1.1 2.3
Other Expenses ** ** ** ** ** ** 0.0 0.3 1.9 0.0 0.0 0.8
Income (Loss) Before Income Taxes (4.5%) 6.0% 12.8% 0.1% 5.1% 12.2% 0.1% 4.7% 11.1% 1.5% 6.9% 11.4%
Note: Computations include respondents that provided zeros and numerical amounts
* All ratios are based as a percentage of total sales except food and beverage costs, which are based on their respective sales
** Insufficient data

��
© 2008 by the National Restaurant Association and Deloitte & Touche LLP
Exhibit A-16Full Service Restaurants (Average Check Per Person Under $15)Statement of Income and Expenses - Ratio to Total Sales*
Sales Volume ($000) Sales Volume ($000)
Under $500 Between $500 and $999 Between $1,000 and $1,999 $2,000 and Over
Lower Quartile Median
Upper Quartile
Lower Quartile Median
Upper Quartile
Lower Quartile Median
Upper Quartile
Lower Quartile Median
Upper Quartile
Sales
Food 71.7% 90.6% 97.4% 65.8% 86.1% 96.6% 73.6% 87.0% 94.4% 80.2% 91.5% 94.3%
Beverage ** ** ** 3.4 13.9 34.2 5.6 13.0 26.4 5.7 8.5 19.8
Total Sales 100.0 100.0 100.0 100.0 100.0 100.0 100.0 100.0 100.0 100.0 100.0 100.0
Cost of Sales
Food 32.1 35.8 43.6 29.2 33.8 41.2 30.0 33.2 35.8 22.9 30.3 32.6
Beverage ** ** ** 25.8 28.7 34.1 25.5 29.1 34.1 20.0 25.1 30.0
Total Cost of Sales 30.9 35.4 43.8 29.3 33.2 38.4 29.9 31.9 35.2 24.3 29.0 32.2
Gross Profit 56.3 64.6 69.1 61.6 66.8 70.7 64.8 68.0 70.1 67.8 71.0 75.7
Operating Expenses
Salaries and Wages (including Employee Benefits) 22.4 29.8 37.0 29.0 33.6 38.3 28.3 31.1 37.0 30.1 33.0 38.1
Direct Operating Expenses 4.4 6.5 10.3 3.2 5.9 10.9 3.3 5.2 9.9 4.5 6.7 9.2
Music and Entertainment ** ** ** 0.0 0.1 0.8 0.0 0.1 0.6 0.0 0.0 0.1
Marketing 1.1 2.5 4.6 0.7 1.3 2.5 0.9 1.9 3.4 0.8 2.3 6.0
Utility Services 3.2 4.9 7.3 2.9 3.7 4.7 2.8 3.3 4.6 2.9 3.7 4.7
Restaurant Occupancy Costs 2.4 5.7 12.1 3.2 6.0 8.0 3.7 5.6 7.8 4.3 5.8 7.9
Repairs and Maintenance 0.7 1.6 2.2 1.0 1.3 1.9 1.1 1.7 2.4 1.2 1.7 2.5
Depreciation 1.3 3.9 5.4 0.5 1.5 3.5 0.7 1.6 2.6 1.1 1.8 3.1
Other Expense/(Income) ** ** ** 0.0 0.7 6.0 (0.4) 1.2 5.2 (0.8) (0.5) 0.0
General & Administrative Expenses 1.5 4.0 5.3 1.0 2.6 5.3 1.7 3.2 5.7 1.3 2.0 4.1
Corporate Overhead ** ** ** ** ** ** 1.0 2.4 4.0 0.0 2.3 3.9
Total Operating Expenses 48.2 54.7 68.6 50.5 60.5 67.1 53.5 60.9 66.9 58.4 63.4 68.3
Interest Expense 0.8 2.6 3.7 0.1 0.9 2.2 0.1 0.7 1.7 0.1 1.1 2.3
Other Expenses ** ** ** ** ** ** 0.0 0.3 1.9 0.0 0.0 0.8
Income (Loss) Before Income Taxes (4.5%) 6.0% 12.8% 0.1% 5.1% 12.2% 0.1% 4.7% 11.1% 1.5% 6.9% 11.4%
Note: Computations include respondents that provided zeros and numerical amounts
* All ratios are based as a percentage of total sales except food and beverage costs, which are based on their respective sales
** Insufficient data
��
© 2008 by the National Restaurant Association and Deloitte & Touche LLP
Exhibit A-17Full Service Restaurants (Average Check Per Person Under $15)Statement of Income and Expenses - Amount per Seat
Menu Theme
Hamburger American (varied)
Lower Quartile Median
Upper Quartile
Lower Quartile Median
Upper Quartile
Sales
Food $7,500 $11,292 $13,314 $3,500 $7,164 $10,793
Beverage ** ** ** 337 1,218 2,755
Total Sales 9,976 12,261 14,542 4,673 7,741 12,340
Cost of Sales
Food 2,201 2,741 3,170 1,300 2,273 3,346
Beverage ** ** ** 134 416 815
Total Cost of Sales 2,293 2,867 3,606 1,645 2,411 3,936
Gross Profit 6,104 9,505 10,495 2,770 5,134 8,642
Operating Expenses
Salaries and Wages (including Employee Benefits) ** ** ** 1,631 2,940 4,353
Direct Operating Expenses ** ** ** 187 430 1,136
Music and Entertainment ** ** ** 2 5 22
Marketing 67 808 978 46 117 214
Utility Services 338 518 569 204 302 416
Restaurant Occupancy Costs ** ** ** 250 442 665
Repairs and Maintenance 54 121 173 78 134 219
Depreciation ** ** ** 63 123 201
Other Expense/(Income) ** ** ** (50) 8 215
General & Administrative Expenses ** ** ** 91 232 502
Corporate Overhead ** ** ** 32 208 435
Total Operating Expenses 4,095 8,027 8,406 2,588 4,810 7,165
Interest Expense ** ** ** 6 52 131
Other Expenses ** ** ** 0 37 136
Income (Loss) Before Income Taxes ** ** ** ($34) $233 $722
Note: Computations include respondents that provided zeros and numerical amounts
** Insufficient data

��
© 2008 by the National Restaurant Association and Deloitte & Touche LLP
Exhibit A-18Full Service Restaurants (Average Check Per Person Under $15)Statement of Income and Expenses - Ratio to Total Sales*
Menu Theme
Hamburger American (varied)
Lower Quartile Median
Upper Quartile
Lower Quartile Median
Upper Quartile
Sales
Food 91.8% 93.4% 94.5% 68.8% 80.2% 95.2%
Beverage ** ** ** 4.8 19.8 31.2
Total Sales 100.0 100.0 100.0 100.0 100.0 100.0
Cost of Sales
Food 22.5 22.8 38.3 30.8 33.5 37.0
Beverage ** ** ** 25.1 28.3 34.1
Total Cost of Sales 22.3 22.6 34.3 30.1 32.4 35.4
Gross Profit 65.7 77.4 77.7 64.5 67.5 70.0
Operating Expenses
Salaries and Wages (including Employee Benefits) 30.0 31.7 33.0 28.8 34.0 39.1
Direct Operating Expenses ** ** ** 3.7 6.1 11.3
Music and Entertainment ** ** ** 0.0 0.1 0.5
Marketing 2.0 6.7 7.2 0.6 1.5 3.0
Utility Services 3.4 3.9 4.6 3.0 4.1 5.5
Restaurant Occupancy Costs 4.4 5.4 11.0 3.7 5.8 7.5
Repairs and Maintenance 0.7 1.2 1.7 1.2 1.7 2.5
Depreciation ** ** ** 0.7 1.6 2.8
Other Expense/(Income) ** ** ** (0.8) 0.1 3.9
General & Administrative Expenses ** ** ** 1.2 3.6 6.0
Corporate Overhead ** ** ** 0.7 2.8 4.6
Total Operating Expenses 50.8 60.6 66.4 53.6 61.5 67.8
Interest Expense ** ** ** 0.1 0.8 2.2
Other Expenses ** ** ** 0.0 0.4 1.3
Income (Loss) Before Income Taxes ** ** ** (0.9%) 4.0% 10.0%
Note: Computations include respondents that provided zeros and numerical amounts
* All ratios are based as a percentage of total sales except food and beverage costs, which are based on their respective sales
** Insufficient data

��
© 2008 by the National Restaurant Association and Deloitte & Touche LLP
Exhibit A-19Full Service Restaurants (Average Check Per Person Under $15)Statement of Income and Expenses - Amount per Seat
Metropolitan/Non-Metropolitan Location
Inside MSA*** Outside MSA***
Lower Quartile Median
Upper Quartile
Lower Quartile Median
Upper Quartile
Sales
Food $4,732 $8,513 $12,019 $3,484 $7,500 $11,902
Beverage 464 981 2,313 191 1,008 2,368
Total Sales 5,699 9,639 13,784 4,115 8,889 13,304
Cost of Sales
Food 1,782 2,588 3,430 1,288 2,472 3,917
Beverage 113 238 708 102 371 782
Total Cost of Sales 1,934 2,814 4,126 1,659 3,143 4,392
Gross Profit 3,807 6,475 9,925 2,628 5,629 9,210
Operating Expenses
Salaries and Wages (including Employee Benefits) 2,061 3,429 4,376 1,920 3,226 4,364
Direct Operating Expenses 259 591 1,099 154 350 1,161
Music and Entertainment 2 5 46 ** ** **
Marketing 61 141 315 56 142 279
Utility Services 231 333 488 202 312 482
Restaurant Occupancy Costs 279 545 885 168 398 732
Repairs and Maintenance 81 140 215 70 140 259
Depreciation 78 150 323 48 104 308
Other Expense/(Income) (68) 0 264 11 144 665
General & Administrative Expenses 123 242 452 75 261 622
Corporate Overhead 0 167 294 ** ** **
Total Operating Expenses 3,313 5,538 8,386 2,243 5,255 9,038
Interest Expense 17 84 193 5 86 185
Other Expenses 0 22 167 ** ** **
Income (Loss) Before Income Taxes $7 $494 $1,154 $94 $295 $651
Note: Computations include respondents that provided zeros and numerical amounts
** Insufficient data
*** Metropolitan statistical area

��
© 2008 by the National Restaurant Association and Deloitte & Touche LLP
Exhibit A-20Full Service Restaurants (Average Check Per Person Under $15)Statement of Income and Expenses - Ratio to Total Sales*
Metropolitan/Non-Metropolitan Location
Inside MSA*** Outside MSA***
Lower Quartile Median
Upper Quartile
Lower Quartile Median
Upper Quartile
Sales
Food 73.2% 88.9% 95.0% 72.7% 81.3% 96.2%
Beverage 5.0 11.1 26.8 3.8 18.8 27.3
Total Sales 100.0 100.0 100.0 100.0 100.0 100.0
Cost of Sales
Food 28.5 32.4 35.8 30.3 34.3 43.0
Beverage 23.8 27.1 31.8 ** ** **
Total Cost of Sales 28.2 31.5 35.1 30.0 33.9 39.2
Gross Profit 64.9 68.5 71.9 60.8 66.1 70.0
Operating Expenses
Salaries and Wages (including Employee Benefits) 28.4 32.1 37.6 27.5 33.6 38.1
Direct Operating Expenses 4.0 6.6 10.3 2.9 5.4 7.7
Music and Entertainment 0.0 0.1 0.4 ** ** **
Marketing 0.8 1.8 3.9 1.1 2.0 3.6
Utility Services 2.8 3.7 4.9 3.1 3.8 6.0
Restaurant Occupancy Costs 3.8 6.1 9.0 2.9 4.7 6.3
Repairs and Maintenance 1.1 1.6 2.3 1.2 1.8 2.8
Depreciation 0.7 1.8 3.6 0.7 1.6 3.0
Other Expense/(Income) (0.7) 0.0 3.5 0.4 1.6 7.0
General & Administrative Expenses 1.4 2.8 5.3 1.1 3.2 5.8
Corporate Overhead 0.0 1.8 3.9 ** ** **
Total Operating Expenses 54.7 61.3 67.7 50.6 58.8 66.4
Interest Expense 0.1 0.9 2.1 0.1 0.9 3.3
Other Expenses 0.0 0.3 1.5 ** ** **
Income (Loss) Before Income Taxes 0.1% 5.6% 12.3% 1.5% 4.5% 11.3%
Note: Computations include respondents that provided zeros and numerical amounts
* All ratios are based as a percentage of total sales except food and beverage costs, which are based on their respective sales
** Insufficient data
*** Metropolitan statistical area

��
© 2008 by the National Restaurant Association and Deloitte & Touche LLP
Exhibit A-21Full Service Restaurants (Average Check Per Person Under $15)Statement of Income and Expenses - Amount per Seat
Average Check
Under $10.00 $10.00 to 14.99
Lower Quartile Median
Upper Quartile Lower Quartile Median Upper Quartile
Sales
Food $5,388 $7,903 $11,363 $3,921 $8,175 $11,879
Beverage 21 196 1,316 538 1,122 2,500
Total Sales 5,640 7,976 13,625 5,586 9,859 13,532
Cost of Sales
Food 1,852 2,565 4,084 1,433 2,588 3,462
Beverage 17 72 344 149 280 754
Total Cost of Sales 1,862 2,570 4,254 1,951 2,989 4,039
Gross Profit 3,714 5,400 8,957 3,477 6,477 9,883
Operating Expenses
Salaries and Wages (including Employee Benefits) 1,811 2,966 4,819 2,063 3,470 4,350
Direct Operating Expenses 218 543 1,130 244 586 1,057
Music and Entertainment 0 3 13 2 11 100
Marketing 53 141 289 61 134 317
Utility Services 209 309 467 234 340 488
Restaurant Occupancy Costs 251 501 877 259 528 813
Repairs and Maintenance 73 130 198 80 145 238
Depreciation 72 147 328 75 140 275
Other Expense/(Income) (48) 12 285 (64) 42 325
General & Administrative Expenses 117 234 463 111 242 492
Corporate Overhead 147 222 280 0 70 368
Total Operating Expenses 2,993 4,837 8,215 3,198 5,761 8,380
Interest Expense 26 99 160 9 64 207
Other Expenses 20 89 281 0 0 84
Income (Loss) Before Income Taxes $112 $426 $956 $0 $390 $1,183
Note: Computations include respondents that provided zeros and numerical amounts
** Insufficient data

��
© 2008 by the National Restaurant Association and Deloitte & Touche LLP
Exhibit A-22Full Service Restaurants (Average Check Per Person Under $15)Statement of Income and Expenses - Ratio to Total Sales*
Average Check
Under $10.00 $10.00 to 14.99
Lower Quartile Median
Upper Quartile
Lower Quartile Median
Upper Quartile
Sales
Food 91.0% 98.1% 100.0% 72.1% 85.4% 93.3%
Beverage 0.0 1.9 9.0 6.7 14.6 27.9
Total Sales 100.0 100.0 100.0 100.0 100.0 100.0
Cost of Sales
Food 29.7 33.5 36.9 28.8 32.5 38.0
Beverage ** ** ** 24.1 27.4 32.5
Total Cost of Sales 28.8 33.2 36.8 28.5 31.6 35.1
Gross Profit 63.2 66.8 71.2 64.9 68.3 71.6
Operating Expenses
Salaries and Wages (including Employee Benefits) 28.3 32.8 37.6 28.4 32.2 37.9
Direct Operating Expenses 3.5 6.0 10.1 4.0 6.3 9.9
Music and Entertainment 0.0 0.0 0.1 0.0 0.1 1.0
Marketing 0.8 1.5 3.5 0.8 2.0 4.2
Utility Services 3.0 3.8 4.9 2.8 3.6 5.1
Restaurant Occupancy Costs 4.0 6.3 8.5 3.3 5.3 8.0
Repairs and Maintenance 1.0 1.5 2.1 1.1 1.7 2.4
Depreciation 0.9 1.9 3.7 0.7 1.7 3.2
Other Expense/(Income) (0.7) 0.1 4.2 (0.5) 0.4 4.4
General & Administrative Expenses 1.1 3.7 6.0 1.6 2.6 5.1
Corporate Overhead 1.5 3.0 4.5 0.0 0.7 2.9
Total Operating Expenses 50.8 60.3 65.6 53.4 61.2 68.2
Interest Expense 0.3 0.9 2.7 0.1 0.9 2.1
Other Expenses 0.2 0.8 2.4 0.0 0.0 1.0
Income (Loss) Before Income Taxes 1.4% 6.1% 12.7% 0.0% 4.8% 12.0%
Note: Computations include respondents that provided zeros and numerical amounts
* All ratios are based as a percentage costs, which are based on their respective sales
** Insufficient data

�0
© 2008 by the National Restaurant Association and Deloitte & Touche LLP
Exhibit A-23Full Service Restaurants (Average Check Per Person Under $15)Income Differential
Amount per Seat Ratio to Total Sales*
Profit Loss Profit Loss
Lower Quartile Median
Upper Quartile
Lower Quartile Median
Upper Quartile
Lower Quartile Median
Upper Quartile
Lower Quartile Median
Upper Quartile
Sales
Food $4,873 $8,563 $12,188 $3,526 $6,200 $10,785 81.8% 95.7% 100.0% 69.1% 88.1% 95.3%
Beverage 333 1,063 2,372 318 853 2,325 4.5 11.0 26.5 4.7 11.9 30.9
Total Sales 5,828 9,691 14,542 5,097 7,030 11,849 100.0 100.0 100.0 100.0 100.0 100.0
Cost of Sales
Food 1,719 2,677 3,488 1,283 2,201 3,696 28.6 32.6 36.8 30.2 34.1 38.5
Beverage 105 250 735 ** ** ** 24.0 27.6 32.6 25.0 30.0 34.4
Total Cost of Sales 1,936 2,886 4,153 1,868 2,273 3,758 28.2 31.8 35.5 30.0 33.6 36.6
Gross Profit 3,930 6,475 10,333 3,371 4,694 7,875 64.5 68.2 71.8 63.3 66.4 70.0
Operating Expenses
Salaries and Wages (including Employee Benefits) 2,098 3,311 4,344 1,804 3,300 4,367 27.5 31.1 36.1 33.0 39.3 43.9
Direct Operating Expenses 242 580 1,088 202 476 1,429 3.7 5.9 9.2 4.4 7.5 12.8
Music and Entertainment 1 5 24 2 11 104 0.0 0.1 0.3 0.0 0.1 0.9
Marketing 61 135 315 59 147 248 0.8 1.8 3.9 0.8 2.2 3.5
Utility Services 230 336 480 212 304 439 2.8 3.7 4.7 3.3 4.5 5.6
Restaurant Occupancy Costs 251 508 860 297 512 800 3.2 5.4 7.6 4.7 7.0 10.7
Repairs and Maintanence 80 140 215 77 133 234 1.0 1.5 2.3 1.2 1.7 2.5
Depreciation 66 140 307 86 151 278 0.7 1.7 3.1 0.9 1.9 4.6
Other Expense/(Income) (66) 28 258 (38) 24 534 (0.5) 0.3 3.5 (0.6) 0.7 8.7
General & Administrative Expenses 114 248 467 112 193 493 1.2 2.4 5.1 1.7 3.9 5.4
Corporate Overhead 0 189 362 0 93 234 0.0 1.7 3.9 0.0 1.3 4.1
Total Operating Expenses 3,083 5,385 8,196 3,175 4,877 8,813 50.0 57.5 63.3 66.6 71.1 80.0
Interest Expense 8 67 201 29 100 151 0.1 0.9 2.2 0.3 1.2 2.3
Other Expenses 0 11 162 ** ** ** 0.0 0.1 1.4 ** ** **
Income (Loss) Before Income Taxes $283 $669 $1,460 ($887) ($363) ($142) 4.2% 8.5% 14.5% (14.5%) (6.2%) (2.2%)
Note: Computations include respondents that provided zeros and numerical amounts
* All ratios are based as a percentage of total sales except food and beverage costs, which are based on their respective sales
** Insufficient data

�1
© 2008 by the National Restaurant Association and Deloitte & Touche LLP
Exhibit A-23Full Service Restaurants (Average Check Per Person Under $15)Income Differential
Amount per Seat Ratio to Total Sales*
Profit Loss Profit Loss
Lower Quartile Median
Upper Quartile
Lower Quartile Median
Upper Quartile
Lower Quartile Median
Upper Quartile
Lower Quartile Median
Upper Quartile
Sales
Food $4,873 $8,563 $12,188 $3,526 $6,200 $10,785 81.8% 95.7% 100.0% 69.1% 88.1% 95.3%
Beverage 333 1,063 2,372 318 853 2,325 4.5 11.0 26.5 4.7 11.9 30.9
Total Sales 5,828 9,691 14,542 5,097 7,030 11,849 100.0 100.0 100.0 100.0 100.0 100.0
Cost of Sales
Food 1,719 2,677 3,488 1,283 2,201 3,696 28.6 32.6 36.8 30.2 34.1 38.5
Beverage 105 250 735 ** ** ** 24.0 27.6 32.6 25.0 30.0 34.4
Total Cost of Sales 1,936 2,886 4,153 1,868 2,273 3,758 28.2 31.8 35.5 30.0 33.6 36.6
Gross Profit 3,930 6,475 10,333 3,371 4,694 7,875 64.5 68.2 71.8 63.3 66.4 70.0
Operating Expenses
Salaries and Wages (including Employee Benefits) 2,098 3,311 4,344 1,804 3,300 4,367 27.5 31.1 36.1 33.0 39.3 43.9
Direct Operating Expenses 242 580 1,088 202 476 1,429 3.7 5.9 9.2 4.4 7.5 12.8
Music and Entertainment 1 5 24 2 11 104 0.0 0.1 0.3 0.0 0.1 0.9
Marketing 61 135 315 59 147 248 0.8 1.8 3.9 0.8 2.2 3.5
Utility Services 230 336 480 212 304 439 2.8 3.7 4.7 3.3 4.5 5.6
Restaurant Occupancy Costs 251 508 860 297 512 800 3.2 5.4 7.6 4.7 7.0 10.7
Repairs and Maintanence 80 140 215 77 133 234 1.0 1.5 2.3 1.2 1.7 2.5
Depreciation 66 140 307 86 151 278 0.7 1.7 3.1 0.9 1.9 4.6
Other Expense/(Income) (66) 28 258 (38) 24 534 (0.5) 0.3 3.5 (0.6) 0.7 8.7
General & Administrative Expenses 114 248 467 112 193 493 1.2 2.4 5.1 1.7 3.9 5.4
Corporate Overhead 0 189 362 0 93 234 0.0 1.7 3.9 0.0 1.3 4.1
Total Operating Expenses 3,083 5,385 8,196 3,175 4,877 8,813 50.0 57.5 63.3 66.6 71.1 80.0
Interest Expense 8 67 201 29 100 151 0.1 0.9 2.2 0.3 1.2 2.3
Other Expenses 0 11 162 ** ** ** 0.0 0.1 1.4 ** ** **
Income (Loss) Before Income Taxes $283 $669 $1,460 ($887) ($363) ($142) 4.2% 8.5% 14.5% (14.5%) (6.2%) (2.2%)
Note: Computations include respondents that provided zeros and numerical amounts
* All ratios are based as a percentage of total sales except food and beverage costs, which are based on their respective sales
** Insufficient data

�2
© 2008 by the National Restaurant Association and Deloitte & Touche LLP
Section B-Full Service Restaurants (Average Check Per Person $15 to $24.99)Exhibit B-1 presents the characteristics of the 183 respondents in the Full Service Restaurants (Average Check Per Person $15 to $24.99) category of this year’s study. More than three-quarters (80.3%) of the respondents represent independent restaurants and 56.3% reported that they were the sole occupant of their location. Restaurants with American menu themes represent 54.1% of this sample.
The median ratio of income before income taxes to total sales is 3.6% or $331 per seat.
Highlights • Median average check is $18.00.
• Median total sales per full-time equivalent employee is $50,605.
• Median food sales are $6,530 per seat and median beverage sales are $2,336 per seat.
• Median total sales per square foot is $279.
• Median income before income taxes is 3.6% of total sales.
• Median total cost of sales is 33.1% of total sales.
Characteristics• 80.3% of full service (average check $15 to $24.99) restaurants are
single units, i.e., independents.
• 65.6% of the responding establishments have sales volume of $1,000,000 and over.
• 54.1% of the respondents report an American menu theme.
• 69.4% of the respondents operate their businesses in locations with less than 7,500 square feet and 68.3% of the respondents have less than 200 seats.

��
© 2008 by the National Restaurant Association and Deloitte & Touche LLP
Section B-Full Service Restaurants (Average Check Per Person $15 to $24.99)Exhibit B-1 presents the characteristics of the 183 respondents in the Full Service Restaurants (Average Check Per Person $15 to $24.99) category of this year’s study. More than three-quarters (80.3%) of the respondents represent independent restaurants and 56.3% reported that they were the sole occupant of their location. Restaurants with American menu themes represent 54.1% of this sample.
The median ratio of income before income taxes to total sales is 3.6% or $331 per seat.
Highlights • Median average check is $18.00.
• Median total sales per full-time equivalent employee is $50,605.
• Median food sales are $6,530 per seat and median beverage sales are $2,336 per seat.
• Median total sales per square foot is $279.
• Median income before income taxes is 3.6% of total sales.
• Median total cost of sales is 33.1% of total sales.
Characteristics• 80.3% of full service (average check $15 to $24.99) restaurants are
single units, i.e., independents.
• 65.6% of the responding establishments have sales volume of $1,000,000 and over.
• 54.1% of the respondents report an American menu theme.
• 69.4% of the respondents operate their businesses in locations with less than 7,500 square feet and 68.3% of the respondents have less than 200 seats.
Exhibit B-1Composition of Participating Full Service Restaurants(Average Check Per Person $15 to $24.99)Number of Respondents: 183
Percentage of Respondents
Percentage of Respondents
Type of Establishment: Ownership:Food Only 5.5% Sole Proprietorship 19.7%Food and Beverage 94.5 Partnership 17.5
Public Corporation 1.6Years in Business: Private Corporation 61.21 to 5 Years 21.9%5 to 10 Years 21.9 Menu Theme:Over 10 Years 56.2 Steak/Seafood 19.1%
Hamburger 2.7Region: 1 Pizza 2.7Northeast 21.3% American (varied) 54.1North Central 21.9 Mexican 1.1South 19.7 Italian 5.5West 34.4 Asian 2.8Not Specified 2.7 Other 12.0
Average Check: 2 Sales Volume: 3
$15.00 to $19.99 55.7% Under $500,000 8.7%$20.00 to $24.99 44.3 $500,000 to $999,999 25.7
$1,000,000 to $1,999,999 33.9Affiliation: $2,000,000 and Over 31.7Single Unit - Independent 80.3%Single Unit - Franchise Operated 4.4 Restaurant Location:Multi-Unit - Company Operated 14.2 Hotel 6.6%Multi-Unit - Franchise Operated 1.1 Shopping Center or Mall 16.4
Sole Occupant 56.3Profit versus Loss: 3 Other 19.7Profit 72.6% Not Specified 1.0Loss 27.4
Total Number of Seats:Lease versus Own: Under 100 19.1%Own Land and Building 43.2% 100 to 149 30.1Lease Land and Building 24.0 150 to 199 19.1Lease Land and Own Building 2.7 200 to 399 23.5Own Land and Lease Building 0.0 400 and Over 8.2Not Specified 30.1
Total Restaurant Square Footage:Under 2,500 12.6%2,500 to 4,999 31.75,000 to 7,499 25.17,500 and Over 25.7Not Specified 4.9
¹ Regions:
Northeast: CT, ME, MA, NH, NJ, NY, PA, RI, VT
North Central: IL, IN, IA, KS, MI, MN, MO, NE, ND, OH, SD, WI
South: AL, AR, DC, DE, FL, GA, KY, LA, MD, MS, OK, NC, SC, TN, TX, VA, WV
West: AK, AZ, CA, CO, HI, ID, MT, NV, NM, OR, UT, WA, WY
² Per person, all meals
³ For respondents specifying

��
© 2008 by the National Restaurant Association and Deloitte & Touche LLP
Exhibit B-2Full Service Restaurants (Average Check Per Person $15 to $24.99)Average Check
Total
Lower Quartile Median
Upper Quartile
All Restaurants $16.00 $18.00 $21.00
Type of Establishment
Food Only ** ** **
Food and Beverage $16.00 $18.00 $21.00
Restaurant Location
Hotel ** ** **
Shopping Center or Mall $16.00 $18.00 $20.00
Sole Occupant 16.00 18.00 20.50
Other 15.75 18.00 22.00
Profit versus Loss
Profit $16.00 $19.00 $21.00
Loss 15.75 17.50 20.00
Menu Theme
Steak/Seafood $16.00 $18.00 $21.00
Chicken ** ** **
Pizza ** ** **
American (varied) 16.00 18.00 21.00
Mexican ** ** **
Italian ** ** **
Asian ** ** **
Other 15.00 17.00 20.00
Affiliation
Single Unit - Independent $16.00 $18.00 $20.75
Single Unit - Franchise Operated ** ** **
Multi-Unit - Company Operated 17.00 19.00 21.75
Multi-Unit - Franchise Operated ** ** **
Ownership
Sole Proprietorship $15.00 $18.00 $20.00
Partnership 16.00 20.00 21.00
Public Corporation ** ** **
Private Corporation 16.00 18.00 21.00
Sales Volume
Under $500,000 ** ** **
$500,000 to $999,999 $16.00 $18.00 $21.00
$1,000,000 to $1,999,999 16.00 18.00 21.00
$2,000,000 and Over 16.00 18.00 21.00
** Insufficient data

��
© 2008 by the National Restaurant Association and Deloitte & Touche LLP
Exhibit B-3Full Service Restaurants (Average Check Per Person $15 to $24.99)Average Daily Seat Turnover
Total
Lower Quartile Median
Upper Quartile
All Restaurants 0.9 1.4 2.0
Type of Establishment
Food Only ** ** **
Food and Beverage 0.9 1.4 2.0
Restaurant Location
Hotel ** ** **
Shopping Center or Mall 0.8 1.2 1.9
Sole Occupant 0.9 1.4 2.0
Other 1.0 1.4 2.3
Profit versus Loss
Profit 0.9 1.4 2.1
Loss 0.9 1.2 1.6
Menu Theme
Steak/Seafood 1.0 1.4 1.9
Chicken ** ** **
Pizza ** ** **
American (varied) 0.8 1.4 1.9
Mexican ** ** **
Italian ** ** **
Asian ** ** **
Other 1.3 2.0 2.6
Average Check
$15.00 to $19.99 1.1 1.4 2.2
$20.00 to $24.99 0.7 1.2 1.6
Affiliation
Single Unit - Independent 0.8 1.3 1.9
Single Unit - Franchise Operated ** ** **
Multi-Unit - Company Operated 1.6 2.1 2.6
Multi-Unit - Franchise Operated ** ** **
Ownership
Sole Proprietorship 0.9 1.3 2.0
Partnership 0.9 1.4 2.1
Public Corporation ** ** **
Private Corporation 1.0 1.4 2.0
Sales Volume
Under $500,000 ** ** **
$500,000 to $999,999 0.7 0.9 1.3
$1,000,000 to $1,999,999 1.0 1.4 1.9
$2,000,000 and Over 1.4 2.0 2.6
**Insufficient data

��
© 2008 by the National Restaurant Association and Deloitte & Touche LLP
Exhibit B-4Full Service Restaurants (Average Check Per Person $15 to $24.99)Cost per Dollar of Sales*
Total Cost of Sales
Total Payroll and Benefits Prime Cost
All Restaurants 33.1¢ 33.5¢ 67.0¢
Type of Establishment
Food Only ** ** **
Food and Beverage 33.0¢ 33.7¢ 67.1¢
Restaurant Location
Hotel ** ** **
Shopping Center or Mall 31.4¢ 30.3¢ 62.0¢
Sole Occupant 33.5 33.4 66.9
Other 34.1 35.0 68.8
Profit versus Loss
Profit 32.9¢ 32.8¢ 66.5¢
Loss 33.9 37.0 70.2
Menu Theme
Steak/Seafood 34.4¢ 33.6¢ 66.5¢
Chicken ** ** **
Pizza ** ** **
American (varied) 34.0 34.1 68.8
Mexican ** ** **
Italian ** ** **
Asian ** ** **
Other 32.0 29.3 61.5
Average Check
$15.00 to $19.99 33.0¢ 33.6¢ 67.7¢
$20.00 to $24.99 33.3 33.1 66.1
Affiliation
Single Unit - Independent 33.1¢ 34.0¢ 67.3¢
Single Unit - Franchise Operated ** ** **
Multi-Unit - Company Operated 34.2 33.4 66.5
Multi-Unit - Franchise Operated ** ** **
Ownership
Sole Proprietorship 33.6¢ 34.5¢ 69.9¢
Partnership 32.8 30.6 64.4
Public Corporation ** ** **
Private Corporation 33.2 33.7 67.0
Sales Volume
Under $500,000 ** ** **
$500,000 to $999,999 34.8¢ 35.3¢ 69.6¢
$1,000,000 to $1,999,999 33.1 35.0 68.0
$2,000,000 and Over 31.7 32.3 65.9
* All amounts are medians
** Insufficient data

��
© 2008 by the National Restaurant Association and Deloitte & Touche LLP
Exhibit B-5Full Service Restaurants (Average Check Per Person $15 to $24.99)Number of Employees*
Number of Employees per Restaurant
Full TimePart Time
(20-34 Hours)
Part-Part-Time (Under 20
Hours)
All Restaurants 13 15 6
Type of Establishment
Food Only ** ** **
Food and Beverage 14 15 6
Restaurant Location
Hotel ** ** **
Shopping Center or Mall 13 9 2
Sole Occupant 14 15 10
Other 12 15 5
Profit versus Loss
Profit 15 15 7
Loss 10 12 5
Menu Theme
Steak/Seafood 16 15 10
Chicken ** ** **
Pizza ** ** **
American (varied) 12 15 6
Mexican ** ** **
Italian ** ** **
Asian ** ** **
Other 12 12 4
Average Check
$15.00 to $19.99 13 16 6
$20.00 to $24.99 13 10 6
Affiliation
Single Unit - Independent 12 12 6
Single Unit - Franchise Operated ** ** **
Multi-Unit - Company Operated 21 22 16
Multi-Unit - Franchise Operated ** ** **
Ownership
Sole Proprietorship 10 10 2
Partnership 16 15 4
Public Corporation ** ** **
Private Corporation 13 15 10
Sales Volume
Under $500,000 ** ** **
$500,000 to $999,999 7 8 5
$1,000,000 to $1,999,999 14 14 5
$2,000,000 and Over 26 25 13
* All amounts are medians
** Insufficient data

��
© 2008 by the National Restaurant Association and Deloitte & Touche LLP
Exhibit B-6Full Service Restaurants (Average Check Per Person $15 to $24.99)Annual Employee Turnover*
All Employees
Salaried Employees
Hourly Employees
All Restaurants 76% 33% 83%
Type of Establishment
Food Only ** ** **
Food and Beverage 76% 33% 85%
Restaurant Location
Hotel ** ** **
Shopping Center or Mall 96% 38% 103%
Sole Occupant 70 25 81
Other 57 * *
Profit versus Loss
Profit 76% 33% 85%
Loss 90 33 99
Menu Theme
Steak/Seafood 72% 28% 78%
Chicken ** ** **
Pizza ** ** **
American (varied) 75 33 82
Mexican ** ** **
Italian ** ** **
Asian ** ** **
Other 79 ** 86
Average Check
$15.00 to $19.99 85% 33% 90%
$20.00 to $24.99 64 * *
Affiliation
Single Unit - Independent 73% 27% 83%
Single Unit - Franchise Operated ** ** **
Multi-Unit - Company Operated 84 58 88
Multi-Unit - Franchise Operated ** ** **
Ownership
Sole Proprietorship 70% ** 94%
Partnership 92 20% 100
Public Corporation ** ** **
Private Corporation 76 33 83
Sales Volume
Under $500,000 ** ** **
$500,000 to $999,999 57% 29% 61%
$1,000,000 to $1,999,999 69 33 75
$2,000,000 and Over 92 33 100
* Amounts for all employees and hourly employees are medians; amounts for salaried employees are upper quartiles.
All amounts are derived from the number of W-2’s and the number of employees
** Insufficient data

��
© 2008 by the National Restaurant Association and Deloitte & Touche LLP
Exhibit B-7Full Service Restaurants (Average Check Per Person $15 to $24.99)Employee Information*
Full-Time Equivalent EmployeesAmount per Full-Time Equivalent Employee
TotalPer 100
Restaurant SeatsPer 100 Average
Daily Covers Total SalesTotal Payroll and Benefits
All Restaurants 27.3 18.5 13.3 $50,605 $17,010
Type of Establishment
Food Only ** ** ** ** **
Food and Beverage 27.9 18.5 13.4 $50,665 $17,044
Restaurant Location
Hotel ** ** ** ** **
Shopping Center or Mall 21.4 19.9 14.6 $47,448 $14,328
Sole Occupant 28.6 18.3 12.8 54,379 17,920
Other 23.7 18.6 13.3 47,712 16,476
Profit versus Loss
Profit 28.8 19.7 13.1 $52,295 $17,045
Loss 23.2 16.6 14.1 48,101 16,104
Menu Theme
Steak/Seafood 33.5 16.1 12.3 $54,379 $16,300
Chicken ** ** ** ** **
Pizza ** ** ** ** **
American (varied) 26.7 18.0 14.2 49,528 17,397
Mexican ** ** ** ** **
Italian ** ** ** ** **
Asian ** ** ** ** **
Other 27.4 25.4 12.4 54,198 15,535
Average Check
$15.00 to $19.99 27.3 19.5 12.3 $50,563 $17,204
$20.00 to $24.99 27.4 17.5 15.4 51,755 15,748
Affiliation
Single Unit - Independent 25.8 16.8 13.5 $49,547 $16,363
Single Unit - Franchise Operated ** ** ** ** **
Multi-Unit - Company Operated 45.5 27.8 12.3 54,971 17,116
Multi-Unit - Franchise Operated ** ** ** ** **
Ownership
Sole Proprietorship 23.8 17.9 12.1 $48,495 $17,925
Partnership 33.6 21.7 14.7 46,841 15,476
Public Corporation ** ** ** ** **
Private Corporation 28.5 18.1 12.9 52,852 16,449
Sales Volume
Under $500,000 ** ** ** ** **
$500,000 to $999,999 16.0 12.6 14.8 $44,509 $13,926
$1,000,000 to $1,999,999 27.1 19.5 13.2 51,471 18,154
$2,000,000 and Over 51.9 25.7 12.4 56,033 17,291
* All amounts are medians. Based on 35 hours per week. Factors used to compute full-time equivalent employees are as follows:
full-time (35 hours or more) equals 1.0; part-time (20-34 hours) equals 0.7; part-part-time (less than 20 hours) equals 0.35
** Insufficient data

�0
© 2008 by the National Restaurant Association and Deloitte & Touche LLP
Exhibit B-8Full Service Restaurants (Average Check Per Person $15 to $24.99)Take-Out/Drive Through, Outside Catering andBanquet Service - Ratio to Total Sales*
Take-Out/ Drive Through
Outside Catering
Banquet Service
All Restaurants 5% 3% 9%
Type of Establishment
Food Only ** ** **
Food and Beverage 5% 3% 10%
Restaurant Location
Hotel ** ** **
Shopping Center or Mall 9% ** **
Sole Occupant 3 3% 5%
Other ** ** **
Profit versus Loss
Profit 5% 5% 5%
Loss 5 3 10
Menu Theme
Steak/Seafood 4% ** **
Chicken ** ** **
Pizza ** ** **
American (varied) 5 3% 8%
Mexican ** ** **
Italian ** ** **
Asian ** ** **
Other ** ** **
Average Check
$15.00 to $19.99 5% 3% 7%
$20.00 to $24.99 3 3 10
Affiliation
Single Unit - Independent 5% 3% 10%
Single Unit - Franchise Operated ** ** **
Multi-Unit - Company Operated ** ** **
Multi-Unit - Franchise Operated ** ** **
Ownership
Sole Proprietorship 5% ** 10%
Partnership ** ** **
Public Corporation ** ** **
Private Corporation 3 3% 10
Sales Volume
Under $500,000 ** ** **
$500,000 to $999,999 5% ** 15%
$1,000,000 to $1,999,999 5 3% 7
$2,000,000 and Over 4 4 5
* All amounts are medians
** Insufficient data

�1
© 2008 by the National Restaurant Association and Deloitte & Touche LLP
Exhibit B-9Full Service Restaurants (Average Check Per Person $15 to $24.99)Statement of Income and Expenses
All Restaurants
Amount per Seat Ratio to Total Sales*
Lower Quartile Median
Upper Quartile
Lower Quartile Median
Upper Quartile
Sales
Food $4,062 $6,530 $10,046 65.7% 76.1% 84.9%
Beverage 1,155 2,336 3,638 16.4 25.0 34.8
Total Sales 5,787 9,018 13,342 100.0 100.0 100.0
Cost of Sales
Food 1,440 2,305 3,750 30.6 34.5 40.5
Beverage 348 600 1,053 24.7 29.3 34.3
Total Cost of Sales 1,913 3,244 4,670 30.0 33.1 38.6
Gross Profit 3,601 5,864 9,037 61.4 66.9 70.0
Operating Expenses
Salaries and Wages (including Employee Benefits) 2,087 3,300 4,846 29.0 33.5 39.4
Direct Operating Expenses 310 602 897 3.8 5.9 8.4
Music and Entertainment 17 43 85 0.2 0.5 1.3
Marketing 68 156 355 1.0 1.8 3.0
Utility Services 203 311 449 2.6 3.4 4.7
Restaurant Occupancy Costs 322 549 876 3.6 6.0 8.0
Repairs and Maintenance 87 156 284 1.0 1.8 2.4
Depreciation 79 188 338 1.1 2.1 3.1
Other Expense/(Income) (6) 154 357 0.0 1.5 4.8
General & Administrative Expenses 128 350 716 1.6 3.1 6.4
Corporate Overhead 75 420 905 0.8 5.0 7.4
Total Operating Expenses 3,353 5,603 8,212 55.5 61.2 67.8
Interest Expense 40 103 199 0.4 1.2 2.3
Other Expenses 17 96 325 0.3 1.0 2.6
Income (Loss) Before Income Taxes ($75) $331 $898 (0.7%) 3.6% 9.0%
Note: Computations include respondents that provided zeros and numerical amounts
* All ratios are based as a percentage of total sales except food and beverage costs, which are based on their respective sales

�2
© 2008 by the National Restaurant Association and Deloitte & Touche LLP
Exhibit B-10Full Service Restaurants (Average Check Per Person $15 to $24.99)Statement of Income and Expenses - Amount per Square Foot*
All Restaurants Type of Establishment Menu Theme Menu Theme Average Check Restaurant Location Sales Volume ($000)
Lower Quartile Median
Upper Quartile Food Only
Food and Beverage
Steak/ Seafood Chicken Pizza
American (varied) Mexican Italian Asian Other
$15.00 to $19.99
$20.00 to $24.99 Hotel Other
Shopping Center or Mall
Sole Occupant
Under $500
$500 to $999
$1,000 to $1,999
$2,000 and Over
Sales
Food $125.18 $202.07 $314.81 ** $201.00 $233.46 ** ** $181.81 ** ** ** $240.00 $217.86 $186.98 ** $201.00 $173.08 $214.45 ** $152.79 $188.52 $315.30
Beverage 35.83 69.20 113.45 N/A 69.64 75.84 ** ** 74.95 ** ** ** 62.87 71.49 61.58 ** 85.35 36.36 76.37 ** 36.20 71.24 90.69
Total Sales 178.07 278.89 416.06 ** 278.89 288.06 ** ** 264.29 ** ** ** 380.00 295.36 262.27 ** 292.86 213.27 297.92 ** 184.64 280.00 399.31
Gross Profit on Sales 115.73 180.20 277.27 ** 180.20 170.87 ** ** 178.29 ** ** ** 262.20 196.24 174.37 ** 201.15 136.29 190.16 ** 122.27 177.87 263.77
Utility Services 6.41 9.00 12.63 ** 9.00 9.19 ** ** 9.50 ** ** ** 9.32 9.95 8.68 ** 8.90 7.25 10.00 ** 7.86 9.51 11.09
Restaurant Occupancy Costs 8.23 15.37 25.33 ** 15.48 14.40 ** ** 13.15 ** ** ** 21.88 15.62 15.17 ** 15.17 16.74 15.09 ** 12.24 17.78 18.80
Note: Computations include respondents that provided zeros and numerical amounts
* All amounts are medians unless otherwise stated
** Insufficient data
N/A Not applicable

��
© 2008 by the National Restaurant Association and Deloitte & Touche LLP
Exhibit B-11Full Service Restaurants (Average Check Per Person $15 to $24.99)Statement of Income and Expenses - Amount per Seat
Type of Establishment
Food Only Food and Beverage
Lower Quartile Median
Upper Quartile
Lower Quartile Median
Upper Quartile
Sales
Food ** ** ** $4,000 $6,400 $9,832
Beverage N/A N/A N/A 1,147 2,333 3,567
Total Sales ** ** ** 5,725 9,018 13,160
Cost of Sales
Food ** ** ** 1,408 2,256 3,684
Beverage N/A N/A N/A 347 600 1,053
Total Cost of Sales ** ** ** 1,889 3,244 4,559
Gross Profit ** ** ** 3,583 5,833 8,867
Operating Expenses
Salaries and Wages (including Employee Benefits) ** ** ** 2,083 3,359 4,826
Direct Operating Expenses ** ** ** 300 574 893
Music and Entertainment ** ** ** 8 27 76
Marketing ** ** ** 64 147 324
Utility Services ** ** ** 199 303 442
Restaurant Occupancy Costs ** ** ** 290 530 814
Repairs and Maintenance ** ** ** 85 154 277
Depreciation ** ** ** 73 174 320
Other Expense/(Income) ** ** ** 0 100 316
General & Administrative Expenses ** ** ** 110 345 667
Corporate Overhead ** ** ** 0 25 461
Total Operating Expenses ** ** ** 3,204 5,488 8,099
Interest Expense ** ** ** 15 70 181
Other Expenses ** ** ** 0 15 148
Income (Loss) Before Income Taxes ** ** ** ($36) $331 $879
Note: Computations include respondents that provided zeros and numerical amounts
** Insufficient data
N/A Not applicable

��
© 2008 by the National Restaurant Association and Deloitte & Touche LLP
Exhibit B-12Full Service Restaurants (Average Check Per Person $15 to $24.99)Statement of Income and Expenses - Ratio to Total Sales*
Type of Establishment
Food Only Food and Beverage
Lower Quartile Median
Upper Quartile
Lower Quartile Median
Upper Quartile
Sales
Food ** ** ** 65.2% 75.0% 82.9%
Beverage N/A N/A N/A 17.1 25.0 34.8
Total Sales ** ** ** 100.0 100.0 100.0
Cost of Sales
Food ** ** ** 30.6 34.5 40.7
Beverage N/A N/A N/A 24.8 29.3 34.4
Total Cost of Sales ** ** ** 30.0 33.0 38.5
Gross Profit ** ** ** 61.5 67.0 70.0
Operating Expenses
Salaries and Wages (including Employee Benefits) ** ** ** 29.1 33.7 39.4
Direct Operating Expenses ** ** ** 3.8 5.9 8.4
Music and Entertainment ** ** ** 0.1 0.3 1.1
Marketing ** ** ** 0.9 1.7 2.9
Utility Services ** ** ** 2.6 3.4 4.6
Restaurant Occupancy Costs ** ** ** 3.1 5.9 8.0
Repairs and Maintenance ** ** ** 1.0 1.8 2.4
Depreciation ** ** ** 1.1 2.0 3.0
Other Expense/(Income) ** ** ** 0.0 0.9 4.2
General & Administrative Expenses ** ** ** 1.4 3.0 6.0
Corporate Overhead ** ** ** 0.0 0.2 5.9
Total Operating Expenses ** ** ** 54.6 61.1 67.7
Interest Expense ** ** ** 0.2 0.8 1.9
Other Expenses ** ** ** 0.0 0.2 1.3
Income (Loss) Before Income Taxes ** ** ** (0.3%) 3.7% 9.0%
Note: Computations include respondents that provided zeros and numerical amounts
* All ratios are based as a percentage of total sales except food and beverage costs, which are based on their respective sales
** Insufficient data
N/A Not applicable

��
© 2008 by the National Restaurant Association and Deloitte & Touche LLP
Exhibit B-13Full Service Restaurants (Average Check Per Person $15 to $24.99)Statement of Income and Expenses - Amount per Seat
Affiliation
Single Unit - Independent Multi-Unit - Company Operated
Lower Quartile Median
Upper Quartile
Lower Quartile Median
Upper Quartile
Sales
Food $3,890 $6,000 $9,094 $7,595 $11,351 $15,119
Beverage 1,006 2,196 3,500 2,053 3,081 4,685
Total Sales 5,368 8,333 12,097 11,609 14,838 18,106
Cost of Sales
Food 1,359 2,067 3,296 2,742 3,928 5,461
Beverage 314 583 989 583 851 1,166
Total Cost of Sales 1,847 3,000 4,137 3,364 4,920 6,297
Gross Profit 3,489 5,428 8,140 6,753 9,490 11,936
Operating Expenses
Salaries and Wages (including Employee Benefits) 1,980 3,063 4,586 3,856 4,639 5,770
Direct Operating Expenses 253 535 890 445 662 1,000
Music and Entertainment 9 30 79 0 34 87
Marketing 67 143 311 82 228 430
Utility Services 191 295 427 282 447 663
Restaurant Occupancy Costs 281 523 732 395 637 1,037
Repairs and Maintenance 80 142 251 141 305 401
Depreciation 69 159 283 166 282 505
Other Expense/(Income) 1 154 324 (73) (18) 145
General & Administrative Expenses 106 276 696 305 503 677
Corporate Overhead 0 25 426 ** ** **
Total Operating Expenses 3,147 5,117 7,508 7,225 8,341 10,813
Interest Expense 19 64 173 2 113 205
Other Expenses 0 25 168 ** ** **
Income (Loss) Before Income Taxes ($111) $229 $815 $353 $720 $2,138
Note: Computations include respondents that provided zeros and numerical amounts
** Insufficient data

��
© 2008 by the National Restaurant Association and Deloitte & Touche LLP
Exhibit B-14Full Service Restaurants (Average Check Per Person $15 to $24.99)Statement of Income and Expenses - Ratio to Total Sales*
Affiliation
Single Unit - Independent Multi-Unit - Company Operated
Lower Quartile Median
Upper Quartile
Lower Quartile Median
Upper Quartile
Sales
Food 65.0% 74.7% 83.3% 69.9% 76.5% 81.6%
Beverage 16.7 25.3 35.0 18.4 23.5 30.1
Total Sales 100.0 100.0 100.0 100.0 100.0 100.0
Cost of Sales
Food 30.8 34.5 40.5 31.3 37.3 40.7
Beverage 25.1 29.7 35.3 ** ** **
Total Cost of Sales 30.2 33.1 38.8 29.6 34.2 38.6
Gross Profit 61.2 66.7 69.8 61.4 65.8 70.4
Operating Expenses
Salaries and Wages (including Employee Benefits) 29.1 34.0 40.0 27.8 33.4 34.7
Direct Operating Expenses 4.0 6.1 8.4 2.9 4.2 8.1
Music and Entertainment 0.1 0.4 1.4 0.0 0.2 0.9
Marketing 0.9 1.8 3.0 1.0 2.0 2.8
Utility Services 2.6 3.6 4.8 2.5 3.0 4.1
Restaurant Occupancy Costs 3.2 5.9 7.8 2.3 5.8 6.4
Repairs and Maintenance 0.9 1.8 2.4 1.1 1.7 2.6
Depreciation 1.0 2.0 2.9 1.2 1.8 2.3
Other Expense/(Income) 0.0 0.4 1.4 ** ** **
General & Administrative Expenses 1.4 3.0 6.5 1.8 3.0 3.7
Corporate Overhead 0.0 0.3 6.1 ** ** **
Total Operating Expenses 54.7 60.9 67.7 52.5 58.9 63.7
Interest Expense 0.2 1.0 2.0 0.0 0.6 1.3
Other Expenses 0.0 0.4 1.4 ** ** **
Income (Loss) Before Income Taxes (1.2%) 3.3% 7.9% 2.9% 6.0% 10.0%
Note: Computations include respondents that provided zeros and numerical amounts
* All ratios are based as a percentage of total sales except food and beverage costs, which are based on their respective sales
** Insufficient data

��
© 2008 by the National Restaurant Association and Deloitte & Touche LLP
Exhibit B-15Full Service Restaurants (Average Check Per Person $15 to $24.99)Statement of Income and Expenses - Amount per Seat
Sales Volume ($000)
Between $500 and $999 Between $1,000 and $1,999 $2,000 and Over
Lower Quartile Median
Upper Quartile
Lower Quartile Median
Upper Quartile
Lower Quartile Median
Upper Quartile
Sales
Food $3,346 $4,564 $6,592 $4,482 $6,841 $9,210 $6,705 $10,261 $13,951
Beverage 545 1,086 1,668 1,583 2,656 3,661 2,333 3,311 4,560
Total Sales 4,367 5,725 8,409 7,450 9,983 12,269 10,154 13,642 17,749
Cost of Sales
Food 1,077 1,679 2,295 1,600 2,423 3,378 2,217 3,772 5,281
Beverage 200 333 489 459 746 1,165 539 876 1,177
Total Cost of Sales 1,431 1,936 3,058 2,222 3,333 4,423 3,226 4,620 6,277
Gross Profit 2,911 3,620 5,479 4,895 6,259 8,362 6,140 9,176 11,723
Operating Expenses
Salaries and Wages (including Employee Benefits) 1,320 2,126 3,017 2,459 3,392 4,490 3,008 4,531 5,423
Direct Operating Expenses 135 420 882 268 611 805 524 811 1,362
Music and Entertainment 5 20 56 10 36 80 10 34 88
Marketing 44 95 160 84 187 324 77 267 436
Utility Services 161 218 306 256 319 464 257 394 520
Restaurant Occupancy Costs 228 323 564 409 552 819 408 615 1,024
Repairs and Maintenance 46 94 176 98 156 240 139 234 307
Depreciation 49 133 227 69 174 234 89 283 489
Other Expense/(Income) 0 100 166 0 99 378 (17) 169 335
General & Administrative Expenses 64 143 548 279 416 804 136 347 739
Corporate Overhead ** ** ** ** ** ** 0 67 671
Total Operating Expenses 2,630 3,221 5,170 4,462 5,874 7,845 5,826 8,150 10,825
Interest Expense 4 59 169 19 75 154 25 103 250
Other Expenses ** ** ** 0 12 95 0 25 215
Income (Loss) Before Income Taxes ($283) $109 $400 ($48) $400 $874 $201 $712 $1,799
Note: Computations include respondents that provided zeros and numerical amounts
** Insufficient data

��
© 2008 by the National Restaurant Association and Deloitte & Touche LLP
Exhibit B-16Full Service Restaurants (Average Check Per Person $15 to $24.99)Statement of Income and Expenses - Ratio to Total Sales*
Sales Volume ($000)
Between $500 and $999 Between $1,000 and $1,999 $2,000 and Over
Lower Quartile Median
Upper Quartile
Lower Quartile Median
Upper Quartile
Lower Quartile Median
Upper Quartile
Sales
Food 68.8% 78.1% 87.4% 60.0% 72.7% 80.1% 70.0% 76.0% 81.9%
Beverage 12.6 21.9 31.3 19.9 27.3 40.0 18.1 24.0 30.0
Total Sales 100.0 100.0 100.0 100.0 100.0 100.0 100.0 100.0 100.0
Cost of Sales
Food 30.7 35.7 40.0 30.7 34.5 40.7 30.5 33.3 40.2
Beverage 26.6 30.1 39.7 25.3 29.5 33.4 22.6 25.5 30.9
Total Cost of Sales 30.4 34.8 38.8 29.4 33.1 37.3 29.5 31.7 37.9
Gross Profit 61.2 65.2 69.6 62.7 66.9 70.6 62.1 68.3 70.5
Operating Expenses
Salaries and Wages (including Employee Benefits) 29.5 35.3 43.4 29.1 35.0 41.4 29.0 32.3 34.9
Direct Operating Expenses 4.0 5.9 10.0 3.3 5.7 7.6 3.8 5.5 8.7
Music and Entertainment 0.1 0.4 1.5 0.1 0.3 1.1 0.1 0.3 0.9
Marketing 0.7 1.6 2.9 1.0 1.9 3.4 0.9 1.8 2.9
Utility Services 2.8 3.8 5.2 2.7 3.4 4.3 2.3 2.7 3.8
Restaurant Occupancy Costs 3.0 6.1 8.7 3.4 5.8 7.3 3.2 5.9 7.4
Repairs and Maintenance 0.8 1.8 2.9 0.9 1.8 2.1 1.2 1.6 2.3
Depreciation 1.1 2.4 4.3 1.1 1.7 2.4 1.0 1.9 3.0
Other Expense/(Income) 0.0 0.9 4.7 0.0 1.1 4.2 (0.1) 0.8 3.6
General & Administrative Expenses 1.2 2.6 6.3 2.9 4.2 7.1 1.0 2.4 5.3
Corporate Overhead ** ** ** ** ** ** 0.0 0.4 6.0
Total Operating Expenses 57.4 62.0 68.8 56.2 62.0 68.2 51.0 59.1 65.4
Interest Expense 0.0 0.8 2.5 0.2 1.0 2.1 0.2 0.8 1.6
Other Expenses ** ** ** 0.0 0.2 1.6 0.0 0.2 1.2
Income (Loss) Before Income Taxes (5.8%) 1.5% 7.3% (0.3%) 4.0% 7.5% 2.0% 5.5% 11.2%
Note: Computations include respondents that provided zeros and numerical amounts
* All ratios are based as a percentage of total sales except food and beverage costs, which are based on their respective sales
** Insufficient data

�0
© 2008 by the National Restaurant Association and Deloitte & Touche LLP
Exhibit B-17Full Service Restaurants (Average Check Per Person $15 to $24.99)Statement of Income and Expenses - Amount per Seat
Menu Theme
Steak/Seafood American (varied)
Lower Quartile Median
Upper Quartile
Lower Quartile Median
Upper Quartile
Sales
Food $4,306 $7,567 $11,085 $3,597 $6,395 $9,045
Beverage 927 2,193 3,333 1,339 2,741 3,957
Total Sales 6,693 8,596 13,072 5,407 9,285 13,342
Cost of Sales
Food 1,907 3,126 4,050 1,424 2,224 3,310
Beverage 328 556 857 416 785 1,208
Total Cost of Sales 2,274 3,378 4,896 1,913 3,200 4,435
Gross Profit 4,144 5,250 8,811 3,480 5,864 8,347
Operating Expenses
Salaries and Wages (including Employee Benefits) 1,973 3,251 4,620 2,169 3,101 4,886
Direct Operating Expenses 395 744 1,068 292 515 879
Music and Entertainment 4 13 83 20 46 94
Marketing 73 172 311 61 152 362
Utility Services 200 300 428 192 309 489
Restaurant Occupancy Costs 284 432 604 230 516 790
Repairs and Maintenance 105 167 263 60 171 300
Depreciation 69 139 274 65 171 357
Other Expense/(Income) 30 157 385 (45) 29 216
General & Administrative Expenses 95 255 398 133 360 696
Corporate Overhead ** ** ** 0 0 333
Total Operating Expenses 3,921 5,372 7,605 2,976 5,246 7,855
Interest Expense 24 68 182 9 59 164
Other Expenses ** ** ** 0 6 94
Income (Loss) Before Income Taxes $26 $292 $984 ($111) $269 $889
Note: Computations include respondents that provided zeros and numerical amounts
** Insufficient data

�1
© 2008 by the National Restaurant Association and Deloitte & Touche LLP
Exhibit B-18Full Service Restaurants (Average Check Per Person $15 to $24.99)Statement of Income and Expenses - Ratio to Total Sales*
Menu Theme
Steak/Seafood American (varied)
Lower Quartile Median
Upper Quartile
Lower Quartile Median
Upper Quartile
Sales
Food 71.5% 78.0% 84.0% 61.3% 69.4% 79.8%
Beverage 16.0 22.0 28.5 20.2 30.6 38.7
Total Sales 100.0 100.0 100.0 100.0 100.0 100.0
Cost of Sales
Food 32.3 36.7 44.5 32.0 35.6 40.8
Beverage 23.5 28.2 33.5 24.9 29.5 34.1
Total Cost of Sales 31.3 34.4 41.0 30.2 34.0 38.8
Gross Profit 59.0 65.6 68.7 61.2 66.0 69.8
Operating Expenses
Salaries and Wages (including Employee Benefits) 29.0 33.6 36.9 30.0 34.1 40.7
Direct Operating Expenses 4.4 7.6 9.8 3.7 5.5 7.9
Music and Entertainment 0.1 0.2 1.0 0.2 0.5 1.5
Marketing 0.8 1.6 3.2 1.0 2.0 3.0
Utility Services 2.6 3.5 4.3 2.8 3.6 4.7
Restaurant Occupancy Costs 2.1 4.9 7.3 2.6 5.8 7.5
Repairs and Maintenance 1.2 1.9 3.0 1.0 1.8 2.8
Depreciation 0.8 1.7 2.7 1.0 2.0 3.1
Other Expense/(Income) 0.4 1.7 4.9 (0.3) 0.5 2.0
General & Administrative Expenses 0.8 2.5 4.4 1.7 3.0 6.9
Corporate Overhead ** ** ** 0.0 0.0 3.8
Total Operating Expenses 53.5 59.2 64.1 52.4 60.2 68.1
Interest Expense 0.2 1.3 2.3 0.1 0.7 1.7
Other Expenses ** ** ** 0.0 0.1 1.1
Income (Loss) Before Income Taxes (0.7%) 3.0% 8.8% (1.2%) 3.5% 9.6%
Note: Computations include respondents that provided zeros and numerical amounts
* All ratios are based as a percentage of total sales except food and beverage costs, which are based on their respective sales
** Insufficient data

�2
© 2008 by the National Restaurant Association and Deloitte & Touche LLP
Exhibit B-19Full Service Restaurants (Average Check Per Person $15 to $24.99)Statement of Income and Expenses - Amount per Seat
Metropolitan/Non-Metropolitan Location
Inside MSA*** Outside MSA***
Lower Quartile Median
Upper Quartile
Lower Quartile Median
Upper Quartile
Sales
Food $4,328 $6,870 $11,475 $3,629 $5,634 $8,252
Beverage 1,230 2,703 3,972 859 1,636 2,656
Total Sales 6,750 10,000 14,537 4,966 6,824 10,445
Cost of Sales
Food 1,464 2,371 4,084 1,483 2,139 3,110
Beverage 351 731 1,166 256 517 696
Total Cost of Sales 2,125 3,273 5,134 1,858 2,694 3,682
Gross Profit 4,692 6,283 9,624 3,107 4,142 6,633
Operating Expenses
Salaries and Wages (including Employee Benefits) 2,417 3,400 5,159 1,797 2,755 4,426
Direct Operating Expenses 322 611 1,000 216 611 839
Music and Entertainment 9 41 84 3 23 46
Marketing 81 190 417 49 121 199
Utility Services 208 319 471 170 270 352
Restaurant Occupancy Costs 321 591 944 132 309 533
Repairs and Maintenance 98 167 291 60 104 239
Depreciation 79 184 328 64 200 484
Other Expense/(Income) (9) 103 319 0 138 311
General & Administrative Expenses 135 360 711 56 219 392
Corporate Overhead 0 40 500 ** ** **
Total Operating Expenses 3,263 5,803 8,327 2,843 4,540 6,357
Interest Expense 12 73 184 15 62 126
Other Expenses 0 17 229 ** ** **
Income (Loss) Before Income Taxes $22 $430 $1,260 ($326) $119 $387
Note: Computations include respondents that provided zeros and numerical amounts
** Insufficient data
*** Metropolitan statistical area

��
© 2008 by the National Restaurant Association and Deloitte & Touche LLP
Exhibit B-20Full Service Restaurants (Average Check Per Person $15 to $24.99)Statement of Income and Expenses - Ratio to Total Sales*
Metropolitan/Non-Metropolitan Location
Inside MSA*** Outside MSA***
Lower Quartile Median
Upper Quartile
Lower Quartile Median
Upper Quartile
Sales
Food 64.7% 74.6% 82.8% 67.7% 78.8% 83.7%
Beverage 17.2 25.4 35.3 16.3 21.2 32.3
Total Sales 100.0 100.0 100.0 100.0 100.0 100.0
Cost of Sales
Food 30.5 33.9 39.6 34.7 39.7 44.3
Beverage 24.1 28.1 33.4 ** ** **
Total Cost of Sales 29.5 32.2 36.9 33.7 38.7 43.8
Gross Profit 63.1 67.8 70.5 56.2 61.3 66.3
Operating Expenses
Salaries and Wages (including Employee Benefits) 28.9 32.6 37.6 31.3 35.5 42.3
Direct Operating Expenses 3.7 5.9 8.3 4.2 5.9 8.9
Music and Entertainment 0.1 0.4 1.3 0.0 0.3 1.0
Marketing 1.0 2.0 3.7 0.9 1.5 2.2
Utility Services 2.5 3.3 4.7 2.7 3.5 4.6
Restaurant Occupancy Costs 3.4 6.0 8.1 1.9 3.5 6.9
Repairs and Maintenance 1.0 1.7 2.4 0.9 1.7 2.4
Depreciation 1.1 2.0 2.8 1.1 2.1 3.2
Other Expense/(Income) (0.1) 0.9 3.5 0.0 1.3 4.9
General & Administrative Expenses 1.4 3.1 6.0 1.0 2.4 4.8
Corporate Overhead 0.0 0.4 5.0 ** ** **
Total Operating Expenses 55.2 60.7 66.6 52.3 59.2 67.5
Interest Expense 0.1 0.8 1.7 0.2 1.1 1.9
Other Expenses 0.0 0.4 1.5 ** ** **
Income (Loss) Before Income Taxes (0.4%) 4.2% 9.5% (5.9%) 1.7% 7.7%
Note: Computations include respondents that provided zeros and numerical amounts
* All ratios are based as a percentage of total sales except food and beverage costs, which are based on their respective sales
** Insufficient data
*** Metropolitan statistical area

��
© 2008 by the National Restaurant Association and Deloitte & Touche LLP
Exhibit B-21Full Service Restaurants (Average Check Per Person $15 to $24.99)Statement of Income and Expenses - Amount per Seat
Average Check
$15.00 to $19.99 $20.00 to $24.99
Lower Quartile Median
Upper Quartile
Lower Quartile Median
Upper Quartile
Sales
Food $4,539 $6,670 $9,681 $3,483 $6,395 $10,254
Beverage 1,086 2,600 3,554 1,233 2,117 3,604
Total Sales 6,491 8,977 13,877 5,286 9,018 13,143
Cost of Sales
Food 1,564 2,609 3,733 1,246 2,033 3,750
Beverage 322 597 914 409 600 1,129
Total Cost of Sales 2,087 3,290 4,779 1,703 3,078 4,460
Gross Profit 4,123 5,631 9,471 3,444 6,041 8,346
Operating Expenses
Salaries and Wages (including Employee Benefits) 2,329 3,455 5,166 1,871 3,000 4,500
Direct Operating Expenses 347 606 911 224 505 882
Music and Entertainment 9 28 81 8 29 73
Marketing 80 189 356 56 111 311
Utility Services 236 318 472 176 291 405
Restaurant Occupancy Costs 354 533 880 212 511 780
Repairs and Maintenance 95 179 285 66 139 238
Depreciation 74 200 335 74 159 300
Other Expense/(Income) 0 126 324 (3) 100 282
General & Administrative Expenses 121 357 725 91 322 676
Corporate Overhead 0 11 413 0 67 480
Total Operating Expenses 3,607 5,449 8,363 2,842 5,449 7,957
Interest Expense 21 59 166 7 71 188
Other Expenses 0 38 168 0 7 112
Income (Loss) Before Income Taxes ($135) $242 $1,171 $54 $387 $804
Note: Computations include respondents that provided zeros and numerical amounts

��
© 2008 by the National Restaurant Association and Deloitte & Touche LLP
Exhibit B-22Full Service Restaurants (Average Check Per Person $15 to $24.99)Statement of Income and Expenses - Ratio to Total Sales*
Average Check
$15.00 to $19.99 $20.00 to $24.99
Lower Quartile Median
Upper Quartile
Lower Quartile Median
Upper Quartile
Sales
Food 65.2% 76.9% 85.0% 67.3% 73.3% 80.5%
Beverage 15.0 23.1 34.8 19.5 26.7 32.7
Total Sales 100.0 100.0 100.0 100.0 100.0 100.0
Cost of Sales
Food 30.8 34.8 40.8 30.5 34.5 40.0
Beverage 24.0 27.9 33.6 25.5 31.1 34.8
Total Cost of Sales 29.9 33.0 38.6 30.3 33.3 38.5
Gross Profit 61.4 67.0 70.1 61.5 66.7 69.7
Operating Expenses
Salaries and Wages (including Employee Benefits) 29.6 33.6 39.4 28.3 33.1 39.0
Direct Operating Expenses 3.8 6.1 8.9 3.8 5.4 8.1
Music and Entertainment 0.1 0.3 1.0 0.1 0.4 1.3
Marketing 1.0 2.0 3.0 0.8 1.5 2.7
Utility Services 2.6 3.5 4.3 2.5 3.2 4.7
Restaurant Occupancy Costs 3.3 6.0 7.5 2.5 5.5 8.0
Repairs and Maintenance 1.0 1.8 2.5 1.0 1.8 2.4
Depreciation 1.1 1.8 3.0 1.0 2.2 3.0
Other Expense/(Income) 0.0 1.3 4.2 0.0 0.9 4.8
General & Administrative Expenses 1.5 2.7 6.4 1.2 3.2 6.0
Corporate Overhead 0.0 0.1 4.3 0.0 0.4 6.9
Total Operating Expenses 55.3 61.0 68.3 54.3 60.6 66.4
Interest Expense 0.2 0.8 1.5 0.1 1.0 2.3
Other Expenses 0.0 0.4 1.4 0.0 0.1 0.9
Income (Loss) Before Income Taxes (2.3%) 2.7% 8.9% 0.8% 4.1% 8.5%
Note: Computations include respondents that provided zeros and numerical amounts
* All ratios are based as a percentage of total sales except food and beverage costs, which are based on their respective sales

��
© 2008 by the National Restaurant Association and Deloitte & Touche LLP
Exhibit B-23Full Service Restaurants (Average Check Per Person $15 to $24.99)Income Differential
Amount per Seat Ratio to Total Sales*
Profit Loss Profit Loss
Lower Quartile Median
Upper Quartile
Lower Quartile Median
Upper Quartile
Lower Quartile Median
Upper Quartile
Lower Quartile Median
Upper Quartile
Sales
Food $4,434 $6,928 $11,696 $3,399 $5,556 $8,333 67.9% 76.0% 83.9% 63.5% 71.1% 83.7%
Beverage 1,226 2,620 3,781 846 1,570 3,203 17.2 24.6 32.6 16.3 28.9 36.5
Total Sales 6,413 10,035 14,656 5,008 7,334 10,034 100.0 100.0 100.0 100.0 100.0 100.0
Cost of Sales
Food 1,554 2,406 4,179 1,270 2,012 2,800 30.5 34.1 40.0 31.8 35.7 41.6
Beverage 360 668 1,094 ** ** ** 24.2 28.5 33.7 26.6 30.1 38.3
Total Cost of Sales 2,105 3,322 5,182 1,772 2,502 3,407 29.8 32.9 38.2 31.0 33.9 39.0
Gross Profit 4,199 6,522 9,706 3,321 4,627 6,633 61.8 67.1 70.2 61.0 66.1 69.0
Operating Expenses
Salaries and Wages (including Employee Benefits) 2,278 3,546 5,149 1,805 2,770 4,391 29.0 32.8 36.5 29.6 37.0 42.6
Direct Operating Expenses 330 633 907 248 432 832 3.8 5.7 8.2 3.8 6.0 9.1
Music and Entertainment 7 24 68 16 33 149 0.1 0.3 0.8 0.2 0.6 2.0
Marketing 58 138 359 83 160 313 0.7 1.6 2.5 1.3 2.6 4.6
Utility Services 194 313 472 203 300 405 2.4 3.2 4.1 3.0 3.9 5.6
Restaurant Occupancy Costs 293 532 873 207 517 769 3.2 5.8 7.4 2.8 7.2 9.1
Repairs and Maintenance 83 155 257 88 145 313 0.9 1.6 2.2 1.2 2.1 3.3
Depreciation 84 195 359 65 154 227 1.1 2.0 2.9 0.8 2.0 3.3
Other Expense/(Income) (6) 130 377 0 32 282 0.0 1.3 4.1 0.0 0.7 4.7
General & Administrative Expenses 105 346 684 124 279 750 1.3 2.8 5.3 1.7 4.1 9.2
Corporate Overhead 0 40 505 0 8 160 0.0 0.4 5.9 0.0 0.1 3.3
Total Operating Expenses 2,991 5,799 8,375 3,687 5,160 7,198 52.2 58.4 62.5 66.3 70.6 75.9
Interest Expense 24 95 205 6 40 116 0.3 1.0 1.9 0.1 0.7 1.8
Other Expenses 0 11 147 0 22 158 0.0 0.1 1.2 0.0 0.3 2.4
Income (Loss) Before Income Taxes $235 $627 $1,363 ($1,050) ($400) ($133) 3.0% 6.1% 11.4% (13.4%) (6.3%) (2.5%)
Note: Computations include respondents that provided zeros and numerical amounts
* All ratios are based as a percentage of total sales except food and beverage costs, which are based on their respective sales
** Insufficient data

��
© 2008 by the National Restaurant Association and Deloitte & Touche LLP
Exhibit C-1 presents the characteristics of the 170 respondents in the Full Service Restaurants (Average Check Per Person $25 and Over) category of this year’s study. More than two-thirds (70.0%) of the respondents represent independent restaurants and 53.5% reported that they were the sole occupant of their location. Restaurants with American menu themes represent 45.9% of this sample.
The median ratio of income before income taxes to total sales is 4.1% or $577 per seat.
Highlights • Median average check is $35.00.
• Median total sales per full-time equivalent employee is $66,269.
• Median food sales are $9,319 per seat and median beverage sales are $3,831 per seat.
• Median total sales per square foot is $368.
• Median income before income taxes is 4.1% of total sales.
• Median total cost of sales is 32.4% of total sales.
Characteristics• 70.0% of full service (average check $25 and over) restaurants are
single units, i.e., independents.
• 72.4% of the responding establishments have sales volume of $1,000,000 and over.
• 45.9% of the respondents report an American menu theme.
• 60.6% of the respondents operate their businesses in locations with less than 7,500 square feet and 59.5% of the respondents have less than 200 seats.
Section C-Full Service Restaurants (Average Check Per Person $25 and Over)

��
© 2008 by the National Restaurant Association and Deloitte & Touche LLP
Exhibit C-1Composition of Participating Full Service Restaurants(Average Check Per Person $25 and Over)Number of Respondents: 170
Percentage of Respondents
Percentage of Respondents
Type of Establishment: Ownership:Food Only 2.4% Sole Proprietorship 17.6%Food and Beverage 97.6 Partnership 19.4
Public Corporation 1.2Years in Business: Private Corporation 61.81 to 5 Years 21.8%5 to 10 Years 22.9 Menu Theme:Over 10 Years 55.3 Steak/Seafood 20.6%
American (varied) 45.9Region: 1 Italian 12.9Northeast 21.8% Asian 1.8North Central 20.0 Other 18.8South 20.6West 36.4 Sales Volume: 3
Not Specified 1.2 Under $500,000 8.2%$500,000 to $999,999 19.4
Average Check: 2 $1,000,000 to $1,999,999 26.5$25.00 to $32.99 39.4% $2,000,000 and Over 45.9$33.00 and Over 60.6
Restaurant Location:Affiliation: Hotel 10.0%Single Unit - Independent 70.0% Shopping Center or Mall 9.4Single Unit - Franchise Operated 1.8 Sole Occupant 53.5Multi-Unit - Company Operated 27.6 Other 27.1Multi-Unit - Franchise Operated 0.6
Total Number of Seats:Profit versus Loss: 3 Under 100 31.2%Profit 74.9% 100 to 149 15.9Loss 25.1 150 to 199 12.4
200 to 399 34.7Lease versus Own: 400 and Over 4.7Own Land and Building 24.7% Not Specified 1.1Lease Land and Building 47.1Lease Land and Own Building 2.9 Total Restaurant Square Footage:Own Land and Lease Building 0.6 Under 2,500 14.7%Not Specified 24.7 2,500 to 4,999 24.7
5,000 to 7,499 21.27,500 and Over 34.1Not Specified 5.3
¹ Regions:
Northeast: CT, ME, MA, NH, NJ, NY, PA, RI, VT
North Central: IL, IN, IA, KS, MI, MN, MO, NE, ND, OH, SD, WI
South: AL, AR, DC, DE, FL, GA, KY, LA, MD, MS, OK, NC, SC, TN, TX, VA, WV
West: AK, AZ, CA, CO, HI, ID, MT, NV, NM, OR, UT, WA, WY
² Per person, all meals
³ For respondents specifying

�0
© 2008 by the National Restaurant Association and Deloitte & Touche LLP
Exhibit C-2Full Service Restaurants (Average Check Per Person $25 and Over)Average Check
Total
Lower Quartile Median
Upper Quartile
All Restaurants $29.00 $35.00 $43.00
Type of Establishment
Food Only ** ** **
Food and Beverage $29.00 $35.00 $43.00
Restaurant Location
Hotel ** ** **
Shopping Center or Mall ** ** **
Sole Occupant $29.00 $36.00 $43.50
Other 33.00 38.00 53.00
Profit versus Loss
Profit $30.00 $36.00 $45.00
Loss 26.25 31.00 37.50
Menu Theme
Steak/Seafood $27.00 $33.00 $44.50
American (varied) 30.00 35.00 40.00
Italian 30.25 35.50 42.25
Asian ** ** **
Other 28.50 36.00 53.50
Affiliation
Single Unit - Independent $28.25 $35.50 $47.00
Single Unit - Franchise Operated 25.00 25.00 32.50
Multi-Unit - Company Operated 32.00 35.00 37.00
Multi-Unit - Franchise Operated ** ** **
Ownership
Sole Proprietorship $28.25 $35.50 $43.50
Partnership 30.00 35.00 47.00
Public Corporation ** ** **
Private Corporation 28.75 35.00 40.50
Sales Volume
Under $500,000 ** ** **
$500,000 to $999,999 $28.00 $32.00 $47.00
$1,000,000 to $1,999,999 27.00 35.00 43.00
$2,000,000 and Over 30.25 35.50 43.00
** Insufficient data

�1
© 2008 by the National Restaurant Association and Deloitte & Touche LLP
Exhibit C-3Full Service Restaurants (Average Check Per Person $25 and Over)Average Daily Seat Turnover
Total
Lower Quartile Median
Upper Quartile
All Restaurants 0.6 1.0 1.5
Type of Establishment
Food Only ** ** **
Food and Beverage 0.6 1.0 1.5
Restaurant Location
Hotel ** ** **
Shopping Center or Mall ** ** **
Sole Occupant 0.6 1.0 1.3
Other 0.6 0.9 1.4
Profit versus Loss
Profit 0.7 1.1 1.6
Loss 0.5 0.8 1.1
Menu Theme
Steak/Seafood 0.7 0.9 1.1
American (varied) 0.7 1.2 1.5
Italian 0.6 0.9 1.6
Asian ** ** **
Other 0.5 0.8 1.3
Average Check
$25.00 to $32.99 0.7 1.1 1.7
$33.00 and Over 0.6 0.8 1.4
Affiliation
Single Unit - Independent 0.5 0.8 1.2
Single Unit - Franchise Operated ** ** **
Multi-Unit - Company Operated 1.1 1.5 2.1
Multi-Unit - Franchise Operated ** ** **
Ownership
Sole Proprietorship 0.5 0.8 1.1
Partnership 0.7 1.1 1.6
Public Corporation ** ** **
Private Corporation 0.7 1.0 1.5
Sales Volume
Under $500,000 ** ** **
$500,000 to $999,999 0.5 0.8 1.0
$1,000,000 to $1,999,999 0.6 0.8 1.0
$2,000,000 and Over 1.1 1.4 1.9
** Insufficient data

�2
© 2008 by the National Restaurant Association and Deloitte & Touche LLP
Exhibit C-4Full Service Restaurants (Average Check Per Person $25 and Over)Cost per Dollar of Sales*
Total Cost of Sales
Total Payroll and Benefits Prime Cost
All Restaurants 32.4¢ 34.5¢ 65.6¢
Type of Establishment
Food Only ** ** **
Food and Beverage 32.3¢ 34.5¢ 65.5¢
Restaurant Location
Hotel ** ** **
Shopping Center or Mall ** ** **
Sole Occupant 33.3¢ 32.5¢ 64.7¢
Other 29.2 35.0 66.4
Profit versus Loss
Profit 30.3¢ 34.2¢ 64.1¢
Loss 35.1 37.5 76.5
Menu Theme
Steak/Seafood 35.7¢ 31.7¢ 68.6¢
American (varied) 30.2 34.6 64.1
Italian ** ** 65.9
Asian ** ** **
Other 31.7 34.9 66.9
Average Check
$25.00 to $32.99 33.5¢ 33.4¢ 66.3¢
$33.00 and Over 30.4 34.7 64.7
Affiliation
Single Unit - Independent 33.4¢ 34.7¢ 68.0¢
Multi-Unit - Company Operated 27.6 34.3 62.8
Multi-Unit - Franchise Operated ** ** **
Ownership
Sole Proprietorship 33.5¢ 32.5¢ 68.4¢
Partnership 30.6 37.4 66.9
Public Corporation ** ** **
Private Corporation 31.2 34.1 64.2
Sales Volume
Under $500,000 ** ** **
$500,000 to $999,999 34.7¢ 35.3¢ 67.5¢
$1,000,000 to $1,999,999 34.3 34.5 72.1
$2,000,000 and Over 28.5 34.1 63.1
* All amounts are medians
** Insufficient data

��
© 2008 by the National Restaurant Association and Deloitte & Touche LLP
Exhibit C-5Full Service Restaurants (Average Check Per Person $25 and Over)Number of Employees*
Number of Employees per Restaurant
Full TimePart Time
(20-34 Hours)
Part-Part-Time (Under 20
Hours)
All Restaurants 18 15 4
Type of Establishment
Food Only ** ** **
Food and Beverage 19 15 5
Restaurant Location
Hotel ** ** **
Shopping Center or Mall ** ** **
Sole Occupant 16 10 4
Other 19 13 4
Profit versus Loss
Profit 23 16 5
Loss 10 9 4
Menu Theme
Steak/Seafood 12 15 4
American (varied) 23 20 10
Italian 22 10 4
Asian ** ** **
Other 14 7 0
Average Check
$25.00 to $32.99 14 12 4
$33.00 and Over 21 15 5
Affiliation
Single Unit - Independent 12 10 3
Multi-Unit - Company Operated 28 32 20
Multi-Unit - Franchise Operated ** ** **
Ownership
Sole Proprietorship 9 10 3
Partnership 24 15 5
Public Corporation ** ** **
Private Corporation 21 20 9
Sales Volume
Under $500,000 ** ** **
$500,000 to $999,999 6 7 2
$1,000,000 to $1,999,999 12 10 4
$2,000,000 and Over 32 30 16
* All amounts are medians
** Insufficient data

��
© 2008 by the National Restaurant Association and Deloitte & Touche LLP
Exhibit C-6Full Service Restaurants (Average Check Per Person $25 and Over)Annual Employee Turnover*
All Employees
Salaried Employees
Hourly Employees
All Restaurants 75% 60% 79%
Type of Establishment
Food Only ** ** **
Food and Beverage 76% 63% 79%
Restaurant Location
Hotel ** ** **
Shopping Center or Mall ** ** **
Sole Occupant 74% 58% 81%
Other 69 ** **
Profit versus Loss
Profit 73% 60% 78%
Loss 82 63 90
Menu Theme
Steak/Seafood 57% 38% 60%
American (varied) 85 67 93
Italian ** ** **
Asian ** ** **
Other 84 67 86
Average Check
$25.00 to $32.99 68% 47% 75%
$33.00 and Over 79 67 86
Affiliation
Single Unit - Independent 56% 43% 60%
Multi-Unit - Company Operated 106 75 108
Multi-Unit - Franchise Operated ** ** **
Ownership
Sole Proprietorship ** ** **
Partnership 69% ** **
Public Corporation ** ** **
Private Corporation 80 67 88
Sales Volume
Under $500,000 ** ** **
$500,000 to $999,999 78% 33% 82%
$1,000,000 to $1,999,999 52 ** **
$2,000,000 and Over 85 67 93
* Amounts for all employees and hourly employees are medians; amounts for salaried employees are upper quartiles.
All amounts are derived from the number of W-2’s and the number of employees
** Insufficient data

��
© 2008 by the National Restaurant Association and Deloitte & Touche LLP
Exhibit C-7Full Service Restaurants (Average Check Per Person $25 and Over)Employee Information*
Full-Time Equivalent EmployeesAmount per Full-Time Equivalent Employee
TotalPer 100
Restaurant SeatsPer 100 Average
Daily Covers Total SalesTotal Payroll and Benefits
All Restaurants 29.2 20.6 20.6 $66,269 $23,650
Type of Establishment
Food Only ** ** ** ** **
Food and Beverage 29.8 20.8 20.8 $66,006 $23,737
Restaurant Location
Hotel ** ** ** ** **
Shopping Center or Mall ** ** ** ** **
Sole Occupant 27.5 19.4 22.6 $63,560 $20,992
Other 28.8 21.2 19.7 69,444 23,737
Profit versus Loss
Profit 35.0 23.4 20.4 $69,961 $24,397
Loss 20.7 16.9 22.6 53,922 17,984
Menu Theme
Steak/Seafood 28.6 18.4 20.9 $67,173 $18,769
American (varied) 42.5 23.6 18.3 69,393 24,412
Italian 35.3 19.6 21.2 62,524 **
Asian ** ** ** ** **
Other 23.2 19.6 25.0 64,000 19,544
Average Check
$25.00 to $32.99 26.1 19.9 17.3 $58,904 $20,010
$33.00 and Over 35.0 21.0 23.0 70,756 24,546
Affiliation
Single Unit - Independent 23.6 18.7 23.0 $59,808 $19,360
Multi-Unit - Company Operated 58.6 25.2 16.9 75,244 25,906
Multi-Unit - Franchise Operated ** ** ** ** **
Ownership
Sole Proprietorship 15.7 15.7 22.5 $55,457 $18,779
Partnership 32.2 23.8 23.5 67,614 23,942
Public Corporation ** ** ** ** **
Private Corporation 35.0 22.9 19.1 67,173 24,186
Sales Volume
Under $500,000 ** ** ** ** **
$500,000 to $999,999 12.9 18.1 23.5 $54,105 $19,255
$1,000,000 to $1,999,999 24.2 16.4 20.9 59,058 19,048
$2,000,000 and Over 60.9 25.2 17.7 71,311 24,848
* All amounts are medians. Based on 35 hours per week. Factors used to compute full-time equivalent employees are as follows:
full-time (35 hours or more) equals 1.0; part-time (20-34 hours) equals 0.7; part-part-time (less than 20 hours) equals 0.35
** Insufficient data

��
© 2008 by the National Restaurant Association and Deloitte & Touche LLP
Exhibit C-8Full Service Restaurants (Average Check Per Person $25 and Over)Take-Out/Drive Through, Outside Catering andBanquet Service - Ratio to Total Sales*
Take-Out/ Drive Through
Outside Catering
Banquet Service
All Restaurants 2% 4% 10%
Type of Establishment
Food Only ** ** **
Food and Beverage 2% 4% 12%
Restaurant Location
Hotel ** ** **
Shopping Center or Mall ** ** **
Sole Occupant 2% 2% 10%
Other ** ** **
Profit versus Loss
Profit 2% 2% 11%
Loss ** ** 10
Menu Theme
Steak/Seafood ** ** **
American (varied) 2% ** 10%
Italian ** ** **
Asian ** ** **
Other ** ** **
Average Check
$25.00 to $32.99 3% 3% 8%
$33.00 and Over 2 4 15
Affiliation
Single Unit - Independent 2% 4% 10%
Multi-Unit - Company Operated ** ** **
Multi-Unit - Franchise Operated ** ** **
Ownership
Sole Proprietorship ** ** **
Partnership ** ** **
Public Corporation ** ** **
Private Corporation 2% 5% 10%
Sales Volume
Under $500,000 ** ** **
$500,000 to $999,999 ** ** **
$1,000,000 to $1,999,999 2% ** 10%
$2,000,000 and Over ** ** 15
* All amounts are medians
** Insufficient data

��
© 2008 by the National Restaurant Association and Deloitte & Touche LLP
Exhibit C-9Full Service Restaurants (Average Check Per Person $25 and Over)Statement of Income and Expenses
All Restaurants
Amount per Seat Ratio to Total Sales*
Lower Quartile Median
Upper Quartile
Lower Quartile Median
Upper Quartile
Sales
Food $6,249 $9,319 $13,458 67.9% 72.6% 77.7%
Beverage 2,135 3,831 5,665 22.8 27.6 32.8
Total Sales 8,761 12,829 19,090 100.0 100.0 100.0
Cost of Sales
Food 2,075 3,083 4,404 28.5 32.6 37.1
Beverage 612 1,129 1,704 25.1 28.2 35.4
Total Cost of Sales 2,777 4,233 5,856 28.2 32.4 36.3
Gross Profit 5,647 8,423 13,289 63.7 67.6 71.8
Operating Expenses
Salaries and Wages (including Employee Benefits) 3,364 5,028 6,852 31.2 34.5 38.3
Direct Operating Expenses 532 838 1,453 4.0 6.0 10.7
Music and Entertainment 13 28 117 0.1 0.2 1.0
Marketing 125 313 478 1.3 2.2 3.0
Utility Services 241 368 529 2.1 2.8 4.0
Restaurant Occupancy Costs 498 843 1,355 4.1 6.9 9.0
Repairs and Maintenance 100 205 370 1.0 1.6 2.2
Depreciation 138 280 592 0.9 2.0 3.9
Other Expense/(Income) (12) 74 383 (0.1) 0.9 2.5
General & Administrative Expenses 178 537 952 2.4 3.8 5.8
Corporate Overhead 193 340 516 1.0 1.9 4.1
Total Operating Expenses 5,276 8,505 11,683 55.4 62.3 68.1
Interest Expense 40 161 213 0.4 1.1 2.1
Other Expenses 36 285 1,002 0.5 2.5 4.1
Income (Loss) Before Income Taxes $13 $577 $1,807 0.1% 4.1% 10.5%
Note: Computations include respondents that provided zeros and numerical amounts
* All ratios are based as a percentage of total sales except food and beverage costs, which are based on their respective sales

��
© 2008 by the National Restaurant Association and Deloitte & Touche LLP
Exhibit C-10Full Service Restaurants (Average Check Per Person $25 and Over)Statement of Income and Expenses - Amount per Square Foot*
All Restaurants Type of Establishment Menu Theme Menu Theme Average Check Restaurant Location Sales Volume ($000)
Lower Quartile Median
Upper Quartile
Food Only
Food and Beverage
Steak/ Seafood
American (varied) Italian Asian Other
$25.00 to $32.99
$33.00 and Over Hotel Other
Shopping Center or Mall
Sole Occupant
Under $500
$500 to $999
$1,000 to $1,999
$2,000 and Over
Sales
Food $191.59 $262.36 $389.80 ** $262.36 $238.86 $287.32 $286.63 ** $211.27 $221.66 $277.58 ** $267.86 ** $240.74 ** $219.38 $218.66 $366.52
Beverage 59.80 102.71 154.99 N/A 103.13 75.20 125.90 ** ** 90.31 78.38 112.46 ** 111.50 ** 91.73 ** 88.00 78.38 145.20
Total Sales 250.00 367.70 554.29 ** 374.40 333.13 422.27 345.50 ** 307.93 331.62 390.01 ** 389.81 ** 350.00 ** 301.81 283.33 540.25
Gross Profit on Sales 168.44 238.50 389.24 ** 238.50 218.75 292.35 241.88 ** 202.17 218.19 259.58 ** 276.79 ** 225.45 ** 191.17 190.97 385.05
Utility Services 6.44 9.77 14.99 ** 9.83 8.21 10.36 ** ** 9.60 9.72 9.77 ** 9.83 ** 9.60 ** 9.28 6.56 12.72
Restaurant Occupancy Costs 11.70 25.25 36.01 ** 25.58 21.40 31.91 ** ** 20.36 14.56 29.78 ** 29.70 ** 22.21 ** 20.50 17.41 34.22
Note: Computations include respondents that provided zeros and numerical amounts
* All amounts are medians unless otherwise stated
** Insufficient data
N/A Not applicable

��
© 2008 by the National Restaurant Association and Deloitte & Touche LLP
Exhibit C-10Full Service Restaurants (Average Check Per Person $25 and Over)Statement of Income and Expenses - Amount per Square Foot*
All Restaurants Type of Establishment Menu Theme Menu Theme Average Check Restaurant Location Sales Volume ($000)
Lower Quartile Median
Upper Quartile
Food Only
Food and Beverage
Steak/ Seafood
American (varied) Italian Asian Other
$25.00 to $32.99
$33.00 and Over Hotel Other
Shopping Center or Mall
Sole Occupant
Under $500
$500 to $999
$1,000 to $1,999
$2,000 and Over
Sales
Food $191.59 $262.36 $389.80 ** $262.36 $238.86 $287.32 $286.63 ** $211.27 $221.66 $277.58 ** $267.86 ** $240.74 ** $219.38 $218.66 $366.52
Beverage 59.80 102.71 154.99 N/A 103.13 75.20 125.90 ** ** 90.31 78.38 112.46 ** 111.50 ** 91.73 ** 88.00 78.38 145.20
Total Sales 250.00 367.70 554.29 ** 374.40 333.13 422.27 345.50 ** 307.93 331.62 390.01 ** 389.81 ** 350.00 ** 301.81 283.33 540.25
Gross Profit on Sales 168.44 238.50 389.24 ** 238.50 218.75 292.35 241.88 ** 202.17 218.19 259.58 ** 276.79 ** 225.45 ** 191.17 190.97 385.05
Utility Services 6.44 9.77 14.99 ** 9.83 8.21 10.36 ** ** 9.60 9.72 9.77 ** 9.83 ** 9.60 ** 9.28 6.56 12.72
Restaurant Occupancy Costs 11.70 25.25 36.01 ** 25.58 21.40 31.91 ** ** 20.36 14.56 29.78 ** 29.70 ** 22.21 ** 20.50 17.41 34.22
Note: Computations include respondents that provided zeros and numerical amounts
* All amounts are medians unless otherwise stated
** Insufficient data
N/A Not applicable

�0
© 2008 by the National Restaurant Association and Deloitte & Touche LLP
Exhibit C-11Full Service Restaurants (Average Check Per Person $25 and Over)Statement of Income and Expenses - Amount per Seat
Type of Establishment
Food Only Food and Beverage
Lower Quartile Median
Upper Quartile
Lower Quartile Median
Upper Quartile
Sales
Food ** ** ** $6,203 $9,164 $13,439
Beverage N/A N/A N/A 2,135 3,831 5,665
Total Sales ** ** ** 8,761 12,829 19,041
Cost of Sales
Food ** ** ** 2,032 3,077 4,361
Beverage N/A N/A N/A 612 1,129 1,704
Total Cost of Sales ** ** ** 2,777 4,233 5,723
Gross Profit ** ** ** 5,647 8,512 13,289
Operating Expenses
Salaries and Wages (including Employee Benefits) ** ** ** 3,334 5,000 6,839
Direct Operating Expenses ** ** ** 520 836 1,444
Music and Entertainment ** ** ** 11 24 94
Marketing ** ** ** 118 307 478
Utility Services ** ** ** 241 368 529
Restaurant Occupancy Costs ** ** ** 495 833 1,323
Repairs and Maintenance ** ** ** 99 204 361
Depreciation ** ** ** 92 259 565
Other Expense/(Income) ** ** ** (4) 54 364
General & Administrative Expenses ** ** ** 158 507 887
Corporate Overhead ** ** ** 5 275 457
Total Operating Expenses ** ** ** 5,276 8,525 11,683
Interest Expense ** ** ** 20 135 207
Other Expenses ** ** ** 2 125 794
Income (Loss) Before Income Taxes ** ** ** $4 $571 $1,800
Note: Computations include respondents that provided zeros and numerical amounts
** Insufficient data
N/A Not applicable

�1
© 2008 by the National Restaurant Association and Deloitte & Touche LLP
Exhibit C-12Full Service Restaurants (Average Check Per Person $25 and Over)Statement of Income and Expenses - Ratio to Total Sales*
Type of Establishment
Food Only Food and Beverage
Lower Quartile Median
Upper Quartile
Lower Quartile Median
Upper Quartile
Sales
Food ** ** ** 67.4% 72.4% 76.9%
Beverage N/A N/A N/A 23.1 27.6 32.6
Total Sales ** ** ** 100.0 100.0 100.0
Cost of Sales
Food ** ** ** 28.5 32.5 37.1
Beverage N/A N/A N/A 25.1 28.2 35.4
Total Cost of Sales ** ** ** 28.0 32.3 36.1
Gross Profit ** ** ** 63.7 67.6 72.0
Operating Expenses
Salaries and Wages (including Employee Benefits) ** ** ** 30.9 34.5 38.2
Direct Operating Expenses ** ** ** 4.0 5.9 10.5
Music and Entertainment ** ** ** 0.1 0.2 1.0
Marketing ** ** ** 1.3 2.2 3.0
Utility Services ** ** ** 2.1 2.8 4.0
Restaurant Occupancy Costs ** ** ** 4.0 6.9 9.0
Repairs and Maintenance ** ** ** 1.0 1.6 2.1
Depreciation ** ** ** 0.8 2.0 3.7
Other Expense/(Income) ** ** ** (0.1) 0.6 2.2
General & Administrative Expenses ** ** ** 1.5 3.7 5.7
Corporate Overhead ** ** ** 0.1 1.1 3.3
Total Operating Expenses ** ** ** 56.0 62.4 68.2
Interest Expense ** ** ** 0.2 1.0 1.9
Other Expenses ** ** ** 0.0 1.3 4.1
Income (Loss) Before Income Taxes ** ** ** 0.0% 4.1% 10.2%
Note: Computations include respondents that provided zeros and numerical amounts
* All ratios are based as a percentage of total sales except food and beverage costs, which are based on their respective sales
** Insufficient data
N/A Not applicable

�2
© 2008 by the National Restaurant Association and Deloitte & Touche LLP
Exhibit C-13Full Service Restaurants (Average Check Per Person $25 and Over)Statement of Income and Expenses - Amount per Seat
Affiliation
Single Unit - Independent Multi-Unit - Company Operated
Lower Quartile Median
Upper Quartile
Lower Quartile Median
Upper Quartile
Sales
Food $5,714 $8,189 $11,042 $9,872 $14,406 $18,886
Beverage 1,643 3,028 4,811 4,219 5,660 7,432
Total Sales 7,328 11,333 15,711 15,309 19,984 25,727
Cost of Sales
Food 1,947 2,936 3,539 2,924 4,211 5,588
Beverage 521 988 1,520 988 1,422 1,975
Total Cost of Sales 2,551 3,884 5,133 4,289 5,510 7,255
Gross Profit 5,026 7,611 10,072 10,821 14,196 18,455
Operating Expenses
Salaries and Wages (including Employee Benefits) 2,896 4,340 5,898 4,879 6,482 8,362
Direct Operating Expenses 420 786 1,566 723 878 1,257
Music and Entertainment 8 27 121 12 16 32
Marketing 95 207 366 404 489 692
Utility Services 212 307 452 294 484 653
Restaurant Occupancy Costs 456 699 1,249 535 1,144 1,517
Repairs and Maintenance 85 151 267 269 347 436
Depreciation 71 180 328 298 538 738
Other Expense/(Income) 0 63 281 (35) 13 372
General & Administrative Expenses 80 253 729 643 796 1,168
Corporate Overhead 0 83 443 ** ** **
Total Operating Expenses 4,297 6,882 10,022 9,679 12,364 14,928
Interest Expense 22 116 200 ** ** **
Other Expenses 0 38 263 ** ** **
Income (Loss) Before Income Taxes ($1) $341 $982 $537 $2,052 $2,913
Note: Computations include respondents that provided zeros and numerical amounts
** Insufficient data

��
© 2008 by the National Restaurant Association and Deloitte & Touche LLP
Exhibit C-14Full Service Restaurants (Average Check Per Person $25 and Over)Statement of Income and Expenses - Ratio to Total Sales*
Affiliation
Single Unit - Independent Multi-Unit - Company Operated
Lower Quartile Median
Upper Quartile
Lower Quartile Median
Upper Quartile
Sales
Food 66.7% 72.5% 78.7% 69.9% 72.9% 75.1%
Beverage 21.3 27.5 33.3 24.9 27.1 30.1
Total Sales 100.0 100.0 100.0 100.0 100.0 100.0
Cost of Sales
Food 29.6 34.3 38.4 27.0 29.1 31.2
Beverage 27.3 31.1 37.4 ** ** **
Total Cost of Sales 30.0 33.4 37.3 25.9 27.6 30.6
Gross Profit 62.6 66.5 70.0 69.4 72.4 74.1
Operating Expenses
Salaries and Wages (including Employee Benefits) 30.6 34.7 39.5 31.6 34.3 36.6
Direct Operating Expenses 4.0 7.0 11.6 4.0 4.7 5.4
Music and Entertainment 0.1 0.3 1.4 0.1 0.1 0.2
Marketing 0.9 1.9 2.7 2.0 2.5 3.6
Utility Services 2.1 2.7 4.2 2.1 2.6 3.3
Restaurant Occupancy Costs 4.4 7.5 9.4 3.1 6.5 7.7
Repairs and Maintenance 0.9 1.4 2.1 1.2 1.7 2.3
Depreciation 0.7 1.5 3.1 1.6 2.5 4.3
Other Expense/(Income) 0.0 0.4 2.5 ** ** **
General & Administrative Expenses 0.9 2.8 6.0 3.7 4.3 5.3
Corporate Overhead 0.0 0.9 2.6 ** ** **
Total Operating Expenses 55.2 62.4 67.8 55.8 61.9 65.1
Interest Expense 0.2 1.0 1.7 ** ** **
Other Expenses 0.0 0.4 2.5 ** ** **
Income (Loss) Before Income Taxes (0.3%) 2.6% 7.5% 3.3% 8.0% 13.0%
Note: Computations include respondents that provided zeros and numerical amounts
* All ratios are based as a percentage of total sales except food and beverage costs, which are based on their respective sales
** Insufficient data

��
© 2008 by the National Restaurant Association and Deloitte & Touche LLP
Exhibit C-15Full Service Restaurants (Average Check Per Person $25 and Over)Statement of Income and Expenses - Amount per Seat
Sales Volume ($000)
Between $500 and $999 Between $1,000 and $1,999 $2,000 and Over
Lower Quartile Median
Upper Quartile
Lower Quartile Median
Upper Quartile
Lower Quartile Median
Upper Quartile
Sales
Food $5,229 $7,259 $9,720 $5,994 $7,374 $9,460 $9,573 $13,440 $17,124
Beverage 1,691 2,802 4,770 1,528 2,478 3,886 4,122 5,399 7,505
Total Sales 7,371 10,613 14,517 8,313 10,133 12,732 14,119 18,729 23,754
Cost of Sales
Food 1,529 2,742 3,212 2,038 2,645 3,256 3,047 4,160 5,420
Beverage 624 1,802 1,501 439 766 1,192 1,053 1,449 2,013
Total Cost of Sales 2,373 3,714 4,807 2,706 3,430 4,465 4,226 5,519 7,197
Gross Profit 4,714 6,919 8,942 5,286 6,871 8,502 9,694 13,412 17,737
Operating Expenses
Salaries and Wages (including Employee Benefits) 2,306 3,937 5,230 2,893 3,546 4,512 4,981 6,306 8,362
Direct Operating Expenses 406 716 1,259 394 679 1,498 750 970 1,649
Music and Entertainment 10 19 49 9 54 167 13 22 118
Marketing 94 156 253 65 171 316 330 453 670
Utility Services 196 289 420 180 261 418 340 477 622
Restaurant Occupancy Costs 496 629 989 353 569 914 786 1,214 1,534
Repairs and Maintenance 78 115 176 92 157 237 239 331 436
Depreciation 88 164 278 37 127 262 200 494 732
Other Expense/(Income) 38 219 787 0 72 267 (51) 12 307
General & Administrative Expenses ** ** ** 37 158 354 458 756 1,121
Corporate Overhead ** ** ** ** ** ** 87 326 527
Total Operating Expenses 4,131 5,841 9,064 4,750 5,514 8,621 8,782 11,375 14,211
Interest Expense 34 148 213 ** ** ** 32 165 566
Other Expenses ** ** ** ** ** ** ** ** **
Income (Loss) Before Income Taxes ($696) $111 $374 ($124) $259 $972 $410 $1,308 $2,581
Note: Computations include respondents that provided zeros and numerical amounts
** Insufficient data

��
© 2008 by the National Restaurant Association and Deloitte & Touche LLP
Exhibit C-16Full Service Restaurants (Average Check Per Person $25 and Over)Statement of Income and Expenses - Ratio to Total Sales*
Sales Volume ($000)
Between $500 and $999 Between $1,000 and $1,999 $2,000 and Over
Lower Quartile Median
Upper Quartile
Lower Quartile Median
Upper Quartile
Lower Quartile Median
Upper Quartile
Sales
Food 66.4% 70.4% 77.3% 67.5% 75.0% 80.0% 68.4% 72.1% 75.5%
Beverage 22.7 29.6 33.6 20.0 25.0 33.1 24.5 27.9 31.6
Total Sales 100.0 100.0 100.0 100.0 100.0 100.0 100.0 100.0 100.0
Cost of Sales
Food 32.6 35.4 37.3 30.0 34.8 39.2 27.2 29.6 34.6
Beverage 29.5 36.3 39.8 27.0 31.0 36.3 23.5 25.6 28.1
Total Cost of Sales 32.5 34.7 37.3 31.2 34.3 39.3 26.3 28.5 32.2
Gross Profit 62.7 65.3 67.5 60.7 65.7 68.8 67.4 71.5 73.7
Operating Expenses
Salaries and Wages (including Employee Benefits) 28.4 35.3 37.5 30.8 34.5 40.2 31.4 34.1 37.1
Direct Operating Expenses 5.2 6.7 11.8 4.3 8.9 11.6 4.0 4.9 7.6
Music and Entertainment 0.1 0.2 0.8 0.1 0.6 1.6 0.1 0.1 0.6
Marketing 1.0 1.8 2.6 0.8 2.0 2.7 1.7 2.4 3.2
Utility Services 2.2 3.1 4.0 1.8 2.5 4.2 2.1 2.5 3.3
Restaurant Occupancy Costs 5.0 7.8 9.8 3.0 6.3 8.9 3.8 6.9 8.4
Repairs and Maintenance 0.7 1.2 1.6 1.0 1.5 2.1 1.2 1.8 2.3
Depreciation 1.0 1.9 3.5 0.5 1.4 2.4 1.2 2.3 4.2
Other Expense/(Income) 0.4 3.0 11.1 0.0 0.6 2.6 (0.2) 0.1 1.5
General & Administrative Expenses ** ** ** 0.7 2.2 5.1 2.9 3.9 5.4
Corporate Overhead ** ** ** ** ** ** 0.6 1.1 3.2
Total Operating Expenses 59.5 62.7 67.7 52.5 60.0 66.0 56.1 62.0 67.8
Interest Expense 0.3 1.2 2.1 0.0 0.5 1.3 0.2 1.0 2.3
Other Expenses ** ** ** ** ** ** ** ** **
Income (Loss) Before Income Taxes (4.7%) 0.8% 4.2% (2.2%) 2.4% 7.8% 2.5% 6.4% 11.6%
Note: Computations include respondents that provided zeros and numerical amounts
* All ratios are based as a percentage of total sales except food and beverage costs, which are based on their respective sales
** Insufficient data

��
© 2008 by the National Restaurant Association and Deloitte & Touche LLP
Exhibit C-17Full Service Restaurants (Average Check Per Person $25 and Over)Statement of Income and Expenses - Amount per Seat
Menu Theme
Steak/Seafood American (varied) Italian
Lower Quartile Median
Upper Quartile
Lower Quartile Median
Upper Quartile
Lower Quartile Median
Upper Quartile
Sales
Food $6,245 $8,566 $10,463 $6,871 $9,891 $13,918 $6,063 $7,706 $14,165
Beverage 1,318 2,696 5,132 2,555 4,363 5,712 1,500 2,800 6,915
Total Sales 8,291 11,473 16,999 9,583 14,792 19,515 8,379 10,945 20,865
Cost of Sales
Food 2,422 3,139 4,587 2,258 3,274 4,332 1,960 2,946 4,736
Beverage 421 843 1,684 773 1,201 1,621 405 754 1,966
Total Cost of Sales 2,822 3,961 5,684 2,916 4,698 5,604 2,551 3,838 6,105
Gross Profit 5,026 7,639 10,218 6,690 9,913 14,159 5,641 7,118 14,628
Operating Expenses
Salaries and Wages (including Employee Benefits) 2,457 4,371 6,234 3,593 5,876 7,207 ** ** **
Direct Operating Expenses 570 994 2,155 536 834 1,250 ** ** **
Music and Entertainment 8 22 200 12 19 75 ** ** **
Marketing 104 288 460 119 392 508 118 223 359
Utility Services 225 311 467 264 407 561 206 348 542
Restaurant Occupancy Costs 499 632 1,077 565 1,033 1,437 ** ** **
Repairs and Maintenance 96 167 298 146 278 397 95 204 301
Depreciation 49 169 257 185 435 627 ** ** **
Other Expense/(Income) ** ** ** (3) 44 367 ** ** **
General & Administrative Expenses 52 207 784 351 673 975 ** ** **
Corporate Overhead ** ** ** 53 269 407 ** ** **
Total Operating Expenses 4,217 6,892 9,817 6,293 10,050 12,515 4,513 6,042 13,485
Interest Expense ** ** ** 3 91 210 ** ** **
Other Expenses ** ** ** 2 75 1,040 ** ** **
Income (Loss) Before Income Taxes $25 $403 $1,194 $3 $716 $2,196 $153 $549 $2,016
Note: Computations include respondents that provided zeros and numerical amounts
** Insufficient data

��
© 2008 by the National Restaurant Association and Deloitte & Touche LLP
Exhibit C-18Full Service Restaurants (Average Check Per Person $25 and Over)Statement of Income and Expenses - Ratio to Total Sales*
Menu Theme
Steak/Seafood American (varied) Italian
Lower Quartile Median
Upper Quartile
Lower Quartile Median
Upper Quartile
Lower Quartile Median
Upper Quartile
Sales
Food 70.1% 75.3% 80.8% 66.9% 72.4% 75.9% 68.8% 75.1% 78.7%
Beverage 19.3 24.7 29.9 24.1 27.6 33.2 21.3 24.9 31.2
Total Sales 100.0 100.0 100.0 100.0 100.0 100.0 100.0 100.0 100.0
Cost of Sales
Food 34.7 38.0 41.9 28.1 30.8 35.1 27.1 29.8 36.6
Beverage 26.9 30.2 35.6 23.5 25.9 33.3 26.0 28.1 34.0
Total Cost of Sales 33.1 35.7 40.0 27.1 30.2 34.2 27.2 29.6 34.7
Gross Profit 60.0 64.3 66.9 65.4 69.8 72.9 65.3 70.4 72.8
Operating Expenses
Salaries and Wages (including Employee Benefits) 27.7 31.7 35.7 31.5 34.6 39.4 ** ** **
Direct Operating Expenses 4.7 9.9 12.7 3.9 4.9 8.7 ** ** **
Music and Entertainment 0.1 0.3 0.9 0.1 0.2 0.9 ** ** **
Marketing 0.9 2.4 3.8 1.3 2.1 3.0 1.1 1.8 2.6
Utility Services 2.1 2.7 4.3 2.2 2.9 3.9 2.1 2.5 3.1
Restaurant Occupancy Costs 4.1 7.4 8.6 5.4 6.8 9.0 ** ** **
Repairs and Maintenance 1.0 1.7 2.2 1.2 1.7 2.3 1.1 1.2 1.8
Depreciation 0.5 1.1 2.1 1.5 2.7 4.5 ** ** **
Other Expense/(Income) 0.0 1.2 7.9 0.0 0.6 1.8 ** ** **
General & Administrative Expenses 0.6 2.7 4.4 3.0 4.2 5.2 ** ** **
Corporate Overhead ** ** ** 0.3 1.2 3.2 ** ** **
Total Operating Expenses 52.1 59.2 65.1 57.8 62.6 68.2 56.6 61.5 66.3
Interest Expense ** ** ** 0.0 0.8 2.0 ** ** **
Other Expenses ** ** ** 0.0 0.7 3.6 ** ** **
Income (Loss) Before Income Taxes 0.1% 2.8% 7.6% 0.0% 5.0% 11.2% 1.4% 4.8% 8.8%
Note: Computations include respondents that provided zeros and numerical amounts
* All ratios are based as a percentage of total sales except food and beverage costs, which are based on their respective sales
** Insufficient data

��
© 2008 by the National Restaurant Association and Deloitte & Touche LLP
Exhibit C-19Full Service Restaurants (Average Check Per Person $25 and Over)Statement of Income and Expenses - Amount per Seat
Metropolitan/Non-Metropolitan Location
Inside MSA*** Outside MSA***
Lower Quartile Median
Upper Quartile
Lower Quartile Median
Upper Quartile
Sales
Food $6,803 $9,705 $14,032 $4,121 $5,195 $8,730
Beverage 2,326 4,317 6,081 1,103 2,361 2,989
Total Sales 9,635 14,636 20,018 5,686 7,469 11,612
Cost of Sales
Food 2,225 3,274 4,489 1,305 1,902 2,962
Beverage 715 1,173 1,799 391 646 1,196
Total Cost of Sales 3,080 4,543 6,058 1,835 2,592 4,207
Gross Profit 6,554 9,777 14,172 3,854 5,235 7,749
Operating Expenses
Salaries and Wages (including Employee Benefits) 3,509 5,448 7,159 ** ** **
Direct Operating Expenses 561 878 1,453 161 632 1,662
Music and Entertainment 12 21 89 ** ** **
Marketing 147 361 536 50 111 298
Utility Services 249 395 556 169 245 303
Restaurant Occupancy Costs 552 981 1,424 352 500 627
Repairs and Maintenance 101 225 393 36 97 184
Depreciation 128 351 600 ** ** **
Other Expense/(Income) (8) 54 352 ** ** **
General & Administrative Expenses 200 652 998 ** ** **
Corporate Overhead 79 319 501 ** ** **
Total Operating Expenses 5,717 9,376 12,516 3,579 4,583 7,568
Interest Expense 21 139 207 ** ** **
Other Expenses 11 493 1,040 ** ** **
Income (Loss) Before Income Taxes $83 $820 $2,082 ($170) $40 $418
Note: Computations include respondents that provided zeros and numerical amounts
** Insufficient data
*** Metropolitan statistical area

��
© 2008 by the National Restaurant Association and Deloitte & Touche LLP
Exhibit C-20Full Service Restaurants (Average Check Per Person $25 and Over)Statement of Income and Expenses - Ratio to Total Sales*
Metropolitan/Non-Metropolitan Location
Inside MSA*** Outside MSA***
Lower Quartile Median
Upper Quartile
Lower Quartile Median
Upper Quartile
Sales
Food 68.2% 72.3% 76.0% 66.5% 75.1% 79.5%
Beverage 24.0 27.7 32.0 20.5 24.9 33.5
Total Sales 100.0 100.0 100.0 100.0 100.0 100.0
Cost of Sales
Food 28.2 31.2 37.1 28.7 33.6 38.9
Beverage 24.4 27.7 34.0 ** ** **
Total Cost of Sales 27.6 31.1 35.4 31.9 33.2 39.7
Gross Profit 64.5 68.9 72.4 60.3 66.8 68.1
Operating Expenses
Salaries and Wages (including Employee Benefits) 30.7 34.2 37.8 ** ** **
Direct Operating Expenses 4.0 5.4 10.5 4.8 6.9 11.8
Music and Entertainment 0.1 0.2 0.9 ** ** **
Marketing 1.4 2.2 3.0 0.9 1.9 2.8
Utility Services 2.0 2.6 3.6 2.2 2.9 4.6
Restaurant Occupancy Costs 3.9 6.9 9.0 3.6 7.1 8.8
Repairs and Maintenance 1.0 1.6 2.2 0.9 1.3 1.9
Depreciation 0.9 2.0 4.1 ** ** **
Other Expense/(Income) (0.1) 0.6 2.1 ** ** **
General & Administrative Expenses 2.5 3.9 5.7 ** ** **
Corporate Overhead 0.7 1.4 3.8 ** ** **
Total Operating Expenses 55.3 61.9 68.2 57.7 62.8 67.4
Interest Expense 0.2 1.0 1.8 ** ** **
Other Expenses 0.1 2.8 4.1 ** ** **
Income (Loss) Before Income Taxes 0.7% 5.6% 11.2% (2.1%) 0.6% 4.2%
Note: Computations include respondents that provided zeros and numerical amounts
* All ratios are based as a percentage of total sales except food and beverage costs, which are based on their respective sales
** Insufficient data
*** Metropolitan statistical area

�0
© 2008 by the National Restaurant Association and Deloitte & Touche LLP
Exhibit C-21Full Service Restaurants (Average Check Per Person $25 and Over)Statement of Income and Expenses - Amount per Seat
Average Check
$25.00 to $32.99 $33.00 and Over
Lower Quartile Median
Upper Quartile
Lower Quartile Median
Upper Quartile
Sales
Food $5,686 $8,114 $12,667 $6,707 $9,686 $13,860
Beverage 1,454 3,251 5,605 2,402 4,129 5,731
Total Sales 7,574 11,479 18,372 9,336 14,131 19,266
Cost of Sales
Food 2,108 2,996 4,206 2,064 3,139 4,470
Beverage 461 1,000 1,842 655 1,163 1,639
Total Cost of Sales 2,805 4,000 5,871 2,768 4,333 5,608
Gross Profit 5,153 7,770 11,596 6,443 9,506 13,986
Operating Expenses
Salaries and Wages (including Employee Benefits) 3,060 4,560 6,364 3,335 5,230 6,991
Direct Operating Expenses 460 831 1,300 561 875 1,685
Music and Entertainment 8 22 84 12 23 99
Marketing 101 253 418 129 358 508
Utility Services 207 345 475 244 358 538
Restaurant Occupancy Costs 295 532 993 574 1,037 1,468
Repairs and Maintenance 99 188 303 99 210 385
Depreciation 61 228 500 131 291 602
Other Expense/(Income) (7) 53 316 (2) 66 367
General & Administrative Expenses 41 345 704 216 696 1,002
Corporate Overhead 0 261 393 31 278 457
Total Operating Expenses 4,389 7,046 10,290 5,482 9,861 12,557
Interest Expense 48 168 306 7 70 172
Other Expenses 2 75 509 0 181 794
Income (Loss) Before Income Taxes ($192) $273 $1,051 $107 $739 $2,225
Note: Computations include respondents that provided zeros and numerical amounts

�1
© 2008 by the National Restaurant Association and Deloitte & Touche LLP
Exhibit C-22Full Service Restaurants (Average Check Per Person $25 and Over)Statement of Income and Expenses - Ratio to Total Sales*
Average Check
$25.00 to $32.99 $33.00 and Over
Lower Quartile Median
Upper Quartile
Lower Quartile Median
Upper Quartile
Sales
Food 66.1% 74.4% 79.2% 68.0% 72.2% 75.9%
Beverage 20.8 25.6 33.9 24.1 27.8 32.1
Total Sales 100.0 100.0 100.0 100.0 100.0 100.0
Cost of Sales
Food 30.0 36.4 39.8 27.8 30.7 35.0
Beverage 25.4 29.2 37.3 24.9 28.1 34.5
Total Cost of Sales 29.9 33.5 38.8 27.3 30.4 34.7
Gross Profit 60.6 66.4 70.1 65.3 69.6 72.7
Operating Expenses
Salaries and Wages (including Employee Benefits) 30.4 33.4 38.5 31.2 34.7 37.9
Direct Operating Expenses 3.9 6.4 11.6 4.0 5.6 10.0
Music and Entertainment 0.1 0.2 1.0 0.1 0.2 1.0
Marketing 1.0 2.2 2.9 1.4 2.1 3.0
Utility Services 2.2 2.9 4.4 2.0 2.6 3.6
Restaurant Occupancy Costs 2.4 5.5 8.3 5.3 7.4 9.4
Repairs and Maintenance 1.2 1.6 2.2 0.9 1.5 2.1
Depreciation 0.7 1.5 3.2 0.9 2.0 3.9
Other Expense/(Income) 0.0 0.5 3.7 0.0 0.8 2.0
General & Administrative Expenses 0.5 3.0 5.1 2.9 4.1 5.9
Corporate Overhead 0.0 1.1 2.9 0.3 1.1 3.5
Total Operating Expenses 56.0 62.3 65.1 55.0 62.4 68.6
Interest Expense 0.4 1.4 3.1 0.1 0.6 1.4
Other Expenses 0.0 0.6 3.3 0.0 2.5 4.1
Income (Loss) Before Income Taxes (2.1%) 2.0% 7.4% 0.8% 5.2% 11.9%
Note: Computations include respondents that provided zeros and numerical amounts
* All ratios are based as a percentage of total sales except food and beverage costs, which are based on their respective sales

�2
© 2008 by the National Restaurant Association and Deloitte & Touche LLP
Exhibit C-23Full Service Restaurants (Average Check Per Person $25 and Over)Income Differential
Amount per Seat Ratio to Total Sales*
Profit Loss Profit Loss
Lower Quartile Median
Upper Quartile
Lower Quartile Median
Upper Quartile
Lower Quartile Median
Upper Quartile
Lower Quartile Median
Upper Quartile
Sales
Food $7,167 $10,130 $14,449 $4,213 $6,615 $9,377 68.8% 72.9% 76.8% 64.5% 71.1% 82.2%
Beverage 2,405 4,363 6,230 925 2,500 4,085 23.8 27.5 31.8 17.8 28.9 35.5
Total Sales 10,237 14,882 20,030 5,364 9,336 14,510 100.0 100.0 100.0 100.0 100.0 100.0
Cost of Sales
Food 2,432 3,370 4,529 1,497 2,234 3,204 28.2 30.8 36.5 32.0 36.7 40.4
Beverage 729 1,173 1,862 ** ** ** 24.4 27.3 33.3 27.8 34.6 40.9
Total Cost of Sales 3,144 4,615 6,074 2,138 3,265 4,794 27.5 30.3 34.7 32.4 35.1 40.0
Gross Profit 6,800 9,903 14,457 3,516 5,727 9,418 65.0 69.7 72.5 60.0 64.9 67.6
Operating Expenses
Salaries and Wages (including Employee Benefits) 3,592 5,400 7,159 2,011 3,350 5,900 30.9 34.2 36.9 30.6 37.5 44.5
Direct Operating Expenses 605 894 1,500 350 603 1,361 4.0 5.3 9.5 5.0 7.9 14.5
Music and Entertainment 11 21 89 12 32 154 0.1 0.1 0.8 0.1 0.5 1.8
Marketing 147 346 498 67 225 409 1.4 2.2 2.9 1.1 2.2 4.2
Utility Services 240 377 557 197 292 445 2.0 2.5 3.5 2.5 3.7 5.2
Restaurant Occupancy Costs 524 952 1,385 360 577 909 3.9 6.9 8.7 4.2 7.8 11.8
Repairs and Maintenance 117 246 396 46 126 213 1.0 1.6 2.1 0.8 1.4 2.2
Depreciation 127 294 611 37 222 413 0.8 2.0 3.4 0.9 1.8 5.4
Other Expense/(Income) 0 63 312 (3) 15 514 (0.1) 0.6 1.8 0.0 0.1 6.3
General & Administrative Expenses 191 673 987 37 229 517 2.2 3.7 5.4 0.6 3.9 7.0
Corporate Overhead 50 288 492 ** ** ** 0.4 1.1 3.2 ** ** **
Total Operating Expenses 5,443 8,831 12,438 3,938 6,701 10,215 54.4 60.8 65.2 62.6 73.6 81.8
Interest Expense 13 114 205 28 148 209 0.1 0.8 1.7 0.3 1.4 4.5
Other Expenses 2 112 933 ** ** ** 0.0 1.4 4.1 ** ** **
Income (Loss) Before Income Taxes $361 $950 $2,272 ($1,756) ($685) ($321) 2.7% 7.2% 12.9% (24.1%) (7.7%) (3.2%)
Note: Computations include respondents that provided zeros and numerical amounts
* All ratios are based as a percentage of total sales except food and beverage costs, which are based on their respective sales
** Insufficient data

��
© 2008 by the National Restaurant Association and Deloitte & Touche LLP
Section D-Limited Service Restaurants*Exhibit D-1 presents the characteristics of the 117 respondents in the Limited Service Restaurants category of this year’s study. Almost half (46.2%) of the respondents represent independent restaurants and 52.1% reported that they were the sole occupant of their location. Restaurants with sandwiches/subs/deli menu themes represent 21.4% of this sample.
The median ratio of income before income taxes to total sales is 9.7% or $1,058 per seat.
*Includes quickservice and quick/fast casual restaurants.
Highlights • Median average check is $8.00.
• Median total sales per full-time equivalent employee is $60,718.
• Median food sales are $11,542 per seat and median beverage sales are $609 per seat.
• Median total sales per square foot is $314.
• Median income before income taxes is 9.7% of total sales.
• Median total cost of sales is 30.4% of total sales.
Characteristics• 46.2% of limited service restaurants are single units, i.e., independents.
• 35.1% of the responding establishments have sales volume of $1,000,000 and over.
• 21.4% of the respondents report a sandwiches/subs/deli menu theme.
• 94.0% of the respondents operate their businesses in locations with less than 7,500 square feet and 81.2% of the respondents have less than 200 seats.

��
© 2008 by the National Restaurant Association and Deloitte & Touche LLP
Exhibit D-1Composition of Participating Limited Service RestaurantsNumber of Respondents: 117
Percentage of Respondents
Percentage of Respondents
Type of Establishment: Ownership:Food Only 73.3% Sole Proprietorship 17.1%Food and Beverage 26.7 Partnership 23.9
Public Corporation 3.4Years in Business: Private Corporation 55.61 to 5 years 29.1%5 to 10 years 14.5 Menu Theme:Over 10 years 56.4 Hamburger 16.2%
Asian 2.6Region: ¹,³ Chicken 1.7Northeast 8.5% Pizza 11.1North Central 25.6 Sandwiches/Subs/Deli 21.4South 35.9 American (varied) 16.2West 29.0 Mexican 5.1Not Specified 1.0 Italian 2.6
Other 23.1Average Check: ²Under $7.50 44.4% Sales Volume: ³$7.50 and Over 55.6 Under $500,000 33.3%
$500,000 to $999,999 31.6Affiliation: $1,000,000 to $1,999,999 22.2Single Unit - Independent 46.2% $2,000,000 and Over 12.9Single Unit - Franchise Operated 12.8Multi-Unit - Company Operated 29.0 Restaurant Location:Multi-Unit - Franchise Operated 12.0 Hotel 0.9%
Shopping Center or Mall 27.4Profit versus Loss: ³ Sole Occupant 52.1Profit 83.8% Other 17.9Loss 16.2 Not Specified 1.7
Lease versus Own: Total Number of Seats:Own Land and Building 18.8% Under 100 65.0%Lease Land and Building 35.0 100 to 149 8.5Lease Land and Own Building 4.3 150 to 199 7.7Own Land and Lease Building 1.7 200 to 399 6.8Not Specified 40.2 400 and Over 1.7
Not Specified 10.3
Total Restaurant Square Footage:Under 2,500 50.4%2,500 to 4,999 34.25,000 to 7,499 9.47,500 and Over 2.6Not Specified 3.4
¹ Regions:
Northeast: CT, ME, MA, NH, NJ, NY, PA, RI, VT
North Central: IL, IN, IA, KS, MI, MN, MO, NE, ND, OH, SD, WI
South: AL, AR, DC, DE, FL, GA, KY, LA, MD, MS, OK, NC, SC, TN, TX, VA, WV
West: AK, AZ, CA, CO, HI, ID, MT, NV, NM, OR, UT, WA, WY
² Per person, all meals3 For respondents specifying

��
© 2008 by the National Restaurant Association and Deloitte & Touche LLP
Exhibit D-2Limited Service RestaurantsAverage Check
Total
Lower Quartile Median
Upper Quartile
All Restaurants $5.00 $8.00 $10.00
Type of Establishment
Food Only $5.00 $7.00 $9.00
Food and Beverage 8.25 9.50 11.00
Restaurant Location
Hotel ** ** **
Shopping Center or Mall $7.50 $9.00 $12.00
Sole Occupant 5.00 7.00 9.00
Other 5.00 8.00 10.00
Profit versus Loss
Profit $5.00 $8.00 $10.00
Loss ** ** **
Menu Theme
Hamburger ** ** **
Asian ** ** **
Chicken ** ** **
Pizza ** ** **
Sandwiches/Subs/Deli $7.00 $9.00 $11.00
American (varied) ** ** **
Mexican ** ** **
Italian ** ** **
Other 5.00 5.00 6.00
Affiliation
Single Unit - Independent $6.00 $7.00 $9.00
Single Unit - Franchise Operated 6.50 9.00 11.00
Multi-Unit - Company Operated 5.00 8.00 11.00
Multi-Unit - Franchise Operated ** ** **
Ownership
Sole Proprietorship ** ** **
Partnership $5.00 $5.00 $9.25
Public Corporation ** ** **
Private Corporation 7.00 8.00 11.00
Sales Volume
Under $500,000 $6.00 $8.00 $9.75
$500,000 to $999,999 7.00 8.00 12.00
$1,000,000 to $1,999,999 5.00 5.00 8.00
$2,000,000 and Over ** ** **
** Insufficient data

��
© 2008 by the National Restaurant Association and Deloitte & Touche LLP
Exhibit D-3Limited Service RestaurantsAverage Daily Seat Turnover
Total
Lower Quartile Median
Upper Quartile
All Restaurants 2.3 4.3 8.3
Type of Establishment
Food Only 2.3 5.8 9.2
Food and Beverage 2.2 3.1 4.3
Restaurant Location
Hotel ** ** **
Shopping Center or Mall 2.6 3.8 5.2
Sole Occupant 2.9 6.1 10.2
Other ** ** **
Profit versus Loss
Profit 2.5 4.5 8.3
Loss ** ** **
Menu Theme
Hamburger ** ** **
Asian ** ** **
Chicken ** ** **
Pizza ** ** **
Sandwiches/Subs/Deli 1.4 2.5 5.6
American (varied) ** ** **
Mexican ** ** **
Italian ** ** **
Other ** ** **
Average Check
Under $7.50 4.1 8.3 10.5
$7.50 and Over 1.9 3.2 4.8
Affiliation
Single Unit - Independent 1.5 3.3 6.4
Single Unit - Franchise Operated ** ** **
Multi-Unit - Company Operated 3.2 6.7 10.4
Multi-Unit - Franchise Operated ** ** **
Ownership
Sole Proprietorship ** ** **
Partnership 4.9 8.8 13.2
Public Corporation ** ** **
Private Corporation 2.0 3.6 5.8
Sales Volume
Under $500,000 1.2 1.9 4.2
$500,000 to $999,999 3.0 5.2 7.3
$1,000,000 to $1,999,999 ** ** **
$2,000,000 and Over ** ** **
** Insufficient data

��
© 2008 by the National Restaurant Association and Deloitte & Touche LLP
Exhibit D-4Limited Service RestaurantsCost per Dollar of Sales*
Total Cost of Sales
Total Payroll and Benefits Prime Cost
All Restaurants 30.4¢ 28.6¢ 59.0¢
Type of Establishment
Food Only 30.1¢ 27.5¢ 58.1¢
Food and Beverage 31.0 31.8 63.8
Restaurant Location
Hotel ** ** **
Shopping Center or Mall 30.2¢ 28.1¢ 59.0¢
Sole Occupant 29.8 27.6 58.1
Other 35.2 29.0 65.0
Profit versus Loss
Profit 30.0¢ 27.5¢ 58.7¢
Loss ** ** **
Menu Theme
Hamburger ** ** **
Asian ** ** **
Chicken ** ** **
Pizza ** ** **
Sandwiches/Subs/Deli 35.3¢ ** 62.3¢
American (varied) ** ** **
Mexican ** ** **
Italian ** ** **
Other 26.5 27.5¢ 54.3
Average Check
Under $7.50 30.4¢ 27.6¢ 55.3¢
$7.50 and Over 30.4 29.0 60.6
Affiliation
Single Unit - Independent 32.9¢ 31.3¢ 64.6¢
Multi-Unit - Company Operated 26.6 27.5 54.8
Multi-Unit - Franchise Operated ** ** **
Ownership
Sole Proprietorship 35.0¢ 27.0¢ 59.1¢
Partnership 26.6 27.6 54.4
Public Corporation ** ** **
Private Corporation 30.7 29.0 60.6
Sales Volume
Under $500,000 33.6¢ 30.6¢ 63.0¢
$500,000 to $999,999 29.0 27.9 58.9
$1,000,000 to $1,999,999 27.4 27.0 54.8
$2,000,000 and Over ** ** **
* All amounts are medians
** Insufficient data

��
© 2008 by the National Restaurant Association and Deloitte & Touche LLP
Exhibit D-5Limited Service RestaurantsNumber of Employees*
Number of Employees per Restaurant
Full TimePart Time
(20-34 Hours)
Part-Part-Time (Under 20
Hours)
All Restaurants 5 6 4
Type of Establishment
Food Only 5 6 4
Food and Beverage 12 3 2
Restaurant Location
Hotel ** ** **
Shopping Center or Mall 4 5 4
Sole Occupant 8 9 5
Other 3 4 2
Profit versus Loss
Profit 6 6 4
Loss ** ** **
Menu Theme
Hamburger ** ** **
Asian ** ** **
Chicken ** ** **
Pizza ** ** **
Sandwiches/Subs/Deli 3 5 2
American (varied) ** ** **
Mexican ** ** **
Italian ** ** **
Other 6 9 5
Average Check
Under $7.50 5 8 5
$7.50 and Over 6 5 2
Affiliation
Single Unit - Independent 4 5 3
Multi-Unit - Company Operated 7 8 4
Multi-Unit - Franchise Operated ** ** **
Ownership
Sole Proprietorship 2 4 3
Partnership 7 10 5
Public Corporation ** ** **
Private Corporation 5 5 3
Sales Volume
Under $500,000 2 3 2
$500,000 to $999,999 4 6 5
$1,000,000 to $1,999,999 11 10 6
$2,000,000 and Over ** ** **
* All amounts are medians
** Insufficient data

100
© 2008 by the National Restaurant Association and Deloitte & Touche LLP
Exhibit D-6Limited Service RestaurantsAnnual Employee Turnover*
All Employees
Salaried Employees
Hourly Employees
All Restaurants 100% 33% 113%
Type of Establishment
Food Only 112% 42% 121%
Food and Beverage 69 33 85
Restaurant Location
Hotel ** ** **
Shopping Center or Mall 126% 33% 131%
Sole Occupant 105 50 115
Other ** ** **
Profit versus Loss
Profit 105% 50% 117%
Loss ** ** **
Menu Theme
Hamburger ** ** **
Asian ** ** **
Chicken ** ** **
Pizza ** ** **
Sandwiches/Subs/Deli 121% 44% 135%
American (varied) ** ** **
Mexican ** ** **
Italian ** ** **
Other 139 50 151
Average Check
Under $7.50 131% 50% 133%
$7.50 and Over 69 ** 82
Affiliation
Single Unit - Independent 78% 17% 91%
Multi-Unit - Company Operated 117 33 141
Multi-Unit - Franchise Operated ** ** **
Ownership
Sole Proprietorship ** ** **
Partnership 147% 50% 159%
Public Corporation ** ** **
Private Corporation 87 33 94
Sales Volume
Under $500,000 78% ** 94%
$500,000 to $999,999 105 ** 111
$1,000,000 to $1,999,999 129 50% 127
$2,000,000 and Over ** ** **
* Amounts for all employees and hourly employees are medians; amounts for salaried employees are upper quartiles.
All amounts are derived from the number of W-2’s and the number of employees
** Insufficient data

101
© 2008 by the National Restaurant Association and Deloitte & Touche LLP
Exhibit D-7Limited Service RestaurantsEmployee Information*
Full-Time Equivalent EmployeesAmount per Full-Time Equivalent Employee
TotalPer 100
Restaurant SeatsPer 100 Average
Daily Covers Total SalesTotal Payroll and Benefits
All Restaurants 13.1 23.4 4.7 $60,718 $17,784
Type of Establishment
Food Only 11.5 25.8 3.9 $60,067 $17,006
Food and Beverage 17.4 15.6 5.5 60,761 19,876
Restaurant Location
Hotel ** ** ** ** **
Shopping Center or Mall 8.6 17.5 5.4 $65,083 $17,230
Sole Occupant 16.4 25.7 3.7 59,689 17,579
Other 6.8 13.6 5.1 60,718 **
Profit versus Loss
Profit 14.0 22.0 4.2 $61,948 $17,436
Loss ** ** ** ** **
Menu Theme
Hamburger ** ** ** ** **
Asian ** ** ** ** **
Chicken ** ** ** ** **
Pizza ** ** ** ** **
Sandwiches/Subs/Deli 7.9 13.5 5.1 $67,721 **
American (varied) ** ** ** ** **
Mexican ** ** ** ** **
Italian ** ** ** ** **
Other 15.1 26.3 2.7 66,467 $17,850
Average Check
Under $7.50 13.7 25.6 2.7 $61,690 $17,579
$7.50 and Over 12.7 19.1 6.0 58,824 18,007
Affiliation
Single Unit - Independent 9.6 15.9 5.1 $53,773 $17,284
Multi-Unit - Company Operated 15.8 25.3 3.4 66,121 18,320
Multi-Unit - Franchise Operated ** ** ** ** **
Ownership
Sole Proprietorship 5.7 ** ** $57,041 **
Partnership 15.8 25.8 2.7 62,224 $17,724
Public Corporation ** ** ** ** **
Private Corporation 11.8 21.0 5.3 60,067 17,850
Sales Volume
Under $500,000 5.8 12.9 5.5 $53,571 $14,483
$500,000 to $999,999 11.8 21.0 4.3 61,520 17,075
$1,000,000 to $1,999,999 18.6 28.0 2.7 67,884 17,787
$2,000,000 and Over ** ** ** ** **
* All amounts are medians. Based on 35 hours per week. Factors used to compute full-time equivalent employees are as follows: full-time (35 hours or more) equals 1.0; part-time (20-34 hours) equals 0.7; part-part-time (less than 20 hours) equals 0.35
** Insufficient data

102
© 2008 by the National Restaurant Association and Deloitte & Touche LLP
Exhibit D-8Limited Service RestaurantsTake-Out/Drive Through, Outside Catering andBanquet Service - Ratio to Total Sales*
Take-Out/ Drive Through
Outside Catering
Banquet Service
All Restaurants 48% 10% 5%
Type of Establishment
Food Only 60% 10% **
Food and Beverage 10 ** **
Restaurant Location
Hotel ** ** **
Shopping Center or Mall 40% ** **
Sole Occupant 60 ** **
Other ** ** **
Profit versus Loss
Profit 45% 10% **
Loss ** ** **
Menu Theme
Hamburger ** ** **
Asian ** ** **
Chicken ** ** **
Pizza ** ** **
Sandwiches/Subs/Deli ** ** **
American (varied) ** ** **
Mexican ** ** **
Italian ** ** **
Other 70% ** **
Average Check
Under $7.50 68% ** **
$7.50 and Over 28 10% **
Affiliation
Single Unit - Independent 34% ** **
Multi-Unit - Company Operated 70 ** **
Multi-Unit - Franchise Operated ** ** **
Ownership
Sole Proprietorship ** ** **
Partnership 70% ** **
Public Corporation ** ** **
Private Corporation 34 10% **
Sales Volume
Under $500,000 40% ** **
$500,000 to $999,999 45 ** **
$1,000,000 to $1,999,999 70 ** **
$2,000,000 and Over ** ** **
* All amounts are medians
** Insufficient data

10�
© 2008 by the National Restaurant Association and Deloitte & Touche LLP
Exhibit D-9Limited Service RestaurantsStatement of Income and Expenses
All Restaurants
Amount per Seat Ratio to Total Sales*
Lower Quartile Median
Upper Quartile
Lower Quartile Median
Upper Quartile
Sales
Food $6,864 $11,542 $17,612 97.9% 100.0% 100.0%
Beverage 195 609 1,108 0.0 4.8 12.5
Total Sales 7,315 11,706 18,107 100.0 100.0 100.0
Cost of Sales
Food 2,315 3,762 5,413 27.1 30.4 35.5
Beverage 63 195 343 24.4 33.4 38.0
Total Cost of Sales 2,399 3,836 5,518 26.7 30.4 35.5
Gross Profit 4,773 7,692 12,748 64.6 69.6 73.3
Operating Expenses
Salaries and Wages (including Employee Benefits) 2,099 3,877 5,111 25.1 28.6 33.2
Direct Operating Expenses 280 602 1,152 3.0 5.0 8.2
Music and Entertainment 11 21 42 0.1 0.2 0.6
Marketing 72 163 492 0.7 1.6 3.4
Utility Services 273 419 640 2.6 3.4 4.6
Restaurant Occupancy Costs 434 896 1,649 5.4 8.6 10.6
Repairs and Maintenance 88 175 273 1.0 1.5 2.3
Depreciation 52 96 303 0.4 1.0 2.6
Other Expense/(Income) 6 223 390 0.2 1.8 3.2
General & Administrative Expenses 84 213 896 0.6 2.5 6.8
Corporate Overhead 434 924 1,429 4.1 6.3 8.5
Total Operating Expenses 3,860 6,435 10,018 51.8 57.8 64.0
Interest Expense 30 132 375 0.5 0.9 3.0
Other Expenses 19 138 435 0.2 1.3 3.0
Income (Loss) Before Income Taxes $230 $1,058 $2,968 3.5% 9.7% 17.8%
Note: Computations include respondents that provided zeros and numerical amounts
* All ratios are based as a percentage of total sales except food and beverage costs, which are based on their respective sales

10�
© 2008 by the National Restaurant Association and Deloitte & Touche LLP
Exhibit D-10Limited Service RestaurantsStatement of Income and Expenses - Amount per Square Foot*
All Restaurants Type of Establishment Menu Theme Menu Theme Average Check Restaurant Location Sales Volume ($000)
Lower Quartile Median
Upper Quartile Food Only
Food and Beverage Hamburger Asian Chicken Pizza
Sandwiches/Subs/Deli
American (varied) Mexican Italian Other
Under $7.50
$7.50 and Over Hotel
Shopping Center or Mall
Sole Occupant Other
Under $500
$500 to $999
$1,000 to $1,999
$2,000 and Over
Sales
Food $186.55 $293.15 $470.81 $318.95 $278.88 ** ** ** ** $252.22 ** ** ** $379.95 $332.08 $278.88 ** $300.00 $312.87 $208.01 $150.00 $315.00 $433.65 **
Beverage 0.20 12.48 35.75 N/A 15.58 ** ** ** ** ** ** ** ** ** ** 12.97 ** ** ** ** ** ** ** **
Total Sales 199.00 313.79 467.75 318.95 290.58 ** ** ** ** 252.22 ** ** ** 379.95 334.67 290.40 ** 321.90 333.33 226.51 171.43 330.82 433.65 **
Gross Profit on Sales 125.52 213.26 355.56 219.90 200.51 ** ** ** ** 167.50 ** ** ** 268.07 223.13 200.00 ** 220.53 215.25 150.02 115.71 238.80 321.23 **
Utility Services 6.70 11.34 15.09 11.52 10.54 ** ** ** ** 8.97 ** ** ** 13.74 12.13 9.55 ** 11.25 11.63 ** 8.17 11.82 13.88 **
Restaurant Occupancy Costs 12.00 26.01 42.60 29.83 ** ** ** ** ** ** ** ** ** 34.93 32.00 18.25 ** 37.50 26.01 ** 12.00 30.46 38.23 **
Note: Computations include respondents that provided zeros and numerical amounts
* All amounts are medians unless otherwise stated
** Insufficient data
N/A Not applicable

10�
© 2008 by the National Restaurant Association and Deloitte & Touche LLP
Exhibit D-11Limited Service RestaurantsStatement of Income and Expenses - Amount per Seat
Type of Establishment
Food Only Food and Beverage
Lower Quartile Median
Upper Quartile
Lower Quartile Median
Upper Quartile
Sales
Food $7,956 $13,967 $18,970 $5,611 $8,660 $14,273
Beverage N/A N/A N/A 175 500 938
Total Sales 7,956 13,967 18,970 6,861 9,777 14,927
Cost of Sales
Food 2,696 4,045 5,629 1,676 2,862 4,303
Beverage N/A N/A N/A 59 175 313
Total Cost of Sales 2,696 4,045 5,629 1,998 3,120 4,853
Gross Profit 5,268 9,541 13,363 4,606 6,622 10,423
Operating Expenses
Salaries and Wages (including Employee Benefits) 2,085 3,887 5,330 2,406 3,451 5,060
Direct Operating Expenses 310 705 1,288 235 476 815
Music and Entertainment 0 0 14 ** ** **
Marketing 68 159 661 80 149 302
Utility Services 287 470 653 206 347 486
Restaurant Occupancy Costs 351 971 1,686 418 627 1,015
Repairs and Maintenance 91 176 279 85 145 244
Depreciation 59 122 353 31 66 154
Other Expense/(Income) 48 265 533 ** ** **
General & Administrative Expenses 77 100 896 128 467 745
Corporate Overhead 394 924 1,396 ** ** **
Total Operating Expenses 2,968 7,337 10,539 3,302 5,452 8,306
Interest Expense 0 16 208 ** ** **
Other Expenses 0 0 117 ** ** **
Income (Loss) Before Income Taxes $307 $1,134 $3,119 $196 $522 $2,701
Note: Computations include respondents that provided zeros and numerical amounts
** Insufficient data
N/A Not applicable

10�
© 2008 by the National Restaurant Association and Deloitte & Touche LLP
Exhibit D-12Limited Service RestaurantsStatement of Income and Expenses - Ratio to Total Sales*
Type of Establishment
Food Only Food and Beverage
Lower Quartile Median
Upper Quartile
Lower Quartile Median
Upper Quartile
Sales
Food 100.0% 100.0% 100.0% 87.5% 92.6% 98.2%
Beverage N/A N/A N/A 1.8 7.4 12.5
Total Sales 100.0 100.0 100.0 100.0 100.0 100.0
Cost of Sales
Food 26.4 30.1 35.3 28.5 31.0 36.1
Beverage N/A N/A N/A 27.2 33.6 36.0
Total Cost of Sales 26.4 30.1 35.3 28.3 31.0 36.1
Gross Profit 64.7 70.0 73.7 63.9 69.0 71.7
Operating Expenses
Salaries and Wages (including Employee Benefits) 23.9 27.5 31.5 27.3 31.8 35.8
Direct Operating Expenses 3.0 5.0 8.1 2.8 5.0 8.2
Music and Entertainment 0.0 0.0 0.1 ** ** **
Marketing 0.6 2.1 3.8 0.9 1.4 2.4
Utility Services 2.7 3.4 4.4 1.9 3.1 4.7
Restaurant Occupancy Costs 5.4 8.8 10.6 4.6 6.9 9.2
Repairs and Maintenance 1.0 1.6 2.4 1.0 1.5 1.8
Depreciation 0.4 1.1 2.4 0.4 0.7 2.3
Other Expense/(Income) 0.2 1.8 3.4 ** ** **
General & Administrative Expenses 0.5 0.8 4.6 3.1 5.6 7.6
Corporate Overhead 3.6 6.3 6.9 ** ** **
Total Operating Expenses 51.3 57.6 62.1 50.6 54.6 63.2
Interest Expense 0.0 0.3 1.2 ** ** **
Other Expenses 0.0 0.0 0.9 ** ** **
Income (Loss) Before Income Taxes 3.5% 10.0% 17.3% 4.9% 6.8% 18.9%
Note: Computations include respondents that provided zeros and numerical amounts
* All ratios are based as a percentage of total sales except food and beverage costs, which are based on their respective sales
** Insufficient data
N/A Not applicable

10�
© 2008 by the National Restaurant Association and Deloitte & Touche LLP
Exhibit D-13Limited Service RestaurantsStatement of Income and Expenses - Amount per Seat
Affiliation
Single Unit - Independent Multi-Unit - Company Operated
Lower Quartile Median
Upper Quartile
Lower Quartile Median
Upper Quartile
Sales
Food $4,729 $8,125 $14,816 $10,929 $16,695 $21,620
Beverage 6 556 1,027 ** ** **
Total Sales 4,875 9,777 14,816 10,644 16,740 21,597
Cost of Sales
Food 1,480 2,862 4,846 3,026 4,340 5,644
Beverage 4 170 340 ** ** **
Total Cost of Sales 1,480 3,154 5,275 3,244 4,340 5,644
Gross Profit 3,204 6,063 8,920 7,698 12,019 16,020
Operating Expenses
Salaries and Wages (including Employee Benefits) 1,600 3,343 4,424 3,174 4,359 5,794
Direct Operating Expenses 153 511 1,260 498 795 1,123
Music and Entertainment 0 3 35 ** ** **
Marketing 54 141 310 63 99 169
Utility Services 201 311 525 352 477 655
Restaurant Occupancy Costs 266 514 1,044 685 1,518 1,923
Repairs and Maintenance 61 138 236 131 229 374
Depreciation 34 65 136 64 94 258
Other Expense/(Income) 0 112 242 200 315 1,386
General & Administrative Expenses 70 213 778 ** ** **
Corporate Overhead ** ** ** 715 1,036 1,438
Total Operating Expenses 2,471 5,005 7,398 5,228 8,871 11,512
Interest Expense 0 75 168 ** ** **
Other Expenses ** ** ** ** ** **
Income (Loss) Before Income Taxes $14 $441 $1,478 $1,107 $2,141 $4,015
Note: Computations include respondents that provided zeros and numerical amounts
** Insufficient data

10�
© 2008 by the National Restaurant Association and Deloitte & Touche LLP
Exhibit D-14Limited Service RestaurantsStatement of Income and Expenses - Ratio to Total Sales*
Affiliation
Single Unit - Independent Multi-Unit - Company Operated
Lower Quartile Median
Upper Quartile
Lower Quartile Median
Upper Quartile
Sales
Food 84.4% 92.9% 99.5% 98.6% 99.1% 100.0%
Beverage 0.5 7.1 15.6 ** ** **
Total Sales 100.0 100.0 100.0 100.0 100.0 100.0
Cost of Sales
Food 30.0 33.1 38.7 25.8 26.9 30.3
Beverage 27.2 33.3 40.0 ** ** **
Total Cost of Sales 29.6 32.9 37.8 25.6 26.6 30.3
Gross Profit 62.2 67.1 70.4 69.7 73.4 74.4
Operating Expenses
Salaries and Wages (including Employee Benefits) 26.2 31.3 35.5 26.0 27.5 28.9
Direct Operating Expenses 2.8 6.7 9.7 4.6 5.0 5.6
Music and Entertainment 0.0 0.0 0.2 ** ** **
Marketing 0.9 1.5 3.0 0.5 0.6 0.9
Utility Services 2.6 3.4 5.7 2.5 3.3 4.0
Restaurant Occupancy Costs 3.7 6.3 11.3 7.5 9.4 10.3
Repairs and Maintenance 0.7 1.4 2.3 1.2 1.6 1.9
Depreciation 0.3 1.0 2.4 0.3 0.7 1.9
Other Expense/(Income) 0.0 0.0 0.6 ** ** **
General & Administrative Expenses 1.2 4.0 6.8 0.4 0.5 0.7
Corporate Overhead ** ** ** 6.3 6.3 7.2
Total Operating Expenses 50.1 57.5 64.3 52.1 55.4 61.5
Interest Expense 0.0 0.7 2.4 ** ** **
Other Expenses ** ** ** ** ** **
Income (Loss) Before Income Taxes 1.2% 6.7% 17.7% 7.0% 15.7% 18.3%
Note: Computations include respondents that provided zeros and numerical amounts
* All ratios are based as a percentage of total sales except food and beverage costs, which are based on their respective sales
** Insufficient data

110
© 2008 by the National Restaurant Association and Deloitte & Touche LLP
Exhibit D-15Limited Service RestaurantsStatement of Income and Expenses - Amount per Seat
Sales Volume ($000)
Under $500 Between $500 and $999 Between $1,000 and $1,999
Lower Quartile Median
Upper Quartile
Lower Quartile Median
Upper Quartile
Lower Quartile Median
Upper Quartile
Sales
Food $3,139 $5,933 $9,958 $7,923 $12,471 $15,657 $14,315 $17,229 $23,679
Beverage ** ** ** ** ** ** ** ** **
Total Sales 3,295 6,441 10,407 9,241 12,116 17,114 14,315 17,229 23,679
Cost of Sales
Food 905 1,890 3,460 2,812 3,828 4,745 4,137 5,174 6,449
Beverage ** ** ** ** ** ** ** ** **
Total Cost of Sales 1,022 2,236 3,460 3,030 3,882 4,978 4,137 5,174 6,449
Gross Profit 2,276 4,255 6,523 5,446 7,877 12,730 9,835 12,358 17,230
Operating Expenses
Salaries and Wages (including Employee Benefits) 1,182 1,650 2,884 2,391 3,887 4,401 3,785 4,534 6,424
Direct Operating Expenses 125 286 1,000 ** ** ** 580 905 1,347
Music and Entertainment ** ** ** ** ** ** ** ** **
Marketing 39 90 223 63 278 671 99 156 552
Utility Services 177 292 441 266 492 652 392 630 800
Restaurant Occupancy Costs 220 557 882 442 1,000 1,630 804 1,610 2,143
Repairs and Maintenance 30 73 121 86 219 283 202 279 495
Depreciation 27 97 273 ** ** ** 73 146 457
Other Expense/(Income) ** ** ** ** ** ** ** ** **
General & Administrative Expenses ** ** ** ** ** ** ** ** **
Corporate Overhead ** ** ** ** ** ** ** ** **
Total Operating Expenses 1,625 3,302 5,678 2,962 7,257 9,491 7,068 9,480 12,444
Interest Expense ** ** ** ** ** ** ** ** **
Other Expenses ** ** ** ** ** ** ** ** **
Income (Loss) Before Income Taxes ($58) $247 $927 $344 $1,224 $3,108 $1,245 $2,141 $3,610
Note: Computations include respondents that provided zeros and numerical amounts
** Insufficient data

111
© 2008 by the National Restaurant Association and Deloitte & Touche LLP
Exhibit D-16Limited Service RestaurantsStatement of Income and Expenses - Ratio to Total Sales*
Sales Volume ($000)
Under $500 Between $500 and $999 Between $1,000 and $1,999
Lower Quartile Median
Upper Quartile
Lower Quartile Median
Upper Quartile
Lower Quartile Median
Upper Quartile
Sales
Food 83.8% 96.8% 100.0% 85.2% 88.9% 93.8% 95.7% 100.0% 100.0%
Beverage ** ** ** ** ** ** ** ** **
Total Sales 100.0 100.0 100.0 100.0 100.0 100.0 100.0 100.0 100.0
Cost of Sales
Food 30.0 33.6 38.8 26.8 29.7 35.5 25.7 27.4 32.2
Beverage ** ** ** ** ** ** ** ** **
Total Cost of Sales 30.0 33.6 38.2 26.4 29.0 35.4 25.8 27.4 32.3
Gross Profit 61.8 66.4 70.0 64.6 71.0 73.6 67.7 72.6 74.2
Operating Expenses
Salaries and Wages (including Employee Benefits) 23.4 30.6 34.6 24.4 27.9 32.3 25.8 27.0 30.0
Direct Operating Expenses 3.1 8.1 12.5 2.7 4.7 5.8 4.8 5.0 6.5
Music and Entertainment ** ** ** ** ** ** ** ** **
Marketing 0.8 2.3 3.6 1.0 2.6 5.6 0.5 0.8 2.5
Utility Services 3.3 4.6 6.1 2.5 3.2 4.3 2.4 3.3 3.9
Restaurant Occupancy Costs 5.6 8.8 11.4 5.4 8.1 10.9 5.5 8.2 10.0
Repairs and Maintenance 0.5 1.3 2.3 1.2 1.7 2.9 1.3 1.6 1.9
Depreciation 0.4 2.5 4.9 0.4 0.9 1.2 0.3 0.9 1.9
Other Expense/(Income) 0.2 1.3 2.8 0.1 1.8 3.1 ** ** **
General & Administrative Expenses 0.8 1.5 4.2 0.6 1.5 6.9 0.4 0.7 3.7
Corporate Overhead ** ** ** ** ** ** ** ** **
Total Operating Expenses 49.4 59.0 68.8 45.3 58.5 62.7 53.0 54.6 58.1
Interest Expense 0.0 0.4 2.6 0.2 0.7 1.0 ** ** **
Other Expenses ** ** ** ** ** ** ** ** **
Income (Loss) Before Income Taxes (3.2%) 5.6% 15.0% 4.4% 10.0% 21.3% 7.1% 14.0% 16.4%
Note: Computations include respondents that provided zeros and numerical amounts
* All ratios are based as a percentage of total sales except food and beverage costs, which are based on their respective sales
** Insufficient data

112
© 2008 by the National Restaurant Association and Deloitte & Touche LLP
Exhibit D-17Limited Service RestaurantsStatement of Income and Expenses - Amount per Seat
Menu Theme
Sandwiches/Subs/Deli
Lower Quartile Median
Upper Quartile
Sales
Food $6,204 $8,055 $14,613
Beverage ** ** **
Total Sales 6,204 8,750 14,613
Cost of Sales
Food 2,246 2,795 4,351
Beverage ** ** **
Total Cost of Sales 2,246 2,800 5,275
Gross Profit 3,864 5,500 9,541
Operating Expenses
Salaries and Wages (including Employee Benefits) ** ** **
Direct Operating Expenses ** ** **
Music and Entertainment ** ** **
Marketing ** ** **
Utility Services ** ** **
Restaurant Occupancy Costs ** ** **
Repairs and Maintenance ** ** **
Depreciation ** ** **
Other Expense/(Income) ** ** **
General & Administrative Expenses ** ** **
Corporate Overhead ** ** **
Total Operating Expenses 2,548 4,567 5,929
Interest Expense ** ** **
Other Expenses ** ** **
Income (Loss) Before Income Taxes $214 $522 $2,054
Note: Computations include respondents that provided zeros and numerical amounts
** Insufficient data

11�
© 2008 by the National Restaurant Association and Deloitte & Touche LLP
Exhibit D-18Limited Service RestaurantsStatement of Income and Expenses - Ratio to Total Sales*
Menu Theme
Sandwiches/Subs/Deli
Lower Quartile Median
Upper Quartile
Sales
Food 85.6% 88.8% 99.5%
Beverage ** ** **
Total Sales 100.0 100.0 100.0
Cost of Sales
Food 30.0 35.3 38.6
Beverage ** ** **
Total Cost of Sales 30.0 35.3 39.0
Gross Profit 61.0 64.7 70.0
Operating Expenses
Salaries and Wages (including Employee Benefits) ** ** **
Direct Operating Expenses ** ** **
Music and Entertainment ** ** **
Marketing ** ** **
Utility Services ** ** **
Restaurant Occupancy Costs ** ** **
Repairs and Maintenance ** ** **
Depreciation ** ** **
Other Expense/(Income) ** ** **
General & Administrative Expenses ** ** **
Corporate Overhead ** ** **
Total Operating Expenses 48.1 55.9 61.9
Interest Expense ** ** **
Other Expenses ** ** **
Income (Loss) Before Income Taxes 3.3% 6.9% 16.5%
Note: Computations include respondents that provided zeros and numerical amounts
* All ratios are based as a percentage of total sales except food and beverage costs,
which are based on their respective sales
** Insufficient data

11�
© 2008 by the National Restaurant Association and Deloitte & Touche LLP
Exhibit D-19Limited Service RestaurantsStatement of Income and Expenses - Amount per Seat
Metropolitan/Non-Metropolitan Location
Inside MSA***
Lower Quartile Median
Upper Quartile
Sales
Food $7,300 $11,379 $18,309
Beverage 0 283 889
Total Sales 7,794 11,608 18,383
Cost of Sales
Food 2,322 3,815 5,347
Beverage 0 80 308
Total Cost of Sales 2,340 3,857 5,533
Gross Profit 5,003 7,696 13,320
Operating Expenses
Salaries and Wages (including Employee Benefits) 2,259 3,781 5,162
Direct Operating Expenses 284 677 1,163
Music and Entertainment 0 2 21
Marketing 68 147 350
Utility Services 259 425 638
Restaurant Occupancy Costs 418 834 1,665
Repairs and Maintenance 100 179 293
Depreciation 43 78 285
Other Expense/(Income) 3 224 469
General & Administrative Expenses 78 124 702
Corporate Overhead 288 834 1,327
Total Operating Expenses 3,788 6,183 10,072
Interest Expense 0 29 267
Other Expenses 0 0 125
Income (Loss) Before Income Taxes $249 $1,042 $3,047
Note: Computations include respondents that provided zeros and numerical amounts
** Insufficient data
*** Metropolitan statistical area

11�
© 2008 by the National Restaurant Association and Deloitte & Touche LLP
Exhibit D-20Limited Service RestaurantsStatement of Income and Expenses - Ratio to Total Sales*
Metropolitan/Non-Metropolitan Location
Inside MSA***
Lower Quartile Median
Upper Quartile
Sales
Food 88.8% 96.8% 100.0%
Beverage 0.1 3.9 11.4
Total Sales 100.0 100.0 100.0
Cost of Sales
Food 26.7 30.0 35.5
Beverage 27.0 34.1 39.5
Total Cost of Sales 26.6 30.0 35.4
Gross Profit 64.6 70.0 73.4
Operating Expenses
Salaries and Wages (including Employee Benefits) 25.5 28.6 33.3
Direct Operating Expenses 2.9 5.0 8.0
Music and Entertainment 0.0 0.0 0.2
Marketing 0.6 1.2 3.4
Utility Services 2.6 3.3 4.3
Restaurant Occupancy Costs 5.4 8.5 10.6
Repairs and Maintenance 1.1 1.5 2.2
Depreciation 0.3 0.8 2.0
Other Expense/(Income) 0.1 1.8 3.2
General & Administrative Expenses 0.6 1.2 4.6
Corporate Overhead 2.7 6.3 6.8
Total Operating Expenses 51.5 56.4 62.2
Interest Expense 0.0 0.4 1.2
Other Expenses 0.0 0.0 1.1
Income (Loss) Before Income Taxes 3.8% 9.8% 17.5%
Note: Computations include respondents that provided zeros and numerical amounts
* All ratios are based as a percentage of total sales except food and beverage costs,
which are based on their respective sales
** Insufficient data
*** Metropolitan statistical area

11�
© 2008 by the National Restaurant Association and Deloitte & Touche LLP
Exhibit D-21Limited Service RestaurantsStatement of Income and Expenses - Amount per Seat
Average Check
Under $7.50 $7.50 and Over
Lower Quartile Median
Upper Quartile
Lower Quartile Median
Upper Quartile
Sales
Food $7,989 $14,750 $18,068 $6,600 $9,833 $16,807
Beverage ** ** ** 62 350 938
Total Sales 8,962 14,750 18,068 6,955 9,982 17,994
Cost of Sales
Food 2,996 4,278 5,681 2,186 3,156 4,850
Beverage ** ** ** 39 97 313
Total Cost of Sales 3,030 4,383 5,779 2,238 3,241 5,040
Gross Profit 5,198 10,007 12,838 4,836 6,729 12,663
Operating Expenses
Salaries and Wages (including Employee Benefits) 2,992 4,113 5,836 2,043 3,343 4,444
Direct Operating Expenses 227 730 1,212 285 505 1,008
Music and Entertainment ** ** ** 0 12 24
Marketing 58 99 431 91 178 354
Utility Services 333 579 679 209 359 523
Restaurant Occupancy Costs 401 1,153 1,674 415 673 1,456
Repairs and Maintenance 119 210 323 75 127 240
Depreciation 50 79 242 50 97 415
Other Expense/(Income) 105 307 533 0 71 284
General & Administrative Expenses 77 92 405 103 402 1,015
Corporate Overhead 667 1,036 1,437 163 434 1,177
Total Operating Expenses 3,141 8,596 10,974 3,168 5,481 8,923
Interest Expense ** ** ** 0 75 300
Other Expenses ** ** ** 0 0 145
Income (Loss) Before Income Taxes $370 $1,058 $2,914 $160 $1,150 $3,062
Note: Computations include respondents that provided zeros and numerical amounts
** Insufficient data

11�
© 2008 by the National Restaurant Association and Deloitte & Touche LLP
Exhibit D-22Limited Service RestaurantsStatement of Income and Expenses - Ratio to Total Sales*
Average Check
Under $7.50 $7.50 and Over
Lower Quartile Median
Upper Quartile
Lower Quartile Median
Upper Quartile
Sales
Food 84.9% 96.8% 100.0% 88.6% 95.2% 99.3%
Beverage ** ** ** 0.7 5.0 12.0
Total Sales 100.0 100.0 100.0 100.0 100.0 100.0
Cost of Sales
Food 26.2 30.4 36.5 28.4 30.4 34.1
Beverage ** ** ** 25.0 33.3 37.5
Total Cost of Sales 26.4 30.4 36.5 28.0 30.4 33.7
Gross Profit 63.6 69.8 73.7 66.3 69.6 72.0
Operating Expenses
Salaries and Wages (including Employee Benefits) 24.9 27.6 30.0 25.2 29.0 35.3
Direct Operating Expenses 4.3 5.0 7.0 2.8 5.0 8.5
Music and Entertainment 0.0 0.0 0.2 0.0 0.1 0.2
Marketing 0.5 0.8 3.4 1.0 2.2 3.4
Utility Services 2.8 3.6 5.0 2.4 3.2 4.0
Restaurant Occupancy Costs 5.7 9.3 10.7 5.0 7.6 10.0
Repairs and Maintenance 1.1 1.7 2.4 1.0 1.4 1.9
Depreciation 0.3 0.6 1.8 0.5 1.0 3.2
Other Expense/(Income) 0.6 2.0 3.2 0.0 1.0 2.8
General & Administrative Expenses 0.5 0.7 4.4 1.1 3.6 7.0
Corporate Overhead 5.5 6.3 6.3 1.6 4.1 8.5
Total Operating Expenses 52.7 58.0 61.9 50.1 54.7 64.9
Interest Expense 0.0 0.1 0.8 0.0 0.8 2.0
Other Expenses ** ** ** 0.0 0.0 1.3
Income (Loss) Before Income Taxes 3.7% 9.2% 16.1% 3.3% 9.8% 18.5%
Note: Computations include respondents that provided zeros and numerical amounts
* All ratios are based as a percentage of total sales except food and beverage costs, which are based on their respective sales
** Insufficient data

11�
© 2008 by the National Restaurant Association and Deloitte & Touche LLP
Exhibit D-23Limited Service RestaurantsIncome Differential
Amount per Seat Ratio to Total Sales*
Profit Profit
Lower Quartile Median
Upper Quartile
Lower Quartile Median
Upper Quartile
Sales
Food $7,410 $11,733 $18,095 96.8% 100.0% 100.0%
Beverage 0 350 916 0.5 6.7 12.8
Total Sales 7,962 11,761 18,394 100.0 100.0 100.0
Cost of Sales
Food 2,345 3,709 5,383 27.0 30.0 35.3
Beverage 0 97 293 22.6 33.4 36.4
Total Cost of Sales 2,492 3,762 5,518 26.7 30.0 35.3
Gross Profit 5,066 7,700 13,113 64.8 70.0 73.4
Operating Expenses
Salaries and Wages (including Employee Benefits) 2,332 3,877 4,946 24.7 27.5 31.6
Direct Operating Expenses 275 630 1,033 2.9 5.0 7.1
Music and Entertainment 0 2 19 0.0 0.0 0.1
Marketing 65 152 322 0.6 1.4 3.2
Utility Services 275 401 631 2.4 3.2 4.0
Restaurant Occupancy Costs 442 900 1,625 5.4 8.2 10.1
Repairs and Maintenance 91 177 274 1.0 1.5 2.0
Depreciation 49 81 285 0.4 0.9 2.0
Other Expense/(Income) 0 186 352 0.0 1.7 3.1
General & Administrative Expenses 80 177 985 0.6 1.5 6.6
Corporate Overhead 288 875 1,437 2.7 6.3 7.5
Total Operating Expenses 2,968 5,983 9,624 50.1 54.5 60.9
Interest Expense 0 21 187 0.0 0.3 1.1
Other Expenses 0 0 67 0.0 0.0 0.5
Income (Loss) Before Income Taxes $472 $1,563 $3,399 6.3% 12.6% 18.5%
Note: Computations include respondents that provided zeros and numerical amounts
* All ratios are based as a percentage of total sales except food and beverage costs, which are based on their respective sales
** Insufficient data

11�
© 2008 by the National Restaurant Association and Deloitte & Touche LLP
Analyze Your OperationA periodic analysis of the financial performance of your food and beverage service operations may provide some early warning signs of potential problems. Food and beverage costs or payroll may be inching up month by month. Some controllable expenses could be increasing, while others are decreasing.
Day-to-day changes in your costs may be small and could go unnoticed. However, regular examination could uncover undesirable trends, allowing you to take corrective action and control situations that could lead to a crisis. That is the key to effective management.
We have included on the following page a worksheet designed to provide information for you to analyze how well your restaurant is performing in comparison with those of a similar business profile. Follow these simple instructions for completing the worksheet:
1. Enter your financial data in the first column.
2. Compute the percentages for Column 2 by dividing the amounts by total sales. (Note: where food and beverage sales are broken down separately, compute percentage of food cost by dividing cost of food by food sales; for the beverage cost percentage, divide cost of beverages by beverage sales.)
3. Calculate supplemental operating information in accordance with the formulas given on the worksheet.
4. List the appropriate comparative percentages or ratios from the
tables included in this report in Column 3.
5. Compute the variances by dividing the difference between the figures in Column 2 and Column 3 by the figures in Column 3. Multiply the result by 100 to express the variance as a percentage.
6. If the variance is greater than plus or minus 10%, further analysis should be made to determine the reason for that variance.

120
© 2008 by the National Restaurant Association and Deloitte & Touche LLP
WORKSHEETComplete and CompareStatement of Income and Expenses
Column 1Your Figures
(Dollars)
Column 2Your Figures(% of Sales)
Column 3Restaurant
Industry Report
Column 4
Variance + or -
Sales $ % %
Food
Beverage
Total Sales
Cost of Sales
Food
Beverage
Total Cost of Sales
Gross Profit
Operating Expenses
Salaries and Wages (including Employee Benefits)
Direct Operating Expenses
Music and Entertainment
Marketing
Utility Services
Restaurant Occupancy Costs
Repairs and Maintenance
Depreciation
Other Expense/(Income)
General & Administrative Expenses
Corporate Overhead
Total Operating Expenses
Interest Expense
Other Expenses
Income Before Income Taxes $ % %
Supplemental Operating Information Your FiguresRestaurant
Industry Report Variance + or -
Sales per Seat
Food $ $
Beverage $ $
Total $ $
Daily Seat Turnover (customers ÷ seats ÷ 365 days)

121
© 2008 by the National Restaurant Association and Deloitte & Touche LLP
SAMPLE
Who Should Complete This Survey?• Owners/operators/managers of a single restaurant. • Owners/operators/managers of two or more restaurants:
Complete and return a survey for Each Unit in operation, or for as many units as possible.
This questionnaire has been specifically designed to collect information relating to an individual restaurant’s operation. It is vitally important that income statement information pertain to a single restaurant and not to a chain of restaurants. Multi-unit operators should report information for individual establishments, including allocated revenues and costs.
Please answer all questions as completely as possible by the June 15, 2007 deadline.
Questions or problems completing the survey? Visit our Web site at www.restaurant.org/research/operations
Sample Survey

122
© 2008 by the National Restaurant Association and Deloitte & Touche LLP
SAMPLE
1. State in which restaurant is located: _________________
2. Zipcode of restaurant: ——————————————
3. Type of ownership (check one) 1 Sole proprietorship 2 Partnership 3 Public Corporation 4 Private Corporation
4. Type of organization 1 Independent (operates one unit) 2 Multi-unit (operates 2 or more units)* 3 Number of units operated:__________
*A separate survey should be completed for each unit.
5. Are you a franchisee or franchisor? (check one) 1 Franchisee 2 Franchisor 3 Both 4 Neither
6. Primary type of business (check one)
Fullservice 1 Average check per person under $15 2 Average check per person $15 to $24.99 3 Average check per person $25 and over
Limited service (all quickservice/fast food concepts) 4 Average check per person under $7.50 5 Average check per person $7.50 and over 6 Other (please specify):__________________
7. Liquor services (check one) 1 Beer and/or wine 2 Full liquor service 3 No alcoholic beverages
8. Primary menu theme: (check one) 1 Hamburger 6 American (varied) 2 Pizza 7 Mexican 3 Chicken 8 Asian 4 Steak/seafood 9 Italian 5 Sandwiches/subs/deli 10 Other (please specify):_______
9. Site on which restaurant is located:
Land (check one) Building (check one) 1 Owned 1 Owned 2 Leased 2 Leased
10. Number of years this restaurant has been in business:(check one)
1 Under 1 year 2 1 to 5 years 3 5 to 10 years 4 Over 10 years
11. Does restaurant offer:
(if offered, your best estimate of percentage of total sales)
Take out/drive-thru Yes No ___________%Outside catering Yes No ___________%Banquet services Yes No ___________%
12. Restaurant is located in/attached to: (check one) 1 A hotel 2 A shopping center or mall 3 Nothing—sole occupant of a building 4 Other (please specify):__________________
13. Number of seats:Total seats # _____________________1
14. Size of restaurant:Square feet of total area # _____________________1(including preparation and storage)
15. Number of customers served for the year:(provide best estimate) # _____________________1
16. Average guest check per person:(all meals) $_____________________1
17. Average number of paid restaurant employees that work during a typical week: (provide best estimate)
Salaried Hourly
Full-time (35 hours or more) _______1 _______2Part-time (20 to 34 hours) _______3 _______4Part-time (less than 20 hours) _______5 _______6TOTAL _______7 _______8
18. Number of W-2s your restaurant sent last year: (provide best estimate)
Salaried employees # ___________1Hourly employees # ___________2TOTAL # ___________3
Section I. General

12�
© 2008 by the National Restaurant Association and Deloitte & Touche LLP
SAMPLE
Section II. Statement of Income and ExpensePlease completely fill out all financial data for fiscal year 2006. If you wish, you may submit a copy of your year-end operating statement and this section will be completed for you by Deloitte & Touche. Income statement information should pertain to ONLY A SINGLE RESTAURANT and not to a chain of restaurants. Please use whole dollar amounts. Enter “zero” where appropriate. See the Guide to Completing the Restaurant Industry Operations Survey at www.restaurant.org/research/operations for more information.
Remember, all information provided will be kept strictly confidential.
Current 12 months ended: Month _________ Year 2006
SALESFood __________________1Beverage (alcoholic) __________________2Total sales _________________3
COST OF SALESFood __________________4Beverage (alcoholic) __________________5Total cost of sales _________________6
GROSS PROFIT (line 3 minus line 6) _________________7
OPERATING EXPENSESRestaurant operating expensesSalaries and wages __________________8Employee benefits __________________9Direct operating expenses __________________10Music and entertainment __________________11Marketing __________________12Utility services __________________13Restaurant occupancy costs __________________14Repairs and maintenance __________________15Depreciation __________________16Other expense/(income) __________________17Total restaurant operating expenses __________________18
General and administrative expenses __________________19Corporate overhead __________________20Total operating expenses _________________21
INTEREST EXPENSE _________________22
OTHER EXPENSES _________________23
INCOME BEFORE INCOME TAXES _________________24

12�
© 2008 by the National Restaurant Association and Deloitte & Touche LLP
Dear Restaurant Industry Operations Report 2007/2008 Edition Reader:
We appreciate your interest in this unique and extensive annual report of restaurant operations, prepared in conjunction with the professional services firm of Deloitte & Touche LLP.
With your purchase of this report, you are entitled to up to three free copies of selected Regional and State Restaurant Industry Operations Reports. These reports are exclusively offered in an electronic PDF format.
The Regional and State Restaurant Industry Operations Reports are produced as a special supplement to the national report. When used in conjunction with the national report, these operations reports can assist you in comparing your operations to others with a similar business profile on a regional, state and national basis.
2007/2008 Edition Regional and State Restaurant Industry Operations Reports are available for the following regions and states:
To order up to three regional and/or state reports, send an e-mail to [email protected] listing the reports you have selected. If you prefer, you may order by calling the National Restaurant Association’s Information Service and Library at (800) 424-5156 ext. 5959. Reports will be sent via e-mail.
National Restaurant AssociationResearch and Information Services Division
Regions:
• East North Central IL, IN, MI, OH, WI
• West North Central IA, KS, MN, MO, NE, SD
• New England CT, ME, MA, NH, RI
• Middle Atlantic NJ, NY, PA
• West South Central LA, OK, TX
• South Atlantic DE, DC, FL, GA, MD, NC, SC, VA, WV
• Mountain AZ, CO, ID, MT, NV, NM, UT, WY
• Pacific AK, CA, HI, OR, WA
States:
• California
• Florida
• Michigan
• Ohio
• Pennsylvania
• Texas
• Washington

12�
© 2008 by the National Restaurant Association and Deloitte & Touche LLP
Additional InformationFor additional restaurant industry operations data beyond the scope of this report, contact the National Restaurant Association’s Information Service and Library at (800) 424 5156, ext. 5960. Several state and regional restaurant industry operations reports are available. For information on joining the National Restaurant Association, call the Membership Department at (800) 424-5156, extension 5929, or visit our Web site at www.restaurant.org/join.
For more information on Deloitte’s Consumer Business Practice, please contact:
Craig GiffiVice Chairman and National Managing Principal Consumer & Industrial Products Industries Deloitte & Touche LLPTel: 216 830 6604e-mail: [email protected]
Lawrence HutterGlobal Practice DirectorConsumer and Industrial Products Industries Deloitte Touche Tohmatsu Tel: +44 20 7303 8648e-mail: [email protected]
Adam WeissenbergVice Chairman and National Managing Partner Tourism, Hospitality & Leisure PracticeConsumer and Industrial Products Industries Deloitte & Touche LLPTel: 973 683 6789e-mail: [email protected]
Sandra ViolaNational Director of Marketing Consumer and Industrial Products IndustriesDeloitte Services LPTel: 212 436 3058e-mail: [email protected]
Steven SteinhauserDirector, Restaurant Industry Practice Consumer and Industrial Products IndustriesDeloitte & Touche LLPTel: 213 688 3231e-mail: [email protected]
Bruce WestbrookNational Consumer & Industrial Products Consulting Leader Deloitte Consulting LLPTel: 404 631 2950e-mail: [email protected]
Dale LottigNational Consumer & Industrial Products Tax Leader Deloitte Tax LLPTel: 415 783 4236e-mail: [email protected]
John SchefflerNational Consumer & Industrial Products Assurance Leader Deloitte & Touche LLPTel: 415-783-6827e-mail: [email protected]
Brett ShermanNational Consumer and Industrial Products Enterprise Risk Services LeaderDeloitte & Touche LLPTel: 973 683 6364e-mail: [email protected]
Kevin F. BarrettNational Consumer and Industrial ProductsFinancial Advisory Services LeaderDeloitte Financial Advisory Services LLPTel: 617 437 2500e-mail: [email protected]
Member of Deloitte Touche Tohmatsu
About the National Restaurant Association
WHO WE AREFounded in 1�1�, the National Restaurant Association is the leading business association for the restaurant industry. Together with the National Restaurant Association Educational Foundation (NRAEF), the Association’s mission is to represent, educate and promote a rapidly growing industry that is comprised of ���,000 restaurant-and-foodservice outlets and 1�.1 million employees. Its membership represents approximately ��0,000 restaurant locations.
WHAT WE DO
We Represent the Restaurant-and-Foodservice Industry• The National Restaurant Association is the restaurant industry’s voice in Washington, DC,
promoting a pro-employee/pro-employer public policy agenda on Capitol Hill and regulatory agencies for such issues as tax relief, litigation reform, food safety and health care reform.
• The National Restaurant Association — ranked one of the country’s most powerful lobbying organizations by Fortune magazine — promotes the essential role of the $558 billion industry to key opinion leaders and government officials.
We Educate the Restaurant-and-Foodservice Industry• The National Restaurant Association serves as the “go-to” source for data and research on the
restaurant industry, including industry sales, trends, employment and operations, through the expertise of the Association’s information-service specialists, economists and other experts.
• The Association provides educational resources, materials and programs that address recruiting, retaining and training the industry’s workforce. Programs include ProStart®, which is a state-based program linking classroom curriculums with workplace mentoring; and the ServSafe® food safety training program, which is accepted by more federal, state and local jurisdictions than any other similar program in the country. The NRAEF has awarded deserving students $4 million in scholarships over the last five years.
We Promote the Restaurant-and-Foodservice Industry• With 945,000 locations, $558 billion in sales and 13.1 million employees, the restaurant
industry truly is the cornerstone of the nation’s economy, of rewarding career-and-employment opportunities, and of local communities. Through its Cornerstone Initiative, the National Restaurant Association promotes the restaurant industry’s essential role to the nation’s leading decision-makers “inside the Beltway” and beyond.
• The Association’s Restaurant, Hotel-Motel Show is the largest single gathering of restaurant, foodservice and lodging professionals in North and South America. The Show, held annually at McCormick Place in Chicago, Ill., attracts 2,100 exhibiting companies and more than 73,000 industry professionals and visitors from all 50 states and 110 countries.
To learn more, visit the Association’s Web site at www.restaurant.org
About Deloitte Deloitte refers to one or more of Deloitte Touche Tohmatsu, a Swiss Verein, its member firms, and their respective subsidiaries and affiliates. Deloitte Touche Tohmatsu is an organization of member firms around the world devoted to excellence in providing professional services and advice, focused on client service through a global strategy executed locally in over 1�0 countries. With access to the deep intellectual capital of approximately 1�0,000 people worldwide, Deloitte delivers services in four professional areas – audit, tax, consulting, and financial advisory services – and serves more than �0 percent of the world’s largest companies, as well as large national enterprises, public institutions, locally important clients, and successful, fast-growing global companies. Services are not provided by the Deloitte Touche Tohmatsu Verein, and, for regulatory and other reasons, certain member firms do not provide services in all four professional areas.
As a Swiss Verein (association), neither Deloitte Touche Tohmatsu nor any of its member firms has any liability for each other’s acts or omissions. Each of the member firms is a separate and independent legal entity operating under the names “Deloitte,” “Deloitte & Touche,” “Deloitte Touche Tohmatsu,” or other related names.
In the United States, Deloitte & Touche USA LLP is the U.S. member firm of Deloitte Touche Tohmatsu and services are provided by the subsidiaries of Deloitte & Touche USA LLP (Deloitte & Touche LLP, Deloitte Consulting LLP, Deloitte Financial Advisory Services LLP, Deloitte Tax LLP, and their subsidiaries), and not by Deloitte & Touche USA LLP. The subsidiaries of the U.S. member firm are among the nation’s leading professional services firms, providing audit, tax, consulting, and financial advisory services through nearly �0,000 people in more than �0 cities. Known as employers of choice for innovative human resources programs, they are dedicated to helping their clients and their people excel. For more information, please visit the U.S. member firm’s Web site at www.deloitte.com
Copyright © 200� Deloitte Development LLC. All rights reserved.

For further information contact:
natIonal REstauRant assocIatIonresearch and information services Division
1200 seventeenth street, nW Washington, DC 20036-3097
202.331.5900
e-mail: [email protected]: www.restaurant.org


