2007 ANNUAL BIOLOGICAL MONITORING REPORT FORMER FORT ORD, CALIFORNIA TOTAL ENVIRONMENTAL RESTORATION CONTRACT CONTRACT NO. DACW05-96-D-0011 Submitted to: U.S. Department of the Army Corps of Engineers 1325 “J” Street Sacramento, California 95814-2922 Submitted by: Shaw Environmental, Inc. PO Box 1698 Marina, California 93933 Revision 0 February 2008 Issued to:_____________________________ Date:_______________ Copy #:_______ ⌧ Controlled Uncontrolled
Transcript
2007 ANNUAL BIOLOGICAL MONITORING REPORT FORMER FORT ORD, CALIFORNIA
TOTAL ENVIRONMENTAL RESTORATION CONTRACT CONTRACT NO. DACW05-96-D-0011
Revision 0
February 2008
Approved by: Date: Shirley Tudor Biologist
Approved by: Date:
Tom Ghigliotto Contractor Quality Control Systems Manager
Approved by: Date:
Jen Moser Task Manager
2007 Annual Biological Report Former Fort Ord, California
i
Table of Contents________________________________________________
List of Tables ................................................................................................................................................. iii List of Figures ................................................................................................................................................iv List of Photographs........................................................................................................................................ v List of Appendices ........................................................................................................................................vii 1.0 Report Introduction ......................................................................................................................... 1-1 2.0 Site 39 - Wetland and Pond Monitoring at Soil Remediation Sites.................................................. 2-1
2.1 Wetland and Pond Monitoring at Soil Remediation Sites -- Introduction .............................. 2-1 2.2 Wetland/Pond Monitoring at Soil Remediation Sites -- Methods .......................................... 2-1
2.2.1 Pond Hydrology/Physical Parameters ..................................................................... 2-2 2.2.2 Pond Vegetation Survey.......................................................................................... 2-2 2.2.3 California Tiger Salamander and California Linderiella Surveys.............................. 2-3 2.2.4 Aquatic Sampling Dates .......................................................................................... 2-3
2.3 Wetland and Pond Monitoring at Soil Remediation Sites -- Results and Discussion ............ 2-3 2.3.1 Pond 5 (reference pond) -- Results and Discussion ................................................ 2-4 2.3.2 Pond 10 (Remediation Pond) -- Results and Discussion......................................... 2-5 2.3.3 Pond 56 (Reference Pond) -- Results and Discussion ............................................ 2-6 2.3.4 Pond 101East (Reference Pond) -- Results and Discussion ................................... 2-6
3.0 CTP Pilot Project Biological Baseline Survey.................................................................................. 3-1 3.1 CTP Pilot Project Biological Baseline Survey -- Introduction ................................................ 3-1 3.2 CTP Pilot Project Biological Baseline Survey -- Methods ..................................................... 3-1 3.3 CTP Project Pilot Project Biological Baseline Survey -- Results and Discussion.................. 3-2
3.3.1 Sand Gilia Survey - Results and Discussion ........................................................... 3-2 3.3.2 Monterey Spineflower Survey - Results and Discussion ......................................... 3-3 3.3.3 Annual Grass Survey - Results and Discussion ...................................................... 3-4 3.3.4 Other HMP species occurring on CTP Site ............................................................. 3-5 3.3.5 CTP Study – Mitigation Measures for Protection of the CTS, BLL, Sand Gilia and
Monterey spineflower: ............................................................................................. 3-6 4.0 MRS-16 First year follow-up monitoring.......................................................................................... 4-1
7.2.1 Ranges 43-48 Site- Results and Discussion ........................................................... 7-1 7.2.2 FONR plots-- Results and Discussion ..................................................................... 7-2 7.2.3 Fusilade Plots - Conclusion and implications .......................................................... 7-3
8.0 Other Biological Support Activities in 2007 ..................................................................................... 8-1 8.1 HMP Species Reports .......................................................................................................... 8-1
8.1.1 California Tiger Salamander encounters ................................................................. 8-1 8.1.2 Black Legless Lizard encounters............................................................................. 8-1
2007 Annual Biological Report Former Fort Ord, California
iii
List of Tables ___________________________________________________
Table 2-1 Summary of 2007 pond physical parameters and hydrological data. Table 2-2 Plant species encountered during 2007 pond surveys Table 2-3 Percent cover of wetland plant species at Pond 5 Table 2-4 Percent cover of wetland plant species at Pond 10 Table 2-5 Percent cover of wetland plant species at Pond 56 Table 5-1 2007 Burn Area fuel breaks vegetation transect data summary
2007 Annual Biological Report Former Fort Ord, California
iv
List of Figures __________________________________________________
Figure 2-1 Location of Monitoring Ponds and Remediation Sites Figure 2-2 Pond 5 - Maximum Ponded Area Figure 2-3 Pond 10 - Maximum Ponded Area, and Transect Location Figure 2-4 Pond 56 - Maximum Ponded Area, and Quadrat Locations Figure 2-5 Pond 101 East - Maximum Ponded Area Figure 3-1 CTP Pilot Study Site Location Figure 3-2 CTP Pilot Study – Sand Gilia Locations Figure 3-3 CTP Pilot Study – Monterey Spineflower Total Distribution Figure 3-4 CTP Pilot Study – Monterey Spineflower Areas with greater than 3 percent cover Figure 3-5 CTP Pilot Study – Invasive Annual Grass Distribution Figure 4-1 MRS-16 Location Figure 4-2 MRS-16 - Sand Gilia Locations Figure 4-3 MRS-16 - Monterey Spineflower Total Distribution Figure 4-4 MRS-16 - Monterey Spineflower Areas with greater than 5 percent cover Figure 4-5 MRS-16 - Invasive Annual Grass Distribution Figure 5-1 2007 Burn Area Location and Transect Locations Figure 5-2 2007 Burn Area Fuel break Invasive Grass Distribution Figure 6-1 Range 43-48 - Location Figure 6-2 Range 43-48 - Invasive Annual Grass Distribution
2007 Annual Biological Report Former Fort Ord, California
v
List of Photographs______________________________________________
Photograph 2-1 Pond 8 - This wetland remained dry all season, except for a small man-made hole that filled to about 30 cm, in March 2007 (inset).
Photograph 2-2 Pond 5 – Maximum ponding in March 2007, showing extensive Eleocharis macrostachya beds over the entire inundated area.
Photograph 2-3 Pond 10 – View of pond at maximum depth in March 2007. California tiger salamander larvae were found in this pond.
Photograph 2-4 Pond 10 – View along vegetation transect used to quantify percent cover of dominant wetland plants, mostly Eleocharis macrostachya, and Distichlis spicata, at the site.
Photograph 2-5 Pond 10 – Sampling for invertebrates (L) and water quality (R) Photograph 2-6 Pond 56 – View of pond at maximum depth in March 2007, showing extensive
Eleocharis macrostachya beds over the entire inundated area. Photograph 2-7 Pond 101E – View of pond at maximum depth in March 2007. Very
little vegetation developed this year in this wetland, because of a very short inundation period.
Photograph 3-1 CTP Pilot Study Site: Sand gilia plants in bloom. Photograph 3-2 CTP Pilot Study Site: View of an area with high density of sand gilia and
Monterey spineflower. Photograph 3-3 CTP Pilot Study Site: South perimeter access route comprised mostly of
dense cover non-native annual grasses. Photograph 3-4 CTP Pilot Study Site: West perimeter access route comprised mostly of dense
cover of non-native annual grasses. Photograph 3-5 CTP Pilot Study Site: View of the chaparral burn area, with medium density
cover of non-native annual grasses, as well as sand gilia and Monterey spineflower patches.
Photograph 3-6 CTP Pilot Study Site: Location of Well Number MW-01 in sensitive habitat area containing Monterey spineflower.
Photograph 3-7 CTP Pilot Study Site: View of well access area through a sandmat manzanita patch (above). Some plants may have been impacted by vehicles driving this access route (below).
Photograph 3-8 CTP Pilot Study Site: Location of Well Number IW-10, in a stand of coastal sage scrub (top). The brush had to be cut back to allow access to the well location (bottom). No HMP shrubs or annual plants were present in this area.
Photograph 4-1 MRS-16: View of site in fall 2006, before the start of the rainy season. Photograph 4-2 MRS-16: View of site in early spring with plant germination and shrub re-
growth. Photograph 4-3 MRS-16: An area with invasive annual grasses at high density (greater than
25 percent cover) Photograph 4-4 MRS-16: An area with invasive annual grasses at medium density (5-25
percent cover) Photograph 4-5 MRS-16: An area with invasive annual grasses at low density (less than 5
percent cover)
2007 Annual Biological Report Former Fort Ord, California
vi
List of Photographs______________________________________________
Photograph 5-1 2007 Burn Area: Transect T2 – Early seral stage chaparral with Monterey Ceanothus and shaggy-barked manzanita as co-dominants.
Photograph 5-2 2007 Burn Area: Transect T7 – Intermediate aged chaparral, with shaggy-barked manzanita as a dominant species.
Photograph 5-4 2007 Burn Area: Transect T12 – A short-statured chaparral stand with high diversity of shrub cover and high herbaceous percent cover. Shaggy-bark is the dominant manzanita. This was the only location where the HMP shrub Eastwood’s golden fleece (Ericameria fasciculata) was recorded in the vicinity.
Photograph 7-1 Fusilade Treatment Plots: View of Broadway fuel break Fusilade -treated plot above the purple flag.
Photograph 7-2 Fusilade Treatment Plots: View of Broadway fuel break treated plot (below purple flag) with visibly lower grass density, adjacent to untreated plot (above purple flag)
untreated side by side Photograph 7-6 Fusilade Treatment Plots: FONR Fusilade plot 3, treated (red color) Photograph 7-7 Fusilade Treatment Plots: FONR Fusilade plot 3, untreated Photograph 8-1 Juvenile California Tiger Salamander found on MRS-16 in January 2007. It
was found underneath a downed log. Photograph 8-2 Relocation area for the CTS found (above). Site is Pond 8, approximately 0.5
mile (0.75km) from encounter site. CTS was placed within a ground squirrel burrow (inset).
2007 Annual Biological Report Former Fort Ord, California
vii
List of Appendices_______________________________________________
Appendix A California Tiger Salamander and California Fairy Shrimp Aquatic Sampling Survey Report
2007 Annual Biological Report Former Fort Ord, California
viii
List of Acronyms and Abbreviations Army U.S. Department of the Army BLL Black Legless Lizard BLM Bureau of Land Management cm Centimeter CTP Carbon Tetrachloride Plume CTS California Tiger Salamander FONR Fort Ord Natural Reserve GIS Geographic Information System GPS Global Positioning System HA Historical Area HMP Habitat Management Plan MRS Munitions Response Site NTU Nephelometric Turbidity Units pH Potential of Hydrogen sqft square feet USFWS United States Fish and Wildlife Service
2007 Annual Biological Monitoring Report Former Fort Ord, California
1-1
1.0 Report Introduction
This report contains results of the 2007 biological monitoring studies that are required as part of the Installation-Wide Multispecies Habitat Management Plan (HMP) for Former Fort Ord, California (Army, 1997a). Shaw Environmental, Inc. (Shaw) prepared this report under the Total Environmental Restoration Contract II No. DACW05-96-D-0011.
The HMP identifies rare, threatened or endangered species and habitats occurring on the former Fort Ord which are designated for protection and future management. Typical habitats that require surveys for potential protection and monitoring of rare species are: central maritime chaparral, wetlands or vernal ponds, and other habitats where listed species are known or suspected to occur including coastal scrub, coast live oak woodlands, and grasslands with a significant native component of grasses or forbs.
Before and after the completion of munitions removal, soil remediation, groundwater remediation, and other related environmental cleanup operations within Habitat Reserves, baseline biological and follow-up surveys are conducted to: establish whether protected species are present prior to work operations, including location and abundance; monitor the protected species and habitat after work completion to help determine whether work activities have significantly impacted rare species or habitat. The HMP also outlines avoidance measures, and mitigation measures such as habitat restoration, which would be necessary if U.S. Department of the Army (Army)-related munitions cleanup activities significantly impact rare species or habitats.
To determine whether mitigation measures would be needed to restore populations of affected HMP-listed special-status species, a baseline biological survey is conducted within a proposed cleanup site, and three to five monitoring events are conducted for rare species following completion of the cleanup operations. Monitoring data may be compared to a site’s baseline vegetation survey data to assess whether there have been significant impacts related to the clean up operations, and whether recovery or restoration of the protected habitat (maritime chaparral, wetlands etc.) and associated species is proceeding toward the baseline conditions.
In addition to the HMP, three Biological Opinions have been issued by the United States Fish and Wildlife Service [(USFWS) 1999, 2002, 2005)] as a result of consultation with the Army which contain additional mitigation measures and recommendations relating to biological monitoring at former Fort Ord cleanup sites.
For the 2007 monitoring season, Shaw was tasked by the Army Corps of Engineers to conduct the following biological baseline and follow-up surveys for various former Fort Ord sites where
2007 Annual Biological Monitoring Report Former Fort Ord, California
1-1
work related to the environmental cleanup has either already begun, or will begin in the future. Biological surveys began early in 2007 and continued until early September 2007.
List of 2007 Biological Monitoring Sites included in this Annual Report
• Site 39, Inland Ranges - Wetland and Pond Monitoring at Soil Remediation Sites • Carbon Tetrachloride Plume (CTP) Pilot Project - Biological Baseline Survey • Munitions Remediation Site (MRS)-16 - First year follow-up monitoring • 2007 Proposed Burn Units 1, 2 and 3 - Baseline Vegetation Survey of Fuel Breaks • MRS Ranges 43-48 - Annual Follow-up Monitoring of Fuel breaks for Non-native
Invasive Annual Grasses
2007 Annual Biological Monitoring Report Former Fort Ord, California
2-1
2.0 Site 39 - Wetland and Pond Monitoring at Soil Remediation Sites
2.1 Wetland and Pond Monitoring at Soil Remediation Sites -- Introduction There are several ranges on former Fort Ord where soil remediation for lead or munitions-related contamination will be necessary. To protect wetland habitats, and rare, threatened or endangered species that could be impacted by these activities, baseline and monitoring surveys were conducted for any ponds or wetlands near a remediation site. These data will be used to determine whether there have been any significant impacts to protected wetland species, or impacts on the hydrology or function of the pond or wetland itself that could affect survival of protected species.
Special-Status species associated with wetlands, and which are included as part of the survey, include Contra Costa goldfields (Lasthenia conjugens), California Tiger Salamander [(CTS), Ambystoma californiense] and California Linderiella (Linderiella occidentalis). The Federally Threatened California red-legged frog (Rana aurora draytoni) has not been found on former Fort Ord since biological surveys began in 1992.
In spring 2007, baseline surveys were conducted at four ponds associated with remediation sites, and three reference sites. Data was collected at each pond to characterize hydrology [maximum depth and maximum area of ponding, duration of ponding, and potential of hydrogen (pH) and turbidity]; wetland vegetation composition (percent cover of each dominant species, species diversity, and percent submergent and emergent vegetation); and determine presence or absence of populations of special-status faunal species: the CTS and California Linderiella, a vernal pond invertebrate.
The ponds (listed by former Fort Ord Pond#) included for 2007 sampling were (with associated remediation range number shown in parentheses): Pond 8 [Historical Area (HA) 39/40], Pond 10 (HA37), and Pond 30 (HA28). Three reference ponds were selected that matched characteristics of the target ponds. Reference ponds surveyed were Ponds 5, 56, and 101East, all of which are located on Bureau of Land Management (BLM) owned lands, at a distant of more than 1.5 kilometers from the closest remediation site.
Location of each of these ponds is shown in Figure 2-1.
2.2 Wetland/Pond Monitoring at Soil Remediation Sites -- Methods Methodology for pond monitoring was consistent with the Wetland Monitoring and Restoration Plan for Munitions and Contaminated Soil Remedial Activities at Former Fort Ord (Army, 2006). As indicated by the plan, the appropriate USFWS protocols were used for
2007 Annual Biological Monitoring Report Former Fort Ord, California
2-2
sampling CTS, and Branchiopods (Branchiopods include California Linderiella, vernal pond shrimp and other invertebrates) (see Appendix A).
As the 2006/2007 winter was a low rain year, only four of the seven selected ponds held water in 2007. These included only one of the remediation-site ponds (Pond 10 - near HA37), and three of the reference ponds.
2.2.1 Pond Hydrology/Physical Parameters A staff gauge was installed at the deepest point of each pond to measure maximum depth and checked at approximately monthly intervals during the period of ponding. A water-quality meter (Horiba Model U-22) was used to measure pH and turbidity during one period after a significant rain event inundated each pond.
To capture the maximum ponding area, a Trimble Global Positioning System (GPS) unit was used to map the boundary of inundation on each visit, approximately once per month until ponds were dry.
2.2.2 Pond Vegetation Survey For ponds which were inundated in spring 2007, a vegetation survey was conducted between March and May. All plant species encountered within the wetland area were recorded for each pond. Vegetation was sampled by one of two methods. At Pond 10, one 150-foot line transect was placed along the wetland to capture representative vegetation. Because of the homogeneity of the vegetation, a single transect was determined to be adequate to represent the vegetation. A one-quarter meter quadrat was placed at about 10-foot intervals along the transect, alternating right and left sides. Species were noted, and percent cover was visually estimated for individual plant species, thatch, mud or bare ground, and water.
For ponds where the vegetation cover was highly consistent between zones surrounding the ponded areas, multiple quadrats were placed in each vegetation zone to characterize the species composition. For both Pond 5 and Pond 56, sampling was conducted in three different zones, using a one-meter square quadrat. The first zone sampled was in the deepest area of the pond that was accessible (not completely inundated). The other two zones were sequentially farther upland of the deepest zone, defined by a noticeable visual change in the plant species composition and dominance.
Plants were identified to species where possible. If plants were not identified to species, it was because they were not in bloom at the time of the survey.
2007 Annual Biological Monitoring Report Former Fort Ord, California
2-3
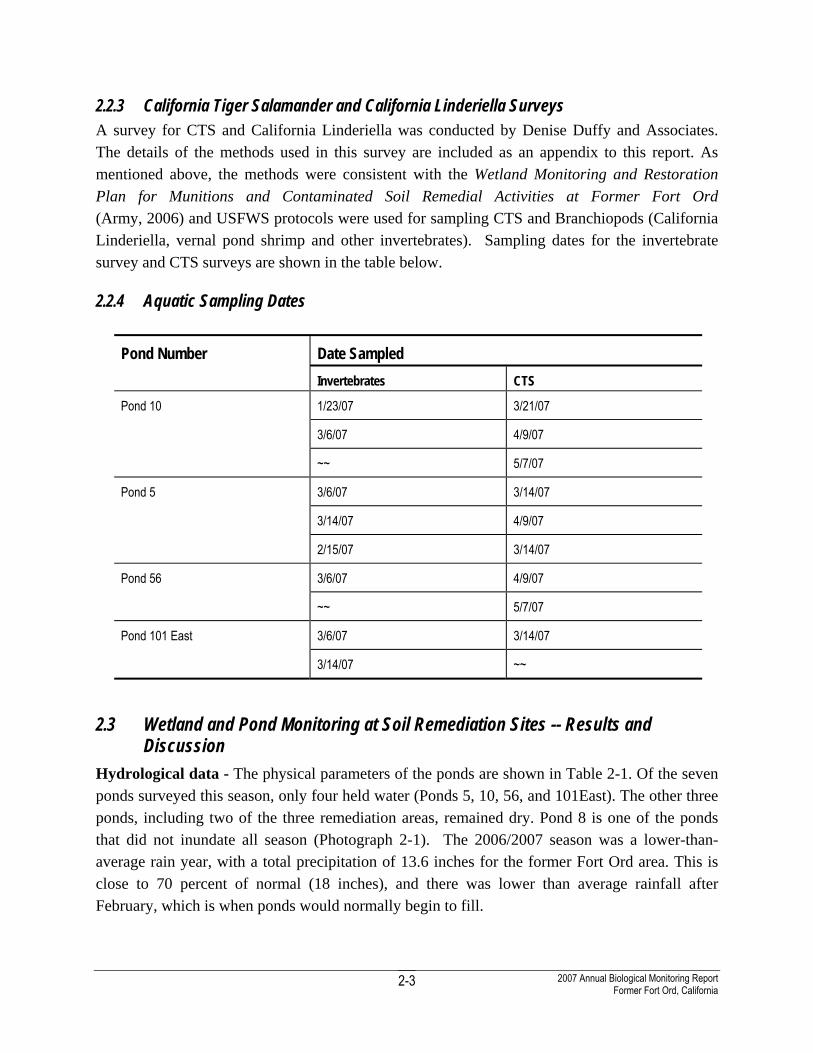
2.2.3 California Tiger Salamander and California Linderiella Surveys A survey for CTS and California Linderiella was conducted by Denise Duffy and Associates. The details of the methods used in this survey are included as an appendix to this report. As mentioned above, the methods were consistent with the Wetland Monitoring and Restoration Plan for Munitions and Contaminated Soil Remedial Activities at Former Fort Ord (Army, 2006) and USFWS protocols were used for sampling CTS and Branchiopods (California Linderiella, vernal pond shrimp and other invertebrates). Sampling dates for the invertebrate survey and CTS surveys are shown in the table below.
2.2.4 Aquatic Sampling Dates
Date Sampled Pond Number Invertebrates CTS
1/23/07 3/21/07
3/6/07 4/9/07
Pond 10
~~ 5/7/07
3/6/07 3/14/07
3/14/07 4/9/07
Pond 5
2/15/07 3/14/07
3/6/07 4/9/07 Pond 56
~~ 5/7/07
3/6/07 3/14/07 Pond 101 East
3/14/07 ~~
2.3 Wetland and Pond Monitoring at Soil Remediation Sites -- Results and
Discussion Hydrological data - The physical parameters of the ponds are shown in Table 2-1. Of the seven ponds surveyed this season, only four held water (Ponds 5, 10, 56, and 101East). The other three ponds, including two of the three remediation areas, remained dry. Pond 8 is one of the ponds that did not inundate all season (Photograph 2-1). The 2006/2007 season was a lower-than-average rain year, with a total precipitation of 13.6 inches for the former Fort Ord area. This is close to 70 percent of normal (18 inches), and there was lower than average rainfall after February, which is when ponds would normally begin to fill.
2007 Annual Biological Monitoring Report Former Fort Ord, California
2-4
Vegetation Sampling - A list of all wetland plant species encountered during the surveys at all ponds which held water in the spring of 2007 is shown in Table 2-2. A total of 36 species were recorded for all ponds sampled, of which 14 species were non-native. Tables 2-3 to 2-5 show the percent cover of plant species from transect and quadrat sampling at each pond where a vegetation survey was conducted.
Aquatic Surveys for CTS and California Linderiella - Aquatic surveys for CTS and California Linderiella were conducted by Denise Duffy and Associates. CTS were only found in one of the surveyed ponds, and Linderiella were also found in just one of the ponds. The report on their survey is included as an appendix to this report (Appendix A), and summary results for CTS and Linderiella presence are included in the sections below for each pond surveyed.
Since 2006/2007 rainfall year is atypical, additional wetland monitoring should be conducted in the winter and spring of 2008 to collect data for the remediation site ponds that remained dry last year. Ponds 8 and Pond 30 require baseline surveys prior to start of remediation work.
2.3.1 Pond 5 (reference pond) -- Results and Discussion Hydrology - Pond 5 is a large, shallow pond dominated by Eleocharis macrostachya beds in its lowest zone mixing with Distichlis spicata in higher zones. It is located on BLM land on former Fort Ord and is one of the selected reference ponds. In spring 2007, the maximum inundated area was 1.6 acres with a maximum depth of 17 centimeters (cm), measured in March (Figure 2-2, Photograph 2-2). The historic maximum area of inundation is approximately 6.5 acres. Ponding period was March through early June 2007. Water quality parameters were taken on March 6th. pH was 7.2, and turbidity was 5.1 Nephelometric Turbidity Units (NTU).
Vegetation - Species composition and percent cover for Pond 5 are summarized in Table 2-3. Figure 2-2 shows the sampling quadrat locations for this pond, consisting of three quadrats placed in each of three zones. Twenty-six species were recorded within this wetland, of which seventeen were native species. All the dominant species listed here are native wetland species. In the deepest zone, close to the staff gauge location, Eleocharis macrostachya was by far the dominant species. In the next highest zone, both Eleocharis and Distichlis spicata dominated, but in this zone Distichlis cover (14 percent) was approximately twice Eleocharis cover (27 percent). In the third zone, Juncus spp was the dominant species at 25 percent, with no other species present. The remaining cover in all these zones was predominantly dead thatch.
Eleocharis macrostachya beds 100 percent all of the emergent vegetation within the inundated area of the pond. No submergent species were noted.
No Contra Costa goldfields or other protected wetland plant species were encountered at this site.
2007 Annual Biological Monitoring Report Former Fort Ord, California
2-5
CTS/California Linderiella Survey - No CTS or California linderiella were found at this pond during aquatic sampling (see Appendix A).
2.3.2 Pond 10 (Remediation Pond) -- Results and Discussion Hydrology - Pond 10 is associated with the soil remediation site HA-37. Pond 10 is a large pond, covering an extensive clay-dominated mudflat. Figure 2-3 shows greatest area of inundation mapped in March of 2007, with an area of 2.1 acres, and a depth of 85 cm (Photograph 2-3). Ponding period was January through late July 2007. Water quality parameters were taken on March 6th. Potential of Hydrogen (pH) was 7.71, and turbidity was 461 NTU. On each visit during the ponded period, the water was observed to be very cloudy and opaque with a high concentration suspended clay particles.
Vegetation - Eighteen species were recorded within this wetland, of which eleven were native. Species composition and percent cover are summarized in Table 2-4. Figure 2-3 shows the transect location for this pond (Photograph 2-4). Closest to the pond edge, within the submergent zone, the dominant species were the submerged species Potamogeton nodusus (30 percent), Eleocharis macrostachya (8 percent). Both are native species. In semi-saturated soils at the pond edge out of the submerged zone, Eleocharis macrostachya was a co-dominant species at 12 percent cover, along with Juncus phaeocephalus at 10.7 percent cover. The remainder of the vegetation cover was predominantly dead thatch. Very few other species were present in this zone, none at greater than one percent cover.
Visible submergent and emergent vegetation associated with Pond 10 in June 2007 consisted of Potamogeton nodosus patches [estimated total area = 450 square feet (sqft)], and emergent beds of Eleocharis macrostachya that comprised a visually estimated total of 750 sqft within the ponded area. Total submergent vegetation comprised 1200 sqft of the 2.1 acre pond, or about 1.3 percent of the maximum ponded area.
No Contra Costa goldfields or other protected wetland plant species were encountered at this site.
Aquatic Surveys for CTS and California Linderiella - CTS larvae were found in high abundance at Pond 10, with more than 101 larvae captured while conducting representative sampling over the whole pond (see Appendix A).
Since this is a significant CTS breeding pond, protective measures will be implemented at this pond during soil remediation to protect populations of CTS. These measures include: conducting periodic monitoring surveys, installing fencing to prevent adult CTS from entering the remediation areas, scheduling timing to work to avoid the most sensitive season for the species, educating all workers for recognition, reporting, and avoidance of CTS.
2007 Annual Biological Monitoring Report Former Fort Ord, California
2-6
No California linderiella were found at this pond during aquatic sampling (Photograph 2-5).
2.3.3 Pond 56 (Reference Pond) -- Results and Discussion Hydrology - Pond 56 was selected as a reference pond. Figure 2-4 shows the maximum inundated area of 0.46 acres measured in March 2007, with a depth of 60 cm (Photograph 2-6). Pond 56 is a small pond, with a historic maximum inundation area of approximately 4.5 acres. Ponding period was December through late July, 2007. Water quality parameters were taken on March 6th. pH was 6.78, and turbidity was 9.8 NTU.
Vegetation - Twenty-eight species were recorded within this wetland, of which nineteen were native. Species composition and percent cover are summarized in Table 2-5. Figure 2-4 shows the sampling quadrat locations for this pond. Closest to the pond edge, within the submergent zone, the only species recorded were Eleocharis macrostachya (22 percent) and Distichlis spicata (9 percent), both native species, with the remainder of cover being dead thatch. In moist soils 10-feet away from the pond edge, Distichlis was dominant with 63 percent cover, compared to 17 percent for Eleocharis. The remainder of the vegetation cover was predominantly dead thatch, with smaller percentages of Juncus sp. (10 percent), Stachys ajugoides (1 percent) and Rumex acetosella (1 percent). Very few other species were present in this zone, none greater than one percent.
Submerged vegetation associated with Pond 56 in June 2007 consisted of Eleocharis macrostachya, very small patches of Potamogeton nodosus and Ranunculus lobbii, each comprising less than one percent of the maximum ponded area.
No Contra Costa goldfields or other protected wetland plant species were encountered at this site.
Aquatic Surveys for CTS and California Linderiella - No CTS were found at Pond 56 during larval surveys. California Linderiella, however, were found on both sampling dates. Numbers of Linderiella sampled were 23 (on February 15, 2007) and 20 (on March 6, 2007) (see Appendix A).
2.3.4 Pond 101East (Reference Pond) -- Results and Discussion Hydrology - Pond 101East is a pond that filled late in the season to a shallow depth and dried up early in the season. It is located on BLM land on the former Fort Ord and is one of the selected reference ponds. Figure 2-5 shows the maximum inundated area measured in March 2007, with an area of 0.32 acres, and depth of 20 cm (Photograph 2-7). The historic maximum area of inundation for this pond is approximately 8.5 acres. Ponding only occurred in the month of March. Water quality parameters were taken on March 6th. pH was 7.61, and turbidity was 6.1 NTU.
2007 Annual Biological Monitoring Report Former Fort Ord, California
2-7
Vegetation - No vegetation survey was conducted at this pond in 2007. The ponding period was very short, and late in the season, and dried up quickly, and not much wetland vegetation in either diversity or abundance developed at this site. Since this is a reference site it would be preferable to re-survey in a higher rainfall year, if it is determined that an additional reference pond data is needed.
Aquatic Surveys for CTS and California Linderiella - No CTS or California linderiella were found at this pond during aquatic sampling (see Appendix A).
2007 Annual Biological Monitoring Report Former Fort Ord, California
3-5
3.0 CTP Pilot Project Biological Baseline Survey
3.1 CTP Pilot Project Biological Baseline Survey -- Introduction A baseline vegetation survey was conducted at the University of California’s Fort Ord Natural Reserve (FONR), in preparation for an upcoming pilot study to address ongoing groundwater remediation cleanup of a carbon tetrachloride plume (CTP). The CTP pilot study has been proposed to extend from July 2007 through February 2008, and consisted of installation of 25 new wells for injection of remediation media, and extraction and monitoring of water samples. Location of the pilot study area, and the biological survey area is shown in Figure 3-1. The biological survey area was about 6 acres in size, and was established to incorporate all the areas that could be impacted by the study.
A 2007 spring survey was conducted for the two listed annual plant species known to be present on the site: the Federally Endangered sand gilia (Gilia tenuiflora arenaria), and Federally Threatened Monterey spineflower (Chorizanthe pungens pungens). No other federal or state listed species are known to be present from review of extensive past surveys conducted within the project area. In addition to these listed plants, invasive annual grass locations were mapped in the area to determine whether work-related disturbances have caused invasion of grasses into new areas.
3.2 CTP Pilot Project Biological Baseline Survey -- Methods For consistency with past surveys, the methods used for the current survey were the same, where appropriate, as those used for vegetation surveys at FONR completed previously by Denise Duffy and Associates for HydroGeoLogic, Inc. (Army, 2007a). The only difference in the methods was in the mapping of invasive annual grasses. In the current study, the entire study area was mapped using GPS for annual grass occurrence and abundance as measured by percent cover. The previous study conducted by HydroGeoLogic, Inc used quadrat sampling along transects to measure not only annual grass occurrence, but included native cover, non-native cover by species, bare ground and litter.
Sand gilia populations were surveyed during mid-April through mid-May to capture the peak bloom. Gilia patches were mapped using GPS, and the actual number of plants was recorded for each patch.
The Monterey spineflower survey was conducted between mid-May and mid-June to capture peak densities, as measured by percent cover. Monterey spineflower areas were mapped as an overall distribution over the study site, and in addition, patches were mapped with density
2007 Annual Biological Monitoring Report Former Fort Ord, California
3-5
estimates, recorded as an estimated percent cover class for each patch. Density classes (following previous FONR surveys) were as follows:
Very Sparse = <3 percent Sparse = 3-25 percent Medium Low = 26-50 percent Medium = 51-75 percent Medium-High = 76-97 percent High = 98-100 percent
Invasive annual grass areas were mapped by hand onto aerial photo maps in the field, and later digitized into Geographic Information System (GIS). The following density cover classes were used for annual grasses:
Very Low = <3 percent Low = 3-25 percent Medium = 26-50 percent High = 51-75 percent Very High = >75 percent
Locations with other HMP plant species, such as sandmat manzanita (Arctostaphylos pumila) were also noted. Areas of A. pumila were documented in areas which might be impacted by access to wells. Monterey Ceanothus (Ceanothus cuneatus spp. rigidus) seedlings in cages were present on the site as part of a FONR replanting study within a small maritime chaparral stand approximately 1 acre in size that burned accidentally two years ago. Numbers of live Ceanothus seedlings were counted prior to work impacts so as to be able to document any losses in areas of well installation.
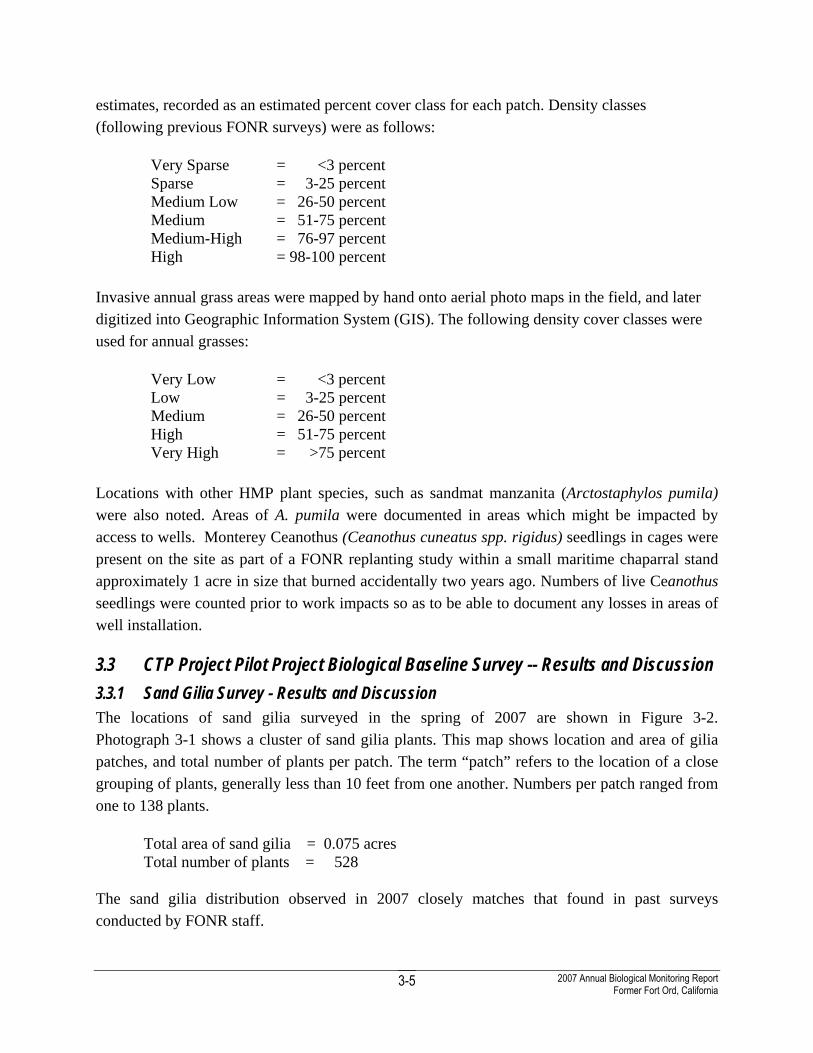
3.3 CTP Project Pilot Project Biological Baseline Survey -- Results and Discussion 3.3.1 Sand Gilia Survey - Results and Discussion The locations of sand gilia surveyed in the spring of 2007 are shown in Figure 3-2. Photograph 3-1 shows a cluster of sand gilia plants. This map shows location and area of gilia patches, and total number of plants per patch. The term “patch” refers to the location of a close grouping of plants, generally less than 10 feet from one another. Numbers per patch ranged from one to 138 plants.
Total area of sand gilia = 0.075 acres Total number of plants = 528
The sand gilia distribution observed in 2007 closely matches that found in past surveys conducted by FONR staff.
2007 Annual Biological Monitoring Report Former Fort Ord, California
3-5
None of the wells or access routes to wells was located in areas with sand gilia, so there are no expected impacts to the species as a result of the work conducted this year. However, sand gilia will continue to be monitored in follow-up surveys in case of changes to the work plan, or other unforeseen impacts to the population.
Given that 2007 was a low-rainfall year, it may be expected that future surveys in higher rainfall year could show significantly higher numbers of plants, or a change in the areal distribution that are climate-dependent, and unrelated to the work impacts. As is true for all plant monitoring programs, climate variations should be taken into consideration in the interpretation of all data comparisons.
3.3.2 Monterey Spineflower Survey - Results and Discussion The total distribution of Monterey spineflower is shown in Figure 3-3, and total acreage was 2.17 acres out of the 6-acre survey area. The spineflower distribution observed in 2007 matches the acreage of plants found in past surveys conducted by FONR staff in the study area, with a slightly differing distribution. No density data was specified in FONR studies for the study area, so no plant density comparison can be made.
More than 80 percent of the mapped spineflower area was in the Very Sparse (0-3 percent) density category. The other 20 percent of the area consisted of small patches of higher density, exceeding 3 percent in percent cover, as shown in Figure 3-4. A particularly large, high density patch of spineflower, that also contained sand gilia, is shown in Photograph 3-2. Approximate acreage for each density class is shown below.
Total area occupied by Monterey spineflower = 2.17 acres Area at Very Sparse density (0-3 percent) = 1.94 acres Area at Sparse density (3-25 percent) = 0.15 acre Area at Medium-Low density (26-50 percent) = 0.05 acre Area at Medium density (51-75 percent) = 0.03 acre
Out of twenty-five new well locations, fourteen occur within the 2007 Monterey spineflower range, and although no wells were located directly in high density areas, some access routes went through high density patches. Conducting work during the dry season minimized impacts to the dry seed bank, and use of heavy-duty matting along all off-road access routes for vehicle use helped to minimize soil disturbance that could bury the seed bank.
Future monitoring effort should continue to map both spineflower distribution and density and to make a comparison to this 2007 baseline data, as well as past data, to determine potential effects to the population that could be caused by the current project.
2007 Annual Biological Monitoring Report Former Fort Ord, California
3-5
As with sand gilia, the 2007 low-rainfall year may have promoted lower-than-average germination and growth of spineflower. Future years with normal rainfall could show a significant change in the abundance of plants, or other variations in the population size, related to climate more than to work-related impacts. Annual climactic variations should be taken into consideration in the interpretation of all plant monitoring data.
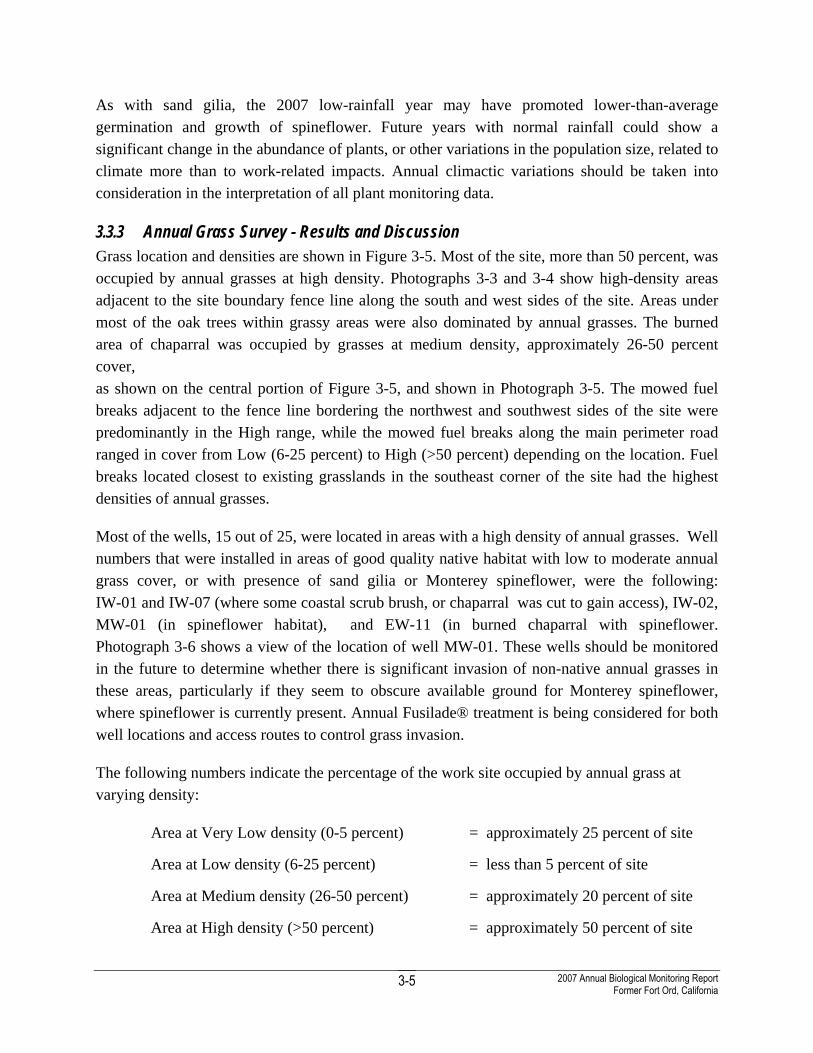
3.3.3 Annual Grass Survey - Results and Discussion Grass location and densities are shown in Figure 3-5. Most of the site, more than 50 percent, was occupied by annual grasses at high density. Photographs 3-3 and 3-4 show high-density areas adjacent to the site boundary fence line along the south and west sides of the site. Areas under most of the oak trees within grassy areas were also dominated by annual grasses. The burned area of chaparral was occupied by grasses at medium density, approximately 26-50 percent cover, as shown on the central portion of Figure 3-5, and shown in Photograph 3-5. The mowed fuel breaks adjacent to the fence line bordering the northwest and southwest sides of the site were predominantly in the High range, while the mowed fuel breaks along the main perimeter road ranged in cover from Low (6-25 percent) to High (>50 percent) depending on the location. Fuel breaks located closest to existing grasslands in the southeast corner of the site had the highest densities of annual grasses.
Most of the wells, 15 out of 25, were located in areas with a high density of annual grasses. Well numbers that were installed in areas of good quality native habitat with low to moderate annual grass cover, or with presence of sand gilia or Monterey spineflower, were the following: IW-01 and IW-07 (where some coastal scrub brush, or chaparral was cut to gain access), IW-02, MW-01 (in spineflower habitat), and EW-11 (in burned chaparral with spineflower. Photograph 3-6 shows a view of the location of well MW-01. These wells should be monitored in the future to determine whether there is significant invasion of non-native annual grasses in these areas, particularly if they seem to obscure available ground for Monterey spineflower, where spineflower is currently present. Annual Fusilade® treatment is being considered for both well locations and access routes to control grass invasion.
The following numbers indicate the percentage of the work site occupied by annual grass at varying density:
Area at Very Low density (0-5 percent) = approximately 25 percent of site
Area at Low density (6-25 percent) = less than 5 percent of site
Area at Medium density (26-50 percent) = approximately 20 percent of site
Area at High density (>50 percent) = approximately 50 percent of site
2007 Annual Biological Monitoring Report Former Fort Ord, California
3-5
3.3.4 Other HMP species occurring on CTP Site Other species encountered during the annual survey included:
Monterey Ceanothus (Ceanothus rigidus rigidus) - Communications with staff from the University of California’s FONR indicated that Ceanothus seedlings had been planted within the burned chaparral area as part of a restoration effort. Forty-four cages with live plants were encountered, and a number of cages were also present with Ceanothus that were either dead or absent. Cages with live Ceanothus plants were marked with red-colored flagging for avoidance if at all possible, and access routes to the wells were re-routed wherever possible to minimize seedling damage. Although effort was made to avoid as many plants as possible, a total of three plants were lost to vehicle damage along access routes.
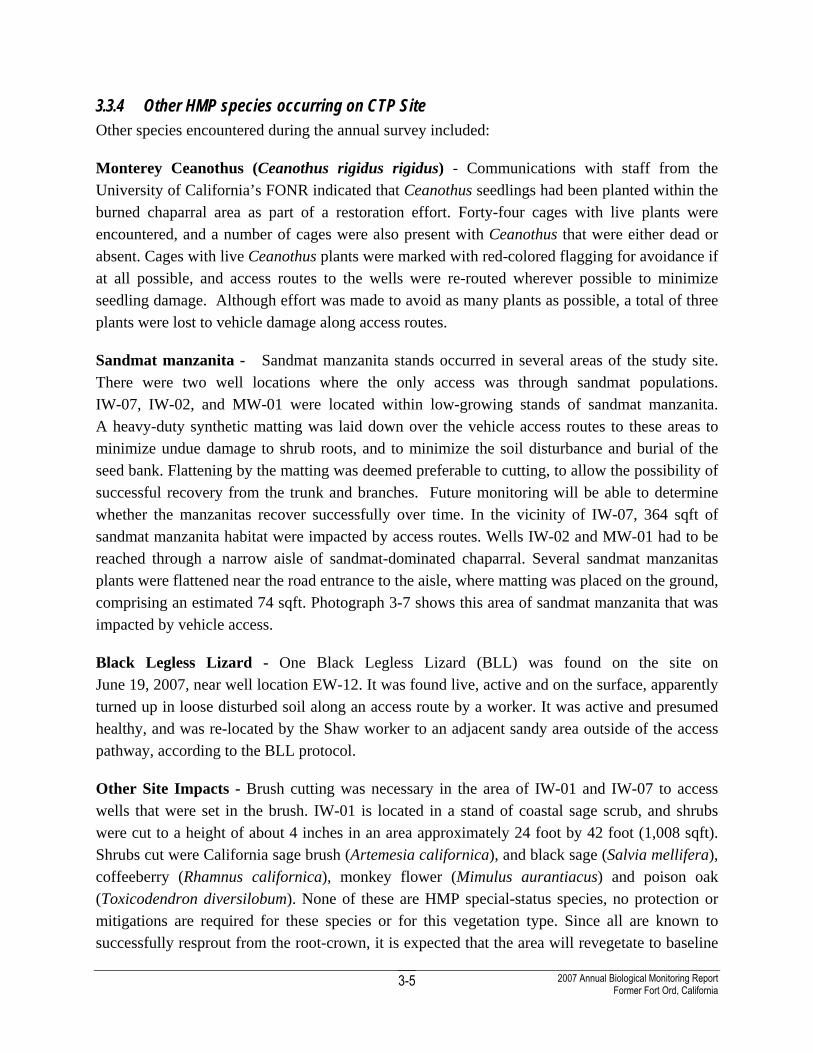
Sandmat manzanita - Sandmat manzanita stands occurred in several areas of the study site. There were two well locations where the only access was through sandmat populations. IW-07, IW-02, and MW-01 were located within low-growing stands of sandmat manzanita. A heavy-duty synthetic matting was laid down over the vehicle access routes to these areas to minimize undue damage to shrub roots, and to minimize the soil disturbance and burial of the seed bank. Flattening by the matting was deemed preferable to cutting, to allow the possibility of successful recovery from the trunk and branches. Future monitoring will be able to determine whether the manzanitas recover successfully over time. In the vicinity of IW-07, 364 sqft of sandmat manzanita habitat were impacted by access routes. Wells IW-02 and MW-01 had to be reached through a narrow aisle of sandmat-dominated chaparral. Several sandmat manzanitas plants were flattened near the road entrance to the aisle, where matting was placed on the ground, comprising an estimated 74 sqft. Photograph 3-7 shows this area of sandmat manzanita that was impacted by vehicle access.
Black Legless Lizard - One Black Legless Lizard (BLL) was found on the site on June 19, 2007, near well location EW-12. It was found live, active and on the surface, apparently turned up in loose disturbed soil along an access route by a worker. It was active and presumed healthy, and was re-located by the Shaw worker to an adjacent sandy area outside of the access pathway, according to the BLL protocol.
Other Site Impacts - Brush cutting was necessary in the area of IW-01 and IW-07 to access wells that were set in the brush. IW-01 is located in a stand of coastal sage scrub, and shrubs were cut to a height of about 4 inches in an area approximately 24 foot by 42 foot (1,008 sqft). Shrubs cut were California sage brush (Artemesia californica), and black sage (Salvia mellifera), coffeeberry (Rhamnus californica), monkey flower (Mimulus aurantiacus) and poison oak (Toxicodendron diversilobum). None of these are HMP special-status species, no protection or mitigations are required for these species or for this vegetation type. Since all are known to successfully resprout from the root-crown, it is expected that the area will revegetate to baseline
2007 Annual Biological Monitoring Report Former Fort Ord, California
3-5
conditions within 1-2 years. Photograph 3-8 shows this coastal scrub area before and after cutting.
3.3.5 CTP Study – Mitigation Measures for Protection of the CTS, BLL, Sand Gilia and Monterey spineflower:
As the CTP study site is located within a habitat reserve area, mitigation measures were implemented to avoid and reduce impacts as much as possible during the work. The following measures were implemented to comply with the HMP and the 2005 Biological Opinion (as amended) that refers to the protection of CTS. The last item, referring to the use of matting was added by Shaw Environmental in response to the FONR concerns about seedbank disturbance and burial in sensitive areas containing Monterey spineflower and sand gilia and other native plants.
• Project was initiated in late June (beginning of the dry season) to minimize impacts to CTS and HMP annual plants as much as possible. Although the project is expected to extend into the spring of 2007, the well installation phase which had the most ground impacts were completed well before the start of the rainy season.
• Specific, delineated access routes, equipment staging areas, and vehicle turnaround areas were established to limit ground impacts by vehicle traffic as much as possible.
• Employee training was conducted for all workers, for recognition of CTS, BLL and other sensitive HMP plant species.
• Almost all piping for the pilot study is aboveground, so there is minimal digging of trenches or holes. Any incidental open holes or trenches deeper than 6 inches are equipped with a ramp or means of escape for CTS.
• A biologist was present on site on a regular basis to monitor site activities and following of the mitigation measures.
• Heavy-duty matting was placed on the ground on access routes into all wells in areas considered sensitive due to known presence of HMP annuals, or with a significant percentage of native plants and low cover of weedy annual grasses. Nine well locations were accessed with matting.
2007 Annual Biological Monitoring Report Former Fort Ord, California
4-1
4.0 MRS-16 First year follow-up monitoring
4.1 MRS-16 -- Introduction A vegetation monitoring survey was conducted on site MRS-16. This site was burned in November 2006 for removal of the maritime chaparral vegetation to facilitate remediation of munitions and explosives of concern. Photographs 4-1 and 4-2 show views of the site immediately after the burn, and in the spring during the 2007 survey season following the burn. Baseline surveys were conducted on MRS-16, and within the fuel break in 1996, 1998, and 2006 (Army, 2007b).
The 2007 vegetation monitoring consisted of a survey for two HMP annual species. These species were the Federally Endangered sand gilia (Gilia tenuiflora arenaria) and Federally Threatened Monterey spineflower (Chorizanthe pungens pungens). The California Endangered seaside bird’s beak (Cordylanthus rigidus littoralis) was not found to be present on the site. Because this survey was conducted just a few months after the burn, almost no shrub or perennial species had become re-established. Surveys for maritime chaparral shrub and perennial species will be conducted in future years when these species have become more established.
The vegetation survey also included mapping of invasive annual grass species on the site in order to document whether these species became established as a result of the burn or burn-related disturbance such as fuel break mowing or foam applications. Location of MRS-16 is shown in Figure 4-1.
4.2 MRS-16 -- Methods Sand gilia populations were surveyed during mid- April through mid-May to capture the peak bloom. Gilia patches were mapped using GPS, and absolute numbers of plants was recorded for each patch.
Monterey spineflower survey was conducted between mid-May and mid-June to capture peak densities. Monterey spineflower patches were mapped, and density of plants, recorded as an estimated percent cover class was recorded for each patch. Monterey spineflower density classes (as percent cover) were as follows:
Low = 0- 5 percent Medium = 6-25 percent High = 26-50 percent Very High = 51-75 percent
2007 Annual Biological Monitoring Report Former Fort Ord, California
4-2
Invasive annual grass areas were mapped by hand, and later digitized into a GIS. The following density cover classes were used for annual grasses. Since the cover of annual grass did not exceed 50 percent total ground cover in any area, even at the highest density, the “High” category was scaled down relatively low, starting at 26 percent cover. These are the same density classes used in the previous grasses survey of the site, the 2006 survey of the fuel break area.
Low = 0- 5 percent Medium = 6-25 percent High = >26 percent
4.3 MRS-16 -- Results and Discussion 4.3.1 Sand Gilia Survey - Results and Discussion The locations of sand gilia surveyed in spring 2007 are shown in Figure 4-2, along with the 2006 populations from the baseline survey for comparison. This map shows both location and area of gilia patches, and total number of plants per patch. The term “patch” refers to the location of a close grouping of plants. Numbers varied from one to approximately 600 plants.
Total area of sand gilia = 0.29 acres Total number of plants = 1,733
All the sand gilia was distributed along only the south side of the site. The total population extended 2,150 feet in length, and occurred within 250 feet of the south fence line. The three same patches of sand gilia that were mapped in 2006 during the MRS-16 Fuel Break Baseline Survey (Army, 2007b) were present in 2007. However, number of plants in 2007 was greater overall by over 1500 plants. In particular, the large western-most patch increased to 600 plants in 2007 from 60 plants in 2006. In addition, numerous, small patches of gilia were encountered in 2007, ranging from one to 75 plants. It is likely these patches may have present during the year of previous survey, but obscured by dense chaparral shrub cover, or dormant in the seedbank. No sand gilia were found during the 1998 baseline surveys of the site. Evidently, the combined beneficial conditions of the burn and the current year’s climate patterns produced a greater germination rate in 2007 than in 2006. This suggests there will be a healthy contribution to the seedbank for future generations of this population of sand gilia.
Future surveys will occur in 2009, 2011, and 2014 to assess sand gilia numbers, and to monitor for potential increase in annual invasive grass cover in these locations, which could threaten the population.
4.3.2 Monterey Spineflower Survey -- Results and Discussion The distribution of Monterey spineflower was also along the south side of the site near the fence line, and the total distribution is shown in Figure 4-3. Total spineflower cover was 6.85 acres,
2007 Annual Biological Monitoring Report Former Fort Ord, California
4-3
and the population extended along the entire length of the south boundary of the site within about 300 feet of the fence line.
More than 95 percent of the mapped spineflower area was in the Low (0-5 percent) density category. The other 5 percent of the area consisted of small patches of higher density, between 5 and 75 percent cover, as shown in Figure 4-4. Approximate acreage per density class is shown below.
Total area occupied by Monterey spineflower = 6.85 acres Area at Low (0-5 percent) Density = 6.50 acres Area at Medium (6-25 percent) Density = 0.07 acre Area at High (26-50 percent) Density = 0.20 acre Area at Very High (51-75 percent) Density = 0.04 acre
Baseline data for Monterey spineflower in MRS-16 were collected in a 1998 survey on the entire site, and in 2006 within the fuelbreak only. Comparison to the 1998 data shows that in both 2006 and 2007 there was a much greater coverage of Monterey spineflower on the site. Comparison with the 2006 baseline survey for Monterey spineflower along the fuel breaks (Army, 2007b) appears to indicate that the spineflower range smaller in 2007, suggesting a decline in the population. However, this is partly due to confusion of C. p. pungens with C. diffusa in 2006. In 2006 surveys, many Chorizanthe individuals were diminutive, and many plants were not flowering at the time of the survey, or flowers were so small that the field characters separating the two species were not apparent. In 2007, all plants were robust and flowering, and there was confusion of the identity of the two species.
The actual range of Monterey spineflower is likely to be close to what is observed in 2007, in the first spring following a burn and good growth conditions. Figure 4-4 shows locations of Monterey spineflower patches that were greater than 5 percent of ground cover within the range of the population. In 2006, very few high density patches were observed, since much of the ground was obscured by shrub cover, which inhibits annual plant growth. The 2007 survey mapped approximately 90 patches of spineflower at a density ranging from 6-75 percent. This is what would be expected in post-burn conditions, as the removal of shrub vegetation, and the improvement in soil conditions allows increased germination, and robust growth of the entire Monterey spineflower seedbank.
As for sand gilia, surveys will continue in accordance with the vegetation monitoring protocol to assess numbers, coverage, and to monitor for potential increase in annual invasive grass cover which could threaten the population.
2007 Annual Biological Monitoring Report Former Fort Ord, California
4-4
4.3.3 Annual Grasses Survey -- Results and Discussion Photographs 4-3, 4-4, and 4-5 show views of grassy areas at high, medium and low density respectively. More than 75 percent of the site had annual grass density at very low to low density, ranging from 0 to 5 percent. Since occurrence on the site of annual grasses at low density was so prevalent, these were not mapped as significant occurrences.
Areas containing medium to high density of annual grass are shown on map Figure 4-5. These medium to high density locations were areas of pre-existing grassland before the burn, or areas that were adjacent to pre-existing grassland. Besides pre-existing grasslands on the site, other grassy areas were located along roads, fence lines, and previously disturbed mounds existing on the north side of site.
The following numbers show the acreages of the site containing annual grasses at the 3 density classes:
Area at Zero to Low Density (0-5 percent) = 63 acres Area at Medium Density (6-25 percent) = 4 acres Area at High Density (>25 percent) = 3.5 acres
For comparison, this map also shows annual grasses mapped in 2006 within the 200-foot zone that was mechanically mowed for fuel breaks in preparation for the November 2006 burn.
Comparison to this 2006 baseline data within the fuel break shows an increase in areas of medium to high density grass areas within fuel breaks. The increase is approximately 2.5 acres. This increase is evident in the southeast corner of the site, where grass acreage has more than doubled, and on the north side of the site where grass patches have appeared where there had been none before.
The increase in grass occurrence in the fuel breaks is likely to be related to disturbance from brush cutting to establish the fuel break, as well as burning, both of which are disturbance types that tend to induce an increase in annual grasses wherever grasses are originally present.
The map also shows areas where foam was applied as a fire suppressant during the 2006 prescribed burn. Since foam application was very to very few spots, and applied in a patchy manner, it is difficult to assess whether there is any relation to grass occurrence and foam application. The disturbance from the burn itself, by removing all native shrub and vegetation cover is likely to have much more overall effect on annual grass invasion into the site, particularly in those areas where preexisting grasslands occurred.
The increase in annual grass range and density appears relatively small in proportion to the site size, and to the population of HMP annuals. Future surveys will continue to monitor for the
2007 Annual Biological Monitoring Report Former Fort Ord, California
4-5
spread or increase of annual grasses within the site, especially within the first five years, and in areas that support HMP annual species. Annual grasses tend to compete aggressively with native annual plants such as sand gilia and Monterey spineflower, and have the potential to reduce habitat quality for these protected species.
2007 Annual Biological Monitoring Report Former Fort Ord, California
5-1
5.0 2007 DRO Burn Area - Baseline Vegetation Survey of Fuel Breaks
5.1 2007 DRO Burn Area -- Introduction Vegetation monitoring transects were needed to complete the baseline survey for the fuel breaks surrounding the 2007 Burn Units. Previous transect vegetation data has been collected within the Burn Units by HLA, and reported in the 1997 Annual Monitoring Report (Army, 1997b). Annual plants surveys were not included as part of this survey but baseline data which was collected in 2000 are available for the majority of the area.
For this 2007 survey, an additional 12 transects were added in 2007 within the 200-foot wide temporary fuel breaks to characterize vegetation composition in these areas. Location of the 2007 Burn Units and transect locations within the fuel breaks are shown in Figure 5-1.
In addition, a survey for occurrence of non-native invasive annual grasses was completed along the fuel breaks to provide baseline data before the burn. These data will allow follow-up monitoring to determine whether burn-related impacts within the fuel breaks, such as vegetation cutting, mowing, application of foams, or other disturbances, significantly increase the density or area of invasive grasses in the following years.
5.2 2007 Burn Area -- Methods 5.2.1 Vegetation Shrub Sampling Methods Transects were placed along the 200-foot wide temporary fuel breaks designated to be mowed as part of the 2007 burn preparations. Transects were placed to represent a variety of different chaparral stand-ages, species diversity and disturbance levels. Photographs 5-1 through 5-4 show a sampling of transect locations at different seral stages.
The line-intercept vegetation sampling method used followed the Protocol for Conducting Vegetation Monitoring in Compliance with the Installation-wide Multispecies HMP at Former Fort Ord (Army, 1995). The methods are the same as those used in previous shrub surveys on former Fort Ord.
Line intercept sampling was conducted along twelve transects of approximately 50 meters in length. Cover for each shrub or perennial species, bare ground, or herbaceous cover was measured as the distance (in cm) covered by each species along the entire length of the transect. Distances smaller than 10 cm were not counted. Percent cover for each species was then estimated as the relative distance covered by each species along the transect.
2007 Annual Biological Monitoring Report Former Fort Ord, California
5-2
5.2.2 Invasive Annual Grass Survey Methods For the invasive grasses survey along fuel break areas, a vehicle was driven along the fuel break roads slowly, while lengths of fuel break were mapped with grass density, defined as percent cover classes. Classes were defined as follows:
Very Low = 0- 5 percent Low = 6-25 percent Medium = 26-50 percent High = >50 percent
In general, these three cover classes were assumed to be adequate to capture any significant changes in percent cover of grasses in the future, while allowing a reasonably rapid assessment over a large area. Future data collections compared against this baseline data will assist in determining the effectiveness of these cover classes.
5.3 2007 Burn area -- Results and Discussion The percent cover data for vegetation transects in the 2007 burn area are summarized in Table 5-1. The dominant species on average over all transects was shaggy-barked manzanita (Arctostaphylos t. tomentosa), ranging from 18 to 86 percent, and averaging 49 percent cover over all transects. The second most dominant species was chamise (Adenostoma fasciculatum), ranging from 3 to 21 percent cover and averaging 10 percent cover over all transects. Other chaparral species that most commonly occurred in the transects were sandmat manzanita, Arctostaphylos pumila (range = one to 50 percent; average = 10 percent), black sage (range = one to 24 percent; average = 8 percent); Monterey Ceanothus, Ceanothus cuneatus rigidus, (range = one to 37 percent; average = 6 percent); and dwarf Ceanothus, Ceanothus dentatus (range = 4 to 22 percent; average = 3 percent). Thirteen other chaparral species occurred with less frequency between transects, or with lower percent cover, averaging less than one percent cover over all transects. Included in the less common species was an HMP-listed rare shrub, Eastwood’s golden bush (Ericameria fasciculatum), which was found in only one transect (T12). This species was not seen in any of the other transect areas except for the T12 area, where it had a patchy, low density occurrence. Bare ground averaged about 14 percent over all transects. Percent cover of annual herbaceous species was very low, at less than one percent overall. Annual plants surveys were not included as part of this survey, but were conducted in 2000 and documented in the 2000 Annual Monitoring Report (Army 2000).
These baseline data should be used for comparison with future monitoring data after work completion, to determine whether plant diversity and cover naturally proceed toward these baseline conditions, as the vegetation grows back.
2007 Annual Biological Monitoring Report Former Fort Ord, California
5-3
Annual grasses survey results are shown in Figure 5-2. Annual grass survey was limited to Burn Units 2 and 3, the units planned for the 2007 burn year. These data should be used for comparison to future surveys in the fuel breaks to determine whether there are any significant increases in annual grass invasion as a result of burn-related disturbances. Fire retardant application in particular, combined with the mowing of vegetation, as has been performed along all of these fuel breaks, is known to increase annual grass invasion. This has been previously documented in the Ranges 43-48 site in 2005 (Parsons, 2004).
2007 Annual Biological Monitoring Report Former Fort Ord, California
6-1
6.0 MRS Ranges 43-48 - Annual Monitoring of Fuel breaks for Non-native Invasive Annual Grasses
6.1 Ranges 43-48 -- Introduction This site was burned in 2003, and a munitions removal was conducted from 2003 through 2005. Previous biological surveys, both baseline survey and follow-up, have been conducted for annual listed plant species, shrub re-growth and recovery, and annual grasses.
In 2007, only an annual grass survey was conducted. This was limited to the fuel breaks surrounding the site. The purpose is to determine whether past disturbances in the fuel break areas may have resulted in the recruitment of non-native invasive annual grass species. The disturbances are related to the fall 2003 prescribed burn that was conducted to prepare the site for munitions removal, and include the following: annual cutting of vegetation (chaparral or grasslands) to maintain the fuel breaks, and a one-time only application of fire retardant and fire foam in the fall of 2003 (when the site was burned by prescribed fire). The location of Ranges 43-48 and the fuel breaks is shown in Figure 6-1.
6.2 Ranges 43-48 -- Methods The annual grass locations and density along the fuel breaks were mapped by hand onto aerial maps, while slowing driving along the site perimeters. Grass density was visually estimated and sections, consisting of road lengths, were mapped and assigned to one of several density classes. Lengths of fuel break less than 50-feet were not mapped separately.
Density classes were as follows:
Low = 0- 5 percent Medium = 6-25 percent High = 26-50 percent Very High = >50 percent
6.3 Ranges 43-48 -- Results and Discussion The annual grass survey results are shown in Figure 6-2. Fuel break areas with the highest density of grasses were found to be located within, and adjacent to, large existing grasslands on the southeast, and northwest sides of the site. This is what would be expected. The lowest densities of grass in the fuel breaks were found in areas which originally were covered with maritime chaparral shrubland, before being mowed as fuel breaks.
2007 Annual Biological Monitoring Report Former Fort Ord, California
6-2
The most significant comparison with previous data was the reduction in grass density on the south fuel break. A survey in the year following the burn (2005), showed a very high density of annual grass along most of the south boundary fuel break on the site. This was presumed to be related to the combined disturbance of mowing and fire retardant application (Parsons, 2005). The survey this year (2007), two years after the initial survey, showed a significant decline to mostly low density of annual grass in these same areas. Note, that grass density is a measure of grass biomass, rather than number of grass individuals. In the year following the burn it was noted that individual grass plants were extremely robust, with single plants containing the same biomass as perhaps 100 individual plants in a sparse year. It is likely that there are large numbers of germinating grass seeds each year, but the competition from native shrubs, perennials and annuals, as well as other non-native plants, is enough to greatly reduce the annual grass biomass as the time since a burn increases.
This observation suggests that with time since a burn event, annual grass invasion declines as native plant competition increases, as long as disturbance remains minimal. In the case of these fuel breaks, the areas are re-mowed periodically. Shrub height is reduced by mowing, but plants are growing all year, competing with the grasses. This also suggests that the first one to two years following a burn may be the optimal time to use grass-specific herbicide to reduce annual grasses. This is the window when HMP annuals such as sand gilia, Monterey spineflower and Seaside bird’s beak grow at peak density and abundance, and it is a biologically important period when the seedbank is replenished. It would be most beneficial to reduce grass competition as much as possible during these years.
2007 Annual Biological Monitoring Report Former Fort Ord, California
7-1
7.0 Annual Monitoring of Fusilade Treatment Sites
7.1 Fusilade-treated plots -- Introduction Since 2005, a number of test plots have been established to evaluate the effectiveness of Fusilade treatment in the reduction or elimination of invasive annual grasses in areas that have been previously disturbed by work-related activity. Fusilade is a monocot-specific herbicide useful for treatment of areas where grasses are the target weed species.
Eight test plots have been previously established and treated with Fusilade in the spring, for two years (2005 and 2007). In 2007, these plots were visited and a visual determination of the Fusilade treatment effectiveness was made by comparing density of annual grass within the treated plots to adjacent control plots. Five of the plots are located along the mowed fuel breaks on the perimeter of the Ranges 43-48 site, and the other three are located within the University of California’s FONR.
7.2 Fusilade-treated plots -- Results and Discussion 7.2.1 Ranges 43-48 Site- Results and Discussion Five Fusilade-treated plots in the Ranges 43-48 site were visited for monitoring in March, 2007. The plots are located on fuel breaks around the perimeter of the Ranges 43-48 site. Four of the plots are located along the fuel break of the East boundary of the site, and one is located along the Broadway fuel break, just east of the southeast corner of the site.
Of the Range 43-48 plots, the four located on the East boundary showed little or no visually significant reduction of annual grass density compared to the control plots adjacent and outside of the treatment areas. Annual grass density in these areas was in the medium range, averaging between 5 and 25 percent cover, with a relatively low percent cover of native annual forbs, and a relatively high percentage of bare ground and of the common non-native forbs such as Erodium sp and Hypochaeris sp. Annual grass species consisted predominantly of Bromus myuros and Bromus diandrus.
By comparison, the Fusilade-treated plot on the Broadway fuel break did show a visually significant reduction of annual grasses compared to the adjacent untreated plot. Photograph 7-1 is a view of the treated plot, with almost no annual grass visible. Photograph 7-2 shows the difference in the treated and untreated plots side by side, where a clear demarcation of the annual grass boundary can be seen. No quantitative data was collected, but a visual estimate of percent cover of grasses was made. The treated plot had an estimated less than one percent cover of grasses, and a high cover of native forb cover. Both sand gilia and Monterey spineflower were
2007 Annual Biological Monitoring Report Former Fort Ord, California
7-2
present in the forb mix. In contrast, the control plots (on either side of the treated plot) had an estimated medium density of grasses, varying between 4 percent and 25 percent cover.
The Broadway fuel break is the only one out of four plots which showed a clear significant difference in grass reduction. The main difference in this plot is that this area is high quality habitat with a very high percentage of native annual and perennial forbs and shrubs. This was the one plot selected that had a low density of annual grass at the start of the study. It is an area which, in the year before it began to be was annually mowed as a fuel break, had virtually no annual grass presence. It is likely there is an abundant healthy native seed bank, and the germinating annuals are able to out-compete the annual grasses, when the grasses are reduced with Fusilade.
In comparison, there was no visual difference in annual grass abundance or cover in any of the other four Range 43-48 plots. These plots ranged from medium to high density to begin with. observed in all other plots.
The reason for the lack of observable reduction in grass density could be any of the following:
• Inadequate coverage of the Fusilade application
• Fusilade ineffective by being applied too late in the season, when many grasses had already set seed
• Re-introduction of grass seed from surrounding areas, during annual mowing operations, or other sources
7.2.2 FONR plots-- Results and Discussion Three plots have had Fusilade applied for two years (2005 and 2007) preceding this monitoring.
Photographs 7-3 and 7-4 show Plot 1, treated and untreated. The red color is this year’s Fusilade application in the treated plot. There is no apparent reduction in grass density as a result of the application.
Photograph 7-5 shows Plot 2, with a view of treated and untreated plots side by side. Again, there is no visually significant difference in grass density as a result of the application.
Lastly, Photographs 7-6 and 7-7 show Plot 3, with a view of treated plot and untreated plot. Again, there is no visually significant difference in grass density after the applications.
2007 Annual Biological Monitoring Report Former Fort Ord, California
7-3
7.2.3 Fusilade Plots - Conclusion and implications • Fusilade appears to be effective in some conditions, notably in areas with low density
grass cover, and/or with a high proportion of native plant cover.
• More study is necessary to determine the effectiveness of Fusilade. In particular, studying the effect of Fusilade at different grass densities, and in the presence versus absence of native plants may be useful.
• Fusilade may require an earlier application to be fully effective.
2007 Annual Biological Monitoring Report Former Fort Ord, California
8-1
8.0 Other Biological Support Activities in 2007
8.1 HMP Species Reports 8.1.1 California Tiger Salamander encounters In 2007, Shaw encountered two CTSs. Both were active and unharmed. The first CTS was discovered by a trained SHAW employee. The adult salamander was found in December 2006 actively crawling inside building within the Shaw office compound on the morning after a rain event. This CTS specimen was recovered by the Army Biologist, William Collins, who re-located the animal to the nearest suitable wetland (Henneken’s Pond).
The second CTS was a juvenile found on MRS-16 on January 9, 2007, under an oak log while logs were being removed from the site in preparation for Munitions and Explosives of Concern removal (Photograph 8-1). The CTS was relocated by the Shaw Biologist into a ground squirrel burrow in the wetland adjacent to the BLM office (Pond 10, Photograph 8-2).
8.1.2 Black Legless Lizard encounters In 2007, two BLLs were encountered during Army clean-up activities. One was found on MRS-16 on January 19, 2007, while hand-digging for munitions. The second was found on the University of California’s FONR on June 19, 2007, during the groundwater remediation pilot study, in the disturbed soil along an access route. Both BLL’s were found alive and presumed healthy, and were re-located by the Shaw Biologist outside the work areas within 50 feet of the original sites.
8.2 Employee Education Twenty Shaw employees and sub-contracting workers received biological training prior to starting work. Training consisted of:
• Recognition of sensitive HMP species, including CTS, BLL, sand gilia, Monterey spineflower, sandmat manzanita and Monterey Ceanothus among other species
• Specific guidance for CTS protection, such as covering holes where possible, placing escape ramps in trenches where needed, and instructions for reporting HMP animal species encountered
• Instructions to minimize all work impacts and work footprints, avoid areas flagged for sensitive species wherever possible
• Instructions to restrict vehicle movement and parking to roads, staging areas, and other designated work areas where at all possible
2007 Annual Biological Monitoring Report Former Fort Ord, California
8-2
• Reduce soil disturbances in sensitive habitat particularly areas containing seedbank or live individuals of HMP-listed plant species
2007 Annual Biological Monitoring Report Former Fort Ord, California
9-1
9.0 References
U.S. Department of the Army (Army), 1995. Protocol for Conducting Vegetation Monitoring in Compliance with the Installation-wide Multispecies HMP at Former Fort Ord.
Army, 1996. Annual Monitoring Report. Biological Baseline Studies and Follow-up Monitoring. Former Fort Ord, Monterey County, California.
Army, 1997a. Installation-Wide Multispecies HMP for Former Fort Ord
Army, 1997b. Annual Habitat Monitoring Report, Former Fort Ord, Monterey, CA.
Army, 1998. Annual Monitoring Report. Biological Baseline Studies and Follow-up Monitoring. Former Fort Ord, Monterey County, California.
Army, 2000. Annual Monitoring Report. Biological Baseline Studies and Follow-up Monitoring. Former Fort Ord, Monterey County, California.
Army, 2006. Wetland Monitoring and Restoration Plan for Munitions and Contaminated Soil Remedial Activities at Former Fort Ord
Army, 2007a. Draft 2006 FONR Impact Assessment and Habitat and Rare Plant Species Survey Results, Fritzsche Army Airfield Fire Drill Area, Former Fort Ord, California
Army, 2007b. 2006 Baseline Biological Monitoring Report: MRS-16 Fuel break, Former Fort Ord, CA.
Parsons Infrastructure and Technology (Parsons), 2004. Observed Effects of Fire Retardant and Fire Foam on Maritime Chaparral in Ranges 43-48. (White Paper written for the Army)
Parsons, 2005. Final 2005 Annual Biological Monitoring Report, Ranges 43-48, Former Fort Ord, Monterey County, California.
United States Fish and Wildlife Service (USFWS), 1999. Biological Opinion on the Closure and Reuse of Fort Ord, Monterey County, California.
USFWS, 2002. Biological Opinion on the Closure and Reuse of Fort Ord, as it affects Monterey Critical Habitat.
USFWS, 2005. Biological Opinion on the Closure and Reuse of Fort Ord, as it affects CTS and Critical Habitat for Contra Costa Goldfields. And Amendment (dated June 1, 2007)