57
CORPORATE GOVERNANCE AND COMPLIANCE HOTLINE BENCHMARKING REPORT

CORPORATE GOVERNANCE AND COMPLIANCE HOTLINE BENCHMARKING REPORT
.
2007 CORPORATE GOVERNANCE AND COMPLIANCE HOTLINE BENCHMARKING REPORT 2.
2007 CORPORATE GOVERNANCE AND COMPLIANCE HOTLINE BENCHMARKING REPORT Welcome to year two of the journey to develop a corporate metrics database for analyzing and responding to initial reports of misconduct in the workplace. The need to compare, plan and execute corporate strategy to effectively impact inappropriate behavior has been apparent since hotlines first appeared in government contracts in the 60s and 70s. With the publication of last year’s groundbreaking initial report it became a reality. The 2006 report was downloaded from around the world by the leading corporations, agencies, consulting firms and government representatives. The demand for this long awaited data has been building for years. The members of the Security Executive Council and others have provided excellent feedback on its value to management, as well as its impact. The 2007 report advances last year’s report in many significant ways. Another 90,000 calls were added; more than 650 companies are now represented in the data set. The incidents and analyses are now broken down to examine trends over time to report on and allow you to plan for the changes in patterns and behaviors. This year’s report also looks at annual rate data (rate of incidences per 1000 employees) to make gradual changes more obvious. Finally, the sector analysis will allow you to scrutinize the different elements of your company with like industry sectors as well as the company as a whole. For example, you might be a retail corporation but have a large construction division that builds your stores. You can now compare the business segment to the industry segment for similarities or differences. The Security Executive Council and its strategic alliance partner, The Network, Inc., are excited about the new elements and format of this report. Many of the changes and extensions to previous analyses are a direct result of feedback from readers like you. We are committed to finding and providing the best data available in order for you to more effectively guide your organization. We have created a direct feedback mechanism for all nonmember companies and agencies. Please send your ideas and input to [email protected] or submit your comments to www.securityexecutivecouncil.com/surveys/hotline08/
Bob Hayes Managing Director Security Executive Council

.
2007 CORPORATE GOVERNANCE AND COMPLIANCE HOTLINE BENCHMARKING REPORT 3.
CALCULATION METHODOLOGY........................................................................................................4
2007 EXECUTIVE SUMMARY/KEY FINDINGS ...................................................................................5
WHAT THIS REPORT MEANS FOR YOUR COMPLIANCE PROGRAM.............................................6
ANALYSES ...........................................................................................................................................8
EMPLOYEE & COMPANY DATA ....................................................................................................9
RATE DATA ANALYSES OVERVIEW...........................................................................................11
DATA ANALYSES BY INDUSTRY ................................................................................................12
CONSTRUCTION.....................................................................................................13
FINANCE, INSURANCE & REAL ESTATE..............................................................17
MANUFACTURING..................................................................................................21
MINING ....................................................................................................................25
PUBLIC ADMINISTRATION.....................................................................................29
RETAIL TRADE........................................................................................................33
SERVICE INDUSTRIES...........................................................................................37
TRANSPORTATION, COMMUNICATIONS & UTILITIES........................................41
WHOLESALE TRADE..............................................................................................45
APPENDICES .....................................................................................................................................49
(I) 2006 CORPORATE GOVERNANCE AND COMPLIANCE BENCHMARKING REPORT:
EXECUTIVE SUMMARY/KEY FINDINGS ............................................................................50
(II) SAMPLE SLIDES FOR PRESENTATIONS TO MANAGEMENT...........................................51
(III) METHODOLOGY ...................................................................................................................54
(IV) CATEGORIES & TERMINOLOGY.........................................................................................55
ABOUT THE SECURITY EXECUTIVE COUNCIL ..............................................................................56
TABLE OF CONTENTS

.
2007 CORPORATE GOVERNANCE AND COMPLIANCE HOTLINE BENCHMARKING REPORT 4.
CALCULATION METHODOLOGY FOR THE 2007 REPORT For last year’s Corporate Governance and Compliance Benchmarking Report we looked at data across all the years provided in the data set. This provided an overall view to hotline incident calls – the industry benchmark. When companies wanted to compare themselves by year, they divided the results by four to get an average. For example, the overall rate of incidents per 1000 employees across all industries and across all four years’ worth of data was 14.9, resulting in an average per year of 3.7. The current executive summary does include some analyses across the now 5 years of data, but the real value is to see what is happening from year-to-year. Therefore, the 2007 report, to provide a more useful report for corporate comparison, has analyses by year and additional rate per 1000 employee analyses. The latter provides control for issues related to a nonrandom sample; for example, number of companies per industry represented. (Note that 2002 data was not included in rate analyses due to low volume of data.) Now companies in individual industries can get a better picture of how they compare and can trend over time. From this report on, new yearly data will be analyzed and added to the existing trend data. This year we also show percentages for “information not available” in case outcome and case disposition analyses. While this data could have been removed and the rest of the data recalculated, we felt it was of interest to publish this detail. There are many possibilities why this occurs, for example, culture of the business or longtime lags from call inception to resolution. (See Appendix III for additional information.) We hope in future research to look into why this occurs and why more for some industries and less for others.

.
2007 CORPORATE GOVERNANCE AND COMPLIANCE HOTLINE BENCHMARKING REPORT 5.
2007 EXECUTIVE SUMMARY/KEY FINDINGS This is the second Corporate Governance and Compliance Hotline Benchmarking Report. It is based on an analysis of more than 277,000 hotline incident reports from more than 650 organizations across all major industries over a five-year period. Rate data analyses across years are based on a four-year period from 2003-2006, as data volume for 2002 was too low for this type of analysis. Participants - or those who made reports - may be employees, former employees, vendors and the public. The data was masked to protect confidentiality. Aggregated Frequencies Across All Reports Over Five Years:
For those reports where case outcome was provided, most reports (65%) were serious enough to warrant an investigation and 45% resulted in corrective action taken.
71% of participants did not notify management of an issue before making a report.
One of the most surprising findings was that
participants reporting corruption and fraud incidents were less likely to remain anonymous than any other incident category. They remained anonymous only 34% of the time.
The research showed that half of the reports
received concerned personnel management incidents. Beyond the personnel management category, company/professional code violations (16%), employment law violations (11%) and corruption and fraud (10%) were the most commonly reported incidents regardless of industry.
53% of reports were made anonymously.
The largest percentage of participants (34%)
acknowledged awareness of a hotline through a poster.
Aggregated Rate Data (2006 Only)*: For the year 2006, a rate of 8.3 incidents was
reported per 1,000 employees overall (regardless of incident type).
Smaller organizations showed a general decrease of
incidents reported over time. Mid-sized and larger companies showed a general increase of reported incidents over time.
*See Industry Section for incident rate data by particular industries
Incidents Reported by Industry Per 1000 Employees in 2006
1.6
6 5.43
4.8
18.3
3.4
9.47.2
8.3
0
5
10
15
20
ConstructionFinance, Insurance & Real EstateManufacturingMiningPublic AdministrationRetail TradeService IndustriesTransportation, Communication & UtilitiesWholesale TradeOverall
The Agriculture, Forestry & Fishing industries were not included in this chart as there were not enough data to provide proper analysis. For more analysis see Data Analysis by Industry section.

.
2007 CORPORATE GOVERNANCE AND COMPLIANCE HOTLINE BENCHMARKING REPORT 6.
WHAT THIS REPORT MEANS FOR YOUR COMPLIANCE PROGRAM Hotlines for reporting misconduct have become valuable compliance and monitoring tools for corporations in the United States and abroad. The U.S. Federal Sentencing Guidelines and the Sarbanes-Oxley Act (SOX) require corporations and publicly traded companies to maintain reporting mechanisms, such as hotlines, and to regularly assess their effectiveness. Other countries such as Canada, the United Kingdom and Japan have begun implementing similar legislation. Historically, however, corporations have struggled to accurately assess hotline performance because they had nothing to compare it to. They could collect data on their own hotlines to see how many reports had been received and what action had been taken based on those reports. But with no way of knowing how those numbers stacked up against those of comparable organizations, they couldn’t draw any reliable conclusions about the quality of their hotlines and reporting programs. Even if they benchmarked against willing peers, their overall sample was often too small to yield reliable results. Then last year, the Security Executive Council (formerly the CSO Executive Council), The Network and the Association of Certified Fraud Examiners released the 2006 Corporate Governance and Compliance Hotline Benchmarking Report, the first report to compile hotline data from corporations of various types and sizes to provide statistics on the nature and number of hotline reports, anonymity, awareness and follow-up. (The Executive Summary/Key Findings of the 2006 report can be found on P. 57 in Appendix I.) This year, the Security Executive Council again joined forces with The Network to create the 2007 Corporate Governance and Compliance Hotline Benchmarking Report, which provides more extensive hotline benchmarking data. The 2007 report breaks out the data by industry and by year, and it presents several data points in the form of rates instead of percentages, which controls for data variations between industries and business sizes. The report also notes some analyses where data are not available, which can sometimes be as telling as the data provided by respondents. But even with all these improvements, like any other report, the value of this study lies not just in the data, but in what can be done with that data. How to Use This Report First, comparing the numbers alone won’t provide you with a complete picture of your hotline’s performance. Yes, a simple comparison of the data in this report with data collected from your own hotline will show you how your reporting performance measures up to those of other organizations. However, unless you look beyond the numbers to consider all the potential explanations of why your program varies from the average, you’ll still be missing critical insights that could change the whole direction of your program assessment. For example: After reading the report’s assessment of reporting rates, you determine that your organization,
given its size, should be receiving eight to nine calls per 1,000 employees. You are only receiving three per every 1,000. This result may be an indication that your organization has far fewer compliance issues than its peers and competitors. While that may be so, it is not the only possible explanation. You’d likely receive fewer calls than average if company employees were being intimidated by their managers into keeping mum about misconduct concerns. Or, perhaps your awareness program isn’t what it should be.

.
2007 CORPORATE GOVERNANCE AND COMPLIANCE HOTLINE BENCHMARKING REPORT 7.
You find the percentage of employees who have notified management of concerns before making a hotline report is lower in your organization than the average. This may mean that employees fear retaliation if they report problems directly to management, or it may mean the company’s desired reporting structure has not been made clear.
The numbers this report provides should serve as potential indicators of problems or successes, but without deeper investigation, the numbers alone can not provide a reliable evaluation of your hotline program. Communicating the Results Once you have studied the benchmark data presented here and considered why your numbers are higher or lower in various categories, share what you have found with your partners in other business units. Internal Audit is no longer the only player in compliance and misconduct. Many of the issues examined in this study will impact several corporate departments. Human Resources, Legal, IT, and Corporate Security and Safety, among others, may have an operational stake in your findings. Look at this study through the lens of Unified Risk Oversight™. Organize a team with representatives from every affected business unit to discuss what this report means to your company. With the help of these partners, you will more easily pinpoint the problems or accomplishments behind the numbers and determine how to correct any shortfalls you may discover. After you’ve discussed the report with your Unified Risk Oversight™ team and determined what actions should be taken, present your findings to management and explain how you intend to use the report to help better calibrate your hotline program. (See Appendix II on P. 58 of this report for an example of how to present report findings to senior management.) Remind them the corporation as a whole will suffer risk if the concerns exposed by this report are not understood or acted on. Show management that you’ve organized a collaborative effort to improve performance and tell them what you are doing with the information you have acquired. We strive to make this report of value to you and your organization. Please send your suggestions for analyses or issue coverage for the 2008 version of this report. Submit your comments to: www.securityexecutivecouncil.com/surveys/hotline08/

.
2007 CORPORATE GOVERNANCE AND COMPLIANCE HOTLINE BENCHMARKING REPORT 8.
ANALYSES The 2006 Corporate Governance and Compliance Hotline Benchmarking Report provided an overall industry analysis. It looked at means of caller awareness, prior management notification, areas of notification, anonymity of reporting, case outcome, and case disposition. The benchmarking report also looked at organization size (measured by number of employees). While providing valuable overall information, the report did not provide industry-specific information. The 2007 report extends analyses by looking across each of the participating industries. Notes: Case outcome and disposition analyses show percentages for “information not available.” While this data could have been removed and the rest of the data recalculated, we felt it was of interest to publish this detail. There are many possibilities why this occurs; for example, culture of the business or long time lags from call inception to resolution. (See Appendix III for additional information.) Also, 2002 data was not included in rate analyses due to low volume of data.

.
2007 CORPORATE GOVERNANCE AND COMPLIANCE HOTLINE BENCHMARKING REPORT 9.
Employee and Company Data As this study is based on reports to a hotline service, the number and types of companies represented are uncontrolled for. However, this may mirror the population at large since different industries likely view hotlines differently. For instance, some may have more formal programs than others and some cultures may embrace hotlines while others do not. The current report adds more than 150 companies to the analyses presented in the 2006 report. The table below provides a count of companies by industry. Number of Unique Companies by Industry: 2003 - 2006 Industry 2003 2004 2005 2006 Agriculture, Forestry & Fishing 1 2 3 3
Construction
5 13 17 23
Finance, Insurance & Real Estate
25 49 71 91
Manufacturing
57 96 133 156
Mining
5 6 10 15
Public Administration
0 0 8 13
Retail Trade
30 59 92 126
Service Industries
35 52 80 125
Transportation, Communications & Utilities
11 34 48 57
Wholesale Trade
7 20 29 44
Overall 176 331 491 653

.
10.2007 CORPORATE GOVERNANCE AND COMPLIANCE HOTLINE BENCHMARKING REPORT . ©2007 Security Executive Council. All Rights Reserved.
The 2007 study also saw an increase in the number of overall employees providing data to the hotline. The table below provides a breakdown of employee pool by industry by year: Total Employee Count by Industry: 2003 - 2006
* Drop from 2005 to 2006 for Retail industry because of an outlier removal Note: The Agriculture, Forestry & Fishing industries were not included in further analyses because of the low volume of companies represented.
Industry 2003 2004 2005 2006 Agriculture, Forestry & Fishing
1,500 16,500 21,400 17,500
Construction
146,408 358,786 399,362 575,185
Finance, Insurance & Real Estate
498,269 1,317,035 1,196,126 1,247,406
Manufacturing
1,442,340 2,608,375 3,499,450 3,844,894
Mining
26,100 132,000 156,204 152,199
Public Administration
N/A N/A 34,206 103,060
Retail Trade
1,025,834 3,314,215 3,572,328 2,329,557*
Service Industries
599,641 810,242 1,056,926 1,319,072
Transportation, Communications & Utilities
390,025 843,154 991,719 999,116
Wholesale Trade 63,950 306,016 383,335 829,742
Overall 4,194,067 9,706,323 11,311,056 11,417,731

.
11.2007 CORPORATE GOVERNANCE AND COMPLIANCE HOTLINE BENCHMARKING REPORT . ©2007 Security Executive Council. All Rights Reserved.
Rate Data Analyses Overview By using rate data we are controlling for the variations of companies and employees represented in the database. Incident reporting rates (per 1,000 employees) were calculated for different organizational sizes as identified by number of employees. The number of reported incidents was divided by the number of employees and multiplied by 1,000. The tables below provide the number of employees, the number of reported incidents and the reporting rates for the years 2003-2006. Report Frequency Rate per 1,000 Employees by Organization Size: 2003 – 2006 Smaller organizations showed a general decrease of incidents reported over time. Mid-sized and larger companies showed a general increase of reported incidents over time. The following table looks at incident reporting rates by industry. Report Rates per 1,000 Employees by Industry: 2003 – 2006
Industry 2003 Rate 2004 Rate 2005 Rate 2006 Rate Construction 1.99 1.63 1.96 1.63
Finance, Insurance & Real Estate
1.22 3.16 5.29 6.02
Manufacturing
4.54 6.90 6.02 5.42
Mining
1.99 3.92 2.60 3.04
Public Administration
N/A N/A 4.68 4.76
Retail Trade
5.46 10.21 10.45 18.39
Service Industries
5.04 5.47 4.00 3.36
Transportation, Communications & Utilities
11.18 7.98 7.94 9.42
Wholesale Trade
2.41 7.97 9.81 7.26
Overall 4.92 7.29 7.26 8.27 Looking at 2006 specifically, the Retail Trade industry had the highest incident reporting rate, followed by Transportation, Communication & Utilities. These industries were followed by the industries of Wholesale Trade and Finance, Insurance & Real Estate. The fewest reported incidents were found in Construction, Mining and Service Industries.
Employee Range 2003 Rate 2004 Rate 2005 Rate 2006 Rate 0-5000
13.7 10.41 9.83 8.84
5001-10000
9.94 9.11 6.50 5.72
10001-20000
4.88 8.83 7.17 9.14
20001-50000
5.06 7.54 7.05 7.88
50000+
4.02 7.11 7.39 8.48
Overall 4.93 7.47 7.35 8.27

.
12.2007 CORPORATE GOVERNANCE AND COMPLIANCE HOTLINE BENCHMARKING REPORT . ©2007 Security Executive Council. All Rights Reserved.
Data Analyses By Industry
The following industries are presented*:
Construction
Finance, Insurance & Real Estate
Manufacturing
Mining
Public Administration
Retail Trade
Service Industries
Transportation, Communication & Utilities
Wholesale Trade
* The Agriculture, Forestry & Fishing industries were not included
in this section as there were not enough data to provide proper analysis.

.
13.2007 CORPORATE GOVERNANCE AND COMPLIANCE HOTLINE BENCHMARKING REPORT . ©2007 Security Executive Council. All Rights Reserved.
CONSTRUCTION Overall Incident Report Rates per 1,000 Employees
Report Rates by Type per 1,000 Employees
Means of Caller Awareness
Finding out how participants learned about reporting mechanisms allows organizations to determine which communication methods are working. When means of awareness were provided by Construction participants, findings showed that in 2006 the largest percentage of participants became aware of the reporting mechanism from a poster. The next most often cited methods were the Intranet, another employee, and other means. This pattern remained stable over the four-year period of the study. However, as for all industries, distributing percentages
Rate per 1000
Incident 2003 2004 2005 2006
Company/Professional Code Violation 0.32 0.26 0.26 0.22
Corruption & Fraud 0.25 0.16 0.23 0.21
Customer/Competitor Interaction 0.02 0.03 0.06 0.02
Employment Law Violation 0.27 0.19 0.23 0.25
Environment, Health & Safety 0.13 0.08 0.12 0.10
Misuse of Assets/Information 0.01 0.00 0.01 0.01
Other, 0.00 0.00 0.00 0.00
Personnel Management, 1.00 0.90 1.05 0.82
1.99
1.63
1.96
1.63
0 0.5 1 1.5 2
2003 Rate
2004 Rate
2005 Rate
2006 Rate

.
14.2007 CORPORATE GOVERNANCE AND COMPLIANCE HOTLINE BENCHMARKING REPORT . ©2007 Security Executive Council. All Rights Reserved.
across all categories clearly shows the importance of communicating reporting mechanisms through multiple channels.
Prior Management Notification
In 2006, only about a third of participants in the Construction industry notified management of their concerns before making a hotline report. This result could indicate a preference among Construction employees for using a reporting mechanism other than a face-to-face conversation with management.
Means of Caller Awareness
2003 2004 2005 2006
Brochure 11% 4% 5% 5%
Employee 13% 12% 14% 14%
Handbook 3% 10% 10% 8%
HR 9% 6% 7% 8%
Intranet 11% 12% 16% 14%
Manager 3% 4% 5% 5%
Other 13% 12% 15% 16%
Poster 32% 37% 20% 27%
Sign 1% 1% 1% 1%
Unknown 0% 0% 1% 0%
Video 0% 0% 0% 0%
Wallet Card 3% 2% 5% 3%
2003 2004 2005 2006
70% 74%67% 66%
31%26% 33% 34%
0%
10%
20%
30%
40%
50%
60%
70%
80%
YESNO

.
15.2007 CORPORATE GOVERNANCE AND COMPLIANCE HOTLINE BENCHMARKING REPORT . ©2007 Security Executive Council. All Rights Reserved.
Prior Management Notification by Incident Category In 2006, participants in the Construction industry were most likely to notify management before making hotline reports for personnel management concerns, followed by employment law violations, company/professional code violations and corruption and fraud issues. Participants were least likely to have previously told management about misuse of assets/information and of customer/competitor interactions.
Anonymity In 2006, 52% of participants from the Construction industry chose not to provide their names when making a report.
Case Outcomes Case Disposition There were not enough data available to run analyses of case outcome and case disposition for the Construction industry.
Incident Category 2003 2004 2005 2006 Company/Professional Code Violation 16% 16% 13% 13% Corruption & Fraud 12% 10% 12% 13% Customer/Competitor Interaction 1% 2% 3% 2% Employment Law Violation 13% 12% 12% 15% Environment, Health & Safety 7% 5% 6% 6% Misuse of Assets/Information 1% 0% 0% 0% Other 0% 0% 0% 0% Personnel Management 50% 55% 54% 51%
49%
51%
47%
53%
52%48%
52%
48%
44 46 48 50 52 54
2003
2004
2005
2006
Did not remainanonymousRemainedanonymous

.
16.2007 CORPORATE GOVERNANCE AND COMPLIANCE HOTLINE BENCHMARKING REPORT . ©2007 Security Executive Council. All Rights Reserved.
Construction by Organization Size Most of the reporting employees in the Construction industry (64%) in 2006 were nested in group 5 organizations (50,000+ employees) followed by group 3 (10,001-20,000) with 24% and group 1 (0 - 5000) with 11%. No employees were reported from organizations of group 2 size, and only about 1% from group 4. This pattern is stable over the four-year period.
Employee Group Size 2003 2004 2005 2006
1: 0 – 5000
13% 12% 11% 11%
2: 5001 – 10000
0% 0% 0% 0 %
3: 10001 – 20000
18% 20% 24% 24%
4: 20001 – 50000
2% 2% 1% 1%
5: 50000 +
68% 67% 64% 64%

.
17.2007 CORPORATE GOVERNANCE AND COMPLIANCE HOTLINE BENCHMARKING REPORT . ©2007 Security Executive Council. All Rights Reserved.
FINANCE, INSURANCE & REAL ESTATE Overall Incident Report Rates per 1,000 Employees Report Rates by Type per 1,000 Employees
Means of Caller Awareness Finding out how participants learned about reporting mechanisms allows organizations to determine which communication methods are working. When means of awareness were provided by participants in the Finance, Insurance & Real Estate industry in 2006, findings showed the largest percentage of participants became aware of the reporting mechanism from a poster. The next most often cited methods were another employee, other means, and the company handbook. This pattern
Rate per 1000
Incident 2003 2004 2005 2006
Company/Professional Code Violation 0.24 0.61 0.78 0.88
Corruption & Fraud 0.22 0.62 1.34 1.28
Customer/Competitor Interaction 0.03 0.09 0.18 0.20
Employment Law Violation 0.18 0.31 0.34 0.43
Environment, Health & Safety 0.02 0.08 0.09 0.14
Misuse of Assets/Information 0.03 0.03 0.03 0.06
Other, 0.11 0.07 0.08 0.00
Personnel Management, 0.38 1.20 1.33 2.17
1.22
3.16
5.29
6.02
0 2 4 6 8
2003 Rate
2004 Rate
2005 Rate
2006 Rate

.
18.2007 CORPORATE GOVERNANCE AND COMPLIANCE HOTLINE BENCHMARKING REPORT . ©2007 Security Executive Council. All Rights Reserved.
remained stable over the four-year period of the study. However, as for all industries, the distribution of percentages across all categories clearly shows the importance of communicating reporting mechanisms through multiple channels.
Prior Management Notification Nearly a third of participants in the Finance, Insurance & Real Estate industry in 2006 told management of their concerns before making their hotline report. This result remained stable over the four-year period; it could indicate a preference among Finance, Insurance & Real Estate employees for using a reporting mechanism other than a face-to-face conversation with management.
Means of Caller Awareness
2003 2004 2005 2006
Brochure
5% 4% 3% 3%
Employee
13% 13% 13% 13%
Handbook
10% 8% 8% 9%
HR
4% 3% 3% 3%
Intranet
5% 3% 4% 5%
Manager
6% 5% 5% 5%
Other
12% 12% 11% 11%
Poster
28% 36% 33% 33%
Sign
1% 1% 1% 2%
Unknown
0% 1% 1% 1%
Video 0% 0% 0% 0%
Wallet Card 7% 6% 5% 4%
20032004
20052006
72% 73% 69% 71%
28% 27% 31%29%
0%
10%
20%
30%
40%
50%
60%
70%
80%
YESNO

.
19.2007 CORPORATE GOVERNANCE AND COMPLIANCE HOTLINE BENCHMARKING REPORT . ©2007 Security Executive Council. All Rights Reserved.
Prior Management Notification by Incident Category In 2006, participants in the Finance, Insurance & Real Estate industry were most likely to notify management before making hotline reports for personnel management concerns, followed by company/professional code violations, employee law violations and corruption and fraud incidents. They were least likely to have previously notified management about misuse of assets/information and customer/competitor interactions. This finding remained relatively stable over the four-year period.
Anonymity Consistently over the four-year period, slightly more than half of employees in the Finance, Insurance & Real Estate industry chose not to provide their names when making a report. Case Outcomes For this study, every issue reported through the hotline is considered an allegation. At the point of investigation, the issue becomes a case. The final case outcome is determined by the affected organization. For reports where information related specifically to case outcome was included, findings show the Finance, Insurance & Real Estate industry took action in about a third of the cases in response to
Incident Category 2003 2004 2005 2006 Company/Professional Code Violation
11%
17%
17%
15%
Corruption & Fraud
14%
9%
10%
11%
Customer/Competitor Interaction
2%
2%
2%
2%
Employment Law Violation
14%
11%
11%
11%
Environment, Health & Safety
5%
5%
5%
4%
Misuse of Assets/Information
2%
1%
1%
1%
Other
2%
0%
0%
0%
Personnel Management
51%
53%
50%
47%
53%48%
54%47%
54%46%
53%47%
40% 45% 50% 55%
2003
2004
2005
2006
Reports
Did not remainanonymous
Remainedanonymous

.
20.2007 CORPORATE GOVERNANCE AND COMPLIANCE HOTLINE BENCHMARKING REPORT . ©2007 Security Executive Council. All Rights Reserved.
reported incidents in 2006. This is a marked increase over 2003, when less than 10% were acted on. For about a fifth of the reports, no investigation was warranted. For just about half of the cases, information was not available. This is a significant improvement over 2003, when case outcome information was unavailable for about 80% of the cases.
Case Disposition A third of the reports in 2006 had an alternative disposition or remained unresolved. About 14% were cleared. For just less than half of the reports, no information was available. This is an improvement over 2003, when disposition information was unavailable for most of the cases (almost 90%).
Finance, Insurance & Real Estate by Organization Size Most of the reporting employees in the Finance, Insurance & Real Estate industry (about 60%) in 2006 were nested in group 5 organizations (50,000+ employees), followed by group 4 (20,001-50,000) and group 3 (10,001-20,000).
Case Outcome 2003 2004 2005 2006 No Investigation Warranted
12%
19%
17%
23%
Investigation, No Corrective Action 1% 10% 11% 11%
Investigation, Corrective Action 8% 25% 24% 16%
Other 0% 0% 0% 0%
Referred/Advised 0% 0% 1% 2%
Information Not Available 80% 46% 47% 48%
Disposition 2003 2004 2005 2006
Cleared/No Action 8% 11% 13% 14%
Disciplined/Counseled 1% 4% 5% 0%
Other/Unresolved 3% 38% 35% 33%
Prosecuted 0% 0% 0% 0%
Terminated 1% 2% 1% 2%
Information Not Available 87% 45% 45% 47%
Employee Group Size 2003 2004 2005 2006 1. 0 - 5000 9% 4% 5% 6%
2: 5001 – 10000 11% 5% 5% 4%
3: 10001 – 20000 7% 8% 8% 12%
4: 20001 – 50000 22% 19% 19% 20%
5. 50000 + 51% 65% 64% 58%

.
21.2007 CORPORATE GOVERNANCE AND COMPLIANCE HOTLINE BENCHMARKING REPORT . ©2007 Security Executive Council. All Rights Reserved.
MANUFACTURING Overall Incident Report Rates per 1,000 Employees
Report Rates by Type per 1,000 Employees
Means of Caller Awareness Finding out how participants learned about reporting mechanisms allows organizations to determine which communication methods are working. When means of awareness were provided by participants in the Manufacturing industry, findings showed that a third of the participants in 2006 became aware of the reporting mechanism from a poster. This is a slight decline from 2003, which
Rate per 1000
Incident 2003 2004 2005 2006
Company/Professional Code Violation 0.39 0.52 0.50 0.50
Corruption & Fraud 0.55 0.75 0.65 0.52
Customer/Competitor Interaction 0.05 0.09 0.12 0.09
Employment Law Violation 0.58 0.83 0.69 0.67
Environment, Health & Safety 0.20 0.26 0.31 0.21
Misuse of Assets/Information 0.27 0.24 0.18 0.08
Other, 0.03 0.07 0.04 0.01
Personnel Management, 2.47 4.11 3.51 2.21
4.54
6.9
6.02
5.42
0 2 4 6 8
2003 Rate
2004 Rate
2005 Rate
2006 Rate

.
22.2007 CORPORATE GOVERNANCE AND COMPLIANCE HOTLINE BENCHMARKING REPORT . ©2007 Security Executive Council. All Rights Reserved.
was 38%. The next most often cited methods were another employee, other means and the company handbook. As for all industries, the distribution of percentages across all categories clearly shows the importance of communicating reporting mechanisms through multiple channels.
Prior Management Notification Nearly 30% of participants in the Manufacturing industry in 2006 told management of their concerns before making a hotline report. This figure is stable over the four-year period and could indicate a preference among Manufacturing employees for using a reporting mechanism other than a face-to-face conversation with management.
Means of Caller Awareness
2003 2004 2005 2006
Brochure
5%
4%
3%
3%
Employee
11% 10% 9% 10%
Handbook
12% 9% 9% 10%
HR
3% 2.6% 3% 3%
Intranet
2% 2% 3% 3%
Manager
7% 5% 5% 4%
Other 10% 9% 9% 10%
Poster
38% 39% 32% 32%
Sign
2% 1% 1% 2%
Unknown
0% 0% 0% 1%
Video
1% 0% 0% 0%
Wallet Card 9% 8% 5% 4%
20032004
20052006
69% 71%69% 71%
32%29% 32%
29%
0%
10%
20%
30%
40%
50%
60%
70%
80%
YESNO

.
23.2007 CORPORATE GOVERNANCE AND COMPLIANCE HOTLINE BENCHMARKING REPORT . ©2007 Security Executive Council. All Rights Reserved.
Prior Management Notification by Incident Category In 2006, participants in the Manufacturing industry were most likely to notify management before making hotline reports for personnel management concerns, followed by employment law violations, corruption and fraud, and company/professional code violation incidents. They were least likely to have previously notified management about misuse of assets/information and customer/competitor interactions. It is important to note that in 2006 information was not available on a fifth of the participants.
Information Not Available 0% 0% 3% 21%
Anonymity Case Outcomes For this study, every issue reported through the hotline is considered an allegation. At the point of investigation, the issue becomes a case. The final case outcome is determined by the affected organization. For reports where information related specifically to case outcome was included, findings show the Manufacturing industry took action in a third of the cases in response to reported incidents. In 2006,
Incident Category 2003 2004 2005 2006
Company/Professional Code Violation
9% 8% 8% 9%
Corruption & Fraud
12% 11% 11% 10%
Customer/Competitor Interaction
1% 1% 2% 2%
Employment Law Violation
13% 12% 11% 12%
Environment, Health & Safety
4% 4% 5% 4%
Misuse of Assets/Information
6% 4% 3% 1%
Other 1% 1% 1% 0%
Personnel Management
54% 60% 57% 41%
50%50%
51%49%
54%46%
54%46%
40% 45% 50% 55%
2003
2004
2005
2006
Did not remainanonymousRemained anonymous
In the manufacturing industry in 2006, more than half of the participants chose not to provide their names when making a report.

.
24.2007 CORPORATE GOVERNANCE AND COMPLIANCE HOTLINE BENCHMARKING REPORT . ©2007 Security Executive Council. All Rights Reserved.
for 5% of cases no investigation was warranted— a marked decline from 19% in 2003. Most of this change is due to an increase in action taken (investigation) even if no corrective action followed. For well over half the cases in 2006 (61%), case outcome information was not available.
Case Disposition About 17% of the Manufacturing reports in 2006 had an alternative disposition or remained unresolved. This is a decline from roughly a quarter of the cases in that category for 2004-2005. About 16% were cleared. For more than half of the reports, no disposition information was provided.
Manufacturing by Organization Size About three quarters of reporting employees in the Manufacturing industry in 2006 were nested in group 5 organizations (50,000+ employees), followed by group 4 (20,001-50,000) and group 3 (10,001-20,000). This pattern is fairly stable over the four-year period.
Case Outcome 2003 2004 2005 2006
No Investigation Warranted 19% 15% 14% 5%
Investigation, No Corrective Action 3% 16% 18% 15%
Investigation, Corrective Action 13% 16% 19% 17%
Other 0% 0% 0% 0%
Referred/Advised 0% 0% 1% 2%
Information Not Available 65% 53% 48% 61%
Disposition 2003 2004 2005 2006
Cleared/No Action 5% 12% 16% 16%
Disciplined/Counseled 1% 7% 10% 5%
Other/Unresolved 6% 27% 25% 17%
Prosecuted 0% 0% 0% 0%
Terminated 2% 2% 2% 2%
Information Not Available
87% 51% 46% 60%
Employee Group Size 2003 2004 2005 2006 1: 0 - 5000 6% 4% 5% 5%
2: 5001 - 10000 4% 4% 4% 3%
3: 10001 - 20000 5% 3% 3% 9%
4: 20001 - 50000 7% 7% 7% 9%
5: 50000 + 79% 82% 81% 74%

.
25.2007 CORPORATE GOVERNANCE AND COMPLIANCE HOTLINE BENCHMARKING REPORT . ©2007 Security Executive Council. All Rights Reserved.
MINING Overall Incident Report Rates per 1,000 Employees
Report Rates by Type per 1,000 Employees
Means of Caller Awareness Finding out how participants learned about reporting mechanisms allows organizations to determine which communication methods are working. When means of awareness was provided by participants in the Mining industry, findings show that in 2006 about 18% of the participants became aware of the
Rate per 1000
Incident 2003 2004 2005 2006
Company/Professional Code Violation 0.27 0.45 0.33 0.22
Corruption & Fraud 0.31 0.61 0.39 0.30
Customer/Competitor Interaction 0.00 0.02 0.04 0.03
Employment Law Violation 0.31 0.36 0.28 0.37
Environment, Health & Safety 0.15 0.41 0.22 2.45
Misuse of Assets/Information 0.00 0.00 0.01 0.01
Other, 0.00 0.00 0.00 0.00
Personnel Management, 0.96 2.08 1.33 1.88
1.99
3.92
2.6
3.04
0 1 2 3 4
2003 Rate
2004 Rate
2005 Rate
2006 Rate

.
26.2007 CORPORATE GOVERNANCE AND COMPLIANCE HOTLINE BENCHMARKING REPORT . ©2007 Security Executive Council. All Rights Reserved.
reporting mechanism from a poster. A similar proportion became aware through another employee and through the company handbook (13%). However, as for all industries, the distribution of percentages across all categories clearly shows the importance of communicating reporting mechanisms through multiple channels.
15
Prior Management Notification Only a quarter of participants in the Mining industry in 2006 told management of their concerns before making a hotline report. This result could point to a preference among Mining employees for using a reporting mechanism other than a face-to-face conversation with management.
Means of Caller Awareness
2003 2004 2005 2006
Brochure
14%
10%
7%
8%
Employee 4% 10% 16% 17%
Handbook 10% 9% 9% 13%
HR 8% 3% 4% 4%
Intranet 0% 1% 1% 3%
Manager
4% 2% 4% 4%
Other
17% 25% 14% 20%
Poster
12% 14% 19% 18%
Sign
8% 1% 1% 1%
Unknown
2% 0% 1% 1%
Video
0% 0% 0% 0%
Wallet Card
14% 14% 10% 7%
20032004
20052006
73% 79% 74% 75%
27%21% 26%
25%
0%
10%
20%
30%
40%
50%
60%
70%
80%
YESNO

.
27.2007 CORPORATE GOVERNANCE AND COMPLIANCE HOTLINE BENCHMARKING REPORT . ©2007 Security Executive Council. All Rights Reserved.
Prior Management Notification by Incident Category Participants from the Mining industry in 2006 were most likely to notify management before making hotline reports about personnel management concerns, followed by employment law violations, corruption and fraud, and company/professional code violation incidents. In 2006, employment law violations overtook corruption/fraud as the second most reported incident type. However, both lost in strength over the years to personnel management, which gained more than 12 percentage points over the four-year period. Participants all four years were least likely to have previously notified management about misuse of assets/information and of customer/competitor interactions.
Anonymity Less than half of participants in the Mining industry chose not to provide their names when making a report. There is a 15%increase in anonymity from 2004 to 2006. Case Outcomes For this study, every issue reported through the hotline is considered an allegation. At the point of investigation, the issue becomes a case. The final case outcome is determined by the affected organization. For reports where information related specifically to case outcome was included, 2006 findings indicate the Mining industry took action in about 18% of the cases (24% in 2005) in response to
Incident Category 2003 2004 2005 2006
Company/Professional Code Violation 14% 11% 13% 7%
Corruption & Fraud 15% 16% 15% 10%
Customer/Competitor Interaction 0% 1% 2% 1%
Employment Law Violation 15% 9% 11% 12%
Environment, Health & Safety 8% 10% 8% 8%
Misuse of Assets/Information 0% 0% 1% 0%
Other 0% 0% 0% 0%
Personnel Management 48% 53% 51% 62%
40%60%
34%66%
41%
59%
49%51%
0% 20% 40% 60% 80%
2003
2004
2005
2006
Did not remainanonymousRemainedanonymous

.
28.2007 CORPORATE GOVERNANCE AND COMPLIANCE HOTLINE BENCHMARKING REPORT . ©2007 Security Executive Council. All Rights Reserved.
reported incidents. For about 5%, no investigation was warranted. For about three quarters of the cases, outcome information was unavailable.
Case Disposition In 2006, just over a tenth of the Mining reports had an alternative disposition or remained unresolved. About 8% were cleared, and almost 3% were disciplined or counseled. For about three quarters of the reports, no disposition information was provided.
Mining by Organization Size Most of the reporting employees in the Mining industry in 2006 were nested in group 3 organizations (10,001-20,000 employees); an increase of 9 percentage points in this category since 2004. The second largest concentration of reporting employees was in group 4 organizations (20,001-50,000) with about a third of the participants.
Case Outcome 2003 2004 2005 2006
No Investigation Warranted 0% 3% 6% 5%
Investigation, No Corrective Action 2% 5% 11% 10%
Investigation, Corrective Action 0% 12% 13% 8%
Other 0% 0% 0% 0%
Referred/Advised 0% 0% 0% 0%
Information Not Available 98% 80% 70% 78%
Disposition 2003 2004 2005 2006
Cleared/No Action 2% 6% 9% 8%
Disciplined/Counseled 0% 3% 3% 3%
Other/Unresolved 0% 9% 14% 11%
Prosecuted 0% 0% 0% 0%
Terminated 0% 3% 3% 1%
Information Not Available 98% 80% 80% 78%
Employee Group Size 2003 2004 2005 2006 1: 0 - 5000
17%
6%
8%
15%
2: 5001 - 1000
2%
10%
14%
9%
3: 10001 - 20000
81%
33%
35%
42%
4: 20001 - 50000
0%
40%
28%
27%
5: 50000 +
0%
12%
15%
7%

.
29.2007 CORPORATE GOVERNANCE AND COMPLIANCE HOTLINE BENCHMARKING REPORT . ©2007 Security Executive Council. All Rights Reserved.
PUBLIC ADMINISTRATION Overall Incident Report Rates per 1,000 Employees
Report Rates by Type per 1,000 Employees
Means of Caller Awareness Finding out how participants learned about reporting mechanisms allows organizations to determine which communication methods are working. When means of awareness were provided by participants in the Public Administration industry, findings showed that about a third became aware through alternative means in 2005-2006 (data were not available for 2003-2004). The next most often cited method was another employee. Eleven percent of the participants became aware of the
Rate per 1000
Incident 2003 2004 2005 2006
Company/Professional Code Violation 1.05 1.13
Corruption & Fraud 1.90 1.10
Customer/Competitor Interaction 0.18 0.37
Employment Law Violation 0.15 0.29
Environment, Health & Safety 0.18 0.14
Misuse of Assets/Information 0.00 0.04
Other, 0.00 0.00
Personnel Management, 0.70 1.30
N/A
N/A
4.68
4.76
0 1 2 3 4 5
2003 Rate
2004 Rate
2005 Rate
2006 Rate

.
30.2007 CORPORATE GOVERNANCE AND COMPLIANCE HOTLINE BENCHMARKING REPORT . ©2007 Security Executive Council. All Rights Reserved.
reporting mechanism from a poster, and 8% from a brochure. However, as for all industries, the distribution of percentages across all categories clearly shows the importance of communicating reporting mechanisms through multiple channels.
Prior Management Notification In 2006, only 17% of Public Administration participants notified management of their concerns before making a hotline report. This is 6% over 2005, yet it is the lowest prior notification figure for any industry. (Note: The instances of 0% represent data was not available.) Prior Management Notification by Incident Category Public Administration participants were most likely to notify management before making hotline reports for personnel management concerns, and almost equally likely to do so regarding company/professional code violations and corruption and fraud incidents. They were least likely to
Means of Caller Awareness
2003 2004 2005 2006
Brochure
N/A
N/A
4%
8%
Employee
N/A
N/A
12%
15%
Handbook
N/A
N/A
2%
0%
HR
N/A
N/A
1%
2%
Intranet
N/A
N/A
14%
6%
Manager
N/A
N/A
5%
2%
Other
N/A
N/A
39%
30%
Poster
N/A
N/A
1%
11%
Sign
N/A
N/A
1%
1%
Unknown
N/A
N/A
7%
16%
Video
N/A
N/A
1%
0%
Wallet Card
N/A
N/A
3%
5%
20032004
20052006
0%0%
89% 84%
0%0%
11% 17%
0%
10%
20%
30%
40%
50%
60%
70%
80%
90%
YES
NO

.
31.2007 CORPORATE GOVERNANCE AND COMPLIANCE HOTLINE BENCHMARKING REPORT . ©2007 Security Executive Council. All Rights Reserved.
have previously told management about misuse of assets/information, but unlike other industries, 8% were willing to report customer/competitor interactions.
Anonymity Just over a third (37%) of Public Administration industry participants chose not to provide their names when making a report. (Note: The instances of 0% represent data was not available.) Case Outcomes For this study, every issue reported through the hotline is considered an allegation. At the point of investigation, the issue becomes a case. The final case outcome is determined by the affected organization. For reports where information related specifically to case outcome was included, findings show that in 2006 the Public Administration industry took action in 26% of the cases in response to reported incidents. For 12% of the cases, no investigation was warranted. For well over
Incident Category 2003 2004 2005 2006 Company/Professional Code Violation
N/A
N/A
23%
24%
Corruption & Fraud
N/A N/A 41% 23%
Customer/Competitor Interaction
N/A N/A 4% 8%
Employment Law Violation
N/A N/A 3% 6%
Environment, Health & Safety
N/A N/A 4% 3%
Misuses of Assets/Information
N/A N/A 0% 1%
Other
N/A N/A 0% 0%
Personnel Management
N/A N/A 15% 27%
0%
0%
29%
71%37%
64%
0% 20% 40% 60% 80%
2003
2004
2005
2006
Did not remainanonymousRemainedanonymous

.
32.2007 CORPORATE GOVERNANCE AND COMPLIANCE HOTLINE BENCHMARKING REPORT . ©2007 Security Executive Council. All Rights Reserved.
half of the cases, outcome information was unavailable (down from three quarters of the cases in 2005).
Case Disposition Almost a third of the Public Administration reports in 2006 had an alternative disposition or remained unresolved. About 11% were cleared, and 2% were disciplined or counseled. For more than half of the reports, no disposition information was provided.
Public Administration by Organization Size Most of the reporting employees in the Public Administration industry (48%) in 2006 were nested in group 3 organizations (10,001-20,000), followed by group 2 (5,001-10,000) with 34% and group 1 (up to 5,000) with 15%. There is marked change from 2005, where most of the employees were split between group 1 and group 2 organizations.
Case Outcome 2003 2004 2005 2006 No Investigation Warranted N/A N/A 4% 12%
Investigation, No Corrective Action N/A N/A 11% 14%
Investigation, Corrective Action N/A N/A 11% 10%
Other N/A N/A 0% 0%
Referred/Advised N/A N/A 1% 2%
Information Not Available N/A N/A 73% 62%
Disposition 2003 2004 2005 2006
Cleared/No Action N/A N/A 11% 11%
Disciplined/Counseled N/A N/A 5% 2%
Other/Unresolved N/A N/A 16% 28%
Prosecuted N/A N/A 0% 0%
Terminated N/A N/A 0% 2%
Information Not Available N/A N/A 68% 56%
Employee Group Size 2003 2004 2005 2006 1: 0 - 5000
N/A
N/A
45%
15%
2: 5001 - 10000
N/A
N/A
50%
34%
3: 10001 - 20000
N/A
N/A
5%
48%
4: 20001 - 50000
N/A
N/A
0%
3%
5: 50000 +
N/A
N/A
0%
0%
.
33.2007 CORPORATE GOVERNANCE AND COMPLIANCE HOTLINE BENCHMARKING REPORT . ©2007 Security Executive Council. All Rights Reserved.
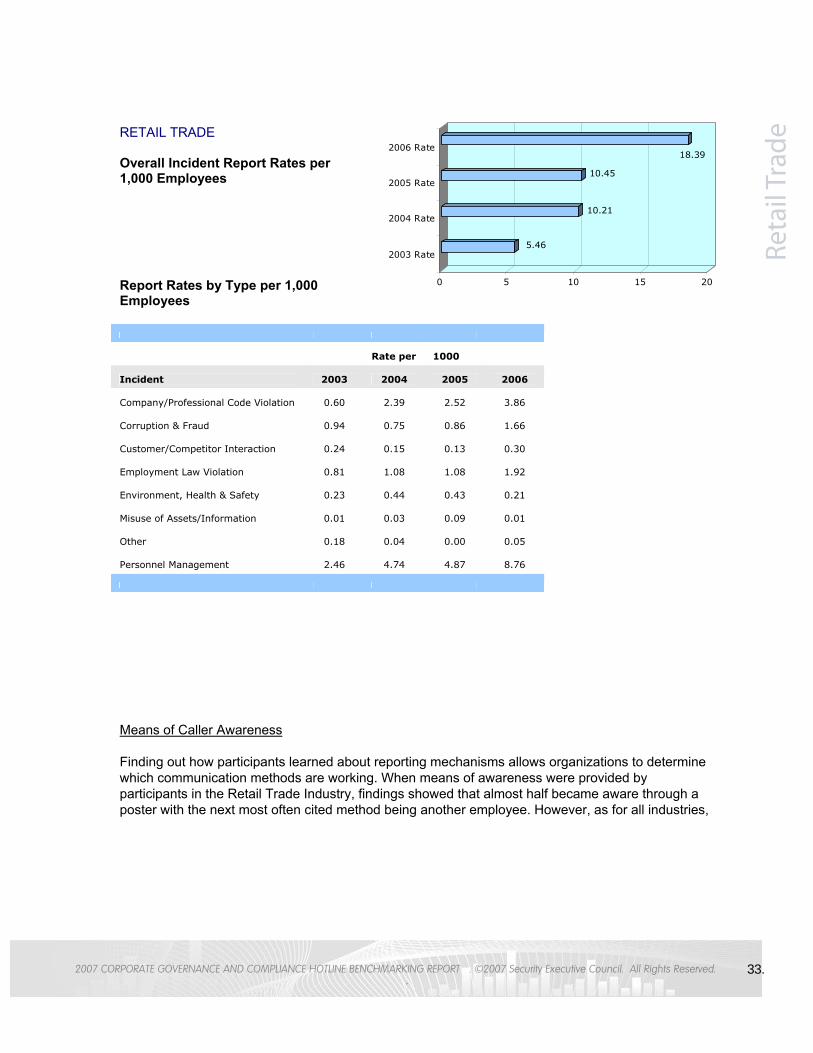
RETAIL TRADE Overall Incident Report Rates per 1,000 Employees
Report Rates by Type per 1,000 Employees
Means of Caller Awareness Finding out how participants learned about reporting mechanisms allows organizations to determine which communication methods are working. When means of awareness were provided by participants in the Retail Trade Industry, findings showed that almost half became aware through a poster with the next most often cited method being another employee. However, as for all industries,
Rate per 1000
Incident 2003 2004 2005 2006
Company/Professional Code Violation 0.60 2.39 2.52 3.86
Corruption & Fraud 0.94 0.75 0.86 1.66
Customer/Competitor Interaction 0.24 0.15 0.13 0.30
Employment Law Violation 0.81 1.08 1.08 1.92
Environment, Health & Safety 0.23 0.44 0.43 0.21
Misuse of Assets/Information 0.01 0.03 0.09 0.01
Other, 0.18 0.04 0.00 0.05
Personnel Management, 2.46 4.74 4.87 8.76
5.46
10.21
10.45
18.39
0 5 10 15 20
2003 Rate
2004 Rate
2005 Rate
2006 Rate

.
34.2007 CORPORATE GOVERNANCE AND COMPLIANCE HOTLINE BENCHMARKING REPORT . ©2007 Security Executive Council. All Rights Reserved.
the distribution of percentages across all categories clearly shows the importance of communicating reporting mechanisms through multiple channels.
Prior Management Notification About a third of the Retail Trade participants in 2006 notified management of their concerns before making a hotline report.
Means of Caller Awareness
2003 2004 2005 2006
Brochure
6%
2%
2%
2%
Employee
15%
15%
15%
15%
Handbook
9%
7%
7%
8%
HR
2%
3%
3%
3%
Intranet
3%
2%
1%
2%
Manager
7%
4%
6%
6%
Other
15%
13%
11%
11%
Poster
31%
41%
43%
43%
Sign
2%
1%
1%
2%
Unknown
0%
1%
1%
2%
Video
0%
0%
0%
0%
Wallet Card
8%
4%
5%
5%
20032004
20052006
70% 72% 68% 70%
30% 28% 32%30%
0%
10%
20%
30%
40%
50%
60%
70%
80%
YESNO

.
35.2007 CORPORATE GOVERNANCE AND COMPLIANCE HOTLINE BENCHMARKING REPORT . ©2007 Security Executive Council. All Rights Reserved.
Prior Management Notification by Incident Category In 2006, Retail Trade participants were most likely to notify management before making hotline reports for personnel management concerns (half of the cases) and about company/professional code violations, followed by employee law violations and corruption and fraud incidents. Corruption/fraud reporting dropped about 8% over the four-year period, while company/professional code violation reports increased by 10 percentage points. Reporting employees were least likely to have previously told management about misuse of assets/information.
Anonymity Well over half of the Retail Trade industry participants chose not to provide their names when making a report over the four-year period. Case Outcomes For this study, every issue reported through the hotline is considered an allegation. At the point of investigation, the issue becomes a case. The final case outcome is determined by the affected organization. For Retail Trade industry reports where information related specifically to case outcome was included, findings point out the Retail Trade industry took action in more than 40% of the cases in
Incident Category 2003 2004 2005 2006 Company/Professional Code Violation
11%
23.%
24%
21%
Corruption & Fraud
17%
7%
8%
9%
Customer/Competitor Interaction
4%
2%
1%
2%
Employment Law Violation
15%
11%
10%
11%
Environment, Health & Safety
4%
4%
4%
4%
Misuse of Assets/Information
0%
0%
0%
1%
Other
3%
0%
0%
0%
Personnel Management
45%
42%
47%
48%
56%
44%
59%
41%
57%
43%
56%
44%
0% 20% 40% 60%
2003
2004
2005
2006
Did not remainanonymousRemainedanonymous

.
36.2007 CORPORATE GOVERNANCE AND COMPLIANCE HOTLINE BENCHMARKING REPORT . ©2007 Security Executive Council. All Rights Reserved.
Disposition 2003 2004 2005 2006
Cleared/No Action 7% 7% 10% 11%
Disciplined/Counseled 0% 2% 3% 3%
Other/Unresolved 1% 57% 54% 53%
Prosecuted 0% 0% 0% 0%
Terminated 0% 0% 0% 1%
Information Not Available 92% 34% 34% 31%
response to reported incidents in 2006. For 27%, no investigation was warranted. For about a third of the cases in 2006, outcome information was not available. This is a marked change from 2003, when information was not available on 90% of the case outcomes.
Case Disposition More than half of the reports in 2006 had an alternative disposition or remained unresolved. About 11% were cleared and 3% were disciplined or counseled. For a third of the reports, no information was provided. This is a marked decline from 2003, when information was unavailable on 92% of the case dispositions. Organization Size Most of the reporting employees in the Retail Trade Industry in 2006 were nested in group 5 organizations (50,000 + employees), followed by group 4 (20,001-50,000). There are some variations with retail employees concentrating mostly in categories 4 and 5 in years 2004-2006, but not so in 2003.
Case Outcome 2003 2004 2005 2006
No Investigation Warranted 8% 27% 26% 27%
Investigation, No Corrective Action 0% 2% 3% 8%
Investigation, Corrective Action 2% 35% 33% 33%
Other 0% 0% 0% 0%
Referred/Advised 0% 0% 0% 0%
Information Not Available 91% 36% 38% 32%
Employee Group Size 2003 2004 2005 2006 1: 0 - 5000
19%
3%
3%
4%
2: 5001 - 10000
29%
5%
5%
3%
3: 10001 - 20000
12%
5%
4%
10%
4: 20001 - 50000
31%
17%
20%
21%
5: 50000 +
9%
70%
68%
63%

.
37.2007 CORPORATE GOVERNANCE AND COMPLIANCE HOTLINE BENCHMARKING REPORT . ©2007 Security Executive Council. All Rights Reserved.
SERVICE INDUSTRIES Overall Incident Report Rates per 1,000 Employees Report Rates by Type per 1,000 Employees
Means of Caller Awareness Finding out how participants learned about reporting mechanisms allows organizations to determine which communication methods are working. When means of awareness were provided by participants in the Service Industries in 2006, almost a third came from a poster; the next most often cited method was another employee. However, as for all industries, the distribution of percentages
Rate per 1000
Incident 2003 2004 2005 2006
Company/Professional Code Violation 0.71 0.78 0.50 0.42
Corruption & Fraud 0.93 0.55 0.30 0.42
Customer/Competitor Interaction 0.10 0.14 0.10 0.12
Employment Law Violation 0.51 0.59 0.41 0.39
Environment, Health & Safety 0.19 0.28 0.17 0.14
Misuse of Assets/Information 0.01 0.02 0.01 0.02
Other, 0.00 0.00 0.00 0.00
Personnel Management, 2.59 4.13 2.48 1.79
5.04
5.47
4
3.36
0 1 2 3 4 5 6
2003 Rate
2004 Rate
2005 Rate
2006 Rate

.
38.2007 CORPORATE GOVERNANCE AND COMPLIANCE HOTLINE BENCHMARKING REPORT . ©2007 Security Executive Council. All Rights Reserved.
across all categories clearly shows the importance of communicating reporting mechanisms through multiple channels.
Prior Management Notification Only about a fifth of the participants in the Service Industries in 2006 notified management of their concerns before making a hotline report.
Means of Caller Awareness
2003 2004 2005 2006
Brochure 8% 6% 4% 5%
Employee 15% 15% 14% 15%
Handbook 8% 10% 12% 10%
HR 5% 6% 7% 5%
Intranet 1% 2% 5% 8%
Manager 5% 4% 4% 3%
Other
11% 13% 13% 14%
Poster
35% 34% 33% 28%
Sign
2% 1% 2% 2%
Unknown
0% 1% 1% 1%
Video
0% 0% 0% 0%
Wallet Card 10% 8% 6% 6%
20032004
20052006
72% 75%72% 77%
28%25% 28%
23%
0%
10%
20%
30%
40%
50%
60%
70%
80%
YESNO

.
39.2007 CORPORATE GOVERNANCE AND COMPLIANCE HOTLINE BENCHMARKING REPORT . ©2007 Security Executive Council. All Rights Reserved.
Prior Management Notification by Incident Category Service industry participants were most likely to notify management before making hotline reports about personnel management concerns and corruption and fraud incidents, followed by company/professional code violations and employee law violations. They were least likely to have previously told management about misuse of assets/information.
Anonymity Only 37% of Service industry participants in 2006 chose not to provide their names when making a report. This is tied as the lowest such reporting among any of the industries with Public Administration and perhaps attests to the relative confidence of employees in this industry. Case Outcomes For this study, every issue reported through the hotline is considered an allegation. At the point of investigation, the issue becomes a case. The final case outcome is determined by the affected organization. For Service Industry reports where information related specifically to case outcome was included, findings show that Service Industries took action in 38% of the cases in response to reported incidents. For 8% no investigation was warranted. This is a marked decline from 2003,
Incident Category 2003 2004 2005 2006
Company/Professional Code Violation
14%
12%
12%
13% Corruption & Fraud
19%
8%
7%
14%
Customer/Competitor Interaction
2%
2%
3%
4%
Employment Law Violation
10%
9%
10%
12%
Environment, Health & Safety
4%
4%
4%
4%
Misuse of Assets/Information
0%
0%
0%
0%
Other
0%
0%
0%
0%
Personnel Management
51%
64%
62%
53%
40%
60%
43%
58%
44%
56%
37%
63%
0% 20% 40% 60% 80%
2003
2004
2005
2006
Did not remainanonymousRemainedanonymous

.
40.2007 CORPORATE GOVERNANCE AND COMPLIANCE HOTLINE BENCHMARKING REPORT . ©2007 Security Executive Council. All Rights Reserved.
when no investigation was warranted in 21% of the cases. For more than half of the cases, outcome information was unavailable in 2003 and 2006, while for 2004-2005 information was unavailable only for 30%-35% of the cases.
Case Disposition About 15% of service industry reports had an alternate disposition or remained unresolved in 2006. However, over 23% were cleared in 2006, and 4% were disciplined or counseled. For more than half of the reports, disposition information was not available in 2003 and 2006, while in 2004-2005 information was unavailable for 30%-35% of the cases.
Service Industries by Organization Size Most of the reporting employees in the Service Industries in 2006 were nested in group 5 organizations (50,000 + employees), followed closely by group 2 (5,001-10,000) and group 1 (up to 5,000).
Case Outcome 2003 2004 2005 2006
No Investigation Warranted 21% 12% 11% 8%
Investigation, No Corrective Action 2% 30% 23% 18%
Investigation, Corrective Action 18% 28% 32% 20%
Other 0% 0% 0% 0%
Referred/Advised 0% 0% 0% 0%
Information Not Available 60% 30% 35% 54%
Disposition 2003 2004 2005 2006
Cleared/No Action 27% 31% 22% 23%
Disciplined/Counseled 5% 5% 4% 4%
Other/Unresolved 3% 28% 34% 15%
Prosecuted 0% 0% 0% 0%
Terminated 1% 6% 3% 2%
Information Not Available 63% 30% 36% 57%
Employee Group Size 2003 2004 2005 2006 1: 0 - 5000
7%
13%
20%
23%
2: 5001 - 10000
7%
7%
11%
24%
3: 10001 - 20000
6%
11%
12%
13%
4: 20001 - 50000
45%
52%
37%
15%
5: 50000 +
35%
17%
21%
26%

.
41.2007 CORPORATE GOVERNANCE AND COMPLIANCE HOTLINE BENCHMARKING REPORT . ©2007 Security Executive Council. All Rights Reserved.
TRANSPORTATION, COMMUNICATIONS & UTILITIES Overall Incident Report Rates per 1,000 Employees Report Rates by Type per 1,000 Employees
Means of Caller Awareness Finding out how participants learned about reporting mechanisms allows organizations to determine which communication methods are working. When means of awareness were provided by participants in the Transportation, Communications & Utilities industry in 2006, the majority came from a poster (about 17%). The next most often cited method was the Intranet (about 16%), followed
Rate per 1000
Incident 2003 2004 2005 2006
Company/Professional Code Violation 1.21 0.88 0.93 0.87
Corruption & Fraud 1.15 0.68 0.78 0.81
Customer/Competitor Interaction 0.06 0.16 0.18 0.15
Employment Law Violation 1.74 1.01 0.99 1.30
Environment, Health & Safety 0.68 0.51 0.52 0.72
Misuse of Assets/Information 0.15 0.05 0.05 0.05
Other, 0.06 0.02 0.02 0.03
Personnel Management, 6.13 4.62 4.40 5.33
11.18
7.98
7.94
9.42
0 2 4 6 8 10 12
2003 Rate
2004 Rate
2005 Rate
2006 Rate

.
42.2007 CORPORATE GOVERNANCE AND COMPLIANCE HOTLINE BENCHMARKING REPORT . ©2007 Security Executive Council. All Rights Reserved.
by another employee (14%). However, as for all industries, the distribution of percentages across all categories clearly shows the importance of communicating reporting mechanisms through multiple channels.
Prior Management Notification Only about a fifth to a quarter of the Transportation, Communications & Utilities industry participants across the four-year period told management of their concerns before making a hotline report.
Means of Caller Awareness
2003 2004 2005 2006
Brochure 3% 5% 3% 3%
Employee 12% 12% 13% 14%
Handbook 7% 7% 8% 8%
HR 5% 4% 4% 4%
Intranet 16% 12% 15% 15%
Manager
5% 4% 5% 4%
Other
14% 12% 15% 14%
Poster
5% 13% 13% 16%
Sign
0% 1% 1% 1%
Unknown
0% 1% 1% 1%
Video
0% 0% 0% 0%
Wallet Card
1% 2% 1% 2%
20032004
20052006
79% 77% 74% 75%
21% 23% 26%25%
0%
10%
20%
30%
40%
50%
60%
70%
80%
YESNO

.
43.2007 CORPORATE GOVERNANCE AND COMPLIANCE HOTLINE BENCHMARKING REPORT . ©2007 Security Executive Council. All Rights Reserved.
Prior Management Notification By Incident Category Transportation, Communications & Utilities industry participants were most likely to notify management before making hotline reports for personnel management concerns and employment law violations, followed by company/professional code violations and corruption and fraud incidents. They were least likely to have previously notified management about misuse of assets/information.
Anonymity Over the four-year period, well over half of the Transportation, Communications & Utilities industry participants chose not to provide their names when making a report. Case Outcomes For this study, every issue reported through the hotline is considered an allegation. At the point of investigation, the issue becomes a case. The final case outcome is determined by the affected organization. For reports where information related specifically to case outcome was included, findings show the Transportation, Communications & Utilities industry took action in about 25% of the cases in
Incident Category 2003 2004 2005 2006 Company/Professional Code Violation
11%
11%
12%
9%
Corruption & Fraud
10%
9%
10%
9%
Customer/Competitor Interaction
1%
3%
2%
2%
Employment Law Violation
16%
13%
13%
14%
Environment, Health & Safety
6%
7%
7%
8%
Misuse of Assets/Information
1%
1%
1%
1%
Other
1%
5%
0%
0%
Personnel Management
55%
58%
56%
57%
64%36%
58%42%
58%43%
59%41%
0% 20% 40% 60% 80%
2003
2004
2005
2006
Did not remainanonymousRemainedanonymous

.
44.2007 CORPORATE GOVERNANCE AND COMPLIANCE HOTLINE BENCHMARKING REPORT . ©2007 Security Executive Council. All Rights Reserved.
response to reported incidents in 2006. For 7% of the cases, no investigation was warranted. For more than two thirds of the cases, outcome information was not available in 2006—about a third less than in 2003.
Case Disposition In 2006, about 14% of the reports had an alternative disposition or remained unresolved. An additional 14% of cases were cleared, and 3.0% ended in discipline or counseling. For more than two thirds of the reports, no disposition information was available. This is a marked difference form previous years.
Transportation, Communications & Utilities by Organization Size Most of the reporting employees in the Transportation, Communications & Utilities industry in 2006 were nested in group 4 organizations (20,001- 50,000 employees) followed by group 5 (50,000 +). In 2003 most of the employees were nested in group 5.
Case outcome 2003 2004 2005 2006
No Investigation Warranted 0% 5% 5% 7%
Investigation, No Corrective Action 0% 6% 6% 9%
Investigation, Corrective Action 0% 3% 5% 10%
Other 0% 0% 0% 0%
Referred/Advised 0% 0% 0% 6%
Information Not Available 99% 86% 84% 69%
Disposition 2003 2004 2005 2006
Cleared/No Action 0% 4% 5% 14%
Disciplined/Counseled 0% 2% 2% 3%
Other/Unresolved 0% 9% 8% 14%
Prosecuted 0% 0% 0% 0%
Terminated 0% 0% 1% 1%
Information Not Available 100% 86% 84% 68%
Employee Group Size 2003 2004 2005 2006
1: 0 - 5000 1% 3% 3% 3%
2: 5001 - 10000 0% 0% 0% 1%
3: 10001 - 20000 2% 12% 12% 12%
4: 20001 - 50000 16% 26% 30% 45%
5: 50000 + 82% 60% 54% 37%

.
45.2007 CORPORATE GOVERNANCE AND COMPLIANCE HOTLINE BENCHMARKING REPORT . ©2007 Security Executive Council. All Rights Reserved.
WHOLESALE TRADE Overall Incident Report Rates per 1,000 Employees
Report Rates by Type per 1,000 Employees
Means of Caller Awareness Finding out how participants learned about reporting mechanisms allows organizations to determine which communication methods are working. When means of awareness was provided by participants in the Wholesale Trade industry in 2006, findings showed that more than a third became aware from
Rate per 1000
Incident 2003 2004 2005 2006
Company/Professional Code Violation 0.33 0.90 1.18 0.63
Corruption & Fraud 0.34 1.00 1.43 0.88
Customer/Competitor Interaction 0.05 0.14 0.22 0.11
Employment Law Violation 0.36 0.90 1.09 0.88
Environment, Health & Safety 0.03 0.39 0.48 0.28
Misuse of Assets/Information 0.00 0.02 0.01 0.02
Other, 0.00 0.00 0.00 0.00
Personnel Management, 1.30 4.63 5.38 4.24
2.41
7.97
9.81
7.26
0 2 4 6 8 10
2003 Rate
2004 Rate
2005 Rate
2006 Rate

.
46.2007 CORPORATE GOVERNANCE AND COMPLIANCE HOTLINE BENCHMARKING REPORT . ©2007 Security Executive Council. All Rights Reserved.
a poster. The next most often cited methods were the company handbook and other employees. However, as for all industries, the distribution of percentages across all categories clearly shows the importance of communicating reporting mechanisms through multiple channels.
Prior Management Notification Less than a third of the Wholesale Trade industry participants across all four years notified management of their concerns before making a hotline report.
Means of Caller Awareness
2003 2004 2005 2006
Brochure 3% 9% 6% 5%
Employee 7% 10% 10% 13%
Handbook 31% 7% 8% 15%
HR 3% 3% 3% 3%
Intranet 5% 3% 4% 4%
Manager
3% 4% 6% 6%
Other
10% 13% 13% 11%
Poster
36% 33% 34% 35%
Sign
1% 1% 2% 2%
Unknown
0% 0% 0% 1%
Video
1% 0% 0% 0%
Wallet Card
0% 16% 14% 7%
20032004
20052006
70% 73% 71% 71%
30%27% 29%
29%
0%
10%
20%
30%
40%
50%
60%
70%
80%
YESNO

.
47.2007 CORPORATE GOVERNANCE AND COMPLIANCE HOTLINE BENCHMARKING REPORT . ©2007 Security Executive Council. All Rights Reserved.
Prior Management Notification by Incident Category The area where participants in the Wholesale Trade industry were by far most likely to notify management before making hotline reports about personnel management concerns. They were equally likely (12%) to notify management about corruption and fraud and employment law violation incidents and least likely to have previously told management about misuse of assets/information.
18
Anonymity Just over a half (52%) of participants in the Wholesale Trade industry chose in 2006 not to provide their names when making a report. This is up from 40% in 2003. Case Outcomes For this study, every issue reported through the hotline is considered an allegation. At the point of investigation, the issue becomes a case. The final case outcome is determined by the affected organization. In 2006, for reports where information related specifically to case outcome was included, findings indicate the Wholesale Trade industry took action in more than one third of the cases in response to reported incidents. In 2006, 7% of cases warranted no investigation. For more than half of the cases,
Incident Category 2003 2004 2005 2006 Company/Professional Code Violation
14%
11%
12%
9%
Corruption & Fraud
14%
13%
15%
12%
Customer/Competitor Interaction
2%
2%
2%
2%
Employment Law Violation
15%
11%
11%
12%
Environment, Health & Safety
1%
5%
5%
4%
Misuse of Assets/Information
0%
0%
0%
0%
Other
0%
0%
0%
0%
Personnel Management
54%
58%
55%
58%
40%60%
44%
56%
45%55%
52%48%
0% 10% 20% 30% 40% 50% 60%
2003
2004
2005
2006
Did not remainanonymousRemainedanonymous

.
48.2007 CORPORATE GOVERNANCE AND COMPLIANCE HOTLINE BENCHMARKING REPORT . ©2007 Security Executive Council. All Rights Reserved.
outcome information was not available. This is a significant drop from 2003, when outcome information was unavailable for more than 90% of the incidents.
Case Disposition About 13% of the reports in 2006 had an alternative disposition or remained unresolved, 22% were cleared, and 12% were disciplined or counseled (the highest rate in any industry). For just under half of the reports, no disposition information was provided. This is markedly down from 2003, when information was unavailable for more than 90% of the incidents.
Wholesale Trade by Organization Size In 2006, most of the reporting employees in the Wholesale Trade industry were nested in group 4 (20,001-50,000 employees) and group 5 organizations (50,000 +).
Case Outcome 2003 2004 2005 2006
No Investigation Warranted 2% 10% 5% 7%
Investigation, No Corrective Action 3% 34% 24% 18%
Investigation, Corrective Action 4% 26% 22% 18%
Other 0% 0% 1% 0%
Referred/Advised 0% 0% 2% 2%
Information Not Available 92% 30% 47% 55%
Disposition 2003 2004 2005 2006 Cleared/No Action 2% 42% 28% 22%
Disciplined/Counseled 2% 8% 12% 12%
Other/Unresolved 3% 16% 5% 13%
Prosecuted 0% 0% 0% 0%
Terminated 2% 4% 4% 3%
Information Not Available 92% 30% 51% 50%
Employee Group Size 2003 2004 2005 2006
1: 0 - 5000 8% 1% 11% 10%
2: 5001 - 10000 43% 7% 11% 10%
3: 10001 - 20000 0% 2% 6% 7%
4: 20001 - 50000 49% 89% 66% 43%
5: 50000 + 0% 0% 5% 31%

.
49.2007 CORPORATE GOVERNANCE AND COMPLIANCE HOTLINE BENCHMARKING REPORT . ©2007 Security Executive Council. All Rights Reserved.
APPENDICES
(I) 2006 Corporate Governance and
Compliance Benchmarking Report: Executive Summary/Key Findings
(II) Sample Slides for Presentation to Management (III) Methodology (IV) Categories & Terminology

.
50.2007 CORPORATE GOVERNANCE AND COMPLIANCE HOTLINE BENCHMARKING REPORT . ©2007 Security Executive Council. All Rights Reserved.
4.37.6
12.9
5.94.7
20.6
11.3
19.3
15 14.9
0
5
10
15
20
25
APPENDIX (I) 2006 Corporate Governance and Compliance Benchmarking Report: Executive
Summary/Key Findings The 2006 benchmarking report was based on an analysis of nearly 200,000 reports from more than 500 organizations across all industries and across a four-year period of collecting reports. Participants, or those who made hotline reports, can be employees, former employees, vendors, and the public. The data was aggregated and masked to protect confidentiality. Data quality management and analysis of the resulting database was conducted by the Security Executive Council. Across the four years’ worth of data the report found:
For those reports where case outcome was provided, most of reports (65%) were serious enough to warrant an investigation and 46% resulted in corrective action taken.
71% of participants did not notify management of an issue before making a report.
One of the most surprising findings was that participants reporting corruption and fraud incidents were less
likely to remain anonymous than participants reporting incidents in any other category. They remained anonymous only 36% of the time.
The research showed that most reports received pertained to personnel management incidents (51%).
Beyond the personnel management category, company/professional code violations (16%), employment law violations (11%), and corruption and fraud (10%) were the most commonly reported incidents, regardless of industry.
54% of reports were made anonymously.
The largest percentage of participants (39%) acknowledged awareness of a hotline through a poster or sign.
Overall, an average of 14.9 incidents are reported per 1,000 employees.
Smaller organizations (those with less than 5,000 employees) received an average of 21.8 incident reports
per 1,000 employees. In contrast, organizations with an employee count between 10,000 and 19,999 received an average of 13.6 incident reports per 1,000 employees. Those organizations with more than 50,000 employees received an average of 14.3 incident reports per 1,000 employees.
Initially, these may seem like small percentages, but when viewed with the types of incidents being reported, they illustrate the importance of a confidential reporting mechanism. The chart below provides a breakdown of incidents reported by industry per 1,000 employees.
Industry
Construction Finance, Insurance & Real
Estate Manufacturing Mining Public Administration Retail Trade Service Industries Transportation,
Communications & Utilities Wholesale Trade Overall The agriculture, forestry & fishing industries were not included
in this chart as there were not enough data to provide a proper analysis.

.
51.2007 CORPORATE GOVERNANCE AND COMPLIANCE HOTLINE BENCHMARKING REPORT . ©2007 Security Executive Council. All Rights Reserved.
Because industry-wide analysis of hotline data was previously missing or incomplete, you may have found during your regular reporting to senior management a question raised such as: “Does this data mean our company is doing well or not doing well with our compliance program compared with others?” One way to answer this is by comparing your company to your peers. You may have a few colleagues with whom you can swap data. With this report you can compare yourself to a wider sample of companies. With future reports we hope to look broader and dig deeper so comparisons may be more on target for your situation. While reading this report and comparing your program to the benchmark is useful, that is not its sole intent. What you do with your comparison is the important aspect. Your findings should be conveyed to senior management to both indicate the state of your program and serve as an impetus to affect needed change. The following example by George Campbell, Emeritus Faculty, Security Executive Council and author of Measures & Metrics in Corporate Security, offers some ways to think about presenting your program compared to industry-wide findings. We hope that this report and the presentation examples will be a part of your strategic arsenal for developing or enhancing your organization’s compliance programs and/or related security programs (for example, misconduct investigations). Protecting brand image, people, organizational growth, and stakeholder confidence is at the root of what should be driving how you measure the success of your program.
Security Executive Council Faculty Notes In the following example, we are using a fictitious financial services organization that subscribes to the Network’s anonymous incident reporting service. If you are not a subscriber, you likely still have some sort of internal or contracted anonymous reporting procedure with which to compare.
This is simple analysis of the benchmark data compared to your own. The good news here in spite of the results is employees are using the confidential resource to report their concerns. Moreover, many think reporting anonymously is better/safer than reporting to their manager – this could be related to a trust issue that is reflective of the reported issues. This is an opportunity to follow up and do additional research.
In our example, we have to acknowledge the obvious internal problems implied by the data and then try to analyze how our approach to disposition is part of the strategy to improve the “climate.” You need to decide if applying meaningful sanctions for founded allegations is relevant in your company. The point is to take your data and discuss it with key people in your internal governance community. Human Resources and Legal are critical players in the analysis and conclusions on a way forward.
APPENDIX (II) Sample Presentation To Senior Management

.
52.2007 CORPORATE GOVERNANCE AND COMPLIANCE HOTLINE BENCHMARKING REPORT . ©2007 Security Executive Council. All Rights Reserved.
This type of chart enables taking two factors (years, in this case) and comparing two years of the industry benchmark (bars) and the internal company data (the line). It’s reasonably easy to see the trends in both but a bit more difficult to figure out the “why.” Again, you have to use a slide like this to convene a group of engaged and relevant professionals and probe the “what if’s”. What do we know about the environment in those units reporting professional code violations or misuse of assets or information? What have we learned from investigative or event lessons learned? If we haven’t engaged a post-mortem, are we missing the learning? What can others like HR or Legal share on follow-ups? This is a drill in what we know and what we need to know. Hopefully, your discussions will have data to influence answers to why we see these results and the options for addressing them.
Our Company Confidential Information
0
0.5
1
1.5
2
2.5
Prof. Code Violation
Corruption & Fraud
Customer/Competitor In
teraction
Employment Law Violation
Environ./Health/Safety
Misuse of Assets/Information
Personnel Management Other
2006 2005 Our Company-2006 Our Company-2005
Incidents per 1000 Employees
This type of outcome may reflect a lack of employee trust and confidence in management’s response to allegations of wrongdoing or other confidential communication. When taken with the preceding rate data, we see a greater prevalence of reporting of more serious allegations and a greater reliance on anonymity by using the employee hotline. “Personnel management” refers to reporting of HR-related issues such as complaints about performance reviews, poor employee/supervisor relationships and other job-related complaints. Many companies have noted the preponderance of calls in this category and have established a separate hotline directly to HR/Employee Relations. This then limits calls on the confidential reporting hotline to allegations of misconduct and criminal behavior which require fact-finding by security personnel and oversight by Compliance, an Ethics Officer or Legal Counsel.
Our Company Confidential Information
0.00%
5.00%
10.00%
15.00%
20.00%
25.00%
30.00%
35.00%
40.00%
45.00%
50.00%
Cleared-N
o Action
Disciplined/Counsele
d
Other/Unresolv
ed
Prosecute
d
Terminated
No Info. Available
2006 2005 Our Company-2006 Our Company-2005
Case Disposition
Our Company Confidential Information
0.00%
10.00%
20.00%
30.00%
40.00%
50.00%
60.00%
70.00%
Prof. Code Violation
Corruption & Fraud
Customer/Competitor In
teraction
Employment Law Violation
Environ./Health/Safety
Misuse of Assets/Information
Personnel Management
2006 2005 Our Company-2006 Our Company-2005
Prior Management Notification Before Resorting to Hotline
In this example, the company has a complete record of all calls and the eventual resolution where the industry report indicates about 45% “information not available.” This is an interesting point and may be due to the frequent failure of subscriber companies to follow up with case resolution given the extended time it normally takes to investigate and resolve cases of this type. What we have done here is to show the company’s case dispositions assuming virtually no information voids. You can compare year to year to see how resolutions have changed in response to strategies to address confirmed trends in misconduct. For example, imagine there was concern in 2005 for the potential lack of probing given the large number of “cleared no action” cases; as a result we see far fewer of these in 2006 and a corresponding rise in the number of cases with applied sanctions. You would want to explore the facts in these cases to make sure the more serious sanctions year-over-year were not attributable to more serious findings than a sanction-oriented policy being applied in 2006.

.
53.2007 CORPORATE GOVERNANCE AND COMPLIANCE HOTLINE BENCHMARKING REPORT . ©2007 Security Executive Council. All Rights Reserved.
If you decide to benchmark your company’s hotline statistics (and you should), you need to take the time to drill down on what the trends imply, where are the common denominators and what is the response when management attempts to fix perceived problems. You need to localize trends and seek out common denominators: • Where (which business units) are various types of allegations directed? • Where are there similar findings on business environment, management behavior, failure to effectively respond, awareness or voids in policy and lessons learned? • What actions will yield the greatest impact for the largest volume of founded allegations? Maybe there is a total lack of stated expectations or policy on appropriate use of assets and information or relations with customers and competitors. Are certain managers in high incidence units repeatedly “getting away with it”? This is an ideal opportunity to sit with a multi-disciplined team from Security, HR, Legal, Ethics, Compliance and others and look for the causes and factors that are contributing to these types of allegations. Every founded case of criminal activity or misconduct should have a post mortem to seek out the contributing factors. You will find common denominators that can be attacked and results measured. See the following slide for an example of how common denominators may be displayed for a focused discussion with management.
Our Company Confidential Information
Recommendations:
• What are your conclusions and what steps does your organization need to take to address the concerns the data has revealed to your analysis?
• Who needs to do what and what is your role?• How will you present your findings to various
constituencies and what are the differences in their hot buttons and your message?
• How should you measure the response?
What did we learn from the trends?
InternetAbuseLack of
SupervisionLack of Candor
WorkplaceViolence
Poor AccessControl
Conflict ofinterestLack of
SupervisionLack of Candor
ProfessionalMisconduct
Lack ofSupervision
Lack of Candor
SexualHarassment
Lack ofSupervision
Lack of Candor
InventoryThefts
Poor AccessControl
Lack of Candor
Payroll FraudLack of
Supervision
SubstanceAbuseLack of
Suprvision
PayrollFraudLack of
Supervision
Trade SecretsTheft
Poor Access Control
Lack of Candor
Low severityLow Frequency
High Severity
High Frequency
SystemSabotage
Lack of SupervisionPoor Access
Control
This can be an incredibly revealing and valuable visual presentation when you have the verifiable historical data and the incident post mortems to identify the root causes and business process vulnerabilities. In this presentation we show 11 categories of incidents with verified common denominators. Each one is actionable with one of your key constituents. In this example, Human Resources has a stake in exploring the “lack of supervision” with regard to manager training and risk awareness. They also need to look into the certain groups represented by the “lack of candor” finding, which may indicate inadequate background investigation or supervisory inadequacies. “Poor access control” can be local decisions over-riding security policy or bad physical security planning and implementation. You can tell several stories and motivate action in a well-planned slide like this.

.
54.2007 CORPORATE GOVERNANCE AND COMPLIANCE HOTLINE BENCHMARKING REPORT . ©2007 Security Executive Council. All Rights Reserved.
APPENDIX (III) Methodology Data In 2006, the Security Executive Council, The Network, and the Association of Certified Fraud Examiners (ACFE) initiated the first-ever, large-scale hotline/helpline benchmarking report. This subsequent study for 2007 is based on an analysis of 277,232 reports from 653 organizations over a five-year period from 2002-2006. Reports were received from employees, ex-employees, vendors and the public. (Note: 2002 data was omitted from rate data analyses due to low volume.) Note: Some analyses show percentages for “information not available.” While this data could have been removed and the rest of the data recalculated, we felt it was of interest to publish this detail. There are many possibilities why this occurs; for example, a culture of the business or longtime lags from call inception to resolution. Please contact the Security Executive Council for any recalculation of data inquiries. Report Details Throughout this benchmarking study, the goal was to identify emerging best practices for hotlines and other reporting mechanisms and to provide a framework by which readers can assess their own compliance programs. Keep in mind, this report should serve as a starting point in your efforts to evaluate your program results and assess your organizational health. Remember that corporate culture, communications, and other factors may influence your results. As you review the data presented in this report, be sure to drill down carefully to determine what these numbers mean in relation to the specific activities and environment within your industry and organization. This data does not represent every organization – it is representative of reports received through The Network. All efforts have been made to report the data in a manner that allows readers to easily make comparisons to their industry. However, readers should keep in mind that other data sources may have slightly different interpretations. While most of records contained all necessary data, there were some instances where the records did not contain every data element. This can occur for many reasons depending on the participant making the report, the requirements of the organization for which the report is being filed, the situation or the incident being reported, etc. Because this is not a random sample of all industries and reports, certain variables may not be fully representative of the population at large. All reports are allegations and are treated as such. The Network does not decide the outcome of cases. Final outcome of cases is designated by the organization affected. 31 Your Input This report is a snapshot of the state of business ethics by industry as assessed by hotline calls. We encourage suggestions from readers for use in future studies. What data should be added? What should be different? Are there other variables that should be collected? Send us your feedback online at www.securityexecutivecouncil.com/surveys/hotline08 Legal Obligations and Privacy In compiling the benchmarking report, The Network took exhaustive measures to adhere to legal, ethical, and contractual obligations. The data set for this report contains only summary information that is useful for understanding reporting activity. The data set does not contain the names of any organizations or individuals. The goal is to provide useful information that will benefit all organizations and the greater compliance community, while at the same time protecting confidentiality of all program participants. The Network will never disclose the identity of individuals who submit reports, the identity of the individual(s) who are the subject of a report, or any other data that may reveal the identity of any individual or organization. To further protect the identities of participants, this report only utilizes aggregate, non-specific data and data ranges.

.
55.2007 CORPORATE GOVERNANCE AND COMPLIANCE HOTLINE BENCHMARKING REPORT . ©2007 Security Executive Council. All Rights Reserved.
APPENDIX (IV) Categories & Terminology Incident Category Descriptions
To assist in interpreting the data, specific incident types were consolidated into broader categories. The incident category descriptions are based on The Network’s 25 years of incident reporting experience and also align with the classifications set forth by the Open Compliance and Ethics Group. Company/Professional Code Violation: Employees have a duty to their employer to act in the best interest of their employer when carrying out the duties of their employment. Any departure from company policy or facility procedures constitutes a company/professional code violation. Examples include conflicts of interest, corporate compliance policy violations and code of conduct violations. Corruption and Fraud: Attempts to deceive the organization or others on behalf of the organization in order to receive gain such as a fraudulent refund or transaction, misstatement or destruction of an accounting document, taking of money or merchandise, kickbacks, etc. Examples include theft of any kind, accounting irregularities, insider trading and improper loans to executives. Customer/Competitor Interaction: Display of poor customer service or courtesy exhibited by employees through their actions, or inattention to customers. This category includes poor workmanship and outdated or defective products. Examples include customer complaints and product quality concerns. This category also includes improper interaction with competitive organizations. Employment Law Violation: Any act or omission that fails to meet the standards of the Equal Employment Opportunity Commission, which includes all types of discrimination. It also includes any adverse treatment related to a person’s employment, career, profession, trade or business, including retaliation. Examples include harassment and labor law violations. Environment, Health & Safety: Any potentially hazardous or unsanitary condition that could affect the well-being of an employee, customer, facility, or the general public. This category includes acts that cause physical injury or other acts or statements that jeopardize physical well-being. Examples include unsafe working conditions, workplace violence and product contamination. Misuse of Assets/Information: The conveying of information considered sensitive to another person, company, or entity by any person. Examples include release of proprietary information and misuse of computers, property or networks. Personnel Management: Any act or omission that is perceived to be detrimental to an employee’s well-being. This category includes concerns over wages, hours, benefits, promotions, etc. Examples include wage and hour issues and employee relations.
Terminology Case Outcome: Case outcome refers to the overall outcome of the entire case—for example, if an investigation was warranted and if corrective action was taken. Case Disposition: Refers to the final outcome for a case, for example, whether an employee who was alleged to have committed a wrongdoing was cleared or terminated. Reporting Mechanisms: Reporting mechanisms are ways in which an individual can report an issue or concern within the organization. These include phone calls, Web forms, e-mails, written letters or conversations with managers and others, including ethics or compliance officers, human resources executives, Ombudsmen or other executives. Hotline vs. Helpline: Some organizations have adopted the term “helpline” due to its more positive perception or the fact that employees can use the process to ask questions about ethical issues. In this report, the terms hotline and helpline are used interchangeably. Hotline Report: A hotline report refers to the actual report received from the hotline. Once an organization begins to investigate a report, it becomes a case. Incident Category: The classification of the allegations reported through the hotline. Participants: Participants are those individuals that file the actual report. Participants can be current employees, ex-employees, vendors, a member of the general public or any other stakeholder.
.
56.2007 CORPORATE GOVERNANCE AND COMPLIANCE HOTLINE BENCHMARKING REPORT . ©2007 Security Executive Council. All Rights Reserved.
ABOUT THE SECURITY EXECUTIVE COUNCIL The Security Executive Council (www.securityexecutivecouncil.com) is an international membership organization for leading senior security executives spanning all industries, both the public and private sectors, and the globe. The Council uses professional staff and a distinguished faculty of former CSOs and content experts to develop strategic security leadership services and products for the entire membership based on member requirements. Members are involved in projects only to the extent they desire to be. The Council's vision is to deliver innovative solutions to members that are unavailable from any other source. ACKNOWLEDGMENTS Robbie Friedmann, PhD, Distinguished Chair of Public Safety Partnerships, Georgia State University Bob Hayes, CSO & Managing Director, Security Executive Council Greg Kane, Director IT and Product Technology, Security Executive Council Kathleen Kotwica, PhD, VP Research and Product Development, Security Executive Council For more information about this benchmarking report, please call +1 202.730.9981 or e-mail [email protected]. The entire contents of this report are copyrighted. Reprint or use of any portion of this report without explicit written permission is prohibited. For reprint information, please contact the Security Executive Council. RELATED RESOURCES for Corporate Governance and Compliance Programs and Professionals (available for sale at www.securityexecutivecouncil.com/secstore) Security Careers – Defining Jobs, Compensation, Qualifications – by Jerry Brennan and Steve Walker Measures and Metrics in Corporate Security – Communicating Business Value – by George K. Campbell The Business Conduct & Compliance Response to Misconduct Allegations – Guidelines for Successful Investigations in Organizations – by John D. Thompson, Esq. Unified Risk Oversight is a trademark of the Security Executive Council. ©2007 Security Executive Council. All Rights Reserved. For more information about this benchmarking

.
2007 CORPORATE GOVERNANCE AND COMPLIANCE HOTLINE BENCHMARKING REPORT . ©2007 Security Executive Council. All Rights Reserved.
For more information about this benchmarking report, please call +1 202.730.9981 or e-mail [email protected]. The entire contents of this report are copyrighted. Reprint or use of any portion of this report without explicit written permission is prohibited. For reprint information, please contact the Security Executive Council.


