16
2007 State of the Watershed Barr Lake & Milton Reservoir Watershed Association Q & A
| Date post: | 26-Dec-2015 |
| Category: |
Documents |
| Upload: | trevor-harper |
| View: | 218 times |
| Download: | 2 times |
2007 State of the Watershed
Barr Lake & Milton Reservoir Watershed Association
Q & A
Littleton
Englewood
Lakewood
Wheat Ridge
Arvada
Westminster
Northglenn
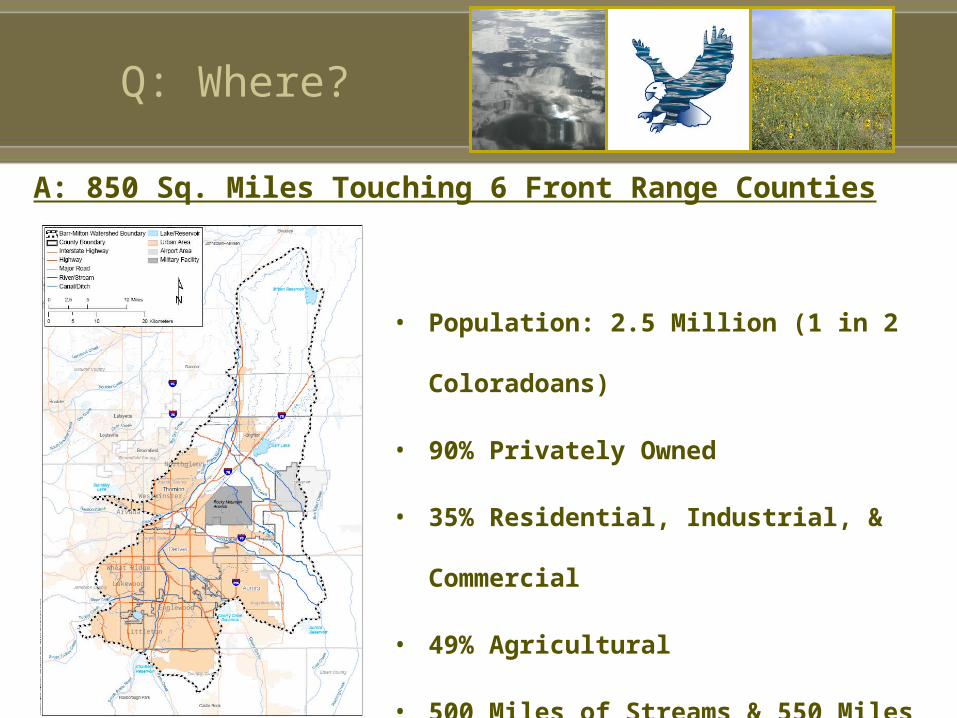
Q: Where?
A: 850 Sq. Miles Touching 6 Front Range Counties
• Population: 2.5 Million (1 in 2 Coloradoans)
• 90% Privately Owned
• 35% Residential, Industrial, & Commercial
• 49% Agricultural
• 500 Miles of Streams & 550 Miles of Canals
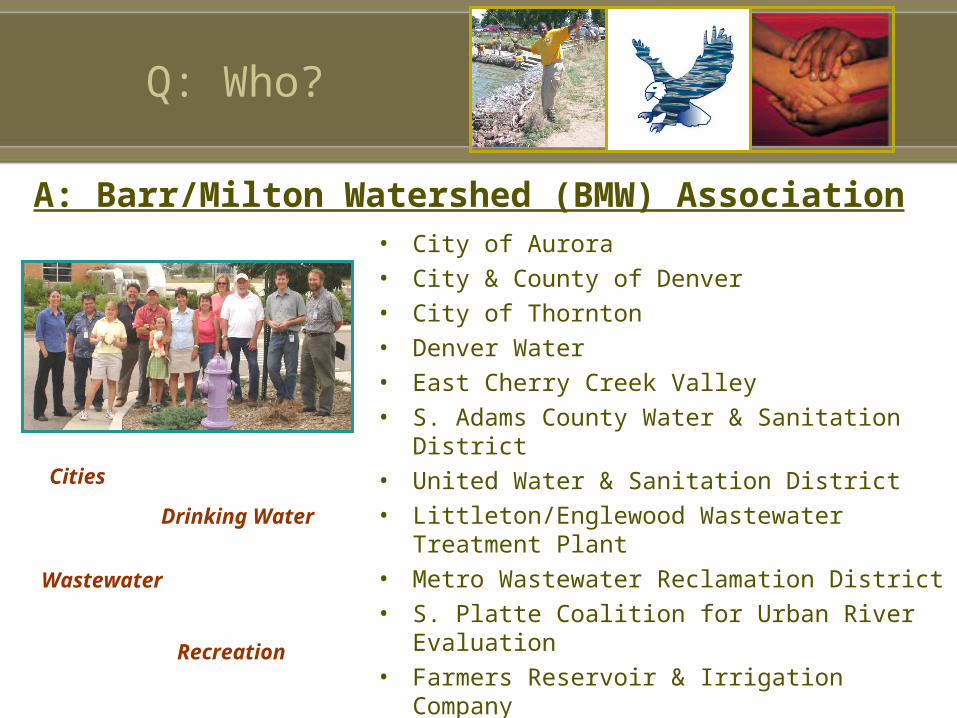
Q: Who?
A: Barr/Milton Watershed (BMW) Association• City of Aurora
• City & County of Denver
• City of Thornton
• Denver Water
• East Cherry Creek Valley
• S. Adams County Water & Sanitation District
• United Water & Sanitation District
• Littleton/Englewood Wastewater Treatment Plant
• Metro Wastewater Reclamation District
• S. Platte Coalition for Urban River Evaluation
• Farmers Reservoir & Irrigation Company
• Barr Lake State Park
• Pelican Lake Ranch Development
• Potentially Another 2,449,987 Residents
Cities
Drinking Water
Wastewater
Recreation
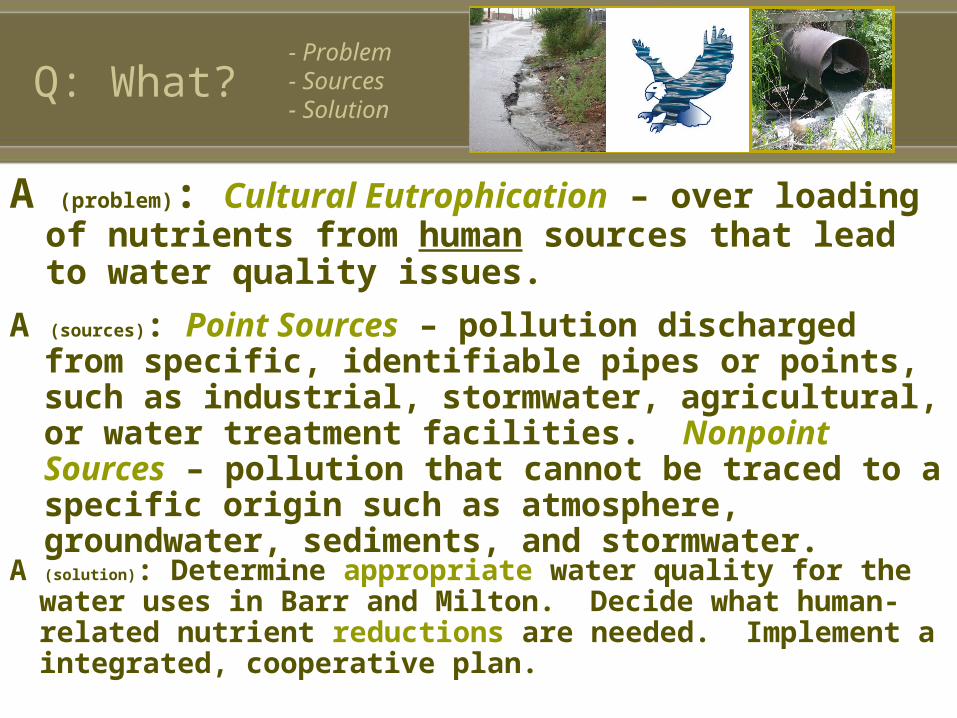
Q: What?
A (problem): Cultural Eutrophication – over loading of nutrients from human sources that lead to water quality issues.
- Problem- Sources- Solution
A (solution): Determine appropriate water quality for the water uses in Barr and Milton. Decide what human-related nutrient reductions are needed. Implement a integrated, cooperative plan.
A (sources): Point Sources – pollution discharged from specific, identifiable pipes or points, such as industrial, stormwater, agricultural, or water treatment facilities. Nonpoint Sources – pollution that cannot be traced to a specific origin such as atmosphere, groundwater, sediments, and stormwater.
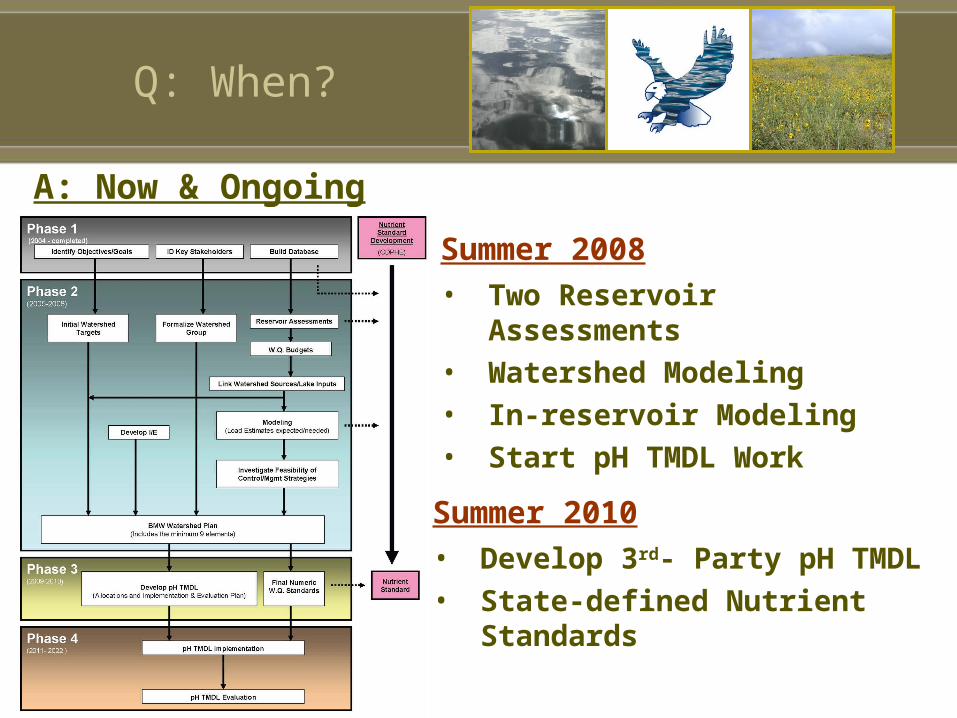
Q: When?
A: Now & Ongoing
• Two Reservoir Assessments
• Watershed Modeling
• In-reservoir Modeling
• Start pH TMDL Work
Summer 2008
Summer 2010• Develop 3rd- Party pH TMDL
• State-defined Nutrient Standards
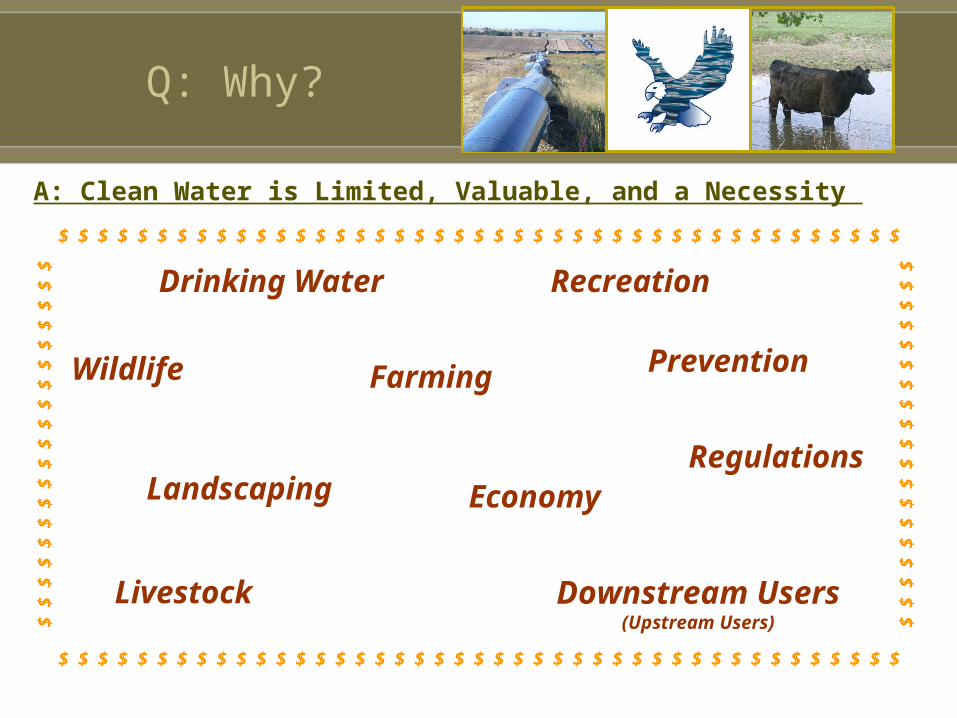
Q: Why?
A: Clean Water is Limited, Valuable, and a Necessity
Drinking Water
Wildlife Farming
Recreation
EconomyLandscaping
Livestock Downstream Users(Upstream Users)
Prevention
Regulations
$ $ $ $ $ $ $ $ $ $ $ $ $ $ $ $ $ $ $ $ $ $ $ $ $ $ $ $ $ $ $ $ $ $ $ $ $ $ $ $ $ $ $
$ $ $ $ $ $ $ $ $ $ $ $ $ $ $ $ $ $ $ $ $ $ $ $ $ $ $ $ $ $ $ $ $ $ $ $ $ $ $ $ $ $ $
$
$ $
$
$
$ $
$
$
$ $
$
$
$
$ $
$
$
$
$
$ $
$
$
$ $
$
$
$ $
$
$
$
$ $
$
$
$
Examples
Examples
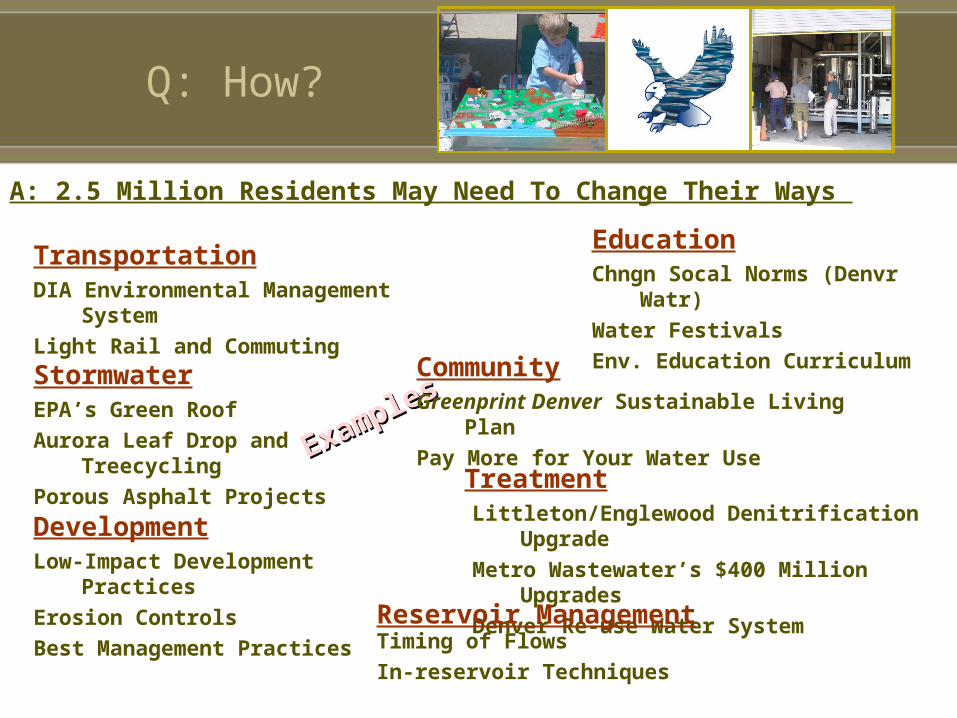
Q: How?
A: 2.5 Million Residents May Need To Change Their Ways
DIA Environmental Management System
Light Rail and Commuting
Transportation
StormwaterEPA’s Green Roof
Aurora Leaf Drop and Treecycling
Porous Asphalt Projects TreatmentLittleton/Englewood Denitrification Upgrade
Metro Wastewater’s $400 Million Upgrades
Denver Re-use Water System
CommunityGreenprint Denver Sustainable Living Plan
Pay More for Your Water Use
DevelopmentLow-Impact Development Practices
Erosion Controls
Best Management Practices
EducationChngn Socal Norms (Denvr Watr)
Water Festivals
Env. Education Curriculum
Reservoir ManagementTiming of Flows
In-reservoir Techniques
Symptoms
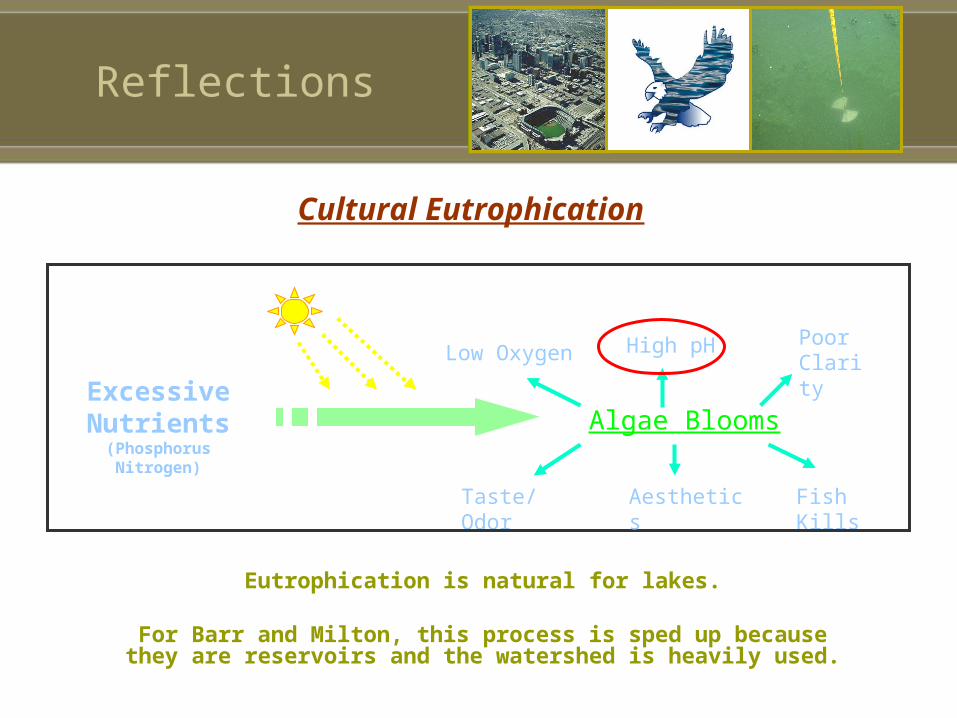
ExcessiveNutrients
(PhosphorusNitrogen)
Algae Blooms
Low Oxygen High pH
Fish Kills
PoorClarity
Taste/Odor Aesthetics
Problem
Cultural Eutrophication
Reflections
Eutrophication is natural for lakes.
For Barr and Milton, this process is sped up because they are reservoirs and the watershed is heavily used.

Barr Lake
Phosphorus Story
Milton Reservoir
Barr Lake Total Phosphorus Trend (2002-2007)
0.0
0.1
0.2
0.3
0.4
0.5
0.6
0.7
0.8
0.9
2002 2003 2004 2005 2006 2007
Av
era
ge
To
tal
Ph
os
ph
oru
s
Co
nce
ntr
ati
on
(p
pm
)
Annual
Jun-Sep
Milton Reservoir Total Phosphorus Trend (2002 - 2007)
0.0
0.1
0.2
0.3
0.4
0.5
0.6
0.7
0.8
0.9
2002 2003 2004 2005 2006 2007
Av
era
ge
To
tal
Ph
os
ph
oru
s C
on
cen
tra
tio
n (
pp
m)
Annual
Jun-Sep
Reflections

Barr Lake
Chlorophyll-a Story
Milton Reservoir Milton Reservoir Chlorophyll-a Trend (2002 - 2007)
0
20
40
60
80
100
120
140
2002 2003 2004 2005 2006 2007
Av
era
ge
Ch
loro
ph
yll-
a C
on
cen
trat
ion
(p
pb
)
Annual
Jun-Sep
Reflections
Barr Lake Chlorophyll-a Trend (2002 - 2007)
0
20
40
60
80
100
120
140
2002 2003 2004 2005 2006 2007
Av
era
ge
Ch
loro
ph
yll
-a
Co
nc
en
tra
tio
n (
pp
b)
Annual
Jun-Sep
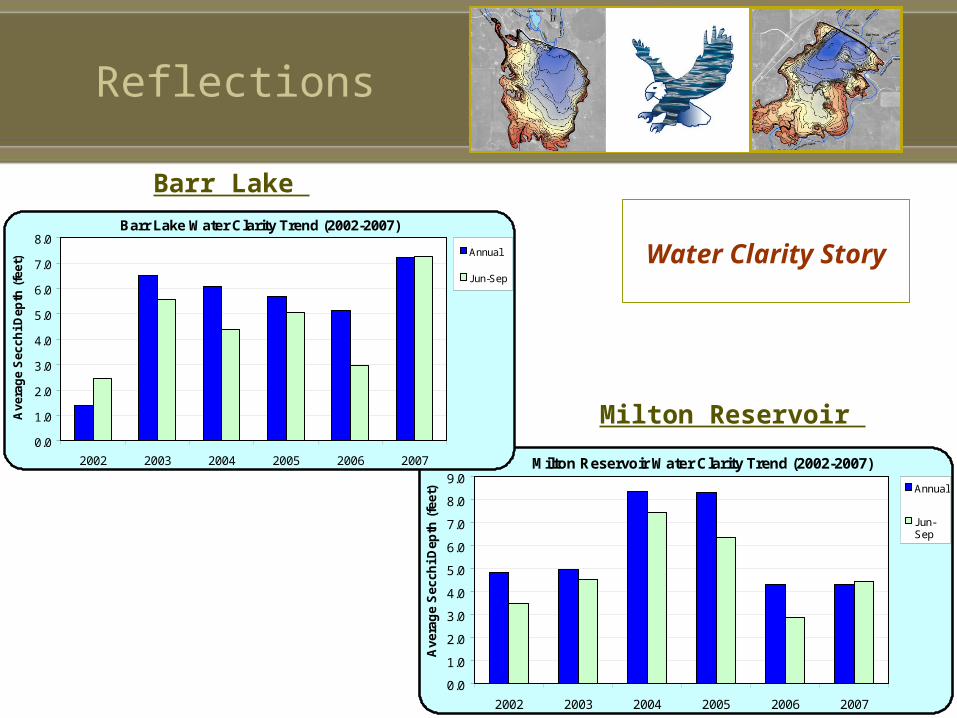
Barr Lake
Water Clarity Story
Milton Reservoir Milton Reservoir Water Clarity Trend (2002-2007)
0.0
1.0
2.0
3.0
4.0
5.0
6.0
7.0
8.0
9.0
2002 2003 2004 2005 2006 2007
Av
era
ge
Se
cc
hi
De
pth
(fe
et) Annual
Jun-Sep
Barr Lake Water Clarity Trend (2002-2007)
0.0
1.0
2.0
3.0
4.0
5.0
6.0
7.0
8.0
2002 2003 2004 2005 2006 2007
Av
erag
e S
ecc
hi D
epth
(fe
et)
Annual
Jun-Sep
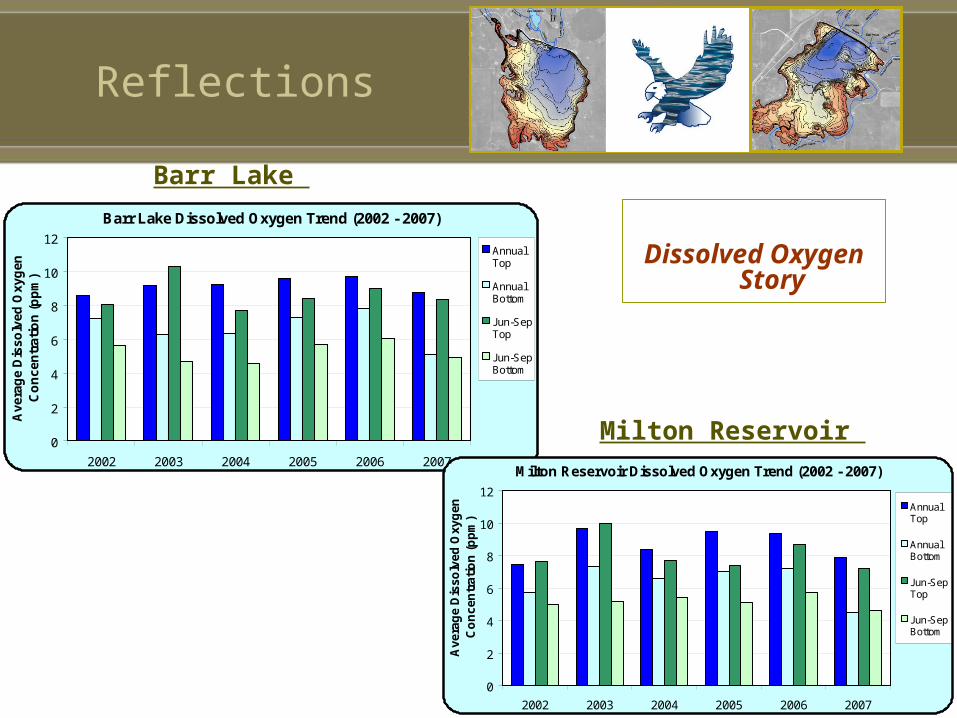
Reflections
Reflections
Barr Lake
Dissolved Oxygen Story
Milton Reservoir
Barr Lake Dissolved Oxygen Trend (2002 - 2007)
0
2
4
6
8
10
12
2002 2003 2004 2005 2006 2007
Av
era
ge
Dis
so
lve
d O
xy
ge
n
Co
nc
en
tra
tio
n (
pp
m)
AnnualTop
AnnualBottom
Jun-SepTop
Jun-SepBottom
Milton Reservoir Dissolved Oxygen Trend (2002 - 2007)
0
2
4
6
8
10
12
2002 2003 2004 2005 2006 2007
Ave
rag
e D
iss
olv
ed O
xyg
en
Co
nce
ntr
ati
on
(p
pm
)
AnnualTop
AnnualBottom
Jun-SepTop
Jun-SepBottom
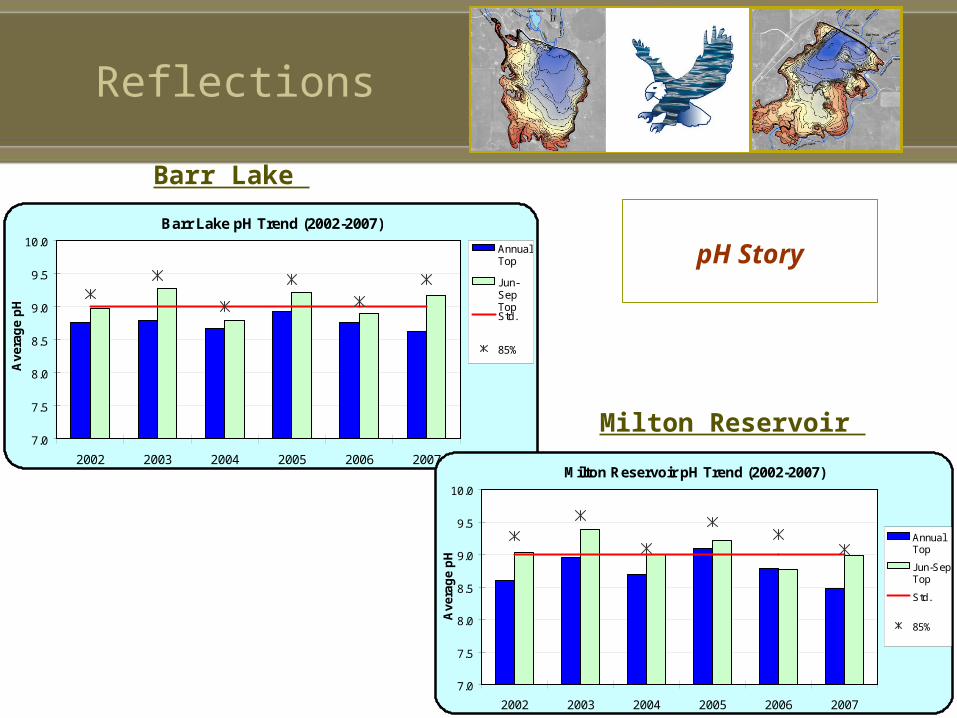
Reflections
Barr Lake
pH StoryBarr Lake pH Trend (2002-2007)
7.0
7.5
8.0
8.5
9.0
9.5
10.0
2002 2003 2004 2005 2006 2007
Av
era
ge
pH
AnnualTop
Jun-SepTopStd.
85%
Milton Reservoir Milton Reservoir pH Trend (2002-2007)
7.0
7.5
8.0
8.5
9.0
9.5
10.0
2002 2003 2004 2005 2006 2007
Av
era
ge
pH
AnnualTop
Jun-SepTop
Std.
85%
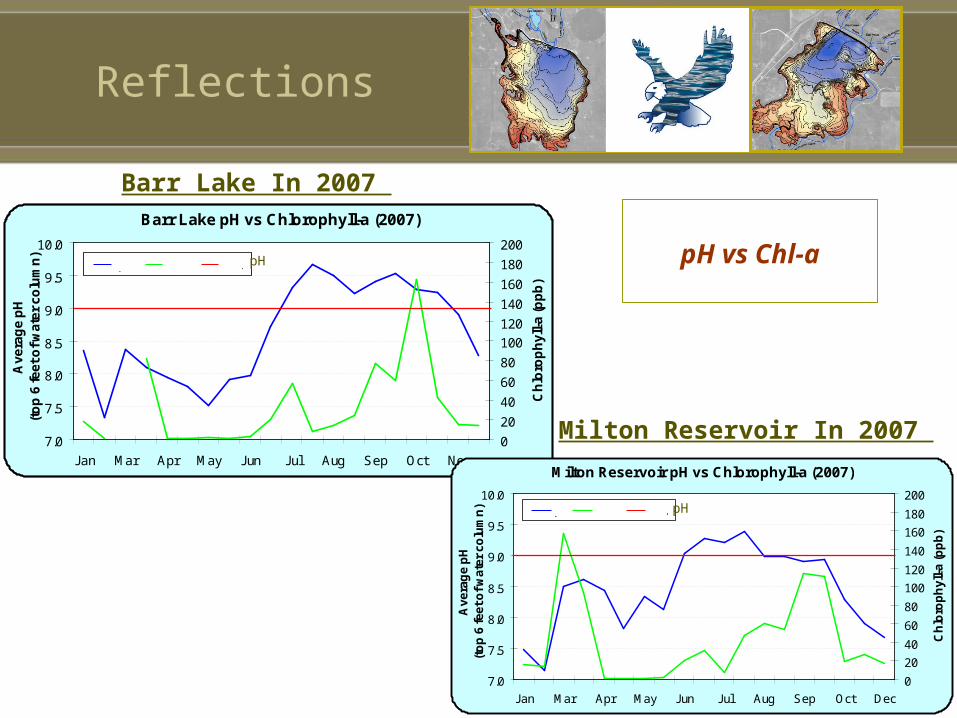
Reflections
Barr Lake In 2007
pH vs Chl-a
Milton Reservoir In 2007
Barr Lake pH vs Chlorophyll-a (2007)
7.0
7.5
8.0
8.5
9.0
9.5
10.0
Jan Mar Apr May Jun Jul Aug Sep Oct Nov
Av
era
ge
pH
(t
op
6 f
ee
t o
f w
ate
r c
olu
mn
)
0
20
40
60
80
100
120
140
160
180
200
Ch
loro
ph
yll-
a (
pp
b)
pH Chl-a pH Chl-a Std. pH
Milton Reservoir pH vs Chlorophyll-a (2007)
7.0
7.5
8.0
8.5
9.0
9.5
10.0
Jan Mar Apr May Jun Jul Aug Sep Oct Dec
Av
era
ge
pH
(t
op
6 f
ee
t o
f w
ate
r c
olu
mn
)
0
20
40
60
80
100
120
140
160
180
200
Ch
loro
ph
yll-
a (
pp
b)
pH Chl-a pH Chl-a Std. pH

Join BMW Association Value Water More Use Less Products With Phosphorus Subtle Management Changes Pick Up Pet Waste Direct Gutters Away From Streets Pick Up Litter Compost Conserve Water Avoid Soil Erosion Keep Chemicals and Debris From Storm Drains Stop Oil Leaks on Your Vehicles Learn Where Your Water Comes From and Where It Goes
Small Acts,Large Results
Join BMW Association - $25 Suggested Annual Fee
Join a CommitteeTechnical: 4th Thursday, 10:00am
Budget: 4 times a Year
Information/Education: 3rd Thursday, 1:30pm
Watershed Plan: 2nd Thursday
Get Involved
www.barr-milton.org
Contact InfoDarcie Garland-Renn303-404-2944 ext. 22


