Verdú M, Pausas JG, Segarra-Moragues JG, Ojeda F. 2007. Burning phylogenies: fire, molecular evolutionary rates and diversification. Evolution 61 (9): 2195-2204.
20
ORIGINAL ARTICLE doi:10.1111/j.1558-5646.2007.00187.x BURNING PHYLOGENIES: FIRE, MOLECULAR EVOLUTIONARY RATES, AND DIVERSIFICATION Miguel Verd ´ u, 1,2 Juli G. Pausas, 3,4 Jos ´ e Gabriel Segarra-Moragues, 1,5 and Fernando Ojeda 6,7 1 Centro de Investigaciones sobre Desertificaci ´ on (CSIC-UV-GV), Apdo Oficial, 46470 Albal (Valencia), Spain 2 E-mail: [email protected]3 Centro de Estudios Ambientales del Mediterr ´ aneo (CEAM), C/ Charles R. Darwin 14, Parc Tecnol ` ogic, 46980 Paterna, Valencia, Spain and Departament d’Ecologia, Universitat d’Alacant, Apartat Correus 99, 03080, Alacant, Spain 4 E-mail: [email protected]; [email protected]5 E-mail: [email protected]6 Departamento de Biologia, Universidad de C ´ adiz, Campus Rio San Pedro, 11510 Puerto Real, Spain 7 E-mail: [email protected]Received March 12, 2007 Accepted May 21, 2007 Mediterranean-type ecosystems are among the most remarkable plant biodiversity “hot spots” on the earth, and fire has tradi- tionally been invoked as one of the evolutionary forces explaining this exceptional diversity. In these ecosystems, adult plants of some species are able to survive after fire (resprouters), whereas in other species fire kills the adults and populations are only maintained by an effective post-fire recruitment (seeders). Seeders tend to have shorter generation times than resprouters, particularly under short fire return intervals, thus potentially increasing their molecular evolutionary rates and, ultimately, their diversification. We explored whether seeder lineages actually have higher rates of molecular evolution and diversification than resprouters. Molecular evolutionary rates in different DNA regions were compared in 45 phylogenetically paired congeneric taxa from fire-prone Mediterranean-type ecosystems with contrasting seeder and resprouter life histories. Differential diversification was analyzed with both topological and chronological approaches in five genera (Banksia, Daviesia, Lachnaea, Leucadendron, and Thamnochortus) from two fire-prone regions (Australia and South Africa). We found that seeders had neither higher molecular rates nor higher diversification than resprouters. Such lack of differences in molecular rates between seeders and resprouters— which did not agree with theoretical predictions—may occur if (1) the timing of the switch from seeding to resprouting (or vice versa) occurs near the branch tip, so that most of the branch length evolves under the opposite life-history form; (2) resprouters suffer more somatic mutations and therefore counterbalancing the replication-induced mutations of seeders; and (3) the rate of mutations is not related to shorter generation times because plants do not undergo determinate germ-line replication. The absence of differential diversification is to be expected if seeders and resprouters do not differ from each other in their molecular evolu- tionary rate, which is the fuel for speciation. Although other factors such as the formation of isolated populations may trigger diversification, we can conclude that fire acting as a throttle for diversification is by no means the rule in fire-prone ecosystems KEY WORDS: Fire, genetic differentiation, resprouter, seeder, speciation. Why speciation occurs is a question of paramount importance in biology. The fact that species diversity is not constant ei- ther across lineages or across regions has attracted the attention of evolutionary biologists since Darwin’s (1859) seminal work. Diversification has traditionally been thought to be associated with the rate of molecular evolution (Laird et al. 1969; Barraclough and Savolainen 2001; Verd´ u 2002; Wright et al. 2006) although a lack of association has also been suggested when speciation is 2195 C 2007 The Author(s). Journal compilation C 2007 The Society for the Study of Evolution. Evolution 61-9: 2195–2204
Transcript
ORIGINAL ARTICLE
doi:10.1111/j.1558-5646.2007.00187.x
BURNING PHYLOGENIES: FIRE, MOLECULAREVOLUTIONARY RATES, AND DIVERSIFICATIONMiguel Verdu,1,2 Juli G. Pausas,3,4 Jose Gabriel Segarra-Moragues,1,5 and Fernando Ojeda6,7
1Centro de Investigaciones sobre Desertificacion (CSIC-UV-GV), Apdo Oficial, 46470 Albal (Valencia), Spain2E-mail: [email protected]
3Centro de Estudios Ambientales del Mediterraneo (CEAM), C/ Charles R. Darwin 14, Parc Tecnologic, 46980 Paterna,
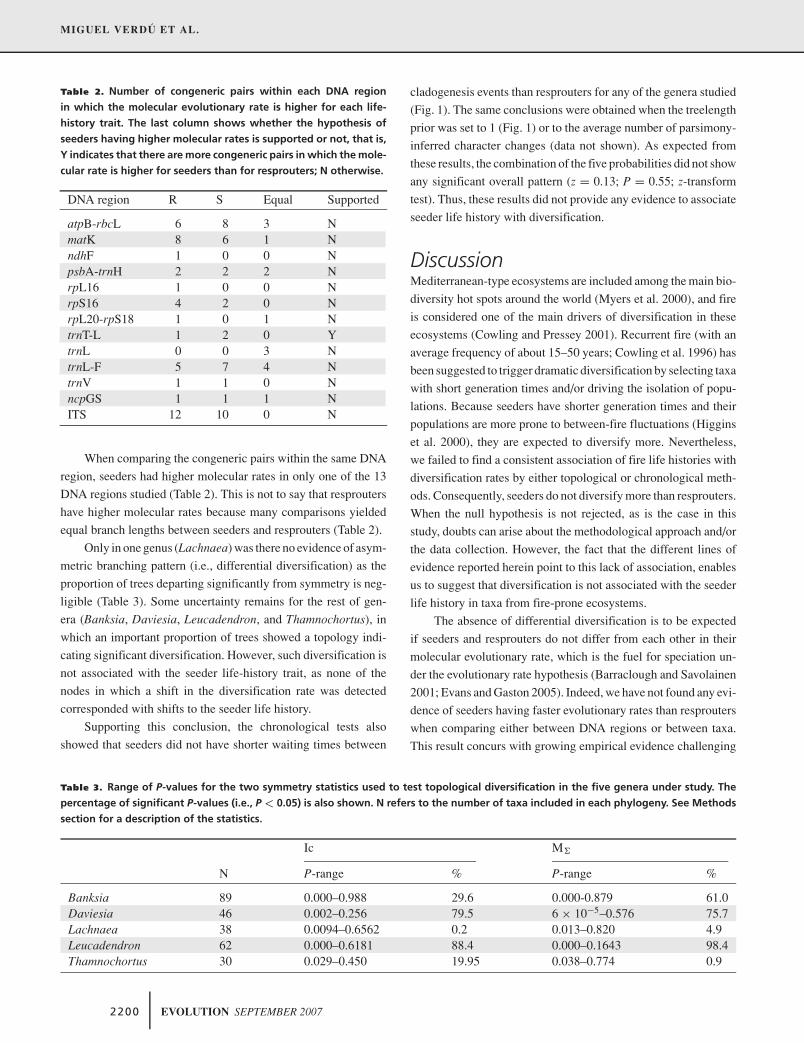
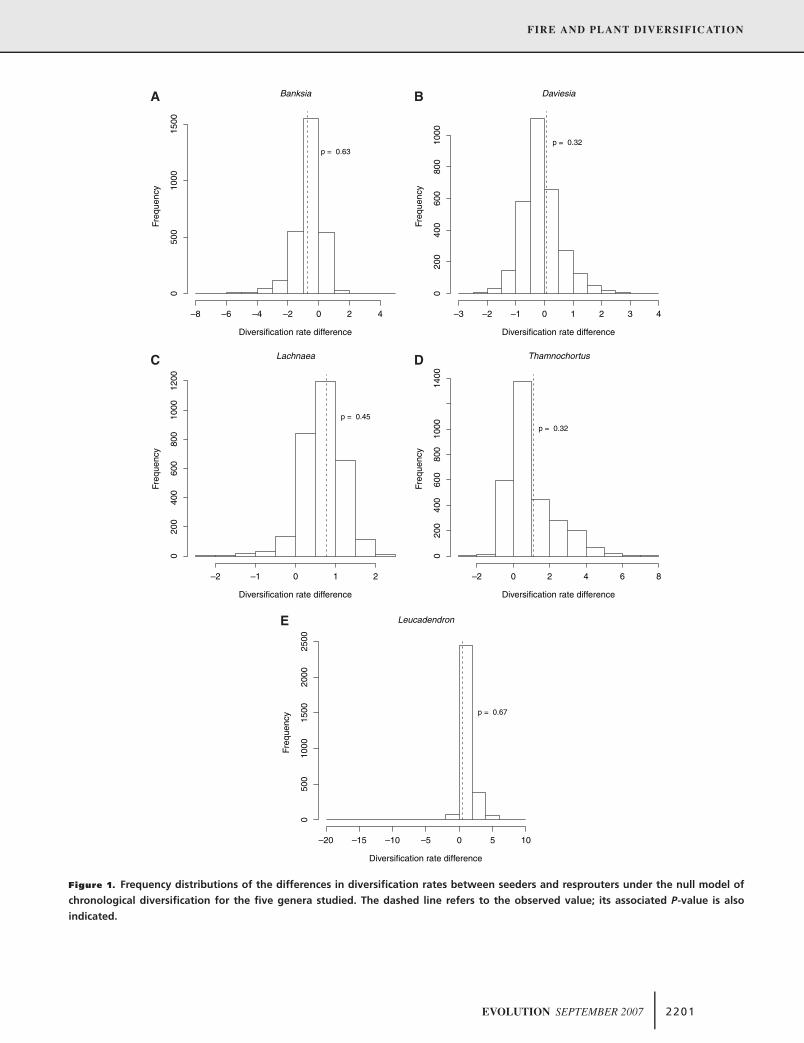
cladogenesis events than resprouters for any of the genera studied
(Fig. 1). The same conclusions were obtained when the treelength
prior was set to 1 (Fig. 1) or to the average number of parsimony-
inferred character changes (data not shown). As expected from
these results, the combination of the five probabilities did not show
any significant overall pattern (z = 0.13; P = 0.55; z-transform
test). Thus, these results did not provide any evidence to associate
seeder life history with diversification.
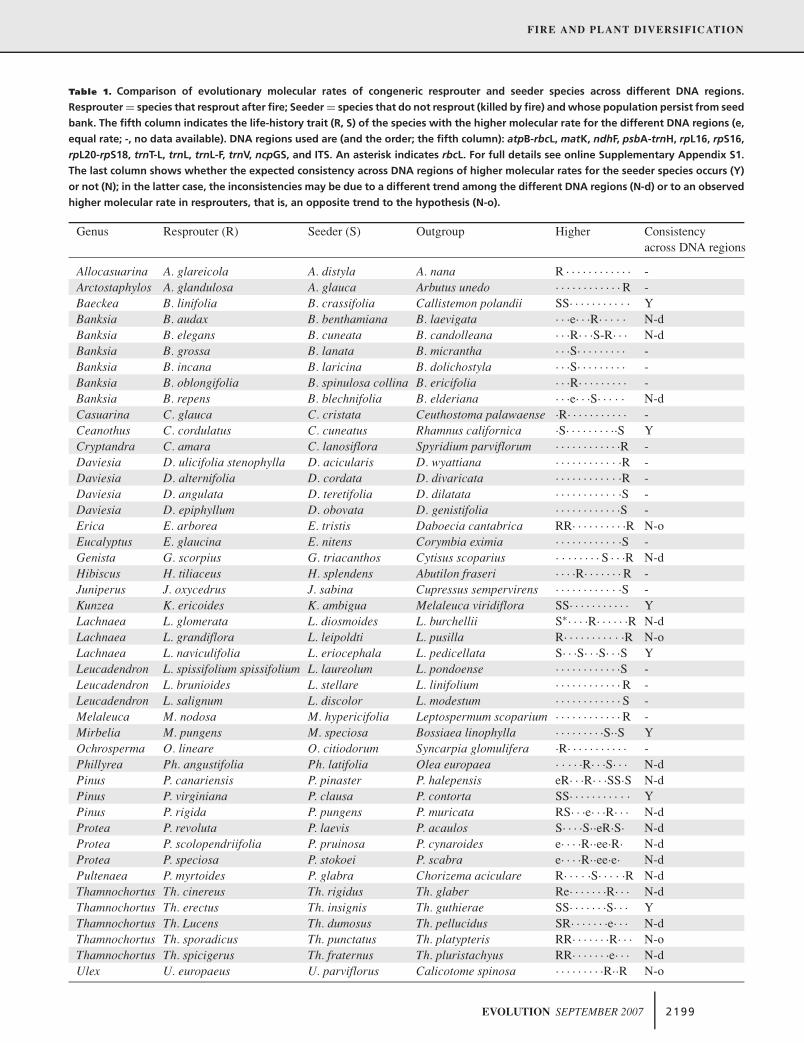
DiscussionMediterranean-type ecosystems are included among the main bio-
diversity hot spots around the world (Myers et al. 2000), and fire
is considered one of the main drivers of diversification in these
ecosystems (Cowling and Pressey 2001). Recurrent fire (with an
average frequency of about 15–50 years; Cowling et al. 1996) has
been suggested to trigger dramatic diversification by selecting taxa
with short generation times and/or driving the isolation of popu-
lations. Because seeders have shorter generation times and their
populations are more prone to between-fire fluctuations (Higgins
et al. 2000), they are expected to diversify more. Nevertheless,
we failed to find a consistent association of fire life histories with
diversification rates by either topological or chronological meth-
ods. Consequently, seeders do not diversify more than resprouters.
When the null hypothesis is not rejected, as is the case in this
study, doubts can arise about the methodological approach and/or
the data collection. However, the fact that the different lines of
evidence reported herein point to this lack of association, enables
us to suggest that diversification is not associated with the seeder
life history in taxa from fire-prone ecosystems.
The absence of differential diversification is to be expected
if seeders and resprouters do not differ from each other in their
molecular evolutionary rate, which is the fuel for speciation un-
der the evolutionary rate hypothesis (Barraclough and Savolainen
2001; Evans and Gaston 2005). Indeed, we have not found any evi-
dence of seeders having faster evolutionary rates than resprouters
when comparing either between DNA regions or between taxa.
This result concurs with growing empirical evidence challenging
2200 EVOLUTION SEPTEMBER 2007
FIRE AND PLANT DIVERSIFICATION
Diversification rate difference
Freq
uenc
y
–8 –6 –4 –2 0 2 4
050
010
0015
00
Banksia
p = 0.63
Diversification rate difference
Freq
uenc
y
–3 –2 –1 0 1 2 3 4
020
040
060
080
010
00
Daviesia
p = 0.32
Diversification rate difference
Freq
uenc
y
–2 –1 0 1 2
020
040
060
080
010
0012
00
Lachnaea
p = 0.45
Diversification rate difference
Freq
uenc
y
–2 0 2 4 6 8
020
040
060
080
010
0014
00
Thamnochortus
p = 0.32
Diversification rate difference
Freq
uenc
y
–20 –15 –10 –5 0 5 10
050
010
0015
0020
0025
00
Leucadendron
p = 0.67
A B
C D
E
Figure 1. Frequency distributions of the differences in diversification rates between seeders and resprouters under the null model of
chronological diversification for the five genera studied. The dashed line refers to the observed value; its associated P-value is also
indicated.
EVOLUTION SEPTEMBER 2007 2201
MIGUEL VERDU ET AL.
the generation-time hypothesis in plants (Bousquet et al. 1992;
Whittle and Johnson 2003, but see Catalan et al. 2006). Three
different explanations could address the lack of differences in
evolutionary rates between the two life-history strategies.
First, differences in evolutionary rates within a seeder–
resprouter species pair may be masked if the timing of the switch
from seeding to resprouting (or vice versa) occurs near the branch
tip, so that most of the branch length evolves under the oppo-
site life-history form (Whittle and Johnson 2003). An indication
that recent switches are possible is the existence of species with
both seeder and resprouter populations (e.g., Banksia marginata,
George 1996; Aspalathus linearis, van der Bank et al. 1999;
Ceanothus tomentosus, Schwik and Ackerly 2005; several south-
ern African Erica species, Verdaguer and Ojeda 1998). However,
such species are rare in nature. Second, in recurrently burned
ecosystems, somatic mutations in resprouters might counterbal-
ance the replication-induced mutations in seeders (Lamont and
Wiens 2003), although empirical evidence to support this hy-
pothesis is scarce. Third, the relationship between mutations and
generation time in plants is unclear because plants do not un-
dergo determinate germ-line replication (Gaut et al. 1996, 1997;
Whittle and Johnson 2003).
Speciation may not be limited only by molecular evolu-
tionary rates; it may also be influenced by other factors such
as the formation of isolated populations (Ohta 1993; Bromham
and Cardillo 2003) and/or strong reductions in genetic variability
within fluctuating populations (Ellner and Hairston 1994; Engen
et al. 2005). Such fluctuations and concomitant genetic erosion
are more marked in organisms with nonoverlapping generations
(Ellner and Hairston 1994; Waples 2002), such as seeder plant
species from fire-prone environments (Bond and van Wilgen 1996;
Ojeda et al. 2005), thus making them more prone to genetic drift
and differentiation processes (Wade and McCauley 1988). How-
ever, these diversifying seeder populations or potentially “incipi-
ent species” (sensu Levin 2000) are also more prone to extinction,
because they do not store reproductive potential over generations
(Higgins et al. 2000; Ojeda et al. 2005; see Warner and Chesson
1985 for a general overview). This counteracting higher extinc-
tion would then account for the seeming lack of overall diversifi-
cation in seeder lineages from the fire-prone, Mediterranean-type
ecosystems reported in this study. Although this possibility de-
serves further investigation, we can conclude that fire acting as
a throttle for diversification is by no means the rule in fire-prone
ecosystems.
ACKNOWLEDGMENTSWe thank R. Ree and B. R. Moore for their advice on the KIT and Sym-meTREE softwares and H. Dopazo for helping with the Phylemon server.B. Lamont provided fire-trait information on some Banksia species. Wealso thank T. Barraclough, P. Catalan, S. Gonzalez-Martınez, B. Lamont,J. Pannell, X. Pico, and R. Ree for helpful comments on the manuscript.
This work has been partially financed by the PERSIST project (CGL2006-07126/BOS) to JGP and by a research grant attached to a “Ramon y Cajal”contract to FO. JGS-M was granted a contract from the I3P program.
LITERATURE CITEDBarker, N. P., A. Vanderpoorten, C. M. Morton, and J. P. Rourke. 2004. Phy-
logeny, biogeography, and the evolution of life-history traits in Leuca-dendron (Proteaceae). Mol. Phyl. Evol. 33:845–860.
Barraclough, T. G. 2006. What can phylogenetics tell us about speciation inthe Cape flora? Diver. Dist. 12:21–26.
Barraclough, T. G., and V. Savolainen. 2001. Evolutionary rates and speciesdiversity in flowering plants. Evolution 55:677–683.
Bell, T. L., and J. S. Pate. 1996. Growth and fire response of selectedEpacridaceae of south-western Australia. Aust. J. Bot. 44:509–526.
Beyers, J. B. P. 2001. The Cape genus Lachnaea (Thymelaeaceae): a mono-graph. Strelitzia 11:1–115.
Bond, W. J., and B. W. Van Wilgen. 1996. Fire and Plants, Chapman & Hall,London.
Bond, W. J., and J. J. Midgley. 2003. The evolutionary ecology of sproutingin woody plants Int. J. Plant Sci. 164:S103–S114.
Broham, L., and M. Cardillo. 2003. Testing the link between the latitudinalgradient in species richness and rates of molecular evolution. J. Evol.Biol.16: 200–207.
Bousquet, J., S. H. Strauss, A. H. Doerksen, and R. A. Price. 1992. Extensivevariation in evolutionary rate of rcbL gene sequences among seed plants.Proc. Natl Acad. Sci. USA 89:7844–7848.
Catalan, P., P. Torrecilla, J. A. Lopez-Rodrıguez, and J. Muller. 2006. Molec-ular evolutionary rates shed new lights on the relationships of Festuca,Lolium, Vulpia and related grasses (Loliinae, Pooideae, Poaceae). Pp.45–70. in J. P. Bailey and R. G. Ellis, eds. Current taxonomic researchon the British & European Flora. Botanical Society of the British Isles.Conference report no. 25. London.
Chan, K. M. A., and B. R Moore. 2002. Whole-tree methods for detectingdifferential diversification rates. Syst. Biol. 51:855–865.
Clark, J. S. 1991. Disturbance and tree life history on the shifting mosaiclandscape. Ecology 72:1102–1118.
Colless, D. H. 1982. Review of phylogenetics: the theory and practice ofphylogenetic systematics. Syst. Zool. 31:100–104.
Cowling, R. M., and R. L. Pressey. 2001. Rapid plant diversification: planningfor an evolutionary future. Proc. Natl Acad. Sci. USA 98:5452–5457.
Cowling, R. M., P. W. Rundel, B. B. Lamont, M. K. Arroyo, and M. Arianotsou.1996. Plant diversity in Mediterranean-climate regions. Trends Ecol.Evol. 11:362–366.
Cowling, R. M., F. Ojeda, B. B. Lamont, P. W. Rundel, and R. Lechmere-Oertel. 2005. Rainfall reliability, a neglected factor in explaining conver-gence and divergence of plant traits in fire-prone Mediterranean-climateecosystems. Global Ecol. Biogeogr. 14:509–519.
Coyne, J. A. 1994. Ernst Mayr and the origin of species. Evolution 48:19–30.Crisp, M. D., and L. G. Cook. 2003. Phylogeny and evolution of anomalous
roots in Daviesia (Fabaceae: Mirbelieae). Int. J. Plant Sci. 164:603–612.Crisp, M., L. Cook, and D. Steane. 2004. Radiation of the Australian flora:
what can comparisons of molecular phylogenies across multiple taxa tellus about the evolution of diversity in present-day communities? Philos.Trans. R. Soc. Lond. B 359:1551–1571.
Darwin, C. 1859. The origin of species by means of natural selection. JohnMurray, London.
Ellner, S., and N. G. Hairston Jr. 1994. Role of overlapping generations inmaintaining genetic variation in a fluctuating environment. Am. Nat.143:403–417.
2202 EVOLUTION SEPTEMBER 2007
FIRE AND PLANT DIVERSIFICATION
Engen, S., R. Lande, and B. E. Saether. 2005. Effective size of a fluctuatingage-structured population. Genetics 170:941–954.
Evans, K. L., and K. J. Gaston. 2005. Can the evolutionary-rates hy-pothesis explain species-energy relationships? Funct. Ecol. 19:899–915.
Felsenstein, J. 2004. Inferring phylogenies. Sinauer Associates, Sunderland,MA.
Gaut, B., B. R. Morton, B. C. McCaig, and M. T. Clegg. 1996. Substitution ratecomparisons between grasses and palms: synonymous rate differencesat the nuclear gene Adh parallel rate differences at the plastid gene rbcL.Proc. Natl. Acad. Sci. USA 93:10274–10279.
Gaut, B. S., L. G. Clark, J. F. Wendel, and S. V. Muse. 1997. Comparisons ofthe molecular evolutionary process at rbcL and ndhF in the grass family(Poaceae). Mol. Biol. Evol. 14:769–777.
George, A. S. 1996. The Banksia book. Kangaroo Press, Kenthurst, NSW,Australia. 240 p.
Hardig, T. M., P. S. Soltis, and D. E. Soltis 2000 Diversification of the NorthAmerican shrub genus Ceanothus (Rhamnaceae): conflicting phyloge-nies from nuclear ribosomal DNA and chloroplast DNA. Am. J. Bot.87:108–123.
Hardy, C. R., and H. P. Linder. 2005. Intraspecific variability and timing inancestral ecology reconstruction: a test case from the Cape flora. Syst.Biol. 54:299–316.
Heard, S. B. 1992. Patterns in tree balance among cladistic, phenetic,and randomly generated phylogenetic trees. Evolution 46:1818–1826.
Higgins, S. I., Pickett, S. T. A., and Bond, W. J. 2000. Predicting extinction risksfor plants: environmental stochasticity can save declining populations.Trends Ecol. Evol. 15:516–520.
Huelsenbeck, J. P. and F. Ronquist. 2001. MrBayes: Bayesian inference ofphylogeny. Bioinformatics 17:754–755.
Keeley, J. E. 1995. Seed germination patterns in fire-prone Mediterranean-climate regions. Pp. 239–273 in M. T. K. Arroyo, P. H. Zedler and M.D. Fox, eds. Ecology and biogeography of Mediterranean ecosystems inChile, California and Australia. Springer, New York.
Keeley, J. E., and C. J. Fotheringham. 2000. Role of fire in regeneration fromseed. Pp 311–330 in M. Fenner, ed. The ecology of regeneration in plantcommunities. CAB International, Oxford.
Keeley, J. E., and P. H. Zedler. 1978. Reproduction of chaparral shrubs afterfire: a comparison of sprouting and seedling strategies. Am. Midl. Nat.99:142–161.
Kimura, M. 1980. A simple method for estimating evolutionary rates of basesubstitutions through comparative studies of nucleotide sequences. J.Mol. Evol. 16:l11–120.
Kosakovsky Pond, S. L., S. D. Frost, and S. V. Muse. 2005. HyPhy: hypothesistesting using phylogenies. Bioinformatics 21:676–679.
Laird, C. D., B. L. McConaught, and B. L. McCarthy. 1969. Rate of fixationof nucleotide substitutions in evolution. Nature 224:149–154.
Lamont, B. B., and D. Wiens. 2003. Are seed set and speciation rates alwayslow among species that resprout after fire, and why? Evol. Ecol. 17:277–292.
Le Maitre, D. C.. 1992. The relative advantages of seedling and sprouting infire-prone environments: a comparison of life histories of Protea neriifo-lia and P. nitida. Pp. 123–144 in B. W. Van Wilgen, D. M. Richardson, F.J. Kruger, and H. J. van Hensberge, eds. Fire in South African mountainfynbos. Springer-Verlag, Berlin, Germany.
Leslie, P. H. 1966. The intrinsic rate of increase and the overlap of successivegenerations in a population of guillemot (Uria aalge Pont). J. Anim. Ecol.35:291–301.
Levin, D. A. 2000. The origin, expansion, and demise of plant species. OxfordUniv. Press, New York.
Lewontin, R. C., and J. Krakauer. 1973. Distribution of gene frequency asa test of the theory of selective neutrality of polymorphism. Genetics74:175–195.
Linder, H. P. 2003. The radiation of the Cape flora, southern Africa. Biol. Rev.78:597–638.
Luikart, G., P. R. England, D. Tallmon, S. Jordon, and P. Taberlet. 2003. Thepower and promise of population genomics: from genotyping to genometyping. Nat. Rev. Genet. 4:981–994.
Maddison, W. P., and D. R. Maddison 2003. MacClade 4. Analysis of phy-logeny and character evolution. Sinauer Associates, Sunderland, MA.
Mast, A. R., and T. J. Givnish. 2002. Historical biogeography and the originof stomatal distributions in Banksia and Dryandra (Proteaceae) based ontheir cpDNA phylogeny. Am. J. Bot. 89:1311–1323.
Myers, N., R. A. Mittermeier, C. G. Mittermeier, G. A. B. da Fonseca, andJ. Kent. 2000. Biodiversity hotspots for conservation priorities. Nature403:853–858.
Munoz, M., and E. R. Fuentes. 1989. Does fire induce shrub germination inthe Chilean matorral? Oikos 56:177–181.
Muse, S. V., and B. S. Weir. 1992. Testing for equality of evolutionary rates.Genetics 132:269–276.
Muse, S. V., and B. S. Gaut. 1997. Comparing patterns of nucleotide substitu-tion rates among chloroplast loci using the relative ratio test. Genetics.146:393–399.
Nunney, L. 1993. The influence of mating system and overlapping generationson effective population size. Evolution 47:1329–1341.
Ohta, T. 1993. An examination of the generation-time effect on molecularevolution. Proc. Natl Acad. Sci. USA 90:10676–10680.
Ojeda, F. 1998. Biogeography of seeder and resprouter Erica species in theCape Floristic Region—Where are the resprouters? Biol. J. Linn. Soc.63:331–347.
Ojeda, F., F. G. Brun, and J. J. Vergara. 2005. Fire, rain, and the selection ofseeder and resprouter life-histories in fire-recruiting, woody plants. NewPhytol. 168:155–165.
Paradis, E. 2005. Statistical analysis of diversification with species traits. Evo-lution 59:1–12.
Paradis, E., J. Claude, and K. Strimmer 2004. APE: analyses of phylogeneticsand evolution in R language. Bionformatics 20:289–290.
Pausas, J. G. 1999a. Mediterranean vegetation dynamics: modelling problemsand functional types. Plant Ecol. 140:27–39.
———. 1999b. The response of plant functional types to changes in the fireregime in Mediterranean ecosystems. A simulation approach. J. Veg. Sci.10:717–722.
Pausas, J. G., and M. Verdu 2005. Plant persistence traits in fire-proneecosystems of the Mediterranean Basin: a phylogenetic approach. Oikos109:196–202.
Pausas, J. G., R. A. Bradstock, D. A. Keith, J. E. Keeley, and GCTE FireNetwork. 2004. Plant functional traits in relation to fire in crown-fireecosystems. Ecology 85:1085–1100.
Pausas, J. G., J. E. Keeley, and M. Verdu. 2006. Inferring differential evo-lutionary processes of plant persistence traits in Northern HemisphereMediterranean fire-prone ecosystems. J. Ecol. 94:31–39.
Posada, D., and K. A. Crandall 1998. Modeltest: testing the model of DNAsubstitution. Bioinformatics 14:817–818.
Rambaut, A. 1996. SE-AL: Sequence Alignment Editor. Available athttp://evolve.zoo. ox.ac.uk/software/index.html.
Ree, R. 2005. Detecting the historical signature of key innovations usingstochastic models of character evolution and cladogenesis. Evolution59:257–265.
Robinson, C. 2005. Molecular phylogenetics of Lachnaea (Thymelaeaceae):evidence from plastid and nuclear sequence data. PhD thesis. Universityof Johannesburg.
EVOLUTION SEPTEMBER 2007 2203
MIGUEL VERDU ET AL.
Sanderson, M. J. 1997. A nonparametric approach to estimating divergencetimes in the absence of rate constancy. Mol. Biol. Evol. 14:1218–1231.
Schwilk, D. W., and D. D. Ackerly. 2005. Is there a cost to resprouting?Seedling growth rate and drought tolerance in sprouting and nonsprout-ing Ceanothus (Rhamnaceae). Am. J. Bot. 92:404–410..
Tarraga, J., I. Medina, L. Arbiza, J. Huerta-Cepas, T. Gabaldon, J. Dopazo, andH. Dopazo. 2007. Phylemon: a suite of web tools for molecular evolution,phylogenetics and phylogenomics. Nucleic Acids Res. Advance Accesspublished on April 22, 2007. doi:10.1093/nar/gkm224
Thompson, J. D., T. J. Gibson, F. Plewniak, F. Jeanmougin, and D. G. Higgins.1997. The ClustalX windows interface: flexible strategies for multiplesequence alignment aided by quality analysis tools. Nucleic Acids Res.24:4876–4882.
Van Der Bank, M., F. H. van der Bank, and B. E. van Wyk. 1999. Evolutionof sprouting versus seeding in Aspalathus linearis. Plant Syst. Evol.219:27–38.
Verdaguer, D. and F. Ojeda 2005. Evolutionary transition from resprouterto seeder life history in two Erica (Ericaceae) species: insights fromseedling axillary buds Ann. Bot. 95:593–599..
Verboom, G. A., H. P. Linder, and W. D. Stock. 2003. Phylogenetics of thegrass genus Ehrharta: evidence for radiation in the summer-arid zone ofthe South African Cape. Evolution 57:1008–1021.
Verdu, M. 2000. Ecological and evolutionary differences between Mediter-ranean seeders and resprouters. J. Veg. Sci. 11:265–268.
———. 2002. Age at maturity and diversification in woody angiosperms.Evolution 56:1352–1361.
Wade, M. J., and D. E. McCauley. 1988. The effects of extinction and colo-nization on the genetic differentiation of populations. Evolution 42:995–1005.
Waples, R. S. 2002. Evaluating the effect of stage-specific survivorship on theNe/N ratio. Mol. Ecol. 11:1029–1037.
Warner, R. R., and P. L. Chesson. 1985. Coexistence mediated by recruitmentfluctuations: a field guide to the storage effect. Am. Nat. 125:769–787.
Wells, P. V. 1969. The relation between mode of regeneration and extent of spe-ciation in woody genera of the California chaparral. Evolution 23:264–267.
Whitlock, M. C. 2005. Combining probability from independent tests: theweighted Z-method is superior to Fisher’s approach. J. Evol. Biol.18:1368–1373.
Whittle, C.-A., and M. O. Johnston 2003 Broad-scale analysis contradicts thetheory that generation time affects molecular evolutionary rates in plants.J. Mol. Evol. 56:223–233.
Wright, S., J. Keeling, and L. Gillman. 2006. The road from Santa Rosalia: afaster tempo of evolution in tropical climates. Proc. Natl Acad. Sci. USA103:7718–7722.
Yule, G. U. 1924. A mathematical theory of evolution based on the conclusionsof Dr. JC Willis, FRS. Philos. Trans. R. Soc. Lond. B 213:21–87.
Zedler, P. H., C. R., Gautier, and G. S. McMaster.1983. Vegetation change inresponse to extreme events: the effect of a short interval between fires inCalifornia chaparral and coastal scrub. Ecology 64:809–818.
Associate Editor: D. Schoen
Supplementary MaterialThe following supplementary material is available for this article:
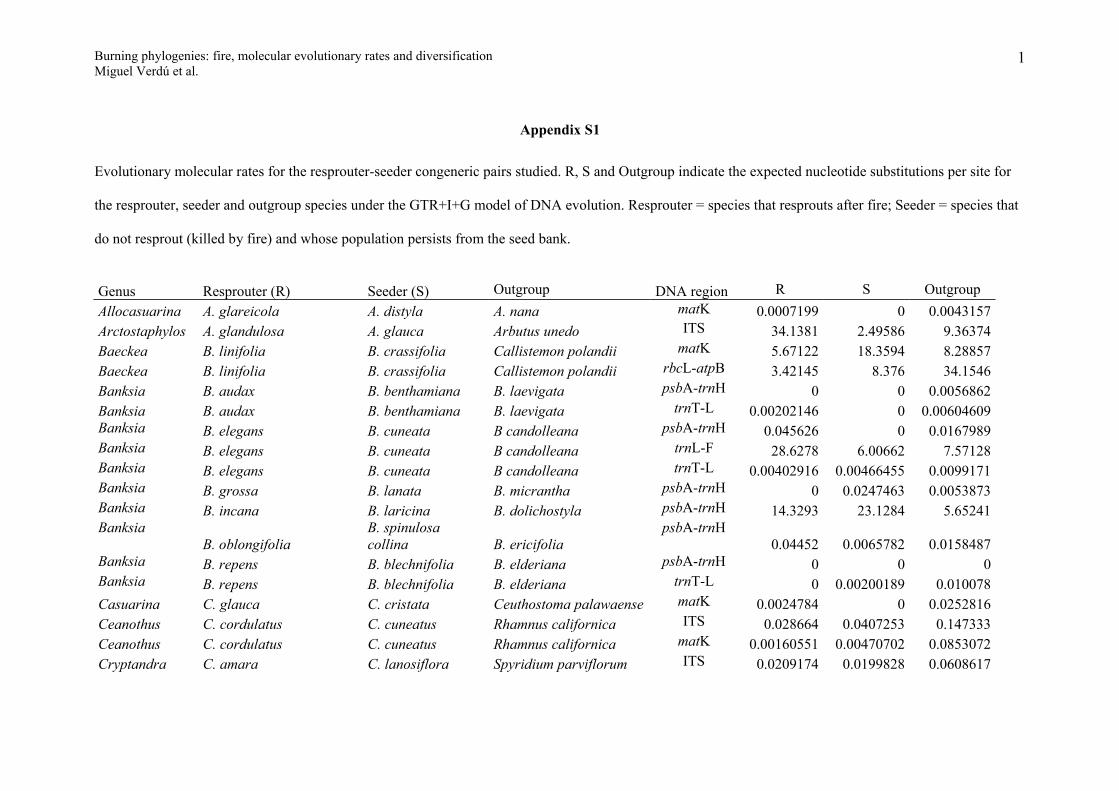
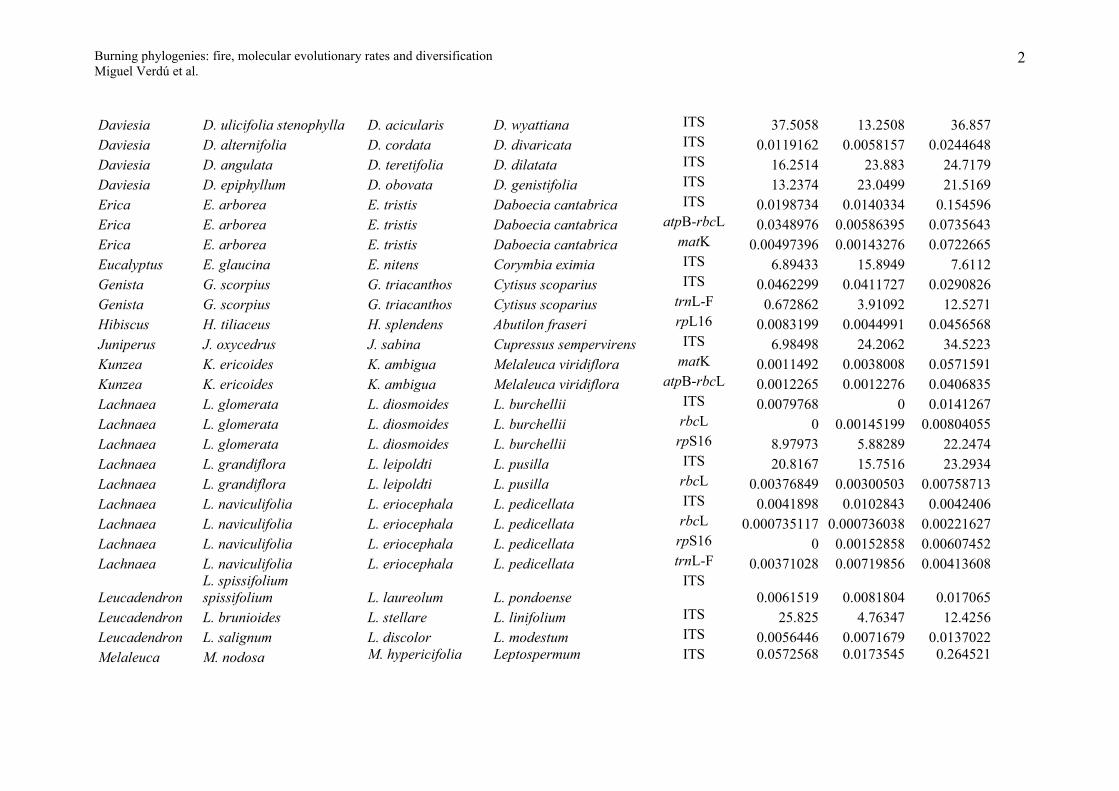
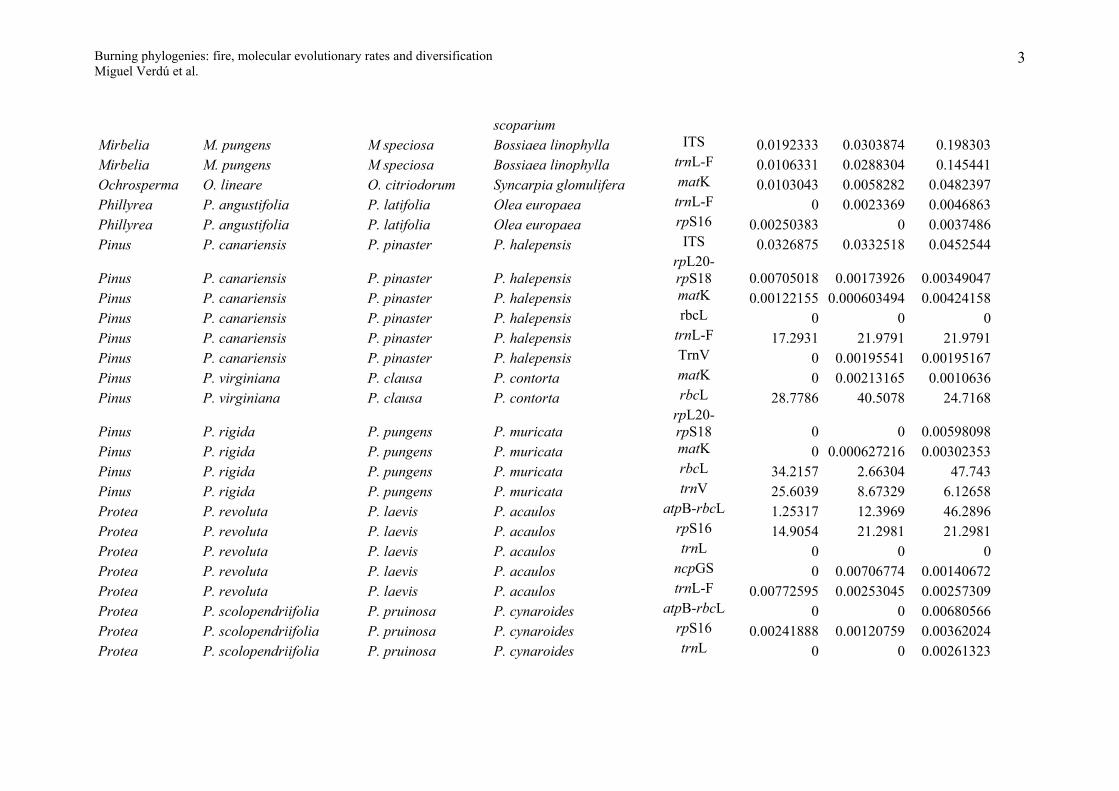
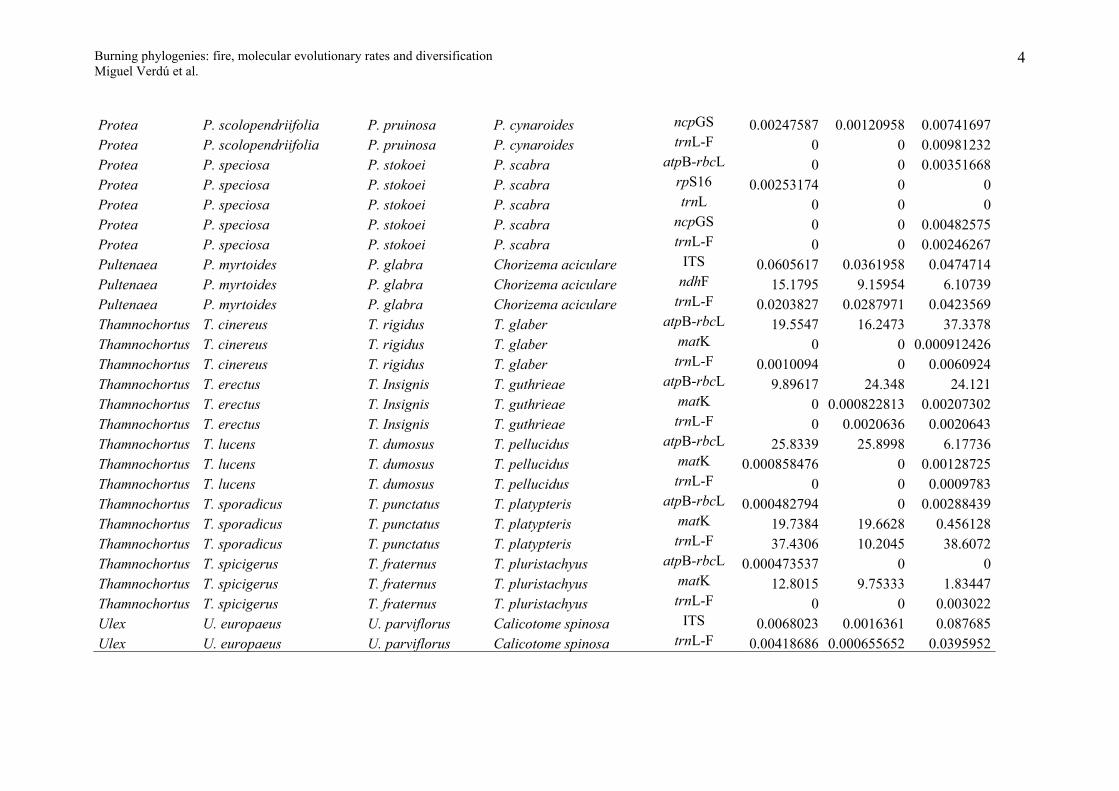
Appendix S1. Evolutionary molecular rates for the resprouter–seeder congeneric pairs studied.
Appendix S2. Consensus trees for the phylogeny of the five genera used to study diversification (Banksia, Daviesia, Lachnaea,
Thamnochortus, Leucadendron).
This material is available as part of the online article from:
(This link will take you to the article abstract).
Please note: Blackwell Publishing is not responsible for the content or functionality of any supplementary materials supplied by
the authors. Any queries (other than missing material) should be directed to the corresponding author for the article.
2204 EVOLUTION SEPTEMBER 2007
Burning phylogenies: fire, molecular evolutionary rates and diversificationMiguel Verdú et al.
Appendix S1
Evolutionary molecular rates for the resprouter-seeder congeneric pairs studied. R, S and Outgroup indicate the expected nucleotide substitutions per site for
the resprouter, seeder and outgroup species under the GTR+I+G model of DNA evolution. Resprouter = species that resprouts after fire; Seeder = species that
do not resprout (killed by fire) and whose population persists from the seed bank.
Genus Resprouter (R) Seeder (S) Outgroup DNA region R S OutgroupAllocasuarina A. glareicola A. distyla A. nana matK 0.0007199 0 0.0043157Arctostaphylos A. glandulosa A. glauca Arbutus unedo ITS 34.1381 2.49586 9.36374Baeckea B. linifolia B. crassifolia Callistemon polandii matK 5.67122 18.3594 8.28857Baeckea B. linifolia B. crassifolia Callistemon polandii rbcL-atpB 3.42145 8.376 34.1546Banksia B. audax B. benthamiana B. laevigata psbA-trnH 0 0 0.0056862Banksia B. audax B. benthamiana B. laevigata trnT-L 0.00202146 0 0.00604609Banksia B. elegans B. cuneata B candolleana psbA-trnH 0.045626 0 0.0167989Banksia B. elegans B. cuneata B candolleana trnL-F 28.6278 6.00662 7.57128Banksia B. elegans B. cuneata B candolleana trnT-L 0.00402916 0.00466455 0.0099171Banksia B. grossa B. lanata B. micrantha psbA-trnH 0 0.0247463 0.0053873Banksia B. incana B. laricina B. dolichostyla psbA-trnH 14.3293 23.1284 5.65241Banksia
B. oblongifoliaB. spinulosa collina B. ericifolia
psbA-trnH0.04452 0.0065782 0.0158487
Banksia B. repens B. blechnifolia B. elderiana psbA-trnH 0 0 0Banksia B. repens B. blechnifolia B. elderiana trnT-L 0 0.00200189 0.010078Casuarina C. glauca C. cristata Ceuthostoma palawaense matK 0.0024784 0 0.0252816Ceanothus C. cordulatus C. cuneatus Rhamnus californica ITS 0.028664 0.0407253 0.147333Ceanothus C. cordulatus C. cuneatus Rhamnus californica matK 0.00160551 0.00470702 0.0853072Cryptandra C. amara C. lanosiflora Spyridium parviflorum ITS 0.0209174 0.0199828 0.0608617
1
Burning phylogenies: fire, molecular evolutionary rates and diversificationMiguel Verdú et al.
Daviesia D. ulicifolia stenophylla D. acicularis D. wyattiana ITS 37.5058 13.2508 36.857Daviesia D. alternifolia D. cordata D. divaricata ITS 0.0119162 0.0058157 0.0244648Daviesia D. angulata D. teretifolia D. dilatata ITS 16.2514 23.883 24.7179Daviesia D. epiphyllum D. obovata D. genistifolia ITS 13.2374 23.0499 21.5169Erica E. arborea E. tristis Daboecia cantabrica ITS 0.0198734 0.0140334 0.154596Erica E. arborea E. tristis Daboecia cantabrica atpB-rbcL 0.0348976 0.00586395 0.0735643Erica E. arborea E. tristis Daboecia cantabrica matK 0.00497396 0.00143276 0.0722665Eucalyptus E. glaucina E. nitens Corymbia eximia ITS 6.89433 15.8949 7.6112Genista G. scorpius G. triacanthos Cytisus scoparius ITS 0.0462299 0.0411727 0.0290826Genista G. scorpius G. triacanthos Cytisus scoparius trnL-F 0.672862 3.91092 12.5271Hibiscus H. tiliaceus H. splendens Abutilon fraseri rpL16 0.0083199 0.0044991 0.0456568Juniperus J. oxycedrus J. sabina Cupressus sempervirens ITS 6.98498 24.2062 34.5223Kunzea K. ericoides K. ambigua Melaleuca viridiflora matK 0.0011492 0.0038008 0.0571591Kunzea K. ericoides K. ambigua Melaleuca viridiflora atpB-rbcL 0.0012265 0.0012276 0.0406835Lachnaea L. glomerata L. diosmoides L. burchellii ITS 0.0079768 0 0.0141267Lachnaea L. glomerata L. diosmoides L. burchellii rbcL 0 0.00145199 0.00804055Lachnaea L. glomerata L. diosmoides L. burchellii rpS16 8.97973 5.88289 22.2474Lachnaea L. grandiflora L. leipoldti L. pusilla ITS 20.8167 15.7516 23.2934Lachnaea L. grandiflora L. leipoldti L. pusilla rbcL 0.00376849 0.00300503 0.00758713Lachnaea L. naviculifolia L. eriocephala L. pedicellata ITS 0.0041898 0.0102843 0.0042406Lachnaea L. naviculifolia L. eriocephala L. pedicellata rbcL 0.000735117 0.000736038 0.00221627Lachnaea L. naviculifolia L. eriocephala L. pedicellata rpS16 0 0.00152858 0.00607452Lachnaea L. naviculifolia L. eriocephala L. pedicellata trnL-F 0.00371028 0.00719856 0.00413608
LeucadendronL. spissifolium spissifolium L. laureolum L. pondoense
ITS0.0061519 0.0081804 0.017065
Leucadendron L. brunioides L. stellare L. linifolium ITS 25.825 4.76347 12.4256Leucadendron L. salignum L. discolor L. modestum ITS 0.0056446 0.0071679 0.0137022Melaleuca M. nodosa M. hypericifolia Leptospermum ITS 0.0572568 0.0173545 0.264521
2
Burning phylogenies: fire, molecular evolutionary rates and diversificationMiguel Verdú et al.
scopariumMirbelia M. pungens M speciosa Bossiaea linophylla ITS 0.0192333 0.0303874 0.198303Mirbelia M. pungens M speciosa Bossiaea linophylla trnL-F 0.0106331 0.0288304 0.145441Ochrosperma O. lineare O. citriodorum Syncarpia glomulifera matK 0.0103043 0.0058282 0.0482397Phillyrea P. angustifolia P. latifolia Olea europaea trnL-F 0 0.0023369 0.0046863Phillyrea P. angustifolia P. latifolia Olea europaea rpS16 0.00250383 0 0.0037486Pinus P. canariensis P. pinaster P. halepensis ITS 0.0326875 0.0332518 0.0452544
Pinus P. canariensis P. pinaster P. halepensisrpL20-rpS18 0.00705018 0.00173926 0.00349047
Pinus P. canariensis P. pinaster P. halepensis matK 0.00122155 0.000603494 0.00424158Pinus P. canariensis P. pinaster P. halepensis rbcL 0 0 0Pinus P. canariensis P. pinaster P. halepensis trnL-F 17.2931 21.9791 21.9791Pinus P. canariensis P. pinaster P. halepensis TrnV 0 0.00195541 0.00195167Pinus P. virginiana P. clausa P. contorta matK 0 0.00213165 0.0010636Pinus P. virginiana P. clausa P. contorta rbcL 28.7786 40.5078 24.7168
Pinus P. rigida P. pungens P. muricatarpL20-rpS18 0 0 0.00598098
Pinus P. rigida P. pungens P. muricata matK 0 0.000627216 0.00302353Pinus P. rigida P. pungens P. muricata rbcL 34.2157 2.66304 47.743Pinus P. rigida P. pungens P. muricata trnV 25.6039 8.67329 6.12658Protea P. revoluta P. laevis P. acaulos atpB-rbcL 1.25317 12.3969 46.2896Protea P. revoluta P. laevis P. acaulos rpS16 14.9054 21.2981 21.2981Protea P. revoluta P. laevis P. acaulos trnL 0 0 0Protea P. revoluta P. laevis P. acaulos ncpGS 0 0.00706774 0.00140672Protea P. revoluta P. laevis P. acaulos trnL-F 0.00772595 0.00253045 0.00257309Protea P. scolopendriifolia P. pruinosa P. cynaroides atpB-rbcL 0 0 0.00680566Protea P. scolopendriifolia P. pruinosa P. cynaroides rpS16 0.00241888 0.00120759 0.00362024Protea P. scolopendriifolia P. pruinosa P. cynaroides trnL 0 0 0.00261323
3
Burning phylogenies: fire, molecular evolutionary rates and diversificationMiguel Verdú et al.
Protea P. scolopendriifolia P. pruinosa P. cynaroides ncpGS 0.00247587 0.00120958 0.00741697Protea P. scolopendriifolia P. pruinosa P. cynaroides trnL-F 0 0 0.00981232Protea P. speciosa P. stokoei P. scabra atpB-rbcL 0 0 0.00351668Protea P. speciosa P. stokoei P. scabra rpS16 0.00253174 0 0Protea P. speciosa P. stokoei P. scabra trnL 0 0 0Protea P. speciosa P. stokoei P. scabra ncpGS 0 0 0.00482575Protea P. speciosa P. stokoei P. scabra trnL-F 0 0 0.00246267Pultenaea P. myrtoides P. glabra Chorizema aciculare ITS 0.0605617 0.0361958 0.0474714Pultenaea P. myrtoides P. glabra Chorizema aciculare ndhF 15.1795 9.15954 6.10739Pultenaea P. myrtoides P. glabra Chorizema aciculare trnL-F 0.0203827 0.0287971 0.0423569Thamnochortus T. cinereus T. rigidus T. glaber atpB-rbcL 19.5547 16.2473 37.3378Thamnochortus T. cinereus T. rigidus T. glaber matK 0 0 0.000912426Thamnochortus T. cinereus T. rigidus T. glaber trnL-F 0.0010094 0 0.0060924Thamnochortus T. erectus T. Insignis T. guthrieae atpB-rbcL 9.89617 24.348 24.121Thamnochortus T. erectus T. Insignis T. guthrieae matK 0 0.000822813 0.00207302Thamnochortus T. erectus T. Insignis T. guthrieae trnL-F 0 0.0020636 0.0020643Thamnochortus T. lucens T. dumosus T. pellucidus atpB-rbcL 25.8339 25.8998 6.17736Thamnochortus T. lucens T. dumosus T. pellucidus matK 0.000858476 0 0.00128725Thamnochortus T. lucens T. dumosus T. pellucidus trnL-F 0 0 0.0009783Thamnochortus T. sporadicus T. punctatus T. platypteris atpB-rbcL 0.000482794 0 0.00288439Thamnochortus T. sporadicus T. punctatus T. platypteris matK 19.7384 19.6628 0.456128Thamnochortus T. sporadicus T. punctatus T. platypteris trnL-F 37.4306 10.2045 38.6072Thamnochortus T. spicigerus T. fraternus T. pluristachyus atpB-rbcL 0.000473537 0 0Thamnochortus T. spicigerus T. fraternus T. pluristachyus matK 12.8015 9.75333 1.83447Thamnochortus T. spicigerus T. fraternus T. pluristachyus trnL-F 0 0 0.003022Ulex U. europaeus U. parviflorus Calicotome spinosa ITS 0.0068023 0.0016361 0.087685Ulex U. europaeus U. parviflorus Calicotome spinosa trnL-F 0.00418686 0.000655652 0.0395952
4
Burning phylogenies: fire, molecular evolutionary rates and diversificationMiguel Verdú et al.
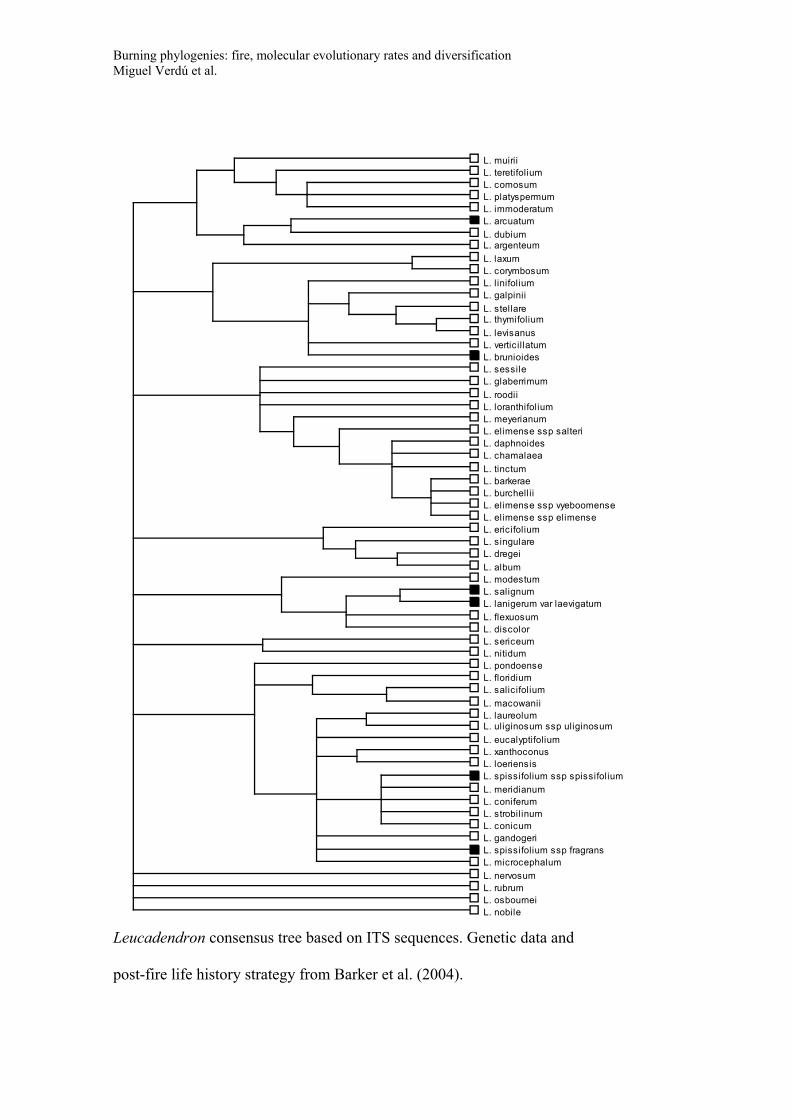
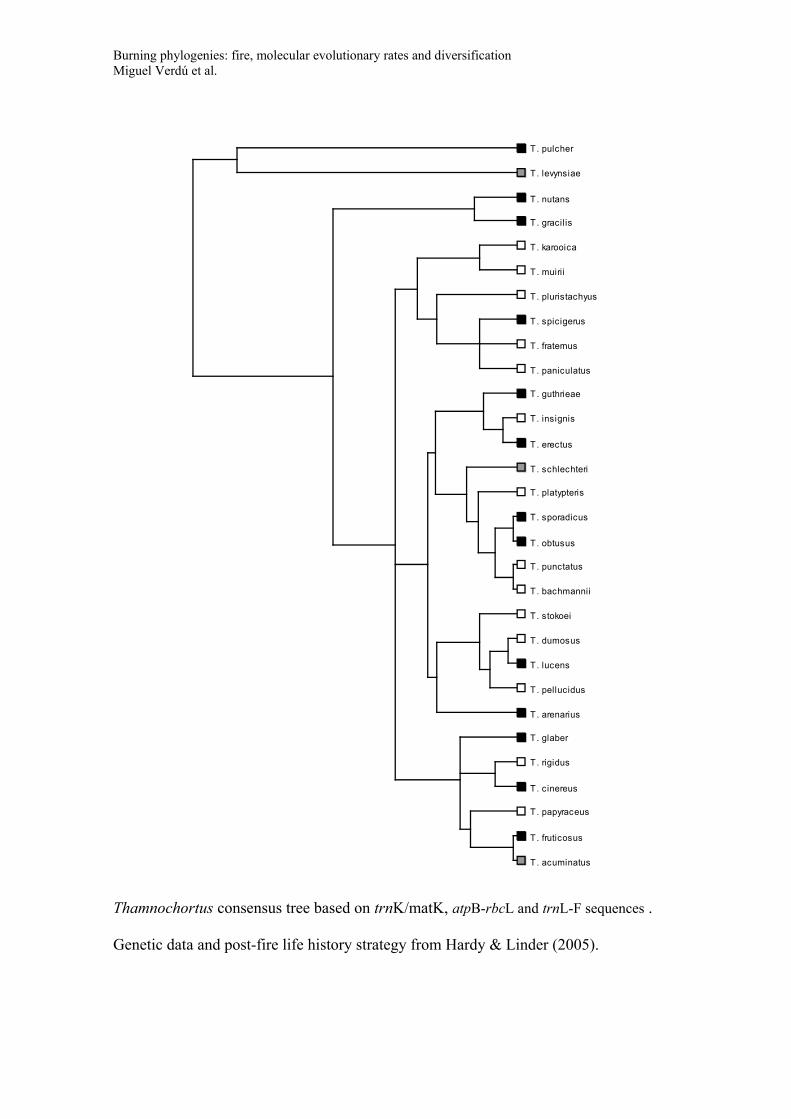
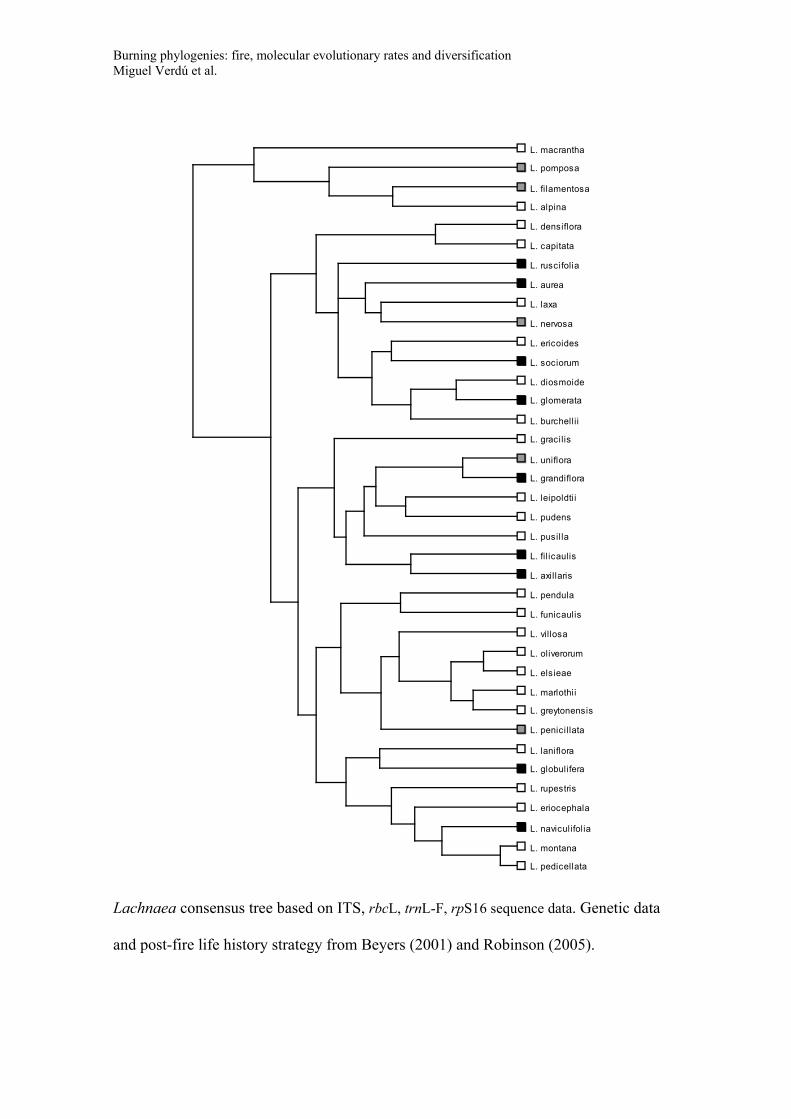
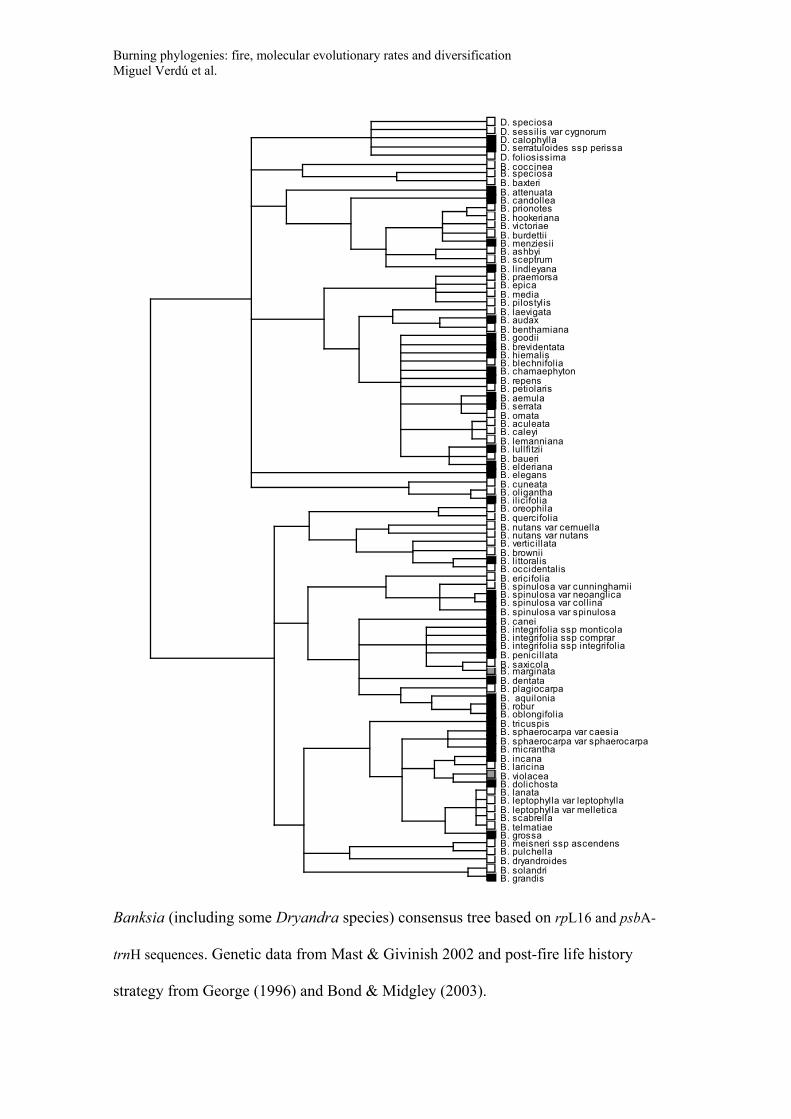
Appendix S2
Consensus trees for the phylogeny of the five genera used to study diversification
(Banksia, Daviesia, Lachnaea, Thamnochortus, Leucadendron). Trees include species
names and post-fire life history strategy (Black symbols: species with post-fire
resprouting capacity; White symbols: species that have no resprouting capacity and that
rely on seeds for post-fire persistence; Grey symbols: species with both resprouting and
non-resprouting populations or species with uncertainty in their resprouting behaviour).
These consensus trees were recovered in a Bayesian framework based on the GenBank
data and applying a non-parametric rate smoothing algorithm (see main text for details).
Burning phylogenies: fire, molecular evolutionary rates and diversificationMiguel Verdú et al.
D. pachyloma
D. anceps
D. megacalyx
D. obovata
D. gracilis
D. epiphyllum
D. speciosa
D. decurrens
D. smithiorum
D. rubiginosa
D. genistifolia
D. angulata
D. chapmanii
D. teretifolia
D. daphnoides
D. emarginataD. dilatata
D. physodes
D. brachyphyllaD. incrassata
D. podophylla
D. pachyphyllaD. flexuosa
D. articulata
D. benthamii
D. nematophylla
D. elliptica
D. latifolia
D. buxifolia
D. mimosoides
D. arborea
D. leptophylla
D. nova-anglica
D. corymbosa
D. nudiflora
D. spiralis
D. mollis
D. rhombifolia
D. divaricata
D. alternifolia
D. cordata
D. ulicifolia ssp ruscifolia
D. ulicifolia ssp ulicifolia
D. ulicifolia ssp stenophylla
D. acicularis
D. wyattiana
Daviesia consensus tree based on ITS sequences. Genetic data and post-fire life history
strategy from Crisp et al. 2003.
Burning phylogenies: fire, molecular evolutionary rates and diversificationMiguel Verdú et al.