74
Biodiversity Research Institute 2008-2009 ASSESSMENT OF MERCURY IN BIRDS AT ONONDAGA LAKE: 2008-2009 BREEDING SEASON FINAL REPORT
Biodiversity Research Institute
3
2008-2009
ASSESSMENT OF MERCURY
IN BIRDS AT ONONDAGA LAKE:
2008-2009 BREEDING SEASON FINAL REPORT

Biodiversity Research Institute
ASSESSMENT OF MERCURY IN BIRDS AT ONONDAGA LAKE:
2008-2009 BREEDING SEASON FINAL REPORT
BRI Report #2011-17
SUBMITTED TO:
Anne Secord
U.S. Fish and Wildlife Service
New York Field Office (Region 5)
3817 Luker Road
Cortland, New York 13045
SUBMITTED BY:
Oksana Lane, Samuel T. Edmonds, Jon Atwood, Kevin Regan, David Buck and David Evers
Biodiversity Research Institute
19 Flaggy Meadow Road
Gorham, Maine, USA 04038
November 5, 2012

Biodiversity Research Institute
Biodiversity Research Institute (BRI) is a 501(c)3 nonprofit organization located in Gorham,
Maine. Founded in 1998, BRI is dedicated toward supporting global health through
collaborative ecological research, assessment of ecosystem health, improving environmental
awareness, and informing science based decision making.
To obtain copies of this report contact:
Biodiversity Research Institute
19 Flaggy Meadow Road
Gorham, ME 04038
(207) 839-7600
www.briloon.org
or
U.S. Fish and Wildlife Service
3817 Luker Road
Cortland, NY 13045

Biodiversity Research Institute
FRONT PHOTO CAPTION (EDMONDS): Left: Male red-winged blackbird captured on Onondaga Lake. Right:
Mistnetting birds on Onondaga Lake
SUGGESTED CITATION: Lane, O.P., S.T. Edmonds, J. Atwood, K. Regan, D. Buck and D. Evers. 2012.
Assessment of mercury exposure in birds at Onondaga Lake: 2008-2009. Report BRI 2011-17
submitted to U.S. Fish and Wildlife Service, Cortland, NY. Biodiversity Research Institute,
Gorham, Maine.

Biodiversity Research Institute Page i
Table of Contents
1. EXECUTIVE SUMMARY ............................................................................................................................. 1
2. INTRODUCTION ........................................................................................................................................ 2
OBJECTIVES .................................................................................................................................................................. 5
STUDY AREA .................................................................................................................................................................. 5
Beach, Onondaga Lake ......................................................................................................................................... 7
Maple Bay, Onondaga Lake ................................................................................................................................. 7
Ninemile Creek ..................................................................................................................................................... 8
Ley Creek, Onondaga Lake ................................................................................................................................... 8
Harbor Brook, Onondaga Lake ............................................................................................................................. 8
White Cliffs, Onondaga Lake ................................................................................................................................ 8
Wetzel Road, Seneca River ................................................................................................................................... 9
Oneida Lake-Reference Site ................................................................................................................................ 10
3. METHODS .............................................................................................................................................. 10
OVERVIEW.................................................................................................................................................................. 10
BIRD AND EGG SAMPLING ............................................................................................................................................. 10
INVERTEBRATE SAMPLING ............................................................................................................................................. 11
LAB METHODS ............................................................................................................................................................. 12
Mercury .............................................................................................................................................................. 12
Stable Isotopes ................................................................................................................................................... 12
Interlab blood Hg comparison-splits .................................................................................................................. 13
STATISTICS .................................................................................................................................................................. 13
4. RESULTS ................................................................................................................................................. 14
SAMPLING EFFORT ....................................................................................................................................................... 14

Biodiversity Research Institute Page ii
Blood and feathers ............................................................................................................................................. 14
Eggs .................................................................................................................................................................... 14
MERCURY RESULTS ....................................................................................................................................................... 14
Blood mercury in target songbirds ..................................................................................................................... 14
Egg mercury in tree swallows and red-winged blackbirds ................................................................................. 15
Tree swallow mercury results ............................................................................................................................. 16
Tree swallow blood-egg relationship (2008-2009) ............................................................................................. 20
Red-winged blackbird mercury results ............................................................................................................... 21
Song sparrow blood and feather mercury .......................................................................................................... 23
Spotted sandpipers ............................................................................................................................................. 28
Blood mercury in non-target species .................................................................................................................. 31
Blood mercury in recaptured birds ..................................................................................................................... 31
INTER-LAB COMPARISON BLOOD HG-LAB SPLITS ................................................................................................................. 32
Stable isotopes in blood ..................................................................................................................................... 34
DOCUMENTED PHYSICAL DEFORMITIES ............................................................................................................................. 35
5. DISCUSSION ........................................................................................................................................... 37
MERCURY EXPOSURE IN BIRDS ........................................................................................................................................ 37
Blood mercury .................................................................................................................................................... 37
Feather mercury ................................................................................................................................................. 37
Egg mercury ....................................................................................................................................................... 38
Stable Isotopes and Hg in Bird Blood ................................................................................................................. 38
6. CONCLUSIONS ........................................................................................................................................ 39
7. ACKNOWLEDGEMENTS .......................................................................................................................... 39
8. LITERATURE CITED.................................................................................................................................. 40
9. APPENDIX A. SUMMARY OF BLOOD AND FEATHER MERCURY DATA, 2008-2009. .................................. 45
Biodiversity Research Institute Page iii
10. APPENDIX B. MERCURY CONCENTRATIONS (µG/G, WW) IN EGGS OF TREE SWALLOWS AND RED-
WINGED BLACKBIRDS, 2009. .................................................................................................................. 59
11. APPENDIX C. TREE SWALLOWS RE-SAMPLED WITHIN THE SAME SEASON AND/OR RE-CAPTURED IN
2009. ...................................................................................................................................................... 60
12. APPENDIX D. SUMMARY OF BLOOD STABLE ISOTOPE DATA (Δ13
C, Δ15
N) AND BLOOD HG DATA FOR ALL
STUDY AREAS, 2009. .............................................................................................................................. 61
13. APPENDIX E. MEAN BLOOD (BY SEX) AND FEATHER (SEXES COMBINED) MERCURY CONCENTRATIONS
(µG/G) IN ADULT RED-WINGED BLACKBIRDS, 2008-2009. ...................................................................... 64

Biodiversity Research Institute Page iv
List of Figures
Figure 1. Study sites on Onondaga Lake 2009.
Figure 2. Wetzel Road as seen from the Seneca River in 2009.
Figure 3. Mean blood Hg concentrations in target songbird species sampled on Onondaga and
Oneida Lakes in 2009 (adults only).
Figure 4. Mean egg Hg concentrations (µg/g ww) in two target songbird species sampled on
Onondaga and Oneida Lakes, 2009.
Figure 5. Quantile box plots showing blood-Hg concentrations in adult tree swallows sampled in
2009 in four study areas.
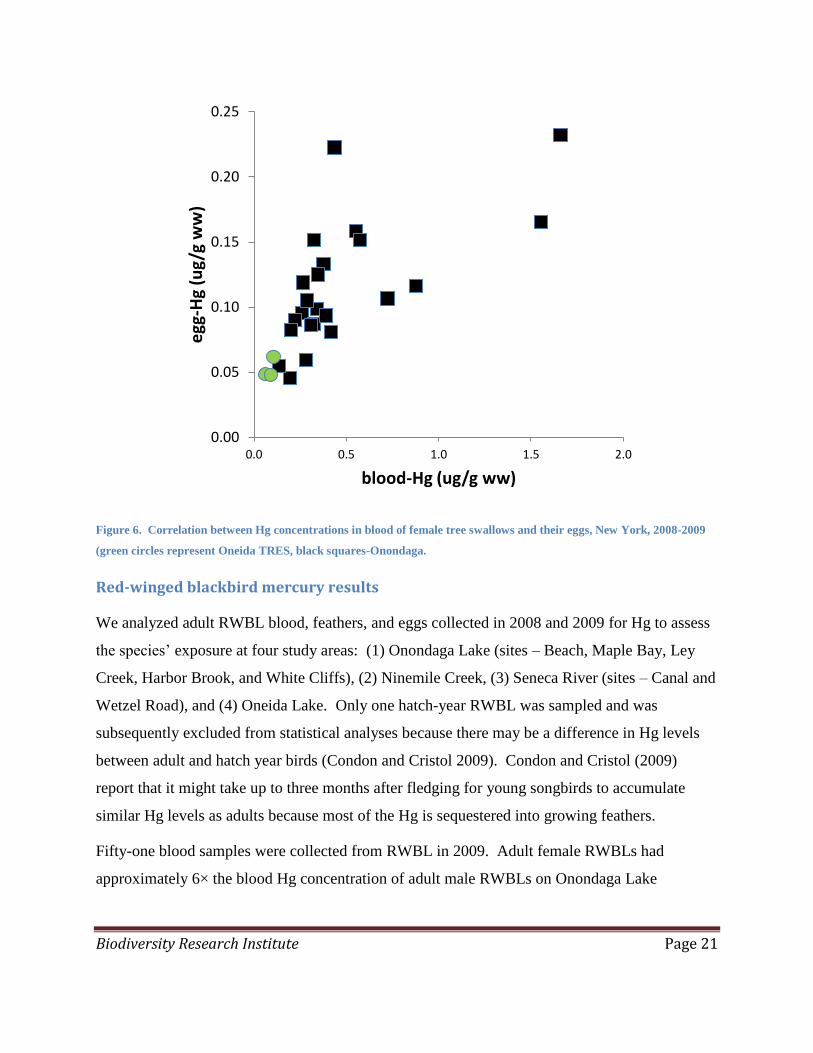
Figure 6. Correlation between Hg concentrations in blood of female tree swallows and their
eggs, New York, 2008-2009.
Figure 7. Quantile box plots showing blood Hg concentrations in song sparrows from four study
areas from 2009.
Figure 8. Quantile box plots showing blood Hg concentrations in song sparrows from four study
areas 2009.
Figure 9. Map of spotted sandpiper sightings on July 9, 2009, on Onondaga Lake and Seneca
River.
Figure 10. Baltimore oriole with abnormal throat growth, Onondaga Lake, 2009.
Figure 11. Tree swallow with lower mandible half-missing, Oneida Lake 2009.
List of Tables
Table 1. Number of egg samples analyzed for mercury in 2009.
Table 2. Summary of tree swallow nest boxes monitored at Onondaga Lake and associated sites
in 2008 and 2009.
Table 3. Summary of blood-mercury (µg/g) by treatment, sites, year, and sex for tree swallows.
Table 4. Red-winged blackbird blood and feather mercury concentrations for 2009.
Table 5. Summary statistics of blood-Hg concentrations (µg/g ww) in song sparrows for adults
and hatch-years (2009).
Biodiversity Research Institute Page v
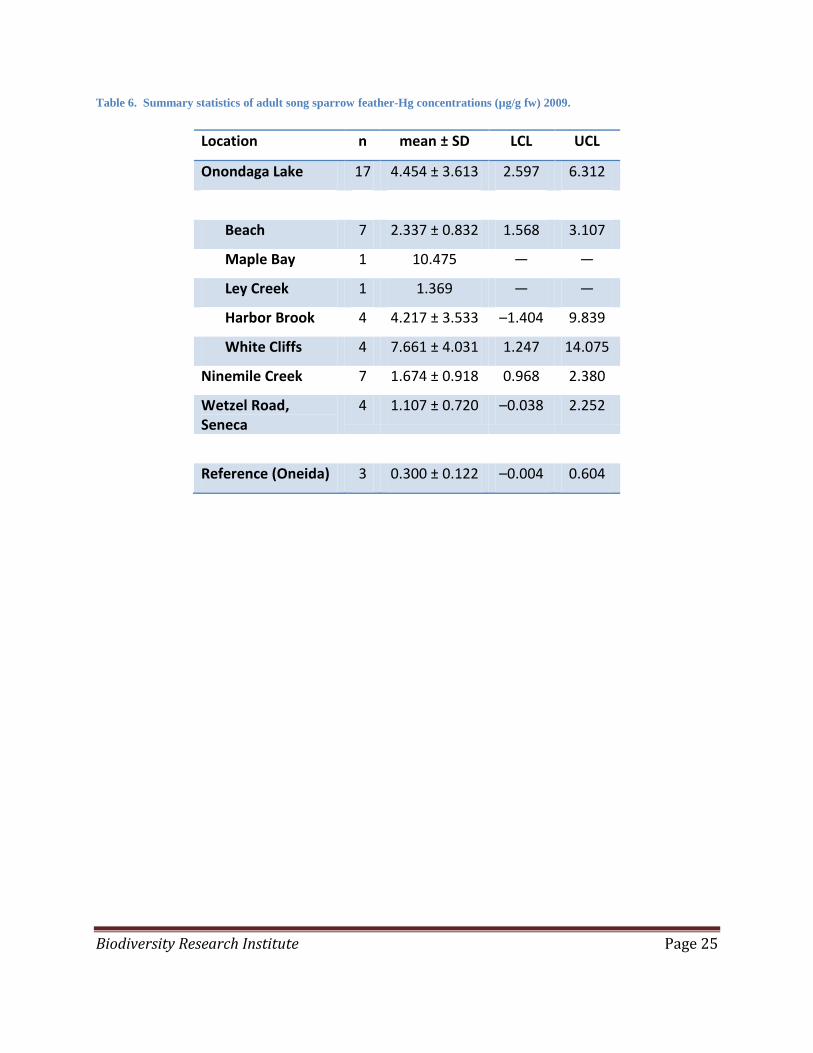
Table 6. Summary statistics of adult song sparrow feather-Hg concentrations (µg/g fw), 2009.
Table 7. Summary of estimated percent of sampled birds that exceed published effect levels.
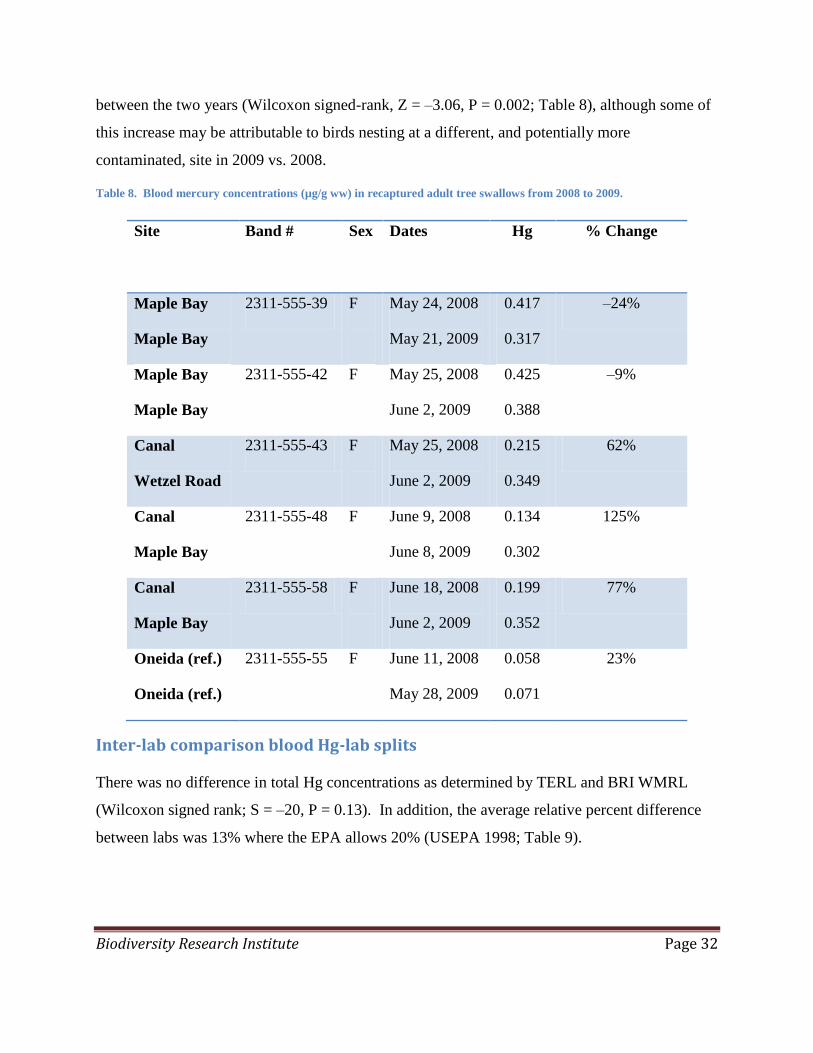
Table 8. Blood mercury concentrations (µg/g ww) in recaptured adult tree swallows from 2008
to 2009.
Table 9. Blood Hg split results from the same bird, analyzed at TERL and BRI WMRL, 2009.
Table 10. Among-site (Onondaga, Ninemile Creek, Seneca, Reference) comparison of
blood-Hg, δ13
C and δ15
N in red-winged blackbird (RWBL), song sparrow (SOSP), and tree
swallow (TRES).
Table 11. Documented morphological deformities in birds captured on Onondaga and Oneida
Lakes in 2009.
List of Acronyms
ANOVA analysis of variance
BERA Baseline Ecological Risk Assessment
BRI Biodiversity Research Institute
CI Confidence Interval
dw dry weight
HSD honestly significant difference
ww wet weight
fw fresh weight
Hg mercury
MeHg methylmercury
NPL National Priorities List
NYSDEC New York State Department of Environmental Conservation

Biodiversity Research Institute Page vi
NRDA Natural Resource Damage Assessment
RWBL red-winged blackbird
SOSP song sparrow
SPSA spotted sandpiper
TERL Trace Element Research Laboratory
TRES tree swallow
WMRL wildlife mercury research laboratory
USEPA United States Environmental Protection Agency
USFWS United States Fish and Wildlife Service

Biodiversity Research Institute Page 1
Executive Summary
The 2008 pilot study conducted by Biodiversity Research Institute (BRI) demonstrated that
mercury (Hg) concentrations in all target bird species were significantly higher on Onondaga
Lake than the reference site on Oneida Lake (Lane et al. 2011). The Hg exposure assessment in
birds breeding on Onondaga and Oneida Lakes was continued in 2009. Findings from the 2008
and the 2009 breeding season indicate that a number of songbirds and most breeding shorebirds
sampled had blood Hg concentrations that exceed recently proposed effect levels for songbirds.
These effect levels are based on Carolina wren (Thryothorus ludovicianus) data (Jackson et al.
2011) and tree swallow (Tachycineta bicolor) reproductive effect levels proposed in the 2008
report (Lane et al. 2011) that point to a blood Hg threshold effect level of about 0.70 and 0.63
μg/g respectively. We generally use 0.70 μg/g as an effect level in this report as it is based on a
field study presented in the peer-reviewed literature (Jackson et al. 2011). At this time we are
unaware of a more appropriate published effects threshold for the effects of Hg on songbirds.
We recognize that effect levels will vary by species and by individual characteristics such as age
or sex. One of the most comprehensive studies of the variability in avian species sensitivity to
Hg was conducted by Heinz et al. (2009). These authors injected Hg into the eggs of 26 bird
species and documented egg mortality. The tree swallow was found to be moderately sensitive
to Hg, more sensitive than species such as the mallard and hooded merganser, but less sensitive
than species such as the American kestrel and osprey. Heinz et al. (2009) did not evaluate the
sensitivity of the Carolina wren or other wren species to injected Hg.
The Carolina wren effect concentration used here is associated with modeled reduction in nest
success. A nest was defined as successful if it fledged at least one young. The effect levels were
based on a 10% and 20% reduction in nest success at 0.70 μg/g and 1.2 μg/g, respectively, in
adult Carolina wren blood Hg. The blood Hg concentrations associated with a 10% and 20%
reduction in nest success for Carolina wrens correspond to 0.11 μg/g and 0.2 μg/g Hg (wet
weight) in eggs and 3.0 μg/g and 4.7 μg/g Hg (fresh weight) in tail feathers (Jackson et al. 2011).
Extrapolating the model to higher mercury values predicts 99% reduction in reproductive success
at blood concentrations of 5.6 µg/g, body feather concentrations of 12.8 µg/g, tail feather
concentrations of 19.5 µg/g, and egg concentrations of 0.97 µg/g (Jackson et al. 2011). Of 367

Biodiversity Research Institute Page 2
invertivorous birds sampled in 2008 and 2009 from Onondaga Lake, 117 (32%) had blood Hg
concentrations exceeding the 0.70 μg/g effect level for Carolina wrens and 75 birds (20%)
exceeded the 1.2 μg/g Hg effect level associated with a predicted 20% nesting success reduction
for the Carolina wren. Of 19 adult spotted sandpipers (Actitis macularius) sampled in
2008-2009, 17 (89%) exceeded the lowest effect level for blood Hg in Carolina wrens (0.7 μg/g)
and 10 of 19 (53%) had Hg concentrations in blood in excess of 1.2 μg/g.
We analyzed tail feather Hg from selected species (American redstart, Setophaga ruticilla;
red-winged blackbird, Agelaius phoeniceus; common grackle, Quiscalus quiscula; song sparrow,
Melospiza melodia; and spotted sandpiper). Twenty of 122 tail feathers (16%) exceeded 3.0
μg/g Hg and 16 (13%) exceeded 4.7 μg/g Hg (associated with 10% and 20% reduction in nest
success in Carolina wrens, respectively). Twenty-two of 53 tree swallow eggs (42%) exceeded
0.11 μg/g-Hg, four of which (8%) exceeded 0.20 μg/g-Hg (associated with 10% and 20%
reduction in nest success in Carolina wrens, respectively). Only two of 15 (13%) red-winged
blackbird eggs were over the 0.11 μg/g-Hg, with one exceeding 0.20 μg/g-Hg. Tree swallow and
red-winged blackbird eggs collected at the Harbor Brook site on Onondaga Lake had the highest
Hg concentration of all sites sampled. No bird blood, feather, or eggs sampled at the reference
site on Oneida Lake had Hg concentrations that exceeded the effect levels discussed above.
Stable isotope data revealed differences in the foraging behavior between the three target
songbirds (tree swallow, red-winged blackbird, and song sparrow). Within species, the dietary
preferences were similar at all sites. Therefore, the observed differences in blood Hg among
sites are likely due to higher concentrations of Hg at Onondaga Lake and not due to different diet
selection.
INTRODUCTION
Biodiversity Research Institute (BRI), under the direction of the Natural Resource Trustees,
conducted a second year of avian sampling at Onondaga Lake to develop an understanding of Hg
exposure to birds breeding along this lake. The Natural Resource Trustees for Onondaga Lake

Biodiversity Research Institute Page 3
include the U.S. Department of the Interior – Fish and Wildlife Service, the New York
Department of Environmental Conservation (NYSDEC), and the Onondaga Nation. The
Trustees are participating in a Natural Resource Damage Assessment (NRDA) for the lake, a
process that is specifically designed to address natural resource injuries related to exposure to
hazardous substances and to identify and evaluate alternatives for restoration of those resources.
As a result of the 2008 pilot assessment of Hg contamination of birds on Onondaga Lake (Lane
et al. 2011), there is evidence that several species are exposed to concentrations of Hg that
exceed effects thresholds reported in the literature for other bird species and may, therefore,
adversely impact them. Onondaga Lake is located between two primary corridors of the Atlantic
Flyway for migratory birds and provides habitat for over 112 species of birds during the breeding
season (TAMS and YEC 2002; USFWS 2005).
The 2009 study was designed to further document potential Hg exposure of indicator resident
and migratory birds that nest and forage within the littoral zone and wetlands of Onondaga Lake.
Three insectivorous songbirds that forage within the Onondaga Lake floodplain were selected as
primary target indicators of Hg contamination in both the 2008 and 2009 studies because they
(1) are primarily invertivores during the breeding season, (2) are ubiquitous, and (3) have been
proven to be an appropriate indicator species of Hg exposure in previous studies (Evers et al.
2006, Hallinger et al. 2010, Lane et al. 2011). The target species selected were the song sparrow
(Melospiza melodia), red-winged blackbird (Agelaius phoeniceus), and tree swallow
(Tachycineta bicolor). Based on elevated blood Hg concentrations presented in the 2008 study,
we also targeted spotted sandpipers (Actitis macularia) as an indicator for shorebird exposure in
2009. All bird species captured were sampled regardless of being classified as a target species.
Information on these species follows:
Tree swallow (TRES): Arrives at New York lakes typically in April and initiates nesting in
early to mid-May. TRES are cavity nesting birds that readily occupy artificial nest boxes
(Robertson et al. 1992) and are commonly used as a study species for contaminant exposure
studies (Secord et al. 1999; Custer et al. 2001; Gerrard and St. Louis 2001). TRES foraging
territory is generally within ~400 m of their nest (Quinney and Ankney 1985), making this

Biodiversity Research Institute Page 4
species a reliable indicator of local contamination. The TRES feeds predominantly on flying
insects. Food items include Dipterans (flies), Hemipterans (leaf-hoppers, etc.), and Odonates
(dragonflies and damselflies) (McCarty and Winkler 1999; Quinney and Ankney 1985).
Food of aquatic origin constituted 65% of the nestling diet by mass in Ontario (Blancher and
McNicol 1991) and 47% in North Dakota (Custer et al. 2008).
Red-winged Blackbird (RWBL): The RWBL is an omnivorous wetland breeding species
common throughout most of North America. Nesting habitat is typically characterized by
tall grass, cattail, sedge, and reed (Phragmites sp.). They are found breeding at multiple sites
around Onondaga Lake and its watershed. This species arrives in New York in late February
to early April, beginning to breed in April and May. During the breeding season, its diet is
mainly animal matter. In non-agricultural habitats, approximately 84% of the male diet and
79% of the female diet may be comprised of insects (McNicol et al. 1982). In the marshes of
Manitoba, 100% of the diet may be animal matter (Bird and Smith 1964).
Song sparrows (SOSP): SOSP are ubiquitous throughout their range and are common along
the shoreline of Onondaga Lake and adjacent uplands. The species breeds in a range of
forest, shrub, and riparian habitats (Arcese et al. 2002). The males are highly territorial and
are often among the first migratory species to return to the breeding grounds. Individuals
often have high site fidelity between years. Song sparrows feed primarily on insects and
other invertebrates and some seeds and fruit (Aldrich 1984). In the Northeastern United
States, the diet consists mostly of plant material in the winter (86%), but is generally over
50% animal based in the summer. The SOSP is a generalist and will feed on a variety of
insects, including those from the orders Coleoptera, Hemiptera, Lepidoptera, Diptera,
Odonata, and Ephemeroptera (Arcese et al. 2002).
Spotted sandpiper (SPSA): The SPSA breeds and forages along the shore of Onondaga
Lake, Ninemile Creek, and the Seneca River. The SPSA diet is invertebrate-based,
dominated by copepods, Diptera larvae, and other aquatic invertebrates (Oring et al. 1997).
The high trophic position, along with foraging habitat in and along the Onondaga Lake

Biodiversity Research Institute Page 5
shoreline, and high sediment ingestion rates associated with sandpipers (7-30% of diet per
Beyer et al. 1995) contribute to high exposure of SPSA to Hg and other contaminants.
Objectives
We assessed Hg exposure to a variety of songbirds at Onondaga Lake through the non-lethal
collection of whole blood and feathers. Blood Hg levels in birds generally represent recent
dietary uptake (Evers et al. 2005, Hobson and Clark 1993, 1994, Bearhop et al. 2000) and
should, therefore, reflect Hg accumulated by birds feeding at or near their capture location.
Feather concentrations indicate a bird’s body burden of Hg at the time of feather growth,
roughly indicating a body’s accumulation of Hg over time (Burger 1993, Evers et al. 2005).
Eggs were collected for Hg analysis to assess embryo exposure to Hg. The following objectives
were outlined to evaluate avian exposure to Hg:
1. Determine Hg concentrations in bird blood and eggs to identify:
a. Hg exposure in target species and
b. Geographic extent and variation of Hg contamination in target species.
2. Model female blood-Hg to egg-Hg relationship in TRES to compare with an existing
predictive model.
3. Collect, analyze, and/or archive feather samples for Hg analysis to assess body burden.
4. Determine nitrogen (δ15
N) and carbon (δ13
C) stable isotope concentrations in bird blood
to understand complexity (food chain length) and origin (terrestrial vs. aquatic) of avian
food webs.
Study area
Seven locations were chosen for bird sampling on Onondaga Lake. An eighth site located on
Oneida Lake was used as a reference for regional baseline mercury exposure. Study sites were
selected based on results from the 2008 sampling (Lane et al. 2011) and categorized into one of
four general Study Areas, as detailed below (Figure 1):

Biodiversity Research Institute Page 6
Figure 1. Study sites on Onondaga Lake 2009.

Biodiversity Research Institute Page 7
1) Study Area 1: Onondaga Lake
a) Beach
b) Maple Bay
c) Harbor Brook
d) Ley Creek
e) White Cliffs
2) Study Area 2: Ninemile Creek
3) Study Area 3: Seneca River
a) Canal (only sampled in 2008)
b) Wetzel Road (only sampled in 2009), located downstream from Onondaga
Lake and replaced Canal from 2008
4) Study Area 4 (Reference): Oneida Lake at Shackelton Point
Beach, Onondaga Lake
(43.086750, –76.217493)
Beach is located along the southern edge of Onondaga Lake approximately halfway between the
mouth of Onondaga Creek and the lake’s outlet to the Seneca River. The upland habitat is a
sparsely vegetated area with patches of Phragmites sp. The soil composition includes waste
soda ash from the Solvay Plant. The lake sediment is also composed of the waste soda ash from
the Solvay process with hardpan extending beyond 10 m from shore. Zebra mussel shells are
abundant in the shoreline littoral zone.
Songbirds and shorebirds were captured along the shoreline and upland area.
Maple Bay, Onondaga Lake
(43.111570, –76.247250)
Maple Bay is located at the northern end of Onondaga Lake. The upland area adjacent to the site
includes a town park with paved and dirt walking trails dominated by wet hardwood bottomland
and patches of Phragmites sp. The outlet of Onondaga Lake to the Seneca River is the
northeastern border of the site, with Interstate Highways 90 and 690 nearby. The lake at the site

Biodiversity Research Institute Page 8
is generally shallow (< 2 m at more than 20 m from shore) with a sandy bottom. The shoreline
has limited patches of grass, Phragmites sp., and cattail, with dense forest edge.
Ninemile Creek
(43.077886, –76.228796)
Ninemile Creek is located approximately 1.5 km upstream from Onondaga Lake on Ninemile
Creek, a tributary to the lake. The upland area is cattail and Phragmites sp. dominated with
mowed road edge and paved road. The creek bottom is soft sediment.
Ley Creek, Onondaga Lake
(43.081513, –76.183344)
Ley Creek is located at the southern end of Onondaga Lake northeast of the mouth of Onondaga
Creek and adjacent to Route 370 and freight train tracks, about 1.6 km (1 mile) north of
Destiny USA. The upland habitat is a Phragmites sp. dominated wetland, mowed grass, and
train tracks with gravel bed. The lake edge is shallow (< 2 m at about 10 m out) with the bottom
composed of large cobble and gravel.
Harbor Brook, Onondaga Lake
(43.064727, –76.190021)
Harbor Brook is located on the southern shore of Onondaga Lake, south of the primary inlet of
Onondaga Creek and adjacent to Interstate 690. The upland habitat is gravel road, hardwood
forest, and small Phragmites sp. wetlands, with the lake edge dominated by a larger Phragmites
dominated wetland. The adjacent area of the lake is shallow (< 2 m at about 10 m from
shoreline), with both fine, soft sediment, and hardpan likely resulting from calcium and chloride
deposits. High densities of zebra mussel shells are found along the shoreline.
White Cliffs, Onondaga Lake
(43.088580, –76.227820)
White Cliffs, also referred to as Ninemile Creek Outlet in 2008, is located near the outlet of
Ninemile Creek. The upland area is dominated primarily by two-acres of cattail and Phragmites

Biodiversity Research Institute Page 9
sp. wetland and sparse vegetation at the base of an eroded cliff of Solvay waste. The lake here is
shallow (< 2 m depth out to 10 to 20 m) with the sediment composed of either Solvay waste or
fine sediment deposited from Ninemile Creek.
Wetzel Road, Seneca River
(43.164064, –76.255241)
Wetzel Road is located along the Seneca River (Figure 2), approximately 6.3 river km
(3.9 miles) downstream from the outlet of Onondaga Lake. The site consists of a cattail
dominated wetland bordered by mixed hardwood/red maple bottomland.
Figure 2. Wetzel Road as seen from the Seneca River in 2009.

Biodiversity Research Institute Page 10
Oneida Lake-Reference Site
(43.173435, –75.930973)
The reference site is located at the Cornell Biological Field Station at Shackelton Point on
Oneida Lake. Oneida Lake is a large lake with a relatively undeveloped shoreline and without
known industrial pollution (including Hg), and has a similar composition of avian species as
Onondaga Lake. The upland area of the site is dominated by grass meadow surrounded by
hardwoods.
Blood and feather samples were collected from all birds captured and eggs were collected from
TRES and RWBL only.
Methods
Overview
Bird sampling and egg collection methods were the same as those employed during the pilot
assessment of 2008 and are explained in detail in the pilot report (Lane et al. 2011). All field
sampling was completed by two to four BRI biological technicians. All bird handling/sample
collection was conducted under appropriate state and federal permits and using standard methods
of tissue collection from songbirds (Evers 2009). All birds were sampled and released
unharmed. Birds were identified to species and sex was determined either by plumage (ex.
RWBL), by the presence of brood patch in females or cloacal protuberance in males (ex. SOSP,
TRES), or by genetic analysis of blood (ex. SPSA). We determined age based on plumage,
presence/absence of molt limits, and feather wear.
Bird and Egg Sampling
Birds were captured using nylon mist nets in conjunction with audio callback to attract target
species in the immediate area. All birds were marked with unique U.S. Geological Survey leg
bands. Blood was non-lethally collected from birds using heparin-coated capillary tubes and
stored in labeled vacutainers; a single tail feather was pulled and stored in labeled plastic or
paper envelopes.

Biodiversity Research Institute Page 11
Tree swallow nest boxes were erected in 2008 at all four study areas defined above (n = 70), and
a subset of previously established (by Cornell University) boxes were monitored at the reference
site, Oneida Lake. Female TRES were captured on-nest for blood and feather sampling and both
sexes were occasionally captured with mist nets while targeting other wetland songbirds. Eggs
were collected for mercury following BRI egg collection protocol. Nestlings were banded in
2009 (n = 65), but no blood or feather samples were collected. Feather samples from adult tree
swallows were archived.
For simplicity throughout this report, Hg implies methylmercury, the dominant species of Hg
present in blood and feathers. Methylmercury has a tendency for biomagnification and is a
potent toxicant. Blood and feather Hg results are summarized by study area, site, sex, and year
in Appendix A.
Eggs were stored in hard cases on cotton with ice in the field and refrigerated within eight hours
of collection. Eggs were weighed and measured within one week of collection; eggs were
weighed at Syracuse University to 0.1 mg, with maximum length and width measured to 0.1 mm.
Egg contents were weighed following transfer to labeled 20 mL I-Chem acid-cleaned
borosilicate glass jars. Contents were classified by embryo development stage or as rotten.
Following processing, eggs were stored frozen until analysis. Abandoned or inviable eggs were
also collected.
Red-winged blackbird eggs were collected from the same sites as TRES – Ley Creek, Maple
Bay, Wetzel Road, Ninemile Creek, Harbor Brook, and Oneida Lake. Egg handling and
processing was the same as that followed for TRES eggs.
All samples were logged and label-checked following field collection and prior to storage.
Freezer temperature remained at less than -15°C based on daily temperature checks.
Invertebrate Sampling (data summarized in a separate report (Buck et al. 2012))
Invertebrates were collected using emergent traps set over water at Beach and on land using
sweep nets. Spiders were collected opportunistically using aspirators at Beach, Ley Creek,
Ninemile Creek, and Oneida Lake. Emergent traps were checked every morning and evening for
two days following placement. All samples were transferred using aspirators into clean vials.

Biodiversity Research Institute Page 12
Fresh weights (0.1 mg) of individuals were measured within two days of collection and unique
identification numbers were assigned.
Lab methods
Mercury
Methylmercury is the organic and highly toxic form of mercury that crosses through an
organism’s biological barriers (Boudou et al. 1991) such as the blood-brain barrier and can affect
the central nervous system in vertebrates. Inorganic mercury can have toxic effects on organs
such as kidneys, but does not pass into the brain. Methylmercury is not readily excreted and will
consequently bioaccumulate in tissues. Blood, egg, and feather samples were analyzed for total
Hg as this analysis is less expensive and typically 90-100% of total Hg in these tissues is in
MeHg form (Rimmer et al. 2005, Edmonds et al. 2010). Mercury analysis followed EPA method
7473 (USEPA 1998) using gold-amalgamation atomic absorption spectroscopy following
thermal desorption of the sample by a Milestone DMA-80. Blood and feathers were analyzed for
total Hg at the BRI Wildlife Mercury Research Laboratory (WMRL) in Gorham, Maine. Internal
lab quality control included initial calibration and continuing verification, blanks, sample
replication, and certified reference materials (CRM): DORM-3 (fish protein CRM for trace
metals) and DOLT-4 (dogfish liver CRM for trace metals) purchased from the National Research
Council of Canada.
Eggs were analyzed for total Hg at Trace Element Research Lab (TERL), Texas A&M, College
Station, Texas, following freeze drying and homogenizing with a Retsch ZM200 ultracentrifugal
mill. A representative subsample of dried egg was used for Hg analysis. Analysis followed
USEPA method 7473 (USEPA 1998), the same as that for blood and feathers. Egg Hg
concentrations in this report are converted from dry weight to wet weight.
Stable Isotopes
Blood samples were shipped to the Boston University Stable Isotope Laboratory for analysis.
Samples were analyzed using automated continuous-flow isotope ratio mass spectrometry
(Michener and Lajtha 2007). Blood was transferred from capillary tubes into pre-weighed tin
capsules. Assuming a content of 70% water, approximately 1.3 mg of blood was added to the

Biodiversity Research Institute Page 13
capsules. All capsules were oven dried at 60˚C for 24 hours and then reweighed for dry mass.
The capsules were then folded and compressed prior to analysis. The samples were combusted
in a EuroVector Euro EA elemental analyzer. The combustion gases (N2 and CO2) were
separated on a GC column, passed through a reference gas box, and introduced into the GV
Instruments IsoPrime isotope ratio mass spectrometer; water was removed using a magnesium
perchlorate water trap. Ratios of 13
C/12
C and 15
N/14
N are reported as standard delta (δ) notation
and are expressed as the relative permil (‰) difference between the samples and international
standards (Vienna Pee Dee Belemnite (V-PDB) carbonate and N2 in air) where:
δX= (Rsample/ Rstandard-1) x 1000 (‰)
Where X = 13
C or 15
N and R = 13
C/12
C or 15
N/14
N
The sample isotope ratio is compared to a secondary gas standard, the isotope ratio of which was
calibrated to international standards. For 13
CV-PDB the gas was calibrated against NBS 20
(Solenhofen Limestone). The 15
Nair gas was calibrated against atmospheric N2 and International
Atomic Energy Agency (IAEA) standards N-1, N-2, and N-3 (all are ammonium sulfate
standards). All international standards were obtained from the National Bureau of Standards in
Gaithersburg, Maryland.
Interlab blood Hg comparison-splits
In 2009, blood and feather samples were analyzed for total Hg at BRI’s WMRL in Gorham,
Maine. A subsample of remaining blood samples was used as splits to be analyzed by an
independent lab, TERL, to verify results from WMRL. Duplicate blood samples were shipped
overnight on ice to TERL and analyzed for total Hg on a DMA-80 following USEPA method
7473 (USEPA 1998).
Statistics
Statistical analyses were done in Excel (Microsoft 2010) and JMP 5.0 (SAS 2003). We used
non-parametric tests because of small sample sizes. We used a Wilcoxon one-way test to
determine significance between sites.

Biodiversity Research Institute Page 14
RESULTS
Sampling effort
Blood and feathers
During two years of field work, we banded and sampled 437 birds – 374 birds of 26 species from
Onondaga Lake and 63 birds from 13 species from Oneida Lake. In 2008, we collected blood
and/or feather samples from 147 birds (137 adults) at Onondaga Lake (including all subsites and
the Seneca River), representing 26 species and 25 birds on Oneida. In 2009 we sampled 227
birds of 25 species on Onondaga Lake and 38 birds from 12 species on Oneida Lake.
Eggs
In 2009, we collected and analyzed 18 TRES eggs and 15 RWBL eggs from the Onondaga Lake
sites for Hg. In 2009, we collected and analyzed one egg per nest from three TRES nests and the
same from RWBL nests at Oneida Lake. We did not collect eggs from Oneida Lake in 2008.
Mercury results
Blood mercury in target songbirds
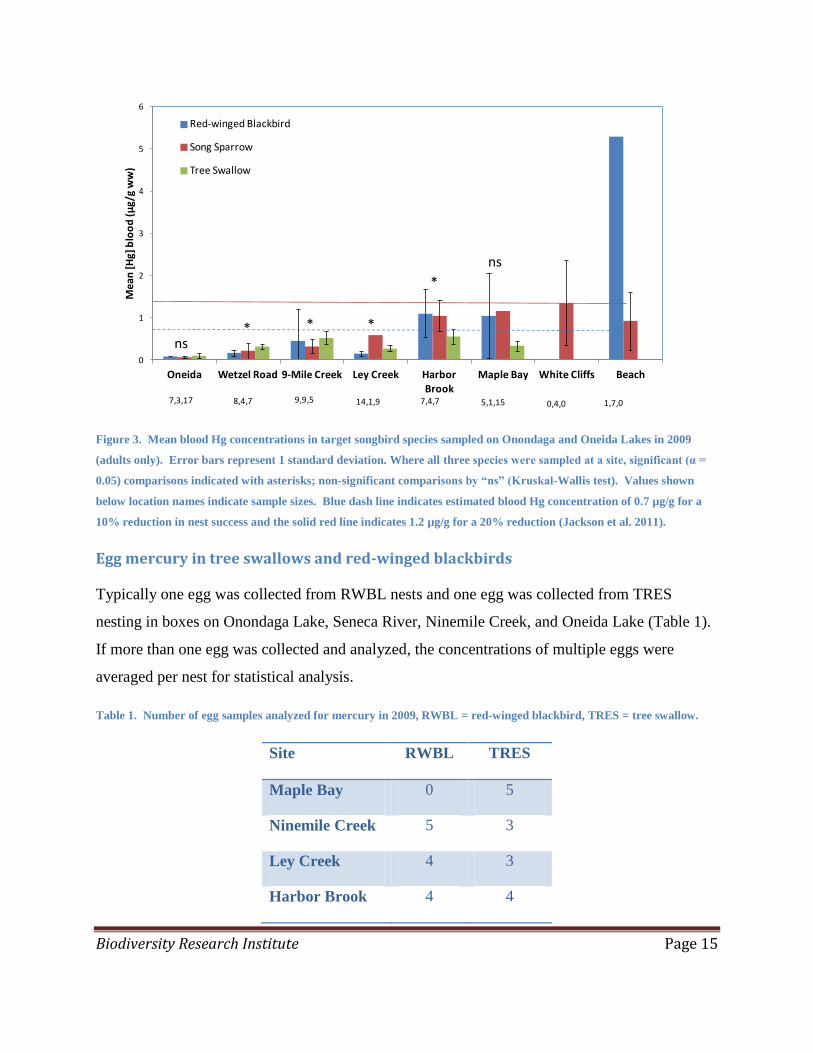
We found no consistent evidence of among-species differences in blood Hg levels at the eight
sampling locations, however, all three target species at sites on Onondaga Lake had greater Hg
concentrations than birds sampled at Oneida Lake (Figure 3).
Biodiversity Research Institute Page 15
Figure 3. Mean blood Hg concentrations in target songbird species sampled on Onondaga and Oneida Lakes in 2009
(adults only). Error bars represent 1 standard deviation. Where all three species were sampled at a site, significant (α =
0.05) comparisons indicated with asterisks; non-significant comparisons by “ns” (Kruskal-Wallis test). Values shown
below location names indicate sample sizes. Blue dash line indicates estimated blood Hg concentration of 0.7 µg/g for a
10% reduction in nest success and the solid red line indicates 1.2 µg/g for a 20% reduction (Jackson et al. 2011).
Egg mercury in tree swallows and red-winged blackbirds
Typically one egg was collected from RWBL nests and one egg was collected from TRES
nesting in boxes on Onondaga Lake, Seneca River, Ninemile Creek, and Oneida Lake (Table 1).
If more than one egg was collected and analyzed, the concentrations of multiple eggs were
averaged per nest for statistical analysis.
Table 1. Number of egg samples analyzed for mercury in 2009, RWBL = red-winged blackbird, TRES = tree swallow.
Site RWBL TRES
Maple Bay 0 5
Ninemile Creek 5 3
Ley Creek 4 3
Harbor Brook 4 4
0
1
2
3
4
5
6
Oneida Wetzel Road 9-Mile Creek Ley Creek Harbor Brook
Maple Bay White Cliffs Beach
Me
an [H
g] b
loo
d (
μg/
g w
w)
Red-winged Blackbird
Song Sparrow
Tree Swallow
*
*ns
ns
**
9,9,5 1,7,05,1,157,3,17 14,1,9 7,4,78,4,7 0,4,0

Biodiversity Research Institute Page 16
Wetzel Road 2 3
Oneida 3 3
Across all sites, TRES eggs had significantly greater concentrations of Hg than RWBL eggs
(Wilcoxon one-way test, chi-square = 12.11, df = 1, P < 0.001; Figure 4). Sample sizes were too
limited to compare egg-Hg concentrations between sites.
Figure 4. Mean egg Hg concentrations (µg/g ww) in two target songbird species sampled on Onondaga and Oneida Lakes,
2009. Blue line indicates 0.11µg/g - 10% reduction in nest success in Carolina wrens (Jackson et al. 2011).
Tree swallow mercury results
The artificial nest box occupancy rate increased from 2008 to 2009 (Table 2).

Biodiversity Research Institute Page 17
Table 2. Summary of tree swallow nest boxes monitored at Onondaga Lake and associated sites in 2008 and 2009. Nest
boxes at the reference site on Oneida Lake were not monitored in 2008.
Treatment Site Year # of boxes
present
# of boxes
with active
nests
% Occupancy
Onondaga Beach 2008 9 3 33%
Maple Bay 2008 10 6 60%
Maple Bay 2009 14 14 100%
Ley Creek 2008 9 4 44%
Ley Creek 2009 14 13 93%
Harbor Brook 2008 9 3 33%
Harbor Brook 2009 15 6 40%
White Cliffs 2008 9 4 44%
Ninemile
Creek
2009 13 4 31%
Seneca River Canal 2008 9 7 78%
Wetzel Road 2009 14 10 71%
Reference Oneida 2008* * 5 -
2009 35** 13 -
*only 5 boxes were monitored in 2008.
**over 35 boxes were present but only 35 were monitored.
The greatest concentrations of Hg in TRES blood in 2008 were found at Harbor Brook, followed
by Ley Creek and Beach (Table 3). In 2009, blood Hg concentrations were generally lower than
in 2008, with the highest blood Hg detected in TRES from Harbor Brook, followed by Ninemile
Creek (new site in 2009) and Maple Bay. Thirteen percent of the TRES sampled on Onondaga
Lake exceeded the 0.7 µg/g blood Hg concentration associated with a 10% nest success

Biodiversity Research Institute Page 18
reduction (Jackson et al. 2011) in Carolina wrens (fewer nests fledging at least one nestling); 6%
exceeded the 1.2 µg/g blood Hg concentration associated with a 20% Carolina wren nest success
reduction threshold (note 0.7 µg/g Hg threshold is similar to 0.63 µg/g reproductive effects
threshold for TRES cited in Lane et al. 2011). One of the five TRES sampled at Ninemile Creek
exceeded the 10% nest success reduction threshold. None of the samples collected from Seneca
River or Oneida Lake exceeded the proposed effect thresholds.
Table 3. Summary of blood-mercury (µg/g) by treatment, sites, year, and sex for tree swallows.
Treatment Site Year Female Mean
± SD [n]
Male mean ±
SD [n]
All adults mean
± SD [n]
Onondaga Beach 2008 0.45 ± 0.04 [2] — 0.45 ± 0.04 [2]
Maple Bay 2008 0.37 ± 0.08 [3] 0.45 ± 0.34
[2]
0.41 ± 0.19 [5]
2009 0.35 ± 0.09
[12]
0.15 ± 0.05
[2]
0.33 ± 0.11
[15]*
Ley Creek 2008 0.86 ± 0.32 [2] — 0.88 ± 0.32 [2]
2009 0.27 ± 0.08 [8] 0.24 [1] 0.26 ± 0.07 [9]
Harbor Brook 2008 1.49 ± 0.24 [2] — 1.49 ± 0.24 [2]
2009 0.57 ± 0.17 [6] 0.37 [1] 0.54 ± 0.17 [7]
White Cliffs 2008 0.42 ± 0.07 [3] 0.42 [1] 0.42 ± 0.06 [4]
Onondaga By
year
2008 0.67 ± 0.44
[12]
0.44 ± 0.24
[3]
0.62 ± 0.42 [15]
2009 0.37 ± 0.16
[26]
0.23 ± 0.11
[4]
0.36 ± 0.16
[31]*
Onondaga
Overall mean
2008-
2009
0.47 ± 0.31
[38]
0.32 ± 0.20
[7]
0.44 ± 0.29
[46]*

Biodiversity Research Institute Page 19
Seneca Canal 2008 0.17 ± 0.03 [6] — 0.17 ± 0.03 [6]
Wetzel Rd 2009 0.31 ± 0.06 [7] — 0.31 ± 0.06 [7]
Seneca Overall
mean
0.25 ± 0.09
[13]
— 0.25 ± 0.09 [13]
Ninemile Creek Ninemile
Creek
2009 0.52 ± 0.15 [5] — 0.52 ± 0.15 [5]
Reference Oneida 2008 0.08 ± 0.03 [5] 0.08 [1] 0.08 ± 0.03 [6]
2009 0.09 ± 0.07
[14]
0.12 ± 0.08
[2]
0.09 ± 0.06
[17]*
Overall mean 0.09 ± 0.06
[19]
0.10 ± 0.06
[3]
0.09 ± 0.06
[23]*
*n in the last column reflects the total number of adult birds sampled=males+females+unknown
There was a significant difference in blood Hg levels of adult TRES among the four study areas
(Kruskal-Wallis test, chi-square = 53.9, df = 3, P < 0.0001; 2008 and 2009 combined). Based on
a post-hoc multiple comparison test, Hg levels in TRES at the reference site in 2009 were
significantly lower than at Onondaga, Ninemile Creek, and Seneca (Figure ). Analyzed by year
2008 and 2009, the differences were still significant (Kruskal-Wallis test, chi-square=20.7, df=2,
P < 0.0001; and chi-square=35.3, df=3, P < 0.0001, respectively). Based on a post-hoc multiple
comparison test, Hg levels at the reference site were significantly lower than at Onondaga,
Ninemile Creek, and Seneca (Figure 5).

Biodiversity Research Institute Page 20
Figure 5. Quantile box plots showing blood-Hg concentrations in adult tree swallows sampled in 2009 in four study areas.
Brackets and associated probability values indicate significant differences between pairs based on Steel-Dwass
comparison. Sample sizes: Onondaga = 31, Ninemile Creek = 5, Seneca (Wetzel) = 7, Reference (Oneida Lake) = 17.
Tree swallow blood-egg relationship (2008-2009)
We collected and analyzed 27 blood/egg pairs from Onondaga and Oneida Lakes in 2008 and
2009. There was a significant positive correlation between Hg levels found in adult female
TRES blood and eggs presumed to have been laid by these individuals (Spearman correlation =
0.791, P < 0.0001; Figure 6).
0
0.1
0.2
0.3
0.4
0.5
0.6
0.7
0.8
0.9
Onondaga 9-Mile Creek Seneca Reference
P = 0.006
P = 0.003
P < 0.001M
ean
Bloo
d-H
g (μg/
g w
w)
Biodiversity Research Institute Page 21
Figure 6. Correlation between Hg concentrations in blood of female tree swallows and their eggs, New York, 2008-2009
(green circles represent Oneida TRES, black squares-Onondaga.
Red-winged blackbird mercury results
We analyzed adult RWBL blood, feathers, and eggs collected in 2008 and 2009 for Hg to assess
the species’ exposure at four study areas: (1) Onondaga Lake (sites – Beach, Maple Bay, Ley
Creek, Harbor Brook, and White Cliffs), (2) Ninemile Creek, (3) Seneca River (sites – Canal and
Wetzel Road), and (4) Oneida Lake. Only one hatch-year RWBL was sampled and was
subsequently excluded from statistical analyses because there may be a difference in Hg levels
between adult and hatch year birds (Condon and Cristol 2009). Condon and Cristol (2009)
report that it might take up to three months after fledging for young songbirds to accumulate
similar Hg levels as adults because most of the Hg is sequestered into growing feathers.
Fifty-one blood samples were collected from RWBL in 2009. Adult female RWBLs had
approximately 6× the blood Hg concentration of adult male RWBLs on Onondaga Lake
0.00
0.05
0.10
0.15
0.20
0.25
0.0 0.5 1.0 1.5 2.0
egg
-Hg
(ug/
g w
w)
blood-Hg (ug/g ww)

Biodiversity Research Institute Page 22
(Table 4). Each sex had significantly greater blood Hg concentrations on Onondaga Lake than
on Oneida Lake (female, P < 0.001, 21× greater; male, P = 0.001, 3× greater (Table 4).
Table 4. Red-winged blackbird blood and feather mercury concentrations for 2009. Concentrations in µg/g ww.
Study Area Sex Blood Hg, wet wt
mean ± SD, (n)
Feather Hg, fresh wt
mean ± SD, (n)
Onondaga Male 0.234 ± 0.269 (16) 0.313 ± 0.321 (16)
Female 1.49 ± 1.473 (11) 0.427 ± 0.241 (11)
Ninemile
Creek
Male 0.519 ± 0.942 (6) 0.504 ± 0.562 (6)
Female 0.279 ± 0.199 (3) 0.479 ± 0.454 (3)
Seneca River Male 0.132 ± 0.053 (5) 0.182 ± 0.085 (5)
Female 0.204 ± 0.070 (3) 0.146 ± 0.017 (3)
Oneida Lake
(Reference)
Male 0.078 ± 0.002 (3) 0.118 ± 0.019 (3)
Female 0.071 ± 0.011 (4) 0.093 ± 0.021 (4)
Fifty-one feather samples from RWBL captured in 2009 were analyzed for total Hg. No
significant difference in feather Hg concentrations between sexes on Onondaga Lake (sites
combined) was observed (Wilcoxon one-way test, chi-square = 3.62, df = 1, P =0.057; small
sample sizes precluded a comparable analysis at the reference site).
Both sexes of RWBL showed significantly higher feather Hg levels at Onondaga compared to
the reference site (females: Wilcoxon one-way test, chi-square = 7.09, P = 0.008; males: chi-
square = 3.91, P = 0.05). The mean feather Hg concentration in RWBL from Onondaga Lake
was 3.5× greater than the mean Hg concentration in RWBL feathers from Oneida Lake and the

Biodiversity Research Institute Page 23
mean feather Hg concentration from Ninemile Creek was 5× greater than the mean feather Hg
concentration in RWBL from Oneida Lake.
Song sparrow blood and feather mercury
Thirty-nine song sparrows were sampled on Onondaga and Oneida Lakes in 2009 (Table 5).
Two of the three females banded in 2008 were recaptured in 2009. No males banded in 2008
(n = 17) were recaptured in 2009. We found no significant difference in blood Hg
concentrations between years at Onondaga Lake (Wilcoxon one-way test, chi-square = 0.53,
df = 1, P = 0.47); samples at other locations (Ninemile Creek, Wetzel Road [Seneca River]) and
the reference site at Oneida Lake were too small to permit analysis of between-year differences.
We observed no significant difference in blood Hg concentration between adult and hatch-year
SOSP at Onondaga Lake (Wilcoxon one-way test, chi-square = 0.02, df = 1, P = 0.89). Blood
Hg concentrations for both age groups were pooled for subsequent statistical analyses. Blood Hg
concentrations differed significantly among study areas (Kruskal-Wallis one-way test; chi-square
= 21.85, df = 3, P < 0.001). A post-hoc multiple comparison test found significant differences in
blood Hg between the reference site and both Ninemile Creek and Onondaga, and between
Onondaga and both Ninemile Creek and Seneca (Figure 7). Summary statistics for SOSP blood
Hg are provided in Table 5.
Table 5. Summary statistics of blood-Hg concentrations (µg/g ww) in song sparrows for adults and hatch-year birds
(2009).
Location mean ± SD (n)
Onondaga 1.05 ± 0.704 (23)
Maple Bay 1.15 (1)
Beach 0.943 ± 0.602 (9)
Harbor Brook 1.08 ± 0.780 (8)
Ley Creek 0.576 (1)
White Cliffs 1.34 ± 1.01 (4)
Ninemile Creek 0.313 ± 0.165 (9)

Biodiversity Research Institute Page 24
Wetzel Road 0.200 ± 0.195 (4)
Reference (Oneida) 0.058 ± 0.014 (3)
Figure 7. Quantile box plots showing blood-Hg concentrations in song sparrows from four study areas from 2009.
Brackets and associated probability values indicate significant differences between pairs based on Steel-Dwass
comparison. Sample sizes: Onondaga = 23, Ninemile Creek = 9, Seneca (Wetzel)= 4, Reference (Oneida Lake) = 3.
Song sparrow tail feathers from 2009 (n = 31) were analyzed for total Hg (Table 6). There was a
significant difference between adult and hatch year birds (Wilcoxon one-way test, chi-square =
6.40, df = 1, P = 0.01); therefore, we excluded hatch year birds in further analyses. Two of seven
hatch-year SOSP tested had extremely high (53.6 and 26.4 µg/g) tail feather Hg concentrations.
Feather Hg concentrations differed significantly among the four sampling areas (Kruskal-Wallis
one-way test; chi-square = 14.13, df = 3, P = 0.003); a post-hoc multiple comparison test found
differences in feather-Hg concentrations only between Onondaga and Oneida Lakes; all other
comparisons were similar (Figure 8).
0.0
0.5
1.0
1.5
2.0
2.5
3.0
Onondaga 9-Mile Creek Seneca Reference
Mea
n B
loo
d-H
g (μg
/g w
w) P = 0.035
P = 0.004P = 0.032
Biodiversity Research Institute Page 25
Table 6. Summary statistics of adult song sparrow feather-Hg concentrations (µg/g fw) 2009.
Location n mean ± SD LCL UCL
Onondaga Lake 17 4.454 ± 3.613 2.597 6.312
Beach 7 2.337 ± 0.832 1.568 3.107
Maple Bay 1 10.475 — —
Ley Creek 1 1.369 — —
Harbor Brook 4 4.217 ± 3.533 –1.404 9.839
White Cliffs 4 7.661 ± 4.031 1.247 14.075
Ninemile Creek 7 1.674 ± 0.918 0.968 2.380
Wetzel Road, Seneca
4 1.107 ± 0.720 –0.038 2.252
Reference (Oneida) 3 0.300 ± 0.122 –0.004 0.604

Biodiversity Research Institute Page 26
Figure 8. Quantile box plots showing feather Hg concentrations in adult song sparrows in four study areas 2009.
Brackets and associated probability values indicate significant differences between pairs based on Steel-Dwass
comparison. Sample sizes: Onondaga = 17, Ninemile Creek = 9, Seneca (Wetzel) = 4, Reference (Oneida Lake) = 3.
In 2009, 64% of adult SOSP sampled on Onondaga Lake had blood Hg concentrations that
exceeded the 0.7 µg/g blood Hg levels considered by Jackson et al. (2011) to cause a 10%
reduction in nest success in Carolina wrens. Twenty-four percent of SOSP had blood Hg
concentrations that exceeded the 1.2 µg/g Hg threshold associated with 20% reduction in nest
success in Carolina wrens (Table 7).
Me
an
Fe
ath
er-
Hg (μg
/g f
w)
0
2
4
6
8
10
12
14
Onondaga 9-Mile Creek Seneca Reference
P = 0.041

Biodiversity Research Institute Page 27
Table 7. Summary of estimated percent of sampled birds that exceed published effect levels on Onondaga Lake, 2008-
2009. Blood and feather threshhold values are based on Jackson et al. 2011 study with adult Carolina wrens.
Species Study Area Year Blood Tail Feather
%> 0.63
µg/g
%> 0.70
µg/g
% > 1.2
µg/g
%> 3.0
µg/g
%> 4.7
µg/g
TRES Onondaga 2008 33% 20% 13% — —
2009 5.5% 2.7% — —
Overall 15% 8.6% 4.3% — —
Ninemile Creek
2009 20% 20% 0% — —
RWBL Onondaga 2008 41% 41% 26% 0% 0%
2009 37% 37% 19% 0% 0%
Overall 39% 39% 22% 0% 0%
Ninemile Creek
2009 1.1% 1.1% 1.1% 0% 0%
SOSP Onondaga 2008 79% 68% 47% — —
2009 71% 64% 24% 47% 29%
Overall 75% 67% 36% 47% 29%
Ninemile Creek
2009 11% 11% 0% 11% 0%
SPSA Onondaga & Ninemile Creek
2008 100% 100% 100% — —
2009 88% 88% 63% 6.3% 6.3%
Overall 89% 89% 68% 6.3% 6.3%

Biodiversity Research Institute Page 28
Species Study Area Year Blood Tail Feather
%> 0.63
µg/g
%> 0.70
µg/g
% > 1.2
µg/g
%> 3.0
µg/g
%> 4.7
µg/g
All other
species
Onondaga 2008 24% 22% 10% 0% 0%
2009 43% 41% 39% 80% 80%
Overall 32% 30% 23% 50% 50%
Ninemile Creek
2009 40% 40% 20% — —
Spotted sandpipers
Twenty-four SPSA were captured and sampled for blood Hg on Onondaga Lake and Ninemile
Creek in 2008 and 2009. Data for 2008 (n = 3) and 2009 (n = 21) were pooled due to sample
size considerations.
Blood Hg concentrations in adult SPSA at Onondaga (excluding Ninemile Creek) averaged 2.49
± 1.72 SD µg/g Hg (n = 17), among the highest averages of all species sampled on the lake.
Adults at both sites (Onondaga Lake and Ninemile Creek) had higher blood Hg levels than
hatch-year birds (Wilcoxon one-way test; Onondaga: chi-square = 4.36, df = 1, P = 0.04; small
sample sizes at Ninemile Creek precluded formal hypothesis testing). No differences in blood
Hg concentrations were observed among the Beach, Harbor Brook, White Cliffs, and Ninemile
Creek in adult sandpipers (Kruskal-Wallis one-way test; chi-square = 3.60, df = 3, 15; P = 0.31).
Sandpipers were not captured at Oneida likely because of lack of available habitat. Only two
were observed during the study period.
If we apply the effects threshold developed for songbirds by Jackson et al. (2011), nearly 90% of
the adult SPSA exceeded the blood Hg threshold of 0.7 µg/g Hg associated with a 10% reduction
in nest success, and 68% exceeded the blood-Hg threshold of 1.2 µg/g Hg associated with a 20%

Biodiversity Research Institute Page 29
nest reduction. Tail feather Hg concentrations were adults: mean = 2.74 ± 6.17 SD n = 19; and
hatch-year: mean = 1.97 ± 0.71 SD, n = 6, but one bird with 25.7 µg/g Hg exceeded the 99%
reduction threshold for nest success for Carolina wrens (at 19.5 µg/g Hg in feathers Jackson et al.
2011 modeled a 99% reduction in nesting success). Spotted sandpipers were not sampled on
Oneida Lake. We conducted a survey for SPSA on July 9, 2009, to estimate the population size
of the species on Onondaga Lake in case this species was to be selected for future Hg risk
assessment. Two observers boated the perimeter of Onondaga Lake, into Ninemile Creek, and
approximately 8 km downstream on the Seneca River, staying within approximately 30 m of the
shoreline. Coordinates for every SPSA were logged on a GPS. Forty-five SPSA were recorded,
with 36 observed along the shoreline of Onondaga Lake, eight on Ninemile Creek between the
I-690 Bridge and the creek outlet, and one on the Seneca River (Figure 9). The majority of
observations (24 of 45) were at sites Beach and White Cliffs.

Biodiversity Research Institute Page 30
Figure 9. Map of spotted sandpiper sightings on July 9, 2009, on Onondaga Lake and Seneca River.

Biodiversity Research Institute Page 31
Blood mercury in non-target species
We sampled 164 non-target birds (including 4 piscivores) and analyzed 164 blood Hg and 14
adult feather Hg samples (from species likely to have high Hg exposure; e.g., invertivores such
as American redstart and piscivores such as the belted kingfisher); remaining feathers were
archived at BRI’s WRML. Blood Hg at the reference site on Oneida Lake ranged from a
minimum of 0.025 µg/g in a northern cardinal to a maximum of 0.235 µg/g in a great-crested
flycatcher; on the Seneca River sites blood ranged from a minimum of 0.001 µg/g in an
American goldfinch to a maximum of 0.140 µg/g in a warbling vireo; on Onondaga Lake from a
minimum of 0.001 µg/g in an American goldfinch to a maximum of 7.17 µg/g in a European
starling (both birds captured at Ley Creek); and on Ninemile Creek the minimum blood Hg
concentration was 0.003 µg/g in an American goldfinch and the maximum was 4.12 µg/g in a
gray catbird (Appendix A). The birds from the southwest area of the lake generally had higher
blood Hg concentrations.
Onondaga Lake and Ninemile Creek had a number of individuals of non-target species with
blood Hg concentrations that exceeded the estimated effect concentrations of 0.70 and 1.2 µg/g
(Appendix A). None of the sampled birds at either of the Seneca River sites or at the Oneida
Lake site exceeded the effect thresholds. Two non-target invertivore birds exceeded an
estimated 99% reduction of nesting success for the Carolina wren based on blood Hg (5.6 µg/g
Hg) or tail feather Hg (19.5 µg/g Hg; Jackson et al. 2011), an adult female European starling (7.2
µg/g blood Hg) and an adult female American redstart (6.2 µg/g blood Hg).
We sampled two piscivorous species – three adult belted kingfishers (blood Hg=1.8 – 3.0 µg/g)
and one hatch-year green heron (blood Hg=0.3 µg/g) (Appendix A). There are no effect levels
published for these species, but (except for one kingfisher with a blood Hg concentration of 3.01
µg/g), they did not exceed the effect levels for piscivorous birds based on common loon studies
(3 µg/g in blood; 40 µg/g in feathers; Evers et al. 2008).
Blood mercury in recaptured birds
Of all birds banded and sampled in 2008, eleven were recaptured and sampled in 2009. Six of
the recaptured birds were tree swallows and we found a significant increase in blood Hg levels
Biodiversity Research Institute Page 32
between the two years (Wilcoxon signed-rank, Z = –3.06, P = 0.002; Table 8), although some of
this increase may be attributable to birds nesting at a different, and potentially more
contaminated, site in 2009 vs. 2008.
Table 8. Blood mercury concentrations (µg/g ww) in recaptured adult tree swallows from 2008 to 2009.
Site Band # Sex
Dates Hg
% Change
Maple Bay
Maple Bay
2311-555-39 F
May 24, 2008
May 21, 2009
0.417
0.317
–24%
Maple Bay
Maple Bay
2311-555-42 F
May 25, 2008
June 2, 2009
0.425
0.388
–9%
Canal
Wetzel Road
2311-555-43 F
May 25, 2008
June 2, 2009
0.215
0.349
62%
Canal
Maple Bay
2311-555-48 F
June 9, 2008
June 8, 2009
0.134
0.302
125%
Canal
Maple Bay
2311-555-58 F
June 18, 2008
June 2, 2009
0.199
0.352
77%
Oneida (ref.)
Oneida (ref.)
2311-555-55 F
June 11, 2008
May 28, 2009
0.058
0.071
23%
Inter-lab comparison blood Hg-lab splits
There was no difference in total Hg concentrations as determined by TERL and BRI WMRL
(Wilcoxon signed rank; S = –20, P = 0.13). In addition, the average relative percent difference
between labs was 13% where the EPA allows 20% (USEPA 1998; Table 9).

Biodiversity Research Institute Page 33
Table 9. Blood Hg split results from the same bird, analyzed at TERL and BRI WMRL, 2009. RPD = relative percent
difference.
TERL BRI WMRL
Band # Species TERL ID Hg
µg/g
WMRL ID Hg µg/g RPD*
1232-310-78 RWBL T9087-041 0.190 A9BK0003 0.168 12%
1232-870-07 RWBL T9087-042 1.11 A9BK0032 1.041 6%
1232-870-14 RWBL T9087-043 0.152 A9BK0039 0.099 42%
1232-870-15 AMRO T9087-044 0.134 A9BK0040 0.127 5%
1533-075-53 BEKI T9087-045 3.30 A9BK0043 3.01 9%
1533-075-
53R
BEKI T9087-046 3.25 A9BK0044 3.35
3%
1573-580-42 BEKI T9087-047 1.62 A9BK0056 1.77 9%
2301-530-66 GRCA T9087-048 0.302 A9BK0063 0.302 0%
2301-530-87 BAOR T9087-049 0.559 A9BK0085 0.529 6%
2301-530-95 RWBL T9087-050 0.106 A9BK0092 0.096 10%
2351-075-95 TRES T9087-051 0.37 A9BK0158 0.362 2%
2391-692-17 TRES T9087-052 0.099 A9BK0179 0.060 49%
Unb-GRHE GRHE T9087-054 5.45 A9BK0265 4.97 9%
2510-023-76 AMGO T9087-053 < DL** A9BK0235 0.007 —
*RPD=Relative Percent Difference is used to evaluate duplicate samples, these are not true
duplicates.
**Below detection limit.

Biodiversity Research Institute Page 34
Stable isotopes in blood
Blood from adult birds of selected species sampled in 2009 was analyzed for stable isotopes of
nitrogen (δ15N ) and carbon (δ
13C ) to assess the effect of trophic position and foraging habitat on
blood Hg concentrations. Statistical analyses were performed on SOSP, TRES, and RWBL data.
Blood Hg was significantly predicted by δ15
N (F = 24.4, P < 0.0001, r2 adjusted = 0.33) and we
found no among-site differences in δ15N for any of the three species (Table 10). Blood Hg
concentrations in birds were not predicted by δ13
C (F = 2.03, P = 0.16, r2 adjusted = 0.02).
Based on samples collected at Onondaga (i.e., excluding the limited data obtained at the
reference site), δ15
N is significantly greater in females than in male RWBL (Wilcoxon one-way
test, chi-square = 14.47, df = 1, P < 0.001), and δ13
C is significantly greater in males than in
females (Wilcoxon one-way test, chi-square = 9.65, df = 1, P = 0.002). δ13C was significantly
different among locations for RWBL and TRES.
Table 10. Among-site (Onondaga, Ninemile Creek, Seneca, Reference) comparison of blood-Hg, δ13C and δ15N in
red-winged blackbird (RWBL), song sparrow (SOSP), and tree swallow (TRES) from 2009. Analyses based on Kruskal-
Wallis one-way test.
Sample sizes
Analysis -Species Ninemile
Creek
Onondaga Reference Seneca chi-
square
df P
blood Hg - RWBL 9 55 20 10 19.63 3 < 0.001
δ13C - RWBL 9 28 7 8 14.64 3 0.002
δ15N - RWBL 9 28 7 8 5.28 3 0.15
blood Hg - SOSP 9 41 6 5 34.78 3 < 0.001
δ13C - SOSP 9 20 2 4 0.26 3 0.97
δ15N - SOSP 9 20 2 4 3.96 3 0.27
blood Hg - TRES 5 44 22 12 51.05 3 < 0.001
δ13C - TRES 3 18 9 7 22.85 3 < 0.001
δ15N - TRES 3 18 9 7 4.47 3 0.22

Biodiversity Research Institute Page 35
Documented physical deformities
We captured six birds with physical deformities on Onondaga Lake and one from Oneida Lake
(Table 11, Figure and 11). The cause(s) of these deformities is/are unknown.
Table 11. Documented morphological deformities in birds captured on Onondaga and Oneida Lakes in 2009.
Site Species Blood Hg Deformities
Onondaga Lake
Maple Bay Yellow warbler 0.277 legs/feet enlarged from fungus/mites
Ley Creek Baltimore Oriole 1.39 abscess (infection) on chin/throat,
Ley Creek Song sparrow 0.679 right leg is bent/odd growth at intertarsal joint
Ley Creek Yellow warbler 1.37 fungus/mites on feet
Ley Creek Yellow warbler 1.88 legs/feet enlarged from fungus/mites
Ninemile Creek American robin 0.248 right leg missing below intertarsal joint
Oneida Lake Tree swallow 0.313 broken lower mandible, damaged scalp

Biodiversity Research Institute Page 36
Figure 10. Baltimore oriole with abnormal throat growth, Onondaga Lake, 2009.
Figure 11. Tree swallow with lower mandible half-missing, Oneida Lake 2009.

Biodiversity Research Institute Page 37
DISCUSSION
Mercury exposure in birds
Blood mercury
Based on two years of sampling, we found that Hg concentrations in all sampled species are
significantly higher on Onondaga Lake and Ninemile Creek than at the reference site on Oneida
Lake. Based on the blood Hg concentrations, breeding SPSA on Onondaga Lake appear to be at
the greatest risk from Hg exposure. In 2009, 14 of 16 adult SPSA (88%) sampled exceeded the
blood Hg effects threshold of 0.70 μg/g and 63% exceeded 1.2 μg/g (Table 7), (range = 0.865–
4.4 μg/g ww). We grouped SPSA from Onondaga and Ninemile Creek study sites because some
individuals were documented at both study areas.
Of the three target songbird species sampled, TRES tended to have lower blood Hg
concentrations than RWBL and SOSP.
Feather mercury
Twenty-three of 108 invertivore tail feathers (21%) were above 3.0 μg/g Hg, the tail feather Hg
concentration associated with 10% reduction in nest success in Carolina wrens (Jackson et al.
2011) and none of 10 feathers analyzed from Oneida Lake exceeded 3 μg/g Hg. Feathers reflect
the body burden of Hg at the time of molt. Knowing the time of molt or feather replacement for
each species sampled is critical to making meaningful interpretations. All three target songbird
species sampled molt their flight feathers once a year on the breeding grounds post-breeding
(Pyle 1997). The SPSA molts in September and November, or post-breeding and during
migration (Pyle 2008). It is likely that feathers collected from adult birds were post-molt 2008
and pre-molt 2009, i.e. grew during the previous year. Philopatry studies in TRES (Winkler et
al. 2004) suggest that TRES are site faithful, with only a small percentage of the breeding
population dispersing to a different area.

Biodiversity Research Institute Page 38
Egg mercury
Mercury concentrations in TRES eggs were greater than RWBL eggs probably because at the
time of egg-laying, female RWBL might be foraging at a lower trophic level and consuming a
more terrestrial-based diet than the aquatic-based insectivorous TRES. In 2008, 14 of 36 TRES
eggs from 11 nests (39%) were above 0.11 μg/g (ww). In 2009, eight out of 17 eggs (47%) were
above 0.11 μg/g. Only two of 15 RWBL eggs (13%) exceeded the 0.11 μg/g concentration.
Tree swallow and RWBL eggs collected at Harbor Brook on Onondaga Lake had the highest Hg
concentration suggesting that a greater source of Hg contamination might be in that area.
Stable Isotopes and Hg in Bird Blood
Mercury in the form of methylmercury that enters food webs is accumulated by organisms at
lower trophic levels and is magnified by consumers at higher levels in the food web. This
process of bioaccumulation and biomagnification of contaminants represents a significant health
risk for wildlife populations. The ratio of stable isotopes of nitrogen (15
N and 14
N, reported as
δ15
N) and carbon (13
C and 12
C, reported as δ13
C) measured in producers and consumers can help
describe food web pathways leading from the base of the food web up to the top predators
(Peterson and Fry 1987) which helps in understanding trophic interactions that may vary across
time and space.
The combination of δ15
N and δ13
C analysis provides a two-dimensional interpretation of food
web dynamics and, in conjunction with contaminant chemistry, can provide a detailed
assessment of the primary routes of contaminant transfer and biomagnification up to top-level
predators (Rasmussen and Vander Zanden 2004). Moving up through a food web, δ15
N values
show a consistent enrichment of the heavier nitrogen isotope (15
N) because organisms
preferentially excrete the lighter nitrogen isotope (14
N). This produces a trophic level shift of
approximately 3‰, allowing for trophic position of particular components of the food web to be
determined quantifiably. By contrast, there is very little enrichment of δ13
C values through a
food web (<1.0‰ is generally understood), but instead reflects the dietary preference at each
trophic level (Peterson and Fry 1987).

Biodiversity Research Institute Page 39
In RWBL, blood Hg was significantly and positively related to δ15
N, but not to δ13
C, suggesting
that trophic position for RWBL is a stronger predictor of blood Hg than habitat or carbon source.
The different δ15
N found in female RWBL suggests that they feed (1) at a higher trophic level,
and/or (2) on an aquatic invertebrate based diet than male RWBL. The higher trophic position
best explains the higher blood Hg concentrations in female RWBL than male RWBL.
In general, neither δ13
C nor δ15
N were significantly different by species between study areas
suggesting that both trophic position (δ15
N) and foraging habitat (δ13
C) were similar between
treatments. We, therefore, conclude that the birds sampled from Onondaga Lake have
significantly higher Hg concentrations because of higher contamination levels in the lake and not
because they are foraging at a higher trophic level on Onondaga vs. Oneida Lakes.
Conclusions
The 2008-2009 study demonstrates that Hg concentrations in all target species are significantly
higher on Onondaga Lake than the reference site on Oneida Lake. Many individuals had blood
Hg levels exceeding the 10% nest success reduction threshold for the Carolina wren (fewer nests
fledging at least one young) of 0.7 µg/g (ww) and a proportion exceeded the 20% threshold of
1.2 µg/g Hg. Female RWBL appear to accumulate greater concentrations of Hg than male
RWBL. All but two sampled SPSA had blood Hg levels above 0.7 and the majority of
shorebirds sampled had blood Hg levels exceeding 1.2 µg/g (ww). Only a few songbird eggs
exceeded the egg LOAEL of 0.2 µg/g. Stable isotope (δ13
C and δ15
N) data revealed differences
in the foraging behavior between the three target songbirds and also highlighted the importance
of understanding both site-specific processes and trophic level interactions that can influence
birds’ susceptibility to Hg bioaccumulation.
Acknowledgements
This study was funded by the U.S. Fish and Wildlife Service. We thank Anne Secord and the
U.S. Fish and Wildlife Service for their logistical support and field assistance. We are grateful to
Anna Harris for her hard field work and project dedication. We thank the Cornell Biological
Field Station at Shackelton Point, Oneida Lake for access to their tree swallow nest boxes and

Biodiversity Research Institute Page 40
for allowing songbird mistnetting on their property. We thank Mario Montesdeoca and Syracuse
University for access to lab facilities in the Center for Environmental Systems Engineering Lab.
We thank Dr. Taylor and Deb Perry from the TERL of Texas A&M, and Dr. Michener at Boston
University for Hg and stable isotope analyses. We thank Melissa Duron for sample handling and
maintaining QA/QC of samples and data.
LITERATURE CITED
Aldrich, J.W. 1984. Ecogeographical variation in size and proportions of Song sparrows
(Melospiza melodia). Ornithol. Monog. 35: 1-134.
Arcese, P., M.K. Sogge, A.B. Marr, and M.A. Patten. 2002. Song sparrow (Melospiza melodia).
In The Birds of North America, No. 704 (A. Poole and F. Gill, eds.). The Birds of North
America, Inc. Philadelphia, PA.
Bearhop S., G.D. Ruxton, and R.W. Furness. 2000. Dynamics of mercury in blood and feathers
of Great Skuas. Environ. Toxicol. and Chem. 19:1638-1643.
Beyer, W.N., E.E. Connor, and S. Gerould. 1995. Estimates of soil ingestion by wildlife.
Journal Wildl. Manage. 58(2):375-382.
Bird, R.D. and L.B. Smith. 1964. The food habits of the red-winged blackbird, Agelaius
phoeniceus, in Manitoba. Canadian Field-Naturalist. 78: 179-186.
Blancher, P.J. and D.K. McNicol. 1991. Tree swallow diet in relation to wetland acidity.
Canadian Journal of Zoology. 69:2629-37.
Boudou, A., M. Delnomdedieu, D. Georgescauld, F. Ribeyre, and E. Sauter. 1991. Fundamental
roles of biological barriers in mercury accumulation and transfer in freshwater
ecosystems (analysis at organism, organ, cell, and molecular levels). Water Air Soil
Pollution. 56:807-821.
Buck D.G., K. Regan, T. Divoll, D. Yates and S. de la Sota. 2012. Mercury in the invertivore
food web of Onondaga Lake. Submitted to U.S. Fish and Wildlife Service, Cortland,
New York, by Biodiversity Research Institute, Gorham, Maine.
Biodiversity Research Institute Page 41
Burger, J. 1993. Metals in avian feathers: bioindicators of environmental pollution. Reviews in
Environ. Toxicol. 5:203-311.
Burgess, N.M. and M.W. Meyer. 2008. Methylmercury exposure associated with reduced
productivity in common loons. Ecotoxicology 17:83-91.
Condon, A. and D. Cristol. 2009. Feather growth influences blood mercury in young songbirds.
Environ. Toxicol. Chem. 28:395-401.
Custer, T.W., C.M. Custer, K. Dickerson, K. Allen, M.J. Melancon, and L.J. Schmidt. 2001.
Polycyclic aromatic hydrocarbons, aliphatic hydrocarbons, trace elements, and
monooxygenase activity in birds nesting on the North Platte River, Casper, Wyoming,
USA. Environ. Toxicol. And Chem. 20:624-631.
Custer, T.W., C.M. Custer, K.M. Johnson, and D.J. Hoffman. 2008. Mercury and other element
exposure to tree swallows (Tachycineta bicolor) nesting on Lostwood National Wildlife
Refuge, North Dakota.
Edmonds, S.T., D.C. Evers, D.A. Cristol, C. Mettke-Hofmann, L.L. Powell, A.J. McGann,
J.W. Armiger, O.P. Lane, D.F. Tessler, P. Newell, K. Heyden, and N.J. O’Driscoll.
2010. Geographic and seasonal variation in mercury exposure of the declining Rusty
Blackbird. Condor 112(4):789-799.
Evers, D.C. 2009. Biodiversity Research Institute: Protocol for collecting bird and mammal
tissue for contaminant analysis. Report BRI 2009-01, Biodiversity Research Institute,
Gorham, Maine.
Evers, D.C, N.M. Burgess, L. Champoux, B. Hoskins, A. Major, W. Goodale, R. Taylor, and
T. Daigle. 2005. Patterns and interpretation of mercury exposure in freshwater avian
communities in Northeastern North America. Ecotoxicology 14:193-222.
Evers, D.C., O. Lane, L. Savoy, and D. Yates. 2006. Summary of wildlife mercury exposure for
the Nyanza Superfund Project. BRI report 2003-04. Submitted to Avatar Environmental,
West Chester, Pennsylvania.
Evers, D.C., L.J. Savoy, C.R. DeSorbo, D.E. Yates, W. Hanson, K.M. Taylor, L.S. Siegel,
J.H. Cooley, Jr., M.S. Bank, A. Major, K. Munney, B.F. Mower, H.S. Vogel, N. Schoch,

Biodiversity Research Institute Page 42
M. Pokras, M.W. Goodale, and J. Fair. 2008. Adverse effects from environmental
mercury loads on breeding common loons. Ecotoxicology 17:69-81.
Gerrard, P.M. and V.L. St. Louis. 2001. The effects of experimental reservoir creation on the
bioaccumulation of methylmercury and reproductive success of tree swallows
(Tachycineta bicolor). Environ. Science & Technology 35:1329-1338.
Hallinger, K.K., D.J. Zabransky, K.A. Kazmer, and D.A. Cristol. 2010. Birdsong differs
between mercury-polluted and reference sites. Auk 127(1):156-161.
Heinz, G., D. Hoffman, J. Klimstra, K. Stebbins, S. Kondrad, and C. Erwin. 2009. Species
differences in the sensitivity of avian embryos to methylmercury. Archives of Environ.
Contam. and Toxicol. 56:129-38.
Hobson, K.A. and R.G. Clark. 1993. Turnover of 13
C in cellular and plasma fractions of blood:
implications for nondestructive sampling in avian dietary studies. Auk 110:638-641.
Hobson, K.A. and R.G. Clark. 1994. Assessing avian diets using stable isotopes I: turnover of
13C in tissues. Condor 94:181-188.
Jackson, A., D.C. Evers, M.A. Etterson, A.M. Condon, S.B. Folsom, J. Detweiler, J. Schmerfeld,
and D.A. Cristol. 2011. Mercury exposure affects the reproductive success of a
free-living terrestrial songbird, the Carolina wren (Thryothorus ludovicianus). Auk
128:759-769.
Lane, O.P., D. Buck, D.C. Evers, S. Edmonds, and A. Jackson. 2011. Pilot assessment of
mercury and PCB exposure in birds breeding at Onondaga Lake. Report BRI 2010-12
submitted to U.S. Fish and Wildlife Service, Cortland, New York. Biodiversity Research
Institute, Gorham, Maine.
McCarty, J.P. and D.W. Winkler. 1999. Foraging ecology and diet selectivity of tree swallows
feeding nestlings. Condor 101: 246-254.
McNicol, D.K., R.J. Robertson, and P.J. Weatherhead. 1982. Seasonal, habitat, and sex-specific
food habits of Red-winged blackbirds: implications for agriculture. Can. J. Zool.
60:3282-3289.

Biodiversity Research Institute Page 43
Michener, R. and K. Lajtha (eds.). 2007. Stable Isotopes in Ecology and Environmental Science
(2nd Edition). Blackwell Publishing, Ltd. Oxford, United Kingdom. 566pp.
Microsoft Excel. 2010. Version 14.0. Microsoft Corporation.
Oring, L.W., E.M. Gray, and J.M. Reed. 1997. Spotted sandpiper (Actitis macularius). In The
Birds of North America, No. 289 (A. Poole, Ed.). Philadelphia: The Academy of
Natural Sciences; Washington, DC: The American Ornithologists’ Union.
Peterson, B.J. and B. Fry. 1987. Stable isotopes in ecosystem studies. Annual Review of
Ecology and Systematics 18: 293-320.
Pyle, P. 1997. Identification guide to North American Birds. Part 1. Slate Creek Press, Bolinas,
California. 732pp.
Pyle, P. 2008. Identification guide to North American Birds. Part II. Slate Creek Press, Bolinas,
California. 835pp.
Quinney, T.E. and C.D. Ankney. 1985. Prey size selection by Tree swallows. Auk
102:245-250.
Rasmussen J.B. and M.J. Vander Zanden. 2004. The variation of lake food webs across the
landscape and its effect on contaminant dynamics. Pp. 169-182 in G.A. Polis,
M.E. Power, and G.R. Huxel, eds., Food webs at the landscape scale. The University of
Chicago Press, Chicago, Illinois.
Rimmer, C.C., K.P. McFarland, D.C. Evers, E.K. Miller, Y. Aubrey, D. Busby, and R.J. Taylor.
2005. Mercury concentrations in Bicknell's thrush and other insectivorous passerines in
montane forests of northeastern North America. Ecotoxicology 14:223-240.
Robertson, R.J., B.J. Stutchbury, and R.R. Cohen. 1992. Tree swallow. In The Birds of North
America, No. 11 (A. Poole, P. Stettenheim, and F. Gill, Eds.). Philadelphia: The
Academy of Natural Sciences; Washington, DC. The American Ornithologists’ Union.
SAS. 2003. JMP Version 5.0. SAS Institute, Inc. Cary, North Carolina.

Biodiversity Research Institute Page 44
Secord, A.L., J.P. McCarty, K.R. Echols, J.C. Meadows, R.W. Gale, D.E. Tillitt. 1999.
Polychlorinated biphenyls and 2,3,7,8-tetrachlorodibenzo-p-dioxin equivalents in tree
swallows from the upper Hudson River, New York State, USA. Environ. Toxicol. Chem.
18: 2519-2525.
TAMS and YEC Inc. 2002. Onondaga Lake Baseline Ecological Risk Assessment. Original
document prepared by Exponent, Bellevue, Washington, for Honeywell, East Syracuse,
New York. Revision prepared by TAMS, New York, New York, and YEC, Valley
Cottage, New York, for New York State Department of Environmental Conservation,
Albany, New York.
U.S. Environmental Protection Agency. 1998. Mercury in solids and solutions by thermal
decomposition, amalgamation, and atomic absorption spectrophotometry. Method 7473.
U.S. Environmental Protection Agency, Washington, DC.
U.S. Fish and Wildlife Service. 2005. Natural Resource Damage Preassessment Screen for
Onondaga Lake, Onondaga County, New York. Original document prepared by
K. Karwowski, U.S. Fish and Wildlife Service, Cortland, New York. 31pp.
Winkler, D.W., P.H. Wrege, P.E. Allen, T.L. Kast, P. Senesac, M.F. Wasson, P.E. Llambías,
V. Ferretti, and P.J. Sullivan. 2004. Breeding dispersal and philopatry in the tree
swallow. Condor 106:768-776.

Biodiversity Research Institute Page 45
Appendix A. Summary of blood and feather mercury data, 2008-2009.
Species Site Year Age Blood mercury (µg/g ww) Feather mercury (µg/g fw)
n Mean ± SD Min., Max. 95% CI n Mean ± SD Min.,
Max.
95% CI
Green heron Harbor Brook 2009 HY 1 0.303 — — — — — —
Killdeer White Cliffs 2008 Ad. 2 1.250 ± 0.014 1.240, 1.260 1.123, 1.38 — — — —
Spotted
sandpiper
Ninemile
Creek
2009 7 0.964 ± 0.858 0.245, 2.58 0.171, 1.76 4 0.914 ± 0.40 0.480,
1.448
0.278, 1.55
Beach 2008 Ad. 1 1.56 — — — — — —
2009 Ad. 8 2.373 ± 1.50 1.082, 4.969 1.12, 3.63 8 4.50 ± 8.61 0.456,
25.703
–2.702, 11.7
2009 HY 1 0.368 — — 1 1.466
Harbor Brook 2008 Ad. 1 3.610 — — — — — —
White Cliffs 2008 Ad. 1 6.420 — — — — — —
2009 Ad. 4 2.587 ± 1.564 0.581, 4.400 0.098, 5.08 4 1.06 ± 0.71 0.250,
1.660
–0.063, 2.18
2009 HY 1 1.048 — — 1 2.473
Overall SPSA 24 2.045 ± 1.66 0.245, 6.420 1.345, 2.746 18 2.66 ± 5.80 0.250,
25.703
–0.228, 5.54

Biodiversity Research Institute Page 46
Species Site Year Age Blood mercury (µg/g ww) Feather mercury (µg/g fw)
Belted
kingfisher
Ninemile
Creek
2009 Ad. 1 1.77 — — 1 6.264 — —
Maple Bay 2008 Ad. 1 1.840 — — 1 35.742 — —
2009 Ad. 2 2.538 ± 0.668 2.065, 3.010 –3.468, 8.54 2 12.22 ± 8.84 5.963,
18.47
–67.3, 91.7
Overall BEKI Ad. 4 2.172 ± 0.573 1.772, 3.010 1.26, 3.083 4 16.6 ± 14.02 5.963,
35.74
–5.704, 38.9
Downy
woodpecker
Beach 2009 Ad. 1 0.032 — — — — — —
Maple Bay 2008 Ad. 3 0.170 ± 0.042 0.125, 0.209 0.065, 0.275 — — — —
Overall DOWO Ad. 4 0.135 ± 0.077 0.032, 0.209 0.013, 0.258 — — — —
Trail’s
flycatcher
Ninemile
Creek
2009 Ad. 3 0.949 ± 0.551 0.527, 1.572 –0.420, 2.317 — — — —
Beach 2008 Ad. 2 0.805 ± 0.054 0.767, 0.843 0.322, 1.288 — — — —
2009 Ad. 1 2.087 — — — — — —
Harbor Brook 2009 Ad. 2 2.758 ± 1.362 1.795, 3.720 –9.476,
14.991
— — — —
Overall TRFL Ad. 8 1.507 ± 1.059 0.527, 3.720 0.622, 2.393 — — — —
Willow Ninemile 2009 Ad. 2 0.670 ± 0.207 0.524, 0.817 –1.193, 2.534 — — — —

Biodiversity Research Institute Page 47
Species Site Year Age Blood mercury (µg/g ww) Feather mercury (µg/g fw)
flycatcher Creek
Harbor Brook 2009 Ad. 2 1.982 ± 0.298 1.771, 2.193 –0.699, 4.664 — — — —
Overall WIFL Ad. 4 1.326 ± 0.786 0.524, 2.193 0.076, 2.577 — — — —
Flycatchers
(Willow and
Trail’s
overall)
Overall Ad. 12 1.447 ± 0.943 0.524, 3.720 0.848, 2.046 — — — —
Great-
crested
flycatcher
White Cliffs 2008 Ad. 1 0.652 — — — — — —
Oneida (Ref.) 2009 Ad. 1 0.235 — — — — — —
Eastern
kingbird
Oneida (Ref.) 2009 Ad. 1 0.130 — — — — — —
Red-eye
vireo
Canal 2008 Ad. 2 0.113 ± 0.004 0.113, 0.119 0.078, 0.154 — — — —
Maple Bay 2008 Ad. 1 0.463 — — — — — —
White Cliffs 2008 Ad. 1 0.122 — — — — — —
Overall REVI Ad. 4 0.204 ± 0.173 0.113, 0.463 –0.070, 0.479 — — — —
Warbling
vireo
Canal 2008 Ad. 1 0.140 — — — — — —

Biodiversity Research Institute Page 48
Species Site Year Age Blood mercury (µg/g ww) Feather mercury (µg/g fw)
Maple Bay 2008 Ad. 9 0.278 ± 0.185 0.075, 0.609 0.136, 0.420 — — — —
Harbor Brook 2009 Ad. 1 0.215 — — — — — —
White Cliffs 2008 Ad. 2 0.279 ± 0.146 0.175, 0.382 –1.037, 1.594 — — — —
Overall WAVI Ad. 13 0.262 ± 0.162 0.075, 0.609 0.165, 0.360 — — — —
Northern
rough-
winged
swallow
White Cliffs 2008 Ad. 2 0.651 ± 0.141 0.552, 0.751 –0.613, 1.916 — — — —
Bank
Swallow
White Cliffs 2008 Ad. 1 0.353 — — — — — —
Tree swallow Ninemile
Creek
2009 Ad. 5 0.516 ± 0.146 0.326, 0.723 0.335, 0.697 — — — —
Beach 2008 Ad. 2 0.445 ± 0.040 0.416, 0.473 0.082, 0.807 — — — —
Canal 2008 Ad. 6 0.172 ± 0.033 0.134, 0.215 0.137, 0.206 — — — —
Maple Bay 2008 Ad. 5 0.405 ± 0.186 0.209, 0.693 0.174, 0.635 — — — —
2009 Ad. 15 0.325 ± 0.111 0.115, 0.546 0.264, 0.387 — — — —
Ley Creek 2008 Ad. 2 0.875 ± 0.319 0.649, 1.100 –1.991, 3.740 — — — —
2009 Ad. 9 0.263 ± 0.072 0.179, 0.415 0.207, 0.318 — — — —
Harbor Brook 2008 Ad. 2 1.490 ± 0.240 1.320, 1.660 –0.670, 3.650 — — — —

Biodiversity Research Institute Page 49
Species Site Year Age Blood mercury (µg/g ww) Feather mercury (µg/g fw)
2009 Ad. 7 0.539 ± 0.172 0.344, 0.830 0.380, 0.698 — — — —
Wetzel Rd. 2009 Ad. 7 0.312 ± 0.060 0.207, 0.391 0.257, 0.368 — — — —
White Cliffs 2008 Ad. 4 0.417 ± 0.055 0.373, 0.494 0.329, 0.504 — — — —
Overall TRES Ad. 64 0.408 ± 0.266 0.115, 1.660 0.342, 0.475 — — — —
Oneida (Ref.) 2008 Ad. 6 0.078 ± 0.029 0.058, 0.131 0.048, 0.108 — — — —
2009 Ad. 17 0.091 ± 0.064 0.035, 0.313 0.059, 0.124 — — — —
Ref. Overall TRES Ad. 23 0.088 ± 0.056 0.035, 0.313 0.064, 0.112 — — — —
Barn
Swallow
Ninemile
Creek
2009 Ad. 2 0.622 ± 0.122 0.535, 0.708 –0.474, 1.72 — — — —
Oneida (Ref.) 2009 Ad. 1 0.133 — — — — — —
Black-capped
chickadee
9-Miile Creek 2009 Ad. 1 0.167 — — — — — —
Maple Bay 2008 Ad. 1 0.369 — — — — — —
2008 HY 1 0.149 — — — — — —
2009 Ad. 1 0.557 — — — — — —
Harbor Brook 2009 Ad. 1 0.466 — — — — — —
2009 HY 1 0.326 — — — — — —
White Cliffs 2009 Ad. 1 0.430 — — — — — —
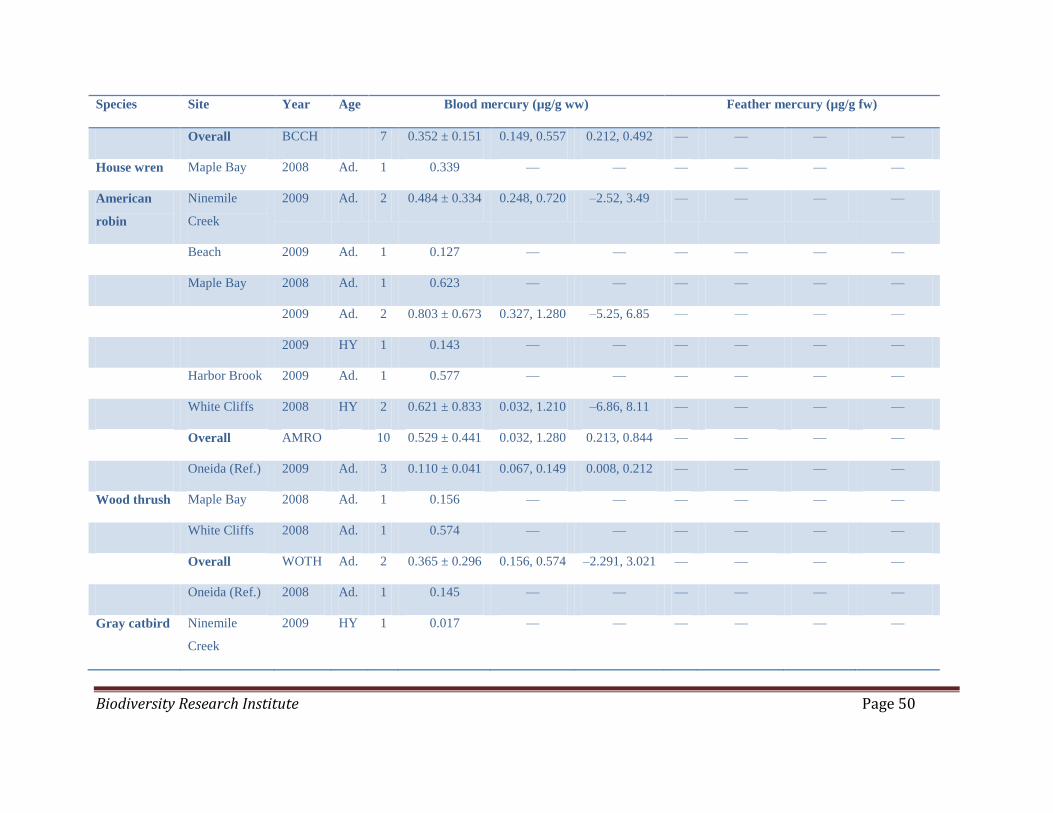
Biodiversity Research Institute Page 50
Species Site Year Age Blood mercury (µg/g ww) Feather mercury (µg/g fw)
Overall BCCH 7 0.352 ± 0.151 0.149, 0.557 0.212, 0.492 — — — —
House wren Maple Bay 2008 Ad. 1 0.339 — — — — — —
American
robin
Ninemile
Creek
2009 Ad. 2 0.484 ± 0.334 0.248, 0.720 –2.52, 3.49 — — — —
Beach 2009 Ad. 1 0.127 — — — — — —
Maple Bay 2008 Ad. 1 0.623 — — — — — —
2009 Ad. 2 0.803 ± 0.673 0.327, 1.280 –5.25, 6.85 — — — —
2009 HY 1 0.143 — — — — — —
Harbor Brook 2009 Ad. 1 0.577 — — — — — —
White Cliffs 2008 HY 2 0.621 ± 0.833 0.032, 1.210 –6.86, 8.11 — — — —
Overall AMRO 10 0.529 ± 0.441 0.032, 1.280 0.213, 0.844 — — — —
Oneida (Ref.) 2009 Ad. 3 0.110 ± 0.041 0.067, 0.149 0.008, 0.212 — — — —
Wood thrush Maple Bay 2008 Ad. 1 0.156 — — — — — —
White Cliffs 2008 Ad. 1 0.574 — — — — — —
Overall WOTH Ad. 2 0.365 ± 0.296 0.156, 0.574 –2.291, 3.021 — — — —
Oneida (Ref.) 2008 Ad. 1 0.145 — — — — — —
Gray catbird Ninemile
Creek
2009 HY 1 0.017 — — — — — —

Biodiversity Research Institute Page 51
Species Site Year Age Blood mercury (µg/g ww) Feather mercury (µg/g fw)
2009 Ad. 4 1.557 ± 1.756 0.266, 4.118 –1.237, 4.351 — — — —
Ninemile
Creek
(Overall)
GRCA 5 1.249 ± 1.669 0.017, 4.118 –0.824, 3.322 — — — —
Beach 2008 Ad. 1 1.110 — — — — — —
2009 Ad. 1 0.227 — — — — — —
Canal 2008 Ad. 1 0.177 — — — — — —
Maple Bay 2008 Ad. 2 0.252 ± 0.151 0.145, 0.358 –1.102, 1.605 — — — —
Ley Creek 2008 Ad. 1 0.625 — — — — — —
2009 Ad. 1 0.302 — — — — — —
Harbor Brook 2008 Ad. 1 0.616 — — — — — —
2009 Ad. 1 3.610 — — — — — —
White Cliffs 2008 Ad. 1 0.569 — — — — — —
2009 4 0.146 ± 0.053 0.115, 0.225 0.061, 0.230 — — — —
Overall GRCA 19 0.767 ± 1.144 0.017, 4.118 0.215, 1.318 — — — —
Oneida (Ref.) 2009 Ad. 1 0.154 — — — — — —
European
starling
Ley Creek 2009 Ad. 1 7.167 — — — — — —

Biodiversity Research Institute Page 52
Species Site Year Age Blood mercury (µg/g ww) Feather mercury (µg/g fw)
2009 HY 2 1.332 ± 1.029 0.604, 2.059 –7.911, 10.57 — — — —
Overall EUST 3 3.277 ± 3.447 0.604, 7.167 –5.285, 11.84 — — — —
Yellow
warbler
Ninemile
Creek
2009 Ad. 1 0.479 — — — — — —
Beach 2008 Ad. 1 0.809 — — — — — —
Maple Bay 2008 Ad. 1 0.237 — — — — — —
2009 Ad. 1 0.277 — — — — — —
Harbor Brook 2008 Ad. 2 1.975 ± 0.361 1.720, 2.230 –1.265, 5.215 — — — —
2009 Ad. 7 0.970 ± 0.592 0.379, 1.881 0.423, 1.517 — — — —
White Cliffs 2009 Ad. 1 1.040 — — — — — —
Overall YEWA Ad. 14 0.970 ± 0.653 0.237, 2.230 0.593, 1.347 — — — —
Oneida (Ref.) 2009 Ad. 1 0.068 — — — — — —
American
redstart
Maple Bay 2008 Ad. 7 0.395 ± 0.147 0.186, 0.572 0.259, 0.530 — — — —
Harbor Brook 2008 Ad. 2 2.335 ± 0.247 2.160, 2.510 0.111, 4.559 — — — —
2009 Ad. 5 3.902 ± 1.739 1.837, 6.155 1.743, 6.060 5 8.292 ± 1.19,
13.55
Overall AMRE Ad. 14 1.924 ± 1.932 0.186, 6.155 0.809, 3.040 5 8.292 ± 5.24 1.19,
13.55
1.79, 14.8

Biodiversity Research Institute Page 53
Species Site Year Age Blood mercury (µg/g ww) Feather mercury (µg/g fw)
Common
yellowthroat
Ninemile
Creek
2009 Ad. 1 0.250 — — — — — —
Northern
cardinal
Maple Bay 2008 Ad. 2 0.061 ± 0.15 0.050, 0.071 –0.073, 0.195 — — — —
Harbor Brook 2009 Ad. 1 0.164 — — — — — —
Overall NOCA Ad. 3 0.095 ± 0.061 0.050, 0.164 –0.055, 0.246 — — — —
Oneida (Ref.) 2009 Ad. 1 0.025 — — — —
Eastern
towhee
Ninemile
Creek
2009 Ad. 1 1.377 — — — — — —
Chipping
sparrow
Wetzel Road 2009 Ad. 1 0.047 — — — — — —
Swamp
sparrow
Harbor Brook 2009 Ad. 1 2.335 — — — — — —
White Cliffs 2009 HY 1 0.218 — — — — — —
Overall 2009 2 1.277 ± 1.497 0.218, 2.335 –12.17, 14.72 — — — —
Song
sparrow
Ninemile
Creek
2009 Ad. 9 0.313 ± 0.165 0.147, 0.706 0.186, 0.439 7 1.67 ± 0.918 0.152,
3.17
0.968, 2.380
Beach 2008 Ad. 3 0.769 ± 0.073 0.710, 0.850 0.589, 0.949 — — — —
2008 HY 1 0.502 — — — — — —

Biodiversity Research Institute Page 54
Species Site Year Age Blood mercury (µg/g ww) Feather mercury (µg/g fw)
2009 Ad. 7 0.914 ± 0.690 0.264, 2.257 0.275, 1.552 7 2.34 ± 0.833 0.845,
3.52
1.57, 3.11
2009 HY 2 1.047 ± 0.101 0.975, 1.119 0.137, 1.957 2 40.0 ± 19.24 26.4, 53.6 –132.9,
212.9
Canal 2008 Ad. 1 0.057 — — — — — —
Maple Bay 2008 Ad. 6 0.599 ± 0.202 0.307, 0.922 0.387, 0.811 — — — —
2009 Ad. 1 1.146 — — 1 10.47 — —
Ley Creek 2008 Ad. 2 0.988 ± 0.880 0.366, 1.610 –6.92, 8.89 — — — —
2009 Ad. 1 0.576 — — 1 1.37
Harbor Brook 2008 Ad. 4 2.067 ± 0.464 1.660, 2.700 1.329, 2.806 — — — —
2009 Ad. 4 1.037 ± 0.376 0.679, 1.567 0.439 4 4.217 ±
3.533
0.850,
9.146
–1.404, 9.84
2009 HY 4 1.129 ± 1.127 0.094, 2.504 –0.665, 2.923 4 4.483 ±
2.103
1.395,
5.827
1.137, 7.83
Wetzel Rd. 2009 Ad. 4 0.200 ± 0.195 0.021, 0.476 –0.110, 0.509 4 1.107 ±
0.720
0.117,
1.801
–0.039, 2.25
White Cliffs 2008 Ad. 4 2.373 ± 0.666 1.38, 2.81 1.313, 3.432 — — — —
2009 Ad. 4 1.344 ± 1.009 0.482, 2.793 -0.263, 2.950 4 7.661 ±
4.031
3.776,
12.910
1.247, 14.1

Biodiversity Research Institute Page 55
Species Site Year Age Blood mercury (µg/g ww) Feather mercury (µg/g fw)
Overall SOSP 57 0.948 ± 0.794 0.021, 2.810 0.738, 1.159 36 5.365 ±
9.580
0.117,
53.606
2.124, 8.61
Oneida (Ref.) 2008 Ad. 3 0.056 ± 0.015 0.047, 0.074 0.018, 0.094 — — — —
2009 Ad. 3 0.058 ± 0.013 0.049, 0.074 0.025, 0.091 3 0.300 ±
0.122
0.201,
0.437
–0.004,
0.604
Ref. Overall Ad. 6 0.057 ± 0.013 0.047, 0.074 0.044, 0.071 3 0.300 ±
0.122
0.201,
0.437
–0.004,
0.604
Brown-
headed
cowbird
Maple Bay 2008 Ad. 1 0.130 — — — — — —
Red-winged
blackbird
Ninemile
Creek
2009 Ad. 9 0.439 ± 0.761 0.096, 2.441 –0.147, 1.024 9 0.496 ±
0.499
0.098,
1.617
0.112, 0.879
Beach 2008 Ad. 5 0.673 ± 0.787 0.070, 1.910 –0.304, 1.651 — — — —
2009 Ad. 1 5.292 — — — — — —
Canal 2008 Ad. 2 0.234 ± 0.069 0.185, 0.283 –0.389, 0.857 — — — —
Maple Bay 2008 Ad. 6 1.095 ± 0.897 0.073, 2.210 0.153, 2.037 7 0.358 ±
0.432
0.111,
1.325
–0.042,
0.757
2009 Ad. 5 1.041 ± 1.011 0.145, 2.614 –0.214, 2.296 5 0.292 ±
0.283
0.068,
0.745
–0.059,
0.644
Ley Creek 2008 Ad. 7 0.373 ± 0.515 0.023, 1.270 –0.103, 0.850 7 0.299 ± 0.101, 0.057, 0.542

Biodiversity Research Institute Page 56
Species Site Year Age Blood mercury (µg/g ww) Feather mercury (µg/g fw)
0.262 0.864
2009 Ad. 14 0.143 ± 0.073 0.064, 0.308 0.101, 0.185 14 0.355 ±
0.335
0.120,
1.420
0.162, 0.548
Harbor Brook 2008 Ad. 5 0.837 ± 0.928 0.199, 2.410 –0.316, 1.990 — — — —
2009 Ad. 7 1.089 ± 0.560 0.347, 2.153 0.572, 1.607 8 0.466 ±
0.268
0.133,
0.782
0.242, 0.690
2009 HY 1 1.310 — — — — — —
Wetzel Rd. 2009 Ad. 8 0.159 ± 0.066 0.044, 0.269 0.104, 0.214 8 0.169 ±
0.067
0.088,
0.314
0.112, 0.225
White Cliffs 2008 Ad. 4 0.807 ± 1.026 0.126, 2.310 –0.825, 2.440 — — — —
Overall RWBL 74 0.636 ± 0.890 0.023, 5.292 0.430, 0.842 59 0.354 ±
0.333
0.068,
1.617
0.267, 0.441
Oneida (Ref.) 2008 Ad. 13 0.112 ± 0.025 0.076, 0.166 0.097, 0.128 — — — —
2009 Ad. 7 0.074 ± 0.008 0.061, 0.081 0.066, 0.082 7 0.104 ±
0.023
0.073,
0.141
0.083, 0.125
Ref. Overall Ad. 20 0.099 ± 0.028 0.061, 0.166 0.086, 0.112 7 0.104 ±
0.023
0.073,
0.141
0.083, 0.125
Common
grackle
Ninemile
Creek
2009 Ad. 1 0.164 — — — — — —

Biodiversity Research Institute Page 57
Species Site Year Age Blood mercury (µg/g ww) Feather mercury (µg/g fw)
Beach 2009 Ad. 1 0.831 — — — — — —
Maple Bay 2008 Ad. 3 0.197 ± 0.128 0.115, 0.345 –0.121, 0.516 3 0.393 ±
0.206
0.193,
0.605
–0.119,
0.905
2008 U 1 0.046 — — 1 0.148 — —
2009 HY 1 0.448 — — — — — —
Ley Creek 2009 Ad. 3 0.223 ± 0.105 0.119, 0.330 –0.038, 0.485 — — — —
Overall COGR 10 0.275 ± 0.232 0.046, 0.831 0.109, 0.441 4 0.332 ±
0.208
0.148,
0.605
0.000, 0.663
Oneida (Ref.) 2008 Ad. 1 0.162 — — — — — —
2009 Ad. 1 0.060 — — — — — —
Ref. Overall Ad. 2 0.111 ± 0.072 0.060, 0.162 –0.540, 0.761 — — — —
Baltimore
oriole
Harbor Brook 2008 Ad. 3 0.503 ± 0.258 0.307, 0.795 –0.137, 1.143 — — — —
2009 Ad. 2 0.959 ± 0.608 0.529, 1.389 –4.504, 6.422 — — — —
Overall BAOR Ad. 5 0.686 ± 0.434 0.307, 1.389 0.147, 1.224 — — — —
Oneida (Ref.) 2008 Ad. 1 0.046 — — — — — —
2009 Ad. 1 0.058 — — — — — —
Ref. Overall Ad. 2 0.052 ± 0.009 0.046, 0.058 –0.029, 0.133 — — — —

Biodiversity Research Institute Page 58
Species Site Year Age Blood mercury (µg/g ww) Feather mercury (µg/g fw)
American
goldfinch
Ninemile
Creek
2009 Ad 2 0.005 ± 0.003 0.003, 0.007 –0.022, 0.032 — — — —
Canal 2008 Ad. 1 0.003 — — — — — —
Ley Creek 2009 Ad. 1 0.001 — — — — — —
Harbor Brook 2009 Ad. 1 0.005 — — — — — —
Wetzel Rd 2009 Ad. 2 0.001 ± 0.000 0.001, 0.001 –0.002, 0.004 — — — —
Overall AMGO Ad. 7 0.003 ± 0.002 0.001, 0.007 0.001, 0.005 — — — —

Biodiversity Research Institute Page 59
Appendix B. Mercury concentrations (µg/g, ww) in eggs of tree swallows
and red-winged blackbirds, 2009.
Treatment Site RWBL Hg TRES Hg
mean ± SD (n)
min, max
mean ± SD (n)
min, max
Ninemile Creek Ninemile Creek 0.030 ± 0.009 (5)
0.020, 0.040
0.139 ± 0.028 (3)
0.107, 0.158
Onondaga Lake Maple Bay — 0.080 ± 0.037 (6)
0.012, 0.125
Ley Creek 0.013 ± 0.009 (4)
0.007, 0.027
0.110 ± 0.025 (3)
0.082, 0.130
Harbor Brook 0.108 ± 0.096 (4)
0.023, 0.233
0.144 ± 0.059 (4)
0.098, 0.223
Onondaga
(overall)
0.061 ± 0.081 (8)
0.007, 0.233
0.106 ± 0.049 (13)
0.012, 0.223
Seneca River Wetzel Road 0.036 ± 0.016 (2)
0.024, 0.047
0.095 ± 0.010 (3)
0.086, 0.105
Reference Oneida Lake 0.028 ± 0.018 (3)
0.014, 0.049
0.040 ± 0.026 (3)
0.011, 0.062
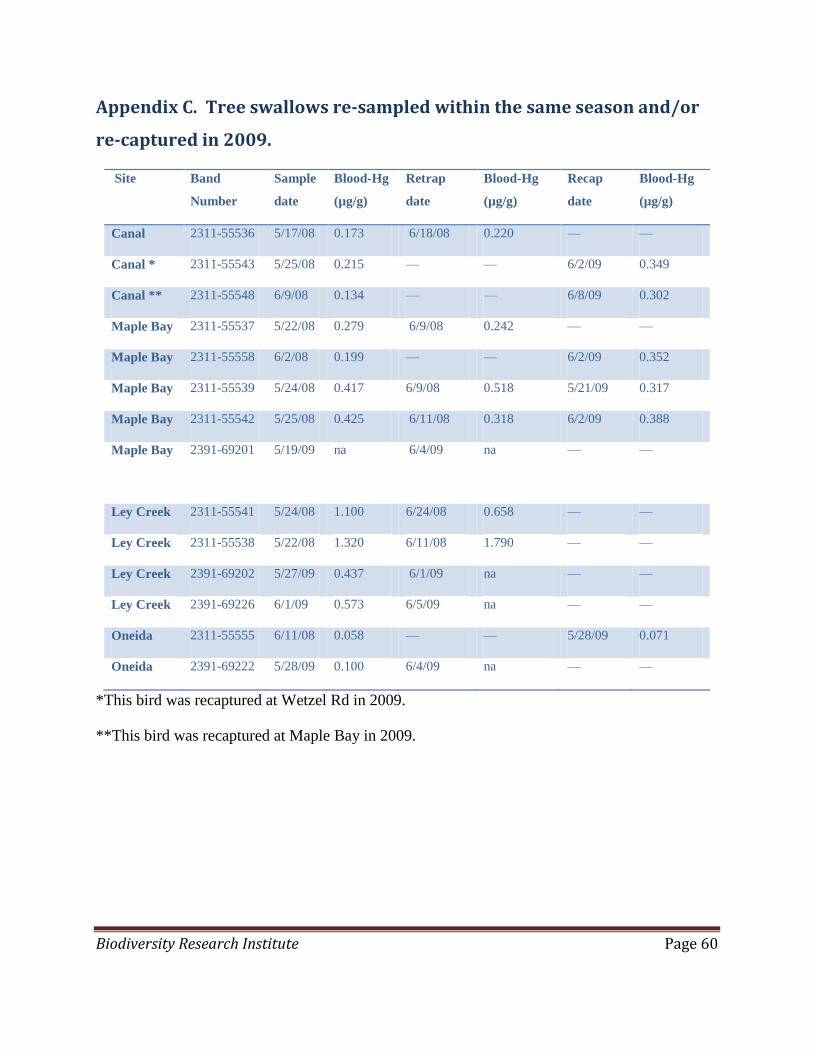
Biodiversity Research Institute Page 60
Appendix C. Tree swallows re-sampled within the same season and/or
re-captured in 2009.
Site Band
Number
Sample
date
Blood-Hg
(µg/g)
Retrap
date
Blood-Hg
(µg/g)
Recap
date
Blood-Hg
(µg/g)
Canal 2311-55536 5/17/08 0.173 6/18/08 0.220 — —
Canal * 2311-55543 5/25/08 0.215 — — 6/2/09 0.349
Canal ** 2311-55548 6/9/08 0.134 — — 6/8/09 0.302
Maple Bay 2311-55537 5/22/08 0.279 6/9/08 0.242 — —
Maple Bay 2311-55558 6/2/08 0.199 — — 6/2/09 0.352
Maple Bay 2311-55539 5/24/08 0.417 6/9/08 0.518 5/21/09 0.317
Maple Bay 2311-55542 5/25/08 0.425 6/11/08 0.318 6/2/09 0.388
Maple Bay 2391-69201 5/19/09
na 6/4/09 na — —
Ley Creek 2311-55541 5/24/08 1.100 6/24/08 0.658 — —
Ley Creek 2311-55538 5/22/08 1.320 6/11/08 1.790 — —
Ley Creek 2391-69202 5/27/09 0.437 6/1/09 na — —
Ley Creek 2391-69226 6/1/09 0.573 6/5/09 na — —
Oneida 2311-55555 6/11/08 0.058 — — 5/28/09 0.071
Oneida 2391-69222 5/28/09 0.100 6/4/09 na — —
*This bird was recaptured at Wetzel Rd in 2009.
**This bird was recaptured at Maple Bay in 2009.

Biodiversity Research Institute Page 61
Appendix D. Summary of blood stable isotope data (δ13C, δ15N) and blood
Hg data for all study areas, 2009.
Species Study Area n Blood-Hg
(µg/g ww)
mean ± SD
δ13
C δ15
N
American goldfinch Ninemile Creek 2 0.005 ± 0.002 –25.06 ± 0.056 6.44 ± 0.526
Onondaga 2 0.003 ± 0.002 –24.64 ± 0.492 5.81± 0.098
Seneca 2 0.001 ± 0.000 –24.54 ± 0.203 5.986 ± 0.017
Overall 6 0.003 ± 0.001 –24.75 ± 0.171 6.080 ± 0.182
American redstart Onondaga 4 3.750 ± 0.984 –25.3 ± 0.208 10.42 ± 0.613
American robin Ninemile Creek 3 0.484 ± 0.236
(2)
–25.0 ± 0.069 7.694 ± 1.692
Onondaga 5 0.491 ± 0.213 –24.76 ± 0.095 8.283 ± 0.606
Reference, Oneida 3 0.110 ± 0.024 –25.0 ± 0.122 8.979 ± 0.611
Overall 11 0.375 ± 0.121
(10)
–24.89 ± 0.064 8.312 ± 0.516
Baltimore oriole Onondaga 2 0.959 ± 0.430 –24.8 ± 0.157 8.820 ± 0.070
Barn swallow Reference, Oneida 1 0.133 –25.50 10.87
Black-capped
chickadee
Ninemile Creek 1 0.167 –25.8 11.52
Onondaga 1 0.430 –25.438 11.126
Overall 2 0.299 ± 0.132 –25.62 ± 0.18 11.32 ± 0.199
Belted kingfisher Ninemile Creek 1 1.772 –27.45 17.40
Onondaga 2 2.538 ± 0.473 –26.29 ± 0.134 17.82 ± 0.082
Overall 3 2.282 ± 0.374 –26.68 ± 0.394 17.68 ± 0.148
Chipping sparrow Seneca 1 0.047 –18.60 6.116
Common grackle Ninemile Creek 1 0.164 –23.68 6.772

Biodiversity Research Institute Page 62
Onondaga 5 0.390 ± 0.123 –21.69 ± 0.571 7.598 ± 0.370
Reference, Oneida 1 0.060 –20.63 8.074
Overall 7 0.310 ± 0.264 –21.82 ± 0.523 7.548 ± 0.294
Common
yellowthroat
Ninemile Creek 1 0.250 –26.21 9.823
Downy woodpecker Onondaga 1 0.032 –24.58 6.815
Eastern kingbird Reference, Oneida 1 0.130 –25.68 9.534
Eastern towhee Ninemile Creek 1 1.377 –24.39 6.491
European starling Onondaga 2 3.886 ± 3.281 –24.93 ± 0.772 9.778 ± 1.951
Great-crested
flycatcher
Reference, Oneida 1 0.235 –23.83 6.641
Gray catbird Ninemile Creek 5 1.249 ± 0.747 –24.73 ± 0.168 8.933 ± 1.054
Onondaga 7 0.675 ± 0.490 –25.31 ± 0.266 9.532 ± 0.727
Reference, Oneida 1 0.154 –24.56 10.447
Overall 13 0.855 ± 0.382 –25.03 ± 0.174 9.372 ± 0.547
Green heron Onondaga 1 0.303 –25.71 10.071
Northern cardinal Onondaga 1 0.164 –25.33 6.047
Reference 1 0.025 –24.98 7.861
Overall 2 0.095 ± 0.069 –25.15 ± 0.172 6.954 ± 0.907
Red-winged
blackbird
Ninemile Creek 9 0.439 ± 0.254 –21.03 ± 0.801 8.012 ± 0.350
Onondaga 28 0.765 ± 0.210 –21.43 ± 0.534 9.060 ± 0.379
Seneca 8 0.159 ± 0.023 –19.88 ± 0.536 8.256 ± 0.288
Reference, Oneida 7 0.074 ± 0.003 –25.37 ± 0.319 9.347 ± 0.517
Overall 52 0.523 ± 0.126 –21.65 ± 0.393 8.793 ± 0.234
Song sparrow Ninemile Creek 9 0.313 ± 0.055 –25.47 ± 0.118 9.220 ± 0.436
Onondaga 20 0.964 ± 0.154 –25.56 ± 0.143 9.721 ± 0.340

Biodiversity Research Institute Page 63
Seneca 4 0.200 ± 0.097 –24.79 ± 1.108 9.465 ± 0.830
Reference, Oneida 2 0.062 ± 0.011 –25.53 ± 0.258 11.31 ± 0.499
Overall 35 0.658 ± 0.108 –25.45 ± 0.147 9.654 ± 0.249
Spotted Sandpiper Ninemile Creek 7 0.964 ± 0.324 –25.13 ± 0.411 12.04 ± 1.215
Onondaga 9 1.916 ± 0.469 –24.88 ± 0.207 11.42 ± 0.713
Overall 16 1.500 ± 0.315 –24.99 ± 0.208 11.69 ± 0.646
Swamp sparrow Onondaga 1 2.335 –25.6 9.140
Tree swallow Ninemile Creek 3 0.469 ± 0.072 –27.82 ± 0.243 10.15 ± 0.632
Onondaga 18 0.393 ± 0.038 –28.11 ± 0.227 11.0± 0.228
Seneca 7 0.312 ± 0.023 –26.24 ± 0.211 10.66 ± 0.125
Reference, Oneida 9 0.114 ± 0.027 –26.59 ± 0.213 11.38 ± 0.350
Overall 37 0.316 ± 0.029 –27.36 ± 0.186 10.96 ± 0.155
Trail’s flycatcher Ninemile Creek 4 0.916 ± 0.227 –25.38 ± 0.035 9.46 ± 0.782
Onondaga 3 2.562 ± 0.592 –24.51 ± 0.215 10.44 ± 0.331
Overall 7 1.621 ± 0.419 –24.44 ± 0.087 9.876 ± 0.479
Warbling vireo Onondaga 1 0.215 –24.60 6.790
Yellow warbler Ninemile Creek 1 0.479 –25.08 10.66
Onondaga 5 0.708 ± 0.196 –26.05 ± 0.474 9.543 ± 0.871
Reference, Oneida 1 0.068 –25.18 10.62
Overall 7 0.584 ± 0.164 –25.79 ± 0.369 9.86 ± 0.634

Biodiversity Research Institute Page 64
Appendix E. Mean blood (by sex) and feather (sexes combined) mercury
concentrations (µg/g) in adult red-winged blackbirds, 2008-2009.
Study Area Sub-site Female Blood-
Hg
Male Blood-Hg Feather-Hg
n; mean ± SD
95% CI (lower,
upper)
n; mean ± SD
95% CI (lower,
upper)
n; mean ± SD
95% CI (lower,
upper)
Onondaga Beach 1; 5.29 5; 0.67 ± 0.79
–0.30, 1.65
1; 0.32
Maple Bay
8; 1.41 ± 0.82
0.73, 2.10
3; 0.16 ± 0.09
–0.07, 0.39
12; 0.33 ± 0.36
0.10, 0.56
Ley Creek 3; 0.57 ± 0.61
–0.95, 2.08
18; 0.16 ± 0.21
0.06, 0.27
21; 0.34 ± 0.31
0.20, 0.48
Harbor Brook 6; 1.38 ± 0.77
0.57, 2.19
6; 0.59 ± 0.36
0.21, 0.97
7; 0.42 ± 0.25
0.19, 0.66
White Cliffs 1; 0.18 3; 1.02 ± 1.15
–1.83, 3.86
—
Overall 19; 1.41 ± 1.23
0.812, 2.00
35; 0.38 ± 0.53
0.20, 0.56
41; 0.35 ± 0.31
0.25, 0.45
Seneca River Canal (2008) 2; 0.23 ± 0.07
–0.39, 0.86
—
Wetzel Road
(2009)
3; 0.20 ± 0.07
0.03, 0.38
5; 0.13 ± 0.05
0.07, 0.20
8; 0.17 ± 0.07
0.11, 0.23
Overall 3; 0.20 ± 0.07
0.03, 0.38
7; 0.16 ± 0.07
0.10, 0.23
8; 0.17 ± 0.07
0.11, 0.23
Ninemile
Creek
3; 0.28 ± 0.20
–0.22, 0.77
6; 0.52 ± 0.94
–0.47, 1.51
9; 0.50 ± 0.0.50
0.11, 0.33
Oneida Lake Reference 8; 0.10 ± 0.04
0.07, 0.13
12; 0.10 ± 0.02
0.09, 0.11
7; 0.10 ± 0.02
0.08, 0.13


