108
Norfolk Southern Corporation | Annual Report 2008
| Date post: | 04-Jun-2018 |
| Category: |
Documents |
| Upload: | nguyentruc |
| View: | 213 times |
| Download: | 0 times |

Norfolk Southern Corporation | Annual Report 2008

2
N o r f o l k S o u t h e r n
system map
Description of BusinessNorfolk Southern Corporation (NYSE: NSC) is one of the nation’s premier
transportation companies. Its Norfolk Southern Railway subsidiary operates
approximately 21,000 route miles in 22 states and the District of Columbia,
serving every major port in the eastern United States and providing superior
connections to western rail carriers. Norfolk Southern operates the most extensive
intermodal network in the East and is North America’s largest rail carrier of metals
and automotive products.

1
* Assumes that the value of the investment in Norfolk Southern Corporation common stock and each index was $100 on Dec. 31, 2003, and that all dividends were reinvested. Data furnished by Bloomberg Financial Markets.
For the YearRailway operating revenues
Income from railway operations
Net income
Per share — basic
Per share — diluted
Dividends per share
Dividend pay-out ratio
Cash provided by operating activities
Property additions
Free cash flow1
At Year End
Total assets
Total debt
Stockholders’ equity
Shares outstanding
Stockholders’ equity per share
Financial Ratios (%)Operating ratio
Debt to total capitalization
(numbers in millions, except per-share amounts)
(1) Free cash flow as used here is defined as cash provided by operating activities minus property additions and is a measure of cash available for other investing activities and financing activities, including repurchases of common stock and dividends.
2006 $ 9,407 $ 2,557 $ 1,481 $ 3.63 $ 3.57 $ .68
19% $ 2,206 $ 1,178 $ 1,028
$ 26,028 $ 6,600 $ 9,615
397.4 $ 24.19
72.8% 40.7%
Total Stockholder Returns (dollars)
$350
$300
$250
$200
$150
$100
$ 50
$ 0Dec. 04 Dec. 05 Dec. 06 Dec. 07
Norfolk Southern Corp. Common Stock S&P Railroad Stock Price Index
S&P Composite-500 Stock Price Index
2007 $ 9,432 $ 2,585 $ 1,464 $ 3.74 $ 3.68 $ .96
26% $ 2,333 $ 1,341 $ 992
$ 26,144 $ 6,368 $ 9,727
379.3 $ 25.64
72.6% 39.6%
Dec. 08
2008 $ 10,661 $ 3,084 $ 1,716 $ 4.60 $ 4.52 $ 1.22
27% $ 2,715 $ 1,558 $ 1,157
$ 26,297 $ 6,667 $ 9,607
366.2 $ 26.23
71.1% 41.0%
Railway Operating Revenue (in millions)
$9,407 $9,432
06 07 08
$10,661
Income from Railway Operations (in millions)
$2,557 $2,585
06 07 08
$3,084
Free Cash Flow1 (in millions)
$1,028 $992
06 07 08
$1,157
financial highlightsN o r f o l k S o u t h e r n C o r p o r a t i o n & S u b s i d i a r i e s

2
F e l l o w
shareholders I write this letter to you at a time of extraordinary
turbulence in our nation’s and the world’s economies.
The old curse – “May you live in interesting times” –
has fallen upon us with a vengeance, and the current
economic uncertainty seems likely to continue for some
time into the future.
Your company and the customers we serve are not
immune to this period of turbulence, and our performance
in 2009 will be challenged as a result. However, we remain
very optimistic about our longer-term prospects, and a look
at our 2008 results shows many of the reasons why.
Quite simply put, 2008 was a terrific year for Norfolk
Southern. Even though our traffic volumes declined,
through proper planning and cost controls we set records
for railway operating revenues, income from railway
operations, net income, and diluted earnings per share.
Our operating ratio improved by 1.5 percentage points
to 71.1, our best operating ratio ever. We continued to
provide superior results for our shareholders as well, by
raising our annual dividend 27 percent and buying back
19.4 million shares of stock.
We made important strides with our other key
constituencies as well. First and foremost, in terms of
our people who are Norfolk Southern’s true competitive
advantage, we were awarded our 19th consecutive
E. H. Harriman Gold Medal Award for employee safety
as the safest major U.S. railroad. No single fact better
illustrates the commitment that every NS employee
brings to doing his or her job safely and well. I ran out
of superlatives to describe their performance a long time
ago. 2008 was another strong year for our safety process,
and we remain intent on our ultimate goal of zero
incidents and zero injuries.
We also strengthened our other human resource
initiatives. Among the most important are our programs
to bring new people into our management team. We
continue to enhance and expand our management
trainee programs for new college
hires, and our operations supervisor
trainee program for people with prior
working experience. Like many other
companies, we face challenges with
the demographics of our work force,
and these programs, which have been
nationally recognized, are ensuring
that we will have a strong and diverse
management team in place for many
years to come.
Our initiatives to drive service
improvements for our customers
also saw success in 2008, and we
continue to be recognized as a service
leader in the rail industry. Superior rail
service is the product of a number of
things: solid infrastructure, properly
maintained and reliable locomotives
and rolling stock, a well-designed
operating plan, and a committed,
focused work force with the tools and
technology to support their efforts.
We have them all. Norfolk Southern
is a service company, and we are
acutely aware that we must continue
to improve our transportation
products if we want to capture all
of the opportunities that are available
to us and realize the full value of
those products.
2008 saw us continue as well our
initiatives to support the communities
we serve. We have increased our
emphasis on sustainability by
naming the industry’s first corporate
sustainability officer, creating

3Norfolk Southern’s management team (left to right):Jim Hixon, executive vice president law and corporate relations;Don Seale, executive vice president and chief marketing officer;John Rathbone, executive vice president administration; Wick Moorman, chairman, president and chief executive officer; Mark Manion, executive vice president operations; Steve Tobias, vice chairman and chief operating officer;Jim Squires, executive vice president finance and chief financial officer; andDeb Butler, executive vice president planning and chief information officer.
innovative programs to reduce the amount of energy
we consume in our operations, and increasing our use
of alternative energy sources. Railroads truly are the
environmentally friendly mode of transportation, and we
believe that actively working to improve our environmental
footprint is not only the responsible thing to do, but it
makes good business sense as well.
In 2009, we’ll continue all of the initiatives that
helped strengthen NS in 2008. We are in extraordinarily
challenging times, but we have built the foundations to
be able to meet those challenges successfully, and we’ll
stay focused on a few key drivers of the business as we
manage through the downturn.
First, we’ll continue to manage our costs aggressively
while still providing a superior level of customer service.
Norfolk Southern has a long history of effective cost
controls, and we have the tools and technology to resize
our operations quickly in response to changing business
conditions. At the same time, we’ll try to mitigate the
impact on our work force to the fullest extent possible.
Guided by our Track 2012 strategic initiatives, we’ll
continue to invest in the company in order to keep the
property strong and continue our improvement programs.
Put simply, we won’t sacrifice longer-term opportunities for
short-term profits. This downturn will be over some day,
and we will be ready to take full advantage of the business
prospects that will be there when it ends.
Finally, we’ll continue to aggressively pursue new
business development initiatives and to ensure that we
realize the appropriate value for our superior transportation
services. Our strategy to create new business corridors
has helped drive our growth in recent years, and we’re
now working hard to develop our biggest project to date,
the Crescent Corridor. It’s an exciting concept to work
with government and our trucking partners in a public-
private partnership to take a million or more trucks off the
highways. We’re seeing a very positive response by public
officials, and I’m optimistic that we’ll
see considerable progress on the
project in 2009.
In closing, as you’ll see, this is
a new way of presenting our annual
report. The enclosed DVD gives you
the chance to see and hear from
some NS employees about what they
do every day to help our company
succeed. They’re representatives
of the whole NS team – talented,
creative, and driven to make our
company a success. They’re great
people, too, and I’m happy and proud
to be part of the team.
Sincerely,
Wick Moorman
Chairman, President
and Chief Execuitve Officer
4
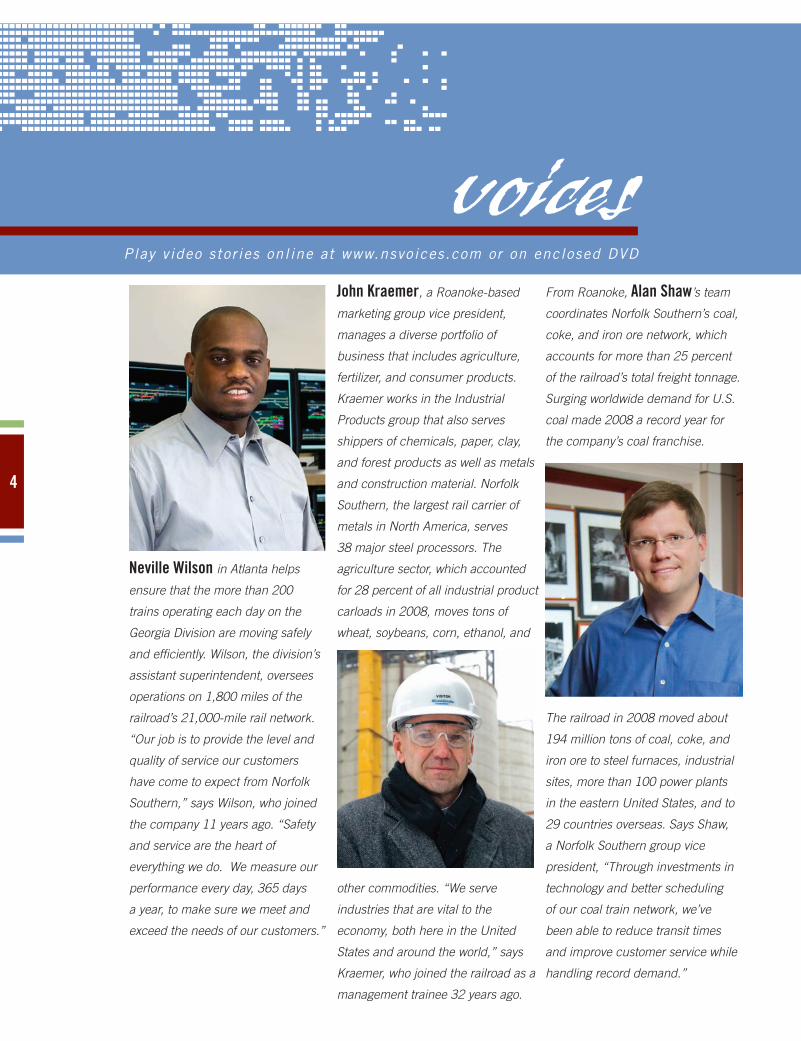
voicesPlay video stor ies onl ine at www.nsvoices.com or on enclosed DVD
From Roanoke, Alan Shaw’s team
coordinates Norfolk Southern’s coal,
coke, and iron ore network, which
accounts for more than 25 percent
of the railroad’s total freight tonnage.
Surging worldwide demand for U.S.
coal made 2008 a record year for
the company’s coal franchise.
The railroad in 2008 moved about
194 million tons of coal, coke, and
iron ore to steel furnaces, industrial
sites, more than 100 power plants
in the eastern United States, and to
29 countries overseas. Says Shaw,
a Norfolk Southern group vice
president, “Through investments in
technology and better scheduling
of our coal train network, we’ve
been able to reduce transit times
and improve customer service while
handling record demand.”
Neville Wilson in Atlanta helps
ensure that the more than 200
trains operating each day on the
Georgia Division are moving safely
and efficiently. Wilson, the division’s
assistant superintendent, oversees
operations on 1,800 miles of the
railroad’s 21,000-mile rail network.
“Our job is to provide the level and
quality of service our customers
have come to expect from Norfolk
Southern,” says Wilson, who joined
the company 11 years ago. “Safety
and service are the heart of
everything we do. We measure our
performance every day, 365 days
a year, to make sure we meet and
exceed the needs of our customers.”
John Kraemer, a Roanoke-based
marketing group vice president,
manages a diverse portfolio of
business that includes agriculture,
fertilizer, and consumer products.
Kraemer works in the Industrial
Products group that also serves
shippers of chemicals, paper, clay,
and forest products as well as metals
and construction material. Norfolk
Southern, the largest rail carrier of
metals in North America, serves
38 major steel processors. The
agriculture sector, which accounted
for 28 percent of all industrial product
carloads in 2008, moves tons of
wheat, soybeans, corn, ethanol, and
other commodities. “We serve
industries that are vital to the
economy, both here in the United
States and around the world,” says
Kraemer, who joined the railroad as a
management trainee 32 years ago.

5
As an Indianapolis-based manager
in the Industrial Development
Department, Dayne Tate scours
the state of Indiana for sites where
companies can build on Norfolk
Southern rail lines. In 2008, 115
companies built or expanded
facilities on the system – companies
such as Louis-Dreyfus, which began
operating a biodiesel and soybean
processing plant in Claypool, Ind.,
that is one of the largest in the
world. The work of the Industrial
Development Department grows
business for the railroad and brings
new jobs and economic growth to
the communities Norfolk Southern
serves. Notes Tate: “Over the past
20 years, we’ve helped nearly 2,000
industries locate or expand on our
system. That translates into more than
100,000 new jobs and over 2 million
additional carloads of freight.”
Under division manager
Jeff Monday’s watch, more than
1,200 freight containers move in and
out of the Rickenbacker Intermodal
Terminal every day. The state-of-the-
art terminal in Columbus, Ohio, which
opened in 2008, provides customers
with access to key markets in the
Midwest. Norfolk Southern serves
48 intermodal terminals spread
across its rail system. “We have the
most extensive intermodal network in
the East,” says Monday, who joined
the railroad 13 years ago in his native
Chicago. “We’re investing in facilities
such as Rickenbacker to meet the
future demand for intermodal service.”
Shari Hulin’s job is finding the people
who will become the next generation
of Norfolk Southern employees for a
company that BusinessWeek ranks
as one of the top 50 places to launch
a career. Norfolk-based Hulin,
manager of professional recruiting,
says the company puts a premium
on work-force diversity because
it gives the railroad a competitive
advantage by “fostering innovation
and giving us a better understanding
of our customers and the
communities we serve.” Military
veterans, she says, also make
good employees because of their
commitment to safety and strong
work ethic. “We’re dedicated to hiring
and retaining the best people, and
our training and recruiting programs
help us do just that,” Hulin says.

6
voices
When it comes to green, says
Jerri Parks, Norfolk Southern
is continually looking for ways
to reduce its environmental
footprint. Railroads are
the most environmentally
friendly mode of ground
transportation, able to move
a ton of freight 436 miles
on a gallon of fuel. Parks
notes Norfolk Southern was
the first railroad to appoint a
sustainability officer and in
2008 issued its first corporate
sustainability report. The railroad also has invested heavily in
improving the environmental performance of its locomotives, putting
it ahead of all other freight railroads in meeting federal emissions
standards. “We’re committed,” says Parks, Norfolk-based director of
intermodal systems, “to protecting the quality of our environment and
to helping our customers reduce their carbon footprints.”
Bob Billingsley
joined Norfolk
Southern as a
junior engineer
more than 30
years ago.
Today, his
Roanoke-based
job as director of
structural projects
has put him in charge
of the Heartland Corridor, a rail
freight route that, when completed
in 2010, will cut 24 hours off the
transit times between Virginia ports
and the Midwest. NS and federal
and state governments are funding
the project through a public-private
partnership. Once completed, the
Heartland Corridor will help relieve
highway congestion and reduce
carbon emissions. “We’re raising
the clearance through 28 tunnels
so we’ll be able to run double-
stacked trains through them,”
Billingsley explains. “It’s a win
for the railroads, it’s a win for our
customers, and it’s a win for the
communities we serve.”
Play video stor ies onl ine at www.nsvoices.com or on enclosed DVD

7
board of directors
Members of the board of directors of Norfolk Southern are (front row left to right) Michael D. Lockhart, Karen N. Horn, J. Paul Reason, Gene R. Carter, (back row left to right) Burton M. Joyce, Steven F. Leer, Landon Hilliard, Charles W. Moorman, Alston D. Correll, Gerald L. Baliles, and Daniel A. Carp.
Gerald L. Baliles, 68, of Charlottesville, Va., has been director of
the Miller Center of Public Affairs at the University of Virginia since
April 2006. He is a former governor and attorney general of Virginia.
His board service began in 1990; his current term expires in 2011.
Committees: Executive, Finance (chairman), Governance and Nominating
Daniel A. Carp, 60, of Naples, Fla., is nonexecutive chairman
of Delta Air Lines, Inc., and formerly served as chairman and chief
executive officer of Eastman Kodak Company. His board service
began in January 2006; his current term expires in 2009.
Committees: Audit, Compensation
Gene R. Carter, 69, of Spotsylvania, Va., is executive director
and chief executive officer of the Association for Supervision and
Curriculum Development, one of the world’s largest international
education associations. His board service began in 1992; his current
term expires in 2011.
Committees: Audit (chairman), Compensation, Executive
Alston D. Correll, 67, of Atlanta, Ga., became chairman of
Atlanta Equity Investors, LLC, a private equity firm, in September
2007, and is chairman emeritus of Georgia-Pacific Corporation. His
board service began in 2000; his current term expires in 2010.
Committees: Compensation (chairman), Executive, Governance and Nominating
Landon Hilliard, 69, of Oyster Bay Cove, N.Y., is a partner of
Brown Brothers Harriman & Co., a private bank in New York City.
His board service began in 1992; his current term expires in 2010.
Committees: Executive, Finance, Governance and Nominating (chairman)
Karen N. Horn, 65, of Lyme, Conn., is partner with
Brock Capital Group. Her board service began in 2008;
her current term expires in 2011.
Committees: Finance, Governance and Nominating
Burton M. Joyce, 67, of South Pasadena, Fla., is former
chairman of IPSCO Inc., a leading steel producer. His board service
began in November 2003; his current term expires in 2010.
Committees: Audit, Compensation
Steven F. Leer, 56, of St. Louis, Mo., is chairman and chief
executive officer of Arch Coal, Inc., one of the nation’s largest
coal producers. His board service began in 1999; his current
term expires in 2009.
Committees: Finance, Governance and Nominating
Michael D. Lockhart, 59, of Lancaster, Pa., is chairman,
president, and chief executive officer of Armstrong World Industries,
Inc. His board service began in 2008; his current term expires in 2009.
Committees: Audit, Finance
Charles W. Moorman, 57, of Virginia Beach, Va., is chairman,
president and chief executive officer of Norfolk Southern Corporation.
His board service began in 2005; his current term expires in 2009.
Committee: Executive (chairman)
J. Paul Reason, 67, Admiral, USN, retired, of Washington, D.C.,
is a member of the Naval Studies Board at the National Academy of
Sciences. His board service began in 2002; his current term
expires in 2011.
Committees: Audit, Compensation

8
officersCharles W. MoormanChairman, President and Chief Executive Officer
Stephen C. TobiasVice Chairman and Chief Operating Officer
Deborah H. Butler Executive Vice President Planning and Chief Information Officer
James A. Hixon Executive Vice President Law and Corporate Relations
Mark D. Manion Executive Vice President Operations
John P. Rathbone Executive Vice President Administration
Donald W. Seale Executive Vice President and Chief Marketing Officer
James A. Squires Executive Vice President Finance and Chief Financial Officer
Daniel D. Smith Senior Vice President Energy and Properties
Joseph C. Dimino Vice President Audit and Compliance
Timothy J. Drake Vice President Engineering
Cindy C. Earhart Vice President Human Resources
Fredric M. Ehlers Vice President Customer Service
Terry N. Evans Vice President Operations Planning and Budget
John H. FriedmannVice President Strategic Planning
William A. Galanko Vice President Law
Tim A. Heilig Vice President Mechanical
Robert E. Huffman Vice President Intermodal Operations
Robert M. Kesler, Jr. Vice President Taxation
David T. Lawson Vice President Industrial Products
H. Craig Lewis Vice President Corporate Affairs
Bruno Maestri Vice President Government Relations
Robert E. Martínez Vice President Business Development
Michael R. McClellan Vice President Intermodal and Automotive Marketing
Harold R. Mobley Vice President Labor Relations
William J. Romig Vice President and Treasurer
Marta R. Stewart Vice President and Controller
Gerhard A. Thelen Vice President Operations Planning and Support
Charles J. Wehrmeister Vice President Safety and Environmental
Thomas G. Werner Vice President Information Technology
F. Blair Wimbush Vice President Real Estate and Corporate Sustainability Officer
Howard D. McFadden Corporate Secretary
Equal Employment Opportunity PolicyNorfolk Southern
Corporation’s policy
is to comply with all
applicable laws,
regulations, and
executive orders
concerning equal
employment
opportunity and
nondiscrimination
and to offer
employment on
the basis of
qualification and
performance,
regardless of race,
religion, color,
national origin,
gender, age, sexual
orientation, veteran
status, the presence of
a disability, or any other
legally protected status.

stockholderI n f o r m a t i o n
Common Stock
Ticker symbol: NSC
Common stock of Norfolk Southern
Corporation is listed and traded on
the New York Stock Exchange.
Publications
Upon written request, the corporation’s
annual and quarterly reports on
Forms 10-K and 10-Q will be furnished
free to stockholders. Write to: Corporate
Communications Department, Norfolk
Southern Corporation, Three Commercial
Place, Norfolk, Va. 23510-9227.
A notice and proxy statement for the
annual meeting of stockholders are
furnished to stockholders in advance
of the meeting.
Upon request, a stockholder may
receive a printed copy of the Corporate
Governance Guidelines, board
committee charters, Code of Ethics,
and Code of Ethical Conduct for Senior
Financial Officers. Contact the Corporate
Secretary, Norfolk Southern Corporation,
Three Commercial Place, Norfolk, Va.
23510-9219. This information also is
available on the NS Web site.
Ethics & Compliance Hotline
High ethical standards always have
been key to Norfolk Southern’s
success. Anyone who may be aware
of a violation of the corporation’s ethical
standards or a conflict of interest,
or has a concern or complaint regarding
the corporation’s financial reporting,
accounting, internal controls or
auditing matters is encouraged to
report such information to the Ethics
& Compliance Hotline, 800.732.9279.
Reports can be made anonymously and
without fear of retaliation.
Annual MeetingMay 14, 2009
10 a.m. EDTThe Kimball Theatre
428 W. Duke of Gloucester St. Williamsburg, Va.
Dividends
At its January 2009 meeting, the
corporation’s board of directors declared
a quarterly dividend of 34 cents per
share on its common stock, payable on
March 10, 2009, to stockholders of
record on Feb. 6, 2009.
Norfolk Southern Corporation usually
pays quarterly dividends on its common
stock on or about March 10, June 10,
Sept. 10 and Dec. 10, when and if
declared by the board of directors to
stockholders of record. The corporation
has paid 106 consecutive quarterly
dividends since its inception in 1982.
Account Assistance
For assistance with lost stock certificates,
transfer requirements and the Dividend
Reinvestment Plan, contact:
Registrar and Transfer Agent
BNY Mellon Shareowner Services
480 Washington, Blvd., 29th Floor
Jersey City, N.J. 07310
866.272.9472
For assistance with address changes,
dividend checks and direct deposit of
dividends, contact:
Assistant Corporate Secretary
Stockholder Records
Norfolk Southern Corporation
Three Commercial Place
Norfolk, Va. 23510-9219
800.531.6757
Dividend Reinvestment Plan
Stockholders whose names appear on
their stock certificates (not a street or
broker name) are eligible to participate
in the Dividend Reinvestment Plan.
The plan provides a convenient,
economical and systematic method
of acquiring additional shares of
the corporation’s common stock
by permitting eligible stockholders
of record to reinvest dividends.
The plan’s administrator is BNY Mellon
Shareowner Services.
For additional information,
dial 866.272.9472.
Financial InquiriesJames A. Squires Executive Vice President Finance and Chief Financial OfficerNorfolk Southern Corp.Three Commercial PlaceNorfolk, Va. 23510-9215757.629.2845
Investor InquiriesLeanne D. MarilleyDirector Investor RelationsNorfolk Southern Corp. Three Commercial PlaceNorfolk, Va. 23510-9215757.629.2861
Corporate OfficesExecutive OfficesNorfolk Southern Corp.Three Commercial PlaceNorfolk, Va. 23510-9227757.629.2600
Regional Offices1200 Peachtree St. N.E.Atlanta, Ga. 30309
110 Franklin Road S.E.Roanoke, Va. 24042
Annual Report Requests & Information 800.531.6757

Norfolk Southern Corporation
Three Commercial Place
Norfolk, VA 23510-9217
www.nscorp.com
Safety: We put safety first by taking care of the people around us
and following the rules.
Performance: We are performance driven and committed to providing
quality customer service. We act on facts and are accountable for results.
Integrity: We do the right thing. We are open, fair, honest, and straightforward.
Respect: We believe in the importance of all of our stakeholders.
We value the ideas and beliefs of our co-workers.
Innovation: We constantly seek new ideas and creative solutions to business challenges.
Teamwork: We believe that working together always produces the best results.
values
Be the safest, most customer-focused, and successful transportation company in the world.our vision
S
29.0109.x426.200K
UNITED STATES SECURITIES AND EXCHANGE COMMISSION Washington, D.C. 20549
FORM 10-K
(X) ANNUAL REPORT PURSUANT TO SECTION 13 OR 15(d) OF THE SECURITIES EXCHANGE ACT OF 1934 For the fiscal year ended DECEMBER 31, 2008
( ) TRANSITION REPORT PURSUANT TO SECTION 13 OR 15(d) OF THE SECURITIES EXCHANGE ACT OF 1934 For the transition period from _________ to _________
Commission file number 1-8339
NORFOLK SOUTHERN CORPORATION (Exact name of registrant as specified in its charter)
Virginia 52-1188014
(State or other jurisdiction of incorporation) (IRS Employer Identification No.)
Three Commercial Place Norfolk, Virginia 23510-2191
(Address of principal executive offices) Zip Code
Registrant’s telephone number, including area code (757) 629-2680
Securities registered pursuant to Section 12(b) of the Act:
Title of each Class Name of each exchange Norfolk Southern Corporation on which registered
Common Stock (Par Value $1.00) New York Stock Exchange
Securities registered pursuant to Section 12(g) of the Act: NONE Indicate by check mark if the registrant is a well-known seasoned issuer, as defined in Rule 405 of the Securities Act. Yes (X) No ( ) Indicate by check mark if the registrant is not required to file such reports pursuant to Section 13 or 15(d) of the Act. Yes ( ) No (X) Indicate by check mark whether the registrant: (1) has filed all reports required to be filed by Section 13 or Section 15(d) of the Securities Exchange Act of 1934 during the preceding 12 months (or for such shorter period that the registrant was required to file such reports), and (2) has been subject to such filing requirements for the past 90 days. Yes (X) No ( ) Indicate by check mark if disclosure of delinquent filers pursuant to Item 405 of Regulation S-K is not contained herein, and will not be contained, to the best of registrant’s knowledge, in definitive proxy or information statements incorporated by reference in Part III of this Form 10-K or any amendment to this Form 10-K. ( ) Indicate by check mark whether the registrant is a large accelerated filer, an accelerated filer, or a non-accelerated filer or smaller reporting company. See definitions of “large accelerated filer,” “accelerated filer” and “smaller reporting company” in Rule 12b-2 of the Exchange Act. Large accelerated filer (X) Accelerated filer ( ) Non-accelerated filer ( ) Smaller reporting company ( )
Indicate by check mark whether the registrant is a shell company (as defined in Rule 12b-2 of the Exchange Act). Yes ( ) No (X) The aggregate market value of the voting common equity held by non-affiliates as of June 30, 2008 was $23,454,318,004 (based on the closing price as quoted on the New York Stock Exchange on that date). The number of shares outstanding of each of the registrant’s classes of common stock, as of January 31, 2009: 366,460,780 (excluding 20,579,088 shares held by the registrant’s consolidated subsidiaries).
DOCUMENTS INCORPORATED BY REFERENCE: Portions of the Registrant’s definitive proxy statement to be filed electronically pursuant to Regulation 14A not later than 120 days after the end of the fiscal year, are incorporated by reference in Part III.
K2
TABLE OF CONTENTS
NORFOLK SOUTHERN CORPORATION AND SUBSIDIARIES (NS)
Page Part I. Items 1 and 2. Business and Properties K3 Item 1A. Risk Factors K13 Item 1B. Unresolved Staff Comments K16 Item 3. Legal Proceedings K16 Item 4. Submission of Matters to a Vote of Security Holders K16 Executive Officers of the Registrant K17 Part II. Item 5. Market for Registrant’s Common Equity, Related Stockholder Matters and
Issuer Purchases of Equity Securities K19 Item 6. Selected Financial Data K20 Item 7. Management’s Discussion and Analysis of Financial Condition and Results of Operations K21 Item 7A. Quantitative and Qualitative Disclosures About Market Risk K40 Item 8. Financial Statements and Supplementary Data K41 Item 9. Changes in and Disagreements with Accountants on Accounting and Financial Disclosure K77 Item 9A. Controls and Procedures K77 Item 9B. Other Information K77 Part III. Item 10. Directors, Executive Officers and Corporate Governance K78 Item 11. Executive Compensation K78 Item 12. Security Ownership of Certain Beneficial Owners and Management and Related Stockholder Matters K78
Item 13. Certain Relationships and Related Transactions, and Director
Independence K81 Item 14. Principal Accountant Fees and Services K81 Part IV. Item 15. Exhibits and Financial Statement Schedules K82 Power of Attorney K93 Signatures K93

K3
PART I
NORFOLK SOUTHERN CORPORATION AND SUBSIDIARIES (NS) Item 1. Business and Item 2. Properties GENERAL - Norfolk Southern Corporation (Norfolk Southern) is a Norfolk, Virginia based company that controls a major freight railroad, Norfolk Southern Railway Company. Norfolk Southern Railway Company is primarily engaged in the rail transportation of raw materials, intermediate products, and finished goods primarily in the Southeast, East, and Midwest and, via interchange with rail carriers, to and from the rest of the United States. Norfolk Southern also transports overseas freight through several Atlantic and Gulf Coast ports. Norfolk Southern provides comprehensive logistics services and offers the most extensive intermodal network in the eastern half of the United States. The common stock of Norfolk Southern is listed on the New York Stock Exchange (NYSE) under the symbol “NSC.” Norfolk Southern was incorporated on July 23, 1980, under the laws of the Commonwealth of Virginia. On June l, 1982, Norfolk Southern acquired control of two major operating railroads, Norfolk and Western Railway Company (NW) and Southern Railway Company (Southern) in accordance with an Agreement of Merger and Reorganization dated as of July 31, 1980, and with the approval of the transaction by the Interstate Commerce Commission (now the Surface Transportation Board [STB]). Effective December 31, 1990, Norfolk Southern transferred all the common stock of NW to Southern, and Southern’s name was changed to Norfolk Southern Railway Company (Norfolk Southern Railway or NSR). Effective September 1, 1998, NW was merged with and into Norfolk Southern Railway. As of December 31, 2008, all the common stock of Norfolk Southern Railway was owned directly by Norfolk Southern. Through a limited liability company, Norfolk Southern and CSX Corporation (CSX) jointly own Conrail Inc. (Conrail), whose primary subsidiary is Consolidated Rail Corporation (CRC). Norfolk Southern has a 58% economic and 50% voting interest in the jointly owned entity, and CSX has the remainder of the economic and voting interests. CRC owns and operates certain properties (the Shared Assets Areas) for the joint and exclusive benefit of NSR and CSX Transportation Inc. (CSXT) (see Note 4 to the Consolidated Financial Statements). Norfolk Southern makes available free of charge through its website, www.nscorp.com, its annual report on Form 10-K, quarterly reports on Form 10-Q, current reports on Form 8-K, and all amendments to those reports as soon as reasonably practicable after such material is electronically filed with or furnished to the Securities and Exchange Commission (SEC). In addition, the following documents are available on the company’s website and in print to any shareholder who requests them:
• Corporate Governance Guidelines • Charters of the Committees of the Board of Directors • The Thoroughbred Code of Ethics • Code of Ethical Conduct for Senior Financial Officers • Categorical Independence Standards for Directors
Unless otherwise indicated, Norfolk Southern and its subsidiaries are referred to collectively as NS.

K4
RAILROAD OPERATIONS – As of December 31, 2008, NS’ railroads operated approximately 21,000 miles of road in 22 eastern states and the District of Columbia. The system’s lines reach many individual industries, electric generating facilities, mines (in western Virginia, eastern Kentucky, southern and northern West Virginia, and western Pennsylvania), distribution centers, transload facilities, and other businesses located in smaller communities in its service area.
Corridors with heaviest freight volume:
New York City area to Chicago (via Allentown and Pittsburgh)
Chicago to Macon (via Cincinnati, Chattanooga, and Atlanta)
Appalachian coal fields of Virginia, West Virginia, and Kentucky to Norfolk and Sandusky, OH
Cleveland to Kansas City
Birmingham to Meridian
Memphis to Chattanooga

K5
The miles operated, which include major leased lines between Cincinnati, Ohio, and Chattanooga, Tennessee, and trackage rights over property owned by North Carolina Railway Company, were as follows:
Mileage Operated as of December 31, 2008 Passing Track, Miles
of Road
Second and Other Main Track
Crossovers and Turnouts
Way and Yard Switching
Total Owned 15,884 2,808 2,001 8,426 29,119Operated under lease, contract or trackage rights 4,948 1,977 415 968 8,308 Total 20,832 4,785 2,416 9,394 37,427
Triple Crown Operations – Triple Crown Services Company (Triple Crown), NS’ subsidiary, offers door-to-door intermodal service using RoadRailer® equipment and domestic containers. RoadRailer® units are enclosed vans that can be pulled over highways in tractor-trailer configuration and over the rails by locomotives. Triple Crown provides intermodal service in major traffic corridors, including those between the Midwest and the Northeast, the Midwest and the Southeast, and the Midwest and Texas. The following table sets forth certain statistics relating to NS’ railroads’ operations for the past 5 years:
Rail Operating Statistics Years Ended December 31, 2008 2007 2006 2005 2004 Revenue ton miles (billions) 195 196 204 203 198Freight train miles traveled (millions) 80.0 81.9 84.2 81.2 77.7Revenue per ton mile $0.0546 $0.0481 $0.0462 $0.0421 $0.0369Revenue ton miles per man-hour worked 3,075 3,066 3,196 3,146 3,347Percentage ratio of railway operating expenses to railway operating revenues 71.1% 72.6% 72.8% 75.2% 76.7%
RAILWAY OPERATING REVENUES – NS’ total railway operating revenues were $10.7 billion in 2008. See the financial information by traffic segment in Part II, Item 7, “Management’s Discussion and Analysis of Financial Condition and Results of Operations.” COAL TRAFFIC – Coal, coke, and iron ore – most of which is bituminous coal – is NS’ railroads’ largest commodity group as measured by revenues. The railroads handled a total of 194.2 million tons in 2008, most of which originated on NS’ lines in West Virginia, Virginia, Pennsylvania, and Kentucky. Revenues from coal, coke, and iron ore accounted for about 29% of NS’ total railway operating revenues in 2008. Total coal handled through all system ports in 2008 was 41.8 million tons. Of this total, 18.9 million tons (including coastwise traffic) moved through Norfolk, Virginia, 5.7 million tons moved through the Baltimore Terminal, 11.3 million tons moved to various docks on the Ohio River, and 5.9 million tons moved to various

K6
Lake Erie ports. Other than coal for export, virtually all coal handled by NS’ railroads was terminated in states east of the Mississippi River. See the discussion of coal traffic, by type of coal, in Part II, Item 7, “Management’s Discussion and Analysis of Financial Condition and Results of Operations.” GENERAL MERCHANDISE TRAFFIC - General merchandise traffic is composed of five major commodity groupings: automotive; chemicals; metals and construction; agriculture, consumer products and government; and paper, clay and forest products. The automotive group includes finished vehicles for BMW, Chrysler, Ford Motor Company, General Motors, Honda, Isuzu, Jaguar, Land Rover, Mazda, Mercedes-Benz, Mitsubishi, Nissan, Saab, Subaru, Suzuki, Toyota, and Volkswagen, and auto parts for Ford Motor Company, General Motors, Mercedes-Benz, and Toyota. The chemicals group includes sulfur and related chemicals, petroleum products, chlorine and bleaching compounds, plastics, rubber, industrial chemicals, chemical wastes, and municipal wastes. The metals and construction group includes steel, aluminum products, machinery, scrap metals, cement, aggregates, bricks, and minerals. The agriculture, consumer products, and government group includes soybeans, wheat, corn, fertilizer, animal and poultry feed, food oils, flour, beverages, canned goods, sweeteners, consumer products, ethanol, and items for the military. The paper, clay and forest products group includes lumber and wood products, pulp board and paper products, wood fibers, wood pulp, scrap paper, and clay. In 2008, 135 million tons of general merchandise freight, or approximately 67% of total general merchandise tonnage handled by NS, originated online. The balance of general merchandise traffic was received from connecting carriers at interterritorial gateways. The principal interchange points for NS-received traffic included Chicago, Memphis, New Orleans, Cincinnati, Kansas City, Detroit, Hagerstown, St. Louis/East St. Louis, and Louisville. General merchandise carloads handled in 2008 were 2.6 million, the revenues from which accounted for 52% of NS’ total railway operating revenues in 2008. See the discussion of general merchandise rail traffic by commodity group in Part II, Item 7, “Management’s Discussion and Analysis of Financial Condition and Results of Operations.” INTERMODAL TRAFFIC - The intermodal market consists of shipments moving in trailers, domestic and international containers, and Roadrailer® equipment. These shipments are handled on behalf of intermodal marketing companies, international steamship lines, truckers, and other shippers. Intermodal units handled in 2008 were 3 million, the revenues from which accounted for 19% of NS’ total railway operating revenues for the year. See the discussion of intermodal traffic in Part II, Item 7, “Management’s Discussion and Analysis of Financial Condition and Results of Operations.” FREIGHT RATES - In 2008, NS’ railroads continued their reliance on private contracts and exempt price quotes as their predominant pricing mechanisms. Thus, a major portion of NS’ railroads’ freight business is not currently economically regulated by the government. In general, market forces have been substituted for government regulation and now are the primary determinant of rail service prices. In 2008, NS’ railroads were found by the STB to be “revenue adequate” based on results for the year 2006. The STB has not made its revenue adequacy determination for the year 2007. A railroad is “revenue adequate” under the applicable law when its return on net investment exceeds the rail industry’s composite cost of capital. This determination is made pursuant to a statutory requirement.

K7
PASSENGER OPERATIONS
• Regularly scheduled passenger trains are operated by Amtrak on NS’ lines between the following locations:
- Alexandria, Virginia, and New Orleans, Louisiana - Raleigh and Charlotte, North Carolina - Selma and Charlotte, North Carolina - Chicago, Illinois, and Porter, Indiana - Chicago, Illinois, and Battle Creek, Michigan - Chicago, Illinois, and Pittsburgh, Pennsylvania - Chicago, Illinois, and Detroit, Michigan - Pittsburgh and Harrisburg, Pennsylvania
• Commuter trains are operated on the NS line between Manassas and Alexandria in accordance with contracts with two transportation commissions of the Commonwealth of Virginia
• NS leases the Chicago to Manhattan, Illinois, line to the Commuter Rail Division of the Regional Transportation Authority of Northeast Illinois
• NS operates freight service over lines with significant ongoing Amtrak and commuter passenger operations, and is conducting freight operations over trackage owned by:
- Amtrak - New Jersey Transit - Southeastern Pennsylvania Transportation Authority - Metro-North Commuter Railroad Company - Maryland Department of Transportation
• Passenger operations are conducted either by Amtrak or by the commuter agencies over trackage owned by Conrail in the Shared Assets Areas.
NONCARRIER OPERATIONS - NS’ noncarrier subsidiaries engage principally in the acquisition, leasing, and management of coal, oil, gas and minerals; the development of commercial real estate; telecommunications; and the leasing or sale of rail property and equipment. In 2008, no such noncarrier subsidiary or industry segment grouping of noncarrier subsidiaries met the requirements for a reportable business segment set forth in the Financial Accounting Standards Board issued Statement of Financial Accounting Standards No. 131, “Disclosures About Segments of an Enterprise and Related Information.” RAILWAY PROPERTY The NS railroad system extends across 22 states and the District of Columbia. The railroad infrastructure makes the company capital intensive with total property of approximately $22 billion. Capital Expenditures - Capital expenditures for road, equipment, and other property for the past five years were as follows (including capitalized leases): Capital Expenditures 2008 2007 2006 2005 2004 ($ in millions) Road and other property $ 1,070 $ 894 $ 756 $ 741 $ 612 Equipment 488 447 422 284 429 Total $ 1,558 $ 1,341 $ 1,178 $ 1,025 $ 1,041
K8
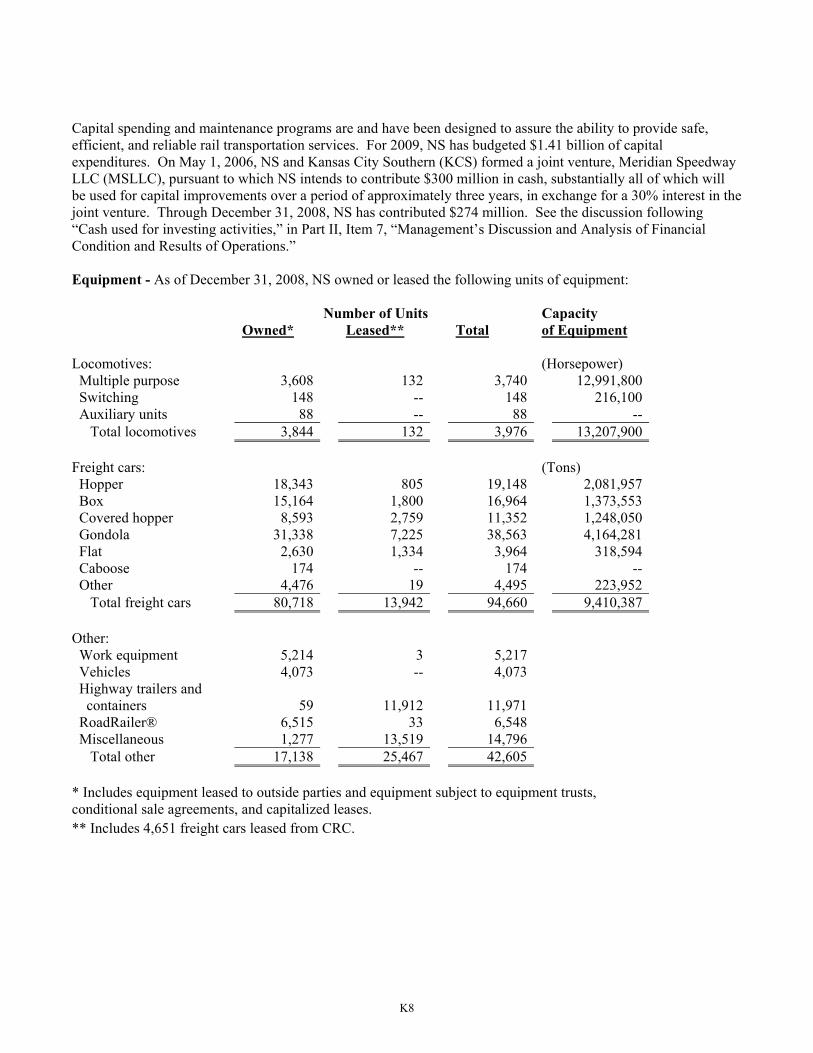
Capital spending and maintenance programs are and have been designed to assure the ability to provide safe, efficient, and reliable rail transportation services. For 2009, NS has budgeted $1.41 billion of capital expenditures. On May 1, 2006, NS and Kansas City Southern (KCS) formed a joint venture, Meridian Speedway LLC (MSLLC), pursuant to which NS intends to contribute $300 million in cash, substantially all of which will be used for capital improvements over a period of approximately three years, in exchange for a 30% interest in the joint venture. Through December 31, 2008, NS has contributed $274 million. See the discussion following “Cash used for investing activities,” in Part II, Item 7, “Management’s Discussion and Analysis of Financial Condition and Results of Operations.” Equipment - As of December 31, 2008, NS owned or leased the following units of equipment: Number of Units Capacity Owned* Leased** Total of Equipment Locomotives: (Horsepower) Multiple purpose 3,608 132 3,740 12,991,800 Switching 148 -- 148 216,100 Auxiliary units 88 -- 88 -- Total locomotives 3,844 132 3,976 13,207,900 Freight cars: (Tons) Hopper 18,343 805 19,148 2,081,957 Box 15,164 1,800 16,964 1,373,553 Covered hopper 8,593 2,759 11,352 1,248,050 Gondola 31,338 7,225 38,563 4,164,281 Flat 2,630 1,334 3,964 318,594 Caboose 174 -- 174 -- Other 4,476 19 4,495 223,952 Total freight cars 80,718 13,942 94,660 9,410,387 Other: Work equipment 5,214 3 5,217 Vehicles 4,073 -- 4,073 Highway trailers and containers 59 11,912 11,971 RoadRailer® 6,515 33 6,548 Miscellaneous 1,277 13,519 14,796 Total other 17,138 25,467 42,605
* Includes equipment leased to outside parties and equipment subject to equipment trusts, conditional sale agreements, and capitalized leases. ** Includes 4,651 freight cars leased from CRC.

K9
The following table indicates the number and year built for locomotives and freight cars owned at December 31, 2008. Year Built 1999- 1994- 1993 & 2008 2007 2006 2005 2004 2003 1998 Before Total Locomotives: No. of units 40 90 143 89 207 607 628 2,040 3,844 % of fleet 1% 2% 4% 2% 6% 16% 16% 53% 100% Freight cars: No. of units 2,360 1,200 404 89 -- 1,546 6,944 68,175 80,718 % of fleet 3% 1% 1% --% --% 2% 9% 84% 100% The following table shows the average age of NS’ locomotive and freight car fleets at December 31, 2008, and the number of retirements in 2008:
Locomotives Freight Cars Average age – in service 18.9 years 29.9 yearsRetirements 14 units 2,839 unitsAverage age – retired 34.4 years 39.6 years Ongoing freight car and locomotive maintenance programs are intended to ensure the highest standards of safety, reliability, customer satisfaction, and equipment marketability. The locomotive bad order ratio includes units out of service for required inspections every 92 days and program work such as overhauls. Annual Average Bad Order Ratio 2008 2007 2006 2005 2004 Freight cars 4.5% 4.9% 6.4% 6.3% 7.4% Locomotives 5.8% 5.7% 5.7% 6.2% 6.3% Encumbrances - Certain railroad equipment is subject to the prior lien of equipment financing obligations amounting to approximately $236 million as of December 31, 2008, and $389 million as of December 31, 2007. Track Maintenance - Of the approximately 37,500 total miles of track operated, NS had responsibility for maintaining about 30,000 miles of track, with the remainder being operated under trackage rights from another party responsible for maintenance. Over 75% of the main line trackage (including first, second, third, and branch main tracks, all excluding rail operated pursuant to trackage rights) has rail ranging from 131 to 155 pounds per yard with the standard installation currently at 136 pounds per yard. Approximately 44% of NS lines, excluding rail operated pursuant to trackage rights, carried 20 million or more gross tons per track mile during 2008.

K10
The following table summarizes several measurements regarding NS’ track roadway additions and replacements during the past five years: 2008 2007 2006 2005 2004 Track miles of rail installed 459 401 327 302 246 Miles of track surfaced 5,209 5,014 4,871 4,663 5,055 New crossties installed (millions) 2.7 2.7 2.7 2.5 2.5 Microwave System - The NS microwave system, consisting of approximately 7,400 radio route miles, 426 core stations, 30 secondary stations, and 5 passive repeater stations, provides communications between most operating locations. The microwave system is used primarily for voice communications, VHF radio control circuits, data and facsimile transmissions, traffic control operations, and AEI data transmissions. Traffic Control - Of the approximately 15,900 route miles owned by NS, about 11,000 miles are signalized, including 8,000 miles of centralized traffic control (CTC) and 3,000 miles of automatic block signals. Of the 8,000 miles of CTC, approximately 3,000 miles are controlled by data radio originating at 266 base station radio sites. Computers - A computer network consisting of a centralized data center in Atlanta, Georgia, and various distributed computers throughout the company connects the yards, terminals, transportation offices, rolling stock repair points, sales offices, and other key system locations. Operating and traffic data are processed and stored to provide customers with information on their shipments throughout the system. Computer systems provide current information on the location of every train and each car on line, as well as related waybill and other train and car movement data. In addition, the computer systems are utilized to assist management in the performance of a variety of functions and services including payroll, car and revenue accounting, billing, material management activities and controls, and special studies. ENVIRONMENTAL MATTERS - Compliance with federal, state, and local laws and regulations relating to the protection of the environment is a principal NS goal. To date, such compliance has not affected materially NS’ capital additions, earnings, liquidity, or competitive position. See “Legal Proceedings,” Part I, Item 3; “Personal Injury, Environmental, and Legal Liabilities” in Part II, Item 7, “Management’s Discussion and Analysis of Financial Condition and Results of Operations;” and Note 17 to the Consolidated Financial Statements. EMPLOYEES – The following table shows the average number of employees and the average cost per employee for wages and benefits: 2008 2007 2006 2005 2004 Average number of employees 30,709 30,806 30,541 30,294 28,475 Average wage cost per employee $66,000 $62,000 $62,000 $61,000 $59,000 Average benefit cost per employee $31,000 $30,000 $32,000 $29,000 $28,000 Approximately 85% of NS’ railroad employees are covered by collective bargaining agreements with various labor unions. See the discussion of “Labor Agreements” in Part II, Item 7, “Management’s Discussion and Analysis of Financial Condition and Results of Operations.” GOVERNMENT REGULATION - In addition to environmental, safety, securities, and other regulations generally applicable to all businesses, NS’ railroads are subject to regulation by the STB. The STB has jurisdiction
K11
over some rates, routes, fuel surcharges, conditions of service, and the extension or abandonment of rail lines. The STB also has jurisdiction over the consolidation, merger, or acquisition of control of and by rail common carriers. The Federal Railroad Administration regulates certain track and mechanical equipment standards. The relaxation of economic regulation of railroads, begun over two decades ago under the Staggers Rail Act of 1980, includes exemptions of intermodal business (trailer-on-flat-car, container-on-flat-car), rail boxcar traffic, lumber, manufactured steel, automobiles, and certain bulk commodities such as sand, gravel, pulpwood, and wood chips for paper manufacturing. Transportation contracts on regulated shipments effectively remove those shipments from regulation as well for the duration of the contract. About 86% of NS’ freight revenues come from either exempt traffic or traffic moving under transportation contracts. Efforts were made in 2008 to re-subject the rail industry to increased federal economic regulation and such efforts are expected to continue in 2009. The Staggers Rail Act of 1980, which substantially balanced such regulation, encouraged and enabled rail carriers to innovate and to compete for business, thereby contributing to the economic health of the nation and to the revitalization of the industry. Accordingly, NS will continue to oppose efforts to reimpose increased economic regulation. COMPETITION – There is continuing strong competition among rail, water, and highway carriers. Price is usually only one factor of importance as shippers and receivers choose a transport mode and specific hauling company. Inventory carrying costs, service reliability, ease of handling, and the desire to avoid loss and damage during transit are also important considerations, especially for higher-valued finished goods, machinery, and consumer products. Even for raw materials, semifinished goods, and work-in-process, users are increasingly sensitive to transport arrangements that minimize problems at successive production stages. NS’ primary rail competitor is the CSX system; both operate throughout much of the same territory. Other railroads also operate in parts of the territory. NS also competes with motor carriers, water carriers, and with shippers who have the additional option of handling their own goods in private carriage. Certain marketing strategies among railroads and between railroads and motor carriers enable carriers to compete more effectively in specific markets. SECURITY OF OPERATIONS – NS has taken significant steps to provide enhanced security for the NS rail system. In particular, NS has developed and implemented a comprehensive security plan that is modeled on and was developed in conjunction with the security plan prepared by the Association of American Railroads (AAR) post September 11, 2001. The AAR Security Plan defines four Alert Levels and details the actions and countermeasures that are being applied across the railroad industry as the terrorist threat increases or decreases. The Alert Level actions include countermeasures that will be applied in three general areas: (1) operations (including transportation, engineering, and mechanical); (2) information technology and communications; and (3) railroad police. Although security concerns preclude public disclosure of its contents, the NS Departmental Security Plan outlines the protocol within NS for all concerned to be notified of AAR Alert Level changes. All NS Operations Division employees are advised by their supervisors or train dispatchers, as appropriate, of any change in Alert Level and any additional responsibilities they may incur due to such change. The NS plan also effectively addresses and complies with Department of Transportation security regulations pertaining to training and security plans with respect to the transportation of hazardous materials. As part of the plan, security awareness training is given to all railroad employees who directly affect hazardous material transportation safety, and this training is integrated into recurring hazardous material training and re-certification programs. Toward that end, NS, working closely with the National Transit Institute at Rutgers University, has developed a four-module uniform national training program. NS also has worked with the Transportation Security Administration (TSA) in developing other industry training programs. More in-depth security training has been given to those select NS employees who have been given specific security responsibilities, and
K12
additional, location-specific security plans have been developed for certain metropolitan areas and each of six port facilities served by NS. With respect to the ports, each facility plan has been approved by the applicable Captain of the Port and subject to inspection by the U.S. Coast Guard. Additionally, NS engages in close and regular coordination with numerous federal and state agencies, including the U.S. Department of Homeland Security (DHS), the TSA, the Federal Bureau of Investigation (FBI), the Federal Railroad Administration (FRA), the U.S. Coast Guard, U.S. Customs and Border Protection, and various state Homeland Security offices. As one notable example, an NS Police Special Agent, under the auspices of the AAR, has been assigned to the National Joint Terrorism Task Force (NJTTF) operating out of FBI Headquarters in Washington, D.C. to represent and serve as liaison to the North American rail industry. This arrangement improves logistical flow of vital security and law enforcement information with respect to the rail industry as a whole, while having the post filled by an NS Special Agent has served to foster a strong working relationship between NS and the FBI. NS also has become a member of the Customs-Trade Partnership Against Terrorism (C-TPAT) program sponsored by U.S. Customs. C-TPAT allows NS to work closely with U.S. Customs and its customers to develop measures that will help ensure the integrity of freight shipments moving on NS, particularly those moving to or from a foreign country. Based on participation in C-TPAT, NS has ensured that its plan meets all current applicable security recommendations made by U.S. Customs. Similarly, NS is guided in its operations by various supplemental security action items issued by DHS and U.S. Department of Transportation (DOT), U.S. Coast Guard Maritime Security requirements, as well as voluntary security action items developed in 2006 in collaboration with TSA, DOT, and the freight railroads. Many of the action items are based on lessons learned from DHS and DOT security assessments of rail corridors in High Threat Urban Areas (HTUA) begun in 2004. Particular attention is paid to: (1) the establishment of secure storage areas for rail cars carrying toxic-by-inhalation (TIH) materials; (2) the expedited movement of trains transporting rail cars carrying TIH materials; (3) the minimization of unattended loaded tank cars carrying TIH materials; and (4) cooperation with federal, state, local and tribal governments to identify, through risk assessments, those locations where security risks are the highest. These action items and NS’ compliance initiatives are outlined in the various departmental sections of the NS Departmental Security Plan. NS is also taking the appropriate actions to ensure compliance with the 2008 TSA Final Rule addressing Rail Security Sensitive Materials, and the 2008 Pipeline and Hazardous Materials Safety Administration (PHMSA) rail-routing regulations outlined in Docket HM-232E. In 2008, through participation in the Transportation Community Awareness and Emergency Response (TRANSCAER) Program, NS provided rail accident response training to approximately 4,300 emergency responders, such as local police and fire personnel, representing over 25,000 man-hours of emergency response training. NS also conducted railroad operations classes for FBI agents and the railroad liaison agents from Joint Terrorism Task Forces. NS’ other training efforts throughout 2008 included participation in 15 drills including 2 major full-scale exercises with various local, state, and federal agencies conducted in accordance with the DHS Exercise and Evaluation Program. NS also has ongoing programs to sponsor local emergency responders at tank car emergency response training programs conducted at the AAR Transportation Technology Center in Pueblo, Colorado. Also, the NS annual TRANSCAER Whistle-Stop train makes stops in numerous cities, its special training cars serving as a resource to an audience of nearly 1,000 emergency responders annually. Improvements in equipment design also are expected to play a role in enhancing rail security. The Pipeline and Hazardous Materials Safety Administration (PHMSA), in coordination with the FRA, is amending the Hazardous Materials Regulations to prescribe enhanced safety measures for rail transportation of TIH materials, including interim design standards for railroad tank cars. The rule mandates commodity-specific improvements in safety features and design standards for newly manufactured DOT specification tank cars and an improved top fittings performance standard. The interim standards established in this rule will enhance the accident survivability of TIH tank cars.

K13
Item 1A. Risk Factors NS is subject to significant governmental legislation and regulation over commercial, environmental, and operating matters. Railroads are subject to the enactment of laws by Congress that could increase economic regulation of the industry. Railroads presently are subject to commercial regulation by the STB, which has jurisdiction over some routes, rates and fuel surcharges, conditions of service, and the extension or abandonment of rail lines. The STB also has jurisdiction over the consolidation, merger, or acquisition of control of and by rail common carriers. Additional economic regulation of the rail industry by Congress or the STB, whether under new or existing laws, could have a significant negative impact on NS’ ability to determine prices for rail services and result in a material adverse effect in the future on NS’ financial position, results of operations, or liquidity in a particular year or quarter. This potential material adverse effect could also result in reduced capital spending on NS’ rail network. Railroads are subject to safety and security regulation by the DOT and the DHS, which regulate most aspects of NS’ operations. Compliance with the Rail Safety Improvement Act of 2008 will result in additional operating costs associated with the statutory mandate to implement positive train control by 2015. In addition, NS’ failure to comply with applicable laws and regulations could have a material adverse effect on NS. NS’ operations are subject to extensive federal, state, and local environmental laws and regulations concerning, among other things, emissions to the air; discharges to waterways or ground water supplies; handling, storage, transportation, and disposal of waste and other materials; and the cleanup of hazardous material or petroleum releases. The risk of incurring environmental liability – for acts and omissions, past, present, and future – is inherent in the railroad business. Property owned by NS, whether currently or in the past, is and has been subject to a variety of uses, including NS railroad operations and other industrial activity by past owners or past and present tenants of NS. Environmental problems that are latent or undisclosed may exist on these properties, and NS could incur environmental liabilities or costs, the amount and materiality of which cannot be estimated reliably at this time, with respect to one or more of these properties. Moreover, lawsuits and claims involving other unidentified environmental sites and matters are likely to arise from time to time, and the resulting liabilities could have a significant effect on financial position, results of operations, or liquidity in a particular year or quarter. NS, as a common carrier by rail, must offer to transport hazardous materials, regardless of risk. Transportation of certain hazardous materials could create catastrophic losses in terms of personal injury and property damage costs, and compromise critical parts of our rail network. NS may be affected by terrorism or war. Any terrorist attack, or other similar event, any government response thereto, and war or risk of war could cause significant business interruption and may adversely affect NS’ results of operations, financial position, and liquidity in a particular year or quarter. Because NS plays a critical role in the nation’s transportation system, it could become the target of such an attack or have a significant role in the government’s preemptive approach or response to an attack or war. Although NS currently maintains insurance coverage for third-party liability arising out of war and acts of terrorism, it maintains only limited insurance coverage for first-party property damage and damage to property in NS’ care, custody, or control caused by certain acts of terrorism. In addition, premiums for some or all of NS’ current insurance programs covering these losses could increase dramatically, or insurance coverage for certain losses could be unavailable to NS in the future. NS may be affected by general economic conditions. Prolonged negative changes in domestic and global economic conditions affecting the producers and consumers of the commodities NS carries may have an adverse effect on its operating results, financial position, and liquidity. Economic conditions resulting in bankruptcies of one or more large customers could have a significant impact on NS’ financial position, results of operations, or liquidity in a particular year or quarter.

K14
NS may be affected by the impact of environmental regulation on its utility coal customers and/or the value of certain NS assets. A number of evolving environmental issues could affect the U.S. utility coal market, including potential regional programs aimed at capping and reducing power plant CO2 emissions and ongoing efforts at addressing climate change. Although certain utilities have begun adding or are planning to add emissions control technologies to their electric generating units, allowing them to utilize their existing coal-fired power plants, future regulatory developments in this area could have a negative effect on NS’ utility coal customers and/or the value of coal reserves owned by NS and thus an adverse effect on NS’ operating results, financial position, and liquidity. NS faces competition from other transportation providers. NS is subject to competition from motor carriers, railroads, and to a lesser extent, ships, barges, and pipelines, on the basis of transit time, pricing, and the quality and reliability of service. While NS has used primarily internal resources to build or acquire and maintain its rail system, trucks and barges have been able to use public rights-of-way maintained by public entities. Any future improvements or expenditures materially increasing the quality or reducing the cost of alternative modes of transportation in the regions in which NS operates, or legislation granting materially greater latitude for motor carriers with respect to size or weight limitations, could have a material adverse effect on its financial position, results of operations, or liquidity in a particular year or quarter. The operations of carriers with which NS interchanges may adversely affect its operations. NS’ ability to provide rail service to customers in the U.S. and Canada depends in large part upon its ability to maintain cooperative relationships with connecting carriers with respect to, among other matters, freight rates, revenue divisions, car supply and locomotive availability, data exchange and communications, reciprocal switching, interchange, and trackage rights. Deterioration in the operations of, or service provided by connecting carriers, or in our relationship with those connecting carriers, could result in NS’ inability to meet its customers’ demands or require NS to use alternate train routes, which could result in significant additional costs and network inefficiencies. NS relies on technology and technology improvements in its business operations. If NS experiences significant disruption or failure of one or more of its information technology systems, including computer hardware, software, and communications equipment, NS could experience a service interruption, security breach, or other operational difficulties, which could have a material adverse impact on its results of operations, financial condition, and liquidity in a particular year or quarter. Additionally, if NS does not have sufficient capital to acquire new technology or if it is unable to implement new technology, NS may suffer a competitive disadvantage within the rail industry and with companies providing other modes of transportation service, which could have a material adverse effect on its financial position, results of operations, or liquidity in a particular year or quarter. The vast majority of NS employees belong to labor unions, and labor agreements, strikes, or work stoppages could adversely affect its operations. Approximately 26,000, or about 85%, of NS railroad employees are covered by collective bargaining agreements with various labor unions. If unionized workers were to engage in a strike, work stoppage, or other slowdown, NS could experience a significant disruption of its operations. Additionally, future national labor agreements, or renegotiation of labor agreements or provisions of labor agreements, could significantly increase NS’ costs for healthcare, wages, and other benefits. Any of these factors could have a material adverse impact on NS’ financial position, results of operations, or liquidity in a particular year or quarter. NS may be subject to various claims and lawsuits that could result in significant expenditures. The nature of NS’ business exposes it to the potential for various claims and litigation related to labor and employment, personal injury, commercial disputes, freight loss and other property damage, and other matters. Job-related

K15
personal injury and occupational claims are subject to the Federal Employers’ Liability Act (FELA), which is applicable only to railroads. FELA’s fault-based tort system produces results that are unpredictable and inconsistent as compared with a no-fault worker’s compensation system. The variability inherent in this system could result in actual costs being very different from the liability recorded. Any material changes to current litigation trends or a catastrophic rail accident involving any or all of freight loss or property damage, personal injury, and environmental liability could have a material adverse effect on NS’ operating results, financial condition, and liquidity to the extent not covered by insurance. NS has obtained insurance for potential losses for third-party liability and first-party property damages. Specified levels of risk are retained on a self-insurance basis (currently up to $25 million and above $1 billion per occurrence for bodily injury and property damage to third parties and $25 million and above $175 million per occurrence for property owned by NS or in its care, custody, or control). Insurance is available from a limited number of insurers and may not continue to be available or, if available, may not be obtainable on terms acceptable to NS. Severe weather could result in significant business interruptions and expenditures. Severe weather conditions and other natural phenomena, including hurricanes, floods, fires, and earthquakes, may cause significant business interruptions and result in increased costs, increased liabilities, and decreased revenues, which could have an adverse effect on NS’ financial position, results of operations, or liquidity in a particular year or quarter. Unpredictability of demand for rail services resulting in the unavailability of qualified personnel could adversely affect NS’ operational efficiency and ability to meet demand. Workforce demographics, training requirements, and the availability of qualified personnel, particularly engineers and trainmen, could each have a negative impact on NS’ ability to meet demand for rail service. Unpredictable increases in demand for rail services may exacerbate such risks, which could have a negative impact on NS’ operational efficiency and otherwise have a material adverse effect on its financial position, results of operations, or liquidity in a particular year or quarter. NS may be affected by supply constraints resulting from disruptions in the fuel markets or the nature of some of its supplier markets. NS consumes about 500 million gallons of diesel fuel each year. Fuel availability could be affected by any limitation in the fuel supply or by any imposition of mandatory allocation or rationing regulations. If a severe fuel supply shortage arose from production curtailments, increased demand in existing or emerging foreign markets, disruption of oil imports, disruption of domestic refinery production, damage to refinery or pipeline infrastructure, political unrest, war or other factors, NS’ financial position, results of operations, or liquidity in a particular year or quarter could be materially adversely affected. Also, such an event would impact NS as well as its customers and other transportation companies. Due to the capital intensive nature and industry-specific requirements of the rail industry, there are high barriers of entry for potential new suppliers of core railroad items, such as locomotives and rolling stock equipment. Additionally, NS competes with other industries for available capacity and raw materials used in the production of certain track materials, such as rail and ties. Changes in the competitive landscapes of these limited-supplier markets could result in increased prices or material shortages that could materially affect NS’ financial position, results of operations, or liquidity in a particular year or quarter. The state of capital markets could adversely affect NS’ liquidity. NS from time-to-time relies on the capital markets to provide some of its capital requirements, including the issuance of long-term debt instruments and commercial paper, as well as the sale of certain receivables. Significant instability or disruptions of the capital markets, including the credit markets, or deterioration of NS’ financial condition due to internal or external factors could restrict or eliminate NS’ access to, and/or significantly increase the cost of, various financing sources, including bank credit facilities and issuance of corporate bonds. Instability or disruptions of the capital markets and deterioration of NS’ financial condition, alone or in combination, could also result in a reduction in NS’ credit

K16
rating to below investment grade, which could prohibit or restrict NS from accessing external sources of short- and long-term debt financing and/or significantly increase the associated costs. Item 1B. Unresolved Staff Comments None. Item 3. Legal Proceedings The Ohio Environmental Protection Agency has notified Norfolk Southern that it intends to seek penalties and require Norfolk Southern to take remedial actions in connection with alleged violations of the Clean Air and Water Acts stemming from the operation of our coal dock in Ashtabula, Ohio. The Pennsylvania Department of Environmental Protection has submitted to NS a proposed Consent Assessment of Civil Penalty with respect to several alleged environmental releases from September 2007 to the present. Although NS will contest liability and the imposition of any penalties, because these governmental proceedings with respect to environmental laws and regulations involve potential fines, penalties or other monetary sanctions in excess of $100,000, we describe them here consistent with SEC rules and requirements. NS does not believe that the outcome of these proceedings will have a material effect on its financial position, results of operations, or liquidity. On November 6, 2007, various antitrust class actions filed against NS and other Class 1 railroads in various Federal district courts regarding fuel surcharges were consolidated in the District of Columbia by the Judicial Panel on Multidistrict Litigation. NS believes the allegations in the complaints are without merit and intends to vigorously defend the cases. NS does not believe that the outcome of these proceedings will have a material effect on its financial position, results of operations, or liquidity. A lawsuit containing similar allegations against NS and four other major railroads that was filed on March 25, 2008, in the U.S. District Court for the District of Minnesota was voluntarily dismissed by the plaintiff subject to a tolling agreement entered into in August 2008. On April 24, 2008, the United States Department of Justice (DOJ) brought an action against NS for alleged violations of federal environmental laws resulting from the discharge of chlorine and oil that occurred as a result of the January 6, 2005 derailment in Graniteville, SC, including claims for civil penalties as well as injunctive relief. On June 24, 2008, NS filed a motion to dismiss DOJ’s claims, contending that insufficient facts have been alleged to support such claims. NS does not believe that the resolution of these claims will have a material adverse effect on its financial position, results of operations, or liquidity. Item 4. Submission of Matters to a Vote of Security Holders There were no matters submitted to a vote of security holders during the fourth quarter of 2008.

K17
Executive Officers of the Registrant. Norfolk Southern’s executive officers generally are elected and designated annually by the Board of Directors at its first meeting held after the annual meeting of stockholders, and they hold office until their successors are elected. Executive officers also may be elected and designated throughout the year as the Board of Directors considers appropriate. There are no family relationships among the officers, nor any arrangement or understanding between any officer and any other person pursuant to which the officer was selected. The following table sets forth certain information, as of February 1, 2009, relating to the executive officers. Name, Age, Present Position Business Experience During Past Five Years Charles W. Moorman, 56, Present position since February 1, 2006. Chairman, President and Served as President and Chief Executive Officer from Chief Executive Officer November 1, 2005 to February 1, 2006; as President from October 1, 2004 to November 1, 2005; as Senior Vice President – Corporate Planning and Services from December 1, 2003 to October 1, 2004; Senior Vice President – Corporate Services from February 1, 2003 to December 1, 2003 and prior thereto served as President – Thoroughbred Technology and Telecommunications, Inc. Stephen C. Tobias, 64, Present position since August 1, 1998. Vice Chairman and Chief Operating Officer Deborah H. Butler, 54, Present position since June 1, 2007. Executive Vice President – Prior thereto served as Vice President – Customer Service. Planning and Chief Information Officer James A. Hixon, 55, Present position since October 1, 2005. Executive Vice President – Served as Executive Vice President – Finance and Public Affairs Law and Corporate Relations From October 1, 2004, to October 1, 2005; Senior Vice President – Legal and Government Affairs from December 1, 2003 to October 1, 2004 and prior thereto served as Senior Vice President – Administration. Mark D. Manion, 56, Present position since October 1, 2004. Executive Vice President – Served as Senior Vice President – Transportation Operations Operations from December 1, 2003 to October 1, 2004 and prior thereto served as Vice President – Transportation Services and Mechanical. John P. Rathbone, 56, Present position since October 1, 2004. Executive Vice President – Served as Senior Vice President – Administration from Administration December 1, 2003 to October 1, 2004 and prior thereto served as Senior Vice President and Controller. Donald W. Seale, 56, Present position since April 1, 2006. Executive Vice President Served as Executive Vice President – Sales and Marketing from and Chief Marketing Officer October 1, 2004 to April 1, 2006; as Senior Vice President – Marketing Services from December 1, 2003 to October 1, 2004 and prior thereto was Senior Vice President – Merchandise Marketing.

K18
James A. Squires, 47, Present position since July 1, 2007. Executive Vice President – Served as Executive Vice President – Finance from April 1, Finance and Chief Financial 2007 to July 1, 2007, Senior Vice President – Financial Planning Officer from April 1, 2006 to April 1, 2007, Senior Vice President – Law from October 1, 2004 to April 1, 2006, as Vice President – Law from December 1, 2003 to October 1, 2004 and prior thereto was Senior General Counsel. Daniel D. Smith, 56, Present position since December 1, 2003. Senior Vice President – Prior thereto served as President - NS Development. Energy and Properties Marta R. Stewart, 51, Present position since December 1, 2003. Vice President and Controller Prior thereto was Assistant Vice President Corporate Accounting.

K19
PART II
NORFOLK SOUTHERN CORPORATION AND SUBSIDIARIES (NS)
Item 5. Market for Registrant’s Common Equity, Related Stockholder Matters and Issuer Purchases of Equity Securities
NORFOLK SOUTHERN CORPORATION AND SUBSIDIARIES STOCK PRICE AND DIVIDEND INFORMATION
The Common Stock of Norfolk Southern Corporation, owned by 35,466 stockholders of record as of December 31, 2008, is traded on the New York Stock Exchange under the symbol NSC. The following table shows the high and low sales prices as reported by Bloomberg L.P. on its internet-based service and dividends per share, by quarter, for 2008 and 2007. Quarter
2008 1st 2nd 3rd 4th Market price High $ 56.89 $ 67.38 $ 73.64 $ 65.04 Low 44.15 54.94 57.82 43.29 Dividends per share $ 0.29 $ 0.29 $ 0.32 $ 0.32
2007 1st 2nd 3rd 4th Market price High $ 53.84 $ 59.19 $ 59.77 $ 54.58 Low 45.38 49.70 46.42 48.03 Dividends per share $ 0.22 $ 0.22 $ 0.26 $ 0.26 ___________________________________________________________________________________________
ISSUER PURCHASES OF EQUITY SECURITIES
Period
(a) Total Number of Shares (or Units)
Purchased (1)
(b) Average Price Paid per Share
(or Unit)
(c) Total Number of Shares (or Units)
Purchased as Part of Publicly Announced Plans or Programs(2)
(d) Maximum Number (or Approximate Dollar Value)
of Shares (or Units) that may yet be Purchased
Under the Plans or Programs(2)
October 1-31, 2008 4,202,600 54.43 4,202,600 10,312,150
November 1-30, 2008 -- -- -- 10,312,150
December 1-31, 2008 2,125 47.05 -- 10,312,150
Total 4,204,725 4,202,600
(1) Of this amount 2,125 represent shares tendered by employees in connection with the exercise of stock options under the Long-Term Incentive Plan.
(2) On November 22, 2005, the Board of Directors authorized a share repurchase program, pursuant to which up to 50 million shares of Common Stock could be purchased through December 31, 2015. On March 27, 2007, the Board of Directors amended the program and increased the number of shares that may be repurchased to 75 million, and shortened the repurchase term by five years to December 31, 2010.

K20
Item 6. Selected Financial Data
NORFOLK SOUTHERN CORPORATION AND SUBSIDIARIES FIVE-YEAR FINANCIAL REVIEW
2008 2007 2006 20051 20042 ($ in millions, except per share amounts)
RESULTS OF OPERATIONS Railway operating revenues $ 10,661 $ 9,432 $ 9,407 $ 8,527 $ 7,312 Railway operating expenses 7,577 6,847 6,850 6,410 5,610 Income from railway operations
3,084
2,585
2,557
2,117
1,702
Other income – net 110 93 149 74 76 Interest expense on debt 444 441 476 494 489 Income before income taxes 2,750 2,237 2,230 1,697 1,289 Provision for income taxes 1,034 773 749 416 379 Net income $ 1,716 $ 1,464 $ 1,481 $ 1,281 $ 910 PER SHARE DATA Net income – basic $ 4.60 $ 3.74 $ 3.63 $ 3.17 $ 2.31 – diluted $ 4.52 $ 3.68 $ 3.57 $ 3.11 $ 2.28 Dividends $ 1.22 $ 0.96 $ 0.68 $ 0.48 $ 0.36 Stockholders’ equity at year end $ 26.23 $ 25.64 $ 24.19 $ 22.63 $ 19.92
FINANCIAL POSITION Total assets $ 26,297 $ 26,144 $ 26,028 $ 25,859 $ 24,748 Total long-term debt, including current maturities $ 6,667 $ 6,368 $ 6,600 $ 6,930 $ 7,525 Stockholders’ equity $ 9,607 $ 9,727 $ 9,615 $ 9,276 $ 7,977 OTHER Capital expenditures $ 1,558 $ 1,341 $ 1,178 $ 1,025 $ 1,041 Average number of shares outstanding (thousands)
372,276
389,626
405,988
404,170
394,201
Number of stockholders at year end 35,466 36,955 38,900 48,180 51,032 Average number of employees: Rail 30,241 30,336 30,079 29,851 28,057 Nonrail 468 470 462 443 418 Total 30,709 30,806 30,541 30,294 28,475
1 2005 provision for income taxes includes a $96 million benefit related to the reduction of NS’ deferred income tax liabilities resulting from tax legislation enacted by Ohio. This benefit increased net income by $96 million, or 23 cents per diluted share.
2 2004 other income – net includes a $40 million net gain from the Conrail Corporate Reorganization. This gain increased net income by $40 million or 10 cents per diluted share.
See accompanying Consolidated Financial Statements and notes thereto.

K21
Item 7. Management’s Discussion and Analysis of Financial Condition and Results of Operations
Norfolk Southern Corporation and Subsidiaries Management’s Discussion and Analysis of
Financial Condition and Results of Operations The following discussion and analysis should be read in conjunction with the Consolidated Financial Statements and Notes and the Selected Financial Data. OVERVIEW NS’ 2008 net income rose 17% largely on the strength of a 19% increase in income from railway operations. Operating results reflected higher average revenue per unit (including fuel surcharge revenue) that more than offset the effects of increased operating expenses and lower traffic volume. Operating revenues increased 13% and operating expenses rose 11% compared to 2007, resulting in a lower operating ratio (a measure of the amount of revenues consumed by expenses) of 71.1%, as compared with 72.6% in 2007. Cash provided by operating activities was $2.7 billion, exceeding $2 billion for the fourth consecutive year. Coupled with net borrowings of $280 million, this provided funding for increased capital expenditures, share repurchases, and higher dividends. During 2008, NS purchased and retired 19.4 million shares of NS common stock at a total cost of $1.1 billion under the share repurchase program which the Board of Directors approved in November 2005 and subsequently amended in March 2007 to authorize the repurchase of up to 75 million shares of NS common stock through December 31, 2010. In total, NS has purchased and retired 64.7 million shares under this program at a cost of $3.3 billion. Looking ahead, NS expects revenues to decline in 2009, reflecting lower traffic volume due to the weak economy and decreased fuel surcharge revenue resulting from lower fuel prices. NS plans to continue to improve service, maintain a market-based approach to pricing, and reduce volume-related costs. SUMMARIZED RESULTS OF OPERATIONS 2008 Compared with 2007 Net income in 2008 was $1.7 billion, up $252 million, or 17%, compared with 2007. Diluted earnings per share were $4.52, up 84¢, or 23%. The greater percentage increase in per share earnings was due to fewer shares outstanding as a result of NS’ share repurchase program (see Note 13). The increase in net income was primarily due to higher income from railway operations that was offset in part by higher income taxes (see Note 3). Railway operating revenues increased $1.2 billion, as higher average revenue per unit (including fuel surcharges) outweighed lower traffic volumes. Railway operating expenses increased $730 million, principally due to higher fuel costs and increased compensation and benefits expenses. Oil prices affect NS’ results of operations in a variety of ways and can have an overall favorable or unfavorable impact in any particular quarter or year. In addition to the impact of oil prices on general economic conditions and traffic volume, oil prices directly affect NS’ revenues through market-based fuel surcharges and contract escalators (see “Railway Operating Revenues”) and also affect fuel costs (see “Railway Operating Expenses”). For 2008, oil prices had an overall favorable impact on income from railway operations. Future changes in oil prices may cause volatility in operating results that could be material to a particular quarter or year.

K22
2007 Compared with 2006 Net income in 2007 was $1.5 billion, down $17 million, or 1%, compared with 2006. Diluted earnings per share were $3.68, up 11¢, or 3%, reflecting fewer shares outstanding as a result of NS’ share repurchase program (see Note 13). The decrease in net income was primarily due to higher income taxes and lower non-operating items that offset higher income from railway operations. Railway operating revenues increased $25 million, as higher average revenue per unit overshadowed lower traffic volumes. Railway operating expenses decreased $3 million, principally due to lower volume-related expenses that offset higher fuel expense. DETAILED RESULTS OF OPERATIONS Railway Operating Revenues Railway operating revenues were $10.7 billion in 2008 and $9.4 billion in 2007 and 2006. The following table presents a three-year comparison of revenues, volume, and average revenue per unit by market group.
Revenues Units Revenue per Unit 2008 2007 2006 2008 2007 2006 2008 2007 2006 ($ in millions) (in thousands) ($ per unit) Coal $ 3,111 $ 2,315 $ 2,330 1,765.7 1,699.4 1,760.0 $ 1,762 $ 1,363 $ 1,324 General merchandise: Agr./cons. prod./govt. 1,282 1,047 994 612.4 601.5 594.1 2,093 1,740 1,673 Metals/construction 1,251 1,149 1,168 742.4 783.6 835.3 1,686 1,467 1,398 Chemicals 1,238 1,166 1,079 393.7 426.7 426.4 3,144 2,732 2,530 Paper/clay/forest 898 860 891 394.1 428.1 466.7 2,280 2,010 1,909 Automotive 823 974 974 412.2 533.0 561.9 1,997 1,827 1,734 General merchandise 5,492 5,196 5,106 2,554.8 2,772.9 2,884.4 2,150 1,874 1,770 Intermodal 2,058 1,921 1,971 3,029.0 3,120.7 3,256.5 679 615 605 Total $ 10,661 $ 9,432 $ 9,407 7,349.5 7,593.0 7,900.9 $ 1,451 $ 1,242 $ 1,191 Revenues increased $1.2 billion in 2008 and $25 million in 2007. As shown in the table below, both revenue improvements were the result of increased average revenue per unit, including fuel surcharge revenue, which more than offset decreased traffic volumes. Fuel surcharge revenue amounted to $1.6 billion in 2008 (up $830 million) compared to $792 million in 2007 and $1 billion in 2006. If fuel prices remain at or near year-end 2008 levels, fuel surcharge revenues in 2009 will be substantially lower, with a corresponding effect on revenue per unit. Many of Norfolk Southern’s negotiated fuel surcharges for coal and general merchandise traffic are based on the monthly average price of West Texas Intermediate Crude Oil (WTI Average Price). These surcharges are reset the first day of each calendar month based on the WTI Average Price for the second preceding calendar month. This two-month lag in computing WTI Average Price coupled with the sharp drop in fuel prices late in the year increased fuel surcharge revenue by approximately $100 million for the year.
Revenue Variance Analysis Increases (Decreases)
2008 vs. 2007 2007 vs. 2006 ($ in millions) Revenue per unit/mix $ 1,531 $ 392 Traffic volume (units) (302) (367) Total $ 1,229 $ 25

K23
Both comparisons reflect large increases in average revenue per unit, a result of higher rates and increased fuel surcharges. Traffic volumes in both years declined. For 2008, traffic volumes for all commodity groups except coal and agriculture/consumer products/government decreased. In 2007, traffic volumes for all commodity groups except agriculture/consumer products/government and chemicals decreased. On January 26, 2007, the Surface Transportation Board (STB) issued a decision that the type of fuel surcharge imposed by NS and most other large railroads – a fuel surcharge based on a percentage of line haul revenue – would no longer be permitted for regulated traffic that moves under public (tariff) rates. The STB gave the railroads a 90-day transition period to adjust their fuel surcharge programs. During the second quarter of 2007, NS discontinued assessing fuel surcharges on its published (non-intermodal) public rates. Adjustments to public prices now reflect ongoing market conditions. The traffic moving under these tariffs and public quotes comprises about 10% of Norfolk Southern’s total revenue base. COAL revenues increased $796 million, or 34%, compared with 2007, reflecting higher rates, including fuel surcharges, and a 4% increase in traffic volume. Coal average revenue per unit was up 29% compared with 2007, reflecting higher rates (which were comprised of pricing increases, contract escalators and the effect of increased longer-haul export coal traffic) and increased fuel surcharges. For 2009, average revenue per unit is expected to decline reflecting the effects of lower fuel surcharges and contract escalators. Coal represented 29% of NS’ revenues in 2008 and 79% of shipments handled originated on NS’ lines. As shown in the following table, increased shipments of export, utility, and domestic metallurgical coal more than offset lower industrial shipments.
Total Coal, Coke, and Iron Ore Tonnage 2008 2007 2006 (Tons in thousands) Utility 144,451 142,734 148,078Export 23,069 15,564 12,409Domestic metallurgical 18,155 17,873 20,878Industrial 8,553 9,794 9,202 Total 194,228 185,965 190,567 Coal revenues in 2007 decreased $15 million, or 1%, compared with 2006, as a 2% reduction in tonnage handled more than offset a 3% increase in average revenue per unit. Carloads declined 3%, a higher percentage than the change in tonnage handled because of increased average tonnage per car. Coal represented 25% of NS’ revenues in 2007, and 78% of shipments handled originated on NS’ lines. NS is currently involved in litigation with Virginia Electric and Power Company/Old Dominion Electric Cooperative (Virginia Power) regarding rate adjustment provisions in a transportation contract between them. In 2007, the Virginia Supreme Court issued a decision that remanded the case to the trial court on the grounds that neither of its prior decisions constituted a final order. In April 2008, the trial court entered a final order granting NS monetary damages, including interest, and prescribing the methodology for determining future rates. Virginia Power filed a notice of appeal and the Virginia Supreme Court has agreed to hear the appeal. Future developments and the ultimate resolution of this matter could result in NS recognizing additional revenues related to this dispute, which could have a favorable impact on results of operations in a particular year or quarter. Utility coal tonnage increased 1%, compared with 2007, a result of modest stockpile growth in the Northeast.

K24
In 2007, utility coal tonnage decreased 4% compared with 2006, reflecting high stockpile levels (particularly in the Southeast) that led to reduced shipments, despite fairly strong electric generation (up 4%) in the NS service region. In addition, the temporary closure of a major coal mine as well as the loss of business to barge transportation contributed to the decline. For 2009, utility coal tonnage is expected to weaken, with lower electric demand as a result of a weak economy. Export coal tonnage increased 48% compared to 2007, reflecting increased global demand coupled with weather-related supply constraints in Australia, reduced export volume from China, and the weak U.S. dollar. Norfolk volume increased about 51,000 carloads, or 39%, and Baltimore volume was up about 28,000 carloads, or 102%. Export coal tonnage in 2007 increased 25% compared to 2006, primarily due to increased demand reflecting a lower valued U.S. dollar as well as loading delays at Australian ports. Norfolk volume increased by approximately 26,000 cars, or 25%, and Baltimore volume was up approximately 4,500 cars, or 19%. For 2009, export coal tonnage is expected to decrease, reflecting a significant reduction in worldwide steel production, increasing competition into Europe due to changes in ocean freight rates, and the strengthening of the U.S. dollar against other currencies. Domestic metallurgical coal, coke, and iron ore tonnage increased 2% compared with 2007, reflecting the start up of a new coke plant. In 2007, domestic metallurgical coal, coke, and iron ore tonnage decreased 14% compared with 2006. The decrease was primarily due to coke furnace outages, mine production outages, and reduced spot iron ore traffic. For 2009, domestic metallurgical coal, coke, and iron ore tonnage is expected to be down due to lower domestic steel demand. Other coal tonnage (principally steam coal shipped to industrial plants) decreased 13% in 2008 compared to 2007 principally due to coal supply constraints. In 2007, other coal tonnage increased 6% versus 2006, primarily due to new business and stronger demand. For 2009, other coal tonnage is expected to be flat compared to 2008. GENERAL MERCHANDISE revenues in 2008 increased $296 million, or 6%, compared with 2007, as a 15% increase in average revenue per unit, reflecting continued market-based pricing and higher fuel surcharges, more than offset an 8% decline in traffic volume. In 2007, general merchandise revenues increased $90 million, or 2%, compared with 2006, as a 6% increase in average revenue per unit, more than offset a 4% decline in traffic volume. Revenue in 2007 included $26 million related to a volume-related contract settlement with an automotive customer. Agriculture, consumer products, and government revenue increased 22% in 2008 compared with 2007. The revenue improvement resulted from higher average revenue per unit, which reflected increased rates and higher fuel surcharge revenues. Traffic volume increased 2% as more ethanol, military, feed, soybeans, and food oils shipments offset declines in fertilizers, corn, beverages, and consumer products. Agriculture, consumer products, and government revenue increased 5% in 2007 compared with 2006. The revenue improvement resulted from higher average revenue per unit, which reflected higher rates. Traffic volume rose modestly as more corn, fertilizer, and ethanol shipments were mitigated by less government and consumer product volume.

K25
For 2009, agriculture revenue is expected to post modest growth, benefiting from increasing demand for biofuel products including ethanol, biodiesel, and feed ingredients from their production, and slightly higher average revenue per unit (including fuel surcharges). However, lower volumes in corn, soybeans, and fertilizer shipments due to softer demand along with declines in consumer products markets are expected to partially offset this growth. Metals and construction revenue increased 9% in 2008 as a 15% increase in average revenue per unit that resulted from increased rates and higher fuel surcharge more than offset the effects of a 5% decrease in traffic volume. The decline in volume was due to reduced demand for construction materials and lower coil, iron, and steel shipments, reflecting the weak housing and automotive sectors. Metals and construction revenue decreased 2% in 2007 as a 5% increase in average revenue per unit that resulted from higher rates was more than offset by the effects of a 6% decrease in traffic volume. The decline in volume was principally due to lower iron, steel, and coil shipments and reduced demand for construction materials, both reflecting the soft automotive and housing sectors. For 2009, metals and construction revenues are expected to decline as a result of decreased traffic volumes due to lower steel production in North America coupled with continued weakness in the housing and automotive sectors and lower average revenue per unit (including fuel surcharges). Chemicals revenue in 2008 increased 6%, compared with 2007, a result of increased rates and higher fuel surcharge revenue. Traffic volume declined 8%, reflecting continued weakness in both industrial intermediates and plastics (linked to housing construction declines) in addition to miscellaneous chemicals and petroleum-based products. In 2007, chemicals revenue increased 8% compared with 2006, reflecting higher rates in all groups. Traffic volume rose modestly as more shipments of industrial intermediates offset fewer shipments in the petroleum, miscellaneous chemicals, and plastics markets, which continued to reflect weakness in housing-related demand. For 2009, chemicals revenue is expected to decline as a result of reduced volumes, reflecting a weak economic outlook with fewer housing starts and construction-related weaknesses, and lower average revenue per unit (including fuel surcharges). Paper, clay, and forest products revenue increased 4% in 2008 compared with 2007 due to a 13% increase in average revenue per unit which more than offset an 8% decrease in traffic volume. The volume decline reflected the continued housing slowdown and increased trucking capacity available to paper customers. Paper, clay, and forest products revenue decreased 3% in 2007 compared with 2006 as the effects of higher average revenue per unit were more than offset by an 8% decrease in traffic volume reflecting the housing slowdown and decline in conventional paper markets. For 2009, paper, clay, and forest products revenues are expected to decline due to economy-related volume declines, including the effects of increased trucking capacity, and lower average revenue per unit (including fuel surcharges). Automotive revenues decreased 16% in 2008 compared to 2007 as lower traffic volumes offset higher average revenue per unit. Volumes decreased 23%, reflecting reduced North American sales and production. Automotive manufacturers, especially the domestic producers, continued to experience significant sales declines during the year. Three assembly plants closed during the year and six implemented shift reductions. In addition, one manufacturer temporarily closed an assembly plant to retool for a new product in 2010. As of year end, Ford,

K26
General Motors, and Chrysler combined operated 14 of 24 assembly plants served by NS. NS continues to monitor the state of the automotive industry and the collectability of the associated receivables. Automotive revenues were flat in 2007 compared with 2006 as lower traffic volumes offset higher average revenue per unit. Revenue in 2007 included a $26 million volume-related contract settlement. Volume decreased 5%, reflecting softness in demand for vehicles as well as parts, and the closure in June 2007 of an NS-served plant. For 2009, automotive revenues are expected to decrease reflecting continued production cutbacks and lower average revenue per unit (including fuel surcharges). INTERMODAL revenues increased $137 million, or 7%, compared with 2007, as a 10% increase in average revenue per unit (including fuel surcharges) offset a 3% reduction in traffic volumes. Domestic volume (which includes truckload and intermodal marketing companies’ [IMC] volumes) increased 8% compared with 2007, reflecting the relative fuel efficiency of intermodal versus over-the-road transportation and service improvements. International traffic volume declined 9%, primarily driven by the weak economy and less inland rail movement of West Coast port traffic that was partially offset by East Coast port volume growth. The Premium business, which includes parcel and less-than-truckload (LTL) carriers, decreased 6%, as reduced private empty movements and soft parcel business offset LTL conversions. Triple Crown Services Company (Triple Crown), a service with rail-to-highway trailers, experienced a 3% drop in volume primarily driven by reduced auto parts shipments. Intermodal revenues in 2007 decreased $50 million, or 3%, compared with 2006, as a 4% reduction in traffic volumes offset a 2% increase in average revenue per unit. Truckload volume decreased 10% compared with 2006 and domestic IMC volume declined 4%. Traffic volume for Triple Crown dropped 3%. The declines for truckload, IMC, and Triple Crown were primarily due to lower national demand for dry van shipments resulting from continued weakness in the housing and automotive markets and increased over-the-road competition. International traffic volume decreased 4% reflecting reduced shipments of empty containers and less inland rail transportation of West Coast port traffic, which offset volume growth from East Coast port traffic. Premium business was up 2% reflecting gains in parcel shipments that offset modest declines in LTL shipper traffic. For 2009, intermodal revenue is expected to decrease from 2008 primarily due to weak economic conditions, pressures from the drayage market and lower average revenue per unit (including fuel surcharges). Railway Operating Expenses Railway operating expenses in 2008 were $7.6 billion, up $730 million, or 11%, compared to 2007. Expenses in 2007 were about even with expenses in 2006. The increase in 2008 was primarily due to higher fuel costs and increased compensation and benefits expenses. The 2007 comparison reflected volume-related decreases offset by higher fuel expense. The railway operating ratio, which measures the percentage of operating revenues consumed by operating expenses, improved to 71.1% in 2008, compared with 72.6% in 2007 and 72.8% in 2006.

K27
The following table shows the changes in railway operating expenses summarized by major classifications.
Operating Expense Variances Increases (Decreases)
2008 vs. 2007 2007 vs. 2006 ($ in millions)
Compensation and benefits $ 132 $ (85)Purchased services and rents 48 (27)Fuel 469 74 Depreciation 29 37 Materials and other 52 (2) Total $ 730 $ (3) Compensation and benefits, which represents 35% of total railway operating expenses, increased $132 million, or 5%, compared with 2007, primarily due to higher incentive compensation (up $66 million); increased wage rates (up $54 million); costs associated with lump-sum payments due under a new Brotherhood of Locomotive Engineers and Trainmen (BLET) agreement ($31 million); higher payroll taxes (up $15 million); and, the absence of the 2007 employment tax refund ($9 million). These were partially offset by lower costs associated with trainees (down $19 million), lower health and welfare benefits resulting from higher employee contributions (down $19 million), and lower stock-based compensation (down $7 million). In 2008, compensation and benefits expense benefited from a net pension credit of $39 million; however, primarily due to the market decline in pension assets (see Note 10), NS does not expect a similar benefit in 2009. In 2007, compensation and benefits decreased $85 million, or 3%, compared with 2006, primarily due to lower incentive compensation (down $48 million), lower volume-related payroll (down $37 million), the absence of the prior year retirement and waiver agreements with former executives as well as the cost of the regular stock-based grant to the former Chief Executive Officer ($24 million), lower stock-based compensation (down $13 million), and lower payroll taxes (down $12 million). These were partially offset by increased wage rates (up $27 million) and higher medical costs (up $27 million). NS employment averaged 30,709 in 2008 compared with 30,806 in 2007 and 30,541 in 2006. The increase in 2007 in the number of employees was almost exclusively in operating department personnel to improve service needs, as well as to prepare for expected retirements. NS continues to monitor forecasted volumes in light of current economic conditions to ensure appropriate employment levels for service needs. Purchased services and rents includes the costs of services purchased from outside contractors, including the net costs of operating joint (or leased) facilities with other railroads and the net cost of equipment rentals. This category of expenses increased $48 million, or 3%, in 2008 compared to 2007, but decreased $27 million, or 2%, in 2007 compared to 2006. Purchased services costs were $1,242 million in 2008, $1,172 million in 2007 and $1,165 million in 2006. The increase in 2008 reflected higher intermodal operations costs, transportation operating costs, and professional and legal services. In 2007, higher expenses for maintenance activities were largely offset by volume-related declines. Equipment rents, which includes the cost to NS of using equipment (mostly freight cars) owned by other railroads or private owners less the rent paid to NS for the use of its equipment, amounted to $357 million, $379 million and $413 million for 2008, 2007 and 2006, respectively. The decreases in 2008 and 2007 were principally due to lower shipment volumes and improved fleet utilization.

K28
Fuel expense, which includes the cost of locomotive fuel as well as other fuel used in railway operations, increased $469 million, or 40%, in 2008 compared with 2007, and increased $74 million, or 7%, in 2007 compared with 2006. Fuel expense is recorded net of hedge benefits, although there have been no such benefits since May 2006 when the program wound down (see “Market Risks and Hedging Activities,” below and Note 16). The increase in 2008 reflected a 45% increase in the price per gallon of locomotive fuel offset in part by a 3% decline in consumption. The increase in 2007 reflected a 9% increase in the price per gallon of locomotive fuel as well as the absence of hedge benefits offset in part by a 4% decline in consumption. Legislation enacted in the first quarter of 2005 repealed the 4.3¢ per gallon excise tax on railroad diesel fuel for 2007, with the following phased reductions in 2005 and 2006: 1¢ per gallon from January 1, 2005 through June 30, 2005; 2¢ per gallon from July 1, 2005 through December 31, 2006; and by the full 4.3¢ thereafter. NS consumes about 500 million gallons of locomotive diesel fuel per year. Depreciation expense increased $29 million, or 4%, in 2008 compared to 2007, and $37 million, or 5%, in 2007 compared to 2006. In both years, substantial capital investments and improvements resulted in higher depreciation expense. Materials and other expenses (including the estimates of costs related to personal injury, property damage, and environmental matters) increased $52 million, or 7%, in 2008 compared with 2007, but decreased $2 million in 2007 compared with 2006, as shown in the following table. 2008 2007 2006 ($ in millions) Materials $ 380 $ 359 $ 346 Casualties and other claims 180 171 220 Other 292 270 236 $ 852 $ 800 $ 802 The increase in 2008 was primarily due to costs associated with the Avondale Mills settlement related to the Graniteville accident (see below), as well as higher loss and damage claims and increased material costs for equipment and roadway repairs. These increases were partially offset by favorable personal injury claims development. In April 2008, NS settled the lawsuit brought by Avondale Mills for claims associated with the January 6, 2005, derailment in Graniteville, SC. A portion of the settlement will not be reimbursed by insurance and was included in 2008 expenses. The total liability related to the derailment represents NS’ best estimate based on current facts and circumstances. The estimate includes amounts related to business property damage and other economic losses, personal injury and individual property damage claims, as well as third-party response costs. NS’ commercial insurance policies are expected to cover substantially all expenses related to this derailment above the unreimbursed portion and NS’ self-insured retention, including NS’ response costs and legal fees. The Consolidated Balance Sheets reflect current and long-term receivables for estimated recoveries from NS’ insurance carriers. NS is engaged in arbitration with one of its insurance carriers that failed to respond to an insurance claim submitted by NS. NS believes these expenses are covered by the insurance policy and that recovery of the contested amount is probable, in that NS expects the arbitrator will determine the settlement amounts to be reasonable and that the insurer’s refusal to consent to and to fund the settlement was a breach of contract. Accordingly, NS has recorded the full recovery attributable to such carrier ($100 million). In October 2008, another of NS’ insurance carriers provided the preliminary findings of its review of NS’ reimbursement request and reported that it may dispute a portion of that request. NS has initiated arbitration against the carrier

K29
and believes that all expenses contained in the reimbursement request are covered by the insurance policy and that recovery is probable. The decline in materials and other expense in 2007 was primarily due to lower derailment and personal injury costs, offset in part by higher property and other taxes, and increased materials costs for maintenance activities. The largest component of casualties and other claims expense is personal injury costs. Cases involving occupational injuries comprised about 52% of total employee injury cases resolved and about 29% of total payments made. With its long-established commitment to safety, NS continues to work actively to eliminate all employee injuries and to reduce the associated costs. With respect to occupational injuries, which are not caused by a specific accident or event but allegedly result from a claimed exposure over time, the benefits of any existing safety initiatives may not be realized immediately. These types of claims are being asserted by former or retired employees, some of whom have not been actively employed in the rail industry for decades. The rail industry remains uniquely susceptible to litigation involving job-related accidental injury and occupational claims because of the Federal Employers’ Liability Act (FELA), which is applicable only to railroads. FELA’s fault-based system, which covers employee claims for job-related injuries, produces results that are unpredictable and inconsistent as compared with a no-fault workers’ compensation system. NS maintains substantial amounts of insurance for potential third-party liability and property damage claims. It also retains reasonable levels of risk through self-insurance (see Note 17). NS expects insurance costs to be slightly higher in 2009. Other Income – Net Other income – net was $110 million in 2008, $93 million in 2007, and $149 million in 2006 (see Note 2). The increase in 2008 reflected the absence of expenses related to synthetic fuel investments (see “Income Taxes” below), reduced other interest expense ($27 million) largely due to adjustments to reflect the outcome of certain tax examinations and higher coal royalties (up $12 million). These benefits were offset in part by lower returns and higher borrowing costs on corporate-owned life insurance (down $38 million), lower interest income (down $25 million), fewer gains on sales of property and investments (down $22 million), and lower equity in the earnings of Conrail (down $16 million), which reflects the absence of a tax audit settlement recorded by Conrail in 2007 ($18 million). The decrease in 2007 reflected lower interest income ($31 million), higher expenses associated with synthetic fuel-related tax credit investments ($15 million), and lower returns from corporate-owned life insurance ($15 million) that combined to offset higher equity in earnings of Conrail ($20 million). NS has membership interests representing ownership in companies that owned and operated facilities that produced synthetic fuel from coal. In addition, NS purchased two facilities that produced synthetic fuel from coal in 2007. The production of synthetic fuel resulted in tax credits as well as expenses related to the investments. The expenses are recorded as a component of “Other income – net,” and the tax credits, as well as tax benefits related to the expenses, are reflected in “Provision for income taxes” (see further discussion below). Income Taxes Income tax expense in 2008 was $1 billion, for an effective rate of 38%, compared with effective rates of 35% in 2007 and 34% in 2006. The increase in the rate for 2008 was primarily due to the absence of synthetic fuel-related tax credits that expired at the end of 2007. The increase in the rate for 2007 largely resulted from Illinois tax legislation which increased deferred taxes by $19 million (see Note 3).

K30
The tax credits generated by NS’ synthetic fuel-related investments reduced the effective tax rate by 3% in 2007 and 2006. Net income in 2007 reflected $5 million less in net benefits from these credits, as compared with the same period of 2006, as shown below: 2007 2006 ($ in millions) Effect in “Other income – net:” Expenses on synthetic fuel-related investments $ 77 $ 62 Effect in “Provision for income taxes:” Tax credits 60 56 Tax benefit of expenses on synthetic-fuel related investments 30 24 Total reduction of income tax expense 90 80 Effect in “Net income:” Net benefit from synthetic-fuel related investments $ 13 $ 18 During 2008, NS resolved both the Internal Revenue Service (IRS) examination of its 2004 and 2005 consolidated federal income tax returns and its appeal of the 2002 and 2003 IRS examination without a material effect in income tax expense. NS’ consolidated federal income tax returns for 2006 and 2007 are being audited by the IRS. FINANCIAL CONDITION, LIQUIDITY, AND CAPITAL RESOURCES Cash provided by operating activities, NS’ principal source of liquidity, was $2.7 billion in 2008 compared with $2.3 billion in 2007 and $2.2 billion in 2006. The improvement in 2008 resulted from increased railway operating income and from bonus tax depreciation which reduced current tax payments. The improvement in 2007 resulted from favorable changes in working capital as well as a modest increase in income from railway operations. NS had working capital deficits of $106 million at December 31, 2008, and $273 million at December 31, 2007. The improvement was largely the result of increased cash and cash equivalents. NS expects that cash on hand combined with cash flow provided by operating activities will be sufficient to meet its ongoing obligations. NS’ cash and cash equivalents balances totaled $618 million and $206 million at December 31, 2008 and 2007, respectively.
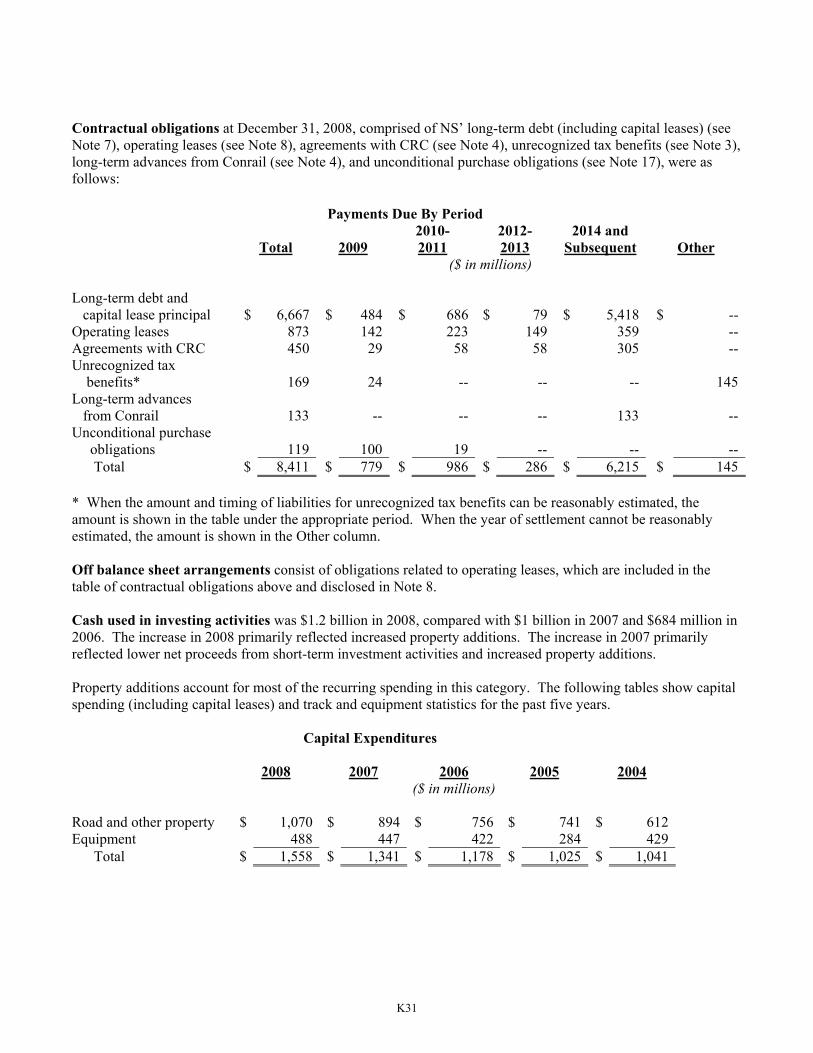
K31
Contractual obligations at December 31, 2008, comprised of NS’ long-term debt (including capital leases) (see Note 7), operating leases (see Note 8), agreements with CRC (see Note 4), unrecognized tax benefits (see Note 3), long-term advances from Conrail (see Note 4), and unconditional purchase obligations (see Note 17), were as follows:
Payments Due By Period 2010- 2012- 2014 and Total 2009 2011 2013 Subsequent Other ($ in millions) Long-term debt and capital lease principal $ 6,667 $ 484 $ 686 $ 79 $ 5,418 $ -- Operating leases 873 142 223 149 359 -- Agreements with CRC 450 29 58 58 305 -- Unrecognized tax benefits* 169 24 -- -- -- 145 Long-term advances from Conrail 133 -- -- -- 133 -- Unconditional purchase obligations 119 100 19 -- -- -- Total $ 8,411 $ 779 $ 986 $ 286 $ 6,215 $ 145 * When the amount and timing of liabilities for unrecognized tax benefits can be reasonably estimated, the amount is shown in the table under the appropriate period. When the year of settlement cannot be reasonably estimated, the amount is shown in the Other column. Off balance sheet arrangements consist of obligations related to operating leases, which are included in the table of contractual obligations above and disclosed in Note 8. Cash used in investing activities was $1.2 billion in 2008, compared with $1 billion in 2007 and $684 million in 2006. The increase in 2008 primarily reflected increased property additions. The increase in 2007 primarily reflected lower net proceeds from short-term investment activities and increased property additions. Property additions account for most of the recurring spending in this category. The following tables show capital spending (including capital leases) and track and equipment statistics for the past five years.
Capital Expenditures 2008 2007 2006 2005 2004 ($ in millions) Road and other property $ 1,070 $ 894 $ 756 $ 741 $ 612Equipment 488 447 422 284 429 Total $ 1,558 $ 1,341 $ 1,178 $ 1,025 $ 1,041
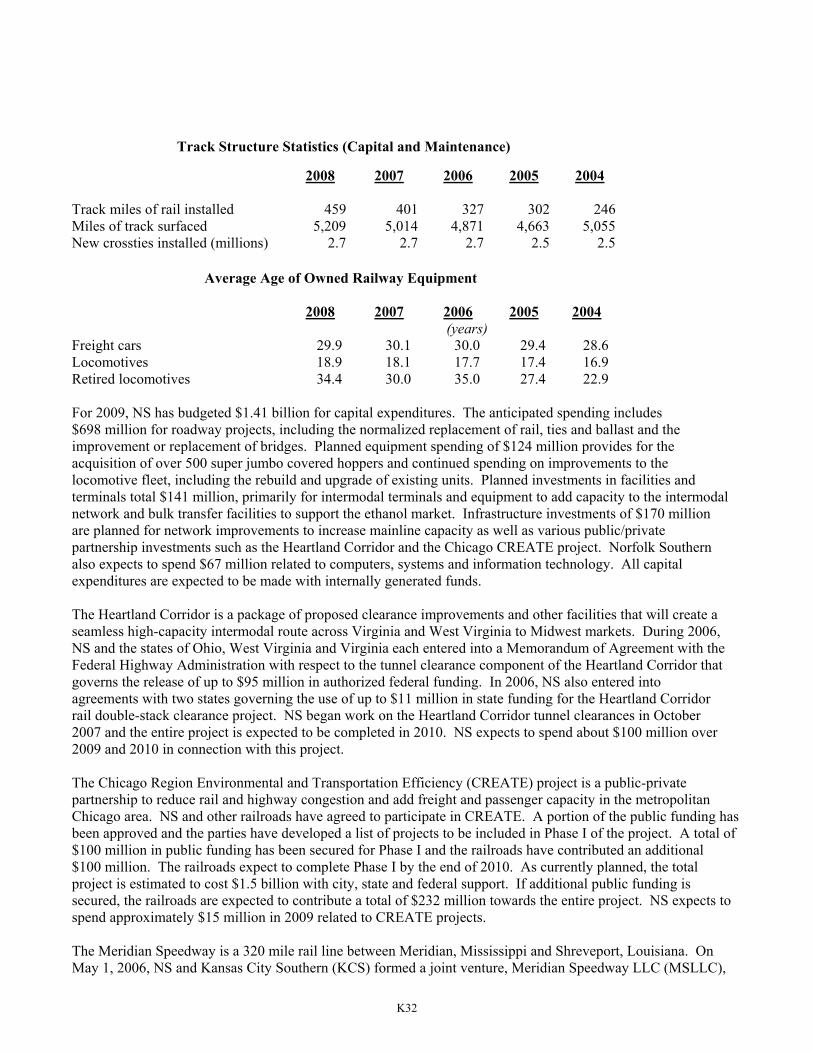
K32
Track Structure Statistics (Capital and Maintenance) 2008 2007 2006 2005 2004
Track miles of rail installed 459 401 327 302 246 Miles of track surfaced 5,209 5,014 4,871 4,663 5,055 New crossties installed (millions) 2.7 2.7 2.7 2.5 2.5
Average Age of Owned Railway Equipment 2008 2007 2006 2005 2004
(years) Freight cars 29.9 30.1 30.0 29.4 28.6 Locomotives 18.9 18.1 17.7 17.4 16.9 Retired locomotives 34.4 30.0 35.0 27.4 22.9 For 2009, NS has budgeted $1.41 billion for capital expenditures. The anticipated spending includes $698 million for roadway projects, including the normalized replacement of rail, ties and ballast and the improvement or replacement of bridges. Planned equipment spending of $124 million provides for the acquisition of over 500 super jumbo covered hoppers and continued spending on improvements to the locomotive fleet, including the rebuild and upgrade of existing units. Planned investments in facilities and terminals total $141 million, primarily for intermodal terminals and equipment to add capacity to the intermodal network and bulk transfer facilities to support the ethanol market. Infrastructure investments of $170 million are planned for network improvements to increase mainline capacity as well as various public/private partnership investments such as the Heartland Corridor and the Chicago CREATE project. Norfolk Southern also expects to spend $67 million related to computers, systems and information technology. All capital expenditures are expected to be made with internally generated funds. The Heartland Corridor is a package of proposed clearance improvements and other facilities that will create a seamless high-capacity intermodal route across Virginia and West Virginia to Midwest markets. During 2006, NS and the states of Ohio, West Virginia and Virginia each entered into a Memorandum of Agreement with the Federal Highway Administration with respect to the tunnel clearance component of the Heartland Corridor that governs the release of up to $95 million in authorized federal funding. In 2006, NS also entered into agreements with two states governing the use of up to $11 million in state funding for the Heartland Corridor rail double-stack clearance project. NS began work on the Heartland Corridor tunnel clearances in October 2007 and the entire project is expected to be completed in 2010. NS expects to spend about $100 million over 2009 and 2010 in connection with this project. The Chicago Region Environmental and Transportation Efficiency (CREATE) project is a public-private partnership to reduce rail and highway congestion and add freight and passenger capacity in the metropolitan Chicago area. NS and other railroads have agreed to participate in CREATE. A portion of the public funding has been approved and the parties have developed a list of projects to be included in Phase I of the project. A total of $100 million in public funding has been secured for Phase I and the railroads have contributed an additional $100 million. The railroads expect to complete Phase I by the end of 2010. As currently planned, the total project is estimated to cost $1.5 billion with city, state and federal support. If additional public funding is secured, the railroads are expected to contribute a total of $232 million towards the entire project. NS expects to spend approximately $15 million in 2009 related to CREATE projects. The Meridian Speedway is a 320 mile rail line between Meridian, Mississippi and Shreveport, Louisiana. On May 1, 2006, NS and Kansas City Southern (KCS) formed a joint venture, Meridian Speedway LLC (MSLLC),

K33
pursuant to which NS would contribute $300 million in cash, substantially all of which will be used for capital improvements over a period of approximately three years, in exchange for a 30% interest in the joint venture. To date, NS has contributed $274 million. At the formation of MSLLC, KCS contributed the Meridian Speedway. NS is recognizing its pro rata share of the joint venture’s earnings or loss as required under the equity method of accounting. NS’ total investment in MSLLC is supported by the fair value of the rail line as well as intangible assets obtained through the transaction. The joint venture is expected to increase capacity and improve service over the Meridian Speedway into the Southeast. Pan Am Southern LLC (PAS) will include the PAS Lines, which consist of a 155-mile main line track that runs between Mechanicville, New York and Ayer, Massachusetts, along with 281 miles of secondary and branch lines, including trackage rights in New York, Connecticut, Massachusetts, New Hampshire, and Vermont. PAS, when formed, will be a joint venture between NS and Pan Am Railways, Inc. (Pan Am) pursuant to which Pan Am expects to contribute the PAS Lines and NS expects to contribute cash and other property valued at $140 million, a significant portion of which will be used for capital improvements to the PAS Lines and the related construction of new intermodal and automotive terminals in the Albany, New York area. The joint venture is subject to regulatory approvals and other customary closing conditions.
The Crescent Corridor is a multistate network of infrastructure improvements and other facilities geared toward creating a seamless, high-capacity intermodal route spanning 11 states from New Jersey to Louisiana and offering truck-competitive service along several major interstate highway corridors, including I-81 and I-85, as well as I-20, I-40, I-59, and I-75. Based on the public benefits that stand to be derived in the form of highway congestion relief, NS plans to implement the Crescent Corridor through a series of public-private partnerships. Although there is not yet a single, integrated plan for the Crescent Corridor, preliminary work has begun and is slated to continue in 2009, including continued infrastructure improvements and other design and engineering work along the Virginia portion of the Corridor consistent with our matching obligation with respect to funds provided by the Commonwealth of Virginia. NS expects to spend approximately $30 million related to Crescent Corridor projects in 2009. The MidAmerica Corridor is a proposed cooperative arrangement between NS and Canadian National Railway (CN) to effectively share track between Chicago, St. Louis, Kentucky, and Mississippi in order to establish more efficient routes for traffic moving between the mid-western and southeastern U.S., including potential coal traffic moving to NS-served southeastern utility plants from CN-served Illinois Basin coal producers. To implement the MidAmerica Corridor, NS, at its option, would expend funds during the next five years to upgrade the rail line operated by West Tennessee Railway between Fulton, Kentucky, and Corinth, Mississippi, a line over which NS would operate pursuant to recently obtained trackage rights. The MidAmerica Corridor arrangement is subject to negotiation of definitive agreements between NS and CN, regulatory approvals, and other customary closing conditions. Cash used in financing activities was $1.1 billion in 2008, compared with $1.6 billion in 2007 and $1.3 billion in 2006. The decrease in 2008 reflected a net increase in debt, compared with a net decline in 2007, which was offset in part by higher dividend payments. The increase in 2007 reflected higher share repurchases as a part of NS’ share repurchase program (see Note 13), as well as higher debt repayments and increased dividend payments. Share repurchases totaled $1.1 billion in 2008, $1.2 billion in 2007, and $964 million in 2006 for the purchase and retirement of 19.4 million, 23.6 million, and 21.7 million shares, respectively, of common stock as part of NS’ share repurchase program. In March 2007, NS’ Board of Directors amended NS’ share repurchase program by increasing the authorized amount of share repurchases from 50 million to 75 million shares and shortening the authorized period from 2015 to 2010. To date, almost all of the purchases under the program have been made with internally generated cash. However, future funding sources could include proceeds from the issuance of debt, including the use of the receivable securitization program (see Note 7). The timing and volume of purchases is guided by management’s assessment of market conditions and other pertinent facts. Due to economic and market conditions,
K34
NS reduced its share repurchases during the fourth quarter of 2008, and the amount of future purchases is uncertain due to the economic climate. Through a private offering, NS issued and sold $600 million of unsecured notes in April 2008 (see Note 7), and subsequently exchanged substantially all of these unregistered securities with essentially identical securities registered under the Securities Act of 1933. In January 2009, through another private offering, NS issued $500 million of unsecured notes at 5.75% due 2016 (see Note 7). The net proceeds from the offering were $494 million after deducting the purchase discount and expenses. NS has agreed to exchange the unregistered securities with essentially identical securities registered under the Securities Act of 1933. Subsequent to the January 2009 offering, NS has remaining authority from its board of directors to issue and sell up to $500 million of additional debt or equity securities through public or private sale. The Form S-3 shelf registration statements previously filed with the Securities and Exchange Commission (SEC) are no longer effective under SEC’s Rule 415(a)(5), which provides for a three-year term. NS expects to file a new Form S-3 registration statement during the first quarter of 2009. NS has in place and available a $1 billion, five-year credit agreement expiring in 2012, which provides for borrowings at prevailing rates and includes covenants. NS had no amounts outstanding under this facility at December 31, 2008, and NS is in compliance with all of the covenants. NS also has an accounts receivable securitization program which was renewed with a new 364-day term ending in October 2009. In addition, NS has the ability to directly access the debt markets. Looking forward, NS’ annual debt maturities are relatively modest and stable from year to year (see Note 7). NS expects to refinance maturing debt over the next several years and modestly increase current debt levels. Overall, NS’ goal is to maintain a capital structure with appropriate leverage to support NS’ business strategy and provide flexibility through business cycles. APPLICATION OF CRITICAL ACCOUNTING ESTIMATES The preparation of financial statements in accordance with U.S. generally accepted accounting principles requires management to make estimates and assumptions that affect the reported amounts of assets and liabilities, the disclosure of contingent assets and liabilities at the date of the financial statements, and the reported amounts of revenues and expenses during the reporting period. These estimates and assumptions may require significant judgment about matters that are inherently uncertain, and future events are likely to occur that may require management to make changes to these estimates and assumptions. Accordingly, management regularly reviews these estimates and assumptions based on historical experience, changes in the business environment, and other factors that management believes to be reasonable under the circumstances. Management regularly discusses the development, selection, and disclosures concerning critical accounting estimates with the Audit Committee of its Board of Directors. Pensions and Other Postretirement Benefits Accounting for pensions and other postretirement benefit plans requires management to make several estimates and assumptions (see Note 10). These include the expected rate of return from investment of the plans’ assets, projected increases in medical costs, and the expected retirement age of employees as well as their projected earnings and mortality. In addition, the amounts recorded are affected by changes in the interest rate environment because the associated liabilities are discounted to their present value. Management makes these estimates based on the company’s historical experience and other information that it deems pertinent under the circumstances (for example, expectations of future stock market performance). Management utilizes an independent consulting actuarial firm’s studies to assist it in selecting appropriate assumptions and valuing its related liabilities.

K35
NS’ net pension benefit, which is included in “Compensation and benefits” on its Consolidated Statements of Income, was $39 million for the year ended December 31, 2008. In recording this amount, NS assumed a long-term investment rate of return of 9%, which was supported by the long-term total rate of return on plan assets since inception. Given the uncertain economic outlook and the recent volatility in corporate bond indices, management reduced its long-term investment rate of return to 8.75% for 2009. A one percentage point change to this rate of return assumption would result in an $18 million change to the pension credit and, as a result, an equal change in “Compensation and benefits” expense. Changes that are reasonably likely to occur in assumptions concerning retirement age, projected earnings, and mortality would not be expected to have a material effect on NS’ net pension benefit or net pension liability in the future. The net pension liability is recorded at its net present value using a discount rate that is based on the current interest rate environment in light of the timing of expected benefit payments. In 2008 and 2007, NS utilized an analysis in which the projected annual cash flows from the pension and postretirement benefit plans were matched with a yield curve based on an appropriate universe of high-quality corporate bonds. NS used the results of the yield curve to select the discount rate that matches the payment stream of the benefits in these plans. In 2006, NS referred to Moody’s seasoned Aa corporate bond yields and the changes in such yields in establishing the discount rate. NS’ net cost for other postretirement benefits, which is also included in “Compensation and benefits,” was $69 million for the year ended December 31, 2008. In recording this expense and valuing the net liability for other postretirement benefits, which is included in “Other postretirement benefits,” management estimated future increases in health-care costs. These assumptions, along with the effect of a one percentage point change in them, are described in Note 10. Properties and Depreciation Most of NS’ total assets are long-lived railway properties (see Note 5). As disclosed in Note 1, NS’ properties are depreciated using group depreciation. Rail is depreciated primarily on the basis of use measured by gross-ton miles. Other properties are depreciated generally using the straight-line method over the lesser of estimated service or lease lives. NS reviews the carrying amount of properties whenever events or changes in circumstances indicate that such carrying amount may not be recoverable based on future undiscounted cash flows. Assets that are deemed impaired as a result of such review are recorded at the lesser of carrying amount or fair value. NS’ depreciation expense is based on management’s assumptions concerning service lives of its properties as well as the expected net salvage that will be received upon their retirement. In developing these assumptions, NS’ management utilizes periodic depreciation studies that are performed by an outside firm of consulting engineers. These studies analyze NS’ historical patterns of asset use and retirement and take into account any expected change in operation or maintenance practices. NS’ recent experience with these studies has been that while they do result in changes in the rates used to depreciate its properties, these changes have not caused a significant effect to its annual depreciation expense. The studies may also indicate that the recorded amount of accumulated depreciation is deficient (or in excess) of the amount indicated by the study. Any such deficiency (or excess) is amortized as a component of depreciation expense over the remaining service lives of the affected class of property. NS’ depreciation expense for the year ended December 31, 2008, amounted to $804 million. NS’ weighted-average depreciation rates for 2008 are disclosed in Note 5; a one-tenth percentage point increase (or decrease) in these rates would have resulted in a $28 million increase (or decrease) to depreciation expense. Personal Injury, Environmental, and Legal Liabilities NS’ expense for casualties and other claims, included in “Materials and other,” amounted to $180 million for the year ended December 31, 2008. Most of this expense was NS’ accrual related to personal injury liabilities. Job-related personal injury and occupational claims are subject to FELA, which is applicable only to railroads. FELA’s fault-based tort system produces results that are unpredictable and inconsistent as compared with a no-

K36
fault worker’s compensation system. The variability inherent in this system could result in actual costs being very different from the liability recorded. In all cases, NS records a liability when the expected loss for the claim is both probable and estimable. To aid in valuing its personal injury liability and determining the amount to accrue during the year, NS’ management utilizes studies prepared by an independent consulting actuarial firm. For employee personal injury cases, the actuarial firm studies NS’ historical patterns of reserving for claims and subsequent settlements, taking into account relevant outside influences. An estimate of the ultimate amount of the liability, which includes amounts for incurred but unasserted claims, is based on the results of this analysis. For occupational injury claims, the actuarial firm studies NS’ history of claim filings, severity, payments and other relevant facts. Additionally, the estimate of the ultimate loss for occupational injuries includes a provision for those claims that have been incurred but not reported by projecting NS’ experience into the future as far as can be reasonably determined. NS has recorded this actuarially determined liability. The liability is dependent upon many individual judgments made as to the specific case reserves as well as the judgments of the consulting actuary and management in the periodic studies. Accordingly, there could be significant changes in the liability, which NS would recognize when such a change became known. The most recent actuarial study, completed in the fourth quarter of 2008, resulted in a decrease to NS’ personal injury liability during the fourth quarter. While the liability recorded is supported by the most recent study, it is reasonably possible that the ultimate liability could be higher or lower. NS is subject to various jurisdictions’ environmental laws and regulations. It is NS’ policy to record a liability where such liability or loss is probable and its amount can be estimated reasonably (see Note 17). Claims, if any, against third parties for recovery of cleanup costs incurred by NS, are reflected as receivables (when collection is probable) in the Consolidated Balance Sheets and are not netted against the associated NS liability. Environmental engineers regularly participate in ongoing evaluations of all known sites and in determining any necessary adjustments to liability estimates. NS also has established an Environmental Policy Council, composed of senior managers, to oversee and interpret its environmental policy. Operating expenses for environmental matters totaled approximately $18 million in 2008, $16 million in 2007 and $19 million in 2006, and capital expenditures for environmental matters totaled approximately $7 million in both 2008 and 2007, and $6 million in 2006. Capital expenditures for environmental matters in 2009 are expected to be about $9 million. NS’ Consolidated Balance Sheets included liabilities for environmental exposures in the amount of $42 million at December 31, 2008, and $46 million at December 31, 2007 (of which $12 million is classified as a current liability at the end of each period). At December 31, 2008, the liability represented NS’ estimate of the probable cleanup and remediation costs based on available information at 148 known locations. As of that date, 13 sites accounted for $22 million of the liability, and no individual site was considered to be material. NS anticipates that much of this liability will be paid out over five years; however, some costs will be paid out over a longer period. At 30 locations, one or more NS subsidiaries, usually in conjunction with a number of other parties, have been identified as potentially responsible parties by the Environmental Protection Agency (EPA) or similar state authorities under the Comprehensive Environmental Response, Compensation, and Liability Act of 1980, or comparable state statutes, which often impose joint and several liability for cleanup costs. With respect to known environmental sites (whether identified by NS or by the EPA or comparable state authorities), estimates of NS’ ultimate potential financial exposure for a given site or in the aggregate for all such sites are necessarily imprecise because of the widely varying costs of currently available cleanup techniques, the likely development of new cleanup technologies, the difficulty of determining in advance the nature and full extent of contamination and each potential participant’s share of any estimated loss (and that participant’s ability to bear it), and evolving statutory and regulatory standards governing liability. NS

K37
estimates its environmental remediation liability on a site-by-site basis, using assumptions and judgments that management deems appropriate for each site. As a result, it is not practical to quantitatively describe the effects of changes in these many assumptions and judgments. NS has consistently applied its methodology of estimating its environmental liabilities. On April 24, 2008, the United States Department of Justice (DOJ) brought an action against NS for alleged violations of federal environmental laws resulting from the discharge of chlorine and oil that occurred as a result of the January 6, 2005, derailment in Graniteville, SC, including claims for civil penalties as well as injunctive relief. On June 24, 2008, NS filed a motion to dismiss DOJ’s claims, contending that insufficient facts have been alleged to support such claims. NS does not believe that the outcome of these proceedings will have a material effect on its financial position, results of operations, or liquidity. Based on an assessment of known facts and circumstances, management believes that it is unlikely that any such known facts and circumstances, either individually or in the aggregate, will have a material adverse effect on NS’ financial position, results of operations, or liquidity. Norfolk Southern and certain subsidiaries are defendants in numerous lawsuits and other claims relating principally to railroad operations. When management concludes that it is probable that a liability has been incurred and the amount of the liability can be reasonably estimated, it is accrued through a charge to expenses. While the ultimate amount of liability incurred in any of these lawsuits and claims is dependent on future developments, in management’s opinion the recorded liability, if any, is adequate to cover the future payment of such liability and claims. However, the final outcome of any of these lawsuits and claims cannot be predicted with certainty, and unfavorable or unexpected outcomes could result in additional accruals that could be significant to results of operations in a particular year or quarter. Any adjustments to recorded liabilities will be reflected in expenses in the periods in which such adjustments are known. Income Taxes NS’ net long-term deferred tax liability totaled $6.4 billion at December 31, 2008 (see Note 3). This liability is estimated based on the expected future tax consequences of items recognized in the financial statements. After application of the federal statutory tax rate to book income, judgment is required with respect to the timing and deductibility of expenses in the corporate income tax returns. For state income and other taxes, judgment is also required with respect to the apportionment among the various jurisdictions. A valuation allowance is recorded if management expects that it is more likely than not that its deferred tax assets will not be realized. NS had an $11 million valuation allowance on $991 million of deferred tax assets as of December 31, 2008, reflecting the expectation that most of these assets will be realized. In addition, NS has a recorded liability for its estimate of uncertain tax positions taken or expected to be taken in a tax return. Judgment is required in evaluating the application of federal and state tax laws and assessing whether it is more likely than not that a tax position will be sustained on examination and, if so, judgment is also required as to the measurement of the amount of tax benefit that will be realized upon settlement with the taxing authority. Management believes this liability for uncertain tax positions to be adequate. Income tax expense is adjusted in the period in which new information about a tax position becomes available or the final outcome differs from the amounts recorded. For every one half percent change in the 2008 effective tax rate net income would have changed by $14 million.
K38
OTHER MATTERS Labor Agreements Approximately 26,000, or about 85%, of NS’ railroad employees are covered by collective bargaining agreements with various labor unions. These agreements remain in effect until changed pursuant to the Railway Labor Act (RLA). NS largely bargains nationally, in concert with other major railroads. Moratorium provisions in the labor agreements govern when the railroads and the unions may propose changes. The most recent national bargaining round began in late 2004. Since that time, the railroads have reached national agreements that extend through 2009 with all of the rail unions. Additionally, the current agreement with BLET extends through 2014. Because NS has reached separate agreements with the BLET and the American Train Dispatchers Association (ATDA), only the health and welfare provisions from the national agreements apply to NS’ locomotive engineers and ATDA-represented dispatchers. A small number of longshoremen at Ashtabula (Ohio) Docks are represented by the International Longshoremen’s Association (ILA) and do not participate in national bargaining. Negotiations are continuing with that organization. Market Risks and Hedging Activities NS has used derivative financial instruments to reduce the risk of volatility in its diesel fuel costs and to manage its overall exposure to fluctuations in interest rates. In 2001, NS began a program to hedge a portion of its diesel fuel consumption. The intent of the program was to assist in the management of NS’ aggregate risk exposure to fuel price fluctuations, which can significantly affect NS’ operating margins and profitability, through the use of one or more types of derivative instruments. No new hedges have been entered into since May 2004, and the last remaining contracts were settled in the second quarter of 2006, bringing an end to the benefits from the program. Locomotive diesel fuel costs represented 14% of NS’ operating expenses for 2006. NS manages its overall exposure to fluctuations in interest rates by issuing both fixed- and floating-rate debt instruments and by entering into interest-rate hedging transactions to achieve an appropriate mix within its debt portfolio. At December 31, 2008, NS’ debt subject to interest rate fluctuations totaled $317 million. A 1% point increase in interest rates would increase NS’ total annual interest expense related to all its variable debt by approximately $3 million. Management considers it unlikely that interest rate fluctuations applicable to these instruments will result in a material adverse effect on NS’ financial position, results of operations, or liquidity. Some of NS’ capital leases, which carry an average fixed rate of 7%, were effectively converted to variable rate obligations using interest rate swap agreements. On December 31, 2008, the average pay rate under these agreements was 3%, and the average receive rate was 7%. During 2008 and 2007, the effect of the swaps was to reduce interest expense by approximately $1 million in both periods. A portion of the lease obligations is payable in Japanese yen. NS eliminated the associated exchange rate risk at the inception of each lease with a yen deposit sufficient to fund the yen-denominated obligation. Most of these deposits are held by foreign banks, primarily Japanese. As a result, NS is exposed to financial market risk relative to Japan. Counterparties to the interest rate swaps and Japanese banks holding yen deposits are major financial institutions believed by management to be creditworthy.
K39
New Accounting Pronouncements In September 2006, the Financial Accounting Standards Board issued Statement of Financial Accounting Standards (SFAS) No. 157, “Fair Value Measurements.” This statement, effective for interim or annual reporting periods beginning after November 15, 2007, establishes a framework for measuring fair value in U.S. generally accepted accounting principles and expands disclosures about fair value measurements. Effective January 1, 2008, NS adopted this standard related to financial instrument assets and liabilities with no effect on NS’ consolidated financial statements. NS will adopt the provisions of this standard relative to nonfinancial assets and nonfinancial liabilities that are not remeasured at fair value on a recurring basis in the first quarter of 2009. NS does not expect that it will have an effect on NS’ consolidated financial statements. In June 2008, the FASB issued FASB Staff Position (FSP) Emerging Issues Task Force (EITF) 03-6-1, “Determining Whether Instruments Granted in Share-Based Payment Transactions are Participating Securities.” This FSP addresses whether instruments granted in share-based payment transactions are participating securities prior to vesting and, therefore, need to be included in the earnings allocation in computing earnings per share under the two-class method as described in SFAS No. 128, “Earnings per Share.” NS will adopt the FSP, which affects the calculation of earnings per share, in the first quarter of 2009. The provisions of the FSP are to be applied retrospectively. NS expects that it will not have a material effect on NS’ consolidated financial statements. FSP No. 132(R)-1, “Employers’ Disclosures about Postretirement Benefit Plan Assets,” was issued on December 30, 2008. This statement, effective for fiscal years ending after December 15, 2009, clarifies an employer’s disclosures about plan assets of a defined benefit pension or other postretirement plan. This statement prescribes expanded disclosures regarding investment allocation decisions, categories of plan assets, inputs, and valuation techniques used to measure fair value, the effect of Level 3 inputs on changes in plan assets and significant concentrations of risk. NS will adopt the FSP at the end of 2009 and expects it will not have a material effect on NS’ consolidated financial statements. In December 2007, the FASB issued SFAS No. 160 (SFAS 160), “Noncontrolling Interests in Consolidated Financial Statements,” which requires that noncontrolling (minority) interests be reported as a component of equity. NS will adopt the statement in the first quarter of 2009 and expects it will not have a material effect on NS’ consolidated financial statements. Inflation In preparing financial statements, U.S. generally accepted accounting principles require the use of historical cost that disregards the effects of inflation on the replacement cost of property. NS, a capital-intensive company, has most of its capital invested in such property. The replacement cost of these assets, as well as the related depreciation expense, would be substantially greater than the amounts reported on the basis of historical cost. Proposed Legislation and Regulations on Safety and Transportation of Hazardous Materials Federal regulations were adopted in late 2008 on safety and transportation of hazardous materials. NS is in compliance with those regulations currently effective and expects to be in compliance with those regulations to become effective at a later date. FORWARD-LOOKING STATEMENTS This Management’s Discussion and Analysis of Financial Condition and Results of Operations contains forward-looking statements that may be identified by the use of words like “believe,” “expect,” “anticipate” and “project.” Forward-looking statements reflect management’s good-faith evaluation of information currently available.

K40
However, such statements are dependent on and, therefore, can be influenced by, a number of external variables over which management has little or no control, including: domestic and international economic conditions; interest rates; the business environment in industries that produce and consume rail freight; competition and consolidation within the transportation industry; the operations of carriers with which NS interchanges; acts of terrorism or war; fluctuation in prices of key materials, in particular diesel fuel; labor difficulties, including strikes and work stoppages; legislative and regulatory developments; results of litigation; changes in securities and capital markets; disruptions to NS’ technology infrastructure, including computer systems; and natural events such as severe weather, hurricanes, and floods. For a discussion of significant risk factors applicable to NS, see Part I, Item 1A “Risk Factors.” Forward-looking statements are not, and should not be relied upon as, a guarantee of future performance or results, nor will they necessarily prove to be accurate indications of the times at or by which any such performance or results will be achieved. As a result, actual outcomes and results may differ materially from those expressed in forward-looking statements. NS undertakes no obligation to update or revise forward-looking statements. Item 7A. Quantitative and Qualitative Disclosures about Market Risk The information required by this item is included in Part II, Item 7, “Management’s Discussion and Analysis of Financial Condition and Results of Operations” under the heading “Market Risks and Hedging Activities.”

K41
Item 8. Financial Statements and Supplementary Data
INDEX TO FINANCIAL STATEMENTS Page Report of Management K42 Reports of Independent Registered Public Accounting Firm K43 Consolidated Statements of Income K45 Years ended December 31, 2008, 2007 and 2006 Consolidated Balance Sheets K46 As of December 31, 2008 and 2007 Consolidated Statements of Cash Flows K47 Years ended December 31, 2008, 2007 and 2006 Consolidated Statements of Changes in Stockholders’ Equity K48 Years ended December 31, 2008, 2007 and 2006 Notes to Consolidated Financial Statements K49 The Index to Consolidated Financial Statement Schedule in Item 15 K82
K42
Report of Management February 18, 2009 To the Stockholders Norfolk Southern Corporation Management is responsible for establishing and maintaining adequate internal control over financial reporting. In order to ensure that the Corporation’s internal control over financial reporting is effective, management regularly assesses such controls and did so most recently for its financial reporting as of December 31, 2008. This assessment was based on criteria for effective internal control over financial reporting described in Internal Control-Integrated Framework issued by the Committee of Sponsoring Organizations of the Treadway Commission. Based on this assessment, management has concluded that the Corporation maintained effective internal control over financial reporting as of December 31, 2008. KPMG LLP, independent registered public accounting firm, has audited the Corporation’s financial statements and issued an attestation report on the Corporation’s internal control over financial reporting as of December 31, 2008. /s/ Charles W. Moorman /s/ James A. Squires /s/ Marta R. Stewart Charles W. Moorman James A. Squires Marta R. Stewart Chairman, President and Executive Vice President Finance and Vice President and Chief Executive Officer Chief Financial Officer Controller

K43
Report of Independent Registered Public Accounting Firm The Board of Directors and Stockholders Norfolk Southern Corporation: We have audited Norfolk Southern Corporation’s internal control over financial reporting as of December 31, 2008, based on criteria established in Internal Control – Integrated Framework issued by the Committee of Sponsoring Organizations of the Treadway Commission (COSO). Norfolk Southern Corporation’s management is responsible for maintaining effective internal control over financial reporting and for its assessment of the effectiveness of internal control over financial reporting, included in the accompanying Report of Management. Our responsibility is to express an opinion on the Company’s internal control over financial reporting based on our audit. We conducted our audit in accordance with the standards of the Public Company Accounting Oversight Board (United States). Those standards require that we plan and perform the audit to obtain reasonable assurance about whether effective internal control over financial reporting was maintained in all material respects. Our audit included obtaining an understanding of internal control over financial reporting, assessing the risk that a material weakness exists, and testing and evaluating the design and operating effectiveness of internal control based on the assessed risk. Our audit also included performing such other procedures as we considered necessary in the circumstances. We believe that our audit provides a reasonable basis for our opinion. A company’s internal control over financial reporting is a process designed to provide reasonable assurance regarding the reliability of financial reporting and the preparation of financial statements for external purposes in accordance with generally accepted accounting principles. A company’s internal control over financial reporting includes those policies and procedures that (1) pertain to the maintenance of records that, in reasonable detail, accurately and fairly reflect the transactions and dispositions of the assets of the company; (2) provide reasonable assurance that transactions are recorded as necessary to permit preparation of financial statements in accordance with generally accepted accounting principles, and that receipts and expenditures of the company are being made only in accordance with authorizations of management and directors of the company; and (3) provide reasonable assurance regarding prevention or timely detection of unauthorized acquisition, use, or disposition of the company’s assets that could have a material effect on the financial statements. Because of its inherent limitations, internal control over financial reporting may not prevent or detect misstatements. Also, projections of any evaluation of effectiveness to future periods are subject to the risk that controls may become inadequate because of changes in conditions, or that the degree of compliance with the policies or procedures may deteriorate. In our opinion, Norfolk Southern Corporation maintained, in all material respects, effective internal control over financial reporting as of December 31, 2008, based on criteria established in Internal Control – Integrated Framework issued by the Committee of Sponsoring Organizations of the Treadway Commission. We also have audited, in accordance with the standards of the Public Company Accounting Oversight Board (United States), the consolidated balance sheets of Norfolk Southern Corporation and subsidiaries as of December 31, 2008 and 2007, and the related consolidated statements of income, changes in stockholders’ equity, and cash flows for each of the years in the three-year period ended December 31, 2008, and our report dated February 18, 2009 expressed an unqualified opinion on those consolidated financial statements. /s/ KPMG LLP Norfolk, Virginia February 18, 2009

K44
Report of Independent Registered Public Accounting Firm The Board of Directors and Stockholders Norfolk Southern Corporation: We have audited the accompanying consolidated balance sheets of Norfolk Southern Corporation and subsidiaries as of December 31, 2008 and 2007, and the related consolidated statements of income, changes in stockholders’ equity, and cash flows for each of the years in the three-year period ended December 31, 2008. In connection with our audits of the consolidated financial statements, we also have audited financial statement schedule as listed in Item 15(A)2. These consolidated financial statements and financial statement schedule are the responsibility of the Company’s management. Our responsibility is to express an opinion on these consolidated financial statements and financial statement schedule based on our audits. We conducted our audits in accordance with the standards of the Public Company Accounting Oversight Board (United States). Those standards require that we plan and perform the audit to obtain reasonable assurance about whether the financial statements are free of material misstatement. An audit includes examining, on a test basis, evidence supporting the amounts and disclosures in the financial statements. An audit also includes assessing the accounting principles used and significant estimates made by management, as well as evaluating the overall financial statement presentation. We believe that our audits provide a reasonable basis for our opinion. In our opinion, the consolidated financial statements referred to above present fairly, in all material respects, the financial position of Norfolk Southern Corporation and subsidiaries as of December 31, 2008 and 2007, and the results of their operations and their cash flows for each of the years in the three-year period ended December 31, 2008, in conformity with U.S. generally accepted accounting principles. Also in our opinion, the related financial statement schedule, when considered in relation to the basic consolidated financial statements taken as a whole, presents fairly, in all material respects, the information set forth therein. As discussed in note 1 to the consolidated financial statements, Norfolk Southern Corporation adopted Financial Accounting Standards Board Interpretation No. 48, Accounting for Uncertainty in Income Taxes, effective January 1, 2007 and Statement of Financial Accounting Standards No. 158, Employers’ Accounting for Defined Benefit Pension and Other Postretirement Plans, effective December 31, 2006. We also have audited, in accordance with the standards of the Public Company Accounting Oversight Board (United States), Norfolk Southern Corporation’s internal control over financial reporting as of December 31, 2008, based on criteria established in Internal Control – Integrated Framework, issued by the Committee of Sponsoring Organizations of the Treadway Commission (COSO), and our report dated February 18, 2009 expressed an unqualified opinion on the effectiveness of the Company’s internal control over financial reporting. /s/ KPMG LLP Norfolk, Virginia February 18, 2009
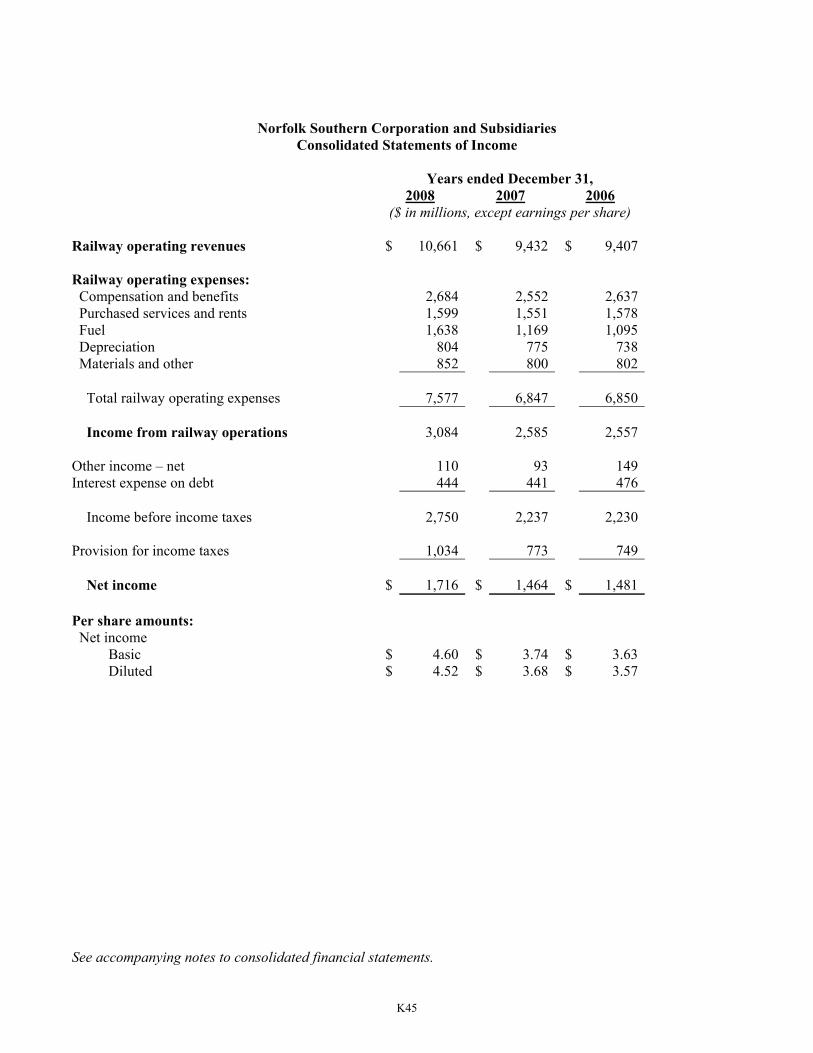
K45
Norfolk Southern Corporation and Subsidiaries Consolidated Statements of Income
Years ended December 31, 2008 2007 2006 ($ in millions, except earnings per share) Railway operating revenues $ 10,661 $ 9,432 $ 9,407 Railway operating expenses: Compensation and benefits 2,684 2,552 2,637 Purchased services and rents 1,599 1,551 1,578 Fuel 1,638 1,169 1,095 Depreciation 804 775 738 Materials and other 852 800 802 Total railway operating expenses 7,577 6,847 6,850 Income from railway operations 3,084 2,585 2,557 Other income – net 110 93 149 Interest expense on debt 444 441 476 Income before income taxes 2,750 2,237 2,230 Provision for income taxes 1,034 773 749 Net income $ 1,716 $ 1,464 $ 1,481 Per share amounts: Net income Basic $ 4.60 $ 3.74 $ 3.63 Diluted $ 4.52 $ 3.68 $ 3.57 See accompanying notes to consolidated financial statements.

K46
Norfolk Southern Corporation and Subsidiaries Consolidated Balance Sheets
As of December 31, 2008 2007 ($ in millions) Assets Current assets: Cash and cash equivalents $ 618 $ 206 Accounts receivable – net 870 942 Materials and supplies 194 176 Deferred income taxes 149 190 Other current assets 168 161 Total current assets 1,999 1,675 Investments 1,779 1,974 Properties less accumulated depreciation 22,247 21,583 Other assets 272 912 Total assets
$
26,297
$
26,144
Liabilities and stockholders’ equity Current liabilities: Accounts payable $ 1,140 $ 1,139 Income and other taxes 261 203 Other current liabilities 220 237 Current maturities of long-term debt 484 369 Total current liabilities 2,105 1,948 Long-term debt 6,183 5,999 Other liabilities 2,030 2,039 Deferred income taxes 6,372 6,431 Total liabilities 16,690 16,417 Stockholders’ equity: Common stock $1.00 per share par value, 1,350,000,000 shares authorized; outstanding 366,233,106 and 379,297,891 shares, respectively, net of treasury shares 368 380 Additional paid-in capital 1,680 1,466 Accumulated other comprehensive loss (942) (399) Retained income 8,501 8,280 Total stockholders’ equity 9,607 9,727 Total liabilities and stockholders’ equity $ 26,297 $ 26,144 See accompanying notes to consolidated financial statements.

K47
Norfolk Southern Corporation and Subsidiaries Consolidated Statements of Cash Flows
Years Ended December 31, 2008 2007 2006 ($ in millions) Cash flows from operating activities Net income $ 1,716 $ 1,464 $ 1,481 Reconciliation of net income to net cash provided by operating activities: Depreciation 815 786 750 Deferred income taxes 290 125 (8) Gains and losses on properties and investments (29) (51) (54) Changes in assets and liabilities affecting operations: Accounts receivable 269 30 (60) Materials and supplies (18) (25) (19) Other current assets (8) (17) (11) Current liabilities other than debt (262) 38 38 Other – net (58) (17) 89 Net cash provided by operating activities 2,715 2,333 2,206 Cash flows from investing activities Property additions (1,558) (1,341) (1,178) Property sales and other transactions 109 124 119 Investments, including short-term (86) (635) (1,804) Investment sales and other transactions 307 827 2,179 Net cash used in investing activities (1,228) (1,025) (684) Cash flows from financing activities Dividends (456) (377) (278) Common stock issued – net 229 183 297 Purchase and retirement of common stock (1,128) (1,196) (964) Proceeds from borrowings 1,425 250 -- Debt repayments (1,145) (489) (339) Net cash used in financing activities (1,075) (1,629) (1,284) Net increase (decrease) in cash and cash equivalents 412 (321) 238 Cash and cash equivalents At beginning of year 206 527 289 At end of year $ 618 $ 206 $ 527 Supplemental disclosure of cash flow information Cash paid during the year for: Interest (net of amounts capitalized) $ 421 $ 441 $ 473 Income taxes (net of refunds) $ 615 $ 603 $ 692 See accompanying notes to consolidated financial statements.

K48
Norfolk Southern Corporation and Subsidiaries Consolidated Statements of Changes in Stockholders’ Equity
Accum. Other Additional Unearned Compre- Common Paid-in Restricted hensive Retained Stock Capital Stock Loss Income Total ($ in millions, except per share amounts)
Balance December 31, 2005 $ 411 $ 992 $ (17) $ (77) $ 7,967 $ 9,276 Comprehensive income Net income 1,481 1,481 Other comprehensive income 2 2 Total comprehensive income 1,483 Adoption of SFAS 158, net of tax (294) (294) Dividends on Common Stock, $0.68 per share (278) (278) Share repurchases (22) (63) (879) (964) Stock-based compensation, including tax benefit of $85 9 372 17 (8) 390 Other 2 2 Balance December 31, 2006 $ 398 $ 1,303 $ -- $ (369) $ 8,283 $ 9,615 Comprehensive income Net income 1,464 1,464 Other comprehensive loss (30) (30) Total comprehensive income 1,434 Adoption of FIN 48, net of tax 10 10 Dividends on Common Stock, $0.96 per share (377) (377) Share repurchases (24) (81) (1,091) (1,196) Stock-based compensation, including tax benefit of $57 6 238 (9) 235 Other 6 6
Balance December 31, 2007 $ 380 $ 1,466 $ -- $ (399) $ 8,280 $ 9,727 Net income 1,716 1,716 Other comprehensive loss (543) (543) Total comprehensive income 1,173 Dividends on Common Stock, $1.22 per share (456) (456) Share repurchases (19) (79) (1,030) (1,128) Stock-based compensation, including tax benefit of $76 6 287 (9) 284 Other 1 6 7 Balance December 31, 2008 $ 368 $ 1,680 $ -- $ (942) $ 8,501 $ 9,607 See accompanying notes to consolidated financial statements.

K49
Norfolk Southern Corporation and Subsidiaries Notes to Consolidated Financial Statements
The following Notes are an integral part of the Consolidated Financial Statements. 1. Summary of Significant Accounting Policies Description of Business Norfolk Southern Corporation is a Virginia-based holding company engaged principally in the rail transportation business, operating approximately 21,000 route miles primarily in the East and Midwest. These consolidated financial statements include Norfolk Southern Corporation (Norfolk Southern) and its majority-owned and controlled subsidiaries (collectively, NS). Norfolk Southern’s major subsidiary is Norfolk Southern Railway Company (NSR). All significant intercompany balances and transactions have been eliminated in consolidation. NSR and its railroad subsidiaries transport raw materials, intermediate products and finished goods classified in the following market groups (percent of total railway operating revenues in 2008): coal (29%); intermodal (19%); agriculture/consumer products/government (12%); metals/construction (12%); chemicals (12%); paper/clay/forest products (8%); and automotive (8%). Although most of NS’ customers are domestic, ultimate points of origination or destination for some of the products transported (particularly coal bound for export and some intermodal containers) may be outside the United States. Approximately 85% of NS’ railroad employees are covered by collective bargaining agreements with various labor unions. Use of Estimates The preparation of financial statements in accordance with U.S. generally accepted accounting principles requires management to make estimates and assumptions that affect the reported amounts of assets and liabilities, the disclosure of contingent assets and liabilities at the date of the financial statements and the reported amounts of revenues and expenses during the reporting period. Management periodically reviews its estimates, including those related to the recoverability and useful lives of assets, as well as liabilities for litigation, environmental remediation, casualty claims, income taxes, and pension and other postretirement benefits. Changes in facts and circumstances may result in revised estimates. Revenue Recognition Transportation revenue is recognized proportionally as a shipment moves from origin to destination and related expenses are recognized as incurred. Refunds (which are primarily volume-based incentives) are recorded as a reduction to revenues on the basis of management’s best estimate of projected liability, which is based on historical activity, current traffic counts and the expectation of future activity. NS regularly monitors its contract refund liability, and historically, the estimates have not differed significantly from the amounts ultimately refunded. Switching, demurrage and other incidental service revenues are recognized when the services are performed. Derivatives NS does not engage in the trading of derivatives. NS has used derivative financial instruments to reduce the risk of volatility in its diesel fuel costs and in the management of its mix of fixed and floating-rate debt. Management has determined that these derivative instruments qualify as either fair-value or cash-flow hedges, having values that highly correlate with the underlying hedged exposures, and has designated such instruments as hedging
K50
transactions. Income and expense related to the derivative financial instruments are recorded in the same category as generated by the underlying asset or liability. Credit risk related to the derivative financial instruments is considered to be minimal and is managed by requiring high credit standards for counterparties and periodic settlements (see Note 16). Cash Equivalents “Cash equivalents” are highly liquid investments purchased three months or less from maturity. Allowance for Doubtful Accounts NS’ allowance for doubtful accounts was $5 million at December 31, 2008, and December 31, 2007. To determine its allowance for doubtful accounts, NS evaluates historical loss experience (which has not been significant), the characteristics of current accounts, as well as general economic conditions and trends. Materials and Supplies “Materials and supplies,” consisting mainly of fuel oil and items for maintenance of property and equipment, are stated at the lower of average cost or market. The cost of materials and supplies expected to be used in capital additions or improvements is included in “Properties.” Investments Debt securities classified as “held-to-maturity” are reported at amortized cost and marketable equity and debt securities classified as “trading” or “available-for-sale” are recorded at fair value. Unrealized after-tax gains and losses for investments designated as “available-for-sale,” are recognized in “Accumulated other comprehensive loss.” Investments where NS has the ability to exercise significant influence over but does not control the entity are accounted for using the equity method in accordance with APB Opinion No. 18, “The Equity Method of Accounting for Investments in Common Stock.” Properties “Properties” are stated principally at cost and are depreciated using group depreciation. Rail is depreciated primarily on the basis of use measured by gross ton-miles. Other properties are depreciated generally using the straight-line method over the lesser of estimated service or lease lives. Depletion of natural resources (see Note 2) is based on units of production. Depreciation in the Consolidated Statements of Cash Flows includes depreciation and depletion. NS capitalizes interest on major capital projects during the period of their construction. Expenditures, including those on leased assets that extend an asset’s useful life or increase its utility, are capitalized. Expenditures capitalized include those that are directly related to a capital project and may include materials, labor, and equipment, in addition to an allocable portion of indirect costs that clearly relate to a particular project. Costs related to repairs and maintenance activities that do not extend an asset’s useful life or increase its utility are expensed when such repairs are performed. When properties other than land and nonrail assets are sold or retired in the ordinary course of business, the cost of the assets, net of sale proceeds or salvage, is charged to accumulated depreciation, and no gain or loss is recognized through income. Gains and losses on disposal of land and nonrail assets are included in “Other income - net” (see Note 2) since such income is not a product of NS’ railroad operations. NS reviews the carrying amount of properties whenever events or changes in circumstances indicate that such carrying amount may not be recoverable based on future undiscounted cash flows. Assets that are deemed impaired as a result of such review are recorded at the lower of carrying amount or fair value.

K51
Required Accounting Changes Effective January 1, 2008, NS adopted the Financial Accounting Standards Board issued Statement of Financial Accounting Standards (SFAS) No. 157, “Fair Value Measurements,” related to financial instrument assets and liabilities with no effect on NS’ consolidated financial statements. This statement, effective for interim or annual reporting periods beginning after November 15, 2007, establishes a framework for measuring fair value in U.S. generally accepted accounting principles and expands disclosures about fair value measurements. Effective January 1, 2007, NS adopted Financial Accounting Standards Board Interpretation No. 48 (FIN 48), “Accounting for Uncertainty in Income Taxes,” which clarifies accounting for uncertainty in income taxes recognized in an enterprise’s financial statements in accordance with SFAS No. 109, “Accounting for Income Taxes.” FIN 48 prescribes a recognition threshold and measurement attribute for a tax position taken or expected to be taken in a tax return. Under the guidelines of FIN 48, an entity should recognize the financial statement benefit of a tax position if it determines that it is more likely than not that the position will be sustained on examination (see Note 3). Effective December 31, 2006, NS adopted SFAS No. 158, “Employers’ Accounting for Defined Benefit Pension and Other Postretirement Plans” (SFAS 158) (see Note 10). Effective January 1, 2006, NS adopted SFAS No. 123(R), “Share-Based Payment,” [SFAS 123(R)]. This statement applies to awards granted, modified, repurchased or cancelled after the effective date as well as awards that are unvested at the effective date and includes, among other things, the requirement to expense the fair value of stock options. The standard also requires that awards to be settled in cash be measured at fair value at each reporting date until ultimate settlement. NS adopted SFAS 123(R) using the modified prospective method, which requires application of the standard to all awards granted, modified, repurchased or cancelled on or after January 1, 2006, and to all awards for which the requisite service has not been rendered as of such date. In accordance with the modified prospective approach, prior period financial statements have not been restated to reflect the impact of SFAS 123(R). Under SFAS 123(R), all new awards granted to retirement eligible employees must be expensed immediately. Under APB Opinion No. 25 and related interpretations, such awards were amortized over the stated service period. In June 2008, the FASB issued FASB Staff Position (FSP) Emerging Issues Task Force (EITF) 03-6-1, “Determining Whether Instruments Granted in Share-Based Payment Transactions are Participating Securities.” This FSP addresses whether instruments granted in share-based payment transactions are participating securities prior to vesting and, therefore, need to be included in the earnings allocation in computing earnings per share under the two-class method as described in SFAS No. 128, “Earnings per Share.” NS will adopt the FSP, which affects the calculation of earnings per share, in the first quarter of 2009. The provisions of the FSP are to be applied retrospectively. NS expects that it will not have a material effect on NS’ consolidated financial statements.
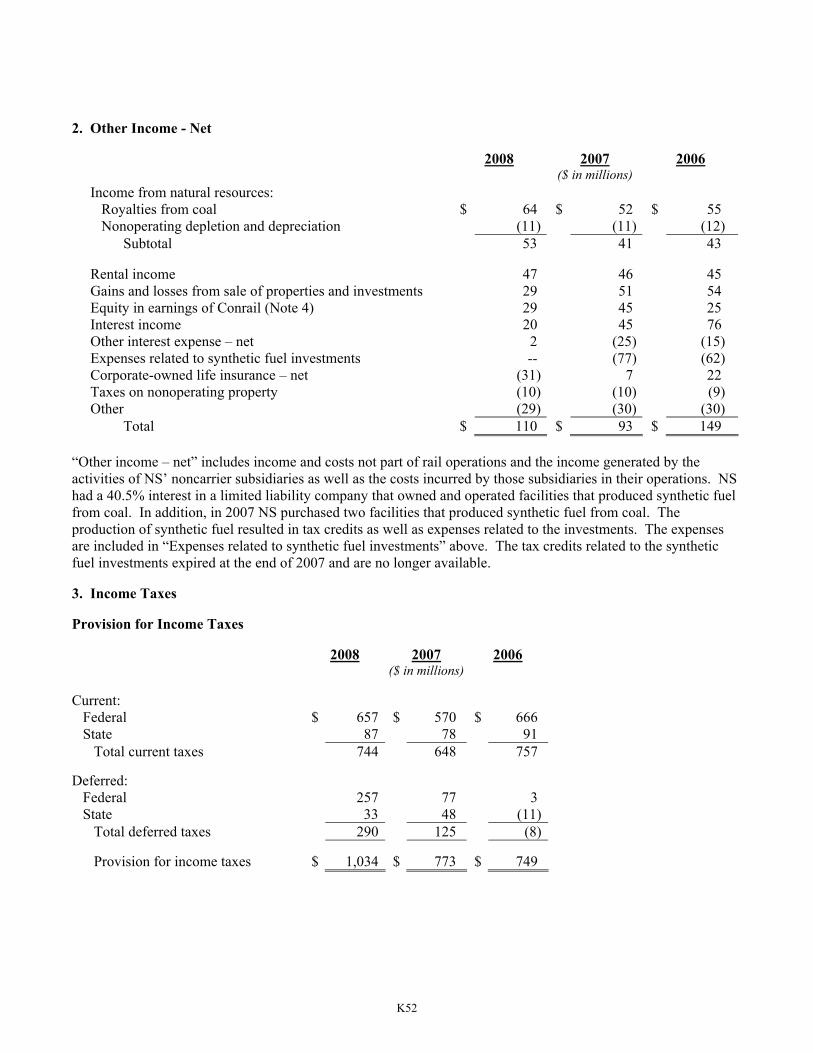
K52
2. Other Income - Net
2008 2007 2006 ($ in millions)
Income from natural resources: Royalties from coal $ 64 $ 52 $ 55 Nonoperating depletion and depreciation (11) (11) (12) Subtotal 53 41 43 Rental income 47 46 45 Gains and losses from sale of properties and investments 29 51 54 Equity in earnings of Conrail (Note 4) 29 45 25 Interest income 20 45 76 Other interest expense – net 2 (25) (15) Expenses related to synthetic fuel investments -- (77) (62) Corporate-owned life insurance – net (31) 7 22 Taxes on nonoperating property (10) (10) (9) Other (29) (30) (30) Total $ 110 $ 93 $ 149
“Other income – net” includes income and costs not part of rail operations and the income generated by the activities of NS’ noncarrier subsidiaries as well as the costs incurred by those subsidiaries in their operations. NS had a 40.5% interest in a limited liability company that owned and operated facilities that produced synthetic fuel from coal. In addition, in 2007 NS purchased two facilities that produced synthetic fuel from coal. The production of synthetic fuel resulted in tax credits as well as expenses related to the investments. The expenses are included in “Expenses related to synthetic fuel investments” above. The tax credits related to the synthetic fuel investments expired at the end of 2007 and are no longer available. 3. Income Taxes Provision for Income Taxes 2008 2007 2006 ($ in millions) Current: Federal $ 657 $ 570 $ 666 State 87 78 91 Total current taxes 744 648 757 Deferred: Federal 257 77 3 State 33 48 (11) Total deferred taxes 290 125 (8) Provision for income taxes $ 1,034 $ 773 $ 749
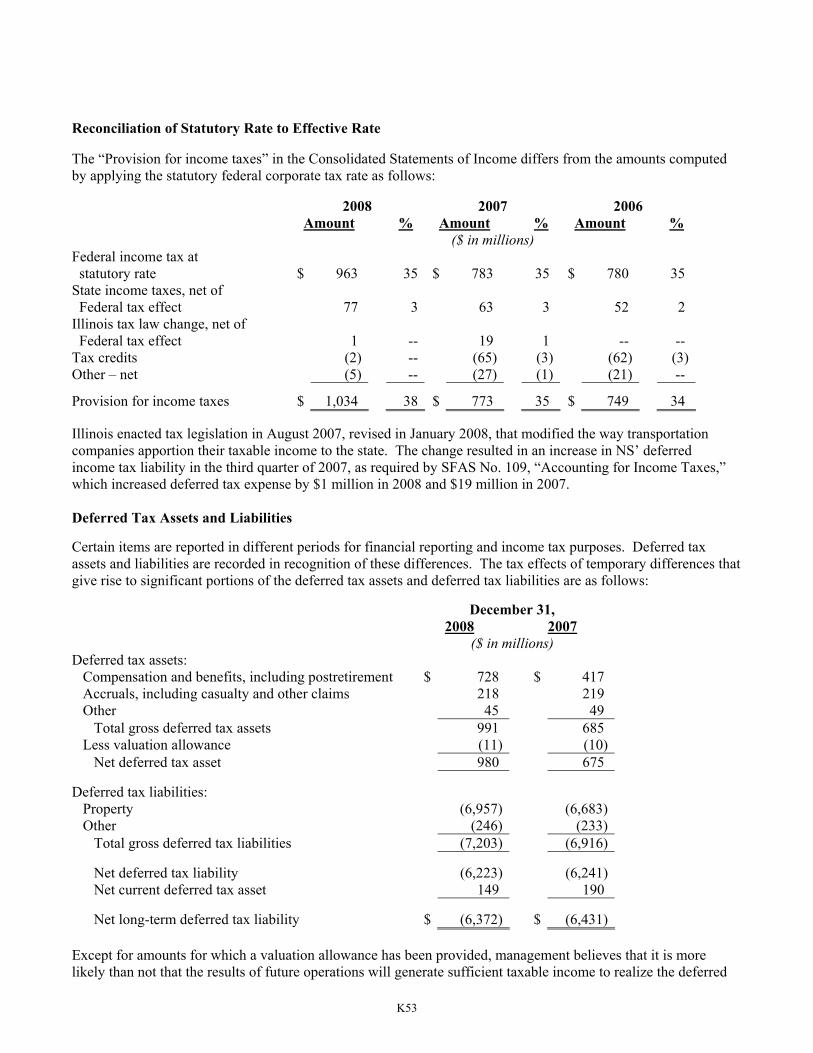
K53
Reconciliation of Statutory Rate to Effective Rate The “Provision for income taxes” in the Consolidated Statements of Income differs from the amounts computed by applying the statutory federal corporate tax rate as follows: 2008 2007 2006
Amount % Amount % Amount % ($ in millions) Federal income tax at statutory rate $ 963 35 $ 783 35 $ 780 35 State income taxes, net of Federal tax effect 77 3 63 3 52 2 Illinois tax law change, net of Federal tax effect 1 -- 19 1 -- -- Tax credits (2) -- (65) (3) (62) (3)Other – net (5) -- (27) (1) (21) --
Provision for income taxes $ 1,034 38 $ 773 35 $ 749 34 Illinois enacted tax legislation in August 2007, revised in January 2008, that modified the way transportation companies apportion their taxable income to the state. The change resulted in an increase in NS’ deferred income tax liability in the third quarter of 2007, as required by SFAS No. 109, “Accounting for Income Taxes,” which increased deferred tax expense by $1 million in 2008 and $19 million in 2007. Deferred Tax Assets and Liabilities Certain items are reported in different periods for financial reporting and income tax purposes. Deferred tax assets and liabilities are recorded in recognition of these differences. The tax effects of temporary differences that give rise to significant portions of the deferred tax assets and deferred tax liabilities are as follows: December 31, 2008 2007 ($ in millions) Deferred tax assets: Compensation and benefits, including postretirement $ 728 $ 417 Accruals, including casualty and other claims 218 219 Other 45 49 Total gross deferred tax assets 991 685 Less valuation allowance (11) (10) Net deferred tax asset 980 675 Deferred tax liabilities: Property (6,957) (6,683) Other (246) (233) Total gross deferred tax liabilities (7,203) (6,916) Net deferred tax liability (6,223) (6,241) Net current deferred tax asset 149 190 Net long-term deferred tax liability $ (6,372) $ (6,431) Except for amounts for which a valuation allowance has been provided, management believes that it is more likely than not that the results of future operations will generate sufficient taxable income to realize the deferred

K54
tax assets. The valuation allowance at the end of each year relates to subsidiary state income tax net operating losses that may not be utilized prior to their expiration. The total valuation allowance increased $1 million in 2008 and 2007, and decreased $1 million in 2006. Uncertain Tax Positions A reconciliation of the beginning and ending amount of unrecognized tax benefits is as follows ($ in millions): December 31, 2008 2007 Balance at beginning of year $ 167 $ 179 Additions based on tax positions related to the current year 73 65 Additions for tax positions of prior years 4 9 Reductions for tax positions of prior years (63) (84) Settlements with taxing authorities (9) -- Lapse of statutes of limitations (3) (2) Balance at end of year $ 169 $ 167
Included in the balance of unrecognized tax benefits at December 31, 2008, are potential benefits of $60 million that would affect the effective tax rate if recognized. As a result of the implementation of FIN 48 on January 1, 2007 (see Note 1), NS recognized a $10 million increase to stockholders equity, $2 million of which related to investments accounted for under the equity method of accounting. Unrecognized tax benefits are adjusted in the period in which new information about a tax position becomes available or the final outcome differs from the amount recorded. NS expects that the total amount of unrecognized tax benefits at December 31, 2008, will decrease by approximately $55 million in 2009 due to tax positions for which there was an uncertainty about the timing of deductibility in earlier years but deductibility may become certain by the close of 2009. NS’ consolidated federal income tax returns for 2006 and 2007 are being audited by the Internal Revenue Service (IRS). NS anticipates that the IRS will complete its examination of the 2006 and 2007 years within the next twelve months. It is reasonably possible that the amount of unrecognized tax benefits will change due to the completion of the IRS examination of the 2006 and 2007 years, but an estimate of the change cannot be made. State income tax returns generally are subject to examination for a period of three to four years after filing of the return. In addition, NS is generally obligated to report changes in taxable income arising from federal income tax examinations to the states within a period of up to two years from the date the federal examination is final. NS has various state income tax returns either under examination, administrative appeals, or litigation. It is reasonably possible that the amount of unrecognized tax benefits will decrease in 2009 as a result of the lapse of state statutes of limitations, but the amount is not expected to be significant. NS does not expect that any of the above potential changes in unrecognized tax benefits will have a material effect on NS’ financial position, results of operations, or liquidity. Interest related to unrecognized tax benefits, which is included in “Other income – net,” amounted to $15 million of income in 2008, $12 million of expense in 2007 and $2 million of income in 2006. Penalties related to tax matters are included in “Provision for income taxes” and totaled zero in each of 2008, 2007, and 2006. NS has recorded a liability of $20 million at December 31, 2008, and $28 million at December 31, 2007, for the payment of interest on unrecognized tax benefits. NS has no liability recorded at December 31, 2008, and December 31, 2007, for the payment of penalties on unrecognized tax benefits.

K55
4. Investments December 31, 2008 2007 ($ in millions) Long-term investments: Investment in Conrail Inc. $ 868 $ 899 Other equity method investments 650 594 Company-owned life insurance at net cash surrender value 74 327 Other investments 187 154 Total long-term investments $ 1,779 $ 1,974 “Other equity method investments” above includes $267 million at December 31, 2008, and $240 million at December 31, 2007, related to NS’ investment in Meridian Speedway LLC, a joint venture formed with Kansas City Southern in 2006. Investment in Conrail Through a limited liability company, Norfolk Southern and CSX Corporation (CSX) jointly own Conrail Inc. (Conrail), whose primary subsidiary is Consolidated Rail Corporation (CRC). NS has a 58% economic and 50% voting interest in the jointly owned entity, and CSX has the remainder of the economic and voting interests. NS is applying the equity method of accounting to its investment in Conrail in accordance with APB Opinion No. 18, “The Equity Method of Accounting for Investments in Common Stock.” NS is amortizing the excess of the purchase price over Conrail’s net equity using the principles of purchase accounting, based primarily on the estimated useful lives of Conrail’s depreciable property and equipment, including the related deferred tax effect of the differences in tax accounting bases for such assets, as all of the purchase price at acquisition was allocable to Conrail’s tangible assets and liabilities. At December 31, 2008, based on the funded status of Conrail’s pension plans, recorded in accordance with SFAS 158, NS reduced its proportional investment in Conrail by $60 million. This resulted in a $55 million loss recorded to “other comprehensive income (loss)” and a combined federal and state deferred tax asset of $5 million. At December 31, 2007, NS’ year-end SFAS 158 adjustment increased its proportional investment in Conrail by $6 million. This resulted in $5 million of income recorded to “other comprehensive income (loss)” and a combined federal and state deferred tax liability of about $1 million. At December 31, 2008, the difference between NS’ investment in Conrail and its share of Conrail’s underlying net equity was $551 million. NS’ equity in the earnings of Conrail, net of amortization, included in “Other income – net” was $29 million, $45 million, and $25 million in 2008, 2007, and 2006, respectively. CRC owns and operates certain properties (the Shared Assets Areas) for the joint and exclusive benefit of NSR and CSX Transportation, Inc. (CSXT). The costs of operating the Shared Assets Areas are borne by NSR and CSXT based on usage. In addition, NSR and CSXT pay CRC a fee for access to the Shared Assets Areas. “Purchased services and rents” and “Fuel” include expenses for amounts due to CRC for operation of the Shared Assets Areas totaling $131 million in 2008 and $126 million in both 2007 and 2006. Future minimum lease payments due to CRC under the Shared Assets Areas agreements are as follows: $29 million in each of 2009 through 2013 and $305 million thereafter. NS provides certain general and administrative support functions to Conrail, the fees for which are billed in accordance with several service-provider arrangements and amount to approximately $7 million annually.

K56
“Accounts payable” includes $82 million at December 31, 2008, and $78 million at December 31, 2007, due to Conrail for the operation of the Shared Assets Areas. In addition, “Other liabilities” includes $133 million at December 31, 2008, and December 31, 2007, for long-term advances from Conrail, maturing 2035, that bear interest at an average rate of 4.4%. 5. Properties December 31, Depreciation 2008 2007 Rate for 2008 ($ in millions)
Land $ 2,119 $ 2,085 Railway property: Road 20,240 19,420 2.7% Equipment 7,688 7,413 3.7% Other property 473 471 2.3% 30,520 29,389 Less accumulated depreciation (8,273) (7,806) Net properties $ 22,247 $ 21,583 Railway property includes $483 million at December 31, 2008, and $504 million at December 31, 2007, of assets recorded pursuant to capital leases with accumulated amortization of $189 million and $175 million at December 31, 2008 and 2007, respectively. Other property includes the costs of obtaining rights to natural resources of $336 million at December 31, 2008, and $337 million at December 31, 2007, with accumulated depletion of $179 million and $172 million at December 31, 2008 and 2007, respectively. Capitalized Interest Total interest cost incurred on debt in 2008, 2007 and 2006 was $459 million, $455 million, and $489 million, respectively, of which $15 million, $14 million, and $13 million was capitalized. 6. Current Liabilities December 31, 2008 2007 ($ in millions) Accounts payable: Accounts and wages payable $ 577 $ 568 Casualty and other claims (Note 17) 248 259 Vacation liability 125 123 Equipment rents payable – net 84 87 Due to Conrail (Note 4) 82 78 Other 24 24 Total $ 1,140 $ 1,139 Other current liabilities: Interest payable $ 91 $ 90 Retiree benefit obligations (Note 10) 59 57 Liabilities for forwarded traffic 44 53 Other 26 37 Total $ 220 $ 237

K57
7. Long-term Debt Long-term debt as of December 31, 2008, with weighted average interest rates and maturities is presented below: December 31, 2008 2007 ($ in millions)
Notes and debentures: 6.56%, maturing to 2014 $ 1,431 $ 1,631 6.68%, maturing 2017 and 2018 1,150 550 8.21%, maturing 2020 to 2025 764 764 7.12%, maturing 2027 to 2031 1,290 1,290 7.21%, maturing 2037 and 2043 855 855 7.02%, maturing 2097 and 2105 650 650 Securitization borrowings, 3.01% 300 250 Capitalized leases, 4.16%, maturing to 2024 139 165 Other debt, 7.50%, maturing to 2019 113 113 Equipment obligations, 6.45%, maturing to 2014 99 226 Discounts and premiums, net (124) (126) Total long-term debt 6,667 6,368 Less current maturities (484) (369) Long-term debt excluding current maturities $ 6,183 $ 5,999 Long-term debt maturities subsequent to 2009 are as follows: 2010 $ 344 2011 342 2012 33 2013 46 2014 and subsequent years 5,418 Total $ 6,183
During the second quarter of 2008, $200 million of commercial paper matured and was refinanced as part of a private offering under which NS issued and sold $600 million of unsecured notes at 5.75% due 2018. NS subsequently exchanged substantially all of these unregistered securities with essentially identical securities registered under the Securities Act of 1933. In November 2007, NS entered into a $500 million receivables securitization facility under which NSR sells substantially all of its eligible third-party receivables to an NS subsidiary, which in turn may transfer beneficial interests in the receivables to various commercial paper vehicles. Amounts received under the facility are accounted for as borrowings. Under this facility, NS received $425 million and repaid $375 million in 2008. At December 31, 2008 and 2007, the amounts outstanding under the facility were $300 million at an average variable interest rate of 3.01% and $250 million at an average variable interest rate of 5.57%, respectively. The facility has a 364-day term which was renewed and amended in October 2008; however, NS intends to refinance these borrowings by issuing long-term debt, which is supported by its $1 billion credit agreement (see below). Accordingly, amounts outstanding are included in the line item “Long-term debt” in the Consolidated Balance Sheets. At December 31, 2008, and December 31, 2007, the amounts of receivables included in “Accounts receivable – net” serving as collateral for these borrowings were $719 million and $778 million, respectively. The railroad equipment obligations and the capitalized leases are secured by liens on the underlying equipment. Certain lease obligations require the maintenance of yen-denominated deposits, which are pledged to the lessor to
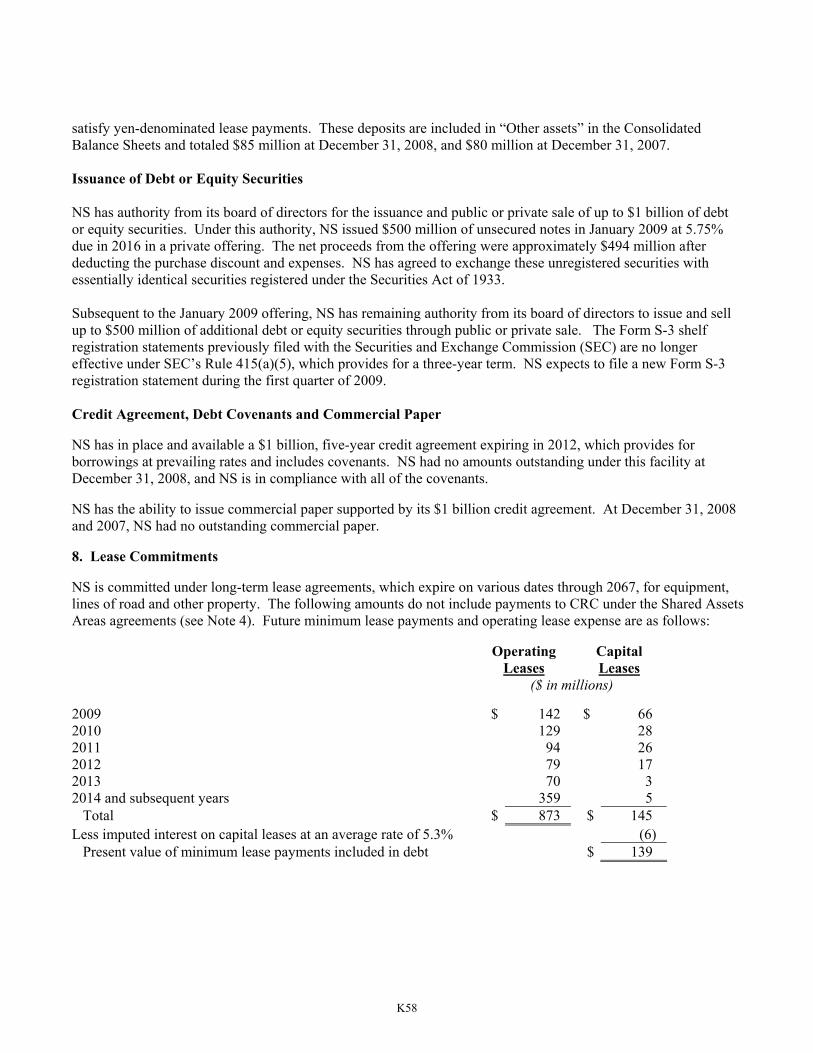
K58
satisfy yen-denominated lease payments. These deposits are included in “Other assets” in the Consolidated Balance Sheets and totaled $85 million at December 31, 2008, and $80 million at December 31, 2007. Issuance of Debt or Equity Securities NS has authority from its board of directors for the issuance and public or private sale of up to $1 billion of debt or equity securities. Under this authority, NS issued $500 million of unsecured notes in January 2009 at 5.75% due in 2016 in a private offering. The net proceeds from the offering were approximately $494 million after deducting the purchase discount and expenses. NS has agreed to exchange these unregistered securities with essentially identical securities registered under the Securities Act of 1933. Subsequent to the January 2009 offering, NS has remaining authority from its board of directors to issue and sell up to $500 million of additional debt or equity securities through public or private sale. The Form S-3 shelf registration statements previously filed with the Securities and Exchange Commission (SEC) are no longer effective under SEC’s Rule 415(a)(5), which provides for a three-year term. NS expects to file a new Form S-3 registration statement during the first quarter of 2009. Credit Agreement, Debt Covenants and Commercial Paper NS has in place and available a $1 billion, five-year credit agreement expiring in 2012, which provides for borrowings at prevailing rates and includes covenants. NS had no amounts outstanding under this facility at December 31, 2008, and NS is in compliance with all of the covenants. NS has the ability to issue commercial paper supported by its $1 billion credit agreement. At December 31, 2008 and 2007, NS had no outstanding commercial paper. 8. Lease Commitments NS is committed under long-term lease agreements, which expire on various dates through 2067, for equipment, lines of road and other property. The following amounts do not include payments to CRC under the Shared Assets Areas agreements (see Note 4). Future minimum lease payments and operating lease expense are as follows: Operating Capital Leases Leases ($ in millions) 2009 $ 142 $ 66 2010 129 28 2011 94 26 2012 79 17 2013 70 3 2014 and subsequent years 359 5 Total $ 873 $ 145 Less imputed interest on capital leases at an average rate of 5.3% (6) Present value of minimum lease payments included in debt $ 139

K59
Operating Lease Expense 2008 2007 2006 ($ in millions) Minimum rents $ 183 $ 191 $ 197 Contingent rents 80 79 79 Total $ 263 $ 270 $ 276 Contingent rents are primarily comprised of usage-based rent paid to other railroads for joint facility operations. 9. Other Liabilities
December 31, 2008 2007 ($ in millions) Retiree health and death benefit obligations (Note 10) $ 732 $ 635 Net pension obligations (Note 10) 329 150 Casualty and other claims (Note 17) 320 588 Federal and state income taxes 144 131 Long-term advances from Conrail (Note 4) 133 133 Deferred compensation 131 148 Other 241 254 Total $ 2,030 $ 2,039 10. Pensions and Other Postretirement Benefits Norfolk Southern and certain subsidiaries have both funded and unfunded defined benefit pension plans covering principally salaried employees. Norfolk Southern and certain subsidiaries also provide specified health care and death benefits to eligible retired employees and their dependents. Under the present plans, which may be amended or terminated at NS’ option, a defined percentage of health care expenses is covered, reduced by any deductibles, co-payments, Medicare payments and, in some cases, coverage provided under other group insurance policies.

K60
Pension and Other Postretirement Benefit Obligations and Plan Assets
Pension Benefits Other Postretirement
Benefits 2008 2007 2008 2007 ($ in millions) Change in benefit obligations Benefit obligation at beginning of year $ 1,644 $ 1,650 $ 859 $ 785 Service cost 25 24 16 21 Interest cost 99 92 51 46 Actuarial (gains) losses 4 (12) 44 53 Plan amendments 7 -- -- -- Benefits paid (109) (110) (50) (46) Benefit obligation at end of year 1,670 1,644 920 859 Change in plan assets Fair value of plan assets at beginning of year 1,963 1,939 176 119 Actual return on plan assets (531) 125 (38) 6 Employer contribution 10 9 50 97 Benefits paid (109) (110) (50) (46) Fair value of plan assets at end of year 1,333 1,963 138 176 Funded status at end of year $ (337) $ 319 $ (782) $ (683) Amounts recognized in the Consolidated Balance Sheets consist of:
Noncurrent assets $ 1 $ 478 $ -- $ -- Current liabilities (9) (9) (50) (48) Noncurrent liabilities (329) (150) (732) (635) Net amount recognized $ (337) $ 319 $ (782) $ (683) Amounts recognized in accumulated other comprehensive loss (pretax) consist of:
Net loss $ 991 $ 290 $ 351 $ 279 Prior service cost (benefit) 13 9 (2) (10)
NS’ unfunded pension plans, included above, which in all cases have no assets and therefore have an accumulated benefit obligation in excess of plan assets, had projected benefit obligations of $168 million at December 31, 2008, and $159 million at December 31, 2007, and had accumulated benefit obligations of $146 million at December 31, 2008, and $137 million at December 31, 2007.

K61
Pension and Other Postretirement Benefit Cost Components 2008 2007 2006 ($ in millions) Pension benefits Service cost $ 25 $ 24 $ 27 Interest cost 99 92 88 Expected return on plan assets (173) (167) (159)Amortization of prior service cost 3 2 2 Amortization of net losses 7 9 13 Net benefit $ (39) $ (40) $ (29) Other postretirement benefits Service cost $ 16 $ 21 $ 19 Interest cost 51 46 42 Expected return on plan assets (15) (11) (10)Amortization of prior service benefit (8) (8) (8)Amortization of net losses 25 28 27 Net cost $ 69 $ 76 $ 70
Other Changes in Plan Assets and Benefit Obligations Recognized in Other Comprehensive Loss 2008 Other Pension Postretirement Benefits Benefits ($ in millions) Net loss arising during the year $ 708 $ 97 Prior service cost arising during the year 7 -- Amortization of prior service cost (3) 8 Amortization of net losses (7) (25) Total recognized in other comprehensive loss $ 705 $ 80 Total recognized in net periodic (benefit) cost and other comprehensive loss $ 666 $ 149 The estimated net loss and prior service cost for the defined benefit pension plans that will be amortized from accumulated other comprehensive loss into net periodic cost over the next year are $25 million and $3 million, respectively. The estimated net loss and prior service benefit for the other defined benefit postretirement plans that will be amortized from accumulated other comprehensive loss into net periodic benefit cost over the next year are $34 million and $2 million, respectively. As of December 31, 2006, NS adopted SFAS 158. This statement requires an employer to recognize in its statement of financial position the overfunded or underfunded status of defined benefit pension and postretirement plans measured as the difference between the fair value of plan assets and the benefit obligation. Employers must also recognize as a component of other comprehensive income, net of tax, the actuarial gains and losses and the prior service costs, credits, and transition costs that arise during the period. As a result of adopting this standard, NS reduced its pension asset by $217 million and increased its pension and postretirement liabilities by $258 million in its December 31, 2006, Consolidated Balance Sheet, with a corresponding reduction to stockholders’ equity of $292 million (net of tax) reflected as an increase to accumulated other comprehensive loss. In addition, NS recognized a $2 million reduction to stockholders’ equity related to its proportionate share

K62
of Conrail’s adoption of SFAS 158. The adoption of SFAS 158 has no impact on years prior to 2006 and has no effect on the calculation of expenses for pensions and post-retirement benefits. Pension and Other Postretirement Benefit Assumptions Pension and other postretirement benefit costs are determined based on actuarial valuations that reflect appropriate assumptions as of the measurement date, ordinarily the beginning of each year. The funded status of the plans is determined using appropriate assumptions as of each year end. A summary of the major assumptions follows:
2008 2007 2006 Funded status: Discount rate 6.25% 6.25% 5.75% Future salary increases 4.5% 4.5% 4.5% Pension cost: Discount rate 6.25% 5.75% 5.50% Return on assets in plans 9% 9% 9% Future salary increases 4.5% 4.5% 4.5% Other postretirement benefit cost: Discount rate 6.25% 5.75% 5.50% Return on assets in plan 8.5% 9% 9% To determine the discount rate in 2008 and 2007, NS utilized an analysis in which the projected annual cash flows from the pension and postretirement benefit plans were matched with a yield curve based on an appropriate universe of high-quality corporate bonds. NS used the results of the yield curve to select the discount rate that matches the payment stream of the benefits in these plans. In 2006, NS referred to Moody’s seasoned Aa corporate bond yields and the changes in such yields in establishing the discount rate. Health Care Cost Trend Assumptions For measurement purposes at December 31, 2008, increases in the per capita cost of covered health care benefits were assumed to be 8.5% for 2008 and 8.8% for 2009. It is assumed the rate will decrease gradually to an ultimate rate of 5% for 2014 and remain at that level thereafter. Assumed health care cost trend rates have a significant effect on the amounts reported in the financial statements. To illustrate, a one-percentage-point change in the assumed health care cost trend would have the following effects: One percentage point Increase Decrease ($ in millions) Increase (decrease) in: Total service and interest cost components $ 9 $ (7) Postretirement benefit obligation $ 113 $ (94) Asset Management Eleven investment firms manage NS’ defined benefit pension plan’s assets under investment guidelines approved by the Board of Directors. Investments are restricted to domestic fixed income securities, international fixed income securities, domestic and international equity investments, and unleveraged exchange-traded options and financial futures. Limitations restrict investment concentration and use of certain derivative instruments. The target asset allocation for equity is 75% of the pension plan’s assets. Fixed income investments must have an average

K63
rating of “AA” or better and all fixed income securities must be rated “A” or better except bond index funds. Equity investments must be in liquid securities listed on national exchanges. No investment is permitted in the securities of Norfolk Southern Corporation or its subsidiaries (except through commingled pension trust funds). Investment managers’ returns are expected to meet or exceed selected market indices by prescribed margins. NS’ pension plan weighted-average asset allocations at December 31, 2008 and 2007, by asset category, were as follows: Percentage of plan assets at December 31, Asset Category 2008 2007 Domestic equity securities 58% 65%International equity securities 11% 10%Debt securities 31% 25% Total 100% 100% The postretirement benefit plan assets consist primarily of trust-owned variable life insurance policies with an asset allocation at December 31, 2008, of 53% in equity securities and 47% in debt securities compared with 65% in equity securities and 35% in debt securities at December 31, 2007. The target asset allocation for equity is between 50% and 75% of the plan’s assets. The plans’ assumed future returns are based principally on the asset allocation and on the historic returns for the plans’ asset classes determined from both actual plan returns and, over longer time periods, market returns for those asset classes. In 2008, 2007, and 2006 NS assumed a return on pension plan assets of 9%. For 2009, NS assumes an 8.75% return on pension plan assets. A one percentage point change to the rate of return assumption would result in an $18 million change to the net pension (benefit) cost and, as a result, an equal change in “Compensation and benefits” expense. Contributions and Estimated Future Benefit Payments In 2009, NS expects to contribute approximately $9 million to its unfunded pension plans for payments to pensioners and $50 million to its other postretirement benefit plans for retiree health benefits. NS does not expect to contribute to its funded pension plan in 2009. Benefit payments, which reflect expected future service, as appropriate, are expected to be paid as follows: Other Pension Postretirement Benefits Benefits ($ in millions) 2009 $ 111 $ 502010 114 542011 116 572012 119 592013 122 62Years 2014-2018 646 339 The other postretirement benefit payments include an estimated average annual reduction due to the Medicare Part D Subsidy of about $6 million.
K64
Other Postretirement Coverage Under collective bargaining agreements, NS and certain subsidiaries participate in a multi-employer benefit plan, which provides certain postretirement health care and life insurance benefits to eligible union employees. Premiums under this plan are expensed as incurred and amounted to $33 million in 2008, $27 million in 2007, and $26 million in 2006. Section 401(k) Plans Norfolk Southern and certain subsidiaries provide Section 401(k) savings plans for employees. Under the plans, NS matches a portion of employee contributions, subject to applicable limitations. NS’ matching contributions, recorded as an expense, under these plans were $15 million in 2008 and $14 million in both 2007 and 2006. 11. Stock-Based Compensation Under the stockholder-approved Long-Term Incentive Plan (LTIP), a committee of nonemployee directors of the Board or the chief executive officer (if delegated such authority by the committee) may grant stock options, stock appreciation rights (SARs), restricted stock units, restricted shares, performance shares, and performance share units (PSUs), up to a maximum of 88,025,000 shares of Norfolk Southern Common Stock (Common Stock). Of these shares, 5,000,000 were approved by the Board for issuance to non-officer participants; as a broad-based issuance, stockholder approval was not required. In May 2005, the stockholders approved an amended LTIP which provided that 8,500,000 shares of stock previously approved for issuance under LTIP could be granted as restricted stock units, restricted shares or performance shares. Under the Board-approved Thoroughbred Stock Option Plan (TSOP), the committee may grant stock options up to a maximum of 6,000,000 shares of Common Stock; as a broad-based stock option plan, stockholder approval of TSOP was not required. NS uses newly issued shares to satisfy any exercises and awards under LTIP and TSOP. The LTIP also permits the payment – on a current or a deferred basis and in cash or in stock – of dividend equivalents on shares of Common Stock covered by options, PSUs or restricted stock units in an amount commensurate with regular quarterly dividends paid on Common Stock. Tax absorption payments also are authorized for any awards under LTIP in amounts estimated to equal the federal and state income taxes applicable to shares of Common Stock issued subject to a share retention agreement. During the first quarter of 2008, a committee of nonemployee directors of NS’ Board granted stock options, restricted stock units and PSUs pursuant to the LTIP and granted stock options pursuant to the TSOP. Receipt of an award under LTIP was made contingent upon the awardee’s execution of a non-compete agreement, and all awards under LTIP were made subject to forfeiture in the event the awardee “engages in competing employment” for a period of time following retirement. Accounting Method As disclosed in Note 1, prior to the adoption of SFAS 123(R), NS applied APB Opinion 25 and related interpretations in accounting for awards made under the plans. Accordingly, grants of PSUs, restricted stock units, restricted shares, dividend equivalents, tax absorption payments and SARs resulted in charges to net income, while grants of stock options had no effect on net income. Under SFAS 123(R), all awards result in charges to net income while dividend equivalents, which are all related to equity classified awards, are charged to retained income. Related compensation costs were $89 million in 2008, $96 million in 2007 and $129 million in 2006. The total tax effects recognized in income in relation to stock-based compensation were benefits of $30 million in 2008, $32 million in 2007 and $44 million in 2006.

K65
“Common stock issued – net” in the Consolidated Statements of Cash Flows for the years ended December 31, 2008, 2007 and 2006 includes tax benefits generated from tax deductions in excess of compensation costs recognized (excess tax benefits) for share based awards of $76 million, $57 million and $85 million, respectively. Stock Options Options may be granted for a term not to exceed 10 years and are subject to a vesting period of at least one year. Option exercise prices are at not less than the fair market value of Common Stock on the effective date of the grant. In the first quarter of 2008, 1,162,600 options were granted under the LTIP and 250,000 options were granted under the TSOP. In each case, the grant price was $50.74, which was the fair market value of Common Stock on the date of grant. The options have a term of ten years but may not be exercised prior to the third anniversary of the date of grant. Holders of the options granted under the LTIP who remain actively employed receive cash dividend equivalent payments for five years in an amount equal to the regular quarterly dividends paid on Common Stock. In the first quarter of 2007, 1,203,300 options were granted under the LTIP and 251,000 options were granted under the TSOP, each with a grant price of $49.555, but may not be exercised prior to the third anniversary of the date of grant. In the first quarter of 2006, 1,188,700 options were granted under the LTIP and 238,000 options were granted under the TSOP, each with a grant price of $49.425, but may not be exercised prior to the first anniversary of the date of grant. For both 2007 and 2006, the grant price was the fair market value of Common Stock on the date of grant, and the options have a term of ten years. The fair value of each option award in 2008, 2007 and 2006 was measured on the date of grant using a lattice-based option valuation model. Expected volatilities are based on implied volatilities from traded options on Common Stock and historical volatility of Common Stock. NS uses historical data to estimate option exercises and employee terminations within the valuation model. The average expected option life is derived from the output of the valuation model and represents the period of time that options granted are expected to be outstanding. The average risk-free interest rate is based on the U.S. Treasury yield curve in effect at the time of grant. For options granted that include dividend equivalent payments, a dividend yield of zero was used. For the 2008 and 2007 TSOP grants a dividend yield of 2.29% and 1.5%, respectively, was used because no dividend equivalent payments are made on these options. The assumptions for the 2008, 2007 and 2006 LTIP and TSOP grants are shown in the following table: 2008 2007 2006 Expected volatility range 25% - 32% 26.1% - 33.3% 23.5% - 34.5% Average expected volatility 32% 33% 27% Average risk-free interest rate 3.68% 4.9% 4.5% Average expected option term – LTIP 5.9 years 5.6 years 3.7 years Per-share grant-date fair value – LTIP $19.32 $19.82 $13.47 Average expected option term – TSOP 8.0 years 6.5 years 3.7 years Per-share grant-date fair value – TSOP $16.29 $17.88 $13.47 Options granted (LTIP and TSOP) 1,412,600 1,454,300 1,427,400
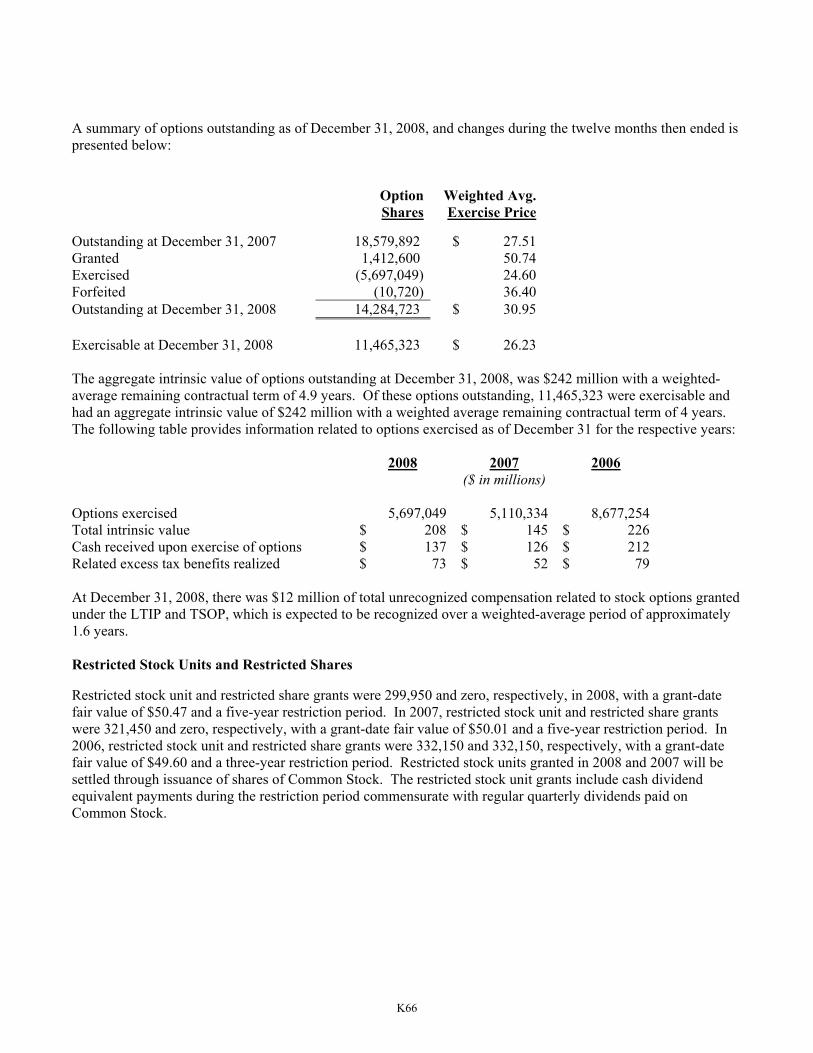
K66
A summary of options outstanding as of December 31, 2008, and changes during the twelve months then ended is presented below: Option Weighted Avg. Shares Exercise Price Outstanding at December 31, 2007 18,579,892 $ 27.51Granted 1,412,600 50.74Exercised (5,697,049) 24.60Forfeited (10,720) 36.40Outstanding at December 31, 2008 14,284,723 $ 30.95 Exercisable at December 31, 2008 11,465,323 $ 26.23 The aggregate intrinsic value of options outstanding at December 31, 2008, was $242 million with a weighted-average remaining contractual term of 4.9 years. Of these options outstanding, 11,465,323 were exercisable and had an aggregate intrinsic value of $242 million with a weighted average remaining contractual term of 4 years. The following table provides information related to options exercised as of December 31 for the respective years: 2008 2007 2006 ($ in millions) Options exercised 5,697,049 5,110,334 8,677,254 Total intrinsic value $ 208 $ 145 $ 226 Cash received upon exercise of options $ 137 $ 126 $ 212 Related excess tax benefits realized $ 73 $ 52 $ 79 At December 31, 2008, there was $12 million of total unrecognized compensation related to stock options granted under the LTIP and TSOP, which is expected to be recognized over a weighted-average period of approximately 1.6 years. Restricted Stock Units and Restricted Shares Restricted stock unit and restricted share grants were 299,950 and zero, respectively, in 2008, with a grant-date fair value of $50.47 and a five-year restriction period. In 2007, restricted stock unit and restricted share grants were 321,450 and zero, respectively, with a grant-date fair value of $50.01 and a five-year restriction period. In 2006, restricted stock unit and restricted share grants were 332,150 and 332,150, respectively, with a grant-date fair value of $49.60 and a three-year restriction period. Restricted stock units granted in 2008 and 2007 will be settled through issuance of shares of Common Stock. The restricted stock unit grants include cash dividend equivalent payments during the restriction period commensurate with regular quarterly dividends paid on Common Stock.

K67
A summary of the status of restricted stock units and restricted shares as of December 31, 2008, and changes during the twelve months then ended is presented below: Weighted - Average Grant-Date Units Shares Fair Value
Nonvested at December 31, 2007 957,352 811,600 $ 42.53 Granted 299,950 -- 50.47 Vested (5,437) (8,156) 34.10 Forfeited -- -- -- Nonvested at December 31, 2008 1,251,865 803,444 $ 43.72
At December 31, 2008, there was $12 million of total unrecognized compensation related to restricted stock units and restricted shares granted under the LTIP, which is expected to be recognized over a weighted-average period of approximately 1.5 years. The total fair values of the restricted stock units paid in cash and restricted shares vested during the twelve months ended December 31, 2008, 2007 and 2006 were $1 million, $22 million, and $40 million, respectively. The total related excess tax benefits realized were $1 million in 2008, $3 million in 2007, and $6 million in 2006. Performance Share Units PSUs provide for awards based on achievement of certain predetermined corporate performance goals (total shareholder return, return on average invested capital and operating ratio) at the end of a three-year cycle. PSU grants and average grant-date fair values were 1,162,600 and $50.465 in 2008; 1,203,300 and $49.555 in 2007; and 1,163,600 and $49.425 in 2006. One-half of any PSUs earned will be paid in the form of shares of Common Stock with the other half to be paid in cash. A summary of the status of PSUs as of December 31, 2008, and changes during the twelve months then ended is presented below:
Weighted - Average
Performance Grant-Date Share Units Fair Value
Balance December 31, 2007 3,603,100 $ 43.91Granted 1,162,600 50.47Earned – paid in Common Stock (506,852) 34.10Earned – paid in cash (507,147) 34.10Unearned (292,701) 34.10Forfeited -- --Balance December 31, 2008 3,459,000 $ 49.82 As of December 31, 2008, there was $18 million of total unrecognized compensation related to PSUs granted under the LTIP, which is expected to be recognized over a weighted-average period of approximately 1.1 years. The total fair values of PSUs earned and paid in cash during the twelve months ended December 31, 2008, 2007 and 2006 were $26 million, $18 million, and $34 million, respectively. The total related excess tax benefits realized were $2 million in 2008, $2 million in 2007, and zero in 2006.
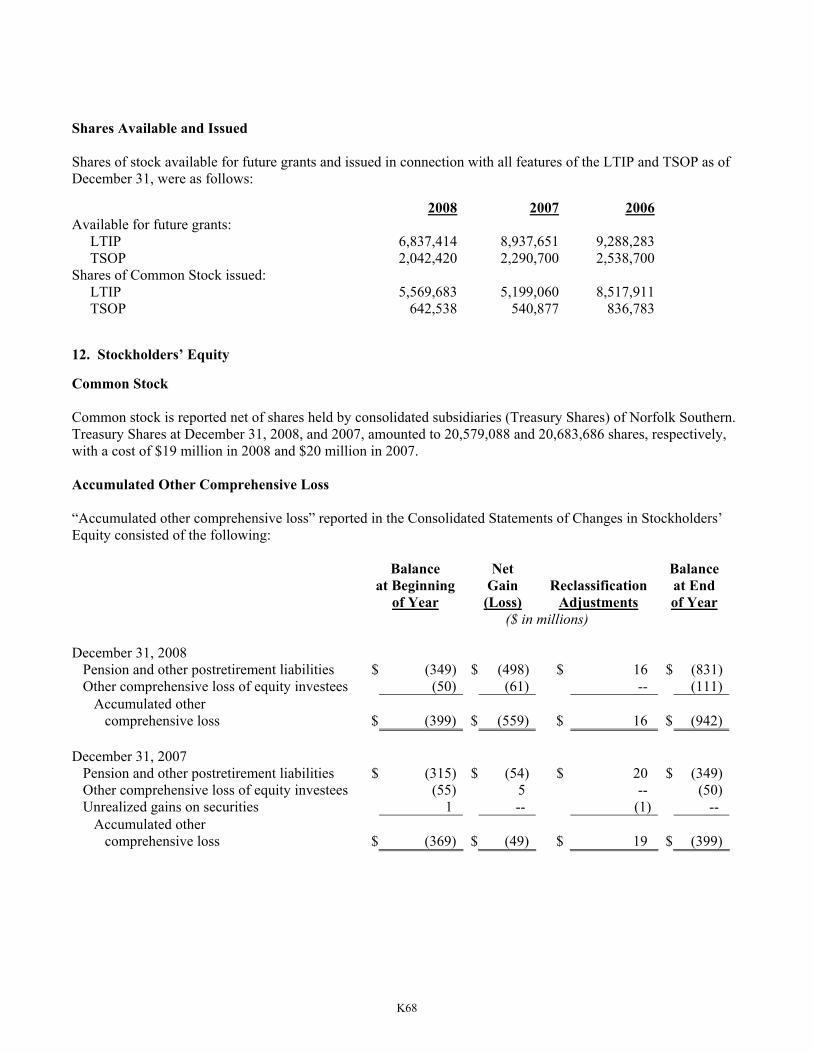
K68
Shares Available and Issued Shares of stock available for future grants and issued in connection with all features of the LTIP and TSOP as of December 31, were as follows: 2008 2007 2006Available for future grants: LTIP 6,837,414 8,937,651 9,288,283 TSOP 2,042,420 2,290,700 2,538,700Shares of Common Stock issued: LTIP 5,569,683 5,199,060 8,517,911 TSOP 642,538 540,877 836,783 12. Stockholders’ Equity Common Stock Common stock is reported net of shares held by consolidated subsidiaries (Treasury Shares) of Norfolk Southern. Treasury Shares at December 31, 2008, and 2007, amounted to 20,579,088 and 20,683,686 shares, respectively, with a cost of $19 million in 2008 and $20 million in 2007. Accumulated Other Comprehensive Loss “Accumulated other comprehensive loss” reported in the Consolidated Statements of Changes in Stockholders’ Equity consisted of the following: Balance Net Balance at Beginning Gain Reclassification at End of Year (Loss) Adjustments of Year ($ in millions) December 31, 2008 Pension and other postretirement liabilities $ (349) $ (498) $ 16 $ (831) Other comprehensive loss of equity investees (50) (61) -- (111) Accumulated other comprehensive loss $ (399) $ (559) $ 16 $ (942) December 31, 2007 Pension and other postretirement liabilities $ (315) $ (54) $ 20 $ (349) Other comprehensive loss of equity investees (55) 5 -- (50) Unrealized gains on securities 1 -- (1) -- Accumulated other comprehensive loss $ (369) $ (49) $ 19 $ (399)
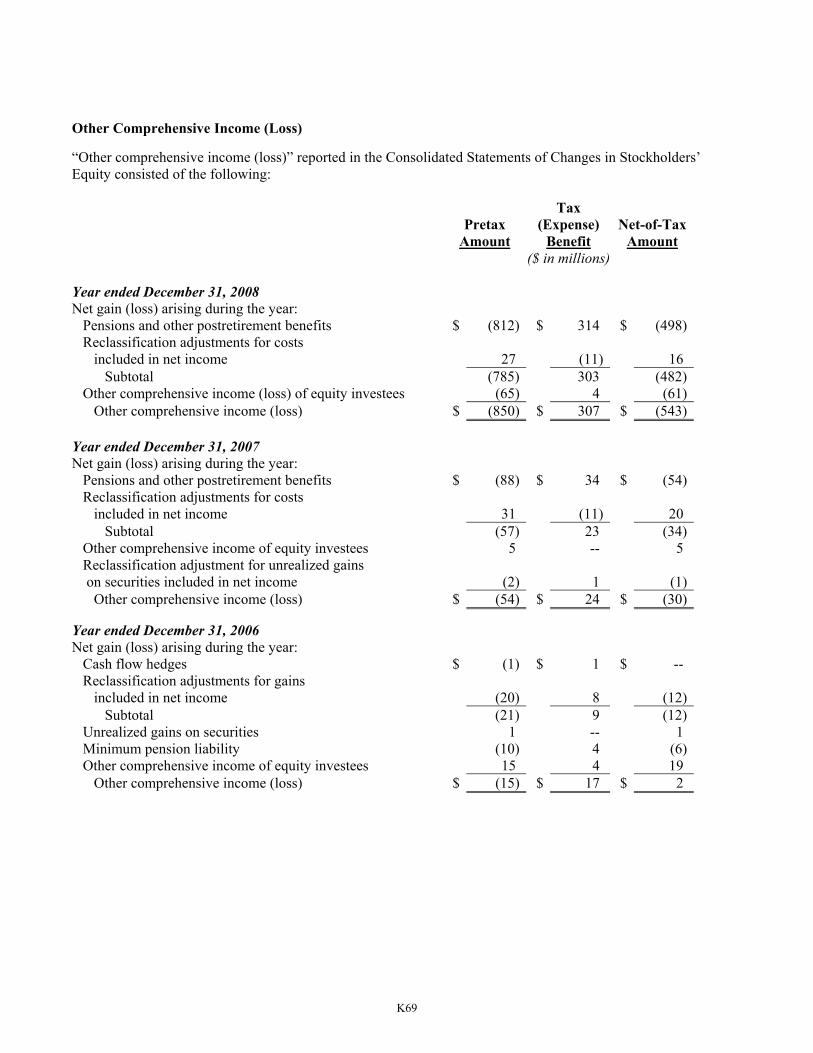
K69
Other Comprehensive Income (Loss) “Other comprehensive income (loss)” reported in the Consolidated Statements of Changes in Stockholders’ Equity consisted of the following: Tax Pretax (Expense) Net-of-Tax Amount Benefit Amount ($ in millions) Year ended December 31, 2008 Net gain (loss) arising during the year: Pensions and other postretirement benefits $ (812) $ 314 $ (498) Reclassification adjustments for costs included in net income 27 (11) 16 Subtotal (785) 303 (482) Other comprehensive income (loss) of equity investees (65) 4 (61) Other comprehensive income (loss) $ (850) $ 307 $ (543) Year ended December 31, 2007 Net gain (loss) arising during the year: Pensions and other postretirement benefits $ (88) $ 34 $ (54) Reclassification adjustments for costs included in net income 31 (11) 20 Subtotal (57) 23 (34) Other comprehensive income of equity investees 5 -- 5 Reclassification adjustment for unrealized gains on securities included in net income (2) 1 (1) Other comprehensive income (loss) $ (54) $ 24 $ (30) Year ended December 31, 2006 Net gain (loss) arising during the year: Cash flow hedges $ (1) $ 1 $ -- Reclassification adjustments for gains included in net income (20) 8 (12) Subtotal (21) 9 (12) Unrealized gains on securities 1 -- 1 Minimum pension liability (10) 4 (6) Other comprehensive income of equity investees 15 4 19 Other comprehensive income (loss) $ (15) $ 17 $ 2

K70
13. Stock Repurchase Program In March 2007, NS’ Board of Directors amended NS’ share repurchase program, increasing the authorized amount of share repurchases from 50 million to 75 million shares and shortening the term of the program from 2015 to 2010. The timing and volume of purchases is guided by management’s assessment of market conditions and other pertinent facts. Near-term purchases under the program are expected to be made with internally generated cash or proceeds from borrowings. NS repurchased and retired 19.4 million shares, 23.6 million shares, and 21.7 million shares of its common stock under this program in 2008, 2007, and 2006, respectively, at a cost of $1.1 billion, $1.2 billion, and $964 million, respectively. Since inception of this program in 2006, NS has repurchased and retired 64.7 million shares of Common Stock at a total cost of $3.3 billion. 14. Earnings Per Share The following tables set forth the calculation of basic and diluted earnings per share: 2008 2007 2006 ($ in millions except per share, shares in millions) Basic earnings per share: Income available to common stockholders $ 1,711 $ 1,459 $ 1,475 Weighted-average shares outstanding 372.3 389.6 406.0 Basic earnings per share $ 4.60 $ 3.74 $ 3.63 Income available to common stockholders for both 2008 and 2007 reflects a $5 million reduction, and in 2006 a $6 million reduction for the after-tax effect of dividend equivalent payments made to holders of vested stock options. 2008 2007 2006 ($ in millions except per share, shares in millions) Diluted earnings per share: Income available to common stockholders $ 1,716 $ 1,464 $ 1,481 Weighted-average shares outstanding per above 372.3 389.6 406.0 Dilutive effect of outstanding options and share-settled awards (as determined by the application of the treasury stock method) 7.7 8.2 8.7 Adjusted weighted-average shares outstanding 380.0 397.8 414.7 Diluted earnings per share $ 4.52 $ 3.68 $ 3.57 The diluted calculations exclude options having exercise prices exceeding the average market price of Common Stock as follows: zero in 2008 and 2007 and 1 million in 2006.
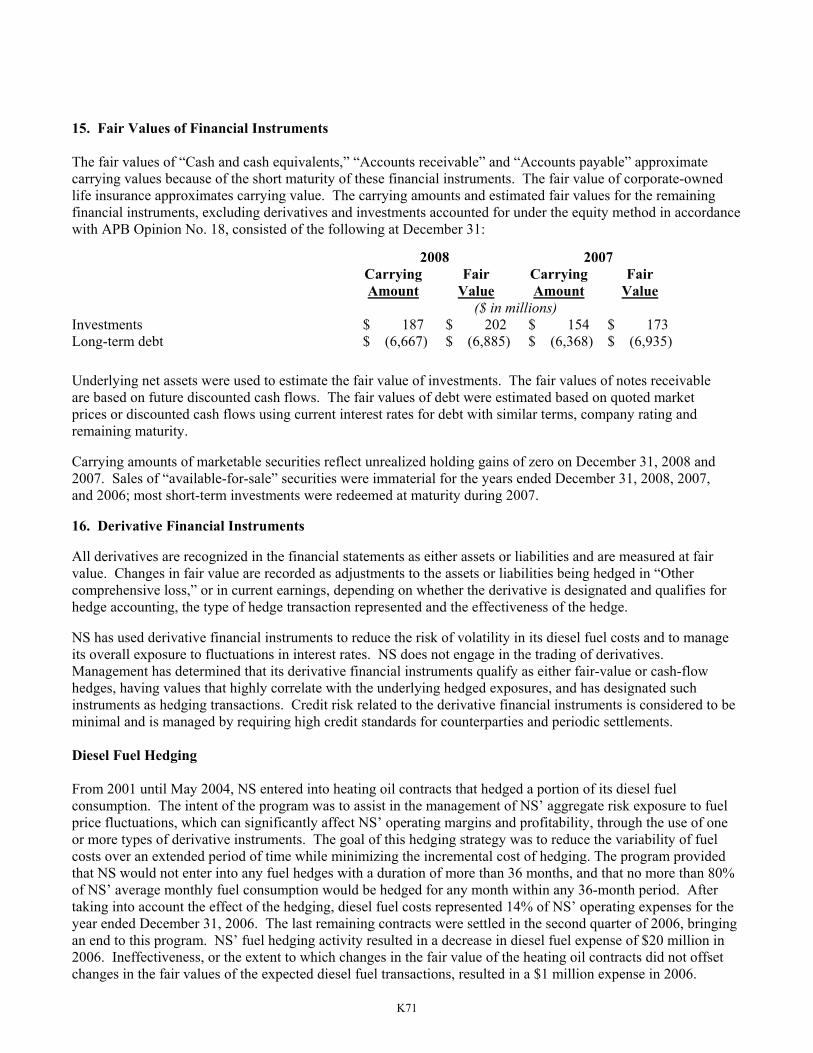
K71
15. Fair Values of Financial Instruments The fair values of “Cash and cash equivalents,” “Accounts receivable” and “Accounts payable” approximate carrying values because of the short maturity of these financial instruments. The fair value of corporate-owned life insurance approximates carrying value. The carrying amounts and estimated fair values for the remaining financial instruments, excluding derivatives and investments accounted for under the equity method in accordance with APB Opinion No. 18, consisted of the following at December 31:
Underlying net assets were used to estimate the fair value of investments. The fair values of notes receivable are based on future discounted cash flows. The fair values of debt were estimated based on quoted market prices or discounted cash flows using current interest rates for debt with similar terms, company rating and remaining maturity. Carrying amounts of marketable securities reflect unrealized holding gains of zero on December 31, 2008 and 2007. Sales of “available-for-sale” securities were immaterial for the years ended December 31, 2008, 2007, and 2006; most short-term investments were redeemed at maturity during 2007. 16. Derivative Financial Instruments All derivatives are recognized in the financial statements as either assets or liabilities and are measured at fair value. Changes in fair value are recorded as adjustments to the assets or liabilities being hedged in “Other comprehensive loss,” or in current earnings, depending on whether the derivative is designated and qualifies for hedge accounting, the type of hedge transaction represented and the effectiveness of the hedge. NS has used derivative financial instruments to reduce the risk of volatility in its diesel fuel costs and to manage its overall exposure to fluctuations in interest rates. NS does not engage in the trading of derivatives. Management has determined that its derivative financial instruments qualify as either fair-value or cash-flow hedges, having values that highly correlate with the underlying hedged exposures, and has designated such instruments as hedging transactions. Credit risk related to the derivative financial instruments is considered to be minimal and is managed by requiring high credit standards for counterparties and periodic settlements. Diesel Fuel Hedging From 2001 until May 2004, NS entered into heating oil contracts that hedged a portion of its diesel fuel consumption. The intent of the program was to assist in the management of NS’ aggregate risk exposure to fuel price fluctuations, which can significantly affect NS’ operating margins and profitability, through the use of one or more types of derivative instruments. The goal of this hedging strategy was to reduce the variability of fuel costs over an extended period of time while minimizing the incremental cost of hedging. The program provided that NS would not enter into any fuel hedges with a duration of more than 36 months, and that no more than 80% of NS’ average monthly fuel consumption would be hedged for any month within any 36-month period. After taking into account the effect of the hedging, diesel fuel costs represented 14% of NS’ operating expenses for the year ended December 31, 2006. The last remaining contracts were settled in the second quarter of 2006, bringing an end to this program. NS’ fuel hedging activity resulted in a decrease in diesel fuel expense of $20 million in 2006. Ineffectiveness, or the extent to which changes in the fair value of the heating oil contracts did not offset changes in the fair values of the expected diesel fuel transactions, resulted in a $1 million expense in 2006.
2008 2007 Carrying Fair Carrying Fair Amount Value Amount Value ($ in millions) Investments $ 187 $ 202 $ 154 $ 173 Long-term debt $ (6,667) $ (6,885) $ (6,368) $ (6,935)

K72
Interest Rate Hedging NS manages its overall exposure to fluctuations in interest rates by issuing both fixed- and floating-rate debt instruments, and by entering into interest rate hedging transactions to achieve an appropriate mix within its debt portfolio. NS had $17 million, or less than 1%, and $59 million, or about 1%, of its fixed rate debt portfolio hedged as of December 31, 2008, and December 31, 2007, respectively, using interest rate swaps that qualify for and are designated as fair-value hedge transactions. NS’ interest rate hedging activity resulted in decreases in interest expense of approximately $1 million for 2008, 2007, and 2006. These swaps have been effective in hedging the changes in fair value of the related debt arising from changes in interest rates and there has been no impact on earnings resulting from ineffectiveness associated with these derivative transactions. Fair Values Fair values of interest rate swaps at December 31, 2008, and December 31, 2007, were determined based upon the present value of expected future cash flows discounted at the appropriate implied spot rate from the spot rate yield curve. Fair value adjustments are noncash transactions and, accordingly, are excluded from the Consolidated Statements of Cash Flows. The gross and net asset position of NS’ outstanding derivative financial instruments was approximately $1 million at December 31, 2008 and 2007. 17. Commitments and Contingencies Lawsuits Norfolk Southern and/or certain subsidiaries are defendants in numerous lawsuits and other claims relating principally to railroad operations. When management concludes that it is probable that a liability has been incurred and the amount of the liability can be reasonably estimated, it is accrued through a charge to earnings. While the ultimate amount of liability incurred in any of these lawsuits and claims is dependent on future developments, in management’s opinion, the recorded liability is adequate to cover the future payment of such liability and claims. However, the final outcome of any of these lawsuits and claims cannot be predicted with certainty, and unfavorable or unexpected outcomes could result in additional accruals that could be significant to results of operations in a particular year or quarter. Any adjustments to the recorded liability will be reflected in earnings in the periods in which such adjustments are known. Casualty Claims Casualty claims include employee personal injury and occupational claims as well as third-party claims, all exclusive of legal costs. To aid in valuing its personal injury liability and determining the amount to accrue with respect to such claim during the year, NS’ management utilizes studies prepared by an independent consulting actuarial firm. Job-related accidental injury and occupational claims are subject to the Federal Employers’ Liability Act (FELA), which is applicable only to railroads. FELA’s fault-based system produces results that are unpredictable and inconsistent as compared with a no-fault workers’ compensation system. The variability inherent in this system could result in actual costs being different from the liability recorded. While the ultimate amount of claims incurred is dependent on future developments, in management’s opinion, the recorded liability is adequate to cover the future payments of claims and is supported by the most recent actuarial study. In all cases, NS records a liability when the expected loss for the claim is both probable and estimable. In April 2008, NS settled the lawsuit brought by Avondale Mills for claims associated with the January 6, 2005, derailment in Graniteville, SC. The total liability related to the derailment represents NS’ best estimate based on current facts and circumstances. The estimate includes amounts related to business property damage and other economic losses, personal injury and individual property damage claims, as well as third-party response costs. NS’ commercial insurance policies are expected to cover substantially all expenses related to this

K73
derailment above the unreimbursed portion and NS’ self-insured retention, including NS’ response costs and legal fees. The Consolidated Balance Sheets reflect current and long-term receivables for estimated recoveries from NS’ insurance carriers. NS is engaged in arbitration with one of its insurance carriers that failed to respond to an insurance claim submitted by NS. NS believes these expenses are covered by the insurance policy and that recovery of any contested amount is probable, in that NS expects the arbitrator will determine the settlement amounts to be reasonable and that the insurer’s refusal to consent to and to fund the settlement was a breach of contract. Accordingly, NS has recorded the full recovery attributable to such carrier ($100 million). In October 2008, another of NS’ insurance carriers provided the preliminary findings of its review of NS’ reimbursement request and reported that it may dispute a portion of that request. NS has initiated arbitration against the carrier and believes that all expenses contained in the reimbursement request are covered by the insurance policy and that recovery is probable. Employee personal injury claims – The largest component of casualties and other claims expense is employee personal injury costs. The independent actuarial firm engaged by NS provides quarterly studies to aid in valuing its employee personal injury liability and estimating its employee personal injury expense. The actuarial firm studies NS’ historical patterns of reserving for claims and subsequent settlements, taking into account relevant outside influences. The actuary uses the results of these analyses to estimate the ultimate amount of the liability, which includes amounts for incurred but unasserted claims. NS adjusts its liability quarterly based upon management’s assessment and the results of the study. The estimate of loss liabilities is subject to inherent limitation given the difficulty of predicting future events such as jury decisions, court interpretations, or legislative changes and as such the actual loss may vary from the estimated liability recorded. Occupational claims – Occupational claims (including asbestosis and other respiratory diseases, as well as conditions allegedly related to repetitive motion) are often not caused by a specific accident or event but rather allegedly result from a claimed exposure over time. Many such claims are being asserted by former or retired employees, some of whom have not been employed in the rail industry for decades. The independent actuarial firm provides an estimate of the occupational claims liability based upon NS’ history of claim filings, severity, payments, and other pertinent facts. The liability is dependent upon management’s judgments made as to the specific case reserves as well as judgments of the consulting independent actuarial firm in the periodic studies. The actuarial firm’s estimate of ultimate loss includes a provision for those claims that have been incurred but not reported. This provision is derived by analyzing industry data and projecting NS’ experience into the future as far as can be reasonably determined. NS adjusts its liability quarterly based upon management’s assessment and the results of the study. However, it is possible that the recorded liability may not be adequate to cover the future payment of claims. Adjustments to the recorded liability are reflected in operating expenses in the periods in which such adjustments become known. Third-party claims – NS records a liability for third-party claims including those for highway crossing accidents, trespasser and other injuries, automobile liability, property damage, and lading damage. The independent actuarial firm assists with the calculation of potential liability for third-party claims, except lading damage, based upon NS’ experience including number and timing of incidents, amount of payments, settlement rates, number of open claims, and legal defenses. The actuarial estimate includes a provision for claims that have been incurred but have not yet been reported. Each quarter NS adjusts its liability based upon management’s assessment and the results of the study. Given the inherent uncertainty in regard to the ultimate outcome of third-party claims, it is possible that the actual loss may differ from the estimated liability recorded. Environmental Matters NS is subject to various jurisdictions’ environmental laws and regulations. It is NS’ policy to record a liability where such liability or loss is probable and its amount can be estimated reasonably. Claims, if any, against third parties for recovery of cleanup costs incurred by NS are reflected as receivables (when collection is probable) in the Consolidated Balance Sheets and are not netted against the associated NS liability.

K74
Environmental engineers regularly participate in ongoing evaluations of all known sites and in determining any necessary adjustments to liability estimates. NS also has an Environmental Policy Council, composed of senior managers, to oversee and interpret its environmental policy. NS’ Consolidated Balance Sheets include liabilities for environmental exposures in the amount of $42 million at December 31, 2008, and $46 million at December 31, 2007 (of which $12 million is classified as a current liability at December 31, 2008 and 2007). At December 31, 2008, the liability represents NS’ estimate of the probable cleanup and remediation costs based on available information at 148 known locations compared with 155 locations at December 31, 2007. As of December 31, 2008, 13 sites accounted for $22 million of the liability, and no individual site was considered to be material. NS anticipates that much of this liability will be paid out over five years; however, some costs will be paid out over a longer period. At 30 locations, one or more Norfolk Southern subsidiaries, usually in conjunction with a number of other parties, have been identified as potentially responsible parties by the Environmental Protection Agency (EPA) or similar state authorities under the Comprehensive Environmental Response, Compensation and Liability Act of 1980, or comparable state statutes, which often impose joint and several liability for cleanup costs. With respect to known environmental sites (whether identified by NS or by the EPA or comparable state authorities), estimates of NS’ ultimate potential financial exposure for a given site or in the aggregate for all such sites are necessarily imprecise because of the widely varying costs of currently available cleanup techniques, the likely development of new cleanup technologies, the difficulty of determining in advance the nature and full extent of contamination and each potential participant’s share of any estimated loss (and that participant’s ability to bear it), and evolving statutory and regulatory standards governing liability. The risk of incurring environmental liability – for acts and omissions, past, present and future - is inherent in the railroad business. Some of the commodities in NS’ traffic mix, particularly those classified as hazardous materials, pose special risks that NS and its subsidiaries work diligently to minimize. In addition, several NS subsidiaries own, or have owned, land used as operating property, or which is leased and operated by others, or held for sale. Because environmental problems may exist on these properties that are latent or undisclosed, there can be no assurance that NS will not incur environmental liabilities or costs with respect to one or more of them, the amount and materiality of which cannot be estimated reliably at this time. Moreover, lawsuits and claims involving these and potentially other unidentified environmental sites and matters are likely to arise from time to time. The resulting liabilities could have a significant effect on financial position, results of operations, or liquidity in a particular year or quarter. On April 24, 2008, the United States Department of Justice (DOJ) brought an action against NS for alleged violations of federal environmental laws resulting from the discharge of chlorine and oil that occurred as a result of the January 6, 2005, derailment in Graniteville, SC, including claims for civil penalties as well as injunctive relief. On June 24, 2008, NS filed a motion to dismiss DOJ’s claims, contending that insufficient facts have been alleged to support such claims. NS does not believe that the outcome of these proceedings will have a material effect on its financial position, results of operations, or liquidity. Based on its assessment of the facts and circumstances now known, management believes that it has recorded the probable costs for dealing with those environmental matters of which NS is aware. Further, management believes that it is unlikely that any known matters, either individually or in the aggregate, will have a material adverse effect on NS’ financial position, results of operations, or liquidity. Insurance Norfolk Southern obtains on behalf of itself and its subsidiaries insurance for potential losses for third-party liability and first-party property damages. NS is currently self-insured up to $25 million and above $1 billion
K75
per occurrence for bodily injury and property damage to third parties and up to $25 million and above $175 million per occurrence for property owned by NS or in NS’ care, custody or control. Purchase Commitments At December 31, 2008, NS had outstanding purchase commitments of approximately $119 million primarily for freight cars, RoadRailer® trailers and track material in connection with its capital programs through 2010. Change-In-Control Arrangements Norfolk Southern has compensation agreements with officers and certain key employees that become operative only upon a change in control of Norfolk Southern, as defined in those agreements. The agreements provide generally for payments based on compensation at the time of a covered individual’s involuntary or other specified termination and for certain other benefits. Guarantees In a number of instances, Norfolk Southern and its subsidiaries have agreed to indemnify lenders for additional costs they may bear as a result of certain changes in laws or regulations applicable to their loans. Such changes may include impositions or modifications with respect to taxes, duties, reserves, liquidity, capital adequacy, special deposits, and similar requirements relating to extensions of credit by, deposits with, or the assets or liabilities of such lenders. The nature and timing of changes in laws or regulations applicable to NS’ financings are inherently unpredictable, and therefore NS’ exposure in connection with the foregoing indemnifications cannot be quantified. No liability has been recorded related to these indemnifications. In the case of one type of equipment financing, NSR’s Japanese leveraged leases, NSR may terminate the leases and ancillary agreements if such a change-in-law indemnity is triggered. Such a termination would require NSR to make early termination payments that would not be expected to have a material effect on NS’ financial position, results of operations, or liquidity. NS has indemnified parties in a number of transactions for U.S. income tax withholding imposed as a result of changes in U.S. tax law. In all cases, NS has the right to unwind the related transaction if the withholding cannot be avoided in the future. Because these indemnities would be triggered and are dependent upon a change in the tax law, the maximum exposure is not quantifiable. Management does not believe that it is likely that it will be required to make any payments under these indemnities. As of December 31, 2008, certain Norfolk Southern subsidiaries are contingently liable as guarantors with respect to $8 million of indebtedness, due in 2019, of an entity in which they have an ownership interest, the Terminal Railroad Association of St. Louis. Four other railroads are also jointly and severally liable as guarantors for this indebtedness. No liability has been recorded related to this guaranty.
* * * * *

K76
NORFOLK SOUTHERN CORPORATION AND SUBSIDIARIES QUARTERLY FINANCIAL DATA
(Unaudited)
Three Months Ended March 31 June 30 September 30 December 31 ($ in millions, except per share amounts) 2008 Railway operating revenues $ 2,500 $ 2,765 $ 2,894 $ 2,502Income from railway operations 578 799 894 813Net income 291 453 520 452Earnings per share: Basic $ 0.77 $ 1.20 $ 1.39 $ 1.23 Diluted $ 0.76 $ 1.18 $ 1.37 $ 1.21 2007 Railway operating revenues $ 2,247 $ 2,378 $ 2,353 $ 2,454Income from railway operations 528 690 681 686Net income 285 394 386 399Earnings per share: Basic $ 0.72 $ 1.00 $ 0.99 $ 1.04 Diluted $ 0.71 $ 0.98 $ 0.97 $ 1.02

K77
Item 9. Changes in and Disagreements with Accountants on Accounting and Financial Disclosure None. Item 9A. Controls and Procedures Evaluation of Disclosure Controls and Procedures Norfolk Southern’s Chief Executive Officer and Chief Financial Officer, with the assistance of management, evaluated the effectiveness of NS’ disclosure controls and procedures (as such term is defined in Rules 13a-15(e) and 15d-15(e) under the Securities Exchange Act of 1934, as amended (the “Exchange Act”)) as of December 31, 2008. Based on such evaluation, such officers have concluded that, as of December 31, 2008, NS’ disclosure controls and procedures were effective to ensure that information required to be disclosed in NS’ reports under the Exchange Act is recorded, processed, summarized, and reported, within the time period specified in the SEC’s rules and forms, and that such information is accumulated and communicated to management, including the Chief Executive Officer and the Chief Financial Officer, as appropriate, to allow timely decisions regarding required disclosure. Internal Control Over Financial Reporting The management of Norfolk Southern is responsible for establishing and maintaining adequate internal control over financial reporting. Norfolk Southern’s internal control over financial reporting includes those policies and procedures that pertain to its ability to record, process, summarize, and report reliable financial data. Management recognizes that there are inherent limitations in the effectiveness of any internal control over financial reporting, including the possibility of human error and the circumvention or overriding of internal control. Accordingly, even effective internal control over financial reporting can provide only reasonable assurance with respect to financial statement preparation. Further, because of changes in conditions, the effectiveness of internal control over financial reporting may vary over time. In order to ensure that Norfolk Southern’s internal control over financial reporting is effective, management regularly assesses such controls and did so most recently for its financial reporting as of December 31, 2008. This assessment was based on criteria for effective internal control over financial reporting set forth by the Committee of Sponsoring Organizations of the Treadway Commission (COSO) in Internal Control-Integrated Framework. Based on our assessment, management has concluded that Norfolk Southern maintained effective internal control over financial reporting as of December 31, 2008. The Board of Directors, acting through its Audit Committee, is responsible for the oversight of Norfolk Southern’s accounting policies, financial reporting and internal control. The Audit Committee of the Board of Directors is comprised entirely of outside directors who are independent of management. The independent registered public accounting firm and the internal auditors have full and unlimited access to the Audit Committee, with or without management, to discuss the adequacy of internal control over financial reporting, and any other matters which they believe should be brought to the attention of the Audit Committee.
Norfolk Southern’s management has issued a report of its assessment of internal control over financial reporting, and Norfolk Southern’s independent registered public accounting firm has issued an attestation report on Norfolk Southern’s internal controls over financial reporting as of December 31, 2008. These reports appear in Part II, Item 8 of this report on Form 10-K. During the fourth quarter of 2008, management has not identified any changes in internal controls over financial reporting that have materially affected, or are reasonably likely to materially affect, NS’ internal control over financial reporting. Item 9B. Other Information None.
K78
PART III
NORFOLK SOUTHERN CORPORATION AND SUBSIDIARIES (NS) Item 10. Directors, Executive Officers and Corporate Governance In accordance with General Instruction G(3), information called for by Item 10, Part III, is incorporated herein by reference from the information appearing under the caption “Election of Directors,” under the caption “Section 16(a) Beneficial Ownership Reporting Compliance,” under the caption “Corporate Governance,” and under the caption “Committees” in Norfolk Southern’s definitive Proxy Statement for the Annual Meeting of Stockholders to be held on May 14, 2009, which definitive Proxy Statement will be filed electronically with the Securities and Exchange Commission (Commission) pursuant to Regulation 14A. The information regarding executive officers called for by Item 401 of Regulation S-K is included in Part I hereof beginning under “Executive Officers of the Registrant.” Item 11. Executive Compensation In accordance with General Instruction G(3), information called for by Item 11, Part III, is incorporated herein by reference from the information:
• appearing under the subcaption “Compensation” under the caption “Board of Directors” for directors, including the “2008 Non-Employee Director Compensation Table” and the “Narrative to Non-Employee Director Compensation Table;”
• appearing under the caption “Executive Compensation” for executives, including the “Compensation Discussion and Analysis,” the information appearing in the “Summary Compensation Table” and the “2008 Grants of Plan-Based Awards” table, including the narrative to such tables, the “Outstanding Equity Awards at Fiscal Year-End 2008” and “Option Exercises and Stock Vested in 2008” tables, and the tabular and narrative information appearing under the subcaptions “Retirement Benefits,” “Deferred Compensation,” and “Potential Payments Upon a Change in Control or Other Termination of Employment;” and
• appearing under the captions “Compensation Committee Interlocks and Insider Participation” and “Compensation Committee Report,”
in each case included in Norfolk Southern’s definitive Proxy Statement for the Annual Meeting of Stockholders to be held on May 14, 2009, which definitive Proxy Statement will be filed electronically with the Commission pursuant to Regulation 14A. Item 12. Security Ownership of Certain Beneficial Owners and Management and Related Stockholder Matters In accordance with General Instruction G(3), information on security ownership of certain beneficial owners and management called for by Item 12, Part III, Item 403 of Regulation S-K, is incorporated herein by reference from the information appearing under the caption “Beneficial Ownership of Stock” in Norfolk Southern’s definitive Proxy Statement for the Annual Meeting of Stockholders to be held on May 14, 2009, which definitive Proxy Statement will be filed electronically with the Commission pursuant to Regulation 14A.

K79
Equity Compensation Plan Information (as of December 31, 2008) Number of securities remaining available Number of
securities Weighted-
average for future issuance
under equity
to be issued upon Exercise price compensation plans exercise of of outstanding (excluding
Plan outstanding options, options, warrants securities reflected Category warrants and rights and rights in column (a))
(a) (b) (c) Equity compensation plans approved by security holders(1) 14,937,465 (3) $ 31.26 (5) 6,837,414 (6)
Equity compensation plans not approved by security holders(2) 1,946,100 (4) $ 35.52 2,072,420 (7)
Total 16,883,565 8,909,834 1 The Long-Term Incentive Plan, excluding five million shares for broad-based issuance to non-officers. 2 The Long-Term Incentive Plan’s five million shares for broad-based issuance to non-officers, the Thoroughbred Stock Option Plan and the Directors’ Restricted Stock Plan. 3 Includes options, restricted stock units and performance share units granted under the Long-Term Incentive Plan that may be settled in shares of stock. 4 Includes options granted under the Long-Term Incentive Plan on 428,168 shares for non-officers and options granted
under the Thoroughbred Stock Option Plan. 5 Calculated without regard to 2,598,842 outstanding restricted stock units and performance share units at December 31, 2008. 6 Of the shares remaining available for grant under plans approved by stockholders, 5,582,679 are available for grant as restricted shares, performance shares or restricted stock unit shares under the Long-Term Incentive Plan. 7 Of the shares remaining available for grant under plans not approved by stockholders, 30,000 are available for grant as restricted stock under the Directors’ Restricted Stock Plan. Norfolk Southern Corporation Long-Term Incentive Plan (“LTIP”) Established on June 28, 1983, and approved by stockholders at their Annual Meeting held on May 10, 1984, LTIP was adopted to promote the success of Norfolk Southern by providing an opportunity for non-employee directors, officers and other key employees to acquire a proprietary interest in the Corporation. On January 23, 2001, the Board of Directors further amended LTIP and approved the issuance of an additional 5,000,000 shares of authorized but unissued Common Stock under LTIP to participants who are not officers of Norfolk Southern. The issuance of these shares was broadly-based, and stockholder approval of these shares was not required. Accordingly, this portion of LTIP is included in the number of securities available for future issuance for plans not approved by stockholders. Also on January 23, 2001, the Board amended LTIP, which amendment was approved by shareholders on May 10, 2001, that included the reservation for issuance of an additional 30,000,000 shares of authorized but unissued Norfolk Southern Common Stock. Pursuant to another amendment approved by stockholders on May 12, 2005, not more than 8,500,000 of the shares remaining available for issuance under LTIP may be awarded as restricted shares, performance shares or restricted stock unit shares. Cash payments of restricted stock units, stock appreciation rights, and performance share units will not be applied against the maximum number of shares issuable under LTIP. Any shares of Common Stock

K80
subject to options, performance share units, restricted shares or restricted stock units which are not issued as Common Stock will again be available for award under LTIP after the expiration or forfeiture of an award. Non-employee directors, officers and other key employees residing in the United States or Canada are eligible for selection to receive LTIP awards. Under LTIP, the Compensation Committee (Committee) may grant incentive stock options, nonqualified stock options, stock appreciation rights, restricted shares, restricted stock units, and performance share units. In addition, dividend equivalents may be awarded for options, restricted stock units, and performance share units. The Committee may make awards under LTIP subject to forfeiture under certain circumstances and may establish such other terms and conditions for the awards as provided in LTIP. For options, the option price per share will not be less than 100% of the fair market value of Norfolk Southern’s Common Stock on the effective date the option is granted. All options are subject to a vesting period of at least one year, and the term of the option will not exceed ten years. LTIP specifically prohibits option repricing without stockholder approval, except for capital adjustments. Performance share units entitle a recipient to receive performance-based compensation at the end of a three-year performance cycle based on Norfolk Southern’s performance during that three-year period. For the 2008 performance share unit awards, corporate performance will be measured using three equally weighted standards established by the Committee: (1) three-year average return on average capital invested, (2) three-year average operating ratio, and (3) three-year total return to stockholders as compared with the average total return on all stocks comprising the S&P 500 composite stock price index. Performance share units may be payable in either shares of Norfolk Southern Common Stock or cash. Restricted stock units are payable in cash or in shares of Norfolk Southern Common Stock at the end of a restriction period of not less than 36 months and not more than 60 months. During the restriction period, the holder of the restricted stock units has no beneficial ownership interest in the Norfolk Southern Common Stock represented by the restricted stock units and has no right to vote the shares represented by the units or to receive dividends (except for dividend equivalent rights that may be awarded with respect to the restricted stock units). The Committee at its discretion may waive the restriction period. Norfolk Southern Corporation Thoroughbred Stock Option Plan The Board adopted the Norfolk Southern Corporation Thoroughbred Stock Option Plan (“TSOP”) on January 26, 1999, to promote the success of Norfolk Southern by providing an opportunity for nonagreement employees to acquire a proprietary interest in Norfolk Southern and thereby to provide an additional incentive to nonagreement employees to devote their maximum efforts and skills to the advancement, betterment, and prosperity of Norfolk Southern and its stockholders. Under the TSOP there were 6,000,000 shares of authorized but unissued Common Stock reserved for issuance. TSOP has not been and is not required to have been approved by stockholders. Active full-time nonagreement employees residing in the United States or Canada are eligible for selection to receive TSOP awards. Under TSOP, the Committee may grant nonqualified stock options subject to such terms and conditions as provided in TSOP. The option price will not be less than 100% of the fair market value of Norfolk Southern’s Common Stock on the effective date the options are granted. All options are subject to a vesting period of at least one year, and the term of the option will not exceed ten years. Options awarded in 2008 are subject to a three-year vesting period. TSOP specifically prohibits option repricing without stockholder approval, except for capital adjustments.

K81
Norfolk Southern Corporation Directors’ Restricted Stock Plan The Norfolk Southern Corporation Directors’ Restricted Stock Plan (“Plan”) was adopted on January 1, 1994, and is designed to increase ownership of Norfolk Southern Common Stock by its non-employee directors so as to further align their ownership interest in Norfolk Southern with that of stockholders. The Plan has not been and is not required to have been approved by stockholders. Currently, a maximum of 66,000 shares of Norfolk Southern Common Stock may be granted under the Plan. To make grants to eligible directors, Norfolk Southern purchases, through one or more subsidiary companies, the number of shares required in open-market transactions at prevailing market prices, or makes such grants from Norfolk Southern Common Stock already owned by one or more of Norfolk Southern’s subsidiary companies. Only non-employee directors who are not and never have been employees of Norfolk Southern are eligible to participate in the Plan. Upon becoming a director, each eligible director receives a one-time grant of 3,000 restricted shares of Norfolk Southern Common Stock. No individual member of the Board exercises discretion concerning the eligibility of any director or the number of shares granted. The restriction period applicable to restricted shares granted under the Plan begins on the date of the grant and ends on the earlier of the recipient’s death or six months after the recipient ceases to be a director by reason of disability or retirement. During the restriction period shares may not be sold, pledged, or otherwise encumbered. Directors will forfeit the restricted shares if they cease to serve as a director of Norfolk Southern for reasons other than their disability, retirement, or death. Item 13. Certain Relationships and Related Transactions, and Director Independence In accordance with General Instruction G(3), information called for by Part III, Item 13, is incorporated herein by reference from the information appearing under the caption “Transactions with Related Persons” and under the caption “Director Independence” in Norfolk Southern’s definitive Proxy Statement for the Annual Meeting of Stockholders to be held on May 14, 2009, which definitive Proxy Statement will be filed electronically with the Commission pursuant to Regulation 14A. Item 14. Principal Accountant Fees and Services In accordance with General Instruction G(3), information called for by Part III, Item 14, is incorporated herein by reference from the information appearing under the caption “Ratification of Appointment of Independent Registered Public Accounting Firm” in Norfolk Southern’s definitive Proxy Statement for the Annual Meeting of Stockholders to be held on May 14, 2009, which definitive proxy statement will be filed electronically with the Commission pursuant to Regulation 14A.
K82
PART IV
NORFOLK SOUTHERN CORPORATION AND SUBSIDIARIES (NS)
Item 15. Exhibits and Financial Statement Schedules Page (A) The following documents are filed as part of this report: 1. Index to Consolidated Financial Statements Report of Management K42 Reports of Independent Registered Public Accounting Firm K43 Consolidated Statements of Income, Years ended December 31, 2008, 2007 and 2006 K45 Consolidated Balance Sheets as of December 31, 2008 and 2007 K46 Consolidated Statements of Cash Flows, Years ended December 31, 2008, 2007 and 2006 K47 Consolidated Statements of Changes in Stockholders’ Equity, Years ended K48 December 31, 2008, 2007 and 2006 Notes to Consolidated Financial Statements K49 2. Financial Statement Schedule: The following consolidated financial statement schedule should be read in connection with the consolidated financial statements: Index to Consolidated Financial Statement Schedule Page Schedule II - Valuation and Qualifying Accounts K95
Schedules other than the one listed above are omitted either because they are not required or are inapplicable, or because the information is included in the consolidated financial statements or related notes.
3. Exhibits Exhibit Number Description 3 Articles of Incorporation and Bylaws - 3(i) The Restated Articles of Incorporation of Norfolk Southern Corporation are incorporated by
reference to Exhibit 3(i) to Norfolk Southern Corporation’s 10-K filed on March 5, 2001. 3(ii) The Bylaws of Norfolk Southern Corporation, as amended effective January 27, 2009, are
incorporated by reference to Exhibit 3(ii) to Norfolk Southern Corporation’s Form 8-K filed on January 30, 2009.
4 Instruments Defining the Rights of Security Holders, Including Indentures: (a) Indenture, dated as of January 15, 1991, from Norfolk Southern Corporation to First Trust of
New York, National Association, as Trustee, is incorporated by reference to Exhibit 4.1 to Norfolk Southern Corporation’s Registration Statement on Form S-3 (No. 33-38595).

K83
(b) First Supplemental Indenture, dated May 19, 1997, between Norfolk Southern Corporation and
First Trust of New York, National Association, as Trustee, related to the issuance of notes in the principal amount of $4.3 billion, is incorporated herein by reference to Exhibit 1.1(d) to Norfolk Southern Corporation’s Form 8-K filed on May 21, 1997.
(c) Second Supplemental Indenture, dated April 26, 1999, between Norfolk Southern Corporation
and U.S. Bank Trust National Association, as Trustee, related to the issuance of notes in the principal amount of $400 million, is incorporated herein by reference to Exhibit 1.1(c) to Norfolk Southern Corporation’s Form 8-K filed on April 30, 1999.
(d) Third Supplemental Indenture, dated May 23, 2000, between Norfolk Southern Corporation and
U.S. Bank Trust National Association, as Trustee, related to the issuance of notes in the principal amount of $600 million, is incorporated herein by reference to Exhibit 4.1 to Norfolk Southern Corporation’s Form 8-K filed on May 25, 2000.
(e) Fourth Supplemental Indenture, dated as of February 6, 2001, between Norfolk Southern
Corporation and U.S. Bank Trust National Association, as Trustee, related to the issuance of notes in the principal amount of $1 billion, is incorporated herein by reference to Exhibit 4.1 to Norfolk Southern Corporation’s Form 8-K filed on February 7, 2001.
(f) Sixth Supplemental Indenture, dated as of April 30, 2002, between Norfolk Southern
Corporation and U.S. Bank Trust National Association, as Trustee, relating to the issuance of notes in the principal amount of $200 million, is incorporated herein by reference to Exhibit 4.1 to Norfolk Southern Corporation’s Form 8-K filed on May 1, 2002.
(g) Eighth Supplemental Indenture, dated as of September 17, 2004, between Norfolk Southern
Corporation and U.S. Bank Trust National Association, as Trustee, relating to the issuance of 5.257% Notes due 2014 (“Securities”) in the aggregate principal amount of $441.5 million in connection with Norfolk Southern Corporation’s offer to exchange the Securities and cash for up to $400 million of its outstanding 7.350% Notes due 2007, is incorporated herein by reference to Exhibit 4.1 to Norfolk Southern Corporation’s Form 8-K filed on September 23, 2004.
(h) Indenture, dated August 27, 2004, among PRR Newco, Inc., as Issuer, and Norfolk Southern
Railway Company, as Guarantor, and The Bank of New York, as Trustee, is incorporated herein by reference to Exhibit 4(l) to Norfolk Southern Corporation’s Form 10-Q filed on October 28, 2004.
(i) First Supplemental Indenture, dated August 27, 2004, among PRR Newco, Inc., as Issuer, and
Norfolk Southern Railway Company, as Guarantor, and The Bank of New York, as Trustee, related to the issuance of notes in the principal amount of approximately $451.8 million, is incorporated herein by reference to Exhibit 4(m) to Norfolk Southern Corporation’s Form 10-Q filed on October 28, 2004.
(j) Ninth Supplemental Indenture, dated as of March 11, 2005, between Norfolk Southern
Corporation and U.S. Bank Trust National Association, as Trustee, relating to the issuance of notes in the principal amount of $300 million, is incorporated herein by reference to Exhibit 4.1 to Norfolk Southern Corporation’s Form 8-K filed on March 15, 2005.
(k) Tenth Supplemental Indenture, dated as of May 17, 2005, between Norfolk Southern
Corporation and U.S. Bank Trust National Association, as Trustee, relating to the issuance of notes in the principal amount of $366.6 million, is incorporated herein by reference to Exhibit 99.1 to Norfolk Southern Corporation’s Form 8-K filed on May 18, 2005.

K84
(l) Eleventh Supplemental Indenture, dated as of May 17, 2005, between Norfolk Southern
Corporation and U.S. Bank Trust National Association, as Trustee, relating to the issuance of notes in the principal amount of $350 million, is incorporated herein by reference to Exhibit 99.2 to Norfolk Southern Corporation’s Form 8-K filed on May 18, 2005.
(m) Indenture, dated as of April 4, 2008, between Norfolk Southern Corporation and U.S. Bank
Trust National Association, as Trustee, relating to the issuance of notes in the principal amount of $600 million, is incorporated herein by reference to Exhibit 4.1 to Norfolk Southern Corporation’s Form 8-K filed on April 9, 2008.
(n) Indenture, dated as of January 15, 2009, between Norfolk Southern Corporation and U.S. Bank
trust National Association, as Trustee, relating to the issuance of notes in the principal amount of $500 million, is incorporated herein by reference to Exhibit 4.1 to Norfolk Southern Corporation’s Form 8-K filed on January 20, 2009.
(o) Registration Rights Agreement, dated as of January 15, 2009, among Norfolk Southern
Corporation and Citigroup Global Markets Inc., J.P. Morgan Securities Inc and UBS Securities LLC, is incorporated herein by reference to Exhibit 4.2 to Norfolk Southern Corporation’s Form 8-K filed on January 20, 2009.
(p) In accordance with Item 601(b)(4)(iii) of Regulation S-K, copies of other instruments of
Norfolk Southern Corporation and its subsidiaries with respect to the rights of holders of long-term debt are not filed herewith, or incorporated by reference, but will be furnished to the Commission upon request.
10 Material Contracts - (a) The Transaction Agreement, dated as of June 10, 1997, by and among CSX, CSX
Transportation, Inc., Registrant, Norfolk Southern Railway Company, Conrail Inc., Consolidated Rail Corporation, and CRR Holdings LLC, with certain schedules thereto, previously filed, is incorporated herein by reference to Exhibit 10(a) to Norfolk Southern Corporation’s Form 10-K filed on February 24, 2003.
(b) Amendment No. 1, dated as of August 22, 1998, to the Transaction Agreement, dated as of June
10, 1997, by and among CSX Corporation, CSX Transportation, Inc., Norfolk Southern Corporation, Norfolk Southern Railway Company, Conrail Inc., Consolidated Rail Corporation, and CRR Holdings LLC, is incorporated herein by reference from Exhibit 10.1 to Norfolk Southern Corporation’s Form 10-Q filed on August 11, 1999.
(c) Amendment No. 2, dated as of June 1, 1999, to the Transaction Agreement, dated June 10,
1997, by and among CSX Corporation, CSX Transportation, Inc., Norfolk Southern Corporation, Norfolk Southern Railway Company, Conrail Inc., Consolidated Rail Corporation, and CRR Holdings LLC, is incorporated herein by reference from Exhibit 10.2 to Norfolk Southern Corporation’s Form 10-Q filed on August 11, 1999.
(d) Amendment No. 3, dated as of June 1, 1999, and executed in April 2004, to the Transaction
Agreement, dated June 10, 1997, by and among CSX Corporation, CSX Transportation, Inc., Norfolk Southern Corporation, Norfolk Southern Railway Company, Conrail Inc., Consolidated Rail Corporation, and CRR Holdings LLC, is incorporated herein by reference to Exhibit 10(dd) to Norfolk Southern Corporation’s Form 10-Q filed on July 30, 2004.

K85
(e) Amendment No. 5 to the Transaction Agreement, dated as of August 27, 2004, by and among
CSX Corporation, CSX Transportation, Inc., Norfolk Southern Corporation, Norfolk Southern Railway Company, Conrail Inc., Consolidated Rail Corporation, and CRR Holdings LLC, is incorporated herein by reference to Exhibit 10.1 to Norfolk Southern Corporation’s Form 8-K filed on September 2, 2004.
(f) Amendment No. 6, dated as of April 1, 2007, to the Transaction Agreement dated June 10,
1997, by and among CSX Corporation, CSX Transportation, Inc., Norfolk Southern Railway Company, Conrail Inc., Consolidated Rail Corporation, and CRR Holdings LLC is incorporated herein by reference to Exhibit 10.5 to Norfolk Southern Corporation’s Form 10-Q filed on July 27, 2007.
(g) Shared Assets Area Operating Agreement for North Jersey, dated as of June 1, 1999, by and
among Consolidated Rail Corporation, CSX Transportation, Inc., and Norfolk Southern Railway Company, with exhibit thereto, is incorporated herein by reference from Exhibit 10.4 to Norfolk Southern Corporation’s Form 10-Q filed on August 11, 1999.
(h) Shared Assets Area Operating Agreement for Detroit, dated as of June 1, 1999, by and among
Consolidated Rail Corporation, CSX Transportation, Inc., and Norfolk Southern Railway Company, with exhibit thereto, is incorporated herein by reference from Exhibit 10.6 to Norfolk Southern Corporation’s Form 10-Q filed on August 11, 1999.
(i) Shared Assets Area Operating Agreement for South Jersey/Philadelphia, dated as of June 1,
1999, by and among Consolidated Rail Corporation, CSX Transportation Inc., and Norfolk Southern Railway Company, with exhibit thereto, is incorporated herein by reference from Exhibit 10.5 to Norfolk Southern Corporation’s Form 10-Q filed on August 11, 1999.
(j) Amendment No. 1, dated as of June 1, 2000, to the Shared Assets Areas Operating Agreement
for North Jersey, South Jersey/Philadelphia, and Detroit, dated as of June 1, 1999, by and among Consolidated Rail Corporation, CSX Transportation, Inc., and Norfolk Southern Railway Company, with exhibit thereto, is incorporated herein by reference to Exhibit 10(h) to Norfolk Southern Corporation’s 10-K filed on March 5, 2001.
(k) Amendment No. 2, dated as January 1, 2001, to the Shared Assets Area Operating Agreements
for North Jersey, South Jersey/Philadelphia, and Detroit, dated as of June 1, 1999, by and among Consolidated Rail Corporation, CSX Transportation, Inc., and Norfolk Southern Railway Company, with exhibit thereto, is incorporated herein by reference to Exhibit 10(j) to Norfolk Southern Corporation’s Form 10-K filed on February 21, 2002.
(l) Amendment No. 3, dated as of June 1, 2001, and executed in May of 2002, to the Shared Assets
Area Operating Agreement for North Jersey, South Jersey/Philadelphia, and Detroit, dated as of June 1, 1999, by and among Consolidated Rail Corporation, CSX Transportation, Inc., and Norfolk Southern Railway Company, with exhibit thereto, is incorporated herein by reference to Exhibit 10(k) to Norfolk Southern Corporation’s Form 10-K filed on February 24, 2003.
(m) Amendment No. 4, dated as of June 1, 2005, and executed in late June 2005, to the Shared
Assets Area Operating Agreement for North Jersey, South Jersey/Philadelphia, and Detroit, dated as of June 1, 1999, by and among Consolidated Rail Corporation, CSX Transportation, Inc., and Norfolk Southern Railway Company, with exhibits thereto, is incorporated herein by reference to Exhibit 99 to Norfolk Southern Corporation’s Form 8-K filed on July 1, 2005.

K86
(n) Monongahela Usage Agreement, dated as of June 1, 1999, by and among CSX
Transportation, Inc., Norfolk Southern Railway Company, Pennsylvania Lines LLC, and New York Central Lines LLC, with exhibit thereto, is incorporated herein by reference from Exhibit 10.7 to Norfolk Southern Corporation’s Form 10-Q filed on August 11, 1999.
(o) The Agreement, entered into as of July 27, 1999, between North Carolina Railroad Company
and Norfolk Southern Railway Company, is incorporated herein by reference from Exhibit 10(i) to Norfolk Southern Corporation’s Form 10-K filed on March 6, 2000.
(p) First Amendment dated March 19, 2007, to the Master Agreement dated July 27, 1999, by
and between North Carolina Railroad Company and Norfolk Southern Railway Company is incorporated herein by reference to Exhibit 10.3 to Norfolk Southern Corporation’s Form 10-Q filed on July 27, 2007.
(q) The Supplementary Agreement, entered into as of January 1, 1987, between the Trustees of the
Cincinnati Southern Railway and The Cincinnati, New Orleans and Texas Pacific Railway Company (the latter a wholly owned subsidiary of Norfolk Southern Railway Company) – extending and amending a Lease, dated as of October 11, 1881 - is incorporated by reference to Exhibit 10(k) to Norfolk Southern Corporation’s Form 10-K filed on March 5, 2001.
(r)* The Norfolk Southern Corporation Executive Management Incentive Plan, effective
January 25, 2005, is incorporated by reference herein from Exhibit 99 to Norfolk Southern Corporation’s Form 8-K filed on May 13, 2005.
(s)* The Norfolk Southern Corporation Officers’ Deferred Compensation Plan, as amended
effective September 26, 2000, is incorporated herein by reference to Exhibit 10(n) to Norfolk Southern Corporation’s Form 10-K filed on March 5, 2001.
(t)* The Norfolk Southern Corporation Executives’ Deferred Compensation Plan, as amended
effective January 20, 2001, is incorporated herein by reference to Exhibit 10(o) to Norfolk Southern Corporation’s Form 10-K filed on March 5, 2001.
(u)* The Directors’ Deferred Fee Plan of Norfolk Southern Corporation, as amended effective
January 23, 2001, is incorporated herein by reference to Exhibit 10(p) to Norfolk Southern Corporation’s Form 10-K filed on March 5, 2001.
(v)* The Norfolk Southern Corporation Directors’ Restricted Stock Plan, effective January 1,
1994, as restated November 24, 1998, is incorporated herein by reference from Exhibit 10(h) to Norfolk Southern Corporation’s Form 10-K filed on March 24, 1999.
(w)* Form of Severance Agreement, dated as of June 1, 1996, between Norfolk Southern
Corporation and certain executive officers (including those defined as “named executive officers” and identified in the Corporation’s Proxy Statement for the 1997 through 2001 Annual Meetings of Stockholders), is incorporated herein by reference to Exhibit 10(t) to Norfolk Southern Corporation’s Form 10-K filed on February 21, 2002.
(x)*,** Supplemental Benefit Plan of Norfolk Southern Corporation and Participating Subsidiary
Companies, as amended effective January 1, 2009. (y)* The Norfolk Southern Corporation Directors’ Charitable Award Program, as amended
effective July 2007, is incorporated herein by reference to Exhibit 10.6 to Norfolk Southern Corporation’s Form 10-Q filed on July 27, 2007.
K87
(z)* The Norfolk Southern Corporation Outside Directors’ Deferred Stock Unit Program, as amended effective January 22, 2008, is incorporated herein by reference to Exhibit 10.1 to Norfolk Southern Corporation’s Form 8-K filed on January 25, 2008.
(aa)* Form of Agreement, dated as of October 1, 2001, providing enhanced pension benefits to
three officers in exchange for their continued employment with Norfolk Southern Corporation for two years, is incorporated herein by reference to Exhibit 10(w) to Norfolk Southern Corporation’s Form 10-Q filed on November 9, 2001. The agreement was entered into with L. Ike Prillaman, former Vice Chairman and Chief Marketing Officer; Stephen C. Tobias, Vice Chairman and Chief Operating Officer; and Henry C. Wolf, former Vice Chairman and Chief Financial Officer.
(bb) The Norfolk Southern Corporation Thoroughbred Stock Option Plan, as amended effective
January 28, 2003, is incorporated herein by reference to Exhibit 10(z) to Norfolk Southern Corporation’s Form 10-K filed on February 24, 2003.
(cc)* The Norfolk Southern Corporation Restricted Stock Unit Plan, effective January 28, 2003, is
incorporated herein by reference to Exhibit 10(bb) to Norfolk Southern Corporation’s Form 10-K filed on February 24, 2003.
(dd)*,** The Norfolk Southern Corporation Executive Life Insurance Plan, as amended and restated
effective January 1, 2009. (ee) Distribution Agreement, dated as of July 26, 2004, by and among CSX Corporation, CSX
Transportation, Inc., CSX Rail Holding Corporation, CSX Northeast Holdings Corporation, Norfolk Southern Corporation, Norfolk Southern Railway Company, CRR Holdings LLC, Green Acquisition Corp., Conrail Inc., Consolidated Rail Corporation, New York Central Lines LLC, Pennsylvania Lines LLC, NYC Newco, Inc., and PRR Newco, Inc., is incorporated herein by reference to Exhibit 2.1 to Norfolk Southern Corporation’s Form 8-K filed on September 2, 2004.
(ff) Tax Allocation Agreement, dated as of August 27, 2004, by and among Green Acquisition
Corp., Conrail Inc., Consolidated Rail Corporation, New York Central Lines LLC, and Pennsylvania Lines LLC, is incorporated herein by reference to Exhibit 10.2 to Norfolk Southern Corporation’s Form 8-K filed on September 2, 2004.
(gg) Amended and Restated Credit Agreement dated as of June 26, 2007, with respect to the
Registrant’s $1 billion unsecured revolving credit facility, is incorporated herein by reference to Exhibit 99 to Norfolk Southern Corporation’s Form 8-K filed on June 27, 2007.
(hh)* The description of Norfolk Southern Corporation’s executive physical reimbursement for
non-employee directors and certain executives is incorporated herein by reference to Norfolk Southern Corporation’s Form 8-K filed on July 28, 2005.
(ii)* Form of 2005 Incentive Stock Option and Non-Qualified Stock Option Agreement under the
Norfolk Southern Long-Term Incentive Plan, is incorporated herein by reference to Exhibit 99 to Norfolk Southern Corporation’s Form 8-K filed on January 7, 2005.
(jj)* Form of 2005 Restricted Share Agreement under the Norfolk Southern Long-Term Incentive
Plan, is incorporated herein by reference to Exhibit 99 to Norfolk Southern Corporation’s Form 8-K filed on January 7, 2005.
K88
(kk)* Form of 2006 Incentive Stock Option and Non-Qualified Stock Option Agreement under the
Norfolk Southern Long-Term Incentive Plan, is incorporated herein by reference to Exhibit 99 to Norfolk Southern Corporation’s Form 8-K/A filed on December 7, 2005.
(ll)* Form of 2005 Restricted Stock Unit Agreement under the Norfolk Southern Long-Term
Incentive Plan, is incorporated herein by reference to Exhibit 99 to Norfolk Southern Corporation’s Form 8-K filed on January 7, 2005.
(mm)* Form of 2006 Restricted Share and Restricted Stock Unit Agreement under the Norfolk
Southern Corporation Long-Term Incentive Plan, is incorporated herein by reference to Exhibit 99 to Norfolk Southern Corporation’s Form 8-K/A filed on December 7, 2005.
(nn)* Form of 2006 Performance Share Unit Award under the Norfolk Southern Corporation
Long-Term Incentive Plan, is incorporated herein by reference to Exhibit 99 to Norfolk Southern Corporation’s Form 8-K/A filed on December 7, 2005.
(oo) The Transaction Agreement, dated as of December 1, 2005, by and among Norfolk Southern
Corporation, The Alabama Great Southern Railroad Company, Kansas City Southern, and The Kansas City Southern Railway Company is incorporated herein by reference to Exhibit 10.(ll) to Norfolk Southern Corporation’s Form 10-K filed on February 23, 2006 (Exhibits, annexes and schedules omitted. The Registrant will furnish supplementary copies of such materials to the SEC upon request).
(pp) Amendment No. 1, dated as of January 17, 2006, by and among Norfolk Southern
Corporation, The Alabama Great Southern Railroad Company, Kansas City Southern, and the Kansas City Southern Railroad is incorporated herein by reference to Exhibit 10.(mm) to Norfolk Southern Corporation’s Form 10-K filed on February 23, 2006.
(qq) Amendment No. 2, dated as of May 1, 2006, to the Transaction Agreement, dated as of
December 1, 2005, by and among Norfolk Southern Corporation, The Alabama Great Southern Railroad Company, Kansas City Southern, and The Kansas City Southern Railway Company is incorporated herein by reference to Exhibit 10.1 to Norfolk Southern Corporation’s Form 8-K filed on May 4, 2006.
(rr)* The retirement agreement, dated January 27, 2006, between Norfolk Southern Corporation
and David R. Goode, is incorporated herein by reference to Exhibit 10.1 to Norfolk Southern Corporation’s Form 8-K filed on January 27, 2006.
(ss)* The waiver agreement, dated January 27, 2006, between Norfolk Southern Corporation and
David R. Goode, providing for the waiver of forfeiture provisions otherwise applicable to certain restricted shares and restricted stock units upon retirement, is incorporated herein by reference to Exhibit 10.2 to Norfolk Southern Corporation’s Form 8-K filed on January 27, 2006.
(tt)* Revised fees for outside directors are incorporated herein by reference to Norfolk Southern
Corporation’s Form 8-K filed on January 27, 2006. (uu)* The retirement agreement, dated March 28, 2006, between Norfolk Southern Corporation and
L. Ike Prillaman, is incorporated herein by reference to Exhibit 10.1 to Norfolk Southern Corporation’s Form 8-K filed on March 31, 2006.
K89
(vv)* The waiver agreement, dated March 28, 2006, between Norfolk Southern
Corporation and L. Ike Prillaman, providing for the waiver of forfeiture provisions otherwise applicable to certain restricted shares and restricted stock units upon retirement, is incorporated herein by reference to Exhibit 10.2 to Norfolk Southern Corporation’s Form 8-K filed on March 31, 2006.
(ww) Limited Liability Company Agreement of Meridian Speedway, LLC, dated as of
May 1, 2006, by and among The Alabama Great Southern Railroad Company and Kansas City Southern is incorporated herein by reference to Exhibit 10.2 to Norfolk Southern Corporation’s Form 8-K filed on May 4, 2006.
(xx)* The Norfolk Southern Corporation Long-Term Incentive Plan, as amended effective
July 25, 2006, is incorporated herein by reference to Exhibit 10.3 to Norfolk Southern Corporation’s Form 10-Q filed on July 28, 2006.
(yy)* Form of Norfolk Southern Corporation Long-Term Incentive Plan, 2007 Award
Agreement is incorporated herein by reference to Exhibit 10.1 to Norfolk Southern Corporation’s Form 8-K filed on January 11, 2007.
(zz)*,** Retirement Plan of Norfolk Southern Corporation and Participating Subsidiary
Companies effective June 1, 1982, amended effective January 1, 2009. (aaa)* The retirement agreement between Norfolk Southern Corporation and Henry C.
Wolf is incorporated herein by reference to Exhibit 10.1 to Norfolk Southern Corporation’s Form 8-K filed on May 11, 2007.
(bbb)* The waiver agreement between Norfolk Southern Corporation and Henry C. Wolf is
incorporated herein by reference to Exhibit 10.2 to Norfolk Southern Corporation’s Form 8-K filed on May 11, 2007.
(ccc) Transfer and Administration Agreement dated as of November 8, 2007, with respect to
the Registrant’s $500 million receivables securitization facility is incorporated herein by reference to Exhibit 99 to Norfolk Southern Corporation’s Form 8-K filed on November 14, 2007.
(ddd)* Form of Norfolk Southern Corporation Long-Term Incentive Plan 2008 Award
Agreement is incorporated herein by reference to Exhibit 99 to Norfolk Southern Corporation’s Form 8-K filed on November 20, 2007.
(eee) Dealer Agreement dated as of January 23, 2008, between the Registrant and J. P.
Morgan Securities Inc. is incorporated herein by reference to Exhibit 10.1 to Norfolk Southern Corporation’s Form 8-K filed on January 25, 2008.
(fff) Dealer Agreement dated as of January 23, 2008, between the Registrant and
Goldman, Sachs & Co. is incorporated herein by reference to Exhibit 10.2 to Norfolk Southern Corporation’s Form 8-K filed on January 25, 2008.
(ggg)* 2008 Award Agreement between Norfolk Southern Corporation and Gerald L.
Baliles, dated January 24, 2008, is incorporated herein by reference to Exhibit 10.2 to Norfolk Southern Corporation’s Form 8-K filed on January 25, 2008.
K90
(hhh)* 2008 Award Agreement between Norfolk Southern Corporation and Daniel A. Carp,
dated January 24, 2008, is incorporated herein by reference to Exhibit 10.3 to Norfolk Southern Corporation’s Form 8-K filed on January 25, 2008.
(iii)* 2008 Award Agreement between Norfolk Southern Corporation and Gene R. Carter,
dated January 24, 2008, is incorporated herein by reference to Exhibit 10.4 to Norfolk Southern Corporation’s Form 8-K filed on January 25, 2008.
(jjj)* 2008 Award Agreement between Norfolk Southern Corporation and Alston D.
Correll, dated January 24, 2008, is incorporated herein by reference to Exhibit 10.5 to Norfolk Southern Corporation’s Form 8-K filed on January 25, 2008.
(kkk)* 2008 Award Agreement between Norfolk Southern Corporation and Landon
Hilliard, dated January 24, 2008, is incorporated herein by reference to Exhibit 10.6 to Norfolk Southern Corporation’s Form 8-K filed on January 25, 2008.
(lll)* 2008 Award Agreement between Norfolk Southern Corporation and Burton M.
Joyce, dated January 24, 2008, is incorporated herein by reference to Exhibit 10.7 to Norfolk Southern Corporation’s Form 8-K filed on January 25, 2008.
(mmm)* 2008 Award Agreement between Norfolk Southern Corporation and Steven F. Leer,
dated January 24, 2008, is incorporated herein by reference to Exhibit 10.8 to Norfolk Southern Corporation’s Form 8-K filed on January 25, 2008.
(nnn)* 2008 Award Agreement between Norfolk Southern Corporation and Jane M.
O’Brien, dated January 24, 2008, is incorporated herein by reference to Exhibit 10.9 to Norfolk Southern Corporation’s Form 8-K filed on January 25, 2008.
(ooo)* 2008 Award Agreement between Norfolk Southern Corporation and J. Paul Reason,
dated January 24, 2008, is incorporated herein by reference to Exhibit 10.10 to Norfolk Southern Corporation’s Form 8-K filed on January 25, 2008.
(ppp) Omnibus Amendment, dated as of March 18, 2008, to the Transfer and
Administration Agreement dated as of November 8, 2007, is incorporated herein by reference to Exhibit 10.1 to Norfolk Southern Corporation’s Form 10-Q filed on April 23, 2008.
(qqq) Transaction Agreement (the “Pan Am Transaction Agreement”), dated May 15,
2008, by and among Norfolk Southern Railway Company, Pan Am Railways, Inc., Boston and Maine Corporation, and Springfield Terminal Railway Company, is incorporated herein by reference to Exhibit 10.1 to Norfolk Southern Corporation’s Form 10-Q filed on July 24, 2008 (Exhibits, annexes and schedules omitted. The Registrant will furnish supplementary copies of such materials to the SEC upon request.)
(rrr)** Letter Agreement, dated October 21, 2008, by and among Norfolk Southern Railway
Company, Pan Am Railways, Inc., Boston and Maine Corporation, and Springfield Terminal Railway Company amending certain terms of the Pan Am Transaction Agreement.
(sss)* Directors’ Deferred Fee Plan of Norfolk Southern Corporation, as amended effective
January 1, 2009, is incorporated herein by reference to Exhibit 10.01 to Norfolk Southern Corporation’s Form 8-K filed on July 24, 2008.

K91
(ttt)* Norfolk Southern Corporation Executives’ Deferred Compensation Plan, as
amended effective January 1, 2009, is incorporated herein by reference to Exhibit 10.02 to Norfolk Southern Corporation’s Form 8-K filed on July 24, 2008.
(uuu)* Amendment to Norfolk Southern Corporation Officers’ Deferred Compensation
Plan, effective January 1, 2008, is incorporated herein by reference to Exhibit 10.03 to Norfolk Southern Corporation’s Form 8-K filed on July 24, 2008.
(vvv)* Norfolk Southern Corporation Long-Term Incentive Plan, as amended effective
January 1, 2009, is incorporated herein by reference to Exhibit 10.04 to Norfolk Southern Corporation’s Form 8-K filed on July 24, 2008.
(www)* Norfolk Southern Corporation Restricted Stock Unit Plan, as amended effective
January 1, 2009, is incorporated herein by reference to Exhibit 10.05 to Norfolk Southern Corporation’s Form 8-K filed on July 24, 2008.
(xxx) Amendment No. 1 to Transfer and Administration Agreement dated as of October
22, 2008, and effective as of October 23, 2008, with respect to the Registrant’s $500 million receivables securitization facility, is incorporated herein by reference to Exhibit 99 to Norfolk Southern Corporation’s Form 8-K filed on October 23, 2008.
(yyy)* Stock Unit Plan of Norfolk Southern Corporation dated as of July 24, 2001, as amended
on August 21, 2008, with an effective date of January 1, 2009, is incorporated herein by reference to Exhibit 10.1 to Norfolk Southern Corporation’s Form 10-Q filed on October 24, 2008.
(zzz)* Form of Norfolk Southern Corporation Long-Term Incentive Plan 2009 Award
Agreement is incorporated herein by reference to Exhibit 99 to Norfolk Southern Corporation’s Form 8-K/A filed on December 17, 2008.
(aaaa)*,** Form of Amended and Restated Change in Control Agreement between Norfolk
Southern Corporation and certain executive officers (including those defined as “named executive officers” and identified in the Corporation’s Proxy Statement for the 2008 annual Meetings of Stockholders).
(bbbb)* 2009 Award Agreement between Norfolk Southern Corporation and Gerald L.
Baliles, dated January 29, 2009, is incorporated herein by reference to Exhibit 10.1 to Norfolk Southern Corporation’s Form 8-K filed on January 30, 2009.
(cccc)* 2009 Award Agreement between Norfolk Southern Corporation and Daniel A. Carp,
dated January 29, 2009, is incorporated herein by reference to Exhibit 10.2 to Norfolk Southern Corporation’s Form 8-K filed on January 30, 2009.
(dddd)* 2009 Award Agreement between Norfolk Southern Corporation and Gene R. Carter,
dated January 29, 2009, is incorporated herein by reference to Exhibit 10.3 to Norfolk Southern Corporation’s Form 8-K filed on January 30, 2009.
(eeee)* 2009 Award Agreement between Norfolk Southern Corporation and Alston D.
Correll, dated January 29, 2009, is incorporated herein by reference to Exhibit 10.4 to Norfolk Southern Corporation’s Form 8-K filed on January 30, 2009.
(ffff)* 2009 Award Agreement between Norfolk Southern Corporation and Landon
Hilliard, dated January 29, 2009, is incorporated herein by reference to Exhibit 10.5 to Norfolk Southern Corporation’s Form 8-K filed on January 30, 2009.

K92
(gggg)* 2009 Award Agreement between Norfolk Southern Corporation and Karen N. Horn,
dated January 29, 2009, is incorporated herein by reference to Exhibit 10.6 to Norfolk Southern Corporation’s Form 8-K filed on January 30, 2009.
(hhhh)* 2009 Award Agreement between Norfolk Southern Corporation and Burton M. Joyce,
dated January 29, 2009, is incorporated herein by reference to Exhibit 10.7 to Norfolk Southern Corporation’s Form 8-K filed on January 30, 2009.
(iiii)* 2009 Award Agreement between Norfolk Southern Corporation and Steven F. Leer,
dated January 29, 2009, is incorporated herein by reference to Exhibit 10.8 to Norfolk Southern Corporation’s Form 8-K filed on January 30, 2009.
(jjjj)* 2009 Award Agreement between Norfolk Southern Corporation and Michael D.
Lockhart, dated January 29, 2009, is incorporated herein by reference to Exhibit 10.9 to Norfolk Southern Corporation’s Form 8-K filed on January 30, 2009.
(kkkk)* 2009 Award Agreement between Norfolk Southern Corporation and J. Paul Reason,
dated January 29, 2009, is incorporated herein by reference to Exhibit 10.10 to Norfolk Southern Corporation’s Form 8-K filed on January 30, 2009.
12** Statement re: Computation of Ratio of Earnings to Fixed Charges. 21** Subsidiaries of the Registrant. 23** Consent of Independent Registered Public Accounting Firm. 31** Rule 13a-14(a)/15d-14(a) Certifications. 32** Section 1350 Certifications. 99** Annual CEO Certification pursuant to NYSE Rule 303A.12(a). * Management contract or compensatory arrangement. ** Filed herewith. (B) Exhibits. The Exhibits required by Item 601 of Regulation S-K as listed in Item 15(A)3 are filed
herewith or incorporated herein by references. (C) Financial Statement Schedules. Financial statement schedules and separate financial statements specified by this Item are
included in Item 15(A)2 or are otherwise not required or are not applicable. Exhibits 23, 31, 32 and 99 are included in copies assembled for public dissemination.
All exhibits are included in the 2008 Form 10-K posted on our website at www.nscorp.com under “Investors” and “SEC Filings” or you may request copies by writing to:
Office of Corporate Secretary
Norfolk Southern Corporation Three Commercial Place
Norfolk, Virginia 23510-9219

K93
POWER OF ATTORNEY Each person whose signature appears below under “SIGNATURES” hereby authorizes James A. Hixon and James A. Squires or one of them, to execute in the name of each such person, and to file, any amendment to this report and hereby appoints James A. Hixon and James A. Squires or any one of them, as attorneys-in-fact to sign on his or her behalf, individually and in each capacity stated below, and to file, any and all amendments to this report.
SIGNATURES Pursuant to the requirements of Section 13 or 15(d) of the Securities Exchange Act of 1934, Norfolk Southern Corporation has duly caused this report to be signed on its behalf by the undersigned, thereunto duly authorized, on this 18th day of February 2009. NORFOLK SOUTHERN CORPORATION /s/ Charles W. Moorman By: Charles W. Moorman (Chairman, President and Chief Executive Officer) Pursuant to the requirements of the Securities Exchange Act of 1934, this report has been signed below on this 18th day of February 2009, by the following persons on behalf of Norfolk Southern Corporation and in the capacities indicated. Signature Title
/s/ Charles W. Moorman Chairman, President and Chief Executive Officer and Director (Charles W. Moorman) (Principal Executive Officer)
/s/ James A. Squires Executive Vice President Finance and Chief Financial Officer (James A. Squires) (Principal Financial Officer)
/s/ Marta R. Stewart Vice President and Controller (Marta R. Stewart) (Principal Accounting Officer)
/s/ Gerald L. Baliles Director (Gerald L. Baliles)
/s/ Daniel A. Carp Director (Daniel A. Carp)
/s/ Gene R. Carter Director (Gene R. Carter)

K94
/s/ Alston D. Correll Director (Alston D. Correll)
/s/ Landon Hilliard Director (Landon Hilliard)
/s/ Karen N. Horn Director (Karen N. Horn)
/s/ Burton M. Joyce Director (Burton M. Joyce)
/s/ Steven F. Leer Director (Steven F. Leer)
/s/ Michael D. Lockhart Director (Michael D. Lockhart)
/s/ J. Paul Reason Director (J. Paul Reason)
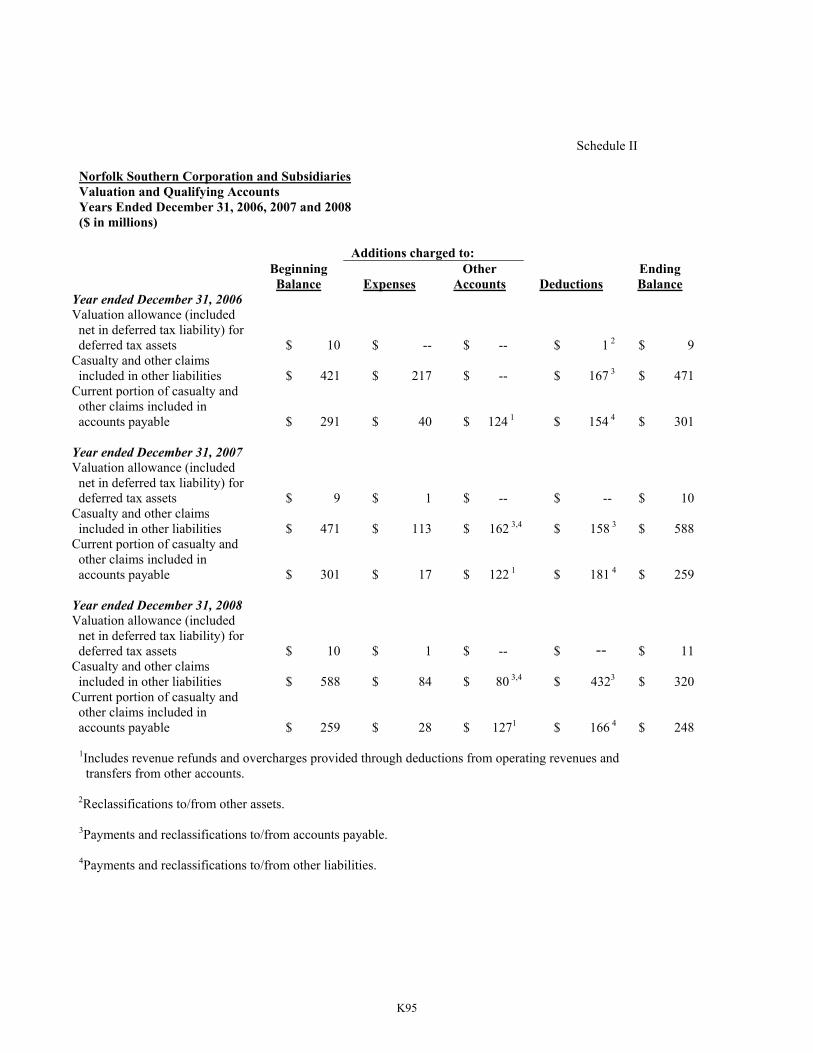
K95
Schedule II
Norfolk Southern Corporation and Subsidiaries Valuation and Qualifying Accounts Years Ended December 31, 2006, 2007 and 2008 ($ in millions)
Additions charged to: Beginning Other Ending
Balance Expenses Accounts Deductions Balance Year ended December 31, 2006 Valuation allowance (included net in deferred tax liability) for deferred tax assets $ 10 $ -- $ -- $ 1 2 $ 9 Casualty and other claims included in other liabilities $ 421 $ 217 $ -- $ 167 3 $ 471 Current portion of casualty and other claims included in accounts payable $ 291 $ 40 $ 124 1 $ 154 4 $ 301 Year ended December 31, 2007 Valuation allowance (included net in deferred tax liability) for deferred tax assets $ 9 $ 1 $ -- $ -- $ 10 Casualty and other claims included in other liabilities $ 471 $ 113 $ 162 3,4 $ 158 3 $ 588 Current portion of casualty and other claims included in accounts payable $ 301 $ 17 $ 122 1 $ 181 4 $ 259 Year ended December 31, 2008 Valuation allowance (included net in deferred tax liability) for deferred tax assets $ 10 $ 1 $ -- $ -- $ 11 Casualty and other claims included in other liabilities $ 588 $ 84 $ 80 3,4 $ 4323 $ 320 Current portion of casualty and other claims included in accounts payable $ 259 $ 28 $ 1271 $ 166 4 $ 248
1Includes revenue refunds and overcharges provided through deductions from operating revenues and transfers from other accounts.
2Reclassifications to/from other assets.
3Payments and reclassifications to/from accounts payable.
4Payments and reclassifications to/from other liabilities.

Intentionally left blank


