144
2008 ANNUAL REPORT
| Date post: | 16-May-2018 |
| Category: |
Documents |
| Upload: | hoangkhanh |
| View: | 213 times |
| Download: | 0 times |

2008 ANNUAL REPORT

TO OUR SHAREHOLDERS
The past year was an outstanding one for Live Nation. We continued to successfully execute our strategic plan, generating improved performance across
our core business and positioning our organization for growth over the long term.
Despite a challenging economic environment, millions of fans continue to attend live concerts to support their favorite artists. In 2008, our 22,000 con-
certs were attended by over 52 million fans, a 32% increase in events and a 12% increase in attendance compared to 2007. We currently believe that
our concert activities in 2009 will match the levels we achieved in 2008. This will represent a considerable achievement given the state of the global econ-
omy and our robust performance in 2008. Our show lineup remains robust, with a roster of major artists including U2, Madonna, Jonas Brothers,
Nickelback, Coldplay and AC/DC, among others.
Three years ago, we began a mission aimed at transforming a declining and fragmented live entertainment company into a vertical live music growth
company. That mission had three prongs:
1) Divesting non-core assets, a process now 90% completed.
2) Strengthening our core North American Music business through a combination of organic growth drivers and more effective cost management. Over
three years, revenues in this segment have grown over 65%.
3) Vertically expanding into the online/ticketing e-commerce business to sell more tickets. In December 2008, Livenation.com became a full-service
ticketing site for our owned and/or operated venues – powered by our ticketing platform.
We are excited about the opportunities that lie ahead for Live Nation. Our integrated platform is now complete and our ticketing business is progressing
according to plan. We remain optimistic about our long-term growth potential given the strength we are seeing across our business and our intense focus
on execution. Over the next year we are focused on executing four priorities:
• increasing liquidity and deleveraging;
• maximizing occupancy in our pipe by attracting the best touring artists in the world;
• monetizing the pipe through sponsorship, onsite revenues and monetizing ticket sales;
• growing our online/e-commerce business to maximize ticket sales, online advertising and bundled products.
On February 10, 2009, we announced that we had entered into a definitive merger agreement with Ticketmaster Entertainment, Inc. to create the world’s
premier live entertainment company. We believe the merger will accelerate the execution of our vision and strategy to build a more efficient concert sales
and distribution company.
Live Nation is taking this step in the conviction that the proposed transaction will create a stronger financial profile, better positioning us to serve artists
and fans and drive improved shareholder value over the long term.
Finally, we would like to take this opportunity to thank our shareholders, employees and the artists and fans we serve for their tremendous dedication
and support of Live Nation. We look forward to updating you on our progress as the year unfolds.
Michael Rapino
President and Chief Executive Officer
June 15, 2009
www.livenation.com

SELECT ITEMS FROM LIVE NATION, INC.’S ANNUAL REPORT ON FORM 10-KFOR THE YEAR ENDED DECEMBER 31, 2008
PART I
“Live Nation” (which may be referred to as the “Company”, “we”, “us” or “our”) means Live Nation, Inc.and its subsidiaries, or one of our segments or subsidiaries, as the context requires. The Live Nation CurrentReport on Form 8-K filed on May 28, 2009 (the “Annual Report 8-K”) updated Items 1, 1A, 6, 7, 8 and 15 (the“Updated Items”) of Live Nation’s Annual Report on Form 10-K for the year ended December 31, 2008. TheUpdated Items below are identical to those in Exhibit 99.1 to the Annual Report 8-K. Information regarding LiveNation’s common stock and a performance graph of Live Nation’s common stock follow the Updated Items.
Special Note About Forward-Looking Statements
Certain statements contained in this Form 10-K (or otherwise made by us or on our behalf from time to timein other reports, filings with the Securities and Exchange Commission, or the SEC, news releases, conferences,internet postings or otherwise) that are not statements of historical fact constitute “forward-looking statements”within the meaning of Section 27A of the Securities Act of 1933, as amended, and Section 21E of the ExchangeAct of 1934, as amended, notwithstanding that such statements are not specifically identified. Forward-lookingstatements include, but are not limited to, statements about our financial position, business strategy, competitiveposition, potential growth opportunities, potential operating performance improvements, the effects ofcompetition, the effects of future legislation or regulations, plans and objectives of our management for futureoperations and our pending merger with Ticketmaster. We have based our forward-looking statements on ourbeliefs and assumptions based on information available to us at the time the statements are made. Use of thewords “may,” “should,” “continue,” “plan,” “potential,” “anticipate,” “believe,” “estimate,” “expect,” “intend,”“outlook,” “could,” “target,” “project,” “seek,” “predict,” or variations of such words and similar expressions areintended to identify forward-looking statements but are not the exclusive means of identifying such statements.
Forward-looking statements are not guarantees of future performance and are subject to risks anduncertainties that could cause actual results to differ materially from those in such statements. Factors that couldcause actual results to differ from those discussed in the forward-looking statements include, but are not limitedto, those set forth under Item 1A.—Risk Factors as well as other factors described herein or in our annual,quarterly and other reports we file with the Securities and Exchange Commission (collectively, “cautionarystatements”). Based upon changing conditions, should any one or more of these risks or uncertainties materialize,or should any underlying assumptions prove incorrect, actual results may vary materially from those described inany forward-looking statements. All subsequent written and oral forward-looking statements attributable to us orpersons acting on our behalf are expressly qualified in their entirety by the applicable cautionary statements. Wedo not intend to update these forward-looking statements, except as required by applicable law.
ITEM 1. BUSINESS
Our Company
We are the largest producer of live music concerts in the world. In 2008, we connected over 52 million livemusic fans with their favorite performers at approximately 22,000 events in 33 countries around the world anddrove over 72 million unique visitors to livenation.com. Globally, we own, operate, have booking rights for and/or have an equity interest in 159 venues, including House of Blues® music venues and prestigious locations suchas The Fillmore in San Francisco, the Hollywood Palladium, the Heineken Music Hall in Amsterdam and the O2
Dublin.
1

On February 10, 2009, we entered into a merger agreement with Ticketmaster Entertainment, Inc., orTicketmaster. Pursuant to the merger agreement, Ticketmaster stockholders will own approximately 50.01% ofthe combined company. The merger is subject to approval by both companies’ stockholders, the consent ofTicketmaster’s lenders and the satisfaction of customary closing conditions and regulatory review andapprovals. Additional disclosure regarding the merger will be set forth in a proxy statement to be filed with theSEC in connection with the merger.
Our principal executive offices are located at 9348 Civic Center Drive, Beverly Hills, California 90210(telephone: 310-867-7000). Our principal website is www.livenation.com. Live Nation is listed on the New YorkStock Exchange, trading under the symbol “LYV”.
Our Strategy
Our strategy is to connect the artist to the fan. We believe that this focus will enable us to increaseshareholder value by developing new ancillary revenue streams around the live music event and the artistthemselves. We will continue to focus on our live music assets. We plan to expand our business through buildinga stronger connection with the fan through the live event and our ticketing platform. We will seek to connectcorporate sponsors with this fan through the live music experience. We will continue to execute on this strategythrough pursuing the objectives listed below.
• Improve the Profitability of Our Existing Core Business. We continue to focus on improving theprofitability of our existing core live music operations by implementing strategies to increase ancillary salesper fan at all events and at all venues we operate in, as well as striving to be the low-cost operator.
• Extend Relationships with Artists and Sponsors. Our goal is to develop deeper relationships with touringartists centered on the live music event. We are able to expand our relationship with the artist throughlonger-term and broader relationships by providing more services and partnering with the artist to grow theirmusic properties. We believe that we can expand the business lines related to the live music event, such asthe sale of tour merchandise and live concert DVDs as well as providing other products and services to fansand artists both before and after the concert, including the development of artist fan clubs and websites. Wealso believe that we have an opportunity to expand our relationship with corporate sponsors by providingstrategic programs that deliver more value to the sponsor through our unique relationship to the music fanand to the artist and by utilizing our distribution network of venues and our extensive online presence.
• Develop Ticketing and Online Services. Our goal is to have a direct relationship with the music fan throughour ticketing platform and to be the leading online live music destination website throughwww.livenation.com. Our website offers comprehensive information about live concerts, including showsthat are not Live Nation promoted events, and access to tickets and artist merchandise. We seek to continueto drive the growth of our website by expanding our online offering to increase traffic and generatingincremental revenue from additional ticket sales, merchandise sales, online advertising and other goods andservices.
• Increase Our Global Live Music Platform. We plan to expand our promoter presence to include the topmusic markets and population centers around the world. We currently operate in 20 global markets. Ourfocus internationally is on increasing our promoter presence. We intend to expand our North Americanplatform in key larger markets through ownership or operation of key venues and by growing our festivalpresence.
• Divest Non-Core Assets. We are focused on building our live music business and ancillary services in majormusic markets around the world. As a result, we expect, where it is economically justifiable, to continue todivest non-live music related assets and/or underperforming live music assets and use the net proceeds tore-invest in our core live music business, repay outstanding indebtedness or for general corporate purposes.
In order to achieve our objectives and successfully implement our strategies, we have made, and expect tocontinue to pursue, investments, acquisitions and divestitures that contribute to the above goals where thevaluations, returns and growth potential are consistent with our long-term goal of increasing shareholder value.
2

Our Assets
We believe we have a unique portfolio of assets that is unmatched in the live music industry.
• Fans. During 2008, our events and venues were attended by over 57 million fans, including over 52 millionlive music fans. Our database provides us with the means to efficiently market our shows to these fans aswell as offer them other music-related products and services. This database is an invaluable asset that we areable to use to service our artists and corporate clients.
• Artists. We have extensive relationships with artists ranging from those acts that are just beginning theircareers to superstars. In 2008, we promoted shows or tours for over 1,600 artists globally. We believe ourartist relationships are a competitive advantage and will help us pursue our strategy to develop additionalancillary revenue streams around the live music event and the artists themselves.
• Ticketing Platform. In December 2008, we launched our own ticketing platform using an establishedticketing software system that we have licensed through CTS Eventim. We operate this system on hardwarewe own. The system provides tools for selling and managing ticket inventory online, at our box offices,through our phone center and at other retail outlets. Our primary online ticketing website,www.livenation.com, is designed to promote ticket sales for live events and to disseminate event and relatedmerchandise information online.
• Distribution Network. We believe that our global distribution network of promoters, venues and festivalsprovides us with a strong position in the live music industry. We believe we have one of the largest globalnetworks of music promoters in the world, with offices in 26 cities in North America and a total of 19countries worldwide. In addition, we own, operate, have booking rights and/or have an equity interest in 159venues located across six countries as of the end of 2008, making us, we believe, the second largest operatorof music venues in the world. We also believe that we produce one of the largest networks of music festivalsin the world with over 30 festivals globally.
• Sponsors. We employed a sales force of approximately 220 people that worked with over 800 sponsorsduring 2008, through a combination of local venue related deals and national deals, both in North Americaand internationally. Our sponsors include some of the most well-recognized national and global brandsincluding Citi®, BlackBerry and O2.
• Employees. At December 31, 2008, we employed approximately 4,700 full-time employees who arededicated to providing first-class service to our artists, fans and corporate sponsors. Many of our employeeshave decades of experience in promoting and producing live concerts, as well as operating live musicvenues.
Our History
We were formed through acquisitions of various entertainment businesses and assets by our predecessors. InAugust 2000, Clear Channel Communications, Inc., or Clear Channel, acquired our live entertainment business,which was initially formed in 1997. In August 2005, we were incorporated in our current form as a Delawarecorporation to own substantially all of the entertainment business of Clear Channel. In December 2005, theseparation of the business previously conducted by Clear Channel’s live entertainment segment and sportsrepresentation business, and the distribution by Clear Channel of all of our common stock to its stockholders,was completed in a tax free spin-off (or the Distribution, the Separation or the spin-off). Following our separationfrom Clear Channel, we became a separate publicly traded company on the New York Stock Exchange tradingunder the symbol “LYV”.
Our Industry
The live music industry includes concert promotion and/or production. According to Pollstar, NorthAmerican gross concert revenue increased from $3.6 billion in 2006 to $4.2 billion in 2008, a compound annual
3

growth rate of approximately 8%. Excluding the impact of acquisitions, in the 2006 to 2008 period, our NorthAmerican Music and International Music revenue, comprised primarily of gross concert-related revenue,increased from $3.1 billion to $3.7 billion, a compound annual growth rate of 10%. We believe this growth wasprimarily due to increasing ticket prices for top-grossing acts and the desire of these acts, such as Madonna andU2, to tour.
Typically, to initiate live music events or tours, booking agents directly contract with performers torepresent them for defined periods. Booking agents then contact promoters, who will contract with them ordirectly with performers to arrange events. Booking agents generally receive fixed or percentage fees fromperformers for their services. Promoters earn revenue primarily from the sale of tickets. Performers are paid bythe promoter under one of several different formulas, which may include fixed guarantees and/or a percentage ofticket sales or event profits. In addition, promoters may also reimburse performers for certain costs of production,such as sound and lights. Under guaranteed payment formulas, promoters assume the risks of unprofitable events.Promoters may renegotiate lower guarantees or cancel events because of insufficient ticket sales in order toreduce their losses. Promoters can also reduce the risk of losses by entering into global or national touringagreements with performers and including the right to offset lower performing shows with higher performingshows on the tour in the determination of overall artist fees.
For music tours, one to four months typically elapse between booking performers and the firstperformances. Promoters, in conjunction with performers, managers and booking agents, set ticket prices andadvertise events. Promoters market events, sell tickets, rent or otherwise provide venues and arrange for localproduction services, such as stages and sets.
Venue operators typically contract with promoters to rent their venues for specific events on specific dates.Venue operators provide services such as concessions, parking, security, ushering and ticket-taking, and receivesome or all of the revenue from concessions, merchandise, sponsorships, parking and premium seats. For theevents they host, venue operators typically receive fixed fees or percentages of ticket sales, as well aspercentages of total concession sales from the concessionaire and percentages of total merchandise sales from themerchandisers.
Our Business
We operate in three reportable business segments: North American Music, International Music andTicketing (previously known as Global Digital). Prior to 2008, we reported a Global Theater segment, which hasbeen eliminated after the divestiture of substantially all of our North American theatrical business in January2008. Our United Kingdom theatrical venue operation business, previously included in Global Theater, is nowreported in “other” and the few remaining North American theater venues are now reported in North AmericanMusic.
Information related to these operating segments and other operations for 2008, 2007 and 2006 is included inNote 18—Segment Data in the Notes to Consolidated Financial Statements in Item 8.
North American Music. Our North American Music business principally involves the promotion of livemusic events in our owned and/or operated venues and in rented third-party venues primarily in the United Statesand Canada, as well as providing various services to artists. During 2008, our North American Music businessgenerated approximately $2.7 billion, or 64%, of our total revenue. We promoted over 10,000 North Americanlive music events in 2008, including artists such as Madonna, The Police, Rascal Flatts, Coldplay, Jonas Brothersand the Trans-Siberian Orchestra.
International Music. Our International Music business principally involves the promotion of live musicevents in our owned and/or operated venues and in rented third-party venues and the production of musicfestivals outside of North America. For 2008, our International Music business generated approximately $1.4
4

billion, or 33%, of our total revenue. We promoted or produced over 4,000 live music events internationally in2008, including artists such as Madonna, Vasco Rossi and Bruce Springsteen as well as several large festivals inEurope, such as Rock Werchter in Belgium, Lowlands Festival in Holland, and Reading Festival and LeedsFestival, both in the United Kingdom.
Ticketing. Our Ticketing business principally involves the management of our internal ticketing operationsand online and wireless distribution activities, including the launch of Live Nation ticketing and the developmentof our website. Our Ticketing business generated approximately $22 million, or 0.5%, of our total revenue in2008. We expect this business to expand as a result of our launch in 2008 of a ticketing platform which allows usto sell tickets for 2009 events at our owned and/or operated venues.
Other. Our United Kingdom theatrical venue operation business principally involves the operation andrental of our owned/and or operated venues for theatrical performances. For 2008, businesses included under“other” generated approximately $88 million, or 2%, of our total revenue.
Recent Acquisitions
Heineken Music Hall. In January 2008, we acquired the operating company that manages and holds thelease for the Heineken Music Hall in Amsterdam.
AMD. In January 2008, we acquired a 51% interest in Amsterdam Music Dome Exploitatie B.V., or AMD.AMD will be the exclusive lessee of a music venue that is planned to be developed.
DF Concerts. In April 2008, we acquired a 78.3% interest in DFC Holdings Limited, or DF Concerts,through a joint venture with Gaiety Investments. We own 50.1% of the joint venture with Gaiety Investments.DF Concerts is a leading concert promotion company in Scotland and promotes what we believe to be the mostsuccessful music festival in Scotland, T in the Park.
Mirage. In May 2008, we acquired a 65% interest in Mirage Promotions FZ-LLC, or Mirage, a leadingpromoter in Dubai and the surrounding region. Mirage was subsequently rebranded as Live Nation Middle East.
Fantasma. In May 2008, we acquired certain assets of Fantasma Productions Inc. of Florida, or Fantasma, aconcert promotion company in Florida.
Luger and Moondog. In June 2008, we acquired the remaining 51% interest and 75% interest of Lugerinc.AB and Moondog Entertainment AB, or Luger and Moondog, respectively, that we did not already own. Lugerand Moondog are music-related companies in Sweden.
Main Square Festival. In July 2008, we acquired a 51% interest in Moi.Je Prod SAS, the producer of theMain Square Festival in Arras, France.
De-Lux. In October 2008, we acquired De-Lux Merchandise Company Limited, or De-Lux, a merchandisingcompany in the United Kingdom.
Emerge. In October 2008, we acquired Emerge Media Ventures Ltd., or Emerge, a promotion company inCanada.
Recent Divestitures
Consistent with our strategy to focus on our core live music business, we continued to divest of non-musicor non-core assets during 2008.
5

North American theatrical business. In January 2008, we sold substantially all of our North Americantheatrical business, which included the assets of the North American theatrical presenting business and certaintheatrical venues. In December 2007, we sold the Oriental Theater in Chicago, Illinois and our 50% interest inBroadway in Chicago, LLC which were part of the North American theatrical business.
Friends & Partners. In August 2008, we sold Friends & Partners Italia S.r.l., or F&P Italia, a promotioncompany in Italy.
Motor Sports business. In September 2008, we sold our motor sports business which included events formotorcycle road racing, supercross racing, monster truck shows, freestyle motocross events and other similarevents.
Events business. In October 2008, we sold our non-core events business along with rights to certain DVDprojects. The events business included rights or investments in certain non-music and exhibition-style events.
Operating Segments
North American Music
Our North American Music segment principally involves the promotion of live music events in our ownedand/or operated venues and in rented third-party venues in the United States and Canada as well as providingvarious services to artists.
As a promoter, we typically book performers, arrange performances and tours, secure venues, provide forthird-party production services, sell tickets and advertise events to attract audiences. We earn revenue primarilyfrom the sale of tickets and pay performers under one of several formulas, including a fixed guaranteed amountand/or a percentage of ticket sales or event profits. For each event, we either use a venue we own and/or operate,or rent a third-party venue. Revenues are generally related to the number of events, volume of ticket sales andticket prices. Event costs such as artist and production service expenses are included in direct operating expensesand are typically substantial in relation to the revenue. As a result, significant increases or decreases in promotionrevenue do not typically result in comparable changes to operating income.
As a venue operator, we contract with promoters to rent our venues for events and provide operationalservices such as concessions, merchandising, parking, security, ushering and ticket-taking. We generate revenueprimarily from the sale of food and beverages, parking, premium seating, venue sponsorships and ticket rebatesor service charges earned on tickets sold through phone, outlet and internet by third parties under our ticketingagreements or through our internal ticketing operations for events we promote. In our amphitheaters, the sale offood and beverage is outsourced and we receive a share of the net revenue from the concessionaire which isrecorded in revenue with no significant direct operating expenses associated with it. Revenue generated fromvenue operations typically have a higher margin than promotion revenue and therefore typically have a moredirect relationship to operating income.
Our Artist Services division partners with artists to manage their diverse rights, grow their fan bases andprovide a direct connection to fans through our global distribution platform and marketing proficiencies. Theoperations of this division include the sale of merchandise, artist fan sites and VIP ticketing, broadcast/digitalmedia rights, recorded music distribution and sponsorship and marketing services. Direct operating expenses forthe Artist Services division include the artist’s share of profits and cost of goods sold.
We believe that we have a unique opportunity to connect the music fan to corporate sponsors and thereforeseek to optimize this relationship through the development of strategic sponsorship programs. We continue toalso pursue the sale of national and local sponsorships and placement of advertising, including signage andpromotional programs. Many of our venues have venue naming rights sponsorship programs. We believenational sponsorships allow us to maximize our network of venues and to arrange multi-venue branding
6

opportunities for advertisers. Our national sponsorship programs include companies such as Citi®, BlackBerryand State Farm. Our local and venue-focused sponsorships include venue signage, promotional programs, on-siteactivation, hospitality and tickets, and are derived from a variety of companies across various industry categories.
International Music
Our International Music segment principally involves the promotion of live music events in our owned and/or operated venues and in rented third-party venues and the production of music festivals.
As a promoter, we typically book performers, arrange performances and tours, secure venues, provide forthird-party production services, sell tickets and advertise events to attract audiences. We earn revenue primarilyfrom the sale of tickets and pay performers under one of several formulas, including a fixed guaranteed amountand/or a percentage of ticket sales or event profits. For each event, we either use a venue we own and/or operate,or rent a third-party venue. Revenues are generally related to the number of events, volume of ticket sales andticket prices. Event costs such as artist and production service expenses are included in direct operating expensesand are typically substantial in relation to the revenue. As a result, significant increases or decreases in promotionrevenue do not typically result in comparable changes to operating income.
As a venue operator, we contract with promoters to rent our venues for events and provide operationalservices such as concessions, merchandising, security, ushering and ticket-taking. We generate revenue primarilyfrom rental income, the sale of food and beverages, venue sponsorships and ticket rebates earned on tickets soldthrough phone, outlet and internet by third parties under our ticketing agreements for events we promote.Revenue generated from venue operations typically have a higher margin than promotion revenue and thereforetypically have a more direct relationship to operating income.
Ticketing
Our Ticketing segment manages our digital online presence and completed the new Live Nation ticketingplatform which was launched in late 2008. Within our Ticketing segment, we manage our internal ticketingoperations and online and wireless distribution activities, including the development of our websitewww.livenation.com. This segment derives the majority of its revenue from service charges earned on tickets soldthrough our internal ticketing operations and from sponsorships. The tickets sold by this segment are the ticketsthat we are allowed to sell directly to customers in North America under our agreements with outside ticketingagencies prior to the launch of Live Nation ticketing. Ticketing pays our North American Music segment a ticketrebate equivalent to the amount that they would have received had the ticket been sold by an outside ticketingagency. The remainder of the service charge is retained by Ticketing.
Other
Included under our Other operations is primarily our United Kingdom theatrical venue operations and otherbusinesses.
Live Nation Venue Details
In the live entertainment industry, venues generally consist of:
• Stadiums—Stadiums are multi-purpose facilities, often housing local sports teams. Stadiums typically have30,000 or more seats. Although they are the largest venues available for live music, they are not specificallydesigned for live music. At December 31, 2008, we did not own or lease any stadiums, although we mayrent them for certain events.
• Amphitheaters—Amphitheaters are generally outdoor venues with between 5,000 and 30,000 seats that areused primarily in the summer season. We believe they are popular because they are designed specifically for
7

concert events, with premium seat packages and better lines of sight and acoustics. At December 31, 2008,we owned eight, leased 28, operated seven and had booking rights for nine amphitheaters located in NorthAmerica.
• Arenas—Arenas are indoor venues that are used as multi-purpose facilities, often housing local sportsteams. Arenas typically have between 5,000 and 20,000 seats. Because they are indoors, they are able tooffer amenities that other similar-sized outdoor venues cannot, such as luxury suites and premium clubmemberships. As a result, we believe they have become increasingly popular for higher-priced concertsaimed at audiences willing to pay for these amenities. At December 31, 2008, we owned one, leased two,operated two and had booking rights for five arenas located in the United Kingdom, Ireland, TheNetherlands and North America.
• Music Theaters—Music theaters are indoor venues that are built primarily for music events. These venuestypically have a capacity between 1,000 and 6,500. Because these venues have a smaller capacity than anamphitheater, they do not offer as much economic upside on a per show basis. However, because musictheaters can be used year-round, unlike most amphitheaters, they can generate annual profits similar to thoseof an amphitheater. Music theaters represent less risk to concert promoters because they have lower fixedcosts associated with hosting a concert and may provide a more appropriately-sized venue for developingartists and more artists in general. At December 31, 2008, we owned seven, leased 22, operated three, hadbooking rights for eleven and an equity interest in one music theater located in North America, the UnitedKingdom and Sweden.
• Clubs—Clubs are indoor venues that are built primarily for music events but may also include comedyclubs. These venues typically have a capacity of less than 1,000 and often without full fixed seating.Because of their small size, they do not offer as much economic upside, but they also represent less risk to aconcert promoter because they have lower fixed costs associated with hosting a concert and also mayprovide a more appropriate size venue for developing artists. Clubs can also be used year-round and cantherefore generate higher profits for the year, even though per show profits are lower. At December 31,2008, we owned three, leased eight and had booking rights for eight clubs in North America and the UnitedKingdom.
• House of Blues—House of Blues venues are indoor venues that offer customers an integrated live music anddining experience. The live music halls are specially designed to provide optimum acoustics and typicallycan accommodate between 1,000 to 2,000 guests. A full-service restaurant and bar is located adjacent to thelive music hall. We believe that the high quality of the food, service and atmosphere in our restaurantsattracts customers to these venues independently from an entertainment event, and generates a significantamount of repeat business from local customers. At December 31, 2008, we owned two and leased nineHouse of Blues venues located in North America. One of the House of Blues venues is comprised of twobuildings where we own one of the buildings and lease the other building. We have included this venue asan owned venue.
• Festival Sites—Festival sites are outdoor locations used primarily in the summer season to stage day-long ormulti-day concert events featuring several performers. Depending on the location, festival site capacities canrange from 10,000 to 120,000. We believe they are popular because of the value provided to the fan bypackaging several performers for a full-day or multi-day event. While festival sites only host a few eventseach year, they can provide higher operating income because they have lower costs associated withproducing the event and maintaining the site. At December 31, 2008, we owned three festival sites locatedin North America and the United Kingdom.
• Theatrical Theaters—Theatrical theaters are generally indoor venues that are built specifically for theatricalevents, with substantial aesthetic and acoustic consideration. These venues typically have less than 5,000seats. Additionally, given their size, they are able to host events aimed at niche audiences. At December 31,2008, we owned seven, leased seven, operated five and had an equity interest in one theatrical theaterlocated in North America and the United Kingdom.
8

Music Venues
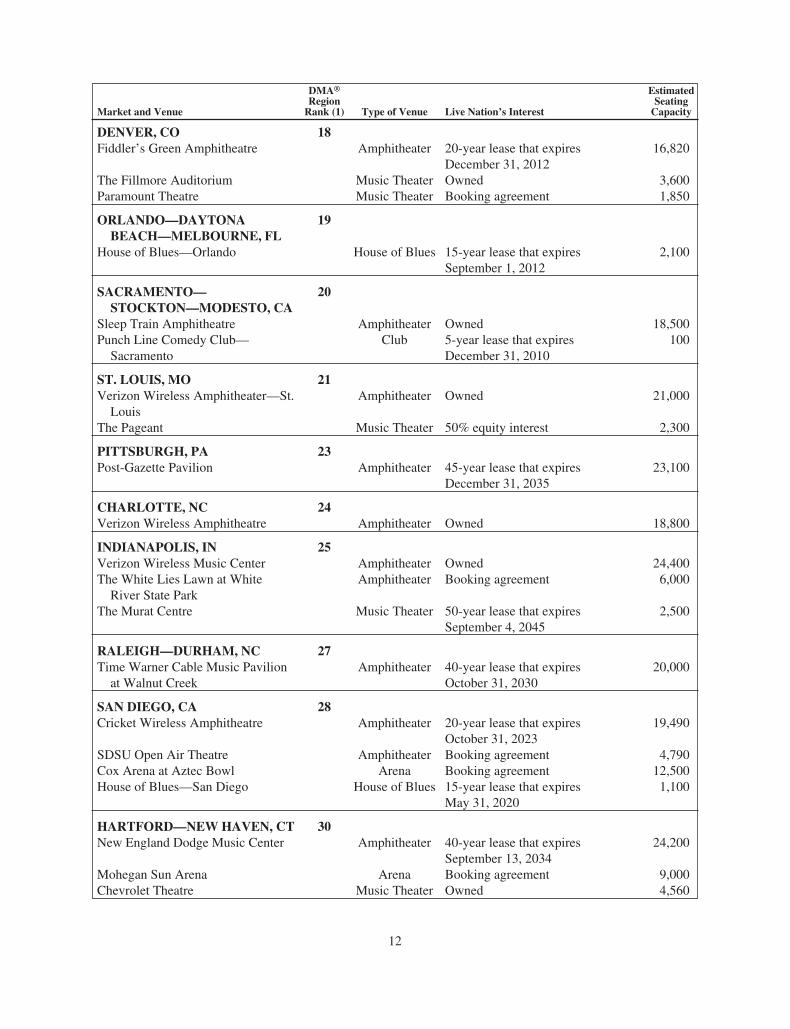
At December 31, 2008, we owned, operated, had booking rights for and/or had an equity interest in thefollowing domestic and international venues primarily used for music events:
Market and Venue
DMA®
RegionRank (1) Type of Venue Live Nation’s Interest
EstimatedSeatingCapacity
NEW YORK, NY 1PNC Bank Arts Center Amphitheater 22-year lease that expires
December 31, 201717,500
Nikon at Jones Beach Theater Amphitheater 20-year license agreement thatexpires December 31, 2019
14,400
The Capital One Bank Theatre atWestbury
Music Theater 43-year lease that expiresDecember 31, 2034
2,800
Hammerstein Ballroom Music Theater Booking agreement 3,600Asbury Park Convention Hall Music Theater Booking agreement 3,600Paramount Theatre Music Theater Booking agreement 1,500The Fillmore New York at IrvingPlaza
Club 10-year lease that expiresOctober 31, 2016
1,000
Blender Theater at Gramercy Club 10-year lease that expiresDecember 31, 2016
600
Roseland Ballroom Club Booking agreement 3,700The Stone Pony Club Booking agreement 600
LOS ANGELES, CA 2San Manuel Amphitheater Amphitheater 25-year lease that expires
June 30, 201865,000
Verizon Wireless Amphitheater Amphitheater 20-year lease that expiresFebruary 28, 2017
16,300
Gibson Amphitheatre at UniversalCitywalk
Music Theater 15-year lease that expiresSeptember 9, 2014
6,185
Long Beach Arena Arena Booking agreement 13,500Hollywood Palladium Music Theater 20-year lease that expires
January 31, 20274,000
The Wiltern Music Theater 5-year lease that expiresJune 30, 2010
2,300
Avalon Hollywood Club Booking agreement 1,400The Roxy Theatre Club Booking agreement 500House of Blues—Sunset Strip House of Blues 10-year lease that expires
May 10, 20121,000
House of Blues—Anaheim House of Blues 10-year lease that expiresJanuary 8, 2011
950
CHICAGO, IL 3First Midwest Bank Amphitheatre Amphitheater Owned 28,600Charter One Pavilion at NortherlyIsland
Amphitheater 5-year lease that expiresDecember 31, 2009
8,500
Allstate Arena Arena Booking agreement 19,000Rosemont Theatre Music Theater Booking agreement 4,400House of Blues—Chicago House of Blues Owned 1,300
9

Market and Venue
DMA®
RegionRank (1) Type of Venue Live Nation’s Interest
EstimatedSeatingCapacity
PHILADELPHIA, PA 4Susquehanna Bank Center Amphitheater 31-year lease that expires
September 29, 202525,000
Tower Theater Music Theater Owned 3,050Theater of the Living Arts Club Owned 810Electric Factory Club Booking agreement 2,250
DALLAS—FORTWORTH, TX 5Superpages.com Center Amphitheater 30-year lease that expires
December 31, 201820,100
House of Blues—Dallas House of Blues 15-year lease that expiresApril 30, 2022
1,625
SAN FRANCISCO—OAKLAND—SAN JOSE, CA 6
Shoreline Amphitheatre at MountainView
Amphitheater 15-year lease that expiresDecember 31, 2020
22,000
Sleep Train Pavilion at Concord Amphitheater 4-year management agreement thatexpires December 31, 2010
12,500
Mountain Winery Amphitheater Booking agreement that expiredSeptember 30, 2007 (currentlynegotiating new terms)
1,750
The Fillmore Music Theater 15-year lease that expiresAugust 31, 2012
1,200
Punch Line Comedy Club—SanFrancisco
Club 5-year lease that expiresSeptember 15, 2011
500
Cobb’s Comedy Club Club 10-year lease that expiresOctober 31, 2015
150
BOSTON, MA 7Comcast Center Amphitheater Owned 19,900Bank of America Pavilion Amphitheater Indefinite license agreement that
expires 18 months after notificationthat pier is to be occupied for waterdependent use
4,900
Orpheum Theatre—Boston Music Theater 10-year operating agreement thatexpires December 31, 2015
2,700
Paradise Rock Club Club 10-year lease that expiresMay 31, 2018
650
ATLANTA, GA 8Lakewood Amphitheatre Amphitheater 35-year lease that expires
December 31, 203319,000
Chastain Park Amphitheatre Amphitheater 10-year lease that expiresDecember 31, 2010
6,400
The Tabernacle Music Theater 20-year lease that expiresJanuary 31, 2018
2,500
WASHINGTON, DC 9Nissan Pavilion Amphitheater Owned 22,500Warner Theatre Music Theater 10-year lease that expires
September 30, 20121,850
10

Market and Venue
DMA®
RegionRank (1) Type of Venue Live Nation’s Interest
EstimatedSeatingCapacity
HOUSTON, TX 10Cynthia Woods Mitchell Pavilion Amphitheater Booking agreement 16,400Showgrounds at Sam HoustonRace Park
Amphitheater Booking agreement 9,000
Verizon Wireless Theater Music Theater 15-year lease that expiresDecember 31, 2012
2,900
House of Blues—Houston House of Blues 10-year lease that expiresOctober 31, 2018
1,530
DETROIT, MI 11The Fillmore Detroit Music Theater 15-year lease that expires
January 31, 20182,900
Saint Andrews Hall Club Owned 820
PHOENIX, AZ 12Cricket Wireless Pavilion Amphitheater 60-year lease that expires
June 30, 204920,000
Dodge Theatre Music Theater 10-year lease that expiresDecember 31, 2016
5,500
TAMPA—ST. PETERSBURG—SARASOTA, FL 13
Ford Amphitheatre at the FloridaState Fairgrounds
Amphitheater 15-year lease that expiresDecember 31, 2018
20,000
SEATTLE—TACOMA, WA 14White River Amphitheatre Amphitheater 25-year management agreement
that expires October 31, 202720,000
MIAMI—FT. LAUDERDALE,FL 16
Bayfront Park Amphitheater 10-year management agreementthat expires December 31, 2018
5,000
Pompano Beach Amphitheatre Amphitheater 6-year management agreement thatexpires November 25, 2015
3,300
The Fillmore Miami Beach at theJackie Gleason Theater
Music Theater 10-year management agreementthat expires August 21, 2017
2,700
Revolution Live Club Booking agreement 1,300
CLEVELAND—AKRON, OH 17Blossom Music Center Amphitheater 15-year lease that expires
October 31, 201419,550
Time Warner Cable Amphitheater atTower City
Amphitheater 6-year lease that expiresApril 30, 2011
5,500
Nautica Pavilion Amphitheater 3-year management agreement thatexpired December 31, 2008(currently negotiating new terms)
5,000
House of Blues—Cleveland House of Blues 20-year lease that expiresOctober 31, 2024
1,200
11
Market and Venue
DMA®
RegionRank (1) Type of Venue Live Nation’s Interest
EstimatedSeatingCapacity
DENVER, CO 18Fiddler’s Green Amphitheatre Amphitheater 20-year lease that expires
December 31, 201216,820
The Fillmore Auditorium Music Theater Owned 3,600Paramount Theatre Music Theater Booking agreement 1,850
ORLANDO—DAYTONABEACH—MELBOURNE, FL
19
House of Blues—Orlando House of Blues 15-year lease that expiresSeptember 1, 2012
2,100
SACRAMENTO—STOCKTON—MODESTO, CA
20
Sleep Train Amphitheatre Amphitheater Owned 18,500Punch Line Comedy Club—Sacramento
Club 5-year lease that expiresDecember 31, 2010
100
ST. LOUIS, MO 21Verizon Wireless Amphitheater—St.Louis
Amphitheater Owned 21,000
The Pageant Music Theater 50% equity interest 2,300
PITTSBURGH, PA 23Post-Gazette Pavilion Amphitheater 45-year lease that expires
December 31, 203523,100
CHARLOTTE, NC 24Verizon Wireless Amphitheatre Amphitheater Owned 18,800
INDIANAPOLIS, IN 25Verizon Wireless Music Center Amphitheater Owned 24,400The White Lies Lawn at WhiteRiver State Park
Amphitheater Booking agreement 6,000
The Murat Centre Music Theater 50-year lease that expiresSeptember 4, 2045
2,500
RALEIGH—DURHAM, NC 27Time Warner Cable Music Pavilionat Walnut Creek
Amphitheater 40-year lease that expiresOctober 31, 2030
20,000
SAN DIEGO, CA 28Cricket Wireless Amphitheatre Amphitheater 20-year lease that expires
October 31, 202319,490
SDSU Open Air Theatre Amphitheater Booking agreement 4,790Cox Arena at Aztec Bowl Arena Booking agreement 12,500House of Blues—San Diego House of Blues 15-year lease that expires
May 31, 20201,100
HARTFORD—NEWHAVEN, CT 30New England Dodge Music Center Amphitheater 40-year lease that expires
September 13, 203424,200
Mohegan Sun Arena Arena Booking agreement 9,000Chevrolet Theatre Music Theater Owned 4,560
12

Market and Venue
DMA®
RegionRank (1) Type of Venue Live Nation’s Interest
EstimatedSeatingCapacity
KANSAS CITY, MO 31Starlight Theatre Music Theater Booking agreement 8,105
COLUMBUS, OH 32Germain Amphitheater Amphitheater Currently not in operation 20,000
CINCINNATI, OH 34Riverbend Music Center Amphitheater Booking agreement 20,500National City Pavilion Amphitheater Booking agreement 4,000Taft Theatre Music Theater 5-year lease that expires
July 31, 20102,500
Bogarts Club 10-year lease that expiresSeptember 30, 2012
1,470
MILWAUKEE, WI 35Alpine Valley Music Theatre Amphitheater 21-year management agreement
that expires December 31, 201935,300
Marcus Amphitheater Amphitheater Booking agreement 23,000
SAN ANTONIO, TX 37Selma Amphitheater Amphitheater Owned (not in operation) 19,300
WEST PALM BEACH—FORTPIERCE, FL
38
Centre for the Arts at Mizner ParkAmphitheater
Amphitheater 5-year lease that expiresJune 30, 2014
4,500
Cruzan Amphitheatre Amphitheater 10-year lease that expiresDecember 31, 2015
19,300
BIRMINGHAM, AL 40Verizon Wireless Music Center—Birmingham
Amphitheater Owned 10,550
HARRISBURG—LANCASTER—LEBANON—YORK, PA
41
Star Pavilion at Hershey Park Amphitheater Booking agreement that expiredDecember 31, 2005 (currentlynegotiating new terms)
8,100
LAS VEGAS, NV 42Pearl Concert Theater at PalmsCasino Resort
Music Theater Booking agreement 2,500
House of Blues—Las Vegas House of Blues 15-year lease that expiresMarch 1, 2014
1,800
NORFOLK—PORTSMOUTH—NEWPORT NEWS, VA
43
Verizon Wireless Virginia BeachAmphitheater
Amphitheater 30-year lease that expiresDecember 31, 2026
20,000
13

Market and Venue
DMA®
RegionRank (1) Type of Venue Live Nation’s Interest
EstimatedSeatingCapacity
ALBUQUERQUE—SANTA FE,NM
44
Journal Pavilion Amphitheater 20-year lease that expiresApril 16, 2021
12,000
Sandia Casino Amphitheater Music Theater Booking agreement 4,200
AUSTIN, TX 49Austin Music Hall Music Theater Booking agreement 4,400
LOUISVILLE, KY 50The Louisville Palace Music Theater Owned 2,700
BUFFALO, NY 51Darien Lake Performing Arts Center Amphitheater 25-year lease that expires
October 15, 202021,800
Seneca Niagra Casino Music Theater Booking agreement 2,100Seneca Events Center Music Theater Booking agreement 1,700
NEW ORLEANS, LA 53House of Blues—New Orleans House of Blues One building owned and one
building under 35-year lease thatexpires October 31, 2027
1,000
WILKES BARRE—SCRANTON,PA
54
Toyota Pavilion at MontageMountain
Amphitheater 10-year lease that expiresDecember 31, 2011
17,500
ALBANY—SCHNECTADY—TROY, NY
57
Saratoga Performing Arts Center Amphitheater 10-year license agreement thatexpires September 7, 2009
25,200
FLORENCE—MYRTLEBEACH, SC
104
House of Blues—Myrtle Beach House of Blues 27-year lease that expiresMay 31, 2025
2,000
YAKIMA—PASCO—RICHLAND—KENNEWICK,WA
126
The Gorge Amphitheatre Amphitheater 20-year lease that expiresOctober 31, 2023
20,000
WHEELING, WVSTEUBENVILLE, OH
159
Jamboree in the Hills Festival Site Owned 35,000Capitol Music Hall Music Theater Currently not in operation 2,490
TORONTO, CANADA N/AMolson Amphitheatre Amphitheater 35-year lease that expires
December 31, 201016,000
The Guvernment-Kool Haus Club Booking agreement 2,400The Drink at the Guvernment Club Booking agreement 1,200
14

Market and Venue
DMA®
RegionRank (1) Type of Venue Live Nation’s Interest
EstimatedSeatingCapacity
VANCOUVER, CANADA N/AGeneral Motors Place Arena Booking agreement 13,000Commodore Ballroom Club 15-year lease that expires
July 31, 20141,100
BIRMINGHAM, ENGLAND N/AO2 Academy Birmingham Music Theater 8-year lease that expired
March 25, 2008 (currentlynegotiating new terms)
3,200
Birmingham Dome Music Theater Currently not in operation 3,000
BRIGHTON, ENGLAND N/AO2 Academy Brighton Music Theater Currently not in operation 2,500
BRISTOL, ENGLAND N/AO2 Academy Bristol Music Theater 25-year lease that expires
December 25, 20231,900
LEEDS, ENGLAND N/AO2 Academy Leeds Music Theater 25-year lease that expires
June 23, 20262,300
LIVERPOOL, ENGLAND N/AO2 Academy Liverpool Music Theater 34-year lease that expires
January 22, 20371,200
LONDON, ENGLAND N/AWembley Arena Arena 15-year management agreement
that expires March 31, 202112,750
O2 Academy Brixton Music Theater 98-year lease that expiresDecember 4, 2024
4,920
O2 Shepherds Bush Empire Music Theater Owned 2,000Astoria Music Theater Currently not in operation 1,800Astoria 2 Music Theater Currently not in operation 1,000O2 Academy Islington Music Theater 25-year lease that expires
June 20, 2028800
MANCHESTER, ENGLAND N/AManchester Apollo Music Theater Owned 3,500
NEWCASTLE, ENGLAND N/AO2 Academy Newcastle Music Theater 99-year lease that expires
March 24, 20212,000
NOTTINGHAM, ENGLAND N/AMedia Club Currently not in operation 1,380
OXFORD, ENGLAND N/AO2 Academy Oxford Music Theater 25-year lease that expires
October 30, 20311,020
READING, ENGLAND N/ALittle John’s Farm and Battle Farm Festival Site Owned N/A
15

Market and Venue
DMA®
RegionRank (1) Type of Venue Live Nation’s Interest
EstimatedSeatingCapacity
SHEFFIELD, ENGLAND N/ASheffield Hallam FM Arena Arena 18-year management agreement
that expires March 31, 201111,250
O2 Academy Sheffield Music Theater 35-year lease that expiresJanuary 9, 2043
2,350
SOUTHAMPTON, ENGLAND N/ASouthampton Guildhall Music Theater 25-year management agreement
that expires February 10, 20281,750
AMSTERDAM, HOLLAND N/AHeineken Music Hall Arena 20-year lease that expires
December 31, 20275,500
GLASGOW, SCOTLAND N/AO2 Academy Glasgow Music Theater Owned 2,500King Tuts Wah Wah Hut Club Owned 300Universe Club Currently not in operation 200
GLASGOW, SCOTLAND N/ABalado Airfield (T in the Park) Festival Site One parcel owned/one parcel under
a 10-year lease that expiresAugust 1, 2010
N/A
CARDIFF, WALES N/ACardiff International Arena Arena 137-year lease that expires
December 31, 21316,700
DUBLIN, IRELAND N/AThe O2 Dublin Arena Owned 13,000
STOCKHOLM, SWEDEN N/ACirkus Music Theater 10-year lease that expires
March 31, 20093,000
(1) DMA® region refers to a United States designated market area as of January 1, 2009. At that date, therewere 210 DMA®s. DMA® is a registered trademark of Nielsen Media Research, Inc.
16

Theater Venues
At December 31, 2008, we owned, operated and/or had an equity interest in the following domestic andinternational venues primarily used for theatrical events:
Market and Venue
DMA®
RegionRank (1) Type of Venue Live Nation’s Interest
EstimatedSeatingCapacity
NEW YORK, NY 1Hilton Theatre Theatrical Theater 40-year lease that expires
December 31, 20381,800
PHILADELPHIA, PA 4Chestnut Street Theatre Theatrical Theater Currently not in operation 2,350
BOSTON, MA 7Boston Opera House Theatrical Theater Owned 2,700
BIRMINGHAM, ENGLAND N/AAlexandra Theatre Theatrical Theater 20-year lease that expires
February 20, 20141,350
BRISTOL, ENGLAND N/AThe Bristol Hippodrome Theatrical Theater Owned 1,980
FOLKSTONE, ENGLAND N/ALeas Cliff Hall Theatrical Theater 20-year management agreement
that expires August 20, 20231,510
GRIMSBY, ENGLAND N/AGrimsby Auditorium Theatrical Theater 10-year management agreement
that expires March 31, 20111,700
HASTINGS, ENGLAND N/AWhite Rock Theatre-Hastings Theatrical Theater 11-year management agreement
that expires March 31, 20131,450
LIVERPOOL, ENGLAND N/ALiverpool Empire Theatre Theatrical Theater 125-year lease that expires
June 8, 21272,365
LONDON, ENGLAND N/ALyceum Theatre Theatrical Theater 150-year lease that expires
November 21, 21382,095
Apollo Victoria Theatre Theatrical Theater Owned 2,600The Dominion Theatre Theatrical Theater 33% equity interest 2,100
MANCHESTER, ENGLAND N/APalace Theatre Manchester Theatrical Theater Owned 1,995Opera House Manchester Theatrical Theater Owned 1,915
OXFORD, ENGLAND N/ANew Theatre Oxford Theatrical Theater 15-year lease that expires
December 24, 20221,780
ofs Studio Theatre Theatrical Theater 20-year lease that expiresFebruary 22, 2021
170
17

Market and Venue
DMA®
RegionRank (1) Type of Venue Live Nation’s Interest
EstimatedSeatingCapacity
SOUTHPORT, ENGLAND N/ASouthport Theatre Theatrical Theater 5-year lease that expires
June 5, 20121,600
SUNDERLAND, ENGLAND N/ASunderland Empire Theatrical Theater 25-year management agreement
that expires December 31, 20292,025
TORBAY, ENGLAND N/APrincess Theatre Theatrical Theater 60-year management agreement
that expires November 30, 20581,490
YORK, ENGLAND N/AGrand Opera House York Theatrical Theater Owned 970
EDINBURGH, SCOTLAND N/AThe Edinburgh Playhouse Theatrical Theater Owned 3,055
(1) DMA® region refers to a United States designated market area as of January 1, 2009. At that date, therewere 210 DMA®s. DMA® is a registered trademark of Nielsen Media Research, Inc.
The following table summarizes the number of venues by type that we owned, operated, had booking rightsfor and/or had an equity interest in as of December 31, 2008.
Venue Type Capacity Owned Leased OperatedBookingRights
EquityInterest Total
Music Venues:Festival Site . . . . . . . . . . . . . . . . . . . . . . 10,000 – 120,000 3 — — — — 3Amphitheater . . . . . . . . . . . . . . . . . . . . . 5,000 – 30,000 8 28 7 9 — 52Arena . . . . . . . . . . . . . . . . . . . . . . . . . . . 5,000 – 20,000 1 2 2 5 — 10Music Theater . . . . . . . . . . . . . . . . . . . . 1,000 – 6,500 7 22 3 11 1 44Club . . . . . . . . . . . . . . . . . . . . . . . . . . . . Less than 1,000 3 8 — 8 — 19House of Blues . . . . . . . . . . . . . . . . . . . . 1,000 – 2,000 2 9 — — — 11
Total music venues . . . . . . . . . . . . 24 69 12 33 1 139Theatrical Venues:Theatrical Theater . . . . . . . . . . . . . . . . . Less than 5,000 7 7 5 — 1 20
Total venues . . . . . . . . . . . . . . . . . . 31 76 17 33 2 159
Venues currently not in operation . . . . . 4 6 — — — 10
Competition
Competition in the live music industry is intense. We believe that we compete primarily on the basis of ourability to deliver quality music products and enhanced fan and artist experiences. We believe that our primarystrengths include:
• the quality of service delivered to our artists, fans and corporate sponsors;
• our track record in promoting and producing live music events and tours both domestically andinternationally;
• artists relationships;
• ticketing;
18

• distribution platform (venues);
• the scope and effectiveness of our expertise of marketing and sponsorship programs; and
• our financial stability.
Although we believe that our products and services currently compete favorably with respect to suchfactors, we cannot provide any assurance that we can maintain our competitive position against current andpotential competitors, especially those with significantly greater brand recognition, financial, marketing, service,support, technical and other resources.
In the markets in which we promote music concerts, we face competition from promoters and venueoperators. We believe that barriers to entry into the promotion services business are low and that certain localpromoters are increasingly expanding the geographic scope of their operations.
Our main competitors in the live music industry include Anschutz Entertainment Group, Jam Productionsand Palace Sports & Entertainment, in addition to numerous smaller regional companies and various casinos inNorth America and Europe. Anschutz Entertainment Group operates under a number of different namesincluding AEG Live, Concerts West and The Messina Group. Some of our competitors in the live music industryhave a stronger presence in certain markets, and have access to other sports and entertainment venues, as well asgreater financial resources, which may enable them to gain a greater competitive advantage in relation to us.
In markets where we own and/or operate a venue, we compete with other venues to serve artists likely toperform in that general region. Consequently, touring artists have significant alternatives to our venues inscheduling tours. Our main competitors in venue management include SMG and Anschutz Entertainment Group,in addition to numerous smaller regional companies and various casinos in North America and Europe. Some ofour competitors in venue management have a greater number of venues in certain markets as well as greaterfinancial resources in those markets.
Our main competitors at the local market level for sponsorships consist of local sports teams, which oftenoffer state of the art venues and strong local media packages. Additionally, our competitors locally can includefestivals, theme parks and other local events. On the national level, our competitors include the major sportsleagues that all sell sponsorships combined with significant national media packages.
In the online environment, we compete with other website, online event sites and ticketing companies toprovide event information, sell tickets and provide other online services such as fan clubs and artist websites. Ourmain competitors for online event sites include Ticketmaster and Tickets.com, as well as secondary ticketingcompanies such as StubHub.
Government Regulations
We are subject to federal, state and local laws, both domestically and internationally, governing matterssuch as construction, renovation and operation of our venues, as well as:
• licensing and permitting;
• human health, safety and sanitation requirements;
• the service of food and alcoholic beverages;
• working conditions, labor, minimum wage and hour, citizenship and employment laws;
• compliance with The Americans with Disabilities Act of 1990 and the United Kingdom’s DisabilityDiscrimination Act 1995;
• sales and other taxes and withholding of taxes;
19

• privacy requirements related to ticketing;
• historic landmark rules; and
• environmental protection.
We believe that our venues are in material compliance with these laws. The regulations relating to our foodand support service in our venues are many and complex. A variety of regulations at various governmental levelsrelating to the handling, preparation and serving of food (including, in some cases, requirements relating to thetemperature of food), the cleanliness of food production facilities and the hygiene of food-handling personnel areenforced primarily at the local public health department level.
We also must comply with applicable licensing laws, as well as state and local service laws, commonlycalled dram shop statutes. Dram shop statutes generally prohibit serving alcoholic beverages to certain personssuch as an individual who is intoxicated or a minor. If we violate dram shop laws, we may be liable to thirdparties for the acts of the customer. Although we generally hire outside vendors to provide these services at ourlarger operated venues and regularly sponsor training programs designed to minimize the likelihood of such asituation, we cannot guarantee that intoxicated or minor customers will not be served or that liability for theiracts will not be imposed on us.
We are also required to comply with The Americans with Disabilities Act of 1990, or the ADA, the UnitedKingdom’s Disability Discrimination Act 1995, or the DDA, and certain state statutes and local ordinances that,among other things, require that places of public accommodation, including both existing and newly constructedvenues, be accessible to customers with disabilities. The ADA and DDA require that venues be constructed topermit persons with disabilities full use of a live entertainment venue. The ADA and DDA may also require thatcertain modifications be made to existing venues in order to make them accessible to customers and employeeswho are disabled. In order to comply with the ADA, DDA and other similar ordinances, we may face substantialcapital expenditures in the future.
From time to time, governmental bodies have proposed legislation that could have an effect on our business.For example, some legislatures have proposed laws in the past that would impose potential liability on us andother promoters and producers of live music events for entertainment taxes and for incidents that occur at ourevents, particularly relating to drugs and alcohol.
In addition, we and our venues are subject to extensive environmental laws and regulations relating to theuse, storage, disposal, emission and release of hazardous and non-hazardous substances, as well as zoning andnoise level restrictions which may affect, among other things, the hours of operations of our venues.
Intellectual Property
We create, own and distribute intellectual property worldwide. It is our practice to protect our trademarks,brands, copyrights, patents and other original and acquired works, ancillary goods and services. Our trademarksinclude, among others, the word marks “Live Nation,” “House of Blues” and “The Fillmore,” as well as the LiveNation, House of Blues, and The Fillmore logos. We have registered our most significant trademarks in manyforeign countries. We believe that our trademarks and other proprietary rights have significant value and areimportant to our brand-building efforts and the marketing of our services. We cannot predict, however, whethersteps taken by us to protect our proprietary rights will be adequate to prevent misappropriation of these rights.
Employees
As of December 31, 2008, we had approximately 4,700 full-time employees, including 3,300 domestic and1,400 international employees, of which approximately 4,600 were employed in our operations departments andapproximately 130 were employed in our corporate area.
20

Our staffing needs vary significantly throughout the year. Therefore, we also, from time to time, employpart-time and/or seasonal employees. As of December 31, 2008, we employed approximately 4,800 seasonal and/or part-time employees and during peak seasonal periods, particularly in the summer months, we have employedas many as 12,000 seasonal employees. The stagehands at some of our venues and other employees are subject tocollective bargaining agreements. Our union agreements typically have a term of three years and thus regularlyexpire and require negotiation in the course of our business. We believe that we enjoy good relations with ouremployees and other unionized labor involved in our events, and there have been no significant work stoppagesin the past three years. Upon the expiration of any of our collective bargaining agreements, however, we may beunable to renegotiate our collective bargaining agreements on terms favorable to us, and our business operationsat one or more of our facilities may be interrupted as a result of labor disputes or difficulties and delays in theprocess of renegotiating our collective bargaining agreements. In addition, our business operations at one or moreof our facilities may also be interrupted as a result of labor disputes by outside unions attempting to unionize avenue even though we do not have unionized labor at that venue currently. A work stoppage at one or more ofour owned and/or operated venues or at our produced and/or promoted events could have a material adverseeffect on our business, results of operations and financial condition. We cannot predict the effect that newcollective bargaining agreements will have on our expenses.
Executive Officers
Set forth below are the names, ages and current positions of our executive officers and other significantemployees as of February 23, 2009.
Name Age Position
Michael Rapino . . . . . . . 43 President and Chief Executive Officer and DirectorBrian Capo . . . . . . . . . . 42 Chief Accounting OfficerArthur Fogel . . . . . . . . . 55 Chief Executive Officer—Global Touring and Chairman—Global MusicJason Garner . . . . . . . . . 36 Chief Executive Officer—Global MusicJohn Hopmans . . . . . . . . 50 Executive Vice President—Mergers and Acquisitions and Strategic FinanceNathan Hubbard . . . . . . 33 Chief Executive Officer—TicketingThomas Johansson . . . . 60 Chairman—International MusicAlan Ridgeway . . . . . . . 42 Chief Executive Officer—International MusicMichael Rowles . . . . . . 43 General Counsel and SecretaryBen Weeden . . . . . . . . . 32 Chief Operating Officer—North American MusicKathy Willard . . . . . . . . 42 Chief Financial Officer
Michael Rapino is our President and Chief Executive Officer and has served in this capacity since August2005. He has also served on our board of directors since December 2005. From August 2004 to August 2005,Mr. Rapino was Chief Executive Officer and President of our predecessor’s Global Music division. From July2003 to July 2004, Mr. Rapino served as Chief Executive Officer and President of our predecessor’s InternationalMusic division.
Brian Capo is our Chief Accounting Officer and has served in this capacity since December 2007. Prior tothat, Mr. Capo served as a Senior Finance Director at BMC Software, Inc. from November 2005 to November2007. From August 2004 to October 2005, he served as a Finance Director at Waste Management, Inc. and was aManaging Finance Director at American Electric Power Company, Inc. from November 2002 to July 2004.
Arthur Fogel is the Chief Executive Officer of our Global Touring division and Chairman of our GlobalMusic group and has served in this capacity since 2005. Previously, Mr. Fogel served as President of our MusicTouring division since 1999.
Jason Garner is the Chief Executive Officer of our Global Music group and has served in this capacity sinceSeptember 2008. Prior to that, Mr. Garner held various positions within our North American Music divisionincluding President and Chief Executive Officer.
21

John Hopmans is the Executive Vice President of Mergers and Acquisitions and Strategic Finance and hasserved in this capacity since April 2008. Previously, Mr. Hopmans served in several capacities at Scotia Capitalincluding Managing Director, Industry Head, Private Equity Sponsor Coverage and as Managing Director,Industry Head, Diversified Industries since joining them in 1991.
Nathan Hubbard is the Chief Executive Officer of our Ticketing division and has served in this capacitysince June 2008. From January 2008 to May 2008, Mr. Hubbard served as President of the Ticketing division.Prior to that, Mr. Hubbard was Chief Executive Officer of Musictoday.
Thomas Johansson is the Chairman of our International Music division and has served in this capacity sinceSeptember 2004. Previously, Mr. Johansson served as the Chief Executive Officer of our subsidiary EMA TelstarGroup, a company he founded in April 1969 and which our predecessor acquired in 1999.
Alan Ridgeway is the Chief Executive Officer of our International Music division and has served in thiscapacity since September 2007. From September 2005 to August 2007, Mr. Ridgeway was our Chief FinancialOfficer. Prior to that, Mr. Ridgeway served as President of our European Music division. From October 2003 to2004, Mr. Ridgeway was Chief Operating Officer of the European Music division.
Michael Rowles is our General Counsel and has served in this capacity since March 2006 and as ourSecretary since May 2007. Previously, Mr. Rowles served as General Counsel and Secretary of EntravisionCommunications Corporation since September 2000.
Ben Weeden is the Chief Operating Officer of our North American Music division and has served in thiscapacity since October 2008. Mr. Weeden has worked in the North American Music division since 2005, mostrecently serving as Chief Financial Officer. Prior to joining the North American Music division, Mr. Weedenserved as Director of European Touring of our predecessor from January 2003 to January 2005.
Kathy Willard is our Chief Financial Officer and has served in this capacity since September 2007. FromSeptember 2005 to August 2007, Ms. Willard was our Chief Accounting Officer. Prior to that, Ms. Willardserved as Chief Financial Officer of our predecessor from December 2004 to September 2005. From January2001 to December 2004 she served as Senior Vice President and Chief Accounting Officer of our predecessor.
Available Information
We are required to file annual, quarterly and current reports, proxy statements and other information withthe U.S. Securities and Exchange Commission, or the SEC. You may read and copy any materials we have filedwith the SEC at the SEC’s Public Reference Room at 100 F Street, NE, Washington, DC 20549. You may obtaininformation on the operation of the Public Reference Room by calling the SEC at 1-800-SEC-0330. Our filingswith the SEC are also available to the public through the SEC’s website at www.sec.gov.
You can find more information about us at our internet website located at www.livenation.com. Our AnnualReport on Form 10-K, our Quarterly Reports on Form 10-Q, our Current Reports on Form 8-K and anyamendments to those reports are available free of charge on our internet website as soon as reasonablypracticable after we electronically file such material with the SEC.
22

ITEM 1A. RISK FACTORS
You should carefully consider each of the following risks and all of the other information set forth in thisAnnual Report. The following risks relate principally to our leverage, our convertible notes, our business, ourcommon stock and our separation from Clear Channel. The risks and uncertainties described below are not theonly ones facing our company. Additional risks and uncertainties not presently known to us or that we currentlybelieve to be immaterial may also adversely affect our business. If any of the following risks and uncertaintiesdevelop into actual events, this could have a material adverse effect on our business, financial condition orresults of operations. In that case, the trading price of our common stock could decline.
Risks Associated with Our Leverage
We have a large amount of debt, redeemable preferred stock and lease obligations that could restrict ouroperations and impair our financial condition.
As of December 31, 2008, our total indebtedness for borrowed money, including our redeemable preferredstock and excluding the debt discount on the convertible notes, was approximately $925.7 million. Our availableborrowing capacity under the revolving portion of our senior secured credit facility at that date wasapproximately $120.7 million, with sub-limits up to $235.0 million available for letters of credit. AtDecember 31, 2008, outstanding letters of credit were approximately $42.3 million. We may incur substantialadditional indebtedness in the future.
Our substantial indebtedness could have adverse consequences, including:
• making it more difficult for us to satisfy our obligations;
• increasing our vulnerability to adverse economic, regulatory and industry conditions;
• limiting our ability to obtain additional financing for future working capital, capital expenditures,mergers and other purposes;
• requiring us to dedicate a substantial portion of our cash flow from operations to fund payments on ourdebt, thereby reducing funds available for operations and other purposes;
• limiting our flexibility in planning for, or reacting to, changes in our business and the industry in whichwe operate;
• making us more vulnerable to increases in interest rates;
• placing us at a competitive disadvantage compared to our competitors that have less debt; and
• having a material adverse effect on us if we fail to comply with the covenants in the instrumentsgoverning our debt and redeemable preferred stock.
To service our debt, redeemable preferred stock and lease obligations and to fund potential acquisitions,artist advances and capital expenditures, we will require a significant amount of cash, which depends onmany factors beyond our control.
As of December 31, 2008, approximately $48.6 million of our total indebtedness (excluding interest) is duein 2009, $73.4 million is due in the aggregate for 2010 and 2011, $549.8 million is due in the aggregate for 2012and 2013 and $253.9 million is due thereafter. See the table in Item 7. Management’s Discussion and Analysis ofFinancial Condition and Results of Operations—Contractual Obligations and Commitments—FirmCommitments.
Our redeemable preferred stock bears an annual dividend rate of 13%, or $5.2 million annually, and issubject to financial and other covenants substantially similar to the covenants applicable to our senior secured
23

credit facility. If we exceed certain of these covenants, we will have to pay additional dividends. In addition, asof December 31, 2008, we had approximately $1.1 billion in operating lease agreements, of which approximately$77.9 million is due in 2009 and $72.4 million is due in 2010.
Our ability to service our debt, redeemable preferred stock and lease obligations and to fund potentialacquisitions, artist advances and capital expenditures for venue construction, expansion or renovation will requirea significant amount of cash, which depends on many factors beyond our control. Our ability to make paymentson and to refinance our debt will also depend on our ability to generate cash in the future. This, to an extent, issubject to general economic, financial, competitive, legislative, regulatory and other factors that are beyond ourcontrol.
We cannot assure you that our business will generate sufficient cash flow or that future borrowings will beavailable to us in an amount sufficient to enable us to pay our debt or to fund our other liquidity needs. Wecannot predict the impact to our ability to access additional capital in light of the current uncertainty in the creditmarket. If our future cash flow from operations and other capital resources are insufficient to pay our obligationsas they mature or to fund our liquidity needs, we may be forced to reduce or delay our business activities andcapital expenditures, sell assets, obtain additional equity capital or restructure or refinance all or a portion of ourdebt on or before maturity. We may be subject to limitations on the assets we can sell under the terms of the taxmatters agreement with Clear Channel. In addition, the terms of our existing debt, including our senior securedcredit facility, other future debt and our redeemable preferred stock may limit our ability to pursue any of thesealternatives.
These measures might also be unsuccessful or inadequate in permitting us to meet scheduled debt,redeemable preferred stock or lease service obligations. We may be unable to restructure or refinance ourobligations and obtain additional equity financing or sell assets on satisfactory terms or at all. As a result, theinability to meet our debt, redeemable preferred stock or lease obligations could cause us to default on thoseobligations. Any such defaults could materially harm our financial condition and liquidity.
The agreement governing our senior secured credit facility, our redeemable preferred stock designationsand certain of our other indebtedness impose restrictions on us that limit the discretion of management inoperating our business and that, in turn, could impair our ability to meet our obligations under our debt.
The agreement governing our senior secured credit facility, our redeemable preferred stock designations andcertain of our other indebtedness include restrictive covenants that, among other things, restrict our ability to:
• incur additional debt or issue redeemable preferred stock;
• pay dividends and make distributions;
• make certain investments;
• repurchase our stock and prepay certain indebtedness;
• create liens;
• enter into transactions with affiliates;
• modify the nature of our business;
• enter into sale-leaseback transactions;
• transfer and sell material assets; and
• merge or consolidate.
In addition, our senior secured credit facility and redeemable preferred stock designations include otherrestrictions, including requirements to maintain certain financial ratios. Our failure to comply with the terms and
24

covenants in our indebtedness could lead to a default under the terms of the governing documents, which wouldentitle the lenders to accelerate the indebtedness and declare all amounts owed due and payable. If we defaultunder any of the covenants applicable to our redeemable preferred stock, the holders of our redeemable preferredstock may be entitled to elect a director of one of our subsidiaries, and we will have to pay additional dividends.
These covenants could materially and adversely affect our ability to finance our future operations or capitalneeds. Furthermore, they may restrict our ability to expand, to pursue our business strategies and otherwise toconduct our business. Our ability to comply with these covenants may be affected by circumstances and eventsbeyond our control, such as prevailing economic conditions and changes in regulations, and we cannot assureyou that we will be able to comply. A breach of these covenants could result in a default under our debt. If therewere an event of default under our outstanding indebtedness and the obligations thereunder accelerated, ourassets and cash flow might not be sufficient to repay our outstanding debt and we could be forced intobankruptcy.
We will depend on the cash flows of our subsidiaries in order to satisfy our obligations.
We will rely on distributions and advances from our subsidiaries in order to meet our payment requirementsunder our obligations. If our subsidiaries are unable to pay dividends or otherwise make payments to us, we maynot be able to make debt service payments on our obligations. We are a holding company and conductsubstantially all of our operations through our subsidiaries. Our operating cash flows and consequently our abilityto service our debt is therefore principally dependent upon our subsidiaries’ earnings and their distributions ofthose earnings to us and may also be dependent upon loans, advances or other payments of funds to us by thosesubsidiaries. Our subsidiaries are separate legal entities and may have no obligation, contingent or otherwise, topay any amount due pursuant to our obligations or to make any funds available for that purpose. In addition, theability of our subsidiaries to provide funds to us may be subject to restrictions under our senior secured creditfacility and the outstanding redeemable preferred stock of our subsidiary and may be subject to the terms of suchsubsidiaries’ future indebtedness, as well as the availability of sufficient surplus funds under applicable law.
Any inability to fund the significant up-front cash requirements associated with our touring business couldresult in the loss of key tours.
In order to secure a tour, including global tours by major artists, we are often required to post a letter ofcredit or advance cash to the artist prior to the sale of any tickets for that tour. If we do not have sufficient cashon hand or capacity under our revolving credit facility to advance the necessary cash or post the required letter ofcredit, for any given tour we would not be able to promote that tour and our touring business would be negativelyimpacted.
Risks Relating to our 2.875% Convertible Senior Notes
We may not have the funds necessary to finance the repurchase of the notes or to pay the cash payable upona conversion (if we make the net share settlement election), or we may otherwise be restricted from makingsuch payments, which may increase note holders’ credit risk.
In July 2007, we issued $220 million of 2.875% convertible senior notes due 2027 in a private placement inthe United States to qualified institutional buyers pursuant to Rule 144A under the Securities Act of 1933, asamended. On July 15, 2014, July 15, 2017 and July 15, 2022, or in the event of a fundamental change (as definedin the indenture governing the notes), holders may require us to repurchase their notes at a price of 100% of theprincipal amount of the notes, plus accrued and unpaid interest, including contingent interest and additionalamounts, to the repurchase date. In addition, at any time on or prior to June 15, 2027, we may irrevocably electnet share settlement of the notes, and thereafter we will be required to make a cash payment of up to $1,000 foreach $1,000 in principal amount of notes converted. However, it is possible that we will not have sufficient funds
25

available at such time to make the required repurchase or settlement of converted notes. In addition, some of ourexisting financing agreements contain, and any future credit agreements or other agreements relating to ourindebtedness could contain, provisions prohibiting the repurchase of the notes under certain circumstances, orcould provide that a fundamental change constitutes an event of default under that agreement, restrict our abilityto make cash payments upon conversion of the notes or restrict the ability of our subsidiaries to make fundsavailable to us for that purpose. If any agreement governing our indebtedness prohibits or otherwise restricts usfrom repurchasing the notes or making the cash payment upon conversion when we become obligated to do so,we could seek the consent of the lenders to repurchase the notes or settle the conversion or attempt to refinancethe other debt. If we do not obtain such a consent or refinance the debt, we would not be permitted to repurchasethe notes or settle the conversion without potentially causing a default under the other debt. Our failure torepurchase tendered notes or to pay any cash payable on a conversion would constitute an event of default underthe indenture, which might constitute a default under the terms of our other indebtedness.
The additional shares of common stock payable on any notes converted in connection with specifiedcorporate transactions may not adequately compensate holders of notes for any loss they may experience asa result of such specified corporate transactions.
If certain specified corporate transactions occur on or prior to July 15, 2014, we will under certaincircumstances increase the conversion rate on notes converted in connection with the specified corporatetransaction by a number of additional shares of common stock. The number of additional shares of commonstock will be determined based on the date on which the specified corporate transaction becomes effective andthe price paid per share of our common stock in the specified corporate transaction. The additional shares ofcommon stock issuable upon conversion of the notes in connection with a specified corporate transaction maynot adequately compensate holders of notes for any loss they may experience as a result of such specifiedcorporate transaction. Furthermore, holders of notes will not receive the additional consideration payable as aresult of the increase in the conversion rate until the effective date of the specified corporate transaction or later,which could be a significant period of time after holders of notes have tendered their notes for conversion. If thespecified corporate transaction occurs after July 15, 2014, or if the price paid per share of our common stock inthe specified corporate transaction is less than the common stock price at the date of issuance of the notes orabove a specified price, there will be no increase in the conversion rate. In addition, in certain circumstancesupon a change of control arising from our acquisition by a public company, we may elect to adjust the conversionrate and, if we so elect, holders of notes will not be entitled to the increase in the conversion rate determined asdescribed above.
The conditional conversion feature of the notes could result in holders of notes receiving less than the valueof the common stock for which a note would otherwise be convertible.
Prior to July 15, 2027, the notes are convertible for shares of our common stock (or cash or a combination ofcash and shares of our common stock) only if specified conditions are met. If the specific conditions forconversion are not met, holders of notes will not be able to convert their notes, and they may not be able toreceive the value of the common stock or cash and common stock, as applicable, for which the notes wouldotherwise be convertible.
Upon conversion of the notes, holders of notes may receive less proceeds than expected because the value ofour common stock may decline after the exercise of the conversion right.
If we elect to settle conversions other than solely in shares of common stock, including by making a netshare settlement election, the conversion value that holders of notes will receive upon conversion of their notesare in part determined, subject to certain exceptions, by the average of the last reported sale prices of ourcommon stock for the 20 trading days beginning on the second trading day immediately following the day thenotes are tendered for conversion, or, if tendered within the 20 days leading up to the maturity date or a specifiedredemption date, beginning on the fifth day following the maturity date or the redemption date. Accordingly, if
26

the price of our common stock decreases after holder of notes tender their notes for conversion, the conversionvalue they will receive may be adversely affected.
The conversion rate of the notes may not be adjusted for all dilutive events.
The conversion rate of the notes is subject to adjustment only for certain specified events, including, but notlimited to, the issuance of stock dividends on our common stock, the issuance of certain rights or warrants,subdivisions, combinations, distributions of capital stock, indebtedness or assets, cash dividends and certainissuer tender or exchange offers. However, the conversion rate will not be adjusted for other events, such as anissuance of common stock for cash or acquisition, that may adversely affect the trading price of the notes or thecommon stock, or for a third-party tender offer. For example, the conversion rate will not be adjusted as a resultof our pending merger with Ticketmaster.
Risks Relating to Our Business
Our live music business is highly sensitive to public tastes and dependent on our ability to secure popularartists and other live music events, and we may be unable to anticipate or respond to changes in consumerpreferences, which may result in decreased demand for our services.
Our ability to generate revenue from our music operations is highly sensitive to rapidly changing publictastes and dependent on the availability of popular artists and events. Our success depends in part on our abilityto anticipate the tastes of consumers and to offer events that appeal to them. Since we rely on unrelated parties tocreate and perform live music content, any unwillingness to tour or lack of availability of popular artists couldlimit our ability to generate revenue. In particular, there are a limited number of artists that can headline a majorNorth American or global tour or who can sell out larger venues, including many of our amphitheaters. If thosekey artists do not continue to tour, or if we are unable to secure the rights to their future tours, then our businesswould be adversely affected.
In addition, we typically book our live music tours one to four months in advance of the beginning of thetour and often agree to pay an artist a fixed guaranteed amount prior to our receiving any operating income.Therefore, if the public is not receptive to the tour or we or a performer cancel the tour, we may incur a loss forthe tour depending on the amount of the fixed guarantee or incurred costs relative to any revenue earned, as wellas foregone revenue we could have earned at booked venues. We have cancellation insurance policies in place tocover a portion of our losses if a performer cancels a tour. Furthermore, consumer preferences change from timeto time, and our failure to anticipate, identify or react to these changes could result in reduced demand for ourservices, which would adversely affect our operating results and profitability.
We have incurred net losses and may experience future net losses.
Our operating results from continuing operations have been adversely affected by, among other things,event profitability and overhead costs. We incurred net losses of approximately $326.4 million, $52.9 million and$43.4 million in 2008, 2007 and 2006, respectively. We may face reduced demand for our live music events andother factors that could adversely affect our results of operations in the future. We cannot predict whether we willachieve profitability in future periods.
Our operations are seasonal and our results of operations vary from quarter to quarter and year over year,so our financial performance in certain financial quarters or years may not be indicative of, or comparableto, our financial performance in subsequent financial quarters or years.
We believe our financial results and cash needs will vary greatly from quarter to quarter and year to yeardepending on, among other things, the timing of tours, tour cancellations, capital expenditures, seasonal and
27

other fluctuations in our operating results, the timing of guaranteed payments and receipt of ticket sales,financing activities, acquisitions and investments and receivables management. Because our results may varysignificantly from quarter to quarter and year to year, our financial results for one quarter or year cannotnecessarily be compared to another quarter or year and may not be indicative of our future financial performancein subsequent quarters or years. Typically, we experience our lowest financial performance in the first and fourthquarters of the calendar year as our outdoor venues are primarily used, and our festivals primarily occur, duringMay through September. In addition, the timing of tours of top grossing acts can impact comparability ofquarterly results year over year and potentially annual results.
The following table sets forth our operating income (loss) for the last eight fiscal quarters:
(in thousands)
Fiscal Quarter EndedOperating
income (loss)
March 31, 2007 . . . . . . . . . . . . . . . . . . . . . . . . . . . . . . . . . . . . . . . . . . . . . . . . . . . . . . . . . . . . . . . . . . . $ (64,397)June 30, 2007 . . . . . . . . . . . . . . . . . . . . . . . . . . . . . . . . . . . . . . . . . . . . . . . . . . . . . . . . . . . . . . . . . . . . . $ 36,468September 30, 2007 . . . . . . . . . . . . . . . . . . . . . . . . . . . . . . . . . . . . . . . . . . . . . . . . . . . . . . . . . . . . . . . . $ 68,774December 31, 2007 . . . . . . . . . . . . . . . . . . . . . . . . . . . . . . . . . . . . . . . . . . . . . . . . . . . . . . . . . . . . . . . . $ (24,002)March 31, 2008 . . . . . . . . . . . . . . . . . . . . . . . . . . . . . . . . . . . . . . . . . . . . . . . . . . . . . . . . . . . . . . . . . . . $ (70,338)June 30, 2008 . . . . . . . . . . . . . . . . . . . . . . . . . . . . . . . . . . . . . . . . . . . . . . . . . . . . . . . . . . . . . . . . . . . . . $ 27,834September 30, 2008 . . . . . . . . . . . . . . . . . . . . . . . . . . . . . . . . . . . . . . . . . . . . . . . . . . . . . . . . . . . . . . . . $ 75,479December 31, 2008 . . . . . . . . . . . . . . . . . . . . . . . . . . . . . . . . . . . . . . . . . . . . . . . . . . . . . . . . . . . . . . . . $(317,135)
We may be adversely affected by the current, or any future, general deterioration in economic conditions,which could affect consumer and corporate spending and, therefore, significantly adversely impact ouroperating results.
A decline in attendance at or reduction in the number of live music events may have an adverse effect onour revenue and operating income. In addition, during past economic slowdowns and recessions, manyconsumers reduced their discretionary spending and advertisers reduced their advertising expenditures. Theimpact of slowdowns on our business is difficult to predict, but they may result in reductions in ticket sales,sponsorship opportunities and our ability to generate revenue. The risks associated with our businesses maybecome more acute in periods of a slowing economy or recession, which may be accompanied by a decrease inattendance at live music events.
Our business depends on discretionary consumer and corporate spending. Many factors related to corporatespending and discretionary consumer spending, including economic conditions affecting disposable consumerincome such as employment, fuel prices, interest and tax rates and inflation can significantly impact ouroperating results. Business conditions, as well as various industry conditions, including corporate marketing andpromotional spending and interest levels, can also significantly impact our operating results. These factors canaffect attendance at our events, premium seats, sponsorship, advertising and hospitality spending, concession andsouvenir sales, as well as the financial results of sponsors of our venues, events and the industry. Negative factorssuch as challenging economic conditions, public concerns over terrorism and security incidents, particularlywhen combined, can impact corporate and consumer spending, and one negative factor can impact our resultsmore than another. There can be no assurance that consumer and corporate spending will not be adverselyimpacted by current economic conditions, or by any further or future deterioration in economic conditions,thereby possibly impacting our operating results and growth.
Loss of our key promoters, management and other personnel could result in the loss of key tours andnegatively impact our business.
The live music business is uniquely dependent upon personal relationships, as promoters and executiveswithin the live music companies such as ours leverage their existing network of relationships with artists, agents
28

and managers in order to secure the rights to the live music tours and events which are critical to our success.Due to the importance of those industry contacts to our business, the loss of any of our promoters, officers orother key personnel could adversely affect our operations. Although we have entered into long-term agreementswith many of those individuals to protect our interests in those relationships, we can give no assurance that all orany of these key employees will remain with us or will retain their associations with key business contacts.
Doing business in foreign countries creates risks not found in doing business in the United States.
Our international operations accounted for approximately 36% of our revenue in 2008. The risks involved inforeign operations that could result in losses against which we are not insured include:
• exposure to local economic conditions;
• potential adverse changes in the diplomatic relations of foreign countries with the United States;
• restrictions on the withdrawal of foreign investment and earnings;
• investment restrictions or requirements on businesses owned by foreigners;
• expropriations of property;
• potential instability of foreign governments;
• risks of renegotiation or modification of existing agreements with governmental authorities;
• diminished ability to legally enforce our contractual rights in foreign countries;
• foreign exchange restrictions;
• withholding and other taxes on remittances and other payments by subsidiaries; and
• changes in foreign taxation structures.
In addition, we may incur substantial tax liabilities if we repatriate any of the cash generated by ourinternational operations back to the United States due to our current inability to recognize any foreign tax creditsthat would be associated with such repatriation. We could repatriate some of the cash generated by ourinternational operations and to use certain of our substantial net operating losses to offset associated taxliabilities. We are not currently in a position to recognize any tax assets in the United States that are the result ofpayments of income or withholding taxes in foreign jurisdictions.
Exchange rates may cause fluctuations in our results of operations that are not related to our operations.
Because we own assets overseas and derive revenue from our international operations, we may incurcurrency translation losses or gains due to changes in the values of foreign currencies relative to the United StatesDollar. We cannot predict the effect of exchange rate fluctuations upon future operating results. For the yearended December 31, 2008, our international operations accounted for approximately 36% of our revenue.Although we cannot predict the future relationship between the United States Dollar and the currencies used byour international businesses, principally the British Pound and the Euro, in 2008, 2007 and 2006, we experiencedforeign exchange rate net gains of $2.3 million, $4.5 million and $3.2 million, respectively, for those periods,which had a positive effect on our operating income. See Item 7. Management’s Discussion and Analysis ofFinancial Condition and Results of Operations—Quantitative and Qualitative Disclosure about Market Risk.
We may enter into future acquisitions and long-term artist rights arrangements and take certain actions inconnection with such transactions that could affect the price of our common stock.
As part of our growth strategy, we expect to review acquisition prospects that would offer growthopportunities, such as our pending merger with Ticketmaster discussed under “—Risks Relating to the PendingMerger with Ticketmaster.”
29

We also may enter into additional long-term arrangements with certain artists under which we wouldacquire the rights to certain music-related activities, including touring, merchandising, recording, online fanclubs, film/DVD and other rights. In the event of future acquisitions or artist rights arrangements, we could:
• use a significant portion of our available cash;
• issue equity securities, which would dilute current stockholders’ percentage ownership;
• incur substantial debt;
• incur or assume contingent liabilities, known or unknown;
• incur amortization expenses related to intangibles; and
• incur large, immediate accounting write-offs.
Such actions by us could harm our results from operations and adversely affect the price of our commonstock.
We may be unsuccessful in our future acquisition endeavors, if any, which may have an adverse effect onour business. Our compliance with antitrust, competition and other regulations may limit our operationsand future acquisitions.
Our future growth rate depends in part on our selective acquisition of additional businesses. A significantportion of our growth has been attributable to acquisitions, including, among others, our acquisitions of HOBEntertainment, Inc., or HOB, Concert Productions International, or CPI, and an equity interest in Academy MusicHoldings Limited, or AMG. We may be unable to identify other suitable targets for further acquisition or makefurther acquisitions at favorable prices. If we identify a suitable acquisition candidate, our ability to successfullyimplement the acquisition would depend on a variety of factors, including our ability to obtain financing onacceptable terms and requisite government approvals. Acquisitions involve risks, including those associated with:
• integrating the operations, financial reporting, technologies and personnel of acquired companies;
• managing geographically dispersed operations;
• the diversion of management’s attention from other business concerns;
• the inherent risks in entering markets or lines of business in which we have either limited or no directexperience; and
• the potential loss of key employees, customers and strategic partners of acquired companies.
We may not successfully integrate any businesses or technologies we may acquire in the future and may notachieve anticipated revenue and cost benefits. Acquisitions may be expensive, time consuming and may strainour resources. Acquisitions may not be accretive to our earnings and may negatively impact our results ofoperations as a result of, among other things, the incurrence of debt, one-time write-offs of goodwill andamortization expenses of other intangible assets. In addition, future acquisitions that we may pursue could resultin dilutive issuances of equity securities.
We are also subject to laws and regulations, including those relating to antitrust, that could significantlyaffect our ability to expand our business through acquisitions. For example, the Federal Trade Commission andthe Antitrust Division of the United States Department of Justice with respect to our domestic acquisitions, andthe European Commission (the antitrust regulator of the European Union) and the United Kingdom CompetitionCommission with respect to our European acquisitions, have the authority to challenge our acquisitions onantitrust grounds before or after the acquisitions are completed. State agencies may also have standing tochallenge these acquisitions under state or federal antitrust law. Comparable authorities in other jurisdictions alsohave the ability to challenge our foreign acquisitions. Our failure to comply with all applicable laws andregulations could result in, among other things, regulatory actions or legal proceedings against us, the imposition
30

of fines, penalties or judgments against us or significant limitations on our activities. In addition, the regulatoryenvironment in which we operate is subject to change. New or revised requirements imposed by governmentalregulatory authorities could have adverse effects on us, including increased costs of compliance. We also may beadversely affected by changes in the interpretation or enforcement of existing laws and regulations by thesegovernmental authorities.
In addition, restrictions contained in the tax matters agreement between us and Clear Channel, the creditagreement for the senior secured credit facility and the terms of our subsidiary’s redeemable preferred stockrestrict our ability to make acquisitions.
There is the risk of personal injuries and accidents in connection with our live music events, which couldsubject us to personal injury or other claims and increase our expenses, as well as reduce attendance at ourlive music events, causing a decrease in our revenue.
There are inherent risks involved with producing live music events. As a result, personal injuries andaccidents have, and may, occur from time to time, which could subject us to claims and liabilities for personalinjuries. Incidents in connection with our live music events at any of our venues or venues that we rent could alsoresult in claims, reducing operating income or reducing attendance at our events, causing a decrease in ourrevenue. We are currently subject to wrongful death claims, as well as other litigation. While we maintaininsurance polices that provide coverage within limits that are sufficient, in management’s judgment, to protect usfrom material financial loss for personal injuries sustained by persons at our venues or accidents in the ordinarycourse of business, there can be no assurance that such insurance will be adequate at all times and in allcircumstances.
The success of our ticketing operations depends, in part, on the integrity of our systems and infrastructures.System interruption and the lack of integration and redundancy in these systems and infrastructures mayhave an adverse impact on our business, financial condition and results of operations.
The success of our ticketing operations depends, in part, on our ability to maintain the integrity of oursystems and infrastructures, including websites, information and related systems, call centers and distribution andfulfillment facilities. System interruption and the lack of integration and redundancy in the information systemsand infrastructures of our ticketing operations may adversely affect our ability to operate websites, process andfulfill transactions, respond to customer inquiries and generally maintain cost-efficient operations. We mayexperience occasional system interruptions that make some or all systems or data unavailable or prevent us fromefficiently providing services or fulfilling orders. We also rely on affiliate and third-party computer systems,broadband and other communications systems and service providers in connection with the provision of servicesgenerally, as well as to facilitate, process and fulfill transactions. Any interruptions, outages or delays in thesystems and infrastructures of our business, our affiliates and/or third parties, or deterioration in the performanceof these systems and infrastructures, could impair the ability of our business to provide services, fulfill ordersand/or process transactions. Fire, flood, power loss, telecommunications failure, hurricanes, tornadoes,earthquakes, acts of war or terrorism, acts of God and similar events or disruptions may damage or interruptcomputer, broadband or other communications systems and infrastructures at any time. Any of these events couldcause system interruption, delays and loss of critical data, and could prevent us from providing services, fulfillingorders and/or processing transactions. While we have backup systems for certain aspects of our operations, thesesystems are not fully redundant and disaster recovery planning is not sufficient for all eventualities. In addition,we may not have adequate insurance coverage to compensate for losses from a major interruption. If any of theseadverse events were to occur, it could adversely affect our business, financial condition and results of operations.
The processing, storage, use and disclosure of personal data could give rise to liabilities as a result ofgovernmental regulation, conflicting legal requirements or differing views of personal privacy rights.
In the processing of consumer transactions, we receive, transmit and store a large volume of personallyidentifiable information and other user data. The sharing, use, disclosure and protection of this information are
31

governed by the respective privacy and data security policies maintained by our business. Moreover, there arefederal, state and international laws regarding privacy and the storing, sharing, use, disclosure and protection ofpersonally identifiable information and user data. Specifically, personally identifiable information is increasinglysubject to legislation and regulations in numerous jurisdictions around the world, the intent of which is to protectthe privacy of personal information that is collected, processed and transmitted in or from the governingjurisdiction. We could be adversely affected if legislation or regulations are expanded to require changes inbusiness practices or privacy policies, or if governing jurisdictions interpret or implement their legislation orregulations in ways that negatively affect our business, financial condition and results of operations.
We may also become exposed to potential liabilities as a result of differing views on the privacy of theconsumer and other user data collected by our business. The failure of us and/or the various third-party vendorsand service providers with which we do business, to comply with applicable privacy policies or federal, state orsimilar international laws and regulations or any compromise of security that results in the unauthorized releaseof personally identifiable information or other user data could damage the reputation of our business, discouragepotential users from trying the products and services that we offer and/or result in fines and/or proceedings bygovernmental agencies and/or consumers, one or all of which could adversely affect our business, financialcondition and results of operations.
Costs associated with, and our ability to obtain, adequate insurance could adversely affect our profitabilityand financial condition.
Heightened concerns and challenges regarding property, casualty, liability, business interruption and otherinsurance coverage have resulted from terrorist and related security incidents. As a result, we may experienceincreased difficulty obtaining high policy limits of coverage at reasonable costs, including coverage for acts ofterrorism. We have a material investment in property and equipment at each of our venues, which are generallylocated near major cities and which hold events typically attended by a large number of fans. At December 31,2008, we had property and equipment with a net book value of approximately $887.7 million.
These operational, geographical and situational factors, among others, may result in significant increases ininsurance premium costs and difficulties obtaining sufficiently high policy limits with deductibles that we believeto be reasonable. We cannot assure you that future increases in insurance costs and difficulties obtaining highpolicy limits will not adversely impact our profitability, thereby possibly impacting our operating results andgrowth.
In addition, we enter into various agreements with artists from time to time, including long-term artist rightsarrangements. The profitability of those arrangements depends upon those artists’ willingness and ability tocontinue performing, and we may not be able to obtain sufficient insurance coverage at reasonable costs toadequately protect us against the death, disability or other failure of such artists to continue engaging in revenue-generating activities under those agreements.
We cannot guarantee that our insurance policy coverage limits, including insurance coverage for property,casualty, liability, artists and business interruption losses and acts of terrorism, would be adequate under thecircumstances should one or multiple events occur at or near any of our venues, or that our insurers would haveadequate financial resources to sufficiently or fully pay our related claims or damages. We cannot guarantee thatadequate coverage limits will be available, offered at reasonable costs, or offered by insurers with sufficientfinancial soundness. The occurrence of such an incident or incidents affecting any one or more of our venuescould have a material adverse effect on our financial position and future results of operations if asset damageand/or company liability were to exceed insurance coverage limits or if an insurer were unable to sufficiently orfully pay our related claims or damages.
32

Costs associated with capital improvements could adversely affect our profitability and liquidity.
Growth or maintenance of our existing revenue depends in part on consistent investment in our venues.Therefore, we expect to continue to make substantial capital improvements in our venues to meet long-termincreasing demand, to increase entertainment value and to increase revenue. We frequently have a number ofsignificant capital projects underway. Numerous factors, many of which are beyond our control, may influencethe ultimate costs and timing of various capital improvements at our venues, including:
• availability of financing on favorable terms;
• unforeseen changes in design;
• increases in the cost of construction materials and labor;
• additional land acquisition costs;
• fluctuations in foreign exchange rates;
• litigation, accidents or natural disasters affecting the construction site;
• national or regional economic changes;
• environmental or hazardous conditions; and
• undetected soil or land conditions.
The amount of capital expenditures can vary significantly from year to year. In addition, actual costs couldvary materially from our estimates if the factors listed above and our assumptions about the quality of materialsor workmanship required or the cost of financing such construction were to change. Construction is also subjectto governmental permitting processes which, if changed, could materially affect the ultimate cost.
We are subject to extensive governmental regulation, and our failure to comply with these regulations couldadversely affect our business, results of operations and financial condition.
Our live music venue operations are subject to federal, state and local laws, both domestically andinternationally, governing matters such as construction, renovation and operation of our venues, as well as:
• licensing and permitting;
• human health, safety and sanitation requirements;
• requirements with respect to the service of food and alcoholic beverages;
• working conditions, labor, minimum wage and hour, citizenship and employment laws;
• compliance with the ADA and the DDA;
• sales and other taxes and withholding of taxes;
• privacy requirements related to ticketing;
• historic landmark rules; and
• environmental protection laws.
We cannot predict the extent to which any future laws or regulations will impact our operations. Theregulations relating to our food and support service in our venues are many and complex. Although we generallycontract with a third-party vendor for these services at our owned and/or operated venues, we cannot assure youthat we or our third-party vendors are in full compliance with all applicable laws and regulations at all times orthat we or our third-party vendors will be able to comply with any future laws and regulations or that we will notbe held liable for violations by third-party vendors. Furthermore, additional or amended regulations in this areamay significantly increase the cost of compliance.
33

We also serve alcoholic beverages at many of our venues during live music events and must comply withapplicable licensing laws, as well as state and local service laws, commonly called dram shop statutes. Dramshop statutes generally prohibit serving alcoholic beverages to certain persons such as an individual who isintoxicated or a minor. If we violate dram shop laws, we may be liable to third parties for the acts of thecustomer. Although we generally hire outside vendors to provide these services at our operated venues andregularly sponsor training programs designed to minimize the likelihood of such a situation, we cannot guaranteethat intoxicated or minor customers will not be served or that liability for their acts will not be imposed on us.We cannot assure you that additional regulation in this area would not limit our activities in the future orsignificantly increase the cost of regulatory compliance. We must also obtain and comply with the terms oflicenses in order to sell alcoholic beverages in the states in which we serve alcoholic beverages.
From time to time, governmental bodies have proposed legislation that could have an effect on our business.For example, some legislatures have proposed laws in the past that would impose potential liability on us andother promoters and producers of live music events for entertainment taxes and for incidents that occur at ourevents, particularly relating to drugs and alcohol.
We and our venues are subject to extensive environmental laws and regulations relating to the use, storage,disposal, emission and release of hazardous and non-hazardous substances, as well as zoning and noise levelrestrictions which may affect, among other things, the hours of operations of our venues. Additionally, certainlaws and regulations could hold us strictly, jointly and severally responsible for the remediation of hazardoussubstance contamination at our facilities or at third-party waste disposal sites, and could hold us responsible forany personal or property damage related to any contamination.
We face intense competition in the live music industry, and we may not be able to maintain or increase ourcurrent revenue, which could adversely affect our financial performance.
Our business segments are in highly competitive industries, and we may not be able to maintain or increaseour current live music revenue. We compete in the live music industry, and within this industry we compete withother venues to book performers, and, in the markets in which we promote music concerts, we face competitionfrom other promoters and venue operators. Our competitors also compete with us for key employees who haverelationships with popular music artists that have a history of being able to book such artists for concerts andtours. These competitors may engage in more extensive development efforts, undertake more far-reachingmarketing campaigns, adopt more aggressive pricing policies and make more attractive offers to existing andpotential artists. Our competitors may develop services, advertising options or music venues that are equal orsuperior to those we provide or that achieve greater market acceptance and brand recognition than we achieve. Itis possible that new competitors may emerge and rapidly acquire significant market share. Other variables thatcould adversely affect our financial performance by, among other things, leading to decreases in overall revenue,the numbers of advertising customers, event attendance, ticket prices or profit margins include:
• an increased level of competition for advertising dollars, which may lead to lower sponsorships as weattempt to retain advertisers or which may cause us to lose advertisers to our competitors offeringbetter programs that we are unable or unwilling to match;
• unfavorable fluctuations in operating costs, including increased guarantees to performers, which wemay be unwilling or unable to pass through to our customers;
• our competitors may offer more favorable terms than we do in order to obtain agreements for newvenues or to obtain events for the venues they operate;
• technological changes and innovations that we are unable to adopt or are late in adopting that offermore attractive entertainment alternatives than we currently offer, which may lead to reduction inattendance at live events, a loss of ticket sales or to lower ticket prices;
• other entertainment options available to our audiences that we do not offer;
34

• unfavorable changes in labor conditions which may require us to spend more to retain and attract keyemployees; and
• unfavorable shifts in population and other demographics which may cause us to lose audiences aspeople migrate to markets where we have a smaller presence, or which may cause sponsors to beunwilling to pay for sponsorship and advertising opportunities if the general population shifts into aless desirable age or geographical demographic from an advertising perspective.
We believe that barriers to entry into the live music promotion business are low and that certain localpromoters are increasingly expanding the geographic scope of their operations.
We depend upon unionized labor for the provision of some of our services and any work stoppages or labordisturbances could disrupt our business.
The stagehands at some of our venues and other employees are subject to collective bargaining agreements.Our union agreements typically have a term of three years and thus regularly expire and require negotiation in thecourse of our business. Upon the expiration of any of our collective bargaining agreements, however, we may beunable to negotiate new collective bargaining agreements on terms favorable to us, and our business operationsmay be interrupted as a result of labor disputes or difficulties and delays in the process of renegotiating ourcollective bargaining agreements. In addition, our business operations at one or more of our facilities may also beinterrupted as a result of labor disputes by outside unions attempting to unionize a venue even though we do nothave unionized labor at that venue currently. A work stoppage at one or more of our owned and/or operatedvenues or at our produced and/or promoted events could have a material adverse effect on our business, results ofoperations and financial condition. We cannot predict the effect that new collective bargaining agreements willhave on our expenses.
We are dependent upon our ability to lease, acquire and develop live music venues, and if we are unable todo so on acceptable terms, or at all, our results of operations could be adversely affected.
We require access to venues to generate revenue from live music events. For these events, we use venuesthat we own, but we also operate a number of our live music venues under various agreements which includeleases with third parties or equity or booking agreements, which are agreements where we contract to book theevents at a venue for a specific period of time. Our long-term success in the live music business will depend inpart on the availability of venues, our ability to lease these venues and our ability to enter into bookingagreements upon their expiration. As many of these agreements are with third parties over whom we have littleor no control, we may be unable to renew these agreements or enter into new agreements on acceptable terms orat all, and may be unable to obtain favorable agreements with venues. Our ability to renew these agreements orobtain new agreements on favorable terms depends on a number of other factors, many of which are also beyondour control, such as national and local business conditions and competition from other promoters. If the cost ofrenewing these agreements is too high or the terms of any new agreement with a new venue are unacceptable orincompatible with our existing operations, we may decide to forego these opportunities. There can be noassurance that we will be able to renew these agreements on acceptable terms or at all, or that we will be able toobtain attractive agreements with substitute venues, which could have a material adverse effect on our results ofoperations.
We plan to continue to expand our operations through the development of live music venues and theexpansion of existing live music venues, which poses a number of risks, including:
• construction of live music venues may result in cost overruns, delays or unanticipated expenses;
• desirable sites for live music venues may be unavailable or costly; and
• the attractiveness of our venue locations may deteriorate over time.
35

Additionally, the market potential of live music venues sites cannot be precisely determined, and our livemusic venues may face competition in markets from unexpected sources. Newly constructed live music venuesmay not perform up to our expectations. We face significant competition for potential live music venue locationsand for opportunities to acquire existing live music venues. Because of this competition, we may be unable toadd to or maintain the number of our live music venues on terms we consider acceptable.
Our revenues depend in part on the promotional success of our marketing campaigns, and there can be noassurance that such advertising, promotional and other marketing campaigns will be successful or willgenerate revenue or profits.
Similar to many companies, we spend significant amounts on advertising, promotional and other marketingcampaigns for our live music events and other business activities. Such marketing activities include, amongothers, promotion of ticket sales, premium seat sales, hospitality and other services for our events and venues andadvertising associated with our distribution of related souvenir merchandise and apparel. During 2008, we spentapproximately 4.5% of our revenue on marketing, including advertising, and there can be no assurance that suchadvertising, promotional and other marketing campaigns will be successful or will generate revenue or profits.
Poor weather adversely affects attendance at our live music events, which could negatively impact ourfinancial performance from period to period.
We promote many live music events. Weather conditions surrounding these events affect sales of tickets,concessions and souvenirs, among other things. Poor weather conditions can have a material effect on our resultsof operations particularly because we promote a finite number of events. Due to weather conditions, we may berequired to reschedule an event to another available day or a different venue, which would increase our costs forthe event and could negatively impact the attendance at the event, as well as food, beverage and merchandisesales. Poor weather can affect current periods as well as successive events in future periods. If we are unable toreschedule events due to poor weather, we are forced to refund the tickets for those events.
We may be adversely affected by the occurrence of extraordinary events, such as terrorist attacks.
The occurrence and threat of extraordinary events, such as terrorist attacks, intentional or unintentionalmass-casualty incidents, natural disasters or similar events, may substantially decrease the use of and demand forour services and the attendance at live music events, which may decrease our revenue or expose us to substantialliability. The terrorism and security incidents in the past, military actions in Iraq and other locations, and periodicelevated terrorism alerts have raised numerous challenging operating factors, including public concerns regardingair travel, military actions and additional national or local catastrophic incidents, causing a nationwide disruptionof commercial and leisure activities.
Following past terrorism actions, some artists refused to travel or book tours, which adversely affected ourmusic business. The occurrence or threat of future terrorist attacks, military actions by the United States,contagious disease outbreaks, natural disasters such as earthquakes and severe floods or similar events cannot bepredicted, and their occurrence can be expected to negatively affect the economies of the United States and otherforeign countries where we do business.
Risks Relating to Our Common Stock
We cannot predict the prices at which our common stock may trade.
Our stock price has fluctuated between $2.73 and $25.63 since the spin-off in December 2005. The marketprice of our common stock may continue to fluctuate significantly due to a number of factors, some of whichmay be beyond our control, including:
• our quarterly or annual earnings, or those of other companies in our industry;
36

• actual or anticipated fluctuations in our operating results due to the seasonality of our business andother factors related to our business;
• our loss or inability to obtain significant popular artists;
• changes in accounting standards, policies, guidance, interpretations or principles;
• announcements by us or our competitors of significant contracts or acquisitions;
• the publication by securities analysts of financial estimates or reports about our business;
• changes by securities analysts of earnings estimates or reports, or our inability to meet those estimatesor achieve any goals described in those reports;
• the disclosure of facts about our business that may differ from those assumed by securities analysts inpreparing their estimates or reports about our company;
• the operating and stock price performance of other comparable companies;
• overall market fluctuations; and
• general economic conditions.
In particular, the realization of any of the risks described in these Risk Factors could have a significant andadverse impact on the market price of our common stock.
The price of our common stock may fluctuate significantly, and investors could lose all or part of the valueof their common stock.
In recent years, the stock market has experienced extreme price and volume fluctuations. This volatility hashad a significant impact on the market price of securities issued by many companies, including companies in ourindustry. The changes frequently appear to occur without regard to the operating performance of thesecompanies. The price of our common stock could fluctuate based upon factors that have little or nothing to dowith our company, and these fluctuations could materially reduce our stock price.
In the past, some companies that have had volatile market prices for their securities have been subject tosecurities class action suits filed against them. If a suit were to be filed against us, regardless of the outcome, itcould result in substantial legal costs and a diversion of our management’s attention and resources. This couldhave a material adverse effect on our business, results of operations and financial condition.
Our corporate governance documents, rights agreement and Delaware law may delay or prevent anacquisition of us that stockholders may consider favorable, which could decrease the value of ourcommon stock.
Our amended and restated certificate of incorporation and amended and restated bylaws and Delaware lawcontain provisions that could make it more difficult for a third party to acquire us without the consent of ourboard of directors. These provisions include restrictions on the ability of our stockholders to remove directorsand supermajority voting requirements for stockholders to amend our organizational documents, a classifiedboard of directors and limitations on action by our stockholders by written consent. Two of our ten directors arealso directors of Clear Channel. In addition, our board of directors has the right to issue preferred stock withoutstockholder approval, which could be used to dilute the stock ownership of a potential hostile acquirer. Delawarelaw, for instance, also imposes some restrictions on mergers and other business combinations between any holderof 15% or more of our outstanding common stock and us. Although we believe these provisions protect ourstockholders from coercive or otherwise unfair takeover tactics and thereby provide for an opportunity to receivea higher bid by requiring potential acquirers to negotiate with our board of directors, these provisions apply evenif the offer may be considered beneficial by some stockholders.
37

Our amended and restated certificate of incorporation provides that, subject to any written agreement to thecontrary, which agreement does not currently exist, Clear Channel will have no duty to refrain from engaging inthe same or similar business activities or lines of business as us or doing business with any of our customers orvendors or employing or otherwise engaging or soliciting any of our officers, directors or employees. Ouramended and restated certificate of incorporation provides that if Clear Channel acquires knowledge of apotential transaction or matter which may be a corporate opportunity for both us and Clear Channel, we willgenerally renounce our interest in the corporate opportunity. Our amended and restated certificate ofincorporation renounces any interest or expectancy in such corporate opportunity that will belong to ClearChannel. Clear Channel will, to the fullest extent permitted by law, have satisfied its fiduciary duty with respectto such a corporate opportunity and will not be liable to us or our stockholders for breach of any fiduciary dutyby reason of the fact that it acquires or seeks the corporate opportunity for itself, directs that corporateopportunity to another person or does not present that corporate opportunity to us. These provisions could makean acquisition of us less advantageous to a third party.
Our obligation to indemnify, under certain circumstances, Clear Channel and its affiliates pursuant to the taxmatters agreement against tax-related liabilities, if any, caused by the failure of the spin-off to qualify as atax-free transaction under Section 355 of the Code (including as a result of Section 355(e) of the Code) coulddeter a change of control of us.
We have also adopted a stockholder rights plan intended to deter hostile or coercive attempts to acquire us.Under the plan, if any person or group acquires, or begins a tender or exchange offer that could result in suchperson acquiring, 15% or more of our common stock, and in the case of certain Schedule 13G filers, 20% ormore of our common stock, without approval of our board of directors under specified circumstances, our otherstockholders have the right to purchase shares of our common stock, or shares of the acquiring company, at asubstantial discount to the public market price. Therefore, the plan makes an acquisition much more costly to apotential acquirer.
In addition, the terms of our senior secured credit facility provide that the lenders can require us to repay alloutstanding indebtedness upon a change of control, and the redeemable preferred stock requires one of oursubsidiaries to offer to repurchase the redeemable preferred stock at 101% of the liquidation preference upon achange of control. These provisions make an acquisition more costly to a potential acquirer. See Item 7.Management’s Discussion and Analysis of Financial Condition and Results of Operations—Liquidity and CapitalResources—Redeemable Preferred Stock.
We have no plans to pay dividends on our common stock, which could affect its market price.
We currently intend to retain any future earnings to finance the growth, development and expansion of ourbusiness. Accordingly, we do not intend to declare or pay any dividends on our common stock for the foreseeablefuture. The declaration, payment and amount of future dividends, if any, will be at the sole discretion of ourboard of directors after taking into account various factors, including our financial condition, results ofoperations, cash flow from operations, current and anticipated capital requirements and expansion plans, theincome tax laws then in effect and the requirements of Delaware law. In addition, our redeemable preferred stockand the agreement governing our senior secured credit facility include restrictions on our ability to pay cashdividends without meeting certain financial ratios and obtaining the consent of the lenders. Accordingly, holdersof common stock will not receive cash payments on their investment and the market price may be adverselyaffected.
Future sales or other issuances of our common stock could adversely affect its market price.
We have a large number of shares of common stock outstanding and available for resale beginning atvarious points in time in the future. Sales of a substantial number of shares of our common stock in the publicmarket, or the possibility that these sales may occur, could cause the market price for our common stock to
38

decline. As of December 31, 2008, there were 78.0 million shares of our common stock outstanding, excludingtreasury shares, 907,000 shares of common stock issuable from currently exercisable options at a weightedaverage exercise price of $17.81 per share and a warrant to purchase 500,000 shares of common stock at anexercise price of $13.73.
We continually explore acquisition opportunities consistent with our strategy. These acquisitions mayinvolve the payment of cash, the incurrence of debt or the issuance of common stock or other securities. Anysuch issuance could be at a valuation lower than the trading price of our common stock at the time. The price ofour common stock could also be affected by possible sales of our common stock by hedging or arbitrage tradingactivity that may develop involving our common stock. The hedging or arbitrage could, in turn, affect the tradingprices of the notes.
Conversion of the notes may dilute the ownership interest of existing stockholders and may affect our pershare results and the trading price of our common stock.
The issuance of shares of our common stock upon conversion of the notes may dilute the ownershipinterests of existing stockholders. Issuances of stock on conversion may also affect our per share results ofoperations. Any sales in the public market of our common stock issuable upon such conversion could adverselyaffect prevailing market prices of our common stock.
We can issue preferred stock without stockholder approval, which could materially adversely affect therights of common stockholders.
Our certificate of incorporation authorizes us to issue “blank check” preferred stock, the designation,number, voting powers, preferences and rights of which may be fixed or altered from time to time by our boardof directors. Our subsidiaries may also issue additional shares of preferred stock. Accordingly, the board ofdirectors has the authority, without stockholder approval, to issue preferred stock with rights that couldmaterially adversely affect the voting power or other rights of the common stockholders or the market value ofthe common stock.
Risks Relating to Our Separation from Clear Channel
The Separation could result in significant tax liability to our initial public stockholders.
Clear Channel received a private letter ruling from the Internal Revenue Service substantially to the effectthat the distribution of our common stock to its stockholders qualifies as a tax-free distribution for United Statesfederal income tax purposes under Sections 355 and 368(a)(1)(D) of the Code. Although a private letter rulingfrom the Internal Revenue Service generally is binding on the Internal Revenue Service, if the factualrepresentations or assumptions made in the letter ruling request are untrue or incomplete in any material respect,we will not be able to rely on the ruling.
Furthermore, the Internal Revenue Service will not rule on whether a distribution satisfies certainrequirements necessary to obtain tax-free treatment under Section 355 of the Code. Rather, the ruling is basedupon representations by Clear Channel that these conditions have been satisfied, and any inaccuracy in suchrepresentations could invalidate the ruling. Therefore, in addition to obtaining the ruling from the InternalRevenue Service, Clear Channel made it a condition to the Separation that Clear Channel obtain a legal opinionthat the Distribution will qualify as a tax-free distribution for United States federal income tax purposes underSections 355 and 368(a)(1)(D) of the Code. The opinion relies on the ruling as to matters covered by the ruling.In addition, the opinion is based on, among other things, certain assumptions and representations as to factualmatters made by Clear Channel and us, which if incorrect or inaccurate in any material respect would jeopardizethe conclusions reached by counsel in its opinion. The opinion is not binding on the Internal Revenue Service orthe courts, and the Internal Revenue Service or the courts may not agree with the opinion.
39

Notwithstanding receipt by Clear Channel of the ruling and opinion of counsel, the Internal RevenueService could assert that the Distribution does not qualify for tax-free treatment for United States federal incometax purposes. If the Internal Revenue Service were successful in taking this position, our initial publicstockholders could be subject to significant United States federal income tax liability. In general, our initialpublic stockholders could be subject to tax as if they had received a taxable distribution equal to the fair marketvalue of our common stock that was distributed to them.
The Separation could result in significant tax-related liabilities to us.
As discussed above, notwithstanding receipt by Clear Channel of the ruling and the opinion of counsel, theInternal Revenue Service could assert that the Distribution does not qualify for tax-free treatment for UnitedStates federal income tax purposes. If the Internal Revenue Service were successful in taking this position, ClearChannel could be subject to significant United States federal income tax liability. In general, Clear Channelwould be subject to tax as if it had sold the common stock of our company in a taxable sale for its fair marketvalue. In addition, even if the Distribution otherwise were to qualify under Section 355 of the Code, it may betaxable to Clear Channel as if it had sold the common stock of our company in a taxable sale for its fair marketvalue under Section 355(e) of the Code, if the Distribution were later deemed to be part of a plan (or series ofrelated transactions) pursuant to which one or more persons acquire directly or indirectly stock representing a50% or greater interest in Clear Channel or us. For this purpose, any acquisitions of Clear Channel stock or ofour stock within the period beginning two years before the Distribution and ending two years after theDistribution are presumed to be part of such a plan, although we or Clear Channel may be able to rebut thatpresumption.
Although such corporate-level taxes, if any, resulting from a taxable distribution generally would beimposed on Clear Channel, we have agreed in the tax matters agreement to indemnify Clear Channel and itsaffiliates against tax-related liabilities, if any, caused by the failure of the Separation to qualify as a tax-freetransaction under Section 355 of the Code (including as a result of Section 355(e) of the Code) if the failure to soqualify is attributable to actions, events or transactions relating to our stock, assets or business, or a breach of therelevant representations or covenants made by us in the tax matters agreement. If the failure of the Separation toqualify under Section 355 of the Code is for any reason for which neither we nor Clear Channel is responsible,we and Clear Channel have agreed in the tax matters agreement that we will each be responsible for 50% of thetax-related liabilities arising from the failure to so qualify. Clear Channel reported a $2.4 billion capital loss as aresult of the Separation. See Item 8. Financial Statements and Supplementary Data—Note 12 Related-PartyTransactions—Relationship with Clear Channel for a more detailed discussion of the tax matters agreementbetween Clear Channel and us.
We could be liable for income taxes owed by Clear Channel.
Each member of the Clear Channel consolidated group, which includes Clear Channel, our company and oursubsidiaries through December 21, 2005, and Clear Channel’s other subsidiaries, is jointly and severally liablefor the United States federal income tax liability of each other member of the consolidated group. Consequently,we could be liable in the event any such liability is incurred, and not discharged, by any other member of theClear Channel consolidated group. Disputes or assessments could arise during future audits by the InternalRevenue Service in amounts that we cannot quantify. In addition, Clear Channel has recognized a capital loss forUnited States federal income tax purposes in connection with the Separation. If Clear Channel is unable to deductsuch capital loss for United States federal income tax purposes as a result of any action we take following theSeparation or our breach of a relevant representation or covenant made by us in the tax matters agreement, wehave agreed in the tax matters agreement to indemnify Clear Channel for the lost tax benefits that Clear Channelwould have otherwise realized if it were able to deduct this loss. See Item 8. Financial Statements andSupplementary Data—Note 12 Related-Party Transactions—Relationship with Clear Channel.
40

Risks Relating to the Pending Merger with Ticketmaster
Failure to complete the Merger with Ticketmaster may negatively impact our stock price and financialresults.
The merger is subject to a number of closing conditions, and there is no assurance that the conditions to thecompletion of the merger will be satisfied. The pendency of the merger may cause a disruption to our businessand a distraction of our management and employees from day-to-day operations, as matters related to the mergermay require commitments of time and resources that could otherwise have been devoted to other opportunitiesthat might have been beneficial to us. If the merger is not completed, we will be subject to several risks,including (1) the current market price of our common stock may reflect a market assumption that the merger willoccur and a failure to complete the merger could result in a negative perception of us by the stock market and aresulting decline in the market price of our common stock; (2) we may be required to pay Ticketmaster atermination fee of $15 million, in addition to the reimbursement of certain Ticketmaster transaction expenses, ifthe merger agreement is terminated under certain circumstances; and (3) we would not realize any of theanticipated benefits of having completed the merger. If the merger is not completed, these risks may materializeand materially adversely affect our business, financial results, financial condition and stock price.
The anticipated benefits of the Merger may not be realized fully, or realized at all, or may take longer torealize than expected.
The merger involves the integration of two companies that have previously operated independently withprincipal offices in two distinct locations. Due to legal restrictions, we have conducted only limited planningregarding the integration of the two companies. The combined company will be required to devote significantmanagement attention and resources to integrating the two companies. Delays in this process could adverselyaffect the combined company’s business, financial results, financial condition and stock price. Even if we areable to integrate our business operations successfully, there can be no assurance that this integration will result inthe realization of the full benefits of synergies, cost savings, innovation and operational efficiencies that may bepossible from this integration or that these benefits will be achieved within a reasonable period of time.
The trading price of shares of our common stock after the Merger may be affected by factors different fromthose affecting the price of shares of our common stock before the Merger.
If we complete the merger, holders of Ticketmaster common stock will become holders of a majority of ourcommon stock. In addition, our business and results of operations will increase and change as a result of thecombination of the two companies. The results of our operations, as well as the trading price of our commonstock, after the merger may be affected by factors different from those currently affecting our results ofoperations and the trading price of our common stock, including the risks faced by Ticketmaster’s business.Additional disclosure regarding our pending merger with Ticketmaster, the pro forma financial impact of themerger and other related matters will be set forth in a proxy statement to be filed with the SEC in connectionwith the merger.
The Merger will result in changes to our board and management that may affect our strategy.
If we complete the merger, the composition of our board of directors and management team will change inaccordance with the merger agreement, as seven new members from Ticketmaster will be appointed to our board.In addition, we will have a new Executive Chairman. This new board and management may affect the businessstrategy and operating decisions of the combined company upon completion of the merger.
41

ITEM 6. SELECTED FINANCIAL DATA(in thousands, except per share data) 2008 2007 2006 2005 2004
Results of Operations Data:Revenue . . . . . . . . . . . . . . . . . . . . . . . . . . . . . . . . . $4,166,838 $3,755,470 $3,294,471 $2,571,883 $2,461,363Operating Expenses:
Direct operating expenses . . . . . . . . . . . . . . . 3,324,672 3,003,610 2,678,869 2,026,881 1,936,527Selling, general and administrativeexpenses . . . . . . . . . . . . . . . . . . . . . . . . . . . 655,351 592,983 468,970 440,595 398,143
Depreciation and amortization . . . . . . . . . . . . 147,467 116,834 123,628 59,577 58,745Goodwill impairment . . . . . . . . . . . . . . . . . . . 269,902 — — — —Loss (gain) on sale of operating assets . . . . . 1,108 (20,654) (9,987) 4,993 6,409Corporate expenses . . . . . . . . . . . . . . . . . . . . 52,498 45,854 33,863 50,715 31,386
Operating income (loss) . . . . . . . . . . . . . . . . . . . . . (284,160) 16,843 (872) (10,878) 30,153Interest expense . . . . . . . . . . . . . . . . . . . . . . . . . . . 70,670 65,006 37,194 5,961 3,090Interest expense with Clear ChannelCommunications . . . . . . . . . . . . . . . . . . . . . . . . — — — 46,437 42,355
Interest income . . . . . . . . . . . . . . . . . . . . . . . . . . . . (10,192) (13,476) (11,025) (1,461) (2,499)Equity in (earnings) losses of nonconsolidatedaffiliates . . . . . . . . . . . . . . . . . . . . . . . . . . . . . . . (2,264) 5,058 (1,716) 3,437 (1,106)
Other expense (income)—net . . . . . . . . . . . . . . . . (28) (147) (489) 222 1,417
Loss from continuing operations before incometaxes . . . . . . . . . . . . . . . . . . . . . . . . . . . . . . . . . . (342,346) (39,598) (24,836) (65,474) (13,104)
Income tax expense (benefit):Current . . . . . . . . . . . . . . . . . . . . . . . . . . . . . . (24,057) 5,625 8,268 (53,543) (68,032)Deferred . . . . . . . . . . . . . . . . . . . . . . . . . . . . . 8,132 7,649 10,334 87,776 54,411
Income (loss) from continuing operations . . . . . . . (326,421) (52,872) (43,438) (99,707) 517Income (loss) from discontinued operations, netof taxes . . . . . . . . . . . . . . . . . . . . . . . . . . . . . . . . 88,596 45,552 24,205 (25,676) 19,043
Net income (loss) . . . . . . . . . . . . . . . . . . . . . . . . . . (237,825) (7,320) (19,233) (125,383) 19,560Net income attributable to minority interests . . . . 1,587 7,869 12,209 5,236 3,300
Net income (loss) attributable to Live Nation,Inc. . . . . . . . . . . . . . . . . . . . . . . . . . . . . . . . . . . . $ (239,412) $ (15,189) $ (31,442) $ (130,619) $ 16,260
Basic and diluted income (loss) per commonshare attributable to common stockholders:Loss from continuing operations attributableto Live Nation, Inc. . . . . . . . . . . . . . . . . . . $ (4.30) $ (0.89) $ (0.85) $ (1.57)
Income (loss) from discontinuedoperations . . . . . . . . . . . . . . . . . . . . . . . . . . 1.16 0.67 0.37 (0.39)
Net loss attributable to Live Nation, Inc. . . . . $ (3.14) $ (0.22) $ (0.48) $ (1.96)
Cash dividends per share . . . . . . . . . . . . . . . . . . . . $ — $ — $ — $ —
As of December 31, (1) (2)
(in thousands) 2008 2007 2006 2005 2004
Balance Sheet Data:Total assets . . . . . . . . . . . . . . . . . . . . . . . . . . . . . . . $2,476,723 $2,749,820 $2,225,002 $1,776,584 $1,478,706Long-term debt, net of discount (including currentmaturities) . . . . . . . . . . . . . . . . . . . . . . . . . . . . . $ 824,120 $ 753,017 $ 639,146 $ 366,841 $ 650,675
Redeemable preferred stock . . . . . . . . . . . . . . . . . . $ 40,000 $ 40,000 $ 40,000 $ 40,000 $ —Live Nation, Inc. business/stockholders’ equity . . $ 681,921 $ 934,372 $ 638,662 $ 636,700 $ 156,976
(1) Acquisitions and dispositions significantly impact the comparability of the historical consolidated financial datareflected in this schedule of Selected Financial Data.
(2) Prior to the Separation, the combined financial statements include amounts that are comprised of businessesincluded in the consolidated financial statements and accounting records of Clear Channel, using the historicalbases of assets and liabilities of the entertainment business. As a result of the Separation, we recognized the parvalue and additional paid-in capital in connection with the issuance of our common stock in exchange for the netassets contributed at that time.The Selected Financial Data should be read in conjunction with Item 7. Management’s Discussion and Analysis of
Financial Condition and Results of Operations.
42

ITEM 7. MANAGEMENT’S DISCUSSION AND ANALYSIS OF FINANCIAL CONDITION ANDRESULTS OF OPERATIONS
You should read the following discussion of our financial condition and results of operations together withthe audited consolidated financial statements and notes to the financial statements included elsewhere in thisAnnual Report. This discussion contains forward-looking statements that involve risks and uncertainties. Theforward-looking statements are not historical facts, but rather are based on current expectations, estimates,assumptions and projections about our industry, business and future financial results. Our actual results coulddiffer materially from the results contemplated by these forward-looking statements due to a number of factors,including those discussed under Item 1A. Risk Factors and other sections in this Annual Report.
Executive Overview
Our mission is to maximize the revenue generated by the live concert experience driven by serving threeclients—artists, fans and sponsors. During 2008 we continued to execute on our strategy to improve and buildour core business and to divest of non-core operations. The highlights for each of our segments for 2008 were:
North American Music
• For the year ended December 31, 2008, we increased our profitability per event in our owned and/oroperated amphitheaters. This improvement was achieved via our continued strategy to optimize costefficiencies at the event by decreasing the operating cost per attendee and talent cost. Our marketingstrategy drove an increase in our live music attendance in North America by 3.3 million to 33.0 milliontotal attendees at our promoted events, an 11% increase over the prior year, while also reducing themarketing cost per attendee.
• We promoted 10,377 events, including 912 events in our owned and/or operated amphitheaters, ascompared to 10,367 events in 2007.
• Across all our owned and/or operated venues and third-party venues for the year ended December 31,2008, we increased our profitability per event. This increase was driven by extending the cost-efficiency strategy utilized in our amphitheaters to all venue types, generating a decrease in theoperating cost per attendee and also the marketing cost per attendee. We also increased our ancillaryrevenue per attendee and increased paid attendance which complemented our cost efficiencies as weincreased profitability across all venue types.
• We entered into a new partnership through a joint venture relationship in Live Nation—HaymonVentures, LLC to extend our reach in the urban music genre.
• We also entered into an exclusive booking arrangement with Ocesa and T4F covering Mexico, CentralAmerica and South America. This arrangement will drive immediate increases in revenue in a regionwhere we currently have a limited presence.
• Our North American Music venue portfolio was expanded during 2008 through the addition of theHouse of Blues club in Houston which opened in October 2008, the opening of the HollywoodPalladium in October 2008 and the addition of two venues in Florida through the acquisition ofFantasma in May 2008. Subsequent to year-end, in February 2009 we opened our new House of Bluesclub in Boston.
• During 2008, we provided artist services to over 848 artists. These services included fan club andwebsite management, merchandise distribution and licensing and creative services.
International Music
• For the year ended December 31, 2008, our number of promoted events increased by 1,301 to a total of4,240 events, a 44% increase over the prior year. This increase was partially driven by acquisitions and
43

by exhibition-type events that we promoted that are generally over an extended period of time. Inaddition, our attendance increased by over 1.3 million fans over the prior year.
• We continued to expand our portfolio of international festivals with the acquisition of Way Out West inSweden, T in the Park in Scotland and Main Square Festival in France along with the creation ofWhere the Action Is in Sweden. We also successfully grew our ancillary revenue per attendee related tofood and beverage at our existing festivals.
• We added to our international venue portfolio in 2008 through the redevelopment and reopening of theO2 Dublin, formerly known as The Point, in Ireland. The redevelopment increased the capacity of thisvenue from 8,500 to 13,000. We also acquired the operating company that manages and holds the leasefor the Heineken Music Hall, a 5,500 seat venue located in Amsterdam. In addition, we furtherexpanded the AMG venue group with openings in Sheffield and Leeds, England.
• We expanded our international footprint through acquisitions of Mirage in Dubai and DF Concerts inScotland, including the addition of the T in the Park festival. Our previous acquisitions in CentralEurope exhibited particularly strong growth in the year as a result of more selective talent buying and afocus on developing sponsorship revenue streams.
• We were also successful in creating new partnerships with Telefonica O2 for long-term naming rightssponsorships for The Point in Ireland and the AMG venues in the United Kingdom.
• In addition to driving an increase in our food and beverage revenue at our festivals as noted above, ourfocus on improving our core business also resulted in a reduction in our advertising spend per attendee.
Ticketing
• This segment includes our internal ticketing operations and Live Nation’s domestic website,www.livenation.com. The majority of our revenue in this segment is derived from service chargesearned on tickets sold through our internal centralized ticketing operations and sponsorships related tothis business.
• In December 2008, we launched our new ticketing platform to sell tickets to events at our owned and/or operated venues in North America. Through this ticketing system, we now will have control of ourcustomer data and be able to create enhanced ticket-based concert products. We believe this will alsoallow us to capitalize on new distribution channels and expand our sponsorship opportunities.
• We have entered into agreements with, or granted options to, several third-party venues to sell theirevent tickets through our ticketing platform, including many of the North American facilities controlledby SMG, the world’s leading venue management company.
• We added several software enhancements to www.livenation.com during 2008, including FASTLANETM which allows fans to enter events on a priority basis if they buy their tickets through ourwebsite.
Other Information
• Global tours for 2008 included Madonna and The Police. Madonna’s 2008 Sticky and Sweet tour wasthe largest tour ever for a female touring artist in terms of revenue.
• We entered into extended-term rights relationships with several artists including Jay-Z, Shakira,Nickelback and U2. These agreements allow us to provide content to our venues and promotionactivities over a longer time period and expand the relationship with the artist past the individualconcert date.
• As of December 31, 2008, we have 840 local, national and international corporate sponsors. As part ofour strategy to drive larger corporate sponsors, we reduced the overall number of sponsors by 9% from
44

2007. National sponsors include BlackBerry, Burger King and State Farm. Internationally, the successof this strategy is demonstrated by our multi-asset/multi-platform, five-year agreement with O2.
• We completed the divestiture of several non-core businesses during the year, including our NorthAmerican theatrical business in January 2008, our motor sports business in September 2008 and ourevents business in October 2008.
Our Separation from Clear Channel
We were formed through acquisitions of various entertainment businesses and assets by our predecessors. InAugust 2000, Clear Channel acquired our entertainment business. In August 2005, we were incorporated in ourcurrent form as a Delaware corporation to own substantially all of the entertainment business of Clear Channel.In December 2005, the separation of the business previously conducted by Clear Channel’s live entertainmentsegment and sports representation business, and the distribution by Clear Channel of all of our common stock toits stockholders, was completed in a tax free spin-off. Following our separation from Clear Channel, we becamea separate publicly traded company on the New York Stock Exchange trading under the symbol “LYV”.
Basis of Presentation
As a result of the Separation, we recognized the par value and additional paid-in capital in connection withthe issuance of our common stock in exchange for the net assets contributed at that time, and we beganaccumulating retained deficits and currency translation adjustments upon completion of the Separation.Beginning on December 21, 2005, our consolidated financial statements include all accounts of Live Nation andour majority-owned subsidiaries and variable interest entities for which we are the primary beneficiary.
Segment Overview
We reorganized our segments beginning in 2007 in accordance with the change in the management of thebusiness units and therefore changed our reportable operating segments to North American Music, InternationalMusic, Artist Nation (previously known as Global Artists) and Ticketing (previously known as Global Digital).In 2009, we also reorganized our business units and the way in which these businesses are assessed and thereforechanged our reportable operating segments to North American Music, International Music and Ticketing. Ourbusiness formerly reported as Artist Nation is now allocated to the North American Music and InternationalMusic segments. In addition, we have United Kingdom theatrical venue operations (previously included inGlobal Theater) and other businesses which are included under other operations. Prior to 2008, we reported aGlobal Theater segment which has been eliminated after the divestiture of substantially all of our NorthAmerican theatrical business in January 2008. The segment results for all periods presented have beenreclassified to conform to the current year presentation.
North American Music
Our North American Music segment principally involves the promotion of live music events in our ownedand/or operated venues and in rented third-party venues primarily in the United States and Canada, as well asproviding various services to artists. While our North American Music segment operates year-round, weexperience higher revenue during the second and third quarters due to the seasonal nature of shows at ouroutdoor amphitheaters, which primarily occur May through September.
To judge the health of our North American Music segment, we primarily monitor the number of confirmedevents in our network of owned and/or operated and third-party venues, talent fees, average paid attendance andadvance ticket sales. In addition, at our owned and/or operated venues, we monitor attendance, ancillary (e.g.,food and beverage) revenue per attendee, premium seat sales and corporate sponsorship sales.
45

International Music
Our International Music segment principally involves the promotion of live music events in our owned and/or operated venues and in rented third-party venues and the production of music festivals outside of NorthAmerica. While our International Music segment operates year-round, we experience higher revenue during thesecond and third quarters due to the seasonal nature of our international festivals, which primarily occur Junethrough August.
To judge the health of our International Music segment, we primarily monitor the number of confirmedevents in our network of owned and/or operated and third-party venues, talent fees, festival profits, average paidattendance and advance ticket sales. In addition, at our owned and/or operated venues, we monitor attendanceand ancillary revenue per attendee. Because this business is conducted in foreign markets, we look at theoperating results from our foreign operations on a constant dollar basis.
Ticketing
Our Ticketing segment manages the Company’s internal ticketing operations, including the new Live Nationticketing platform which was launched in late 2008 and our digital platform, which includes our online wirelessdistribution activities and the development of our website.
To judge the health of our Ticketing segment, we primarily review the number of tickets sold through ourinternal ticketing operations, the number of unique visitors to our websites and the overall number of customersin our database.
See further discussion of our segments in Item 1. Business—Operating Segments.
46

Consolidated Results of Operations
Year Ended December 31, % Change2008 vs. 2007
% Change2007 vs. 2006(in thousands) 2008 2007 2006
Revenue . . . . . . . . . . . . . . . . . . . . . . . . . . . . . $4,166,838 $3,755,470 $3,294,471 11% 14%Operating expenses:Direct operating expenses . . . . . . . . . . . . . . . 3,324,672 3,003,610 2,678,869 11% 12%Selling, general and administrativeexpenses . . . . . . . . . . . . . . . . . . . . . . . . . . 655,351 592,983 468,970 11% 26%
Depreciation and amortization . . . . . . . . . . . 147,467 116,834 123,628 26% (5)%Goodwill impairment . . . . . . . . . . . . . . . . . . 269,902 — — ** **Loss (gain) on sale of operating assets . . . . . 1,108 (20,654) (9,987) ** **Corporate expenses . . . . . . . . . . . . . . . . . . . . 52,498 45,854 33,863 14% 35%
Operating income (loss) . . . . . . . . . . . . . . . . (284,160) 16,843 (872) ** **Operating margin . . . . . . . . . . . . . . . . . . . . . (6.8)% 0.4% (0.0)%Interest expense . . . . . . . . . . . . . . . . . . . . . . . 70,670 65,006 37,194Interest income . . . . . . . . . . . . . . . . . . . . . . . (10,192) (13,476) (11,025)Equity in (earnings) losses ofnonconsolidated affiliates . . . . . . . . . . . . . (2,264) 5,058 (1,716)
Other income—net . . . . . . . . . . . . . . . . . . . . (28) (147) (489)
Loss from continuing operations beforeincome taxes . . . . . . . . . . . . . . . . . . . . . . . (342,346) (39,598) (24,836)
Income tax expense (benefit):Current . . . . . . . . . . . . . . . . . . . . . . . . . . . . . . (24,057) 5,625 8,268Deferred . . . . . . . . . . . . . . . . . . . . . . . . . . . . . 8,132 7,649 10,334
Loss from continuing operations . . . . . . . . . . (326,421) (52,872) (43,438)Income from discontinued operations, net oftaxes . . . . . . . . . . . . . . . . . . . . . . . . . . . . . . 88,596 45,552 24,205
Net loss . . . . . . . . . . . . . . . . . . . . . . . . . . . . . (237,825) (7,320) (19,233)Net income attributable to minorityinterests . . . . . . . . . . . . . . . . . . . . . . . . . . . 1,587 7,869 12,209
Net loss attributable to Live Nation, Inc. . . . $ (239,412) $ (15,189) $ (31,442)
Note: Non-cash compensation expense of $8.3 million, $10.8 million and $1.6 million is included in corporateexpenses, $27.2 million, $17.4 million and $1.7 million is included in selling, general and administrativeexpenses and $(0.9) million, $1.0 million and $0 million is included in discontinued operations for theyears ended December 31, 2008, 2007 and 2006, respectively. The non-cash compensation expense for2008 and 2007 includes expenses related to stock option and restricted stock grants as well as incentivebonuses being paid in stock in lieu of cash.
** Percentages are not meaningful.
47

Key Operating Metrics
Year Ended December 31,
2008 2007 2006
Estimated EventsNorth American Music promotions:
Owned and/or operated amphitheaters . . . . . . . . . . . . . . . . . . . . . . . 912 856 923All other . . . . . . . . . . . . . . . . . . . . . . . . . . . . . . . . . . . . . . . . . . . . . . . 9,465 9,511 7,065
Total North American Music promotions . . . . . . . . . . . . . . . . . 10,377 10,367 7,988
North American Music third-party rentals at our owned and/or operatedvenues . . . . . . . . . . . . . . . . . . . . . . . . . . . . . . . . . . . . . . . . . . . . . . . . . . 4,641 1,419 1,472
International Music promotions . . . . . . . . . . . . . . . . . . . . . . . . . . . . . . . . 4,240 2,939 2,487International Music third-party rentals at our owned and/or operatedvenues . . . . . . . . . . . . . . . . . . . . . . . . . . . . . . . . . . . . . . . . . . . . . . . . . . 2,909 2,022 1,439
United Kingdom theater promotions . . . . . . . . . . . . . . . . . . . . . . . . . . . . . 225 971 714United Kingdom theater third-party rentals at our owned and/oroperated venues . . . . . . . . . . . . . . . . . . . . . . . . . . . . . . . . . . . . . . . . . . . 4,532 4,704 4,972
Total events . . . . . . . . . . . . . . . . . . . . . . . . . . . . . . . . . . . . . . . . 26,924 22,422 19,072
Estimated Attendance (rounded)North American Music promotions:
Owned and/or operated amphitheaters . . . . . . . . . . . . . . . . . . . . . . . 9,915,000 8,421,000 8,329,000All other . . . . . . . . . . . . . . . . . . . . . . . . . . . . . . . . . . . . . . . . . . . . . . . 23,044,000 21,207,000 18,410,000
Total North American Music promotions . . . . . . . . . . . . . . . . . 32,959,000 29,628,000 26,739,000
North American Music third-party rentals at our owned and/or operatedvenues . . . . . . . . . . . . . . . . . . . . . . . . . . . . . . . . . . . . . . . . . . . . . . . . . . 3,308,000 2,404,000 1,797,000
International Music promotions . . . . . . . . . . . . . . . . . . . . . . . . . . . . . . . . 12,056,000 10,702,000 9,826,000International Music third-party rentals at our owned and/or operatedvenues . . . . . . . . . . . . . . . . . . . . . . . . . . . . . . . . . . . . . . . . . . . . . . . . . . 3,791,000 3,703,000 3,244,000
United Kingdom theater promotions . . . . . . . . . . . . . . . . . . . . . . . . . . . . . 239,000 949,000 756,000United Kingdom theater third-party rentals at our owned and/oroperated venues . . . . . . . . . . . . . . . . . . . . . . . . . . . . . . . . . . . . . . . . . . . 4,906,000 4,836,000 4,757,000
Total attendance . . . . . . . . . . . . . . . . . . . . . . . . . . . . . . . . . . . . 57,259,000 52,222,000 47,119,000
Note: Events generally represent a single performance by an artist for both promotions and third-party rentals.Attendance generally represents the number of fans who were present at an event. Festivals are counted asone event in the quarter in which the festival begins but attendance is split over the days of the festivaland can be split between quarters. Events and attendance metrics are estimated each quarter. Adjustmentsto previously reported quarters, if any, are only included in the year-to-date events and attendancemetrics.
Promotions listed above include events in our owned and/or operated venues as well as events wepromote in third-party venues. Excluded from the table above are events and attendance that occurred inthe North American theatrical business that was sold in January 2008 and our motor sports business thatwas sold in September 2008.
The 2008 data for North American Music third-party rentals at our owned and/or operated venues is notcomparable to 2007 and 2006 because the 2008 data includes 3,076 events and 401,000 attendees relatedto our House of Blues music venues. The comparable data for our House of Blues music venues is notavailable for 2007 and 2006.
48

Revenue
Our revenue increased $411.4 million, or 11%, during the year ended December 31, 2008 as compared tothe same period of the prior year primarily due to increases in revenue from our North American Music andInternational Music segments of $382.8 million and $70.4 million, respectively, partially offset by a decrease inrevenue in our other operations of $52.8 million. The total increase in revenue includes the impact of ouracquisitions during the year. Included in the increase in revenue for the year ended December 31, 2008 isapproximately $8.2 million from increases in foreign exchange rates as compared to the same period of 2007.
Our revenue increased $461.0 million, or 14%, during the year ended December 31, 2007 as compared tothe same period of the prior year primarily due to increases in revenue from our North American Music andInternational Music segments of $235.4 million and $259.6 million, respectively, partially offset by a decrease inrevenue in our other operations of $36.4 million. Included in the increase in revenue for the year endedDecember 31, 2007 is approximately $116.7 million from increases in foreign exchange rates as compared to thesame period of 2006.
More detailed explanations of the changes for the years ended 2008 and 2007 are included in the applicablesegment discussions contained herein.
Direct operating expenses
Our direct operating expenses increased $321.1 million, or 11%, during the year ended December 31, 2008as compared to the same period of the prior year primarily due to increases in direct operating expenses in ourNorth American Music and International Music segments of $309.5 million and $49.4 million, respectively,partially offset by a decrease in our other operations of $44.9 million. Included in the increase in direct operatingexpenses for the year ended December 31, 2008 is approximately $15.6 million from increases in foreignexchange rates as compared to the same period of 2007.
Our direct operating expenses increased $324.7 million, or 12%, during the year ended December 31, 2007as compared to the same period of the prior year primarily due to increases in direct operating expenses in ourNorth American Music and International Music segments of $109.8 million and $235.5 million, respectively,partially offset by a decrease in our other operations of $21.0 million. Included in the increase in direct operatingexpenses for the year ended December 31, 2007 is approximately $93.5 million from increases in foreignexchange rates as compared to the same period of 2006.
Direct operating expenses include artist fees, show related marketing and advertising expenses along withother costs.
More detailed explanations of the changes for the years ended 2008 and 2007 are included in the applicablesegment discussions contained herein.
Selling, general and administrative expenses
Our selling, general and administrative expenses increased $62.4 million, or 11%, during the year endedDecember 31, 2008 as compared to the same period of the prior year primarily due to increases in selling, generaland administrative expenses of our North American Music, International Music and Ticketing segments of $37.0million, $20.6 million and $18.0 million, respectively, partially offset by a decrease in our other operations of$13.2 million. Partially offsetting the increase in selling, general and administrative expenses for the year endedDecember 31, 2008 is approximately $4.8 million from decreases in foreign exchange rates as compared to thesame period of 2007.
Our selling, general and administrative expenses increased $124.0 million, or 26%, during the year endedDecember 31, 2007 as compared to the same period of the prior year primarily due to increases in selling, general
49

and administrative expenses of our North American Music and International Music segments of $107.3 millionand $28.1 million, respectively, partially offset by a decrease in our other operations of $15.0 million. Included inthe increase in selling, general and administrative expenses for the year ended December 31, 2007 isapproximately $16.0 million from increases in foreign exchange rates as compared to the same period of 2006.
More detailed explanations of the changes for the years ended 2008 and 2007 are included in the applicablesegment discussions contained herein.
Depreciation and amortization
Our depreciation and amortization increased $30.6 million, or 26%, during the year ended December 31,2008 as compared to the same period of the prior year primarily due to increases in depreciation and amortizationof our North American Music and International Music segments of $21.8 million and $10.6 million, respectively.During 2008, we recorded an impairment charge of $12.1 million related to several venues and a naming rightintangible.
Our depreciation and amortization decreased $6.8 million, or 5%, during the year ended December 31, 2007as compared to the same period of the prior year primarily due to decreases in depreciation and amortization ofour North American Music segment and other operations of $6.6 million and $8.2 million, respectively. During2006, we recorded an impairment charge of $51.6 million primarily related to several amphitheaters and onetheater development project that is no longer being pursued.
More detailed explanations of the changes for the years ended 2008 and 2007 are included in the applicablesegment discussions contained herein.
Goodwill impairment
In accordance with Financial Accounting Standards Board, or FASB, Statement of Financial AccountingStandards No. 142, Goodwill and Other Intangible Assets, or Statement 142, we test goodwill for impairmentannually as of October 1 using a two-step process. The first step, used to screen for potential impairment,compares the fair value of the reporting unit with its carrying amount, including goodwill. The second step, usedto measure the amount of any potential impairment, compares the implied fair value of the reporting unit with thecarrying amount of goodwill. We also test goodwill for impairment in other periods if an event occurs orcircumstances change that would more likely than not reduce the fair value of a reporting unit below its carryingamount.
In September 2008, in connection with the sale of our non-core events business (which has been classifiedas discontinued operations), we reviewed the carrying value of our non-core events assets based on an indicatorthat future operating cash flows may not support their carrying value based on expected sales proceeds. It wasdetermined that those assets were impaired since the estimated undiscounted cash flows, based on expected salesproceeds, associated with those assets were less than their carrying value. As a result, we recorded a $13.0million goodwill impairment charge related to the goodwill for this non-core events business as a component ofoperating expenses in discontinued operations. We are not continuing to operate in the non-core events business.
During the fourth quarter of 2008, while we were performing our annual impairment test as of October 1,we experienced a significant decline in our market capitalization. Since a favorable result from an October 1 testwould not have prevented a second impairment test at December 31, 2008, a single impairment test wascompleted as of December 31, 2008. Based upon the results of this impairment test that was performed, werecorded an impairment charge of $269.9 million related to our North American Music reporting unit, whichrepresented all of the remaining goodwill previously recorded for this reporting unit.
The process of evaluating goodwill for impairment involves the determination of the fair value of ourreporting units. Inherent in such fair value determinations are certain judgments and estimates relating to future
50

cash flows, including our interpretation of current economic indicators and market valuations, and assumptionsabout our strategic plans with regard to our operations. Due to the uncertainties associated with such estimates,actual results could differ from such estimates. In performing the first step of our impairment analysis, wedeveloped a consolidated fair value using a market multiple methodology, which was then allocated to theindividual reporting units based upon the discounted cash flows developed for each reporting unit. In performingthe second step of our impairment analysis for the reporting units that failed the step one test, we developed fairvalues using the discounted cash flows methodology.
Loss (gain) on sale of operating assets
We recorded a net loss on sale of operating assets of $1.1 million during the year ended December 31, 2008as compared to a net gain of $20.7 million for the same period of the prior year. Gains recorded in 2007 included$19.0 million on the sale of two music theaters and seven clubs in London and an amphitheater in Nashville, $6.0million on the sale of an office building in San Francisco, and $3.6 million on the sale of an arena/race track inLeicestershire, England. Partially offsetting these gains in 2007 was an $8.1 million loss on the sale of ourremaining 50.1% interest in the production of Phantom: The Las Vegas Spectacular.
We recorded a net gain on sale of operating assets of $20.7 million during the year ended December 31,2007 as compared to $10.0 million for the same period of the prior year. Net gains recorded in 2007 include theamounts described above. In 2006, we recorded gains on the sale of a portion of our sports representationbusiness assets and the sale of certain show-related prepaid production assets, theatrical productions andinvestments in nonconsolidated affiliates.
Corporate expenses
Corporate expenses increased $6.6 million, or 14%, during the year ended December 31, 2008 as comparedto the same period of the prior year primarily due to increased headcount and related costs and consultingexpenses.
Corporate expenses increased $12.0 million, or 35%, during the year ended December 31, 2007 as comparedto the same period of the prior year primarily due to $9.2 million of higher non-cash compensation expense foradditional stock-based awards and increased headcount related to the building of corporate functions previouslyprovided by Clear Channel, partially offset by a reduction in rent expense in our New York office due tosubleasing of available space.
Interest expense
Interest expense increased $5.7 million for the year ended December 31, 2008 as compared to the sameperiod of the prior year primarily due to a full year of amortization of the debt discount on our convertible noteswhich were issued in the third quarter of 2007 and increases in the debt balance which were partially offset bydecreases in the weighted average cost of debt.
Interest expense increased $27.8 million during the year ended December 31, 2007 as compared to the sameperiod of the prior year primarily due to interest expense related to our additional term loan which we obtained inthe fourth quarter of 2006, our convertible notes which were issued in the third quarter of 2007, borrowingsunder the revolving credit facility during the period and amortization of additional debt issuance costs.
Our debt balances and weighted average cost of debt, including redeemable preferred stock and excludingthe debt discount on the convertible notes, were $925.7 million and 6.16%, respectively, at December 31, 2008,and $862.6 million and 6.77%, respectively, at December 31, 2007.
51

Interest income
Interest income decreased $3.3 million during the year ended December 31, 2008 as compared to the sameperiod in the prior year primarily due to lower excess cash invested in money market funds and other short-terminvestments in 2008.
Interest income increased $2.5 million during the year ended December 31, 2007 as compared to the sameperiod of the prior year primarily due to interest income earned on excess cash invested in money market fundsand other short-term investments and interest income earned on HOB purchase price held in escrow.
Equity in losses (earnings) of nonconsolidated affiliates
Equity in earnings of nonconsolidated affiliates was $2.3 million for the year ended December 31, 2008 ascompared to equity in losses of nonconsolidated affiliates of $5.1 million for the same period of the prior year. In2007, we recorded higher losses from our investment in a joint venture with Cirque Du Soleil and also recorded awrite-down on an investment with no similar significant write-down in 2008.
Equity in losses of nonconsolidated affiliates was $5.1 million for the year ended December 31, 2007 ascompared to equity in earnings of nonconsolidated affiliates of $1.7 million for the same period of the prior year.In 2007, we recorded a write-down on an investment with no similar significant write-down in 2006 and recordedlosses for our investment in Rock in Rio Madrid S.A. primarily related to advertising expenses incurred inadvance of the festival.
Income Taxes
Our effective tax rate was 5% for 2008 compared to an effective tax rate of (34)% in 2007. This effectivetax rate represents net tax benefits of $15.9 million and tax expense of $13.3 million for the years endedDecember 31, 2008 and 2007, respectively. Of the $15.9 million of 2008 tax benefit, $(47.7) million relates totax benefits from U.S. losses from operations, $(1.0) million relates to state and local taxes, $4.5 million relatesto reserves for uncertain tax positions, $2.7 million relates to adjustments for significant, unusual andextraordinary items and $(1.7) million relates to the effects of tax rate changes. The remainder of $27.3 millionrelates to statutory tax on profitable operations which are principally operations outside of the United States andreflect effective tax rates in those jurisdictions. The net decrease in 2008 tax expense as compared to 2007 taxexpense is principally attributable to larger recognition of tax benefits in 2008 relative to 2007 from losses inU.S. operations.
Our effective tax rate was (34)% for 2007 as compared to an effective tax rate of (75)% for 2006. The 2007effective tax rate decreased relative to 2006 due principally to relatively larger tax benefits recognized fromlosses in our U.S. operations.
Discontinued Operations
In January 2008, we completed the sale of substantially all of our North American theatrical business, whichincluded the assets of the North American theatrical presenting business and certain theatrical venues, to KeyBrand Entertainment Inc. and its lenders for a gross sales price of $90.4 million pursuant to a stock purchaseagreement. After fees, expenses, an adjustment to replace the show cash of the North American theatricalbusiness that was previously removed from the operations and utilized by us and other adjustments, we receivedin 2008 approximately $18.5 million of proceeds, net of cash sold and transaction costs, and will receive anadditional $12.6 million in 2009. The sale of the North American theatrical business resulted in a total pre-taxgain of $17.8 million.
In September 2008, we sold our motor sports business to Feld Acquisition Corp., a wholly-owned subsidiaryof Feld Entertainment, Inc. pursuant to a stock purchase agreement for a gross sales price of $175.0 million in
52

cash, subject to certain net working capital and other post-closing adjustments, in addition to a performance-based contingent payment of up to $30.0 million over a five-year period commencing with calendar year 2009.After estimated fees, expenses and other adjustments, we received approximately $166.5 million of net proceeds,excluding the contingent payment. The sale of the motor sports business resulted in a pre-tax gain of $145.0million.
In October 2008, as part of a binding agreement with Events Acquisition Corporation, we sold our non-coreevents business along with rights to certain DVD projects. Events Acquisition Corporation is owned by MichaelCohl who is a former director and executive officer of the company. The events business included rights orinvestments in certain non-music and exhibition-style events. Under the agreement, we will receiveapproximately $15.4 million for the events business, DVD projects and other rights, in addition to performance-based contingent payments and undistributed profits related to future periods. We recorded a $0.8 million pre-taxgain in discontinued operations and a $0.7 million loss in continuing operations. In the third quarter of 2008, werecorded a $29.2 million impairment related to the events business, including a $13.0 million impairment ofgoodwill, and also a $1.5 million impairment related to the DVD projects.
Net income attributable to minority interests
Net income attributable to minority interests decreased $6.3 million during the year ended December 31,2008, as compared to the same period of the prior year primarily due to lower operating results for AMG andAngel Festivals Limited.
Net income attributable to minority interests decreased $4.3 million during the year ended December 31,2007, as compared to the same period of the prior year primarily due to our acquisition of the remaining interestsin the CPI entities partially offset by our acquisition of a controlling interest in AMG, both during the thirdquarter of 2007.
North American Music Results of Operations
Our North American Music segment operating results were as follows:
Year Ended December 31, % Change2008 vs. 2007
% Change2007 vs. 2006(in thousands) 2008 2007 2006
Revenue . . . . . . . . . . . . . . . . . . . . . . . . . . . . $2,678,309 $2,295,535 $2,060,145 17% 11%Operating expenses:Direct operating expenses . . . . . . . . . . . . . . 2,161,119 1,851,588 1,741,769 17% 6%Selling, general and administrativeexpenses . . . . . . . . . . . . . . . . . . . . . . . . . . 408,067 371,109 263,778 10% 41%
Depreciation and amortization . . . . . . . . . . 99,573 77,756 84,323 28% (8)%Goodwill impairment . . . . . . . . . . . . . . . . . . 269,902 — — ** **Loss (gain) on sale of operating assets . . . . 19 (6,725) (63) ** **
Operating income (loss) . . . . . . . . . . . . . . . (260,371) 1,807 (29,662) ** **Operating margin . . . . . . . . . . . . . . . . . . . . . (9.7)% 0.1% (1.4)%
** Percentages are not meaningful.
Year Ended 2008 Compared to Year Ended 2007
North American Music revenue increased $382.8 million, or 17%, during the year ended December 31,2008 as compared to the same period of the prior year due to an increase in the number of events, ancillaryrevenue per attendee, attendance and average ticket prices for artists such as Dave Matthews Band, Journey andJimmy Buffett, and strong results from arena tours for artists such as Coldplay, Van Halen, and the Trans-
53

Siberian Orchestra. The increase is also due to approximately $241.2 million of incremental revenue primarilyrelated to our acquisitions of the remaining 50% interest in the House of Blues Concerts Canada, or HOBCanada, during the second quarter of 2007 and Signatures SNI, Inc., or Signatures, and Anthill Trading Ltd., orAnthill, in the fourth quarter of 2007. These increases were partially offset by a decline in the volume of globaltours. Tours during 2008 included Madonna, The Police and Neil Young.
North American Music direct operating expenses increased $309.5 million, or 17%, during the year endedDecember 31, 2008 as compared to the same period of the prior year due to higher operating expenses associatedwith an increased number of events and attendance at amphitheaters and third-party venues and strong arenatours discussed above. The increase is also due to direct operating expenses of approximately $211.7 millionprimarily related to our acquisitions of HOB Canada, Signatures and Anthill. These increases were partiallyoffset by a decrease in touring-related direct operating expenses due to the lower volume of events noted above.
North American Music selling, general and administrative expenses increased $37.0 million, or 10%, duringthe year ended December 31, 2008 as compared to the same period of the prior year due to higher salary costs,consulting expenses and rent expense, primarily from the infrastructure for artist rights acquisitions and newbuildings, partially offset by lower legal expenses related to ongoing cases. The increase is also due toincremental selling, general and administrative expenses of $20.2 million related to our HOB Canada, Signaturesand Anthill acquisitions.
North American Music depreciation and amortization expense increased $21.8 million, or 28%, during theyear ended December 31, 2008 as compared to the same period of the prior year due to an impairment of $12.1million recorded during 2008 related to a club and two amphitheaters as well as a naming right intangible andamortization of the intangible assets resulting from the acquisition of Signatures and intangible assets associatedwith certain artist rights agreements.
North American Music gain on sale of operating assets decreased $6.7 million during the year endedDecember 31, 2008 as compared to the same period of the prior year due to the sale of an office building in SanFrancisco and the sale of the Starwood Amphitheater in Nashville in 2007.
Excluding the impact of the goodwill impairment of $269.9 million, operating income for North AmericanMusic increased $10.8 million primarily as a result of executing shows more efficiently through cost controls ontalent buying and other variable expenses and increased activity at our owned and/or operated amphitheaters,overall increased ancillary revenue per attendee, higher ticket sales through our internal ticketing operations,higher average ticket prices and improved results for arena tours. These increases were partially offset by thedecreased volume of global tours, higher selling, general and administrative expenses, increased depreciation andamortization due to impairments in 2008 and amortization of intangible assets for artist rights agreements andgains recorded in 2007 on asset sales with no similar activity in 2008.
Year Ended 2007 Compared to Year Ended 2006
North American Music revenue increased $235.4 million, or 11%, during the year ended December 31,2007 as compared to the same period of the prior year primarily due to $427.0 million of revenue related to ouracquisitions of CPI, TRUNK, Ltd, or Trunk, Musictoday, LLC, or Musictoday and HOB during the second, thirdand fourth quarters of 2006, respectively, and HOB Canada and Anthill during the second and fourth quarters of2007, respectively. This increase was partially offset by a decline in global touring revenue due to a decrease inthe average ticket price and volume and mix of tours. Tours during 2007 included The Rolling Stones, The Who,Barbra Streisand, The Police and Genesis.
North American Music direct operating expenses increased $109.8 million, or 6%, during the year endedDecember 31, 2007 as compared to the same period of the prior year primarily due to $318.2 million of directoperating expenses related to our acquisitions of CPI, Trunk, Musictoday and HOB during 2006 and HOB
54

Canada and Anthill during 2007. This increase was partially offset by a reduction in direct operating expenses forour owned and/or operated amphitheaters due to a decline in the number of events and reduced show costs. Inaddition, we experienced a decline in direct operating expenses for global tours due to the timing and mix oftours in 2007 as compared to 2006. The net increase in direct operating expenses was less than the increase inrevenue primarily due to more strategic talent buying and reduced show costs at our amphitheaters and due toHOB clubs, acquired in 2006, having lower direct operating expenses as a percentage of revenue as compared toour other promotion and venue operation businesses.
North American Music selling, general and administrative expenses increased $107.3 million, or 41%,during the year ended December 31, 2007 as compared to the same period of the prior year primarily due to$82.5 million of selling, general and administrative expenses related to our 2006 acquisitions of CPI, Trunk,Musictoday and HOB and our 2007 acquisitions of HOB Canada and Anthill. In addition, we experienced anincrease in legal expenses of $4.8 million related to ongoing cases, increased salary expense for promoters andadditional staff at venues and other incremental expenses related to the commencement of the Dodge Theateroperating agreement in January 2007, the Hollywood Palladium operating agreement in April 2007 and TheFillmore Miami Beach at the Jackie Gleason Theater operating agreement in June 2007. Finally, we experiencedan increase in selling, general and administrative expenses due to increased salary and consultant expense relatedto increased headcount and activity for Artist Services as we built the infrastructure of this division.
North American Music depreciation and amortization expense decreased $6.6 million, or 8%, during theyear ended December 31, 2007 as compared to the same period of the prior year due to an impairment of $42.5million recorded during 2006 related to several amphitheaters. This decrease was partially offset by an additional$17.3 million primarily for the amortization of the intangible assets resulting from our acquisition of HOB during2006, which were recorded as part of the purchase price allocations, amortization of the intangible assetsresulting from our 2006 and 2007 acquisitions of CPI, intangible assets associated with certain artist rightsagreements and an impairment of $3.8 million recorded during the fourth quarter of 2007 related to twoamphitheaters.
North American Music gain on sale of operating assets increased $6.7 million during the year endedDecember 31, 2007 as compared to the same period of the prior year primarily due to the sales of an officebuilding in San Francisco and the Starwood Amphitheater in Nashville.
The increase in operating income for North American Music was primarily a result of operating incomefrom our HOB and HOB Canada acquisitions, improved results at our owned and/or operated amphitheaters,decreased depreciation expense due to the amphitheater impairments recorded in 2006 and the gains recorded in2007 on the asset sales. These increases were partially offset by a decline in the average ticket price for globaltours, the timing and mix of global tours year over year, increased infrastructure costs for Artist Services and theamortization of intangible assets related to our acquisition of CPI and artist rights agreements.
55

International Music Results of Operations
Our International Music segment operating results were as follows:
Year Ended December 31, % Change2008 vs. 2007
% Change2007 vs. 2006(in thousands) 2008 2007 2006
Revenue . . . . . . . . . . . . . . . . . . . . . . . . . . . . $1,378,104 $1,307,714 $1,048,136 5% 25%Operating expenses:Direct operating expenses . . . . . . . . . . . . . . 1,127,235 1,077,805 842,338 5% 28%Selling, general and administrativeexpenses . . . . . . . . . . . . . . . . . . . . . . . . . . 172,604 151,962 123,824 14% 23%
Depreciation and amortization . . . . . . . . . . 30,418 19,855 17,228 53% 15%Loss (gain) on sale of operating assets . . . . 203 (18,807) 1,041 ** **
Operating income . . . . . . . . . . . . . . . . . . . . 47,644 76,899 63,705 (37)% 20%Operating margin . . . . . . . . . . . . . . . . . . . . . 3.5% 5.9% 6.1%
** Percentages are not meaningful.
Year Ended 2008 Compared to Year Ended 2007
International Music revenue increased $70.4 million, or 5%, during the year ended December 31, 2008 ascompared to the same period of the prior year. Excluding the increase related to the impact of changes in foreignexchange rates of $22.4 million, revenue increased $48.0 million, or 4%. This increase is primarily due toincremental revenue of $106.9 million related to the effect of our acquisitions of AMG in July 2007, HeinekenMusic Hall operations in January 2008, DF Concerts in April 2008, Luger and Moondog in June 2008, and MainSquare festival in July 2008. We also experienced higher promotion revenue in Sweden and Norway driven bystrong stadium events for artists such as KISS, Bruce Springsteen and Iron Maiden. In addition, we had anoverall increase in revenue related to our festival operations in the United Kingdom and Belgium, primarilydriven by increased attendance. These increases were partially offset by declines in revenue of $55.0 millionrelated to the effect of the divestiture of F&P Italia in September 2008 and the disposal of two music theaters andseven clubs in London in August 2007. Further offsetting these increases were declines in revenue related to theclosure of The Point in Ireland (reopened as the O2 Dublin) during renovation from August 2007 until December2008 and a decline in the volume of global tours. Tours during 2008 included Madonna and The Police.
International Music direct operating expenses increased $49.4 million, or 5%, during the year endedDecember 31, 2008 as compared to the same period of the prior year. Excluding the increase related to the impactof changes in foreign exchange rates of $23.4 million, direct operating expenses increased $26.0 million, or 2%,primarily related to incremental direct operating expenses of $75.5 million related to the effect of ouracquisitions, as well as an increase in expenses related to stronger festival performance and higher promotionrevenue noted above. These increases were partially offset by declines in direct operating expenses of $45.2million related to the impact of dispositions noted above. Further offsetting these increases were declines indirect operating expenses related to The Point closure and lower volume of global tours.
International Music selling, general and administrative expenses increased $20.6 million, or 14%, during theyear ended December 31, 2008 as compared to the same period of the prior year. Excluding the decrease relatedto the impact of changes in foreign exchange rates of $1.5 million, the increase in selling, general andadministrative expenses was $19.1 million, or 13%, primarily due to an increase of $17.8 million related to theacquisitions noted above as well as higher compensation costs. These increases were partially offset by adecrease of $6.9 million related to the dispositions and closure of The Point noted above.
International Music depreciation and amortization expense increased $10.6 million, or 53%, during the yearended December 31, 2008 as compared to the same period of the prior year primarily due to increased
56

amortization for intangible assets related to the AMG and DF Concerts acquisitions and certain artist rightsagreements.
International Music loss on sale of operating assets was $0.2 million for the year ended December 31, 2008as compared to a gain on sale of operating assets of $18.8 million for the same period of the prior year primarilydue to the sale of the Hammersmith Apollo and Forum music theaters and seven clubs in London in 2007.
The decrease in operating income for International Music was primarily a result of increased amortization ofintangibles related to the AMG and DF Concerts acquisitions and certain artist rights agreements, lost incomefrom the 2007 dispositions noted above, the decline in the volume of global tours, as well as the gains recorded in2007 on the venue disposals, partially offset by increased operating income from acquisitions.
Year Ended 2007 Compared to Year Ended 2006
International Music revenue increased $259.6 million, or 25%, during the year ended December 31, 2007 ascompared to the same period of the prior year. Excluding the increase related to the impact of changes in foreignexchange rates of $93.1 million, the increase in revenue was $166.5 million, or 16%. The impact of incrementalrevenue due to acquisitions was $107.8 million related to the effect of acquisitions in Spain in December 2006,France in January 2007, AMG in July 2007 and the addition of the Wembley Arena operating agreement in theUnited Kingdom in April 2006. We also experienced an increase in revenue from our other European operationsdriven by increased promotion activity in Italy, Finland, Norway and Holland and stronger results for severalfestivals in the United Kingdom. Partially offsetting these increases was a decline in revenue from the O2, anarena in Ireland, due to the venue being closed for renovations in August 2007.
International Music direct operating expenses increased $235.5 million, or 28%, during the year endedDecember 31, 2007 as compared to the same period of the prior year. Excluding the increase related to the impactof changes in foreign exchange rates of $76.1 million, the increase in direct operating expenses was $159.4million, or 19%. The impact of incremental direct operating expenses due to acquisitions was $80.3 millionrelated to the acquisitions discussed above and the addition of the Wembley Arena operating agreement. Ourdirect operating expenses also increased due to the improved results for our other European operations notedabove and increased direct operating expenses for several festivals in the United Kingdom.
International Music selling, general and administrative expenses increased $28.1 million, or 23%, during theyear ended December 31, 2007 as compared to the same period of the prior year. Excluding the increase relatedto the impact of changes in foreign exchange rates of $11.7 million, the increase in selling, general andadministrative expenses was $16.4 million, or 13%, primarily due to $15.7 million of selling, general andadministrative expenses related to the acquisitions discussed above and the addition of the Wembley Arenaoperations.
International Music gain on sale of operating assets increased $19.8 million during the year endedDecember 31, 2007 as compared to the same period of the prior year primarily due to the sale of theHammersmith Apollo and Forum music theaters and seven clubs in London.
Overall, the increase in operating income for International Music during the year ended December 31, 2007as compared to the same period of the prior year was primarily due to gains recorded as noted above. In addition,our recent acquisitions in Spain and France and our acquisition of AMG improved overall operating incomeduring 2007. Finally, we experienced stronger results at several of our festivals in the United Kingdom.
57

Ticketing Results of Operations
Our Ticketing segment operating results were as follows:
Year Ended December 31, % Change2008 vs. 2007
% Change2007 vs. 2006(in thousands) 2008 2007 2006
Revenue . . . . . . . . . . . . . . . . . . . . . . . . . . . . . . . . . . $ 22,393 $ 11,358 $ 8,893 97% 28%Operating expenses:Direct operating expenses . . . . . . . . . . . . . . . . . . . . 9,370 3,128 2,665 ** 17%Selling, general and administrative expenses . . . . . 33,332 15,379 11,829 ** 30%Depreciation and amortization . . . . . . . . . . . . . . . . . 5,569 3,311 501 68% **
Operating loss . . . . . . . . . . . . . . . . . . . . . . . . . . . . . (25,878) (10,460) (6,102) ** 71%Operating margin . . . . . . . . . . . . . . . . . . . . . . . . . . . ** (92.1)% (68.6)%
** Percentages are not meaningful.
Year Ended 2008 Compared to Year Ended 2007
Ticketing revenue increased $11.0 million during the year ended December 31, 2008 as compared to thesame period of the prior year primarily due to increased ticketing revenue from our internal ticketing operationsas all existing internal ticketing operations have now been centralized under this group.
Ticketing direct operating expenses increased $6.2 million during the year ended December 31, 2008 ascompared to the same period of the prior year due to costs associated with our internal ticketing operationsincreased revenue.
Ticketing selling, general and administrative expenses increased $18.0 million during the year endedDecember 31, 2008 as compared to the same period of the prior year primarily due to increased salary costsrelated to building our ticketing infrastructure, operations of our existing internal ticketing operations andwebsite and internet management, as well as maintenance expense associated with our website and ticketingoperations.
Ticketing depreciation and amortization expense increased $2.3 million during the year ended December 31,2008 as compared to the same period of the prior year primarily due to depreciation expense related to softwareand infrastructure.
The increase in the operating loss for Ticketing was primarily a result of higher salary costs andmaintenance expense as we completed our new ticketing platform partially offset by increased revenue, net ofexpenses, from our internal ticketing operations and related sponsorships.
Year Ended 2007 Compared to Year Ended 2006
Ticketing revenue increased $2.5 million, or 28%, during the year ended December 31, 2007 as compared tothe same period of the prior year primarily due to increased sponsorship revenue and ticket service charge rebatesassociated with our internal ticketing operations.
Ticketing direct operating expenses remained relatively flat during the year ended December 31, 2007 ascompared to the same period of the prior year due to minimal incremental direct operating expenses for ourinternal ticketing operations.
Ticketing selling, general and administrative expenses increased $3.6 million, or 30%, during the year endedDecember 31, 2007 as compared to the same period of the prior year primarily due to increased salary expense
58

related to new staff and increased maintenance and consultant expenses related to our internal informationtechnology and our website management.
Ticketing depreciation and amortization expense increased $2.8 million during the year ended December 31,2007 as compared to the same period of the prior year primarily due to higher depreciation expense related to ourwebsite development.
The increase in the operating loss for Ticketing was primarily a result of higher salary, consultant andmaintenance expenses, partially offset by increased ticket-related revenue and sponsorships from our internalticketing operations.
Other Results of Operations
Our other operating results were as follows:
Year Ended December 31, % Change2008 vs. 2007
% Change2007 vs. 2006(in thousands) 2008 2007 2006
Revenue . . . . . . . . . . . . . . . . . . . . . . . . . . . . . . . . . $88,032 $140,863 $177,297 (38)% (21)%Operating expenses:Direct operating expenses 26,215 71,089 92,097 (63)% (23)%Selling, general and administrative expenses . . . . . 41,348 54,533 69,539 (24)% (22)%Depreciation and amortization . . . . . . . . . . . . . . . . 7,961 10,358 18,559 (23)% (44)%Loss (gain) on sale of operating assets . . . . . . . . . . 62 5,047 (10,844) ** **
Operating income (loss) . . . . . . . . . . . . . . . . . . . . . 12,446 (164) 7,946 ** **Operating margin . . . . . . . . . . . . . . . . . . . . . . . . . . 14.1% (0.1)% 4.5%
** Percentages are not meaningful.
Year Ended 2008 Compared to Year Ended 2007
Other revenue decreased $52.8 million, or 38%, during the year ended December 31, 2008 as compared tothe same period of the prior year primarily as a result of a decline in revenue from our United Kingdom theateroperations as a result of reduced participation in theatrical productions and touring theatrical shows and the saleof our interest in the production of Phantom: The Las Vegas Spectacular in the first quarter of 2007.
Other direct operating expenses decreased $44.9 million, or 63%, during the year ended December 31, 2008as compared to the same period of the prior year primarily due to lower direct operating expenses from ourUnited Kingdom theater operations due to reduced productions and the sale of our interest in the production ofPhantom: The Las Vegas Spectacular.
Other selling, general and administrative expenses decreased $13.2 million, or 24%, during the year endedDecember 31, 2008 as compared to the same period of the prior year primarily due to higher overhead costs in2007 related to businesses that we have sold or are no longer operating.
Loss on sale of operating assets was $0.1 million during the year ended December 31, 2008 as compared to$5.0 million during the same period of the prior year. In 2007, we recorded a loss on the sale of our interest in theproduction of Phantom: The Las Vegas Spectacular, which was partially offset by a gain on the sale of an arena/race track in Leicestershire, England.
The improvement in operating income in our other operations was primarily due to the elimination of lessprofitable non-core assets and a reduced loss on sale of operating assets related to assets sold in 2007.
59
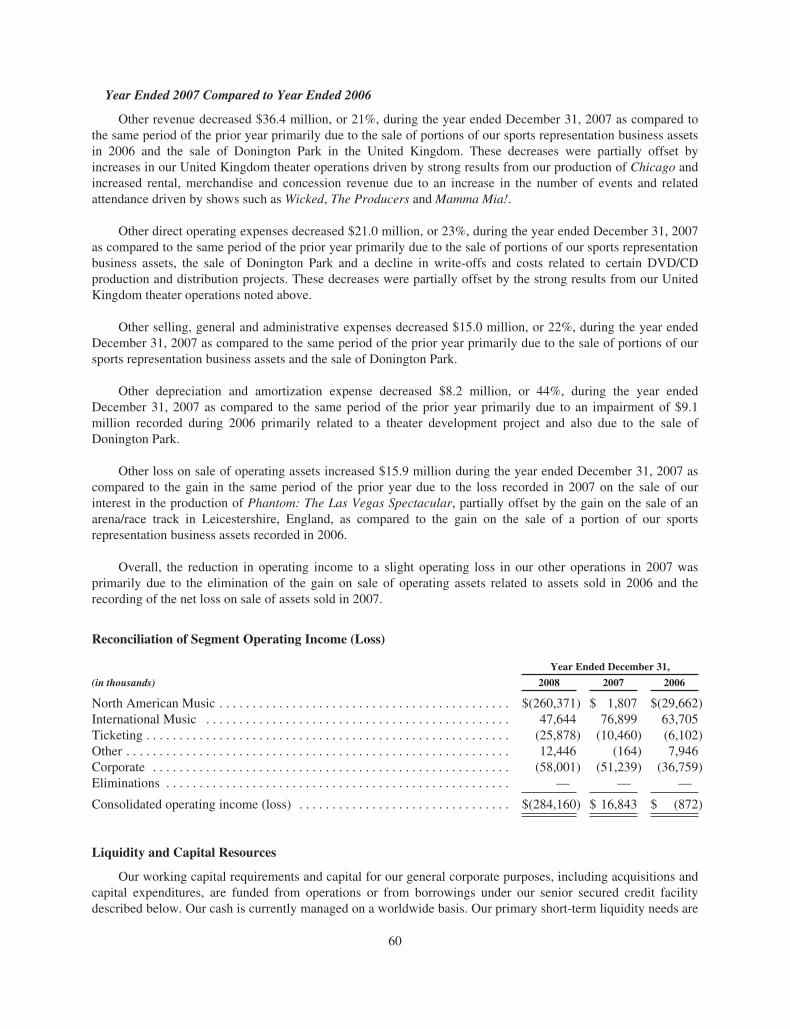
Year Ended 2007 Compared to Year Ended 2006
Other revenue decreased $36.4 million, or 21%, during the year ended December 31, 2007 as compared tothe same period of the prior year primarily due to the sale of portions of our sports representation business assetsin 2006 and the sale of Donington Park in the United Kingdom. These decreases were partially offset byincreases in our United Kingdom theater operations driven by strong results from our production of Chicago andincreased rental, merchandise and concession revenue due to an increase in the number of events and relatedattendance driven by shows such as Wicked, The Producers and Mamma Mia!.
Other direct operating expenses decreased $21.0 million, or 23%, during the year ended December 31, 2007as compared to the same period of the prior year primarily due to the sale of portions of our sports representationbusiness assets, the sale of Donington Park and a decline in write-offs and costs related to certain DVD/CDproduction and distribution projects. These decreases were partially offset by the strong results from our UnitedKingdom theater operations noted above.
Other selling, general and administrative expenses decreased $15.0 million, or 22%, during the year endedDecember 31, 2007 as compared to the same period of the prior year primarily due to the sale of portions of oursports representation business assets and the sale of Donington Park.
Other depreciation and amortization expense decreased $8.2 million, or 44%, during the year endedDecember 31, 2007 as compared to the same period of the prior year primarily due to an impairment of $9.1million recorded during 2006 primarily related to a theater development project and also due to the sale ofDonington Park.
Other loss on sale of operating assets increased $15.9 million during the year ended December 31, 2007 ascompared to the gain in the same period of the prior year due to the loss recorded in 2007 on the sale of ourinterest in the production of Phantom: The Las Vegas Spectacular, partially offset by the gain on the sale of anarena/race track in Leicestershire, England, as compared to the gain on the sale of a portion of our sportsrepresentation business assets recorded in 2006.
Overall, the reduction in operating income to a slight operating loss in our other operations in 2007 wasprimarily due to the elimination of the gain on sale of operating assets related to assets sold in 2006 and therecording of the net loss on sale of assets sold in 2007.
Reconciliation of Segment Operating Income (Loss)
Year Ended December 31,
(in thousands) 2008 2007 2006
North American Music . . . . . . . . . . . . . . . . . . . . . . . . . . . . . . . . . . . . . . . . . . . . $(260,371) $ 1,807 $(29,662)International Music . . . . . . . . . . . . . . . . . . . . . . . . . . . . . . . . . . . . . . . . . . . . . . 47,644 76,899 63,705Ticketing . . . . . . . . . . . . . . . . . . . . . . . . . . . . . . . . . . . . . . . . . . . . . . . . . . . . . . . (25,878) (10,460) (6,102)Other . . . . . . . . . . . . . . . . . . . . . . . . . . . . . . . . . . . . . . . . . . . . . . . . . . . . . . . . . . 12,446 (164) 7,946Corporate . . . . . . . . . . . . . . . . . . . . . . . . . . . . . . . . . . . . . . . . . . . . . . . . . . . . . . (58,001) (51,239) (36,759)Eliminations . . . . . . . . . . . . . . . . . . . . . . . . . . . . . . . . . . . . . . . . . . . . . . . . . . . . — — —
Consolidated operating income (loss) . . . . . . . . . . . . . . . . . . . . . . . . . . . . . . . . $(284,160) $ 16,843 $ (872)
Liquidity and Capital Resources
Our working capital requirements and capital for our general corporate purposes, including acquisitions andcapital expenditures, are funded from operations or from borrowings under our senior secured credit facilitydescribed below. Our cash is currently managed on a worldwide basis. Our primary short-term liquidity needs are
60

to fund general working capital requirements and capital expenditures while our long-term liquidity needs areprimarily acquisition related. Our primary sources of funds for our short-term liquidity needs will be cash flowsfrom operations and borrowings under our senior secured credit facility, while our long-term sources of fundswill be from cash from operations, long-term bank borrowings and other debt or equity financing.
Our balance sheet reflects cash and cash equivalents of $199.7 million and current and long-term debt of$824.1 million at December 31, 2008, and cash and cash equivalents of $339.0 million and current and long-termdebt of $753.0 million at December 31, 2007. These debt balances do not include our outstanding redeemablepreferred stock and are net of debt discount of $61.6 million and $69.6 million at December 31, 2008 and 2007,respectively.
Our available cash and cash equivalents is held in accounts managed by third-party financial institutions andconsists of cash in our operating accounts and invested cash. The invested cash is invested in interest-bearingfunds managed by third-party financial institutions. These funds generally invest in direct obligations of thegovernment of the United States. Cash held in operating accounts in many cases exceeds the Federal DepositInsurance Corporation, or FDIC, insurance limits. While we monitor cash and cash equivalents balances in ouroperating accounts on a regular basis and adjust the balances as appropriate, these balances could be impacted ifthe underlying financial institutions fail. To date, we have experienced no loss or lack of access to our cash orcash equivalents; however, we can provide no assurances that access to our cash and cash equivalents will not beimpacted by adverse conditions in the financial markets.
We may need to incur additional debt or issue equity to make other strategic acquisitions or investments.There can be no assurance that such financing will be available to us on acceptable terms or at all. Our ability toissue additional equity may be constrained because the issuance of additional stock may cause the Distribution tobe taxable under section 355(e) of the Internal Revenue Code, and, under our tax matters agreement with ClearChannel, we would be required to indemnify Clear Channel against the tax, if any. We may make significantacquisitions in the near term, subject to limitations imposed by our financing documents, market conditions andthe tax matters agreement.
The lenders under our revolving credit facility and counterparties to our interest rate swap agreementsdiscussed below consist of banks and other third-party financial institutions. While we currently have noindications or expectations that such lenders and counterparties will be unable to fund their commitments asrequired, we can provide no assurances that future funding availability will not be impacted by adverseconditions in the financial markets. Should an individual lender default on its obligations, the remaining lenderswould not be required to fund the shortfall, resulting in a reduction in the total amount available to us for futureborrowings, but would remain obligated to fund their own commitments. Should any counterparty to our interestrate swap agreements default on its obligations, we could experience higher interest rate volatility during theperiod of any such default.
We generally receive cash related to ticket revenue in advance of the event in our owned and/or operatedvenues, which is recorded in deferred revenue until the event occurs. With the exception of some upfront costsand artist deposits, which are recorded in prepaid expenses until the event occurs, we pay the majority of event-related expenses, along with the remainder of the artist fees, at or after the event. We view our available cash ascash and cash equivalents, less event-related deferred revenue, less accrued expenses due to artists and for cashcollected on behalf of others, plus event-related prepaids. This is essentially our cash available to, among otherthings, repay debt balances, make acquisitions, repurchase stock and finance revenue-generating capitalexpenditures.
Our intra-year cash fluctuations are impacted by the seasonality of our various businesses. An example ofseasonal effects includes our North American Music and International Music segments, which report the majorityof their revenue in the second and third quarters. Cash inflows and outflows depend on the timing of event-related payments but the majority of the inflows generally occur prior to the event. See “—Seasonality” below.
61

We believe that we have sufficient financial flexibility to fund these fluctuations and to access the global capitalmarkets on satisfactory terms and in adequate amounts, although there can be no assurance that this will be thecase. We expect cash flow from operations and borrowings under our senior secured credit facility, along withother financing alternatives, to satisfy working capital, capital expenditure and debt service requirements for atleast the succeeding year.
Sources of Cash
Senior Secured Credit Facility
We have a senior secured credit facility consisting of term loans totaling $550 million and a $285 millionrevolving credit facility. The revolving credit facility provides for borrowings up to the amount of the facilitywith sub-limits of up to $235 million to be available for the issuance of letters of credit and up to $100 million tobe available for borrowings in foreign currencies. The term loans of $325 million and $225 million mature inJune 2013 and December 2013, respectively, and the revolving credit portion of the credit facility matures inJune 2012. For the term loan maturing in June 2013, minimum quarterly principal repayments of approximately$2.7 million per year are required through March 2013, with the balance due at maturity. For the term loanmaturing in December 2013, minimum quarterly principal repayments of approximately $1.9 million per year arerequired through September 2013, with the balance due at maturity. We are required to prepay the outstandingterm loans, subject to certain exceptions and conditions, from certain asset sale proceeds and casualty andcondemnation proceeds that we do not reinvest within a 365-day period or from certain additional debt issuanceproceeds. On asset sales, a minimum of 50% of the net proceeds is required to be prepaid at the time the saleproceeds are received.
During the year ended December 31, 2008, we made principal payments totaling $33.7 million and $325.0million on the term loans and revolving credit facility, respectively, which includes $29.3 million of term loanpre-payments from the proceeds received from the sale of the motor sports business and events business. Thepayments on the revolving credit facility were primarily to repay short-term borrowings used to fund workingcapital requirements during the year. At December 31, 2008, the outstanding balances on the term loans andrevolving credit facility were $418.1 million and $122.0 million, respectively. Taking into account letters ofcredit of $42.3 million, $120.7 million was available for future borrowings.
As of February 23, 2009, the outstanding balances on the term loans and revolving credit facility were$418.1 million and $179.0 million, respectively. Taking into account letters of credit of $42.4 million, $63.6million was available for future borrowings.
Borrowings under the term loan portion of the credit facility bear interest at per annum floating rates equal,at our option, to either (a) the base rate (which is the greater of the prime rate offered by JPMorgan Chase Bank,N.A. or the federal funds rate plus 0.5%) plus 2.25% or (b) Adjusted LIBOR plus 3.25%. Borrowings under therevolving portion of the credit facility bear interest at per annum floating rates equal, at our option, to either(a) the base rate (which is the prime rate offered by JPMorgan Chase Bank, N.A. ) plus an applicable margin or(b) Adjusted LIBOR plus an applicable margin. Sterling and Euro-denominated borrowings under the revolvingportion of the credit facility currently bear interest at per annum floating rates equal to either Adjusted LIBOR orAdjusted EURIBOR, respectively, plus an applicable margin. The revolving credit facility margins are subject tochange based upon the amount of leverage for the previous calendar quarter. In the event our leverage ratioimproves, the interest rate on revolving credit borrowings declines gradually to 1.25% at a total leverage ratio ofless than, or equal to, 1.25 times. Under the terms of the original term loan, we are required to enter into aninterest rate swap for a minimum of 50% of the outstanding debt for a minimum of three years.
The interest rate we pay on borrowings on our senior term loans is 3.25% above LIBOR. The interest ratewe pay on our $285 million multi-currency revolving credit facility depends on our total leverage ratio. Based onour current total leverage ratio, our interest rate on revolving credit borrowings is 2.25% above LIBOR. Inaddition to paying interest on outstanding principal under the credit facility, we are required to pay a commitment
62

fee to the lenders under the revolving credit facility in respect of the unutilized commitments. As ofDecember 31, 2008, the commitment fee rate was 0.375%. We also are required to pay customary letter of creditfees, as necessary.
The senior secured credit facility contains a number of covenants that, among other things, restrict ourability to incur additional debt, pay dividends and make distributions, make certain investments and acquisitions,repurchase stock and prepay certain indebtedness, create liens, enter into agreements with affiliates, modify thenature of the business, enter into sale-leaseback transactions, transfer and sell material assets and merge orconsolidate.
2.875% Convertible Senior Notes
In July 2007, we issued $220 million of convertible senior notes due 2027 in a private placement in theUnited States to qualified institutional buyers pursuant to Rule 144A under the Securities Act of 1933. The notespay interest semiannually at a rate of 2.875% per annum. Beginning with the period commencing on July 20,2014 and ending on January 14, 2015, and for each of the interest periods commencing thereafter, we will paycontingent interest on the notes if the average trading price of the notes during the five consecutive trading daysending on the second trading day immediately preceding the first day of the applicable interest period equals orexceeds 120% of the principal amount of the notes. The contingent interest payable per note will equal 0.25% peryear of the average trading price of such note during the applicable five trading-day reference period, payable inarrears. The notes will be convertible, under certain circumstances, at an initial conversion rate of 36.8395 sharesper $1,000 principal amount of notes, which represents a 27.5% conversion premium based on the last reportedsale price prior to the placement of the notes, of $21.29 per share on July 10, 2007. Upon conversion, the notesmay be settled in shares of Live Nation common stock or, at our election, cash or a combination of cash andshares of Live Nation common stock. The net proceeds from the offering, after deducting estimated offeringexpenses payable by us, were approximately $212.4 million.
Holders of the 2.875% convertible senior notes may require us to purchase for cash all or a portion of theirnotes on July 15, 2014, July 15, 2017 and July 15, 2022 at a price equal to 100% of the principal amount plusaccrued and unpaid interest, if any, subject to specified additional conditions. In addition, if we experience afundamental change, as defined in the indenture governing the notes, holders may require us to purchase for cashall or a portion of their notes, subject to specified exceptions, at a price equal to 100% of the principal amount ofthe notes plus accrued and unpaid interest, if any.
On or after July 20, 2014, we may redeem all or a portion of the notes for cash at a price equal to 100% ofthe principal amount being redeemed plus accrued and unpaid interest, if any.
Redeemable Preferred Stock
As part of the Separation, one of our subsidiaries sold 200,000 shares of Series A (voting) mandatorilyRedeemable Preferred Stock to third-party investors and issued 200,000 shares of Series B (non-voting)mandatorily Redeemable Preferred Stock to Clear Channel which then sold this Series B Redeemable PreferredStock to third-party investors. We did not receive any of the proceeds from the sale of the Series B RedeemablePreferred Stock sold by Clear Channel. As of December 31, 2008, we had 200,000 shares of Series ARedeemable Preferred Stock and 200,000 shares of Series B Redeemable Preferred Stock outstanding(collectively, the Preferred Stock) with an aggregate liquidation preference of $40 million. The Preferred Stockaccrues dividends at 13% per annum and is mandatorily redeemable on December 21, 2011, although we areobligated to make an offer to repurchase the Preferred Stock at 101% of the liquidation preference in the event ofa change of control.
The Amended and Restated Certificate of Incorporation governing the Redeemable Preferred Stock (theAmended Preferred Stock Certificate) contains a number of covenants that, among other things, restrict our
63

ability to incur additional debt, issue certain equity securities, create liens, merge or consolidate, modify thenature of our business, make certain investments and acquisitions, transfer and sell material assets, enter intosale-leaseback transactions, enter into swap agreements, pay dividends and make distributions, and enter intoagreements with affiliates. If we default under any of these covenants, we will have to pay additional dividends.
Guarantees of Third-Party Obligations
As of December 31, 2008 and 2007, we guaranteed the debt of third parties of approximately $2.2 millionand $2.8 million for each of the respective periods, primarily related to maximum credit limits on employee andtour related credit cards and guarantees of bank lines of credit of a nonconsolidated affiliate and a third-partypromoter.
During 2006, in connection with our acquisition of Historic Theatre Group, we guaranteed obligationsrelated to a lease agreement. In the event of default, we could be liable for obligations which have future leasepayments (undiscounted) of approximately $29.4 million through the end of 2035. The venues under the leaseagreement were included in the sale of our North American theatrical business. We entered into an AssumptionAgreement with the buyer in connection with the sale, under which the buyer is assuming our obligations underthe guaranty.
Disposal of Assets
During the year ended December 31, 2008, we received $198.7 million of proceeds primarily related to thesales of our North American theatrical business and the sale of our motor sports business. These proceeds arepresented net of any cash included in the businesses sold.
Debt Covenants
The significant covenants on our multi-currency senior secured credit facility relate to total leverage, seniorleverage, interest coverage and capital expenditures contained and defined in the credit agreement. The adjustedleverage ratio covenant requires us to maintain a ratio of consolidated total indebtedness minus unrestricted cashand cash equivalents, up to a maximum of $150 million (all as defined by the credit agreement), to consolidatedearnings-before-interest-taxes-depreciation-and-amortization (as defined by the credit agreement, or AdjustedConsolidated EBITDA) of less than 4.0 times, provided that aggregated subordinated indebtedness and permittedholding company indebtedness (as defined by the credit agreement) is less than $25 million or 6.0 times if greaterthan $25 million; therefore, we our currently subject to an adjusted leverage ratio of less than 6.0 times. Thesenior leverage covenant, which is only applicable provided aggregate subordinated indebtedness and permittedholding company indebtedness is greater than $25 million, requires us to maintain a ratio of adjustedconsolidated senior indebtedness minus unrestricted cash and cash equivalents to Adjusted ConsolidatedEBITDA of less than 4.0 times. The interest coverage covenant requires us to maintain a minimum ratio ofAdjusted Consolidated EBITDA to cash interest expense (as defined by the credit agreement) of 2.5 times. Thecapital expenditure covenant limits annual capital expenditures (as defined by the credit agreement) to$110 million or less, subject to a carryover provision of up to an additional $110 million. In the event that we donot meet these covenants, we are considered to be in default on the credit facilities at which time the creditfacilities may become immediately due. This credit facility contains a cross default provision that would betriggered if we were to default on any other indebtedness greater than $10 million.
In July 2008, we amended our existing amended and restated senior secured credit agreement and theAmended Preferred Stock Certificate effective June 30, 2008 to, among other things, (i) increase the amount ofallowable investments by the amount of net proceeds received from issuances of equity and convertible debt,(ii) permit investment in unrestricted subsidiaries in an amount of up to 50% of the amount of net proceedsreceived from issuances of equity and convertible debt and (iii) revise the definition of certain items in theagreement.
64

The Amended Preferred Stock Certificate contains covenants similar to the senior secured credit facility andalso contains a covenant that requires us to pay additional dividends ranging from 2% to 7% in the event the ratioof consolidated total indebtedness minus unrestricted cash and cash equivalents, up to a maximum of $150million (all as defined by the Amended Preferred Stock Certificate), to consolidated earnings-before-interest-taxes-depreciation-and-amortization (as defined by the Amended Preferred Stock Certificate) exceeds 4.0 times.
Some of our other subsidiary indebtedness includes restrictions on acquisitions and prohibits payment ofordinary dividends. They also have financial covenants including minimum consolidated EBITDA toconsolidated net interest payable, minimum consolidated cash flow to consolidated debt service, and maximumconsolidated debt to consolidated EBITDA, all as defined in the applicable debt agreements.
At December 31, 2008, we were in compliance with all debt and Redeemable Preferred Stock covenants.We expect to remain in compliance with all of these covenants throughout 2009.
Uses of Cash
Acquisitions
When we make acquisitions, especially of entities where we buy a controlling interest only, the acquiredentity may have cash on its balance sheet at the time of acquisition. All amounts discussed in this section arepresented net of any cash acquired. During 2008, we used $19.7 million in cash for acquisitions primarily in ourInternational Music segment related to the acquisition of the operating company that manages and holds the leasefor the Heineken Music Hall located in Amsterdam, the acquisition of an interest in DF Concerts, a concertpromotion company in Scotland, the acquisition of an interest in Mirage, a concert promoter in Dubai and theacquisition of the remaining interests we did not already own in Luger and Moondog, both music-relatedcompanies in Sweden.
During 2007, we used $124.3 million in cash for acquisitions in our various segments. Our North AmericanMusic segment acquired the remaining interest in HOB Canada, a live music company located in Canada whichoperates or has booking rights for one amphitheater and three clubs in Toronto and Vancouver, the remaining49% interest in Trunk which is a specialty merchandise company located in California, the remaining 49%interest in Musictoday which provides services to artists including online fan clubs and artist e-commerce andfulfillment and is located in Virginia, the remaining interests in the CPI entities which engage in full serviceglobal tours and provide various other artist services and was located in Canada, Anthill which is amerchandising company located in New York, Signatures which is a merchandising company located inCalifornia, and acquired an interest in Bamboozle, LLC, a festival promotion company located in the UnitedStates. Our International Music segment acquired an interest in Jackie Lombard, a concert promotion company inFrance, an interest in AMG, a live music company located in the United Kingdom which owns and/or operates12 music theaters, along with payment of an additional working capital adjustment related to our acquisition ofGamerco, S.A. in December 2006.
During 2006, our North American Music segment used $328.1 million in cash for our acquisitions of HOB,interests in several CPI entities which engage in full service global tours and provide certain artist services, aninterest in Musictoday which provides services to artists for online fan clubs and artist e-commerce andfulfillment, and an interest in Trunk which is a specialty merchandise company. HOB owns and/or operates tenbranded clubs in Los Angeles, Anaheim, San Diego, Las Vegas, New Orleans, Chicago, Cleveland, Orlando,Myrtle Beach and Atlantic City; The Commodore Ballroom, a club in Vancouver; and eight amphitheaters inSeattle, Los Angeles, San Diego, Denver, Dallas, Atlanta, Cleveland and Toronto. In addition, our InternationalMusic segment used $21.8 million in cash, primarily for our acquisitions of an interest in Angel FestivalsLimited, a dance festival promotion company in the United Kingdom and Gamerco, S.A., a concert promotioncompany in Spain. Also, our other operations used $2.0 million in cash for our acquisition of Historic TheatreGroup which operates three theaters in Minnesota that primarily host theatrical performances.
65

Purchases of Intangibles
In 2008 and in 2007, we used $65.5 million and $47.6 million, respectively, in cash primarily related toentering into certain artist rights agreements with Madonna, Jay-Z, Shakira, Nickelback and U2 as well as forrights acquired in 2008 in connection with a 51% interest in Live Nation—Haymon Ventures, LLC.
Capital Expenditures
Venue operations is a capital intensive business, requiring continual investment in our existing venues inorder to address audience and artist expectations, technological industry advances and various federal, state and/or local regulations.
We categorize capital outlays into maintenance capital expenditures and revenue generating capitalexpenditures. Maintenance capital expenditures are associated with the renewal and improvement of existingvenues and, to a lesser extent, capital expenditures related to information systems, web development andadministrative offices. Revenue generating capital expenditures generally relate to the construction of newvenues or major renovations to existing buildings or buildings that are being added to our venue network.Revenue generating capital expenditures can also include smaller projects whose purpose is to add revenue and/or improve operating income. Capital expenditures typically increase during periods when venues are not inoperation.
Our capital expenditures consisted of the following:
(in thousands) 2008 2007 2006
Maintenance capital expenditures . . . . . . . . . . . . . . . . . . . . . . . . . . . . . . . . . . . . $ 24,989 $ 45,194 $48,120Revenue generating capital expenditures . . . . . . . . . . . . . . . . . . . . . . . . . . . . . . . 161,931 71,655 17,585
Total capital expenditures . . . . . . . . . . . . . . . . . . . . . . . . . . . . . . . . . . . . . . . . . . $186,920 $116,849 $65,705
Revenue generating capital expenditures for 2008 increased significantly from the prior year primarily dueto the development and renovation of various venues, including O2 Dublin in Ireland, House of Blues clubs inHouston and Boston, the Hollywood Palladium, AMG venue expansions in Sheffield and Leeds, as well as forour ticketing roll-out. The decrease in maintenance capital expenditures in 2008 as compared to the prior year isdue to various projects in 2007, including the roll-out of a new financial software system, office building movesfor a few locations and information technology costs for hardware and software including the build-out of a newdata center.
Revenue generating capital expenditures for 2007 increased significantly from the prior year due to thedevelopment and renovation of various venues including O2 Dublin in Ireland, the House of Blues club in Dallasand the acquisition of an additional portion of the land on which we annually stage our Reading Festival in theUnited Kingdom. In addition, we invested additional capital in transforming our venues into wired studios toexpand on the distribution opportunities of the live concert experience.
Share Repurchase Program
Our board of directors authorized a $150 million share repurchase program in December 2005. Thatprogram expired on December 31, 2006 and no new program was approved for 2007 or 2008. A total of3.4 million shares were repurchased under this share repurchase program for an aggregate purchase price of$42.7 million, including commissions and fees, with an average purchase price of $12.65 per share.
66

Contractual Obligations and Commitments
Firm Commitments
In addition to the scheduled maturities on our debt, we have future cash obligations under various types ofcontracts. We lease office space, certain equipment and some of the venues used in our music and otheroperations under long-term operating leases. Some of our lease agreements contain renewal options and annualrental escalation clauses (generally tied to the consumer price index), as well as provisions for our payment ofutilities and maintenance. We also have minimum payments associated with noncancelable contracts related toour operations such as artist guarantee contracts. As part of our ongoing capital projects, we will enter intoconstruction related commitments for future capital expenditure work. The scheduled maturities discussed belowrepresent contractual obligations as of December 31, 2008 and thus do not represent all expected expenditures forthose periods.
The scheduled maturities of our outstanding long-term debt, future minimum rental commitments undernoncancelable lease agreements, minimum payments under other noncancelable contracts and capitalexpenditures commitments as of December 31, 2008 are as follows:
Payments Due by Period
(in thousands) Total 2009 2010-2011 2012-2013 2014 and thereafter
Long-term debt obligations, includingcurrent maturitiesTerm loans and revolving creditfacility . . . . . . . . . . . . . . . . . . . . . . . . $ 540,065 $ 4,227 $ 8,453 $527,385 $ —
2.875% convertible senior notes (5) . . . 220,000 — — — 220,000Other long-term debt . . . . . . . . . . . . . . . 125,648 44,411 24,926 22,435 33,876
Redeemable preferred stock . . . . . . . . . . . . . 40,000 — 40,000 — —Estimated interest payments (1) . . . . . . . . . . 204,483 36,163 88,065 68,239 12,016Non-cancelable operating leaseobligations (4) . . . . . . . . . . . . . . . . . . . . . . 1,093,989 77,863 142,311 133,559 740,256
Non-cancelable contracts (2) (4) . . . . . . . . . . 967,090 489,253 102,715 173,229 201,893Capital expenditures . . . . . . . . . . . . . . . . . . . 11,346 8,846 2,500 — —Other long-term liabilities (3)
Total . . . . . . . . . . . . . . . . . . . . . . . . . . . . . . . . $3,202,621 $660,763 $408,970 $924,847 $1,208,041
(1) Includes dividends on the Series A and Series B redeemable preferred stock. Includes interest on the 2.875%convertible senior notes through July 2014. Excludes interest on the outstanding revolver balance. Based onthe outstanding revolver balance of $122.0 million at December 31, 2008, annual interest expense throughmaturity in June 2012 would be approximately $6.0 million assuming a rate of 4.9% and that we maintainthis level of indebtedness under the revolver.
(2) Excluded from the non-cancelable contracts is $120.8 million related to minimum severance obligations forall employment contracts calculated as if all such employees were terminated on January 1, 2009.
(3) Other long-term liabilities consist of $22.0 million of tax contingencies, $4.5 million of deferred revenue,$44.8 million of accrued rent and $75.1 million of various other obligations. All of our other long-termliabilities do not have contractual maturities and, therefore, we cannot predict when, or if, they will becomedue.
(4) Commitment amounts for non-cancelable operating leases and non-cancelable contracts which stipulate anincrease in the commitment amount based on an inflationary index have been estimated using an inflationfactor of 3.0% for North America and 1.75% for the United Kingdom.
(5) Amount represents the outstanding principal of the convertible senior notes and does not reflect debtdiscount of $61.6 million at December 31, 2008.
67

During 2006, in connection with our acquisition of the Historic Theatre Group, we guaranteed obligationsrelated to a lease agreement. In the event of default, we could be liable for obligations which have future leasepayments (undiscounted) of approximately $29.4 million through the end of 2035 which are not reflected in thetable above. The scheduled future minimum rentals for this lease for the years 2009 through 2013 are $1.6million each year. The venues under the lease agreement were included in the sale of our North Americantheatrical business. We entered into an Assumption Agreement with the buyer in connection with the sale, underwhich the buyer is assuming our obligations under the guaranty, however we remain contingently liable to thelessor. We believe that the likelihood of material liability being triggered under this lease is remote, and noliability has been accrued for these contingent lease obligations as of December 31, 2008.
Minimum rentals of $109.2 million to be received in years 2009 through 2020 under non-cancelablesubleases are excluded from the commitment amounts in the above table.
Cash Flows
Year Ended December 31,
(in thousands) 2008 2007 2006
Cash provided by (used in):Operating activities . . . . . . . . . . . . . . . . . . . . . . . . . . . . . . . . . . . . . . . . . $(52,836) $ 49,810 $ 17,628Investing activities . . . . . . . . . . . . . . . . . . . . . . . . . . . . . . . . . . . . . . . . . . $(67,596) $(141,059) $(376,071)Financing activities . . . . . . . . . . . . . . . . . . . . . . . . . . . . . . . . . . . . . . . . . $ 33,984 $ 110,188 $ 268,294
Operating Activities
Year Ended 2008 Compared to Year Ended 2007
Cash used in operations was $52.8 million for the year ended December 31, 2008, compared to cashprovided by operations of $49.8 million for the year ended December 31, 2007. The $102.6 million increase incash used in operations resulted primarily from advances related to entering into certain artist rights agreementsand changes in the event-related operating accounts which are dependent on the timing, size, and number ofevents for upcoming periods. The accounts primarily affected by this event timing were accrued event-relatedexpenses which decreased, as compared to an increase last year, and resulted in a decrease in cash used inoperating activities, partially offset by prepaid event-related expenses which increased less than last year andresulted in a decrease in cash used in operating activities.
Year Ended 2007 Compared to Year Ended 2006
Cash provided by operations was $49.8 million for the year ended December 31, 2007, compared to$17.6 million for the year ended December 31, 2006. The $32.2 million increase in cash provided by operationsprimarily resulted from changes in the event-related operating accounts which are dependent on the number andsize of events for upcoming periods. Accounts receivable decreased, rather than increased, due to the timing andnumber of events during 2007 as compared to 2006 and the timing of cash collections resulting in an increase tocash provided by operations. In addition, we received more deferred revenue and paid less accrued event-relatedexpenses during 2007 as compared to 2006 resulting in an increase to cash provided by operations. Conversely,the other assets increase was higher primarily due to advances under long-term artist rights agreements resultingin a decrease to cash provided by operating activities. Finally, we paid more prepaid event-related expensesduring 2007 as compared to 2006 resulting in a decrease to cash provided by operating activities. These changesin event-related operating accounts are impacted by the timing, size and number of events related to musicactivity in the period.
68

Investing Activities
Year Ended 2008 Compared to Year Ended 2007
Cash used in investing activities was $67.6 million for the year ended December 31, 2008, compared to$141.1 million for the year ended December 31, 2007. The $73.5 million decrease in cash used in investingactivities is primarily due to higher proceeds received in 2008 from the sale of our motor sports, events, andNorth American theatrical businesses as compared to proceeds received in 2007 from the sales of an arena/racetrack in Leicestershire, England, an amphitheater in Nashville, an office building in San Francisco, two musictheaters and seven clubs in London and our production of Phantom: The Las Vegas Spectacular. Additionally,we used more cash in the prior year related to our acquisitions of Signatures, AMG and HOB Canada ascompared to the amounts used for our 2008 acquisitions. Partially offsetting these decreases in cash used ininvesting activities were higher capital expenditures and acquisitions of certain artist rights in 2008.
Year Ended 2007 Compared to Year Ended 2006
Cash used in investing activities was $141.1 million for the year ended December 31, 2007, as compared to$376.1 million for the year ended December 31, 2006. The $235.0 million decrease in cash used in investingactivities was primarily due to our acquisition of HOB during 2006. In addition, we received higher proceedsfrom the divestiture of the Oriental Theater in Chicago and our 50% interest in BIC, the Apollo Hammersmithand Forum music theaters in London, Donington Park in Leicestershire, England, seven clubs in London, anoffice building in San Francisco, the Starwood Amphitheater in Nashville, our remaining 50.1% interest in theproduction of Phantom: The Las Vegas Spectacular and a club in Cleveland, Ohio. These decreases werepartially offset by increases in our capital expenditures during 2007 as compared to the prior year primarily dueto the development of the House of Blues club in Dallas, the renovation of O2 Dublin in Ireland, the acquisitionof an additional portion of the land on which we annually stage our Reading Festival in the United Kingdom andthe wiring of our venues into live studios. Also offsetting the decreases was an increase in cash used for investingactivities primarily related to intangible assets acquired for long-term artist rights agreements.
Financing Activities
Year Ended 2008 Compared to Year Ended 2007
Cash provided by financing activities was $34.0 million for the year ended December 31, 2008, compared to$110.2 million for the year ended December 31, 2007. The $76.2 million decrease in cash provided by financingactivities was primarily a result of reduced net borrowings in 2008 as compared to the same period in the prioryear. Included in 2007 was the issuance of our 2.875% convertible senior notes, while 2008 included higher netborrowings on our revolving credit facility and lower term loan repayments than in 2007. Additionally, in 2008we purchased stock in connection with a put option related to an artist rights agreement which used cash and,therefore, reduced cash provided by financing activities.
Year Ended 2007 Compared to Year Ended 2006
Cash provided by financing activities was $110.2 million for the year ended December 31, 2007, ascompared to $268.3 million for the year ended December 31, 2006. The $158.1 million decrease in cash providedby financing activities was primarily a result of net payments made on our term loans and revolving creditfacility partially offset by increased proceeds received from the issuance of our 2.875% convertible notes during2007 which were less than the proceeds received from the additional term loan during 2006 which was partiallyused to fund our acquisition of HOB in 2006.
Seasonality
Our North American Music and International Music segments typically experience higher operating incomein the second and third quarters as our outdoor venues and international festivals are primarily used or occur
69

during May through September. In addition, the timing of tours of top-grossing acts can impact comparability ofquarterly results year over year, although annual results may not be impacted.
Cash flows from our North American Music and International Music segments typically have a slightlydifferent seasonality as payments are often made for artist performance fees and production costs in advance ofthe date the related event tickets go on sale. These artist fees and production costs are expensed when the eventoccurs. Once tickets for an event go on sale, we begin to receive payments from ticket sales, still in advance ofwhen the event occurs. We record these ticket sales as revenue when the event occurs.
We expect these trends to continue in the future. See Item 1A. Risk Factors—Our operations are seasonaland our results of operations vary from quarter to quarter and year over year, so our financial performance incertain quarters may not be indicative of, or comparable to, our financial performance in subsequent quarters oryears.
Market Risk
We are exposed to market risks arising from changes in market rates and prices, including movements inforeign currency exchange rates and interest rates.
Foreign Currency Risk
We have operations in countries throughout the world. The financial results of our foreign operations aremeasured in their local currencies. As a result, our financial results could be affected by factors such as changesin foreign currency exchange rates or weak economic conditions in the foreign markets in which we haveoperations. Currently, we do not operate in any hyper-inflationary countries. Our foreign operations reportedoperating income of $80.4 million for the year ended December 31, 2008. We estimate that a 10% change in thevalue of the United States dollar relative to foreign currencies would change our operating income for the yearended December 31, 2008 by $8.0 million. As of December 31, 2008, our primary foreign exchange exposureincluded the Euro, British Pound, Swedish Kroner and Canadian Dollar. This analysis does not consider theimplication such currency fluctuations could have on the overall economic conditions of the United States orother foreign countries in which we operate or on the results of operations of our foreign entities.
Occasionally, we will use forward currency contracts to reduce our exposure to foreign currency risk. Theprincipal objective of such contracts is to minimize the risks and/or costs associated with artist fee commitments.At December 31, 2008, we had forward currency contracts outstanding with a notional amount of $10.1 million.
Interest Rate Risk
Our market risk is also affected by changes in interest rates. We had $824.1 million total debt, net of debtdiscount, outstanding as of December 31, 2008. Of the total amount, taking into consideration existing interestrate hedges, we have $553.3 million of fixed-rate debt and $270.8 million of floating-rate debt.
Based on the amount of our floating-rate debt as of December 31, 2008, each 25 basis point increase ordecrease in interest rates would increase or decrease our annual interest expense and cash outlay byapproximately $0.7 million. This potential increase or decrease is based on the simplified assumption that thelevel of floating-rate debt remains constant with an immediate across-the-board increase or decrease as ofDecember 31, 2008 with no subsequent change in rates for the remainder of the period.
At December 31, 2008, we have four interest rate swap agreements that are designated as cash flow hedgesfor accounting purposes, which include swaps and combinations of interest rate caps and floors, with a totalnotional amount of $312.5 million, to effectively convert a portion of our floating-rate debt to a fixed-rate basis.Two of these agreements expire in March 2009 and one in September 2010. One of these swap agreements has a
70

forward swap with a notional amount of $162.5 million effective March 31, 2009 which expires March 31, 2011.The fair value of these agreements at December 31, 2008 was a liability of $10.9 million. These agreements wereput in place to eliminate or reduce the variability of a portion of the cash flows from the interest payments relatedto our senior secured credit facility. The terms of our senior secured credit facility required that an interest rateswap be put in place for at least 50% of the original $325 million senior term loan and for at least three years.
As part of the acquisition of AMG, we have an interest rate swap agreement with an $18.4 million aggregatenotional amount that effectively converts a portion of our floating-rate debt to a fixed-rate basis. This agreementexpires in January 2015. Additionally, in connection with the financing of the redevelopment of O2 Dublin inIreland, we have an interest rate swap agreement with a notional amount of $22.6 million that expires inDecember 2013. These interest rate swap agreements have not been designated as hedging instruments.Therefore, any change in fair value is recorded in earnings during the period of the change.
In July 2007, we issued $220.0 million of convertible senior notes due 2027. Beginning with the periodcommencing on July 20, 2014 and ending on January 14, 2015, and for each of the interest periods commencingthereafter, we will pay contingent interest on the notes if the average trading price of the notes during the fiveconsecutive trading days ending on the second trading day immediately preceding the first day of the applicableinterest period equals or exceeds 120% of the principal amount of the notes. The contingent interest payable pernote will equal 0.25% per year of the average trading price of such note during the applicable five trading-dayreference period, payable in arrears.
Recent Accounting Pronouncements
Recently Adopted Pronouncements
In September 2006, the FASB issued Statement of Financial Accounting Standards No. 157, Fair ValueMeasurements, or Statement 157. Statement 157 provides guidance for using fair value to measure assets andliabilities and also responds to investors’ requests for expanded information about the extent to which companiesmeasure assets and liabilities at fair value, the information used to measure fair value and the effect of fair valuemeasurements on earnings. Statement 157 applies whenever other standards require (or permit) assets orliabilities to be measured at fair value. Statement 157 does not expand the use of fair value in any newcircumstances. We adopted Statement 157 on January 1, 2008 for all financial assets and liabilities recognized ordisclosed at fair value in our consolidated financial statements on a recurring basis (at least annually). InFebruary 2008, the FASB issued FASB Staff Position No. 157-2, Effective Date of FASB Statement No. 157,which delays the effective date for nonfinancial assets and nonfinancial liabilities, except for items that arerecognized or disclosed at fair value in the financial statements on a recurring basis (at least annually). Theeffective date for these items was delayed to fiscal years beginning after November 15, 2008. We are currentlyassessing the impact on our nonfinancial assets and liabilities that the adoption of Statement 157 will have on ourfinancial position and results of operations.
In February 2007, the FASB issued Statement of Financial Accounting Standards No. 159, The Fair ValueOption for Financial Assets and Financial Liabilities, or Statement 159. Statement 159 allows entities tovoluntarily choose, at specified election dates, to measure many financial assets and financial liabilities (as wellas certain nonfinancial instruments that are similar to financial instruments) at fair value, or the fair value option.The election is made on an instrument-by-instrument basis and is irrevocable. If the fair value option is electedfor an instrument, Statement 159 specifies that all subsequent changes in fair value for that instrument will bereported in earnings. We adopted Statement 159 on January 1, 2008 and determined that we would not elect tomeasure any of our eligible financial instruments at fair value under the provisions of this standard.
Recently Issued Pronouncements
In December 2007, the FASB issued Statement of Financial Accounting Standards No. 141(R), BusinessCombinations, or Statement 141(R). Statement 141(R) establishes revised principles and requirements for the
71

recognition and measurement of assets and liabilities in a business combination. Statement 141(R) requires(i) recognition of 100% of the fair value of acquired assets, including goodwill, and assumed liabilities uponobtaining control, (ii) contingent consideration to be recorded at fair value at acquisition date, (iii) transactioncosts to be expensed as incurred, (iv) pre-acquisition contingencies to be accounted for at acquisition date at fairvalue and (v) costs of a plan to exit an activity or terminate or relocate employees to be accounted for as post-combination costs. Statement 141(R) is effective for fiscal years beginning after December 15, 2008. We willadopt Statement 141(R) on January 1, 2009 and apply the requirements of Statement 141(R) for businesscombinations that occur after the date of adoption.
In December 2007, the FASB issued Statement of Financial Accounting Standards No. 160, NoncontrollingInterests in Consolidated Financial Statements—an amendment of ARB No. 51, or Statement 160. Statement 160clarifies the classification of noncontrolling interests in consolidated statements of financial position and theaccounting for and reporting of transactions between the reporting entity and holders of such noncontrollinginterests. Statement 160 is effective for fiscal years beginning after December 15, 2008. The provisions ofStatement 160 are applied prospectively with the exception of reclassifying noncontrolling interests to equity andrecasting consolidated net income (loss) to include net income (loss) attributable to both the controlling andnoncontrolling interests, which are required to be adopted retrospectively. We adopted Statement 160 onJanuary 1, 2009 and its adoption did not have a material impact on our financial position or results of operations.
In March 2008, the FASB issued Statement of Financial Accounting Standards No. 161, Disclosures aboutDerivative Instruments and Hedging Activities—an amendment of FASB Statement No. 133, or Statement 161.Statement 161 requires enhanced disclosures about (i) how and why an entity uses derivative instruments,(ii) how derivative instruments and related hedged items are accounted for under FASB Statement No. 133,Accounting for Derivative Instruments and Hedging Activities, or Statement 133, and its related interpretationsand (iii) how derivative instruments and related hedged items affect an entity’s financial position, financialperformance and cash flows. Statement 161 is effective for fiscal years and interim periods beginning afterNovember 15, 2008. We will adopt Statement 161 in the first quarter of 2009.
In May 2008, the FASB issued FASB Staff Position, or FSP, APB 14-1, Accounting for Convertible DebtInstruments That May Be Settled in Cash upon Conversion (Including Partial Cash Settlement). This FSP willchange the accounting for certain convertible debt instruments, including our 2.875% convertible senior notes.Under the new rules for convertible debt instruments that may be settled entirely or partially in cash uponconversion, an entity should separately account for the liability and equity components of the instrument in amanner that reflects the issuer’s economic interest cost. The effect of the new rules for our notes is that the equitycomponent is included in the additional paid-in capital section of stockholders’ equity on our balance sheet andthe value of the equity component is treated as an original issue discount for purposes of accounting for the debtcomponent of the notes. Higher interest expense results from recognizing the accretion of the discounted carryingvalue of the notes to their face amount as interest expense over the expected term of the notes using an effectiveinterest rate method of amortization. This FSP is effective for fiscal years and interim periods beginning afterDecember 15, 2008. We adopted the provisions of this FSP on January 1, 2009 and applied it retrospectively toall periods presented. In applying this FSP, $73.0 million of the carrying value of the convertible notes wasreclassified to equity as of the July 2007 issuance date. This amount represents the equity component of theproceeds from the notes, calculated assuming a 9.4% non-convertible borrowing rate. The discount will beamortized to interest expense over the seven-year term of the notes. Accordingly, $3.3 million of additionalnon-cash interest expense was recorded in 2007 and $7.6 million of additional non-cash interest expense wasrecorded in 2008. Additionally, we expect that the adoption of this FSP will result in additional non-cash interestexpense of approximately $9.5 million, $10.4 million and $11.4 million for 2009, 2010 and 2011, respectively.
In June 2008, the FASB issued FSP Emerging Issues Task Force, or EITF 03-6-1, Determining WhetherInstruments Granted in Share-Based Payment Transactions Are Participating Securities, or FSP EITF 03-6-1.FSP EITF 03-6-1 was issued to clarify that unvested share-based payment awards with a right to receivenonforfeitable dividends are participating securities and provide guidance on how to allocate earnings to
72

participating securities and compute basic earnings per share using the two-class method. FSP EITF 03-6-1 iseffective for fiscal years and interim periods beginning after December 15, 2008. We adopted FSP EITF 03-6-1on January 1, 2009 and applied it retrospectively to all periods presented. The adoption of FSP EITF 03-6-1 didnot have a material impact on our earnings per share.
Critical Accounting Policies and Estimates
The preparation of our financial statements in conformity with U.S. Generally Accepted AccountingPrinciples requires management to make estimates, judgments and assumptions that affect the reported amountsof assets and liabilities, disclosure of contingent assets and liabilities at the date of the financial statements andthe reported amount of expenses during the reporting period. On an ongoing basis, we evaluate our estimates thatare based on historical experience and on various other assumptions that are believed to be reasonable under thecircumstances. The result of these evaluations forms the basis for making judgments about the carrying values ofassets and liabilities and the reported amount of expenses that are not readily apparent from other sources.Because future events and their effects cannot be determined with certainty, actual results could differ from ourassumptions and estimates, and such difference could be material. Management believes that the followingaccounting estimates are the most critical to aid in fully understanding and evaluating our reported financialresults, and they require management’s most difficult, subjective or complex judgments, resulting from the needto make estimates about the effect of matters that are inherently uncertain. The following narrative describesthese critical accounting estimates, the judgments and assumptions and the effect if actual results differ fromthese assumptions.
Allowance for Doubtful Accounts
We evaluate the collectibility of our accounts receivable based on a combination of factors. Generally, werecord specific reserves to reduce the amounts recorded to what we believe will be collected when a customer’saccount ages beyond typical collection patterns, or we become aware of a customer’s inability to meet itsfinancial obligations.
We believe that the credit risk with respect to trade receivables is limited due to the large number and thegeographic diversification of our customers.
Long-lived Assets
Long-lived assets, such as property, plant and equipment, are reviewed for impairment when events andcircumstances indicate that depreciable and amortizable long-lived assets might be impaired and theundiscounted cash flows estimated to be generated by those assets are less than the carrying amount of thoseassets. When specific assets are determined to be unrecoverable, the cost basis of the asset is reduced to reflectthe current fair value.
We use various assumptions in determining the current fair market value of these assets, including futureexpected cash flows and discount rates, as well as future salvage values and other fair value measures. Forintangibles related to artist rights, the Company uses assumptions about future revenue and operating income forthe rights acquired. These projections are based on information about the artists’ past results and expectationsabout future results. Our impairment loss calculations require us to apply judgment in estimating future cashflows, including forecasting useful lives of the assets and selecting the discount rate that reflects the risk inherentin future cash flows.
If actual results are not consistent with our assumptions and judgments used in estimating future cash flowsand asset fair values, we may be exposed to future impairment losses that could be material to our results ofoperations.
73

Goodwill
Goodwill represents the excess of the purchase price over the fair value of identifiable net assets acquired inbusiness combinations. We review goodwill for impairment at least annually to determine the fair value of ourreporting units. The fair value of our reporting units is used to apply value to the net assets of each reporting unit.To the extent that the carrying amount of net assets would exceed the fair value, an impairment charge may berequired to be recorded.
The process of evaluating goodwill for impairment involves the determination of the fair value of ourreporting units. We use both market multiples and discounted cash flow projections in developing fair values.Inherent in such fair value determinations are certain judgments and estimates relating to future cash flows, ourinterpretation of current economic indicators and market valuations, and assumptions about our strategic planswith regard to our operations. Due to the uncertainties associated with such estimates, actual results could differfrom such estimates.
Revenue Recognition
Revenue from the promotion and production of an event is recognized after the performance occurs uponsettlement of the event. Revenue related to larger global tours is recognized after the performance occurs;however, any profits related to these tours, primarily related to music tour production and tour managementservices, is recognized after minimum revenue thresholds, if any, have been achieved. Revenue collected inadvance of the event is recorded as deferred revenue until the event occurs. Revenue collected from sponsorshipsand other revenue, which is not related to any single event, is classified as deferred revenue and generallyamortized over the operating season or the term of the contract.
Revenue from our ticketing operations primarily consists of convenience and order processing fees chargedat the time a ticket for an event is sold and is recorded on a net basis (net of the face value of the ticket). Fortickets sold for events at our owned and/or operated venues, this revenue is recognized after the performanceoccurs upon settlement of the event. Revenue for these ticket fees collected in advance of the event is recorded asdeferred revenue until the event occurs. These fees will be shared between our Ticketing segment and the NorthAmerican Music segment. For tickets sold for events for third-party venues, this revenue is recognized at thetime of the sale and is recorded by our Ticketing segment.
For multiple element contracts, we allocate consideration to the multiple elements based on the relative fairvalues of each separate element which are determined based on prices charged for such items when sold on astand-alone basis. In cases where there is no objective and reliable evidence of the fair value of certain element(s)in an arrangement, we account for the transaction as a single unit of accounting per the requirements ofEITF 00-21, Revenue Arrangements with Multiple Deliverables.
We account for taxes that are externally imposed on revenue producing transactions on a net basis, as areduction to revenue.
Litigation Accruals
We are currently involved in certain legal proceedings and, as required, have accrued our estimate of theprobable costs for the resolution of these claims. Management’s estimates used have been developed inconsultation with counsel and are based upon an analysis of potential results, assuming a combination oflitigation and settlement strategies. It is possible, however, that future results of operations for any particularperiod could be materially affected by changes in our assumptions or the effectiveness of our strategies related tothese proceedings.
74

Stock-Based Compensation
We follow the fair value recognition provisions of FASB Statement of Financial Accounting StandardsNo. 123 (revised 2004), Share-Based Payment, or Statement 123(R). In accordance with Statement 123(R), wecontinue to use the Black-Scholes option pricing model to estimate the fair value of our stock options at the dateof grant. Judgment is required in estimating the amount of stock-based awards expected to be forfeited prior tovesting. If actual forfeitures differ significantly from these estimates, non-cash compensation expense could bematerially impacted.
Income Taxes
We account for income taxes using the liability method in accordance with FASB Statement of FinancialAccounting Standards No. 109, Accounting for Income Taxes. Under this method, deferred tax assets andliabilities are determined based on differences between financial reporting bases and tax bases of assets andliabilities and are measured using the enacted tax rates expected to apply to taxable income in the periods inwhich the deferred tax asset or liability is expected to be realized or settled. Deferred tax assets are reduced byvaluation allowances if we believe it is more likely than not that some portion or the entire asset will not berealized. As all earnings from our foreign operations are permanently reinvested and not distributed, our incometax provision does not include additional U.S. taxes on foreign operations. It is not practical to determine theamount of federal income taxes, if any, that might become due in the event that the earnings were distributed.
We adopted the provisions of FASB Interpretation No. 48, Accounting for Uncertainty in Income Taxes – aninterpretation of FASB Statement No. 109, or FIN 48, on January 1, 2007. FIN 48 prescribes a recognitionthreshold and a measurement attribute for the financial statement recognition and measurement of tax positionstaken or expected to be taken in a tax return. For those benefits to be recognized, a tax position must be morelikely than not to be sustained upon examination by taxing authorities. The amount recognized is measured as thelargest amount of benefit that is greater than 50% likely of being realized upon ultimate settlement.
Ratio of Earnings to Fixed Charges
The ratio of earnings to fixed charges is as follows:
Year Ended December 31,
2008 2007 2006 2005 2004
* * * * *
* For the years ended December 31, 2008, 2007, 2006, 2005 and 2004, fixed charges exceeded earnings fromcontinuing operations before income taxes and fixed charges by $344.6 million, $34.5 million, $26.6million, $62.0 million and $14.2 million, respectively.
The ratio of earnings to fixed charges was computed on a total company basis. Earnings represent incomefrom continuing operations before income taxes less equity in undistributed net income (loss) of nonconsolidatedaffiliates plus fixed charges. Fixed charges represent interest, amortization of debt discount and expense and theestimated interest portion of rental charges. Rental charges exclude variable rent expense for events in third-partyvenues. Prior period calculations have been revised to conform to the current period presentation.
75

ITEM 8. FINANCIAL STATEMENTS AND SUPPLEMENTARY DATA
Report of Independent Registered Public Accounting Firm
The Board of Directors and Shareholders of Live Nation, Inc.
We have audited the accompanying consolidated balance sheets of Live Nation, Inc. and subsidiaries as ofDecember 31, 2008 and 2007, and the related consolidated statements of operations, comprehensive income(loss), changes in stockholders’ equity, and cash flows for each of the three years in the period endedDecember 31, 2008. Our audits also included the financial statement schedule listed in the Index at Item 15(a)2.These financial statements and schedule are the responsibility of the Company’s management. Our responsibilityis to express an opinion on these financial statements and schedule based on our audits.
We conducted our audits in accordance with the standards of the Public Company Accounting Oversight Board(United States). Those standards require that we plan and perform the audit to obtain reasonable assurance aboutwhether the financial statements are free of material misstatement. An audit includes examining, on a test basis,evidence supporting the amounts and disclosures in the financial statements. An audit also includes assessing theaccounting principles used and significant estimates made by management, as well as evaluating the overallfinancial statement presentation. We believe that our audits provide a reasonable basis for our opinion.
In our opinion, the financial statements referred to above present fairly, in all material respects, the consolidatedfinancial position of Live Nation, Inc. and subsidiaries at December 31, 2008 and 2007, and the consolidatedresults of their operations and their cash flows for each of the three years in the period ended December 31, 2008,in conformity with U.S. generally accepted accounting principles. Also in our opinion, the related financialstatement schedule, when considered in relation to the financial statements taken as a whole, presents fairly in allmaterial respects the information set forth therein.
As discussed in Notes 1 and 13 to the consolidated financial statements, in 2007 the Company changed itsmethod of accounting for income taxes. Also as discussed in Note 1 to the consolidated financial statements, in2009 the Company changed its method of accounting for convertible debt instruments that may be settled in cashupon conversion, its method of accounting for minority interests, and its method of computing earnings per shareas it relates to unvested share-based payment awards with a right to receive nonforfeitable dividends, and haschanged its reportable segments.
We also have audited, in accordance with the standards of the Public Company Accounting Oversight Board(United States), Live Nation, Inc.’s internal control over financial reporting as of December 31, 2008, based oncriteria established in Internal Control-Integrated Framework issued by the Committee of SponsoringOrganizations of the Treadway Commission and our report dated March 3, 2009 expressed an unqualifiedopinion thereon.
Los Angeles, CaliforniaMarch 3, 2009,except for the changes as described in section “Pronouncements Retrospectively Applied” of Note 1 and in Note18, and the financial statement schedule, as to which the date is May 26, 2009
76

CONSOLIDATED BALANCE SHEETS
December 31,
2008 2007
(in thousands exceptshare data)
ASSETSCurrent assets
Cash and cash equivalents . . . . . . . . . . . . . . . . . . . . . . . . . . . . . . . . . . . . . . . . . . . . . . . . . . . . . $ 199,660 $ 338,991Accounts receivable, less allowance of $10,376 in 2008 and $18,928 in 2007 . . . . . . . . . . . . . 217,286 264,316Prepaid expenses . . . . . . . . . . . . . . . . . . . . . . . . . . . . . . . . . . . . . . . . . . . . . . . . . . . . . . . . . . . . . 194,355 186,379Other current assets . . . . . . . . . . . . . . . . . . . . . . . . . . . . . . . . . . . . . . . . . . . . . . . . . . . . . . . . . . . 28,517 44,722
Total current assets . . . . . . . . . . . . . . . . . . . . . . . . . . . . . . . . . . . . . . . . . . . . . . . . . . . . . . . 639,818 834,408Property, plant and equipment
Land, buildings and improvements . . . . . . . . . . . . . . . . . . . . . . . . . . . . . . . . . . . . . . . . . . . . . . . 990,433 1,018,079Furniture and other equipment . . . . . . . . . . . . . . . . . . . . . . . . . . . . . . . . . . . . . . . . . . . . . . . . . . 260,524 236,320Construction in progress . . . . . . . . . . . . . . . . . . . . . . . . . . . . . . . . . . . . . . . . . . . . . . . . . . . . . . . 41,282 51,725
1,292,239 1,306,124Less accumulated depreciation . . . . . . . . . . . . . . . . . . . . . . . . . . . . . . . . . . . . . . . . . . . . . . . . . . 404,504 391,079
887,735 915,045Intangible assets
Intangible assets—net . . . . . . . . . . . . . . . . . . . . . . . . . . . . . . . . . . . . . . . . . . . . . . . . . . . . . . . . . 514,469 382,999Goodwill . . . . . . . . . . . . . . . . . . . . . . . . . . . . . . . . . . . . . . . . . . . . . . . . . . . . . . . . . . . . . . . . . . . 205,296 471,542
Other long-term assetsNotes receivable, less allowance of $562 in 2008 and $745 in 2007 . . . . . . . . . . . . . . . . . . . . . 672 1,703Investments in nonconsolidated affiliates . . . . . . . . . . . . . . . . . . . . . . . . . . . . . . . . . . . . . . . . . . 18,519 23,443Other long-term assets . . . . . . . . . . . . . . . . . . . . . . . . . . . . . . . . . . . . . . . . . . . . . . . . . . . . . . . . 210,214 120,680
Total assets . . . . . . . . . . . . . . . . . . . . . . . . . . . . . . . . . . . . . . . . . . . . . . . . . . . . . . . . . . . . . $2,476,723 $2,749,820
LIABILITIES AND STOCKHOLDERS’ EQUITYCurrent liabilities
Accounts payable . . . . . . . . . . . . . . . . . . . . . . . . . . . . . . . . . . . . . . . . . . . . . . . . . . . . . . . . . . . . $ 53,563 $ 79,273Accrued expenses . . . . . . . . . . . . . . . . . . . . . . . . . . . . . . . . . . . . . . . . . . . . . . . . . . . . . . . . . . . . 378,992 511,636Deferred revenue . . . . . . . . . . . . . . . . . . . . . . . . . . . . . . . . . . . . . . . . . . . . . . . . . . . . . . . . . . . . 225,664 259,868Current portion of long-term debt . . . . . . . . . . . . . . . . . . . . . . . . . . . . . . . . . . . . . . . . . . . . . . . . 48,637 36,345Other current liabilities . . . . . . . . . . . . . . . . . . . . . . . . . . . . . . . . . . . . . . . . . . . . . . . . . . . . . . . . 64,381 18,348
Total current liabilities . . . . . . . . . . . . . . . . . . . . . . . . . . . . . . . . . . . . . . . . . . . . . . . . . . . . 771,237 905,470
Long-term debt, net of discount . . . . . . . . . . . . . . . . . . . . . . . . . . . . . . . . . . . . . . . . . . . . . . . . . . . . . 775,483 716,672Other long-term liabilities . . . . . . . . . . . . . . . . . . . . . . . . . . . . . . . . . . . . . . . . . . . . . . . . . . . . . . . . . . 146,360 91,465Series A and Series B redeemable preferred stock . . . . . . . . . . . . . . . . . . . . . . . . . . . . . . . . . . . . . . . 40,000 40,000Commitments and contingent liabilities (Note 11)
Stockholders’ equityPreferred stock—Series A Junior Participating, $.01 par value; 20,000,000 shares authorized;no shares issued and outstanding . . . . . . . . . . . . . . . . . . . . . . . . . . . . . . . . . . . . . . . . . . . . . . — —
Preferred stock, $.01 par value; 30,000,000 shares authorized; no shares issued andoutstanding . . . . . . . . . . . . . . . . . . . . . . . . . . . . . . . . . . . . . . . . . . . . . . . . . . . . . . . . . . . . . . . — —
Common stock, $.01 par value; 450,000,000 shares authorized; 78,528,724 and 74,893,005shares issued and outstanding in 2008 and 2007, respectively . . . . . . . . . . . . . . . . . . . . . . . . 785 749
Additional paid-in capital . . . . . . . . . . . . . . . . . . . . . . . . . . . . . . . . . . . . . . . . . . . . . . . . . . . . . . 1,063,564 1,011,407Retained deficit . . . . . . . . . . . . . . . . . . . . . . . . . . . . . . . . . . . . . . . . . . . . . . . . . . . . . . . . . . . . . . (373,606) (134,194)Cost of shares held in treasury (505,811 shares in 2008) . . . . . . . . . . . . . . . . . . . . . . . . . . . . . . (7,861) —Accumulated other comprehensive income (loss) . . . . . . . . . . . . . . . . . . . . . . . . . . . . . . . . . . . (961) 56,410
Total Live Nation, Inc. stockholders’ equity . . . . . . . . . . . . . . . . . . . . . . . . . . . . . . . . . . . 681,921 934,372
Minority interests . . . . . . . . . . . . . . . . . . . . . . . . . . . . . . . . . . . . . . . . . . . . . . . . . . . . . . . . . . . . 61,722 61,841
Total stockholders’ equity . . . . . . . . . . . . . . . . . . . . . . . . . . . . . . . . . . . . . . . . . . . . . . . . . 743,643 996,213
Total liabilities and stockholders’ equity . . . . . . . . . . . . . . . . . . . . . . . . . . . . . . . . . . . . . . $2,476,723 $2,749,820
See Notes to Consolidated Financial Statements
77

CONSOLIDATED STATEMENTS OF OPERATIONS
Year Ended December 31,
2008 2007 2006
(in thousands except share and per share data)
Revenue . . . . . . . . . . . . . . . . . . . . . . . . . . . . . . . . . . . . . . . . . . . . . . . . $ 4,166,838 $ 3,755,470 $ 3,294,471Operating expenses:
Direct operating expenses . . . . . . . . . . . . . . . . . . . . . . . . . . . . . . 3,324,672 3,003,610 2,678,869Selling, general and administrative expenses . . . . . . . . . . . . . . . 655,351 592,983 468,970Depreciation and amortization . . . . . . . . . . . . . . . . . . . . . . . . . . 147,467 116,834 123,628Goodwill impairment . . . . . . . . . . . . . . . . . . . . . . . . . . . . . . . . . 269,902 — —Loss (gain) on sale of operating assets . . . . . . . . . . . . . . . . . . . . 1,108 (20,654) (9,987)Corporate expenses . . . . . . . . . . . . . . . . . . . . . . . . . . . . . . . . . . . 52,498 45,854 33,863
Operating income (loss) . . . . . . . . . . . . . . . . . . . . . . . . . . . . . . . . . . . (284,160) 16,843 (872)Interest expense . . . . . . . . . . . . . . . . . . . . . . . . . . . . . . . . . . . . . . . . . . 70,670 65,006 37,194Interest income . . . . . . . . . . . . . . . . . . . . . . . . . . . . . . . . . . . . . . . . . . (10,192) (13,476) (11,025)Equity in (earnings) losses of nonconsolidated affiliates . . . . . . . . . . (2,264) 5,058 (1,716)Other income—net . . . . . . . . . . . . . . . . . . . . . . . . . . . . . . . . . . . . . . . (28) (147) (489)
Loss from continuing operations before income taxes . . . . . . . . . . . . (342,346) (39,598) (24,836)Income tax expense (benefit):
Current . . . . . . . . . . . . . . . . . . . . . . . . . . . . . . . . . . . . . . . . . . . . . (24,057) 5,625 8,268Deferred . . . . . . . . . . . . . . . . . . . . . . . . . . . . . . . . . . . . . . . . . . . . 8,132 7,649 10,334
Loss from continuing operations . . . . . . . . . . . . . . . . . . . . . . . . . . . . . (326,421) (52,872) (43,438)Income from discontinued operations, net of tax . . . . . . . . . . . . . . . . 88,596 45,552 24,205
Net loss . . . . . . . . . . . . . . . . . . . . . . . . . . . . . . . . . . . . . . . . . . . . . . . . (237,825) (7,320) (19,233)Net income attributable to minority interests . . . . . . . . . . . . . . . . . . . 1,587 7,869 12,209
Net loss attributable to Live Nation, Inc. . . . . . . . . . . . . . . . . . . . . . . $ (239,412) $ (15,189) $ (31,442)
Basic and diluted income (loss) per common share attributable tocommon stockholders:Loss from continuing operations attributable to Live Nation,Inc. . . . . . . . . . . . . . . . . . . . . . . . . . . . . . . . . . . . . . . . . . . . . . . $ (4.30) $ (0.89) $ (0.85)
Income from discontinued operations . . . . . . . . . . . . . . . . . . . . . 1.16 0.67 0.37
Net loss attributable to Live Nation, Inc. . . . . . . . . . . . . . . . . . . $ (3.14) $ (0.22) $ (0.48)
Weighted average common shares outstanding:Basic . . . . . . . . . . . . . . . . . . . . . . . . . . . . . . . . . . . . . . . . . . . . . . 76,228,275 68,440,582 64,853,243
Diluted . . . . . . . . . . . . . . . . . . . . . . . . . . . . . . . . . . . . . . . . . . . . . 76,228,275 68,440,582 64,853,243
See Notes to Consolidated Financial Statements
78

CONSOLIDATED STATEMENTS OF COMPREHENSIVE INCOME (LOSS)
Year Ended December 31,
2008 2007 2006
(in thousands)
Net loss . . . . . . . . . . . . . . . . . . . . . . . . . . . . . . . . . . . . . . . . . . . . . . . . . . . . . . . . $(237,825) $ (7,320) $(19,233)Other comprehensive income (loss), net of tax:
Net unrealized gain (loss) on cash flow derivatives . . . . . . . . . . . . . . . . . . (9,094) (1,888) 104Currency translation adjustments . . . . . . . . . . . . . . . . . . . . . . . . . . . . . . . . (60,070) 41,697 30,639
Comprehensive income (loss) . . . . . . . . . . . . . . . . . . . . . . . . . . . . . . . . . . . . . . . (306,989) 32,489 11,510Comprehensive income (loss) attributable to minority interests . . . . . . . . . (10,206) 11,987 15,816
Comprehensive income (loss) attributable to Live Nation, Inc. . . . . . . . . . . . . . $(296,783) $20,502 $ (4,306)
See Notes to Consolidated Financial Statements
79

CONSO
LID
ATEDST
ATEMENTSOFCHANGESIN
STOCKHOLDERS’
EQUIT
Y
LiveNation,
Inc.Stockh
olders’E
quity
Com
mon
Shares
Issued
Com
mon
Stock
Add
itiona
lPaid-in
Cap
ital
Retained
Deficit
Costof
Shares
Heldin
Treasury
Accum
ulated
Other
Com
prehensive
Income(Loss)
Minority
InterestsCom
prehensive
Income(Loss)
Total
(inthou
sand
s,except
sharedata)
Balan
ceat
Decem
ber31,2005
67,174,912
$672
$748,011
$(87,563)
$(18,003)
$(6,417)
$26,362
$—
$663,062
Non-cashcompensation
...........................
——
3,307
——
——
3,307
Com
mon
shares
issued
forbusiness
acquisition
s........
——
16,395
—21,246
——
37,641
Spin-offadjustment...............................
——
(9,965)
——
——
(9,965)
Purchase
ofcommon
shares
........................
——
——
(24,715)
——
(24,715)
Acquisitio
ns.....................................
——
——
——
2,238
2,238
Cashdividends
..................................
——
——
——
(1,415)
(1,415)
Netadvances
....................................
——
——
——
33,188
33,188
Other
....
......................................
——
——
——
(24)
(24)
Com
prehensive
income(loss):
Netincome(loss).............................
——
—(31,442)
——
12,209
(19,233)
(19,233)
Unrealiz
edgain
oncash
flow
derivativ
es..........
——
——
—335
—335
335
Realized
gain
oncash
flow
derivativ
es............
——
——
—(231)
—(231)
(231)
Currencytranslationadjustment.................
——
——
—27,032
3,607
30,639
30,639
Totalcomprehensive
income(loss)
...................
$11,510
Balan
ceat
Decem
ber31,2006
67,174,912
$672
$757,748
$(119,005)
$(21,472)
$20,719
$76,165
$714,827
Non-cashcompensation
...........................
93,000
116,975
——
——
16,976
Com
mon
shares
issued
forbusiness
acquisition
s........
6,450,722
64139,725
—21,884
——
161,673
Com
mon
shares
issued
foroperationalcontracts
........
1,174,371
1226,400
——
——
26,412
Purchase
ofcommon
shares
........................
——
——
(412)
——
(412)
Adjustm
enttoinitially
applyFS
PAPB
14-1
for
convertib
ledebt
(Note7)
.........................
——
70,559
——
——
70,559
Acquisitio
ns.....................................
——
——
——
(12,108)
(12,108)
Cashdividends
..................................
——
——
——
(4,424)
(4,424)
Divestitures
.....................................
——
——
——
(12,927)
(12,927)
Other
....
......................................
——
——
——
3,148
3,148
Com
prehensive
income(loss):
Netincome(loss).............................
——
—(15,189)
——
7,869
(7,320)
(7,320)
Unrealiz
edloss
oncash
flow
derivativ
es..........
——
——
—(1,537)
—(1,537)
(1,537)
Realized
gain
oncash
flow
derivativ
es............
——
——
—(351)
—(351)
(351)
Currencytranslationadjustment.................
——
——
—37,579
4,118
41,697
41,697
Totalcomprehensive
income(loss)
...................
$32,489
80

LiveNation,
Inc.Stockh
olders’E
quity
Com
mon
Shares
Issued
Com
mon
Stock
Add
itiona
lPaid-in
Cap
ital
Retained
Deficit
Costof
Shares
Heldin
Treasury
Accum
ulated
Other
Com
prehensive
Income(Loss)
Minority
InterestsCom
prehensive
Income(Loss)
Total
(inthou
sand
s,except
sharedata)
Balan
ceat
Decem
ber31,2007....................
74,893,005
$749
$1,011,407
$(134,194)
$—
$56,410
$61,841
$996,213
Non-cashcompensation..........................
1,303,899
1322,510
—810
——
23,333
Com
mon
shares
issued
foroperationalcontracts.......
2,331,820
2344,232
——
——
44,255
Purchase
ofcommon
shares
................
.......
——
——
(28,710)
——
(28,710)
Saleof
common
shares
....................
.......
——
(14,585)
—20,039
——
5,454
Acquisitio
ns............................
.......
——
——
——
5,547
5,547
Cashdividends.................................
——
——
——
(3,042)
(3,042)
Netadvances
..................................
——
——
——
8,847
8,847
Divestitures
...................................
——
——
——
(648)
(648)
Other
....
.....................................
——
——
——
(617)
(617)
Com
prehensive
income(loss):
Netincome(loss)
...........................
——
—(239,412)
——
1,587
(237,825)
(237,825)
Unrealiz
edloss
oncash
flow
derivativ
es.........
——
——
—(10,900)
—(10,900)
(10,900)
Realized
loss
oncash
flow
derivativ
es...........
——
——
—1,806
—1,806
1,806
Currencytranslationadjustment
........
.......
——
——
—(48,277)
(11,793)
(60,070)
(60,070)
Totalcomprehensive
income(loss)
.................
$(306,989)
Balan
ceat
Decem
ber31,2008....................
78,528,724
$785
$1,063,564
$(373,606)
$(7,861)
$(961)
$61,722
$743,643
SeeNotes
toConsolid
ated
FinancialS
tatements
81

CONSOLIDATED STATEMENTS OF CASH FLOWS
Year Ended December 31,
2008 2007 2006
(in thousands)Cash flows from operating activities
Net loss . . . . . . . . . . . . . . . . . . . . . . . . . . . . . . . . . . . . . . . . . . . . . . . . . . . . . . . . . . . $(237,825) $ (7,320) $ (19,233)Reconciling items:
Depreciation . . . . . . . . . . . . . . . . . . . . . . . . . . . . . . . . . . . . . . . . . . . . . . . . . . . 86,059 85,848 118,343Amortization of intangibles . . . . . . . . . . . . . . . . . . . . . . . . . . . . . . . . . . . . . . . . 62,163 34,980 9,824Goodwill impairment . . . . . . . . . . . . . . . . . . . . . . . . . . . . . . . . . . . . . . . . . . . . 282,939 — —Impairment of other operational assets . . . . . . . . . . . . . . . . . . . . . . . . . . . . . . . 16,035 — —Deferred income tax expense . . . . . . . . . . . . . . . . . . . . . . . . . . . . . . . . . . . . . . 8,132 7,649 10,334Amortization of debt issuance costs . . . . . . . . . . . . . . . . . . . . . . . . . . . . . . . . . 3,616 1,935 736Amortization of debt discount . . . . . . . . . . . . . . . . . . . . . . . . . . . . . . . . . . . . . . 7,995 3,413 —Non-cash compensation expense . . . . . . . . . . . . . . . . . . . . . . . . . . . . . . . . . . . 34,556 29,191 3,432Gain on sale of operating assets . . . . . . . . . . . . . . . . . . . . . . . . . . . . . . . . . . . . (165,448) (51,226) (11,640)Loss (gain) on sale of other investments . . . . . . . . . . . . . . . . . . . . . . . . . . . . . . — (64) 1,659Equity in earnings of nonconsolidated affiliates . . . . . . . . . . . . . . . . . . . . . . . . (720) (4,806) (8,407)Changes in operating assets and liabilities, net of effects of acquisitions anddispositions:Decrease (increase) in accounts receivable . . . . . . . . . . . . . . . . . . . . . . . . 2,130 3,827 (55,504)Increase in prepaid expenses . . . . . . . . . . . . . . . . . . . . . . . . . . . . . . . . . . . (25,603) (51,554) (11,837)Increase in other assets . . . . . . . . . . . . . . . . . . . . . . . . . . . . . . . . . . . . . . . (107,376) (50,951) (1,762)Increase (decrease) in accounts payable, accrued expenses andother liabilities . . . . . . . . . . . . . . . . . . . . . . . . . . . . . . . . . . . . . . . . . . . . (48,473) 30,858 3,902
Increase (decrease) in deferred revenue . . . . . . . . . . . . . . . . . . . . . . . . . . 28,984 18,030 (22,219)
Net cash provided by (used in) operating activities . . . . . . . . . . . (52,836) 49,810 17,628
Cash flows from investing activitiesCollection of notes receivable . . . . . . . . . . . . . . . . . . . . . . . . . . . . . . . . . . . . . . 334 1,910 4,427Advances to notes receivable . . . . . . . . . . . . . . . . . . . . . . . . . . . . . . . . . . . . . . — (879) (2,420)Distributions from nonconsolidated affiliates . . . . . . . . . . . . . . . . . . . . . . . . . . 7,269 16,195 15,922Investments made to nonconsolidated affiliates . . . . . . . . . . . . . . . . . . . . . . . . (250) (5,261) (14,657)Proceeds from disposal of other investments . . . . . . . . . . . . . . . . . . . . . . . . . . — 3,616 1,743Purchases of property, plant and equipment . . . . . . . . . . . . . . . . . . . . . . . . . . . (186,920) (116,849) (65,705)Proceeds from disposal of operating assets, net of cash divested . . . . . . . . . . . 198,665 132,106 36,292Cash paid for acquisitions, net of cash acquired . . . . . . . . . . . . . . . . . . . . . . . . (19,657) (124,285) (351,858)Purchases of intangible assets . . . . . . . . . . . . . . . . . . . . . . . . . . . . . . . . . . . . . . (65,460) (47,568) (796)Decrease (increase) in other—net . . . . . . . . . . . . . . . . . . . . . . . . . . . . . . . . . . . (1,577) (44) 981
Net cash used in investing activities . . . . . . . . . . . . . . . . . . . . . . . . (67,596) (141,059) (376,071)
Cash flows from financing activitiesProceeds from long-term debt, net of debt issuance costs . . . . . . . . . . . . . . . . 420,327 399,781 339,491Payments on long-term debt . . . . . . . . . . . . . . . . . . . . . . . . . . . . . . . . . . . . . . . (369,610) (285,635) (78,253)Contributions from minority interest partners . . . . . . . . . . . . . . . . . . . . . . . . . . 8,847 — 33,188Distributions to minority interest partners . . . . . . . . . . . . . . . . . . . . . . . . . . . . (3,042) (4,424) (1,415)Proceeds from exercises of stock options . . . . . . . . . . . . . . . . . . . . . . . . . . . . . 636 466 —Proceeds from sales of common stock . . . . . . . . . . . . . . . . . . . . . . . . . . . . . . . 5,454 — —Payments for purchases of common stock . . . . . . . . . . . . . . . . . . . . . . . . . . . . (28,628) — (24,717)
Net cash provided by financing activities . . . . . . . . . . . . . . . . . . . 33,984 110,188 268,294Effect of exchange rate changes on cash and cash equivalents . . . . . . . . . . . . . (52,883) 6,172 313
Net increase (decrease) in cash and cash equivalents . . . . . . . . . (139,331) 25,111 (89,836)Cash and cash equivalents at beginning of period . . . . . . . . . . . . . . . . . . . . . . 338,991 313,880 403,716
Cash and cash equivalents at end of period . . . . . . . . . . . . . . . . . . . . . . . . . . . . $ 199,660 $ 338,991 $ 313,880
Supplemental disclosureCash paid during the year for:
Interest . . . . . . . . . . . . . . . . . . . . . . . . . . . . . . . . . . . . . . . . . . . . . . . . . . . . . . . . $ 59,270 $ 57,596 $ 35,406Income taxes . . . . . . . . . . . . . . . . . . . . . . . . . . . . . . . . . . . . . . . . . . . . . . . . . . . $ 23,250 $ 20,683 $ 20,508
See Notes to Consolidated Financial Statements
82

LIVE NATION, INC.
NOTES TO CONSOLIDATED FINANCIAL STATEMENTS
NOTE 1—SUMMARY OF SIGNIFICANT ACCOUNTING POLICIES
Nature of Business
Live Nation, Inc. (the “Company”, or “Live Nation”) was incorporated in Delaware in August 2005 inpreparation for the contribution and transfer by Clear Channel Communications, Inc. (“Clear Channel”) ofsubstantially all of its entertainment assets and liabilities to the Company (the “Separation”). The Companycompleted the Separation in December 2005 and became a publicly traded company on the New York StockExchange trading under the symbol “LYV”.
Prior to the Separation, Live Nation was a wholly-owned subsidiary of Clear Channel. As part of theSeparation, holders of Clear Channel’s common stock received one share of Live Nation common stock for everyeight shares of Clear Channel common stock.
Seasonality
Due to the seasonal nature of shows in outdoor amphitheaters and festivals, which primarily occur Maythrough September, the Company experiences higher revenue during the second and third quarters. Thisseasonality also results in higher balances in cash and cash equivalents, accounts receivable, prepaid expenses,accrued expenses and deferred revenue at different times in the year.
Basis of Presentation and Principles of Consolidation
As a result of the Separation, the Company recognized the par value and additional paid-in capital inconnection with the issuance of its common stock in exchange for the net assets contributed at that time, and theCompany began accumulating retained deficits and currency translation adjustments upon completion of theSeparation. Beginning on December 21, 2005, the Company’s consolidated financial statements include allaccounts of the Company, its majority owned subsidiaries and variable interest entities for which the Company isthe primary beneficiary.
Significant intercompany accounts among the consolidated businesses have been eliminated inconsolidation. Net income (loss) attributable to minority interests is reflected for consolidated affiliates in whichthe Company owns more than 50%, but not all, of the voting common stock and also variable interest entities forwhich the Company is the primary beneficiary. Investments in nonconsolidated affiliates in which the Companyowns 20% to 50% of the voting common stock or otherwise exercises significant influence over operating andfinancial policies of the nonconsolidated affiliate are accounted for using the equity method of accounting.Investments in nonconsolidated affiliates in which the Company owns less than 20% of the voting common stockare accounted for using the cost method of accounting.
During 2006, the Company recorded an adjustment to additional paid-in capital of $10.0 million to adjustthe carrying value of assets distributed at the date of spin-off.
Cash and Cash Equivalents
Cash and cash equivalents include all highly liquid investments with an original maturity of three months orless. The Company’s cash and cash equivalents consist primarily of domestic and foreign bank accounts as wellas money market accounts. To reduce its credit risk, the Company monitors the credit standing of the financialinstitutions that hold the Company’s cash and cash equivalents and also only invests in AAA-rated money marketaccounts.
83

LIVE NATION, INC.
NOTES TO CONSOLIDATED FINANCIAL STATEMENTS—(Continued)
The Company’s available cash and cash equivalents is held in accounts managed by third-party financialinstitutions and consists of cash in its operating accounts and invested cash. The invested cash is invested ininterest-bearing funds managed by third-party financial institutions. These funds generally invest in directobligations of the government of the United States. Cash held in operating accounts in many cases exceeds theFederal Deposit Insurance Corporation insurance limits. While the Company monitors cash and cash equivalentsbalances in its operating accounts on a regular basis and adjusts the balances as appropriate, these balances couldbe impacted if the underlying financial institutions fail. To date, the Company has experienced no loss or lack ofaccess to its cash or cash equivalents; however, the Company can provide no assurances that access to its cashand cash equivalents will not be impacted by adverse conditions in the financial markets.
Allowance for Doubtful Accounts
The Company evaluates the collectibility of its accounts receivable based on a combination of factors.Generally, it records specific reserves to reduce the amounts recorded to what it believes will be collected when acustomer’s account ages beyond typical collection patterns, or the Company becomes aware of a customer’sinability to meet its financial obligations.
The Company believes that the credit risk with respect to trade receivables is limited due to the largenumber and the geographic diversification of its customers.
Prepaid Expenses
The majority of the Company’s prepaid expenses relate to event expenses including show advances anddeposits and other costs directly related to future music events. For advances that are expected to be recoupedover a period of more than 12 months, the long-term portion of the advance is classified as other long-termassets. Such costs are charged to operations upon completion of the related events.
Purchase Accounting
The Company accounts for its business acquisitions under the purchase method of accounting. The total costof acquisitions is allocated to the underlying identifiable net assets based on their respective estimated fairvalues. The excess of the purchase price over the estimated fair values of the net assets acquired is recorded asgoodwill. Determining the fair value of assets acquired and liabilities assumed requires management’s judgmentand often involves the use of significant estimates and assumptions, including assumptions with respect to futurecash inflows and outflows, discount rates and asset lives among other items. In addition, reserves have beenestablished on the Company’s balance sheet related to acquired liabilities and qualifying restructuring costs andcontingencies based on assumptions made at the time of acquisition. The Company evaluates these reserves on aregular basis to determine the adequacies of the amounts.
Property, Plant and Equipment
Property, plant and equipment are stated at cost or fair value at date of acquisition. Depreciation, which isrecorded for both owned assets and assets under capital leases, is computed using the straight-line method at ratesthat, in the opinion of management, are adequate to allocate the cost of such assets over their estimated usefullives, which are as follows:
Buildings and improvements — 10 to 50 yearsFurniture and other equipment — 3 to 10 years
84

LIVE NATION, INC.
NOTES TO CONSOLIDATED FINANCIAL STATEMENTS—(Continued)
Leasehold improvements are depreciated over the shorter of the economic life or associated lease termassuming renewal periods, if appropriate. Expenditures for maintenance and repairs are charged to operations asincurred, whereas expenditures for renewal and improvements are capitalized.
The Company tests for possible impairment of property, plant, and equipment whenever events orcircumstances change, such as a significant reduction in operating cash flow or a dramatic change in the mannerthat the asset is intended to be used which may indicate that the carrying amount of the asset may not berecoverable. If indicators exist, the Company compares the estimated undiscounted future cash flows related tothe asset to the carrying value of the asset. If the carrying value is greater than the estimated undiscounted futurecash flow amount, an impairment charge is recorded based on the difference between the discounted future cashflow estimates and the carrying value. Any such impairment charge is recorded in depreciation and amortizationexpense in the statement of operations. The impairment loss calculations require management to apply judgmentin estimating future cash flows and the discount rates that reflect the risk inherent in future cash flows.
Intangible Assets
The Company classifies intangible assets as definite-lived, indefinite-lived or goodwill. Definite-livedintangibles primarily include venue management and leasehold agreements, artist relationships, trademarks andnaming rights, all of which are amortized either pro-rata over the respective lives of the agreements, typicallythree to twenty years, or on a basis more representative of the time pattern over which the benefit is derived. TheCompany periodically reviews the appropriateness of the amortization periods related to its definite-lived assets.These assets are stated at cost or fair value. Indefinite-lived intangibles primarily include intangible value relatedto trade names. The excess cost over fair value of net assets acquired is classified as goodwill. The goodwill andindefinite-lived intangibles are not subject to amortization, but are tested for impairment at least annually.
The Company tests for possible impairment of definite-lived intangible assets whenever events orcircumstances change, such as a significant reduction in operating cash flow or a dramatic change in the mannerthat the asset is intended to be used which may indicate that the carrying amount of the asset may not berecoverable. If indicators exist, the Company compares the estimated undiscounted future cash flows related tothe asset to the carrying value of the asset. If the carrying value is greater than the estimated undiscounted futurecash flow amount, an impairment charge is recorded based on the difference between the discounted future cashflow estimates and the carrying value. Any such impairment charge is recorded in depreciation and amortizationexpense in the statement of operations. The impairment loss calculations require management to apply judgmentin estimating future cash flows and the discount rates that reflect the risk inherent in future cash flows.
At least annually, the Company performs its impairment test for each reporting unit’s goodwill using atwo-step approach. The first step, used to screen for potential impairment, compares the fair value of thereporting unit with its carrying amount, including goodwill. If the fair value of a reporting unit exceeds the bookvalue, goodwill is not considered impaired. If the book value exceeds the fair value, the second step of theprocess is performed to measure the amount of impairment. Certain assumptions are used in determining the fairvalue in both step one and step two, including assumptions about market multiples, control premiums, projectedcash flows, discount rates, terminal values and attrition rates. The Company also tests goodwill for impairment inother periods if an event occurs or circumstances change that would more likely than not reduce the fair value ofa reporting unit below its carrying amount.
The Company tests indefinite-lived intangible assets annually for impairment by comparing the fair value ofthe asset to its carrying value. If the carrying value is greater than the fair value of the asset, an impairmentcharge is recorded based on the difference between the fair value of the asset and the carrying value.
85
LIVE NATION, INC.
NOTES TO CONSOLIDATED FINANCIAL STATEMENTS—(Continued)
Nonconsolidated Affiliates
In general, investments in which the Company owns 20% to 50% of the common stock or otherwiseexercises significant influence over the affiliate are accounted for under the equity method. The Company doesnot recognize gains or losses upon the issuance of securities by any of its equity method investees. The Companyreviews the value of equity method investments and records impairment charges in the statement of operationsfor any decline in value that is determined to be other-than-temporary.
Operational Assets
As part of the Company’s operations, it will invest in certain assets or rights to use assets. The Companyreviews the value of these assets and records impairment charges in direct operating expenses in the statement ofoperations for any decline in value that is determined to be other-than-temporary.
Financial Instruments
Due to their short maturity, the carrying amounts of cash and cash equivalents, accounts receivable,accounts payable and accrued expenses approximated their fair values at December 31, 2008 and 2007. With theexception of the Company’s 2.875% convertible senior notes, none of the Company’s other debt is publicly-traded and because the majority of the interest on this debt accrues at a variable rate, the carrying amounts oflong-term debt typically approximate their fair value, however due to recent market volatility, a fair value cannotbe determined. The 2.875% convertible senior notes can be traded, but not on a public market, and therefore theirfair value cannot be approximated at December 31, 2008 and 2007.
The Company has fixed rate debt with a minority interest partner of $37.8 million and $26.6 million atDecember 31, 2008 and 2007, respectively. The Company is unable to determine the fair value.
Income Taxes
The Company’s provision for income taxes has been computed on the basis that the Company filesconsolidated income tax returns with its subsidiaries. The Company accounts for income taxes using the liabilitymethod in accordance with Financial Accounting Standards Board (“FASB”) Statement of Financial AccountingStandards No. 109, Accounting for Income Taxes (“Statement 109”). Under this method, deferred tax assets andliabilities are determined based on differences between financial reporting bases and tax bases of assets andliabilities and are measured using the enacted tax rates expected to apply to taxable income in the periods inwhich the deferred tax asset or liability is expected to be realized or settled. Deferred tax assets are reduced byvaluation allowances if the Company believes it is more likely than not that some portion of or the entire assetwill not be realized. As all earnings from the Company’s foreign operations are permanently reinvested and notdistributed, the Company’s income tax provision does not include additional United States (“U.S.”) taxes onforeign operations. It is not practical to determine the amount of federal income taxes, if any, that might becomedue in the event that the earnings were distributed.
The Company adopted the provisions of FASB Interpretation No. 48, Accounting for Uncertainty in IncomeTaxes—an interpretation of FASB Statement No. 109 (“FIN 48”) on January 1, 2007. FIN 48 prescribes arecognition threshold and a measurement attribute for the financial statement recognition and measurement of taxpositions taken or expected to be taken in a tax return. For those benefits to be recognized, a tax position must bemore likely than not to be sustained upon examination by taxing authorities. The amount recognized is measuredas the largest amount of benefit that is greater than 50% likely of being realized upon ultimate settlement.
86

LIVE NATION, INC.
NOTES TO CONSOLIDATED FINANCIAL STATEMENTS—(Continued)
The Company has established a policy of including interest related to tax loss contingencies in income taxexpense (benefit).
The Company’s provision for income taxes is further disclosed in Note 13.
Revenue Recognition
Revenue from the promotion and production of an event is recognized after the performance occurs uponsettlement of the event. Revenue related to larger global tours is recognized after the performance occurs;however, any profits related to these tours, primarily related to music tour production and tour managementservices, is recognized after minimum revenue guarantee thresholds, if any, have been achieved. Revenuecollected in advance of the event is recorded as deferred revenue until the event occurs. Revenue collected fromsponsorships and other revenue, which is not related to any single event, is classified as deferred revenue andgenerally amortized over the operating season or the term of the contract. Membership revenue is recognized ona straight-line basis over the term of the membership.
Revenue from the Company’s ticketing operations primarily consists of convenience and order processingfees charged at the time a ticket for an event is sold and is recorded on a net basis (net of the face value of theticket). For tickets sold for events at the Company’s owned and/or operated venues, this revenue is recognizedafter the performance occurs upon settlement of the event. Revenue for these ticket fees collected in advance ofthe event is recorded as deferred revenue until the event occurs. These fees will be shared between theCompany’s Ticketing segment and the North American Music segment. For tickets sold for events for third-partyvenues, this revenue is recognized at the time of the sale and is recorded by the Company’s Ticketing segment.
For multiple element contracts, the Company allocates consideration to the multiple elements based on therelative fair values of each separate element which are determined based on prices charged for such items whensold on a stand-alone basis. In cases where there is no objective and reliable evidence of the fair value of certainelement(s) in an arrangement, the Company accounts for the transaction as a single unit of accounting per therequirements of Emerging Issues Task Force (“EITF”) 00-21, Revenue Arrangements with Multiple Deliverables.
The Company accounts for taxes that are externally imposed on revenue producing transactions on a netbasis, as a reduction to revenue.
Barter Transactions
Barter transactions represent the exchange of display space or tickets for advertising, merchandise orservices. These transactions are generally recorded at the lower of the fair value of the display space or ticketsrelinquished or the fair value of the advertising, merchandise or services received. Revenue is recognized onbarter transactions when the advertisements are displayed or the event occurs for which the tickets areexchanged. Expenses are recorded when the advertising, merchandise or service is received or when the eventoccurs. Barter revenue for the years ended December 31, 2008, 2007 and 2006, was approximately $42.5 million,$34.7 million and $38.1 million, respectively, and is included in total revenue. Barter expense for the years endedDecember 31, 2008, 2007 and 2006, was approximately $42.7 million, $34.5 million and $37.7 million,respectively, and is included in direct operating expenses and selling, general and administrative expenses.
Foreign Currency
Results of operations for foreign subsidiaries and foreign equity investees are translated into U.S. dollarsusing the average exchange rates during the year. The assets and liabilities of those subsidiaries and investees are
87

LIVE NATION, INC.
NOTES TO CONSOLIDATED FINANCIAL STATEMENTS—(Continued)
translated into U.S. dollars using the exchange rates at the balance sheet date. The Company does not currentlyhave operations in highly inflationary countries. The related translation adjustments are recorded in a separatecomponent of stockholders’ equity in accumulated other comprehensive income (loss). Foreign currencytransaction gains and losses are included in operations.
Advertising Expense
The Company records advertising expense as it is incurred on an annual basis. Advertising expenses of$186.5 million, $191.6 million and $163.2 million were recorded during the years ended December 31, 2008,2007 and 2006, respectively.
Direct Operating Expenses
Direct operating expenses include artist fees, show related marketing and advertising expenses and salariesand wages related to seasonal employees at the Company’s venues along with other costs.
Selling, General and Administrative Expenses
Selling, general and administrative expenses include salaries and wages related to full-time employees andfixed rent along with other costs.
Depreciation and Amortization
The Company’s depreciation and amortization expense is presented as a separate line item in theconsolidated statements of operations. There is no depreciation or amortization expense included in directoperating expenses or selling, general and administrative expenses.
Non-Cash Compensation
The Company follows the fair value recognition provisions of FASB Statement of Financial AccountingStandards No. 123 (revised 2004), Share-Based Payment (“Statement 123(R)”). Under the fair value recognitionprovisions of Statement 123(R), stock-based compensation cost is measured at the grant date based on the fairvalue of the award and is amortized to selling, general and administrative expenses and corporate expenses on astraight-line basis over the awards’ vesting period.
Use of Estimates
The preparation of financial statements in conformity with U.S. generally accepted accounting principlesrequires management to make estimates, judgments, and assumptions that affect the amounts reported in thefinancial statements and accompanying notes including, but not limited to, legal, tax and insurance accruals. TheCompany bases its estimates on historical experience and on various other assumptions that are believed to bereasonable under the circumstances. Actual results could differ from those estimates.
Reclassifications
Certain reclassifications have been made to the 2007 and 2006 consolidated financial statements to conformto the 2008 presentation to report discontinued operations. Refer to Note 5.
88

LIVE NATION, INC.
NOTES TO CONSOLIDATED FINANCIAL STATEMENTS—(Continued)
Recent Accounting Pronouncements
Recently Adopted Pronouncements
In September 2006, the FASB issued Statement of Financial Accounting Standards No. 157, Fair ValueMeasurements (“Statement 157”). Statement 157 provides guidance for using fair value to measure assets andliabilities and also responds to investors’ requests for expanded information about the extent to which companiesmeasure assets and liabilities at fair value, the information used to measure fair value, and the effect of fair valuemeasurements on earnings. Statement 157 applies whenever other standards require (or permit) assets orliabilities to be measured at fair value. Statement 157 does not expand the use of fair value in any newcircumstances. The Company adopted Statement 157 on January 1, 2008 for all financial assets and liabilitiesrecognized or disclosed at fair value in its consolidated financial statements on a recurring basis (at leastannually). Refer to Note 10. In February 2008, the FASB issued FASB Staff Position No. 157-2, Effective Dateof FASB Statement No. 157, which delays the effective date for nonfinancial assets and nonfinancial liabilities,except for items that are recognized or disclosed at fair value in the financial statements on a recurring basis (atleast annually). The effective date for these items was delayed to fiscal years beginning after November 15, 2008.The Company is currently assessing the impact on its nonfinancial assets and liabilities that the adoption ofStatement 157 will have on its financial position and results of operations.
In February 2007, the FASB issued Statement of Financial Accounting Standards No. 159, The Fair ValueOption for Financial Assets and Financial Liabilities (“Statement 159”). Statement 159 allows entities tovoluntarily choose, at specified election dates, to measure certain financial assets and financial liabilities (as wellas certain nonfinancial instruments that are similar to financial instruments) at fair value (the “fair value option”).The election is made on an instrument-by-instrument basis and is irrevocable. If the fair value option is electedfor an instrument, Statement 159 specifies that all subsequent changes in fair value for that instrument will bereported in earnings. The Company adopted Statement 159 on January 1, 2008 and determined that it would notelect to measure any of its eligible financial instruments at fair value under the provisions of this standard.
Recently Issued Pronouncements
In December 2007, the FASB issued Statement of Financial Accounting Standards No. 141(R), BusinessCombinations (“Statement 141(R)”). Statement 141(R) establishes revised principles and requirements for therecognition and measurement of assets and liabilities in a business combination. Statement 141(R) requires(i) recognition of 100% of the fair values of acquired assets, including goodwill, and assumed liabilities uponobtaining control, (ii) contingent consideration to be recorded at fair value at acquisition date, (iii) transactioncosts to be expensed as incurred, (iv) pre-acquisition contingencies to be accounted for at acquisition date at fairvalue and (v) costs of a plan to exit an activity or terminate or relocate employees to be accounted for as post-combination costs. Statement 141(R) is effective for fiscal years beginning after December 15, 2008. TheCompany will adopt Statement 141(R) on January 1, 2009 and apply the requirements of Statement 141(R) forbusiness combinations that occur after the date of adoption.
In March 2008, the FASB issued Statement of Financial Accounting Standards No. 161, Disclosures aboutDerivative Instruments and Hedging Activities—an amendment of FASB Statement No. 133 (“Statement 161”).Statement 161 requires enhanced disclosures about (i) how and why an entity uses derivative instruments,(ii) how derivative instruments and related hedged items are accounted for under FASB Statement No. 133,Accounting for Derivative Instruments and Hedging Activities (“Statement 133”) and its related interpretationsand (iii) how derivative instruments and related hedged items affect an entity’s financial position, financialperformance and cash flows. Statement 161 is effective for fiscal years and interim periods beginning afterNovember 15, 2008. The Company will adopt Statement 161 in the first quarter of 2009.
89

LIVE NATION, INC.
NOTES TO CONSOLIDATED FINANCIAL STATEMENTS—(Continued)
Pronouncements Retrospectively Applied
In December 2007, the FASB issued Statement of Financial Accounting Standards No. 160, NoncontrollingInterests in Consolidated Financial Statements—an amendment of ARB No. 51 (“Statement 160”). Statement 160clarifies the classification of noncontrolling interests, also known as minority interests, in consolidatedstatements of financial position and the accounting for and reporting of transactions between the reporting entityand holders of such noncontrolling interests. Statement 160 is effective for fiscal years beginning afterDecember 15, 2008. The Company adopted Statement 160 on January 1, 2009. The provisions of Statement 160have been applied prospectively with the exception of reclassifying noncontrolling interests to equity in theCompany’s consolidated balance sheets and recasting consolidated net income (loss) to include net income (loss)attributable to both the controlling and noncontrolling interests, which were required to be adoptedretrospectively.
In May 2008, the FASB issued FASB Staff Position (“FSP”) APB 14-1, Accounting for Convertible DebtInstruments That May Be Settled in Cash upon Conversion (Including Partial Cash Settlement) (“FSP APB14-1”). FSP APB 14-1 will change the accounting for certain convertible debt instruments, including theCompany’s 2.875% convertible senior notes. Under the new rules for convertible debt instruments that may besettled entirely or partially in cash upon conversion, an entity would separately account for the liability andequity components of the instrument in a manner that reflects the issuer’s economic interest cost. The effect ofthe new rules for the Company’s notes is that the equity component is included in the additional paid-in capitalsection of stockholders’ equity on the Company’s balance sheet and the value of the equity component is treatedas an original issue discount for purposes of accounting for the debt component of the notes. Higher interestexpense results by recognizing the accretion of the discounted carrying value of the notes to their face amount asinterest expense over the expected term of the notes using an effective interest rate method of amortization. FSPAPB 14-1 is effective for fiscal years and interim periods beginning after December 15, 2008. The Companyadopted the provisions of FSP APB 14-1 on January 1, 2009 and applied it retrospectively to all periodspresented. In applying FSP APB 14-1, $73.0 million of the carrying value of the convertible notes wasreclassified to equity as of the July 2007 issuance date. This amount represents the equity component of theproceeds from the notes, calculated assuming a 9.4% non-convertible borrowing rate. The discount will beamortized to interest expense over a seven-year term which is when the related put and call areexercisable. Accordingly, $3.3 million of additional non-cash interest expense was reported in 2007 and $7.6million of additional non-cash interest expense was reported in 2008. Additionally, the Company expects that theadoption of FSP APB 14-1 will result in additional non-cash interest expense of approximately $9.5 million,$10.4 million and $11.4 million for 2009, 2010 and 2011, respectively. Refer to Note 7.
In June 2008, the FASB issued FSP EITF 03-6-1, Determining Whether Instruments Granted in Share-Based Payment Transactions Are Participating Securities (“FSP EITF 03-6-1”). FSP EITF 03-6-1 was issued toclarify that unvested share-based payment awards with a right to receive nonforfeitable dividends areparticipating securities and provide guidance on how to allocate earnings to participating securities and computebasic earnings per share using the two-class method. FSP EITF 03-6-1 is effective for fiscal years and interimperiods beginning after December 15, 2008. The Company adopted FSP EITF 03-6-1 on January 1, 2009 andapplied it retrospectively to all periods presented. The adoption of FSP EITF 03-6-1 did not have a materialimpact on the Company’s earnings per share. Refer to Note 14.
NOTE 2—LONG-LIVED ASSETS
Property, Plant and Equipment
The Company tests for possible impairment of property, plant and equipment whenever events orcircumstances change, such as a significant reduction in operating cash flow or a dramatic change in the mannerthat the asset is intended to be used indicate that the carrying amount of the asset may not be recoverable.
90

LIVE NATION, INC.
NOTES TO CONSOLIDATED FINANCIAL STATEMENTS—(Continued)
During the fourth quarter of 2008 and 2007 and the third and fourth quarters of 2006, the Companyreviewed the carrying value of certain property, plant and equipment assets that management determined would,more likely than not, be disposed of before the end of their previously estimated useful lives or had an indicatorthat future operating cash flows may not support their carrying value. It was determined that several of thoseassets were impaired since the estimated undiscounted cash flows associated with those assets were less thantheir carrying value. These cash flows were calculated using estimated sale values of the land for the assets beingevaluated for disposal, that were developed based on an approximate value related to the best use of the land orappraised values or a sales offer, in addition to operating cash flows, all of which were used to approximate fairvalue. For the year ended December 31, 2006, the Company recorded impairment charges primarily related toseveral amphitheaters to be disposed of or determined to be impaired and a theater project that is no longer beingpursued for which impairment charges of $42.5 million and $9.1 million were recorded in the Company’s NorthAmerican Music segment and other operations, respectively. For the year ended December 31, 2007, animpairment charge of $3.8 million was recorded in the Company’s North American Music segment related to anamphitheater that was determined to be impaired and an amphitheater that is no longer being used. For the yearended December 31, 2008, an impairment charge of $7.3 million was recorded in the Company’s NorthAmerican Music segment related to a club and two amphitheaters that were determined to be impaired. Theimpairment charges for all three years were recorded as a component of depreciation and amortization.
During 2008, the Company recorded asset retirement obligations of $2.6 million primarily related toobligations for meeting regulatory requirements for certain venues in the United Kingdom obtained in theacquisition of Academy Music Holdings Limited Group (“AMG”).
During 2007, the Company released $3.4 million of asset retirement obligations, originally recorded inconnection with the Mean Fiddler Music Group, PLC (“Mean Fiddler”) acquisition, due to the sale in 2007 of aportion of these venues. In addition, the Company recorded $1.9 million in additional asset retirement obligationsrelated to various properties in the United Kingdom.
The following table presents the activity related to the Company’s asset retirement obligations as ofDecember 31, 2008 and 2007:
2008 2007
(in thousands)
Balance as of January 1 . . . . . . . . . . . . . . . . . . . . . . . . . . . . . . . . . . . . . . . . . . . . . . . . . . . . . . . $ 5,032 $ 8,835Additions . . . . . . . . . . . . . . . . . . . . . . . . . . . . . . . . . . . . . . . . . . . . . . . . . . . . . . . . . . . . . . 2,570 1,920Accretion of liability . . . . . . . . . . . . . . . . . . . . . . . . . . . . . . . . . . . . . . . . . . . . . . . . . . . . . . 217 144Liabilities settled . . . . . . . . . . . . . . . . . . . . . . . . . . . . . . . . . . . . . . . . . . . . . . . . . . . . . . . . (1,367) (6,044)Foreign currency . . . . . . . . . . . . . . . . . . . . . . . . . . . . . . . . . . . . . . . . . . . . . . . . . . . . . . . . . (1,384) 177
Balance as of December 31 . . . . . . . . . . . . . . . . . . . . . . . . . . . . . . . . . . . . . . . . . . . . . . . . . . . . $ 5,068 $ 5,032
91

LIVE NATION, INC.
NOTES TO CONSOLIDATED FINANCIAL STATEMENTS—(Continued)
Definite-lived Intangibles
The Company has definite-lived intangible assets which are amortized over the shorter of either therespective lives of the agreements or the period of time the assets are expected to contribute to the Company’sfuture cash flows. The amortization is recognized on either a straight-line basis or units of production basis. Thefollowing table presents the gross carrying amount and accumulated amortization of definite-lived intangibleassets as of December 31, 2008 and 2007:
December 31, 2008 December 31, 2007
Gross CarryingAmount
AccumulatedAmortization Net
Gross CarryingAmount
AccumulatedAmortization Net
(in thousands)
Revenue-generating contracts . . . . $279,565 $(21,253) $258,312 $121,766 $(10,967) $110,799Non-compete agreements . . . . . . . 130,157 (30,351) 99,806 176,431 (17,995) 158,436Venue management andleaseholds . . . . . . . . . . . . . . . . . 102,544 (16,020) 86,524 82,693 (8,848) 73,845
Trademarks and naming rights . . . 22,731 (6,616) 16,115 14,390 (4,042) 10,348Artist relationships . . . . . . . . . . . . 19,276 (1,075) 18,201 — — —Other . . . . . . . . . . . . . . . . . . . . . . . 6,546 (770) 5,776 4,286 (761) 3,525
Total . . . . . . . . . . . . . . . . . . . . . . . $560,819 $(76,085) $484,734 $399,566 $(42,613) $356,953
During the year ended December 31, 2008, the Company recorded additional definite-lived intangible assetstotaling $123.0 million due primarily to purchase accounting adjustments for venue management and leaseholdinterests, naming rights, artist relationships and revenue-generating contracts resulting from the Company’s 2007acquisitions of AMG and Signatures SNI, Inc. (“Signatures”), the acquisition in the first quarter of 2008 of theoperating company that manages and holds the lease for the Heineken Music Hall located in Amsterdam, and thesecond quarter acquisitions of the remaining interests the Company did not already own in Lugerinc. AB andMoondog Entertainment AB (“Luger and Moondog”), both music-related companies in Sweden, and a 78.3%interest in DFC Holdings Limited (“DF Concerts”), a promoter in Scotland, through a joint venture with GaietyInvestments. The Company owns 50.1% of the joint venture with Gaiety Investments. These additional definite-lived intangible assets have a weighted average life of approximately eleven years in total and approximatelyeleven years for revenue generating contracts, nine years for non-compete agreements, eight years for venuemanagement and leaseholds, eleven years for trademarks and naming rights, fourteen years for artist relationshipsand four years for other definite-lived intangible assets. Additionally, the Company recorded purchaseaccounting adjustments for the Company’s 2007 acquisition of the remaining interest in Concert ProductionsInternational (“CPI”) resulting in a reduction of $53.3 million in artist relationship intangible assets due to areclassification to goodwill. The Company also recorded an adjustment of $4.8 million to reduce definite-livedintangible assets in connection with the sale of the Events business.
In addition, the Company recorded other definite-lived intangible assets of $136.0 million related to certainartist rights agreements and rights acquired in connection with a 51% interest in Live Nation—HaymonVentures, LLC. Additionally, the impact of foreign exchange rates on definite-lived intangible assets resulted in adecrease of $26.2 million.
For the year ended December 31, 2008, the Company recorded a $7.6 million impairment of definite-livedintangible assets in its North American Music segment related to a naming right intangible that was determinedto be impaired.
92

LIVE NATION, INC.
NOTES TO CONSOLIDATED FINANCIAL STATEMENTS—(Continued)
For the year ended December 31, 2007, the Company recorded definite-lived intangible assets totaling$240.1 million due to purchase accounting adjustments for venue management and leasehold interests,revenue-generating contracts and artist relationships primarily resulting from the Company’s 2006 acquisition ofHOB Entertainment, Inc. (“HOB”) and the Company’s 2007 acquisitions of the remaining interest in CPI andHouse of Blues Concerts Canada (“HOB Canada”). These additional definite-lived intangible assets have aweighted average life of approximately ten years in total and approximately ten years for revenue generatingcontracts, nine years for non-compete agreements, twelve years for venue management and leaseholds, four yearsfor trademarks and naming rights and five years for other definite-lived intangible assets.
In addition in 2007, the Company recorded other definite-lived intangible assets of $73.6 million related torevenue-generating contracts not acquired through acquisitions.
Total amortization expense from definite-lived intangible assets for the years ended December 31, 2008,2007 and 2006 was $62.0 million, $34.9 million and $9.8 million, respectively. For the year ended December 31,2008, the Company recorded an impairment related to definite-lived intangibles of $5.1 million which is includedin depreciation and amortization in the Company’s North American Music segment.
The following table presents the Company’s estimate of amortization expense for each of the fivesucceeding fiscal years for definite-lived intangible assets that exist at December 31, 2008:
(in thousands)
2009 . . . . . . . . . . . . . . . . . . . . . . . . . . . . . . . . . . . . . . . . . . . . . . . . . . . . . . . . . . . . . . . . . . $59,4402010 . . . . . . . . . . . . . . . . . . . . . . . . . . . . . . . . . . . . . . . . . . . . . . . . . . . . . . . . . . . . . . . . . . 54,8592011 . . . . . . . . . . . . . . . . . . . . . . . . . . . . . . . . . . . . . . . . . . . . . . . . . . . . . . . . . . . . . . . . . . 54,7292012 . . . . . . . . . . . . . . . . . . . . . . . . . . . . . . . . . . . . . . . . . . . . . . . . . . . . . . . . . . . . . . . . . . 44,0722013 . . . . . . . . . . . . . . . . . . . . . . . . . . . . . . . . . . . . . . . . . . . . . . . . . . . . . . . . . . . . . . . . . . 62,432
As acquisitions and dispositions occur in the future and the valuation of intangible assets for recentacquisitions is completed, amortization expense may vary.
Indefinite-lived Intangibles
The Company has indefinite-lived intangible assets which consist primarily of the intangible value related totrade names which are reviewed for impairment at least annually. These indefinite-lived intangible assets had acarrying value of $29.7 million and $26.0 million as of December 31, 2008 and 2007, respectively. The increasein indefinite-lived intangible assets during 2008 was due primarily to the intangible value related to trade namesresulting from purchase accounting adjustments for the Company’s 2007 acquisition of AMG.
Goodwill
The Company reorganized its segments beginning in 2007 in accordance with the change in themanagement of the business units and therefore changed its reportable operating segments to North AmericanMusic, International Music, Artist Nation and Ticketing. In 2009, the Company also reorganized its businessunits and the way in which these businesses are assessed and therefore changed its reportable segments to NorthAmerican Music, International Music and Ticketing. The Company’s business formerly reported as Artist Nationis now allocated to the North American Music and International Music segments. Prior to 2008, the Companyalso reported a Global Theater segment which has been eliminated after the divestiture of substantially all of theCompany’s North American theatrical business in January 2008. The Company’s United Kingdom theatricalvenue operation business, previously included in Global Theater, is now reported in other operations. As a result,
93

LIVE NATION, INC.
NOTES TO CONSOLIDATED FINANCIAL STATEMENTS—(Continued)
goodwill has been reallocated to the new reporting business units that make up these segments utilizing a fairvalue approach. When reallocating goodwill as part of a reorganization, the Company allocates goodwill basedon the relative fair values similar to that used when a portion of a reporting unit is being disposed of. TheCompany believes a common method used to determine the fair value of a business in its industry is a multiple ofprojected earnings before interest, taxes, depreciation and amortization. Beginning with the last year-end prior tothe separation date, or December 31, 2004, the Company reallocated the goodwill assigned to it by Clear Channelat Separation using each reporting unit’s relative fair value as calculated by the respective reporting unit’spercentage of total Company projected earnings before interest, taxes, depreciation and amortization, excludingCorporate and reporting units that had a fair value less than zero. Goodwill related to specific acquisitionssubsequent to December 31, 2004 was attributed to the respective new reporting units directly (specificallocation). All of the goodwill allocated to the Artist Nation reporting unit, which was fully impaired in 2008,has been allocated to the North American Music reporting unit. Please see the table below for detail of theallocations from the old reportable segments to the new reportable segments.
In accordance with FASB Statement of Financial Accounting Standards No. 142, Goodwill and OtherIntangible Assets (“Statement 142”), the Company tests goodwill for impairment annually as of October 1, usinga two-step process. The first step, used to screen for potential impairment, compares the fair value of thereporting unit with its carrying amount, including goodwill. The second step, used to measure the amount of anypotential impairment, compares the implied fair value of the reporting unit with the carrying amount of goodwill.The Company also tests goodwill for impairment in other periods if an event occurs or circumstances change thatwould more likely than not reduce the fair value of a reporting unit below its carrying amount.
As a result of the negotiations related to the sale of it non-core events business at September 30, 2008,discussed further below the table, the Company recorded a $13.0 million impairment of goodwill in its Otherreporting unit during the third quarter of 2008. This impairment is reflected in discontinued operations.
During the fourth quarter of 2008, while the Company was performing its annual impairment test as ofOctober 1, the Company experienced a significant decline in its market capitalization. Since a favorable resultfrom an October 1 test would not have prevented a second impairment test at December 31, 2008, a singleimpairment test was completed as of December 31, 2008. Based upon the results of this impairment test, theCompany recorded an impairment charge of $269.9 million related to its North American Music reporting unit,which represented all of the remaining goodwill previously recorded for this reporting unit.
The process of evaluating goodwill for impairment involves the determination of the fair value of theCompany’s reporting units. Inherent in such fair value determinations are certain judgments and estimatesrelating to future cash flows, including the Company’s interpretation of current economic indicators and marketvaluations, and assumptions about the Company’s strategic plans with regard to its operations. Due to theuncertainties associated with such estimates, actual results could differ from such estimates. In performing thefirst step of its impairment analysis, the Company developed a consolidated fair value using a market multiplemethodology, which was then allocated to the individual reporting units based upon the discounted cash flowsdeveloped for each reporting unit. In performing the second step of its impairment analysis for the reporting unitsthat failed the step one test, the Company developed fair values using the discounted cash flows methodology.
The market multiple methodology establishes fair value by comparing the Company to other publicly-tradedcompanies that are similar to it from an operational and economic standpoint. The market multiple methodologycompares the Company to the similar companies on the basis of risk characteristics in order to determine its riskprofile relative to the comparable companies as a group. This analysis generally focuses on quantitativeconsiderations, which include financial performance and other quantifiable data, and qualitative considerations,which include any factors which are expected to impact future financial performance. The most significant
94

LIVE NATION, INC.
NOTES TO CONSOLIDATED FINANCIAL STATEMENTS—(Continued)
assumptions affecting the market multiple methodology are the market multiples and control premium. Themarket multiples the Company uses are: (a) business enterprise value to earnings before interest, taxes anddepreciation and amortization and (b) business enterprise value to revenue. A control premium represents thevalue an investor would pay above minority interest transaction prices in order to obtain a controlling interest inthe respective company.
The discounted cash flow methodology establishes fair value by estimating the present value of theprojected future cash flows to be generated from the reporting unit. The discount rate applied to the projectedfuture cash flows to arrive at the present value is intended to reflect all risks of ownership and the associated risksof realizing the stream of projected future cash flows. The discounted cash flow methodology uses theCompany’s projections of financial performance. The most significant assumptions used in the discounted cashflow methodology are the discount rate, the terminal value or attrition rate and expected future revenues andoperating margins, which vary among reporting units.
For each reportable operating segment, the reporting units are determined to be either the operating segmentor the components thereof in accordance with Statement 142. For 2008, the Company’s reporting units weredetermined to be its operating segments. The following table presents the changes in the carrying amount ofgoodwill in each of the Company’s reportable segments for the years ended December 31, 2008 and 2007:
2006 Segments 2007/2008 Segments
EventsVenues andSponsorship
DigitalDistribution
NorthAmericanMusic
InternationalMusic
ArtistNation Ticketing Other(2) Total
(in thousands)Balance as of December 31,2006 . . . . . . . . . . . . . . . . . . $ 82,151 $ 324,950 $ 16,068 $ — $ — $ — $— $ — $ 423,169
Recast balances (1)Fair value approach . . . . (5,679) (13,317) (4,972) 8,288 8,400 1,904 — 5,376 —Specific allocation . . . . . (76,472) (311,633) (11,096) 281,863 104,256 11,100 — 1,982 —Artist Nationallocation . . . . . . . . . . 13,004 — (13,004) — — —
Current year changesAcquisitions—currentyear . . . . . . . . . . . . . . 90,908 66,463 — — — 157,371
Acquisitions—prioryear . . . . . . . . . . . . . . (113,420) 2,688 — — 1,175 (109,557)
Dispositions . . . . . . . . . . — (7,441) — — — (7,441)Foreign currency . . . . . . 5,355 4,413 — — 2,825 12,593Adjustments . . . . . . . . . (1,721) (1,966) — — (906) (4,593)
Balance as of December 31,2007 . . . . . . . . . . . . . . . . . . $ — $ — $ — 284,277 176,813 — — 10,452 471,542
Current year changesAcquisitions—currentyear . . . . . . . . . . . . . . 1,527 43,557 — — — 45,084
Acquisitions—prioryear . . . . . . . . . . . . . . 10,297 1,277 — — 13,037 24,611
Dispositions . . . . . . . . . . — — — — (6,717) (6,717)Impairment . . . . . . . . . . (269,902) — — — (13,037) (282,939)Foreign currency . . . . . . (11,290) (8,907) — — — (20,197)Adjustments . . . . . . . . . (14,909) (10,379) — — (800) (26,088)
Balance as of December 31,2008 . . . . . . . . . . . . . . . . . . $ — $ — $ — $ — $202,361 $ — $— $ 2,935 $ 205,296
(1) The beginning balance for each segment has been recast to record goodwill related to a division that was previously not included in theallocation. The total consolidated amount remains unchanged.
(2) The beginning balance includes $5.0 million which was previously reported in the Global Theater segment. That segment has beeneliminated due to the divestiture of the North American theatrical business.
95

LIVE NATION, INC.
NOTES TO CONSOLIDATED FINANCIAL STATEMENTS—(Continued)
Included in the current year acquisition amount above for 2008 are additions to goodwill of $25.3 million,$12.8 million and $3.3 million related to the Company’s acquisitions of a 78.3% interest in DF Concerts, theoperating company that manages and holds the lease for the Heineken Music Hall and the remaining interests theCompany did not already own in Luger and Moondog, respectively, as well as $3.7 million for other smalleracquisitions.
Included in the prior year acquisition amount above for 2008 is a reduction of goodwill primarily related toadjustments in the purchase accounting for the Company’s 2007 acquisitions of Signatures and AMG. TheSignatures adjustment includes a reduction of goodwill of $33.6 million related to the recording of the fair valueof the definite-lived intangibles. The AMG adjustment includes a net reduction in goodwill of $6.3 millionrelated to the recording of the fair value of definite-lived and indefinite-lived intangibles, fixed assets andminority interest. Additionally, included in the prior year acquisition amount above is an increase of $58.2million to goodwill related to adjustments in the purchase accounting for the Company’s 2007 acquisition of CPIand $3.8 million of deferred taxes with an offset to goodwill related to the Company’s 2005 acquisition of MeanFiddler as well as $2.5 million for other smaller acquisitions.
Included in the disposition amount above for 2008 is $3.1 million related to the sale of the North Americantheatrical business in January 2008 and $3.6 million related to the sale of the Company’s motor sports business inSeptember 2008.
Included in the impairment amount above for 2008 is a goodwill impairment charge of $269.9 millionrelated to its North American Music reporting unit resulting from the December 31, 2008 impairment testconducted as a result of the sharp decline in the Company’s market capitalization during the fourth quarter, asdiscussed above the table. In September 2008, in connection with the sale of its non-core events business (whichhas been classified as discontinued operations), the Company reviewed the carrying value of its non-core eventsassets based on an indicator that future operating cash flows may not support their carrying value based onexpected sales proceeds. It was determined that those assets were impaired since the estimated undiscounted cashflows, based on expected sales proceeds, associated with those assets were less than their carrying value. As aresult, the Company recorded a goodwill impairment charge of $13.0 million related to the goodwill for thisnon-core events business as a component of operating expenses in discontinued operations. The Company is notcontinuing to operate in the non-core events business.
Included in the adjustment amount above for 2008 is a $10.9 million reduction to goodwill related to secondcomponent goodwill, as defined by Statement 109, which results in a reduction of goodwill for financialreporting purposes when amortized for tax purposes. Also, during the year ended December 31, 2008, theCompany determined that $13.0 million of deferred tax assets acquired with the HOB Entertainment, Inc.acquisition in 2006, for which the Company had previously recorded valuation allowances, met the more likelythan not criteria for recognition. Accordingly, the Company recorded a reduction in the deferred tax valuationallowance for such deferred tax assets with an offset as an adjustment to goodwill. Finally, the Companyrecorded a $2.2 million reduction to goodwill primarily related to the final resolution of accruals for exitactivities from previous acquisitions.
The Company expects that no goodwill related to the 2008 acquisitions will be deductible for tax purposes.
The Company is in the process of finalizing its purchase accounting for recent acquisitions which couldresult in a change to the relevant purchase price allocations.
Included in the current year acquisition amount above for 2007 is goodwill of $3.1 million, $30.1 million,$63.4 million, $15.8 million, $5.1 million and $39.9 million related to the Company’s acquisitions of Jackie
96

LIVE NATION, INC.
NOTES TO CONSOLIDATED FINANCIAL STATEMENTS—(Continued)
Lombard Productions (“Jackie Lombard”) in the first quarter of 2007, the remaining 50% interest in HOBCanada in the second quarter of 2007, a 55.9% interest in AMG and the remaining interest in Musictoday, both inthe third quarter of 2007, Anthill Trading Ltd. (“Anthill”) and Signatures, both in the fourth quarter of 2007,respectively. The Company began consolidating AMG in July 2007 after the completion of a two-step acquisitionof interests in AMG through its joint venture with Gaiety Investments (“Gaiety”). The Company owns 50.1% ofthe joint venture with Gaiety. The goodwill recorded related to AMG represents the value of accelerating theCompany’s venue strategy in the United Kingdom through AMG’s interest in twelve music venues through awell-recognized brand.
Included in the prior year acquisition amount above for 2007 is a reduction of goodwill of $113.2 millionrelated to adjustments in the purchase accounting for the Company’s acquisition of HOB in November 2006.This HOB adjustment included a reduction in goodwill of $105.3 million related to the recording of the fair valueof definite-lived and indefinite-lived intangibles related to venue management and leasehold interests, revenue-generating contracts and trade names, and a $12.3 million reduction related to the fair value adjustment of fixedassets. These decreases were partially offset by an increase in goodwill of $4.4 million related to pre-acquisitionliabilities for HOB.
Also included in the prior year acquisition amount above for 2007 is a $1.9 million working capitaladjustment that increased goodwill, related to a December 2006 acquisition, contingent payments from priorperiod acquisitions of $2.0 million, as well as some smaller adjustments from prior year acquisitions recordedwithin the twelve-month allocation period resulting in a $0.3 million reduction to goodwill.
Included in the disposition amount above for 2007 is $7.4 million allocated to goodwill in connection withthe sale of seven clubs in the United Kingdom. The entities sold as part of this transaction were acquired by theCompany in July 2005 with the acquisition of Mean Fiddler. Goodwill recorded for this acquisition was allocatedin its entirety to the International Music reporting unit. As some, but not all, of this reporting unit was disposedof, a portion of the goodwill of the reporting unit was allocated to the venues sold. The allocation of goodwillwas based on the relative fair values of the venues sold and the portion of the reporting unit remaining. Fair valuefor the venues being disposed of was based upon the negotiated purchase price and the fair value of the reportingunit was based upon historical and projected earnings. The result of the process was to allocate $1.7 million ofgoodwill to the transaction. Additionally, as part of this sale, the Company recognized an adjustment to goodwillat the time of the sale of the seven clubs for the reversal of the remaining accrual for lease termination costsrelated to these sold venues. As the buyer assumed the lease and related obligations pursuant to the sale, theCompany was relieved of these obligations and derecognized the liability with an offset to goodwill. Thisreversal amounted to $4.4 million. Finally, there were tax-related balances of $1.3 million that were recorded inthe purchase accounting for these venues that were reversed into goodwill upon sale.
Included in the adjustment amount above for 2007 is a $4.6 million reduction to goodwill primarily relatedto second component goodwill, as defined by Statement 109, which results in a reduction of goodwill forfinancial reporting purposes when amortized for tax purposes as well as to pre-acquisition reserves.
Other Operating Assets
The Company makes investments in various operating assets, including investments in assets and rightsrelated to assets for DVD production and distribution. These assets are reviewed for impairment whenever eventsor changes in circumstances indicate that the carrying amount of the asset may not be recoverable. For the yearended December 31, 2008, in connection with the sale of the non-core events business along with rights tocertain DVD projects, the Company recorded impairments related to these other operating assets, based on
97

LIVE NATION, INC.
NOTES TO CONSOLIDATED FINANCIAL STATEMENTS—(Continued)
expected sales proceeds, of $1.3 million included in direct operating expenses in the Company’s North AmericanMusic segment and of $14.8 million included in operating expenses as part of discontinued operations. For theyear ended December 31, 2006, the Company recorded an impairment of $3.0 million related to these otheroperating assets in other operations. There were no impairments recorded for the year ended December 31, 2007.
Long-Lived Asset Disposals
During 2008, the Company did not sell any significant assets that were part of its continuing operations.
During 2007, the Company sold non-core operational assets including Donington Park Leisure Ltd., theoperating company that manages and holds the lease for Donington Park, an arena/race track in Leicestershire,England and its remaining 50.1% interest in the production of Phantom: The Las Vegas Spectacular at TheVenetian Resort Hotel and Casino (“Phantom—Las Vegas”). In addition, the Company sold the StarwoodAmphitheater located in Nashville, Tennessee because it was an underperforming core asset. The Company alsosold the Hammersmith Apollo and Forum music theaters in London as a regulatory requirement of the AMGacquisition. In connection with the sale of the Hammersmith Apollo and Forum music theaters, the Companygave the purchaser an option to acquire seven clubs in London at a later date. This option was exercised resultingin the disposal of the Jazz Café, G-A-Y, G-A-Y Late, Borderline, Old Fiddler, Garage and Upstairs at the Garage.Finally, the Company sold an office building located in San Francisco, California because of rising real estatevalues in the area. The Phantom—Las Vegas sale was made to former members of the Company’s management.
During 2006, the Company sold non-core operational assets including portions of its sports representationbusiness assets related to basketball, golf, football, media, tennis, baseball, soccer and rugby talent; its leaseholdinterest in two venues under development on the Planet Hollywood property in Las Vegas; 49.9% of its interestin Phantom—Las Vegas; 10% of its 50% interest in Delirium Concert, L.P.; and rights to certain theatricalproductions. Certain of these sales were made to former members of the Company’s management.
The table below summarizes the asset and liability values at the time of disposal and the resulting gain orloss recorded.
Divested Asset SegmentLoss (Gain) on
Sale Current AssetsNoncurrent
AssetsCurrentLiabilities
NoncurrentLiabilities
(in thousands)
2007 DivestituresDonington Park . . . . . . . . . Other $ (3,551) $ 2,390 $15,935 $ (689) $ 687Phantom—Las Vegas . . . . Other $ 8,148 $30,193 $ — $ 5,118 $12,927Starwood Amphitheater . . North American
Music $ (527) $ — $ 3,517 $ — $ —San Francisco officebuilding . . . . . . . . . . . . .
North AmericanMusic $ (5,995) $ — $ 2,321 $ 50 $ —
Hammersmith Apollo andForum . . . . . . . . . . . . . .
InternationalMusic $(12,897) $ — $15,193 $ 845 $ —
Seven clubs . . . . . . . . . . . . InternationalMusic $ (5,760) $ 2,160 $ 7,635 $ 4,048 $ —
2006 DivestituresSports representation . . . . Other $(10,638) $34,043 $ 2,958 $17,654 $ (9)Theatrical content . . . . . . . Other $ (1,641) $ — $ 9,168 $ — $ —
98

LIVE NATION, INC.
NOTES TO CONSOLIDATED FINANCIAL STATEMENTS—(Continued)
NOTE 3—BUSINESS ACQUISITIONS
The Company made acquisition-related cash payments of $19.7 million, $124.3 million and $351.9 millionduring the years ended December 31, 2008, 2007 and 2006, respectively. In 2008 and 2007, these paymentsrelated to nine acquisitions in each year including music promoters, venue operators and artist fan club andmerchandise service providers, as well as various earn-outs paid on prior year acquisitions. During 2007, theCompany also issued 8.2 million shares of its common stock in connection with the acquisitions of the remaininginterest in Musictoday, LLC, the remaining interest in CPI, Anthill Trading Ltd. (“Anthill”) and Signatures for atotal value of $161.7 million. Of these shares, 0.3 million shares are held by the Company pursuant to a pledgeagreement.
The following is a summary of the assets and liabilities acquired and the consideration given, net of cashreceived, for all acquisitions made during 2008 and 2007:
2008 2007
(in thousands)
Accounts receivable . . . . . . . . . . . . . . . . . . . . . . . . . . . . . . . . . . . . . . . . . . . . . . . . . . . . . . . $ 13,629 $ 16,603Property, plant and equipment . . . . . . . . . . . . . . . . . . . . . . . . . . . . . . . . . . . . . . . . . . . . . . . 6,533 62,241Intangible assets . . . . . . . . . . . . . . . . . . . . . . . . . . . . . . . . . . . . . . . . . . . . . . . . . . . . . . . . . . 71,158 264,496Goodwill . . . . . . . . . . . . . . . . . . . . . . . . . . . . . . . . . . . . . . . . . . . . . . . . . . . . . . . . . . . . . . . 69,695 47,814Other assets . . . . . . . . . . . . . . . . . . . . . . . . . . . . . . . . . . . . . . . . . . . . . . . . . . . . . . . . . . . . . 13,165 18,624
174,180 409,778Long-term debt, assumed, including current portion . . . . . . . . . . . . . . . . . . . . . . . . . . . . . . (2,015) (57,989)Other liabilities . . . . . . . . . . . . . . . . . . . . . . . . . . . . . . . . . . . . . . . . . . . . . . . . . . . . . . . . . . (98,951) (65,831)Deferred purchase consideration . . . . . . . . . . . . . . . . . . . . . . . . . . . . . . . . . . . . . . . . . . . . . (20,799) —Long-term debt, issued, including current portion . . . . . . . . . . . . . . . . . . . . . . . . . . . . . . . (32,758) —Common stock issued . . . . . . . . . . . . . . . . . . . . . . . . . . . . . . . . . . . . . . . . . . . . . . . . . . . . . — (161,673)
Cash paid for acquisitions, net . . . . . . . . . . . . . . . . . . . . . . . . . . . . . . . . . . . . . . . . . . . . . . . $ 19,657 $ 124,285
The Company is in the process of finalizing its purchase accounting for recent acquisitions which couldresult in a change to the allocation of the purchase price.
The Company’s acquisitions during 2007 were considered significant in the aggregate (acquisitions during2008 were not significant in the aggregate). The results of operations for the year ended December 31, 2007include the operations of the Company’s 2007 acquisitions from each acquisition’s purchase date, whereas, theresults of operations for the year ended December 31, 2008 include the operations of the Company’s 2007acquisitions for the entire year. Unaudited pro forma consolidated results of operations, assuming the 2007acquisitions had occurred on January 1, 2007, would have been as follows:
Year Ended December 31,
2008 2007
(in thousands, exceptper share data)
Revenue . . . . . . . . . . . . . . . . . . . . . . . . . . . . . . . . . . . . . . . . . . . . . . . . . . . . . . . . . . . . . . $4,166,838 $3,972,167Loss from continuing operations . . . . . . . . . . . . . . . . . . . . . . . . . . . . . . . . . . . . . . . . . . . $ (326,421) $ (51,949)Net loss attributable to Live Nation, Inc. . . . . . . . . . . . . . . . . . . . . . . . . . . . . . . . . . . . . $ (239,412) $ (12,645)Loss per common share from continuing operations attributable to Live Nation,Inc.—basic and diluted . . . . . . . . . . . . . . . . . . . . . . . . . . . . . . . . . . . . . . . . . . . . . . . . $ (4.30) $ (0.76)
Net loss per common share attributable to Live Nation, Inc.—basic and diluted . . . . . $ (3.14) $ (0.18)
99

LIVE NATION, INC.
NOTES TO CONSOLIDATED FINANCIAL STATEMENTS—(Continued)
The Company has entered into certain agreements relating to acquisitions that provide for purchase priceadjustments and other future contingent payments based on the financial performance of the acquired company.During the years ended December 31, 2008, 2007 and 2006, the cash payments discussed above includepayments related to earn-outs of $3.7 million, $2.0 million and $0.5 million, respectively, that were recorded togoodwill. The Company will continue to accrue additional amounts related to such contingent payments if andwhen it is determinable that the applicable financial performance targets will be met. The aggregate of thesecontingent payments, if performance targets are met, will not significantly impact the Company’s financialposition or results of operations.
NOTE 4—RESTRUCTURING
As part of the Company’s acquisition of HOB Canada in June 2007, the Company accrued $1.2 million inrestructuring costs in its North American Music segment related to severance costs. This restructuring resulted inthe termination of eight employees. These additional costs were recorded as part of the purchase price allocationand there is no remaining accrual as of December 31, 2008.
As part of the Company’s acquisition of HOB in November 2006, the Company accrued $5.5 million inrestructuring costs in its North American Music segment related to severance costs which were paid in 2007.This restructuring resulted in the termination of 80 employees. These additional costs were recorded as anadjustment to the purchase price and there is no remaining accrual as of December 31, 2008.
As part of the Company’s acquisition of Mean Fiddler, subsequently renamed Festival Republic, in July2005, the Company accrued $4.7 million during 2005 and recorded an additional accrual of $2.7 million in 2006in its International Music segment primarily related to lease terminations which it expects to pay over the nextseveral years. These additional costs were recorded as adjustments to the purchase price. In August 2007, theCompany sold seven clubs that were acquired with Mean Fiddler resulting in a reduction of $4.4 million to therestructuring accrual with an offset to goodwill for the lease terminations related to these venues. As ofDecember 31, 2008, the accrual balance for the Mean Fiddler restructuring was $1.0 million.
In addition, the Company has a remaining restructuring accrual of $0.7 million as of December 31, 2008,related to its merger with Clear Channel in August 2000.
In total, the Company has recorded a liability in purchase accounting related to severance for terminatedemployees and lease terminations as follows:
2008 2007
(in thousands)
Severance and lease termination costs:Accrual at January 1 . . . . . . . . . . . . . . . . . . . . . . . . . . . . . . . . . . . . . . . . . . . . . . . . . . . . . . $ 3,543 $13,132Restructuring accruals recorded . . . . . . . . . . . . . . . . . . . . . . . . . . . . . . . . . . . . . . . . . . . . . — 1,456Payments charged against restructuring accrual . . . . . . . . . . . . . . . . . . . . . . . . . . . . . . . . (537) (6,611)Adjustments and foreign currency . . . . . . . . . . . . . . . . . . . . . . . . . . . . . . . . . . . . . . . . . . . (1,266) (4,434)
Remaining accrual at December 31 . . . . . . . . . . . . . . . . . . . . . . . . . . . . . . . . . . . . . . . . . . . . . . $ 1,740 $ 3,543
The remaining severance and lease accrual is comprised of $0.6 million of severance and $1.1 million oflease termination costs. The severance accrual includes amounts that will be paid over the next several yearsrelated to deferred payments to former employees, as well as other compensation. The lease termination accrualwill be paid over the next 15 years. For the years ended December 31, 2008 and 2007, there was $0.5 million and$6.2 million, respectively, charged to the restructuring reserve related to severance.
100

LIVE NATION, INC.
NOTES TO CONSOLIDATED FINANCIAL STATEMENTS—(Continued)
NOTE 5—DISCONTINUED OPERATIONS
In January 2008, the Company completed the sale of substantially all of its North American theatricalbusiness, which included the assets of the North American theatrical presenting business and certain theatricalvenues, to Key Brand Entertainment Inc. and its lenders for a gross sales price of $90.4 million pursuant to astock purchase agreement. After fees, expenses, an adjustment to replace the show cash of the North Americantheatrical business that was previously removed from the operations and utilized by the Company and otheradjustments, the Company received in 2008 approximately $18.5 million of proceeds, net of cash sold andtransaction costs, and will receive an additional $12.6 million in 2009. The sale of the North American theatricalbusiness resulted in a total pre-tax gain of $17.8 million.
In September 2008, the Company sold its motor sports business to Feld Acquisition Corp., a wholly-ownedsubsidiary of Feld Entertainment, Inc. pursuant to a stock purchase agreement for a gross sales price of $175.0million in cash, subject to certain net working capital and other post-closing adjustments, in addition to aperformance-based contingent payment of up to $30.0 million over a five-year period commencing with calendaryear 2009. After estimated fees, expenses and other adjustments, the Company received approximately $166.5million of net proceeds, excluding the contingent payment. The sale of the motor sports business resulted in apre-tax gain of $145.0 million.
In October 2008, as part of a binding agreement with Events Acquisition Corporation, the Company sold itsnon-core events business along with rights to certain DVD projects. Events Acquisition Corporation is owned byMichael Cohl who is a former director and executive officer of the Company. The events business included rightsor investments in certain non-music and exhibition-style events. Under the agreement, the Company will receiveapproximately $15.4 million for the events business, DVD projects and other rights, in addition to performance-based contingent payments and undistributed profits related to future periods. The Company recorded a $0.8million pre-tax gain in discontinued operations and a $0.7 million loss in continuing operations. In the thirdquarter of 2008, the Company recorded a $29.2 million impairment related to the events business, including a$13.0 million impairment of goodwill, and also a $1.5 million impairment related to the DVD projects. Mr. Cohlcontinues to work with the Company as a consultant and remains bound by a non-compete clause until 2016, butunder the agreement he will be permitted to co-promote tours for certain artists with Live Nation. Mr. Cohl willalso be able to continue his work with certain non-music related events and exhibitions. In connection with thesale, a number of employees, primarily from the Company’s Miami offices, left the Company to join Mr. Cohl’snew organization.
The Company has reported the North American theatrical business, the motor sports business and the eventsbusiness as discontinued operations in accordance with FASB Statement of Financial Accounting StandardsNo. 144, Accounting for the Impairment or Disposal of Long-Lived Assets. Accordingly, the results of operationsfor all periods presented have been reclassified to reflect the North American theatrical business, the motor sportsbusiness and the events business as discontinued operations. Due to the 2008 sale of the North Americantheatrical business, the Oriental Theater and the equity investment in Broadway in Chicago, LLC, (“BIC”) whichwere part of the North American theatrical business and were sold in 2007 as discussed in Long-Lived AssetDisposals above, are now being presented as discontinued operations. Included in discontinued operations in2008 is the impairment of $29.2 million for the events business as discussed above.
101

LIVE NATION, INC.
NOTES TO CONSOLIDATED FINANCIAL STATEMENTS—(Continued)
Summary operating results of discontinued operations are as follows:
2008 2007 2006
(in thousands)
Revenue . . . . . . . . . . . . . . . . . . . . . . . . . . . . . . . . . . . . . . . . . . . . . . . . . . . . . . . $160,244 $429,511 $417,244Operating expenses . . . . . . . . . . . . . . . . . . . . . . . . . . . . . . . . . . . . . . . . . . . . . . 168,641 394,784 384,903Gain on sale of operating assets . . . . . . . . . . . . . . . . . . . . . . . . . . . . . . . . . . . . . (2,193) (31,396) (1,653)Other expense (income)—net . . . . . . . . . . . . . . . . . . . . . . . . . . . . . . . . . . . . . . . 1,481 (10,571) (8,819)
Income (loss) from discontinued operations before income taxes . . . . . . . . . . . (7,685) 76,694 42,813Income tax expense . . . . . . . . . . . . . . . . . . . . . . . . . . . . . . . . . . . . . . . . . . . . . . 3,496 30,318 18,608
Income (loss) from discontinued operations before loss (gain) on disposal . . . (11,181) 46,376 24,205Loss (gain) on disposal, net of tax of $64.6 million for the year endedDecember 31, 2008 . . . . . . . . . . . . . . . . . . . . . . . . . . . . . . . . . . . . . . . . . . . . (99,777) 824 —
Income from discontinued operations, net of tax . . . . . . . . . . . . . . . . . . . . . . . . 88,596 45,552 24,205Income from discontinued operations attributable to minority interests . . . . . . 161 1,709 760
Income from discontinued operations attributable to Live Nation, Inc. . . . . . . $ 88,435 $ 43,843 $ 23,445
The table below summarizes the asset and liability values at the time of disposal and the resulting gain orloss recorded.
Divested Asset Segment
Loss(Gain) on
Sale Current AssetsNoncurrent
AssetsCurrentLiabilities
NoncurrentLiabilities
(in thousands)
2008 DivestituresNBC JV . . . . . . . . . . . . . . . . . . . . . . . . . Other $ (2,507) $ 683 $ 100 $ — $—North American theatrical business . . . Other $ (17,767) $65,820 $72,351 $79,938 $ (38)Motor Sports business . . . . . . . . . . . . . . Other $(144,973) $15,458 $12,285 $ (1,634) $393Events business . . . . . . . . . . . . . . . . . . . Other $ (809) $ 3,644 $10,043 $ — $—
2007 DivestituresOriental Theater and BIC . . . . . . . . . . . Other $ (30,939) $ 4 $27,666 $ (341) $ 14
NOTE 6—INVESTMENTS
The Company has investments in various nonconsolidated affiliates. These investments are notconsolidated, but are accounted for either under the equity or cost methods of accounting whereby the Companyrecords its investments in these entities in the balance sheet as investments in nonconsolidated affiliates. TheCompany’s interests in their operations are recorded in the statement of operations as equity in losses (earnings)of nonconsolidated affiliates. Investments in nonconsolidated affiliates in which the Company owns 20% to 50%of the voting common stock or otherwise exercises significant influence over operating and financial policies ofthe nonconsolidated affiliate are accounted for using the equity method of accounting. Investments innonconsolidated affiliates in which the Company owns less than 20% of the voting common stock are accountedfor using the cost method of accounting. The following includes the Company’s larger investments innonconsolidated affiliates accounted for under the equity method of accounting.
Dominion Theatre
The Company owns a 33% interest in the Dominion Theatre, a United Kingdom theatrical companyinvolved in venue operations.
102

LIVE NATION, INC.
NOTES TO CONSOLIDATED FINANCIAL STATEMENTS—(Continued)
Delirium Concert, L.P.
The Company owns a 50% interest in a joint venture with Cirque Du Soleil which was formed in 2005 todevelop, produce and promote a new type of live entertainment musical and visual event. The touring eventassociated with this joint venture ended in the second quarter of 2008.
Summarized unaudited balance sheet and unaudited income statement information for the Company’sinvestments that are considered significant for the years ended December 31, 2006 and 2007 are as follows (noinvestments were considered significant for the year ended December 31, 2008):
DominionDeliriumConcert(1)
(in thousands)
2008Current assets . . . . . . . . . . . . . . . . . . . . . . . . . . . . . . . . . . . . . . . . . . . . . . . . . . . . . . . . . . . . . $ 8,747 $ 9,358Noncurrent assets . . . . . . . . . . . . . . . . . . . . . . . . . . . . . . . . . . . . . . . . . . . . . . . . . . . . . . . . . . $ 9,172 $ —Current liabilities . . . . . . . . . . . . . . . . . . . . . . . . . . . . . . . . . . . . . . . . . . . . . . . . . . . . . . . . . . $ 5,330 $ 10,991Noncurrent liabilities . . . . . . . . . . . . . . . . . . . . . . . . . . . . . . . . . . . . . . . . . . . . . . . . . . . . . . . $ — $ 3,500
Revenue . . . . . . . . . . . . . . . . . . . . . . . . . . . . . . . . . . . . . . . . . . . . . . . . . . . . . . . . . . . . . . . . . . $12,393 $ 15,769Operating income (loss) . . . . . . . . . . . . . . . . . . . . . . . . . . . . . . . . . . . . . . . . . . . . . . . . . . . . . $ 4,837 $ (4,215)Net income (loss) . . . . . . . . . . . . . . . . . . . . . . . . . . . . . . . . . . . . . . . . . . . . . . . . . . . . . . . . . . $ 4,038 $ (4,198)
2007Current assets . . . . . . . . . . . . . . . . . . . . . . . . . . . . . . . . . . . . . . . . . . . . . . . . . . . . . . . . . . . . . $15,910 $ 17,110Noncurrent assets . . . . . . . . . . . . . . . . . . . . . . . . . . . . . . . . . . . . . . . . . . . . . . . . . . . . . . . . . . $11,376 $ —Current liabilities . . . . . . . . . . . . . . . . . . . . . . . . . . . . . . . . . . . . . . . . . . . . . . . . . . . . . . . . . . $ 7,775 $ 14,545Noncurrent liabilities . . . . . . . . . . . . . . . . . . . . . . . . . . . . . . . . . . . . . . . . . . . . . . . . . . . . . . . $ — $ 3,500
Revenue . . . . . . . . . . . . . . . . . . . . . . . . . . . . . . . . . . . . . . . . . . . . . . . . . . . . . . . . . . . . . . . . . . $16,061 $ 44,762Operating income (loss) . . . . . . . . . . . . . . . . . . . . . . . . . . . . . . . . . . . . . . . . . . . . . . . . . . . . . $ 6,872 $(13,157)Net income (loss) . . . . . . . . . . . . . . . . . . . . . . . . . . . . . . . . . . . . . . . . . . . . . . . . . . . . . . . . . . $ 6,158 $(13,157)
2006Current assets . . . . . . . . . . . . . . . . . . . . . . . . . . . . . . . . . . . . . . . . . . . . . . . . . . . . . . . . . . . . . $17,843 $ 2,440Noncurrent assets . . . . . . . . . . . . . . . . . . . . . . . . . . . . . . . . . . . . . . . . . . . . . . . . . . . . . . . . . . $ 2,269 $ 2,410Current liabilities . . . . . . . . . . . . . . . . . . . . . . . . . . . . . . . . . . . . . . . . . . . . . . . . . . . . . . . . . . $ 7,342 $ 1,063Noncurrent liabilities . . . . . . . . . . . . . . . . . . . . . . . . . . . . . . . . . . . . . . . . . . . . . . . . . . . . . . . $ — $ —
Revenue . . . . . . . . . . . . . . . . . . . . . . . . . . . . . . . . . . . . . . . . . . . . . . . . . . . . . . . . . . . . . . . . . . $13,052 $ 69,746Operating income (loss) . . . . . . . . . . . . . . . . . . . . . . . . . . . . . . . . . . . . . . . . . . . . . . . . . . . . . $ 4,508 $(10,438)Net income (loss) . . . . . . . . . . . . . . . . . . . . . . . . . . . . . . . . . . . . . . . . . . . . . . . . . . . . . . . . . . $ 3,284 $(10,438)
(1) Included in Delirium Concert’s operating loss is amortization of production costs related to the event.
There were no accumulated undistributed earnings included in retained deficit for these investments for theyears ended December 31, 2008, 2007 and 2006.
The Company’s investment assets are reviewed for impairment whenever events or changes incircumstances indicate that the carrying amount of the asset may not be recoverable. For the year endedDecember 31, 2008, the Company recorded an impairment related to its investments in nonconsolidated affiliatesof $1.4 million as equity in losses (earnings) of nonconsolidated affiliates as a component of other expense(income)—net in discontinued operations. For the years ended December 31, 2007 and 2006, the Company
103

LIVE NATION, INC.
NOTES TO CONSOLIDATED FINANCIAL STATEMENTS—(Continued)
recorded an impairment related to investments in nonconsolidated affiliates of $2.7 million and $0.5 million,respectively. These impairments were recorded as equity in losses (earnings) of nonconsolidated affiliates.
The Company conducts business with certain of its equity method investees in the ordinary course ofbusiness. Transactions relate to venue rentals, management fees, sponsorship revenue, and reimbursement ofcertain costs. Expenses of $3.1 million, $4.1 million and $4.5 million were incurred in 2008, 2007 and 2006,respectively, and revenue of $2.5 million, $2.3 million and $2.8 million were earned in 2008, 2007 and 2006,respectively, from these equity investees for services rendered or provided in relation to these business ventures.
NOTE 7—LONG-TERM DEBT
Long-term debt, which includes capital leases, at December 31, 2008 and 2007, consisted of the following:
December 31,
2008 2007
(in thousands)
Senior Secured Credit Facility:Term loan . . . . . . . . . . . . . . . . . . . . . . . . . . . . . . . . . . . . . . . . . . . . . . . . . $418,066 $451,730Revolving credit facility . . . . . . . . . . . . . . . . . . . . . . . . . . . . . . . . . . . . . . 122,000 55,000
2.875% convertible senior notes due 2027, net of unamortized discount of$61.6 million in 2008 and $69.6 million in 2007 . . . . . . . . . . . . . . . . . . . . . 158,407 150,411
Other long-term debt . . . . . . . . . . . . . . . . . . . . . . . . . . . . . . . . . . . . . . . . . . . . . 125,647 95,876
824,120 753,017Less: current portion . . . . . . . . . . . . . . . . . . . . . . . . . . . . . . . . . . . . . . . . . . . . . 48,637 36,345
Total long-term debt, net of discount . . . . . . . . . . . . . . . . . . . . . . . . . . . . . . . . $775,483 $716,672
Future maturities of long-term debt at December 31, 2008 are as follows:
(in thousands)
2009 . . . . . . . . . . . . . . . . . . . . . . . . . . . . . . . . . . . . . . . . . . . . . . . . . . . . . . . . . . $ 48,6372010 . . . . . . . . . . . . . . . . . . . . . . . . . . . . . . . . . . . . . . . . . . . . . . . . . . . . . . . . . . 14,2162011 . . . . . . . . . . . . . . . . . . . . . . . . . . . . . . . . . . . . . . . . . . . . . . . . . . . . . . . . . . 19,1642012 . . . . . . . . . . . . . . . . . . . . . . . . . . . . . . . . . . . . . . . . . . . . . . . . . . . . . . . . . . 142,0252013 . . . . . . . . . . . . . . . . . . . . . . . . . . . . . . . . . . . . . . . . . . . . . . . . . . . . . . . . . . 407,796Thereafter . . . . . . . . . . . . . . . . . . . . . . . . . . . . . . . . . . . . . . . . . . . . . . . . . . . . . . 253,875
885,713Debt discount . . . . . . . . . . . . . . . . . . . . . . . . . . . . . . . . . . . . . . . . . . . . . . . . . . . (61,593)
Total, net of discount . . . . . . . . . . . . . . . . . . . . . . . . . . . . . . . . . . . . . . . . . . . . . $824,120
All long-term debt without a stated maturity date is considered current and is reflected as maturing inthe earliest period shown in the table above.
Senior Secured Credit Facility
The Company has a senior secured credit facility consisting of term loans totaling $550 million and a $285million revolving credit facility, with the right, subject to certain conditions, to increase such facilities by up to$250 million in the aggregate. The revolving credit facility provides for borrowings up to the amount of the
104

LIVE NATION, INC.
NOTES TO CONSOLIDATED FINANCIAL STATEMENTS—(Continued)
facility with sub-limits of up to $235 million to be available for the issuance of letters of credit and up to $100million to be available for borrowings in foreign currencies. Under the senior secured credit facility, revolvingloans bear interest at an annual rate of LIBOR plus 2.25%, subject to stepdowns based on the Company’sleverage ratio at the time of borrowing, and term loans bear interest at an annual rate of LIBOR plus 3.25%.
The interest rate paid on the Company’s $285 million, multi-currency revolving credit facility depends onits total leverage ratio. In addition to paying interest on outstanding principal under the credit facility, theCompany is required to pay a commitment fee to the lenders under the revolving credit facility in respect of theunutilized commitments. As of December 31, 2008, the commitment fee rate was 0.375%. The Company is alsorequired to pay customary letter of credit fees, as necessary. In the event the Company’s leverage ratio improves,the interest rate on revolving credit borrowings declines gradually to 1.25% above LIBOR at a total leverageratio of less than, or equal to, 1.25 times.
The senior secured credit facility contains a number of covenants that, among other things, restrict theCompany’s ability to incur additional debt, pay dividends and make distributions, make certain investments andacquisitions, repurchase stock and prepay certain indebtedness, create liens, enter into agreements with affiliates,modify the nature of the business, enter into sale-leaseback transactions, transfer and sell material assets, andmerge or consolidate.
At December 31, 2008, the outstanding balance on the term loans and revolving credit facility was $418.1million and $122.0 million, respectively. Taking into account letters of credit of $42.3 million, $120.7 millionwas available for future borrowings. Under the senior secured credit facility, the Company is required to makeminimum quarterly principal repayments for the term loans. The Company has a term loan maturing in June2013, for which minimum quarterly principal repayments aggregating approximately $2.5 million per year arerequired through March 2013, with the balance due at maturity. The Company also has a term loan maturing inDecember 2013, for which minimum quarterly principal repayments aggregating approximately $1.7 million peryear are required through September 2013, with the balance due at maturity. The revolving credit portion of thecredit facility matures in June 2012. At December 31, 2008, the weighted average interest rate, including theimpact of the interest rate swap agreements, on term loans under this credit facility was 7.39%.
2.875% Convertible Senior Notes
In July 2007, the Company issued $220 million of convertible senior notes due 2027 in a private placementin the United States to qualified institutional buyers pursuant to Rule 144A under the Securities Act of 1933, asamended. The notes pay interest semiannually at a rate of 2.875% per annum. Beginning with the periodcommencing on July 20, 2014 and ending on January 14, 2015, and for each of the interest periods commencingthereafter, the Company will pay contingent interest on the notes if the average trading price of the notes duringthe five consecutive trading days ending on the second trading day immediately preceding the first day of theapplicable interest period equals or exceeds 120% of the principal amount of the notes. The contingent interestpayable per note will equal 0.25% per year of the average trading price of such note during the applicable fivetrading-day reference period, payable in arrears. The notes will be convertible, under certain circumstances, at aninitial conversion rate of 36.8395 shares per $1,000 principal amount of notes, which represents a 27.5%conversion premium based on the last reported sale price of $21.29 per share on July 10, 2007. Upon conversion,the notes may be settled in shares of Live Nation common stock or, at the Company’s election, cash or acombination of cash and shares of Live Nation common stock. The net proceeds from the offering, afterdeducting estimated offering expenses payable by the Company, were approximately $212.4 million.
Holders of the 2.875% convertible senior notes may require the Company to purchase for cash all or aportion of their notes on July 15, 2014, July 15, 2017 and July 15, 2022 at a price equal to 100% of the principal
105

LIVE NATION, INC.
NOTES TO CONSOLIDATED FINANCIAL STATEMENTS—(Continued)
amount plus accrued and unpaid interest, if any, subject to specified additional conditions. In addition, if theCompany experiences a fundamental change, as defined in the indenture governing the notes, holders mayrequire the Company to purchase for cash all or a portion of their notes, subject to specified exceptions, at a priceequal to 100% of the principal amount of the notes plus accrued and unpaid interest, if any.
On or after July 20, 2014, the Company may redeem all or a portion of the notes for cash at a price equal to100% of the principal amount being redeemed plus accrued and unpaid interest, if any.
See Note 9 for discussion on the accounting for derivative instruments embedded within the 2.875%convertible senior notes.
On January 1, 2009, the Company adopted FSP APB 14-1 which changed the accounting for certainconvertible debt instruments, including the Company’s 2.875% convertible senior notes. FSP APB 14-1 requiresan issuer of certain convertible debt instruments that may be settled entirely or partially in cash upon conversionto separately account for the liability and equity components of the instrument in a manner that reflects theissuer’s non-convertible borrowing rate when interest is recognized in subsequent periods. The provisions of FSPAPB 14-1 require retrospective application to all periods presented in the Company’s consolidated financialstatements as a change in accounting principle.
Upon adoption, the Company reclassified $73.0 million of the carrying value of the convertible notes fromlong-term debt to additional paid-in capital on the Company’s consolidated balance sheet as of the July 2007issuance date. This amount represents the equity component of the proceeds from the notes, calculated assuminga 9.4% non-convertible borrowing rate. This equity component is treated as an original issue discount forpurposes of accounting for the debt component of the notes and will be amortized to interest expense, using theeffective interest method, over a seven-year term, which is when the related put and call are exercisable.Additionally, as of the July 2007 issuance date, the Company recorded a deferred tax liability of $27.9 millionand a corresponding $27.9 million reduction in deferred tax valuation allowances, as well as a decrease of $2.4million to other long-term assets for an adjustment of capitalized transaction costs related to the amount allocatedto the equity component of the notes with the offset recorded to additional paid-in capital for these items.Additional non-cash interest expense of $7.6 million and $3.3 million for the years ended December 31, 2008and 2007, respectively, has been recorded for the impact of the accounting change. Comparative financialstatements for prior periods have been adjusted to apply the change in accounting principle retrospectively.
106

LIVE NATION, INC.
NOTES TO CONSOLIDATED FINANCIAL STATEMENTS—(Continued)
The following tables present the financial statement line items that were affected by the change inaccounting principle:
December 31, 2008 December 31, 2007
As Adjusted forFSP APB 14-1
As Computed Priorto FSP APB 14-1
Effect ofChange
As Adjusted forFSP APB 14-1
As Computed Priorto FSP APB 14-1
Effect ofChange
(in thousands)Consolidated Balance Sheets:Other long-term assets . . . . . . . . . $ 210,214 $ 212,148 $ (1,934) $ 120,680 $ 122,963 $ (2,283)Long-term debt . . . . . . . . . . . . . . . $ 775,483 $ 837,076 $(61,593) $ 716,672 $ 786,261 $(69,589)Additional paid-in capital . . . . . . . $1,063,564 $ 993,005 $ 70,559 $1,011,407 $ 940,848 $ 70,559Retained deficit . . . . . . . . . . . . . . . $ (373,606) $(362,706) $(10,900) $ (134,194) $(130,941) $ (3,253)Consolidated Statements ofOperations:
Interest expense . . . . . . . . . . . . . . $ 70,670 $ 63,023 $ 7,647 $ 65,006 $ 61,753 $ 3,253Loss from continuingoperations . . . . . . . . . . . . . . . . . $ (326,421) $(318,774) $ (7,647) $ (52,872) $ (49,619) $ (3,253)
Net loss attributable to LiveNation, Inc. . . . . . . . . . . . . . . . . $ (239,412) $(231,765) $ (7,647) $ (15,189) $ (11,936) $ (3,253)
Basic and diluted loss percommon share attributable tocommon stockholders:
Loss from continuing operationsattributable to Live Nation, Inc. $ (4.30) $ (4.20) $ (0.10) $ (0.89) $ (0.81) $ (0.08)
Net loss attributable to LiveNation, Inc. . . . . . . . . . . . . . . . . $ (3.14) $ (3.04) $ (0.10) $ (0.22) $ (0.17) $ (0.05)
Consolidated Statements ofCash Flows:
Net loss . . . . . . . . . . . . . . . . . . . . . $ (237,825) $(230,178) $ (7,647) $ (7,320) $ (4,067) $ (3,253)Amortization of debt issuancecosts . . . . . . . . . . . . . . . . . . . . . $ 3,616 $ 3,964 $ (348) $ 1,935 $ 2,095 $ (160)
Amortization of debt discount . . . $ 7,995 $ — $ 7,995 $ 3,413 $ — $ 3,413
As of December 31, 2008 and 2007, the carrying amount of the equity component of the notes was $73.0million. As of December 31, 2008 and 2007, the principal amount of the liability component (face value of thenotes), the unamortized discount and the net carrying amount of the notes was $220.0 million, $220.0 million,$61.6 million, $69.6 million, $158.4 million and $150.4 million, respectively. The remaining period over whichthe discount will be amortized is approximately 5 years. At December 31, 2008, the value of the notes ifconverted and fully settled in shares does not exceed the principal amount of the notes. For the year endedDecember 31, 2008 and 2007, the effective interest rate on the liability component of the notes was 9.7%. Thefollowing table summarizes the amount of pre-tax interest cost recognized on the notes:
2008 2007
(in thousands)
Interest cost recognized relating to:Contractual interest coupon . . . . . . . . . . . . . . . . . . . . . . . $ 6,325 $2,899Amortization of the discount on the liability . . . . . . . . . 7,995 3,413Amortization of debt issuance costs . . . . . . . . . . . . . . . . 703 322
Total interest cost recognized on the notes . . . . . . . . . . . . . . . $15,023 $6,634
107

LIVE NATION, INC.
NOTES TO CONSOLIDATED FINANCIAL STATEMENTS—(Continued)
Other Long-term Debt
Other long-term debt is comprised of capital leases of $10.3 million and notes payable and other debt of$115.3 million, including debt to a minority interest partner of $37.8 million, debt related to the redevelopmentof the O2 Dublin of $28.2 million and $39.8 million of long-term debt for AMG which consists of eight notes anda revolver. Total notes payable consists primarily of twenty notes with interest rates ranging from 5.0% to 11.0%and maturities up to eleven years.
Debt Covenants
The significant covenants on the Company’s multi-currency senior secured credit facility relate to totalleverage, senior leverage, interest coverage and capital expenditures contained and defined in the creditagreement. The adjusted leverage ratio covenant requires the Company to maintain a ratio of consolidated totalindebtedness minus unrestricted cash and cash equivalents, up to a maximum of $150 million (all as defined bythe credit agreement), to consolidated earnings-before-interest-taxes-depreciation-and-amortization (as definedby the credit agreement, “Adjusted Consolidated EBITDA”) of less than 4.0 times, provided that aggregatedsubordinated indebtedness and permitted holding company indebtedness (as defined by the credit agreement) isless than $25 million or 6.0 times if greater than $25 million. The senior leverage covenant, which is onlyapplicable provided aggregate subordinated indebtedness and permitted holding company indebtedness is greaterthan $25 million, requires the Company to maintain a ratio of adjusted consolidated senior indebtedness minusunrestricted cash and cash equivalents to Adjusted Consolidated EBITDA of less than 4.0 times. The interestcoverage covenant requires the Company to maintain a minimum ratio of Adjusted Consolidated EBITDA tocash interest expense (as defined by the credit agreement) of 2.5 times. The capital expenditure covenant limitsannual capital expenditures (as defined by the credit agreement) to $110 million or less, subject to a carryoverprovision. In the event that the Company does not meet these covenants, the Company is considered to be indefault on the credit facilities at which time the credit facilities may become immediately due. This credit facilitycontains a cross default provision that would be triggered if the Company was to default on any otherindebtedness greater than $10 million.
In July 2008, the Company amended its existing amended and restated senior secured credit agreement andthe Amended Preferred Stock Certificate effective June 30, 2008 to, among other things, (i) increase the amountof allowable investments by the amount of net proceeds received from issuances of equity and convertible debt,(ii) permit investment in unrestricted subsidiaries in an amount of up to 50% of the amount of net proceedsreceived from issuances of equity and convertible debt and (iii) revise the definition of certain items in theagreement.
Some of the Company’s other subsidiary indebtedness includes restrictions on acquisitions and prohibitspayment of ordinary dividends. They also have financial covenants including minimum consolidated EBITDA toconsolidated net interest payable, minimum consolidated cash flow to consolidated debt service, and maximumconsolidated debt to consolidated EBITDA, all as defined in the applicable debt agreements.
At December 31, 2008, the Company was in compliance with all debt covenants. The Company expects toremain in compliance with all of these covenants throughout 2009.
NOTE 8—REDEEMABLE PREFERRED STOCK
As of December 31, 2008, one of the Company’s subsidiaries had 200,000 shares of Series A redeemablepreferred stock, par value $.01 per share, and 200,000 shares of Series B redeemable preferred stock, par value$.01 per share, outstanding (collectively, the “Preferred Stock”) with an aggregate liquidation preference of $40.0
108

LIVE NATION, INC.
NOTES TO CONSOLIDATED FINANCIAL STATEMENTS—(Continued)
million. The Preferred Stock accrues dividends at 13% per annum and is mandatorily redeemable onDecember 21, 2011. The Company will be required to make an offer to purchase the Series A and Series Bredeemable preferred stock at 101% of each series’ liquidation preference in the event of a change of control (asdefined). The Series A and Series B redeemable preferred stock will rank pari passu to each other and will besenior to all other classes or series of capital stock of the issuer with respect to dividends and with respect toliquidation or dissolution of the issuer.
The Amended and Restated Certificate of Incorporation governing the Redeemable Preferred Stock (the“Amended Preferred Stock Certificate”) contains a number of covenants that, among other things, restrict theCompany’s ability to incur additional debt, issue certain equity securities, create liens, merge or consolidate,modify the nature of the Company’s business, make certain investments and acquisitions, transfer and sellmaterial assets, enter into sale-leaseback transactions, enter into swap agreements, pay dividends and makedistributions, and enter into agreements with affiliates. If the Company defaults under any of these covenants, theCompany will have to pay additional dividends.
The Amended Preferred Stock Certificate contains covenants similar to the senior secured credit facility andalso contains a covenant that requires the Company to pay additional dividends ranging from 2% to 7% in theevent the ratio of consolidated total indebtedness minus unrestricted cash and cash equivalents, up to a maximumof $150 million (all as defined by the Amended Preferred Stock Certificate), to consolidated earnings-before-interest-taxes-depreciation-and-amortization (as defined by the Amended Preferred Stock Certificate) exceeds4.0 times.
The Series A redeemable preferred stock has voting rights including the right to appoint one of the fourmembers of the issuer’s board of directors. The Series B redeemable preferred stock has no voting rights otherthan the right to vote as a class with the Series A redeemable preferred stock to elect one additional member tothe board of directors of the issuer in the event the issuer breaches certain terms of the designations of thepreferred stock.
At December 31, 2008, the Company was in compliance with all Preferred Stock covenants. The Companyexpects to remain in compliance with all of the Company’s Preferred Stock covenants throughout 2009.
NOTE 9—DERIVATIVE INSTRUMENTS
Statement 133 requires the Company to recognize all of its derivative instruments as either assets orliabilities in the consolidated balance sheets at fair value. The accounting for changes in the fair value of aderivative instrument depends on whether it has been designated and qualifies as part of a hedging relationship,and further, on the type of hedging relationship. For derivative instruments that are designated and qualify ashedging instruments, the Company must designate the hedging instrument, based upon the exposure beinghedged, as a fair value hedge, cash flow hedge or a hedge of a net investment in a foreign operation. TheCompany formally documents all relationships between hedging instruments and hedged items, as well as its riskmanagement objectives and strategies for undertaking various hedge transactions. The Company formallyassesses, both at inception and at least quarterly thereafter, whether the derivatives that are used in hedgingtransactions are highly effective in offsetting changes in either the fair value or cash flows of the hedged item. Ifa derivative ceases to be a highly effective hedge, the Company discontinues hedge accounting. The Companyaccounts for its derivative instruments that are not designated as hedges at fair value with changes in fair valuerecorded in earnings. The Company does not enter into derivative instruments for speculation or tradingpurposes.
109

LIVE NATION, INC.
NOTES TO CONSOLIDATED FINANCIAL STATEMENTS—(Continued)
For derivative instruments that are designated and qualify as a cash flow hedge (i.e., hedging the exposure tovariability in expected future cash flows that is attributable to a particular risk), the effective portion of the gainor loss on the derivative instrument is reported as a component of other comprehensive income (loss) andreclassified into earnings in the same line item associated with the forecasted transaction in the same period orperiods during which the hedged transaction affects earnings (for example, in interest expense when the hedgedtransactions are interest cash flows associated with floating-rate debt). The remaining gain or loss on thederivative instrument in excess of the cumulative change in the present value of future cash flows of the hedgeditem, if any, is recognized in other expense (income)—net in current earnings during the period of change.
At December 31, 2008, the Company has six interest rate swap agreements, four of which are designated ascash flow hedges for accounting purposes, which include swaps and combinations of interest rate caps and floors,with a total notional amount of $312.5 million, to effectively convert a portion of its floating-rate debt to a fixed-rate basis. One of these swap agreements is a forward swap with a notional amount of $162.5 million and aneffective date of March 31, 2009. The principal objective of these contracts is to eliminate or reduce thevariability of the cash flows in interest payments associated with the Company’s variable rate debt, thus reducingthe impact of interest rate changes on future interest expense. Approximately 75% of the Company’s outstandingterm loans under the senior secured credit facility had their interest payments designated as the hedged forecastedtransactions against the interest rate swap agreements at December 31, 2008. During the years endedDecember 31, 2008, 2007 and 2006, the Company recorded an unrealized loss of $10.9 million and $1.5 millionand an unrealized gain of $0.3 million, respectively, as a component of other comprehensive income (loss) andrecorded no ineffectiveness related to these hedges. Based on the current interest rate expectations, the Companyestimates that approximately $6.6 million of this loss in other comprehensive income (loss) will be reclassifiedinto earnings in the next 12 months as an adjustment to interest expense.
The Company has recorded a gain (loss) and related asset (liability) related to these derivative instrumentsduring the year as follows:
2008 2007
(in thousands)
Balance at beginning of year . . . . . . . . . . . . . . . . . . . . . . . . . . . . . . . . $ (1,784) $ 104Unrealized loss on cash flow derivatives . . . . . . . . . . . . . . . . . . . . . . . (10,900) (1,537)Realized loss (gain) on cash flow derivatives . . . . . . . . . . . . . . . . . . . 1,806 (351)
Balance at end of year . . . . . . . . . . . . . . . . . . . . . . . . . . . . . . . . . . . . . $(10,878) $(1,784)
The Company has an interest rate swap agreement to convert a portion of AMG’s long-term debt fromfloating-rate debt to a fixed-rate basis with a notional amount of $18.4 million. Additionally, in connection withthe financing of the redevelopment of the O2 Dublin, the Company has an interest rate swap agreement with anotional amount of $22.6 million. These interest rate swap agreements have not been designated as hedginginstruments. Therefore, any change in fair value is recorded in earnings during the period of the change. Thechange in fair value of these instruments for the year ended December 31, 2008 was a loss of $1.3 million. Thechange in fair value was not significant to the Company’s results of operations for the year ended December 31,2007. The liability at December 31, 2008 and 2007 was $1.2 million and $0.2 million, respectively, related tothese swap agreements.
The Company’s 2.875% convertible senior notes issued in July 2007 include certain provisions which arebifurcated from the notes and accounted for as derivative instruments. At the date of issuance and as ofDecember 31, 2008, the fair value of these provisions is considered de minimis.
110

LIVE NATION, INC.
NOTES TO CONSOLIDATED FINANCIAL STATEMENTS—(Continued)
The Company has guaranteed a minimum value of its stock that was granted under certain contractualarrangements in 2007. The Company guarantees that the gross proceeds realized by the holder on the sale of theshares will not be less than an agreed upon fixed value. Settlement will occur with the counterparty within atwo-year period unless other criteria are met. The Company has determined the guarantee to be a derivative,established a fair value at the inception of the contract and continues to update the valuation each reportingperiod. The Company uses a binomial lattice model to value the guarantee. At December 31, 2008 and 2007, thefair value of this guarantee is $18.3 million and $10.5 million, respectively, and is included in current liabilitiesas of December 31, 2008 and 2007. The change in value of this guarantee is recorded as a component ofdepreciation and amortization expense as the guarantee was entered into in connection with the acquisition of acontract rights intangible asset.
Occasionally, the Company will use forward currency contracts to reduce its exposure to foreign currencyrisk. The principal objective of such contracts is to minimize the risks and/or costs associated with artist feecommitments. At December 31, 2008, the Company has forward currency contracts outstanding with a notionalamount of $10.1 million. The change in fair value of these instruments from date of purchase throughDecember 31, 2008 was a loss of approximately $0.7 million recorded in the Company’s results of operations.These forward currency contracts have not been designated as hedging instruments.
NOTE 10—FAIR VALUEMEASUREMENTS
The Company adopted Statement 157 and Statement 159 on January 1, 2008. Statement 157 outlines avaluation framework and creates a fair value hierarchy in order to increase the consistency and comparability offair value measurements. Statement 157 defines fair value as the price that would be received to sell an asset orpaid to transfer a liability in an orderly transaction between market participants at the measurement date (an exitprice). Under Statement 159, entities can elect to measure certain eligible financial instruments and certain otheritems at fair value, if not already required to be carried at fair value under existing accounting literature. TheCompany did not elect the fair value measurement option under Statement 159 for any of its eligible financialassets or liabilities.
The Company currently has various financial instruments carried at fair value such as marketable securitiesand derivatives, but does not currently have nonfinancial assets and nonfinancial liabilities that are required to bemeasured at fair value on a recurring basis. The Company’s financial assets and liabilities are measured usinginputs from two of the three levels of the fair value hierarchy as defined by Statement 157. For thiscategorization, only inputs that are significant to the fair value are considered. The three levels are defined asfollows:
Level 1 – Inputs are unadjusted quoted prices in active markets for identical assets or liabilities that can beaccessed at the measurement date.
Level 2 – Inputs include quoted prices for similar assets and liabilities in active markets, quoted prices foridentical or similar assets or liabilities in markets that are not active, inputs other than quoted prices that areobservable for the asset or liability (i.e., interest rates, yield curves, etc.), and inputs that are derived principallyfrom or corroborated by observable market data by correlation or other means (market corroborated inputs).
Level 3 – Unobservable inputs that reflect assumptions about what market participants would use in pricingthe asset or liability. These inputs would be based on the best information available, including the Company’sown data.
111

LIVE NATION, INC.
NOTES TO CONSOLIDATED FINANCIAL STATEMENTS—(Continued)
In accordance with the fair value hierarchy described above, the following table shows the fair value of theCompany’s financial assets and liabilities that are required to be measured at fair value as of December 31, 2008,which are classified as other long-term assets, other current liabilities and other long-term liabilities:
Recurring Fair Value MeasuresFair Value Measurementsat December 31, 2008
Level 1 Level 2 Level 3 Total
(in thousands)
Assets:Investment in Rabbi Trust . . . . . . . . . . . . . . . . . . . . . . . . . . . . . . . . . . $2,133 $ — $— $ 2,133
Total . . . . . . . . . . . . . . . . . . . . . . . . . . . . . . . . . . . . . . . . . . . . . . . . . . . $2,133 $ — $— $ 2,133
Liabilities:Forward exchange contracts . . . . . . . . . . . . . . . . . . . . . . . . . . . . . . . . . $ — $ 733 $— $ 733Interest rate swaps . . . . . . . . . . . . . . . . . . . . . . . . . . . . . . . . . . . . . . . . — 12,045 — 12,045Embedded derivatives . . . . . . . . . . . . . . . . . . . . . . . . . . . . . . . . . . . . . — 18,261 — 18,261Other liabilities . . . . . . . . . . . . . . . . . . . . . . . . . . . . . . . . . . . . . . . . . . . 2,133 — — 2,133
Total . . . . . . . . . . . . . . . . . . . . . . . . . . . . . . . . . . . . . . . . . . . . . . . . . . . $2,133 $31,039 $— $33,172
Investments held in Rabbi Trusts include exchange-traded equity securities and mutual funds. Fair valuesfor these investments are based on quoted prices in active markets and are therefore classified within Level 1 ofthe fair value hierarchy. Forward exchange contracts are based on observable market transactions of spot andforward rates. Interest rate swaps include interest rate collars and plain vanilla swaps. Fair values for thesefinancial instruments are based upon inputs corroborated by observable market data with similar tenors.Embedded derivatives include a bifurcated derivative from a contractual arrangement. The fair value of thisinstrument is based upon inputs that are observable in the market. Other liabilities represent deferredcompensation obligations to employees under certain plans. The liabilities related to these plans are adjustedbased on changes in the fair value of the underlying employee-directed investments. Since the employee-directedinvestments are exchange-traded equity securities and mutual funds with quoted prices in active markets, theliabilities are classified within Level 1 of the fair value hierarchy.
112

LIVE NATION, INC.
NOTES TO CONSOLIDATED FINANCIAL STATEMENTS—(Continued)
NOTE 11—COMMITMENTS AND CONTINGENT LIABILITIES
The Company leases office space, certain equipment and some of the venues used in its music and otheroperations. Some of the lease agreements contain renewal options and annual rental escalation clauses (generallytied to the consumer price index), as well as provisions for the payment of utilities and maintenance by theCompany. The Company also has non-cancelable contracts related to minimum performance payments withvarious artists and other event-related costs. In addition, the Company has commitments relating to additions toproperty, plant, and equipment under certain construction commitments for facilities and venues.
As of December 31, 2008, the Company’s future minimum rental commitments under non-cancelableoperating lease agreements with terms in excess of one year, minimum payments under non-cancelable contractsin excess of one year and capital expenditure commitments consist of the following:
Non-CancelableOperating Leases
Non-CancelableContracts
CapitalExpenditures
(in thousands)
2009 . . . . . . . . . . . . . . . . . . . . . . . . . . . . . . . . . . . . . . $ 77,863 $489,253 $ 8,8462010 . . . . . . . . . . . . . . . . . . . . . . . . . . . . . . . . . . . . . . 72,378 67,984 2,5002011 . . . . . . . . . . . . . . . . . . . . . . . . . . . . . . . . . . . . . . 69,933 34,731 —2012 . . . . . . . . . . . . . . . . . . . . . . . . . . . . . . . . . . . . . . 68,550 131,080 —2013 . . . . . . . . . . . . . . . . . . . . . . . . . . . . . . . . . . . . . . 65,009 42,149 —Thereafter . . . . . . . . . . . . . . . . . . . . . . . . . . . . . . . . . 740,256 201,893 —
Total . . . . . . . . . . . . . . . . . . . . . . . . . . . . . . . . . . . . . $1,093,989 $967,090 $11,346
Commitment amounts for non-cancelable operating leases and non-cancelable contracts which stipulate anincrease in the commitment amount based on an inflationary index have been estimated using an inflation factorof 3% for North America and 1.75% for the United Kingdom.
Excluded from the non-cancelable contracts is $120.8 million related to minimum severance obligations forall employment contracts calculated as if all such employees were terminated on January 1, 2009.
Minimum rentals of $109.2 million to be received in years 2009 through 2020 under non-cancelablesubleases are excluded from the commitment amounts in the above table.
Total rent expense charged to operations for 2008, 2007 and 2006 was $100.5 million, $92.3 million and$66.2 million, respectively. In addition to the minimum rental commitments included in the table above, theCompany has leases, including a capital lease entered into during 2007, that contain contingent paymentrequirements for which payments vary depending on revenue, tickets sold or other variables. Contingent rentexpense charged to operations for 2008, 2007 and 2006 was $18.8 million, $17.0 million and $11.5 million,respectively. The above does not include rent expense for events in third-party venues.
During 2006, in connection with the Company’s acquisition of Historic Theatre Group, the Companyguaranteed obligations related to a lease agreement. In the event of default, the Company could be liable forobligations which have future lease payments (undiscounted) of approximately $29.4 million through the end of2035. The scheduled future minimum rentals for this lease for the years 2009 through 2013 are $1.6 million eachyear. The venues under the lease agreement were included in the sale of the Company’s North Americantheatrical business. The Company entered into an Assumption Agreement with the buyer in connection with thesale, under which the buyer is assuming the Company’s obligations under the guaranty, however we remaincontingently liable to the lessor. The Company believes that the likelihood of a material liability being triggered
113

LIVE NATION, INC.
NOTES TO CONSOLIDATED FINANCIAL STATEMENTS—(Continued)
under this lease is remote, and no liability has been accrued for these contingent lease obligations as ofDecember 31, 2008.
As of December 31, 2008 and 2007, the Company guaranteed the debt of third parties of approximately$2.2 million and $2.8 million, respectively, primarily related to maximum credit limits on employee and tour-related credit cards and bank lines of credit of a nonconsolidated affiliate and a third-party promoter.
Certain agreements relating to acquisitions provide for purchase price adjustments and other futurecontingent payments based on the financial performance of the acquired companies. The Company will accrueadditional amounts related to such contingent payments if and when it is determinable that the applicablefinancial performance targets will be met. The aggregate of these contingent payments, if performance targets aremet, would not significantly impact the financial position or results of operations of the Company.
The Company was a defendant in a lawsuit filed by Malinda Heerwagen on June 13, 2002, in the U.S.District Court for the Southern District of New York. The plaintiff, on behalf of a putative class consisting ofcertain concert ticket purchasers, alleged that anti-competitive practices for concert promotion services by theCompany nationwide caused artificially high ticket prices. On August 11, 2003, the Court ruled in theCompany’s favor, denying the plaintiff’s class certification motion. The plaintiff appealed this decision to theU.S. Court of Appeals for the Second Circuit. On January 10, 2006, the U.S. Court of Appeals for the SecondCircuit affirmed the ruling in the Company’s favor by the District Court. On January 17, 2006, the plaintiff fileda Notice of Voluntary Dismissal of her action in the Southern District of New York.
The Company is a defendant in twenty-two putative class actions filed by different named plaintiffs invarious U.S. District Courts throughout the country. The claims made in these actions are substantially similar tothe claims made in the Heerwagen action discussed above, except that the geographic markets alleged areregional, statewide or more local in nature, and the members of the putative classes are limited to individualswho purchased tickets to concerts in the relevant geographic markets alleged. The plaintiffs seek unspecifiedcompensatory, punitive and treble damages, declaratory and injunctive relief and costs of suit, includingattorneys’ fees. The Company has filed its answers in some of these actions, and has denied liability. OnDecember 5, 2005, the Company filed a motion before the Judicial Panel on Multidistrict Litigation to transferthese actions and any similar ones commenced in the future to a single federal district court for coordinatedpre-trial proceedings. On April 17, 2006, the Panel granted the Company’s motion and ordered the consolidationand transfer of the actions to the U.S. District Court for the Central District of California. On June 4, 2007, theCourt conducted a hearing on the plaintiffs’ motion for class certification. On June 25, 2007, the Court entered anorder to stay all proceedings in the case pending the Court’s ruling on the plaintiffs’ motion for classcertification. On October 22, 2007, the Court ruled in the plaintiffs’ favor, granting the plaintiffs’ motion forclass certification and certifying a class in the Chicago, New England, New York/New Jersey, Colorado andSouthern California regional markets. On November 5, 2007, the Company filed a Petition for Permission toAppeal from Order Granting Class Certification with the U.S. District Court of Appeals for the Ninth Circuit. Ata status conference conducted on November 5, 2007, the U.S. District Court extended its stay of all proceedingspending further developments in the U.S. Court of Appeals for the Ninth Circuit. On February 15, 2008, the U.S.Court of Appeals for the Ninth Circuit issued an order denying the Company’s Petition for Permission to Appeal.On February 20, 2008, the Company filed a Motion with the U.S. District Court for Reconsideration of itsOctober 22, 2007 order granting the plaintiffs’ motion for class certification. On March 6, 2008, the U.S. DistrictCourt entered an order approving a stipulated continuance and stay of all proceedings pending furtherdevelopments in the U.S. Court of Appeals for the Ninth Circuit. A ruling by the U.S. District Court on theCompany’s Motion for Reconsideration of the October 22, 2007 class certification order is pending. TheCompany intends to vigorously defend all claims in all of the actions.
114

LIVE NATION, INC.
NOTES TO CONSOLIDATED FINANCIAL STATEMENTS—(Continued)
The Company is also currently involved in certain other legal proceedings and accrues its best estimate ofthe probable settlement or other losses for the resolution of these claims as selling, general and administrativeexpenses and corporate expenses. These estimates have been developed in consultation with counsel and arebased upon an analysis of potential results, assuming a combination of litigation and settlement strategies. It ispossible, however, that future results of operations for any particular period could be materially affected bychanges in the Company’s assumptions or the effectiveness of its strategies related to these proceedings.
During 2006, the Company reversed $7.0 million of certain pre-acquisition contingencies related to legalmatters which were resolved during the year. As resolution of the legal matters occurred beyond the one-yearpurchase price allocation period, this reversal was recorded to selling, general and administrative expenses inother operations.
NOTE 12—RELATED-PARTY TRANSACTIONS
Relationship with Clear Channel
Tax Matters Agreement
The tax matters agreement governs the respective rights, responsibilities and obligations of Clear Channeland the Company with respect to tax liabilities and benefits, tax attributes, tax contests and other mattersregarding income taxes, non-income taxes and preparing and filing tax returns, as well as with respect to anyadditional taxes incurred by the Company attributable to actions, events or transactions relating to the Company’sstock, assets or business following the Separation, including taxes imposed if the Separation fails to qualify fortax-free treatment under Section 355 of the Internal Revenue Code of 1986, as amended, or if Clear Channel isnot able to recognize certain losses.
Transactions with Clear Channel Directors
The Company has two non-employee directors as of December 31, 2008 on its board of directors that arealso directors and executive officers of Clear Channel. These two directors receive directors’ fees, stock optionsand restricted stock awards as do other non-employee members of the Company’s board of directors.
Transactions with Clear Channel
From time to time, the Company purchases advertising from Clear Channel and its subsidiaries in theordinary course of business. For the years ended December 31, 2008, 2007 and 2006, the Company recorded$13.2 million, $10.3 million and $12.7 million, respectively, as components of direct operating expenses andselling, general and administrative expenses for these advertisements.
Pursuant to a transition services agreement, subsequent to the Separation, Clear Channel provided to theCompany certain corporate and information technology services. As of December 31, 2008, there are no servicesthat Clear Channel continues to provide for the Company and no expense was recorded for the year endedDecember 31, 2008. For the years ended December 31, 2007 and 2006, the Company recorded an aggregate of$2.0 million and $4.9 million, respectively, for these services as components of selling, general andadministrative expenses and corporate expenses.
In connection with the Separation, the Company entered into various lease and licensing agreements withClear Channel primarily for office space occupied by the Company’s employees. For the years endedDecember 31, 2008, 2007 and 2006, the Company recorded $0.8 million, $0.7 million and $0.7 million,respectively, of expense as a component of selling, general and administrative expenses related to theseagreements.
115

LIVE NATION, INC.
NOTES TO CONSOLIDATED FINANCIAL STATEMENTS—(Continued)
Other Relationships
Transactions with Directors
Through a stock purchase agreement in September 2007, the Company completed the purchase of all of theequity interests in CPI and related companies and subsidiaries (collectively, the “CPI Companies”) that theCompany did not already own. Michael Cohl, a director of Live Nation at the time, owned both a direct and anindirect ownership interest in the CPI Companies at the time of the completion of this purchase. The CPICompanies and the Company concurrently entered into a services agreement with KSC Consulting (Barbados)Inc. (“KSC”) which provided for the executive services of Mr. Cohl, pursuant to which Mr. Cohl served as ChiefExecutive Officer of the CPI Companies and Chairman and Chief Executive Officer of the Company’s formerLive Nation Artists division for a term of five years. In June 2008, the parties entered into an amendment to theservices agreement, under which Mr. Cohl will perform consulting services for the Company through June 2012.In connection with this amendment, the Company paid KSC a lump-sum payment of $4.5 million as full paymentfor Mr. Cohl’s services under the consulting engagement. As part of that amendment, Mr. Cohl resigned as adirector of the Company and from all offices he held with the Company. For the year ended December 31, 2008,2007 and 2006, KSC was paid $0.8 million, $1.2 million and $0.6 million, respectively, under the originalservices agreement. In addition, in March 2008, KSC was awarded a bonus of 41,220 shares of the Company’scommon stock that were issued in April 2008.
Other Related Parties
During the year ended December 31, 2008, the Company paid $10.6 million in connection with threeacquisitions of companies owned by various members of management of the Company’s subsidiaries. Two ofthese acquisitions were of companies that held leases of venues and the third acquisition related to a companythat promotes a festival.
The Company conducts certain transactions in the ordinary course of business with companies that areowned, in part or in total, by various members of management of the Company’s subsidiaries or companies overwhich the Company has significant influence. These transactions primarily relate to venue rentals, including arental advance in 2008, concession services, equipment rental, ticketing and other services and reimbursement ofcertain costs. Expenses of $20.2 million, $11.1 million and $7.5 million were incurred for the years endedDecember 31, 2008, 2007 and 2006, respectively, and revenue of $2.3 million, $0.8 million, and $0.4 millionwere earned for the years ended December 31, 2008, 2007 and 2006, respectively, from these companies forservices rendered or provided in relation to these business ventures.
None of these transactions were with directors or executive officers of the Company.
116

LIVE NATION, INC.
NOTES TO CONSOLIDATED FINANCIAL STATEMENTS—(Continued)
NOTE 13—INCOME TAXES
Significant components of the provision for income tax expense (benefit) are as follows:
2008 2007 2006
(in thousands)
Current—federal . . . . . . . . . . . . . . . . . . . . . . . . . . . . . . . . . . . . . . . . . . . . . . . . . . $(47,625) $(22,924) $(13,989)Current—foreign . . . . . . . . . . . . . . . . . . . . . . . . . . . . . . . . . . . . . . . . . . . . . . . . . 24,524 31,300 21,739Current—state . . . . . . . . . . . . . . . . . . . . . . . . . . . . . . . . . . . . . . . . . . . . . . . . . . . (956) (2,751) 518
Total current . . . . . . . . . . . . . . . . . . . . . . . . . . . . . . . . . . . . . . . . . . . . . . . . . (24,057) 5,625 8,268Deferred—federal . . . . . . . . . . . . . . . . . . . . . . . . . . . . . . . . . . . . . . . . . . . . . . . . . 2,741 10,459 10,370Deferred—foreign . . . . . . . . . . . . . . . . . . . . . . . . . . . . . . . . . . . . . . . . . . . . . . . . 5,391 (4,155) (36)Deferred—state . . . . . . . . . . . . . . . . . . . . . . . . . . . . . . . . . . . . . . . . . . . . . . . . . . — 1,345 —
Total deferred . . . . . . . . . . . . . . . . . . . . . . . . . . . . . . . . . . . . . . . . . . . . . . . . 8,132 7,649 10,334
Income tax expense (benefit) . . . . . . . . . . . . . . . . . . . . . . . . . . . . . . . . . . . . . . . . $(15,925) $ 13,274 $ 18,602
Current income tax expense decreased $29.7 million for the year ended December 31, 2008 as compared tothe same period of the prior year due principally to the recognition of tax benefits for losses in the United Statesduring 2008 for which the Company could not recognize tax benefits in the prior year. For all periods presented,the Company recorded current benefits in continuing operations for federal income tax purposes resulting fromthe use of current period losses against gains and income from discontinued operations. Current income taxexpense decreased $2.6 million for the year ended December 31, 2007 as compared to the same period of theprior year primarily due to tax losses for which tax benefits are recognized.
Deferred tax expense increased $0.5 million for the year ended December 31, 2008 as compared to the sameperiod of the prior year due principally to utilization of foreign deferred tax assets. Deferred tax expensedecreased $2.7 million for the year ended December 31, 2007 as compared to the same period of the prior yeardue principally to less utilization of deferred tax assets.
The domestic loss from continuing operations before income taxes was $414.9 million, $132.5 million and$79.1 million for 2008, 2007 and 2006, respectively. The foreign income from continuing operations beforeincome taxes was $72.6 million, $92.9 million and $54.3 million for 2008, 2007 and 2006, respectively.
117

LIVE NATION, INC.
NOTES TO CONSOLIDATED FINANCIAL STATEMENTS—(Continued)
Significant components of the Company’s deferred tax liabilities and assets as of December 31, 2008 and2007 are as follows:
2008 2007
(in thousands)
Deferred tax liabilities:Intangible assets . . . . . . . . . . . . . . . . . . . . . . . . . . . . . . . . . . . . . . . . . . . . $109,667 $ 14,017Prepaid expenses . . . . . . . . . . . . . . . . . . . . . . . . . . . . . . . . . . . . . . . . . . . . 1,696 5,285Long-term debt . . . . . . . . . . . . . . . . . . . . . . . . . . . . . . . . . . . . . . . . . . . . . 32,225 29,213Other . . . . . . . . . . . . . . . . . . . . . . . . . . . . . . . . . . . . . . . . . . . . . . . . . . . . . 1,112 3,758
Total deferred tax liabilities . . . . . . . . . . . . . . . . . . . . . . . . . . . . . . . . . . . . . . . 144,700 52,273Deferred tax assets:
Intangible and fixed assets . . . . . . . . . . . . . . . . . . . . . . . . . . . . . . . . . . . . 145,632 86,148Accrued expenses . . . . . . . . . . . . . . . . . . . . . . . . . . . . . . . . . . . . . . . . . . . 16,524 19,106Investments in nonconsolidated affiliates . . . . . . . . . . . . . . . . . . . . . . . . . 5,309 5,309Net operating loss carryforwards . . . . . . . . . . . . . . . . . . . . . . . . . . . . . . . 124,082 157,800Bad debt reserves . . . . . . . . . . . . . . . . . . . . . . . . . . . . . . . . . . . . . . . . . . . 2,462 5,388Deferred income . . . . . . . . . . . . . . . . . . . . . . . . . . . . . . . . . . . . . . . . . . . . 7,554 7,554Other . . . . . . . . . . . . . . . . . . . . . . . . . . . . . . . . . . . . . . . . . . . . . . . . . . . . . 14,413 5,720
Total gross deferred tax assets . . . . . . . . . . . . . . . . . . . . . . . . . . . . . . . . . . . . . 315,976 287,025Valuation allowance . . . . . . . . . . . . . . . . . . . . . . . . . . . . . . . . . . . . . . . . . . . . . 206,754 246,708
Total deferred tax assets . . . . . . . . . . . . . . . . . . . . . . . . . . . . . . . . . . . . . . . . . . 109,222 40,317
Net deferred tax assets (liabilities) . . . . . . . . . . . . . . . . . . . . . . . . . . . . . . . . . . $ (35,478) $ (11,956)
The valuation allowance was recorded due to the uncertainty of the ability to generate sufficient taxableincome necessary to realize certain deferred tax assets in future years. If, at a later date, it is determined that dueto a change in circumstances, the Company will utilize all or a portion of those deferred tax assets, the Companywill reverse the corresponding valuation allowance with the offset to income tax benefit or to goodwill.
During 2008, the Company recorded deferred tax liabilities of $29.0 million due principally to differences infinancial reporting and tax bases in assets acquired in business combinations and artist rights agreements. TheCompany also recorded deferred tax assets of $51.6 million in connection with the Company’s goodwillimpairment charge. These deferred tax assets account for the principal change of the net $23.5 million increase inthe Company’s net deferred tax liabilities. The Company recorded a $13.3 million decrease to valuationallowances established in connection with the HOB business combination. Also, during 2008, the Companyrecorded a $4.1 million reversal of deferred tax liabilities in connection with the impairment of goodwill.
During 2007, settlements were reached with the Internal Revenue Service concerning tax matters involvingcertain of the Company’s fixed assets. The settlements resulted in an increase in depreciable tax basis in fixedassets and a related deferred tax asset of $38.2 million. The Company has provided a full valuation reserveagainst that deferred tax asset resulting from the Company’s current assessment that it is more likely than not thatthe deferred tax asset will not be realized.
Deferred tax assets related to intangibles and fixed assets principally relate to differences in book and taxbasis of tax deductible goodwill created from the Company’s various stock acquisitions. In accordance withStatement 142, the Company no longer amortizes goodwill. Thus, a deferred tax benefit for the differencebetween book and tax amortization for the Company’s tax-deductible goodwill is no longer recognized, as these
118

LIVE NATION, INC.
NOTES TO CONSOLIDATED FINANCIAL STATEMENTS—(Continued)
assets are no longer amortized for book purposes. As the Company continues to amortize its tax basis in its taxdeductible goodwill, the deferred tax asset will decrease over time. As of December 31, 2008, the Company hasU.S. federal and state deferred tax assets related to net operating loss carryforwards of $94.2 million and $20.0million, respectively. Based on current statutory carryforward periods, these losses will expire on various datesbetween the years 2009 and 2028. The amounts of U.S. net operating loss carryforwards that will expire if notutilized are $25.6 million and $8.1 million by 2009 and 2010, respectively. The Company’s federal net operatingloss is subject to statutory limitations on the amount that can be used in any given year.
As a result of the adoption of FSP APB 14-1, the Company established a deferred tax liability of $27.9million as of the issuance date of the convertible notes in 2007 related to the deferred tax effects resulting fromthe recording of the equity component of the Company’s convertible notes and related transaction costs. TheCompany also recorded deferred tax liabilities of $3.0 million and $1.3 million in the 2008 and 2007 balancesheets, respectively, related to interest expense deductions for tax purposes on the equity component of theCompany’s convertible notes.
The reconciliation of income tax from continuing operations computed at the United States federal statutorytax rates to income tax expense (benefit) is:
2008 2007 2006
(in thousands)
Income tax expense (benefit) at statutory rates . . . . . . . . . . . . . . . . . . . . . . . . . . $(119,821) $(13,859) $ (8,693)State income taxes, net of federal tax benefit . . . . . . . . . . . . . . . . . . . . . . . . . . . (956) (2,751) (2,393)Differences of foreign taxes from U.S. statutory rates . . . . . . . . . . . . . . . . . . . . (5,005) (4,970) (7,048)Nondeductible goodwill impairment . . . . . . . . . . . . . . . . . . . . . . . . . . . . . . . . . . 50,190 — —Nondeductible items . . . . . . . . . . . . . . . . . . . . . . . . . . . . . . . . . . . . . . . . . . . . . . 8,575 13,608 10,310Tax contingencies . . . . . . . . . . . . . . . . . . . . . . . . . . . . . . . . . . . . . . . . . . . . . . . . 5,545 793 3,641Change in valuation allowance . . . . . . . . . . . . . . . . . . . . . . . . . . . . . . . . . . . . . . 53,035 28,301 26,124Other, net . . . . . . . . . . . . . . . . . . . . . . . . . . . . . . . . . . . . . . . . . . . . . . . . . . . . . . . (7,488) (7,848) (3,339)
$ (15,925) $ 13,274 $18,602
During 2008, the Company recorded tax benefits of approximately $15.9 million on loss from continuingoperations before tax of $342.3 million. Income tax benefit is principally attributable to the Company’srecognition of tax losses from operations in the United States. Nondeductible items consist principally ofnondeductible goodwill impairments. State tax benefit is attributable to losses in domestic operations. TheCompany continually reassesses its ability to realize deferred tax assets. In connection with that assessment,during 2008, the Company recorded a valuation allowance of $53.0 million against certain deferred tax assets.
During 2007, the Company recorded tax expense of approximately $13.3 million on loss from continuingoperations before tax of $39.6 million. During 2006 the Company determined that it may not be able to realizecertain deferred tax assets in the future and as a result of that determination the Company recorded a netvaluation allowance of approximately $26.1 million in 2006. In addition, the Company established $84.6 millionof additional valuation allowance in 2006 in connection with its acquisition of HOB.
The Company regularly assesses the likelihood of additional assessments in each taxing jurisdictionresulting from current and subsequent years’ examinations. Liabilities for income taxes have been established forfuture income tax assessments when it is probable there will be future assessments and the amount thereof can bereasonably estimated. Once established, liabilities for uncertain tax positions are adjusted only when there ismore information available or when an event occurs necessitating a change to the liabilities. The Company
119

LIVE NATION, INC.
NOTES TO CONSOLIDATED FINANCIAL STATEMENTS—(Continued)
believes that the resolution of income tax matters for open years will not have a material effect on itsconsolidated and combined financial statements although the resolution of income tax matters could impact theCompany’s effective tax rate for a particular future period.
In June 2006, the FASB issued FIN 48, which became effective for the Company on January 1, 2007.FIN 48 prescribes a recognition threshold and a measurement attribute for the financial statement recognition andmeasurement of tax positions taken or expected to be taken in a tax return. For those benefits to be recognized, atax position must be more likely than not to be sustained upon examination by taxing authorities. The amountrecognized is measured as the largest amount of benefit that is greater than 50% likely of being realized uponultimate settlement. As a result of the adoption of FIN 48, the Company recognized no material adjustment in theliability for unrecognized income tax benefits. At the adoption date on January 1, 2007, the Company had $21.9million of unrecognized tax benefits, the majority of which would affect the Company’s effective tax rate ifrecognized. At December 31, 2008 and December 31, 2007, the Company had $22.0 million and $24.2 million ofunrecognized tax benefits, respectively. This change in unrecognized income tax benefits relates to current andpre-2008 uncertain tax positions, additional interest accruals, as described below, and currency fluctuations. Theamount of these unrecognized tax benefits which would favorably impact the effective tax rate if recognized atsome point in the future is $18.6 million.
The Company recognizes interest and penalties related to uncertain tax positions in income tax expense. Forthe year ended December 31, 2008, the Company has recognized $1.1 million of interest and penalties related touncertain tax positions. As of December 31, 2008, the Company has approximately $2.9 million of accruedinterest related to uncertain tax positions.
The tax years 2002 through 2008 remain open to examination by the major tax jurisdictions to which theCompany is subject.
The following table summarizes the activity related to the Company’s unrecognized tax benefits for the yearended December 31, 2008 and 2007:
2008 2007
(in thousands)
Balance at January 1 . . . . . . . . . . . . . . . . . . . . . . . . . . . . . . . . . . . . . . . . . . . . . . . . . . . . . . . . . $24,201 $22,935Additions:
Tax for current year positions . . . . . . . . . . . . . . . . . . . . . . . . . . . . . . . . . . . . . . . . . . . . . . 4,480 3,796Tax for prior year positions . . . . . . . . . . . . . . . . . . . . . . . . . . . . . . . . . . . . . . . . . . . . . . . . — 68Interest and penalties for prior years . . . . . . . . . . . . . . . . . . . . . . . . . . . . . . . . . . . . . . . . . 1,162 1,278
Reductions:Settlements for prior year positions . . . . . . . . . . . . . . . . . . . . . . . . . . . . . . . . . . . . . . . . . (96) (3,737)
Foreign currency . . . . . . . . . . . . . . . . . . . . . . . . . . . . . . . . . . . . . . . . . . . . . . . . . . . . . . . . . . . . (7,795) (139)
Balance at December 31 . . . . . . . . . . . . . . . . . . . . . . . . . . . . . . . . . . . . . . . . . . . . . . . . . . . . . . $21,952 $24,201
120

LIVE NATION, INC.
NOTES TO CONSOLIDATED FINANCIAL STATEMENTS—(Continued)
NOTE 14—STOCKHOLDERS’ EQUITY
Dividends
The Company presently intends to retain future earnings, if any, to finance the expansion of its business.Therefore, it does not expect to pay any cash dividends in the foreseeable future. Moreover, the terms of theCompany’s senior secured credit facility and the designations of its preferred stock limit the amount of fundswhich the Company will have available to declare and distribute as dividends on its common stock. Payment offuture cash dividends, if any, will be at the discretion of the Company’s board of directors in accordance withapplicable law after taking into account various factors, including the financial condition, operating results,current and anticipated cash needs, plans for expansion and contractual restrictions with respect to the paymentof dividends.
Common Stock Reserved for Future Issuance
Common stock of approximately 9.0 million shares is reserved for future issuances under the stock incentiveplan (including 4.9 million options and 1.4 million restricted stock awards currently granted).
Share Repurchase Program
On December 22, 2005, the Company’s board of directors authorized a $150.0 million share repurchaseprogram effective as of that date. The repurchase program was authorized through December 31, 2006 and nosuch program was authorized for 2007 or 2008. As of the expiration of the program on December 31, 2006,3.4 million shares had been repurchased for an aggregate cost of $42.7 million, including commissions and fees.
Earnings per Share
The Company computes net income per common share in accordance with FASB Statement of FinancialAccounting Standards No. 128, Earnings per Share (“Statement 128”) under the two-class method. Under theprovisions of Statement 128, basic net income per common share is computed by dividing the net incomeapplicable to common shares by the weighted average number of common shares outstanding during the period.Diluted net income per common share adjusts basic net income per common share for the effects of stockoptions, restricted stock and other potentially dilutive financial instruments only in the periods in which sucheffect is dilutive. In July 2007, the Company issued $220 million of 2.875% convertible notes which areconsidered in the calculation of diluted net income per common share, if dilutive. Dilutive securities atDecember 31, 2008, 2007 and 2006 include 994,372, 927,697 and 360,861 shares of nonvested restricted stock,respectively. The nonvested restricted stockholders are entitled to participate in dividends declared on commonstock as if the shares were fully vested. As a result, for purposes of calculating basic earnings per common share,income attributable to nonvested restricted stockholders is excluded from net income. As the Company had a netloss for the years ended December 31, 2008, 2007 and 2006, no loss has been allocated to the nonvestedrestricted stockholders.
121

LIVE NATION, INC.
NOTES TO CONSOLIDATED FINANCIAL STATEMENTS—(Continued)
The following table sets forth the computation of basic and diluted net loss from continuing operations percommon share:
For the year ended December 31,
2008 2007 2006
(in thousands, except per share data)
Loss from continuing operations attributable to commonstockholders—basic . . . . . . . . . . . . . . . . . . . . . . . . . . . . . $(328,008) $(60,741) $(55,647)
Effect of dilutive securities:Income attributable to nonvested restricted stockholders . . — — —2.875% convertible senior notes . . . . . . . . . . . . . . . . . . . . . — — —
Total loss from continuing operations —diluted . . . . . . . . . . . . . $(328,008) $(60,741) $(55,647)
Weighted average common shares—basic . . . . . . . . . . . . . . 76,228 68,441 64,853Effect of dilutive securities:Stock options, restricted stock and warrants . . . . . . . . . . . . — — —2.875% convertible senior notes . . . . . . . . . . . . . . . . . . . . . — — —
Weighted average common shares—diluted . . . . . . . . . . . . . . . . 76,228 68,441 64,853Loss from continuing operations per common share:
Basic and diluted . . . . . . . . . . . . . . . . . . . . . . . . . . . . . . . . . $ (4.30) $ (0.89) $ (0.85)
The calculation of diluted net loss per common share includes the effects of the assumed exercise of anyoutstanding stock options and warrants, the assumed vesting of shares of restricted stock and the assumedconversion of the 2.875% senior convertible notes where dilutive. For the years ended December 31, 2008, 2007and 2006, the Company has excluded all potentially dilutive securities, such as nonvested restricted stock andoutstanding options and warrants to purchase common stock, from the calculation of diluted net loss per commonshare because such securities are anti-dilutive. For the years ended December 31, 2008, 2007 and 2006, thediluted weighted average common shares outstanding excludes the dilutive effect of 5,304,450, 2,240,000 and80,000 stock options and warrants, respectively, since such options and warrants have an exercise price in excessof the average market price of the Company’s common stock. In addition, for the years ended December 31,2008 and 2007, the diluted weighted average common shares outstanding excludes 8,104,690 and 3,752,582shares, respectively, which represents the dilutive effect of conversion shares related to the Company’s 2.875%convertible senior notes because such securities are anti-dilutive. For the years ended December 31, 2008, 2007and 2006, the diluted weighted average common shares outstanding excludes 547,268, 2,118,495 and 829,128total shares, respectively, which represents the dilutive effect of 6,298,822, 4,885,722 and 2,512,461 stockoptions, warrants and shares of restricted stock, respectively, because these securities were anti-dilutive.
NOTE 15—STOCK-BASED COMPENSATION
In December 2005, the Company adopted its 2005 Stock Incentive Plan. The plan authorizes the Companyto grant stock option awards, director shares, stock appreciation rights, restricted stock and deferred stockawards, other equity-based awards and performance awards. The Company has granted restricted stock awardsand options to purchase its common stock to employees, directors and consultants of the Company and itsaffiliates under the stock incentive plan at no less than the fair market value of the underlying stock on the date ofgrant. The options are granted for a term not exceeding ten years and the nonvested options are forfeited in theevent the employee or director terminates his or her employment or relationship with the Company or one of itsaffiliates. Any options that have vested at the time of termination are forfeited to the extent they are not exercisedwithin the applicable post-employment exercise period provided in their option agreements. These options vest
122

LIVE NATION, INC.
NOTES TO CONSOLIDATED FINANCIAL STATEMENTS—(Continued)
over one to five years. The stock incentive plan contains anti-dilutive provisions that require the adjustment ofthe number of shares of the Company’s common stock represented by, and the exercise price of, each option forany stock splits or stock dividends.
The Company recorded $11.1 million, $16.4 million and $3.3 million of non-cash compensation expenseduring the years ended December 31, 2008, 2007 and 2006, respectively, related to nonvested stock-basedcompensation arrangements for stock options and restricted stock awards. Of these amounts, $4.2 million, $6.3million and $1.7 million was recorded in selling, general and administrative expenses and $6.9 million, $10.1million and $1.6 million was recorded in corporate expenses, respectively. Additionally, $0.1 million wasrecorded in discontinued operations for the year ended December 31, 2007 with no expense recorded for theyears ended December 31, 2008 and 2006. As of December 31, 2008, there was $26.4 million of totalunrecognized compensation cost related to nonvested stock-based compensation arrangements for stock optionsand restricted stock awards. This cost is expected to be recognized over the next four years.
Stock Options
The Company follows the fair value recognition provisions of Statement 123(R). The fair value of theoptions is amortized to expense on a straight-line basis over the options’ vesting period. Stock-basedcompensation expense recognized during the year includes compensation expense for all share-based paymentsgranted on or prior to, but not yet vested at the end of the period, based on the grant date fair value estimated inaccordance with the provisions of Statement 123(R).
Through December 31, 2008, no tax benefits from the exercise of stock options have been recognized. Anyfuture excess tax benefits derived from the exercise of stock options will be recorded prospectively and reportedas cash flows from financing activities in accordance with Statement 123(R).
The fair value for options in Live Nation stock was estimated on the date of grant using a Black-Scholesoption-pricing model. Expected volatilities are based on implied volatilities of traded options and the historicalvolatility of stocks of similar companies since the Company’s common stock does not have sufficient tradinghistory to reasonably predict its own volatility. The Company uses the simplified method for estimating theexpected life within the valuation model which is the period of time that options granted are expected to beoutstanding. The risk free rate for periods within the expected life of the option is based on the U.S. TreasuryNote rate. An estimated rate of 10% is used for expected forfeitures of stock options due to the limited history ofthe Company’s stock option plans. The following assumptions were used to calculate the fair value of theCompany’s options on the date of grant:
2008 2007 2006
Risk-free interest rate . . . . . . . . . . . . . . . . . . . . . . . . . 2.15% - 2.95% 3.63% - 4.88% 4.57% - 4.86%Dividend yield . . . . . . . . . . . . . . . . . . . . . . . . . . . . . . . 0.0% 0.0% 0.0%Volatility factors . . . . . . . . . . . . . . . . . . . . . . . . . . . . . 36.3% - 42.0% 28% 28%Weighted average expected life (in years) . . . . . . . . . 1 - 6.25 5.5 - 7 5 - 7.5
123

LIVE NATION, INC.
NOTES TO CONSOLIDATED FINANCIAL STATEMENTS—(Continued)
The following table presents a summary of the Company’s stock options outstanding at, and stock optionactivity during, the years ended December 31, 2008, 2007 and 2006 (“Price” reflects the weighted averageexercise price per share):
2008 2007 2006
Options Price Options Price Options Price
(in thousands, except per share data)
Outstanding, January 1 . . . . . . . . . . . . . . . . . . . . . . . . . . . 3,881 $18.41 2,152 $11.07 2,078 $10.60Granted . . . . . . . . . . . . . . . . . . . . . . . . . . . . . . . . . . . . 1,324 12.27 2,355 24.09 90 21.88Exercised . . . . . . . . . . . . . . . . . . . . . . . . . . . . . . . . . . (60) 10.60 (44) 10.60 — —Forfeited or expired . . . . . . . . . . . . . . . . . . . . . . . . . . (341) 18.88 (582) 14.88 (16) 10.60
Outstanding, December 31 . . . . . . . . . . . . . . . . . . . . . . . . 4,804 $16.78 3,881 $18.41 2,152 $11.07
Exercisable, December 31 . . . . . . . . . . . . . . . . . . . . . . . . . 907 $17.81 62 $11.35 32 $10.60Weighted average fair value per option granted . . . . . . . . $ 5.72 $ 6.12 $ 3.81
The total intrinsic value of stock options exercised during the year ended December 31, 2008 and 2007 was$0.3 million and $0.6 million, respectively. Cash received from stock option exercises for the year endedDecember 31, 2008 was $0.6 million. The Company did not realize any actual tax benefit from stock optionexercises.
There were 2.7 million shares available for future grants under the stock incentive plan at December 31,2008. Upon share option exercise or vesting of restricted stock, the Company issues new shares to fulfill thesegrants. Vesting dates on the stock options range from March 2009 to September 2012, and expiration dates rangefrom December 2012 to March 2018 at exercise prices and average contractual lives as follows:
Range of Exercise Prices
Outstandingas of
12/31/08(in thousands)
WeightedAverage
RemainingContractual
Life(in years)
WeightedAverageExercisePrice
Exercisableas of
12/31/08
WeightedAverageExercisePrice
WeightedAverage
RemainingContractual
Life(in years)
$10.00 - $14.99 . . . . . . . . . . . . . . . . . . . 2,574 8.0 $11.08 428 $10.83 7.4$15.00 - $19.99 . . . . . . . . . . . . . . . . . . . 385 9.0 $17.83 50 $19.36 8.3$20.00 - $24.99 . . . . . . . . . . . . . . . . . . . 1,845 8.2 $24.51 429 $24.58 8.2
The total intrinsic value of options exercisable as of December 31, 2008 was zero as the exercise priceexceeds the market price.
Restricted Stock Awards
The Company has granted restricted stock awards to its employees and directors under the stock incentiveplan. These common shares carry a legend which restricts their transferability for a term of one to five years andare forfeited in the event the recipient’s employment or relationship with the Company is terminated prior to thelapse of the restriction. In addition, certain restricted stock awards require the Company or the recipient toachieve minimum performance targets in order for these awards to vest. Recipients of the restricted stock awardsare entitled to all cash dividends as of the date the award was granted. The fair value of the restricted stock isamortized to expense on a straight-line basis over the restricted stock’s vesting period. The Company does notassume any forfeitures of restricted stock as awards are limited to a small number of senior management.
124

LIVE NATION, INC.
NOTES TO CONSOLIDATED FINANCIAL STATEMENTS—(Continued)
The following table presents a summary of the Company’s restricted stock awards outstanding atDecember 31, 2008, 2007 and 2006. (“Price” reflects the weighted average share price at the date of grant):
2008 2007 2006
Awards Price Awards Price Awards Price
(in thousands, except per share data)
Outstanding, January 1 . . . . . . . . . . . . . . . . . . . . . . . . . . . . 928 $18.99 361 $12.39 319 $10.60Granted . . . . . . . . . . . . . . . . . . . . . . . . . . . . . . . . . . . . 509 12.28 710 22.53 65 21.12Forfeited . . . . . . . . . . . . . . . . . . . . . . . . . . . . . . . . . . . (142) 19.56 (39) 19.70 (1) 10.60Vested . . . . . . . . . . . . . . . . . . . . . . . . . . . . . . . . . . . . . (301) 18.05 (104) 20.32 (22) 10.60
Outstanding, December 31 . . . . . . . . . . . . . . . . . . . . . . . . . 994 $15.76 928 $18.99 361 $12.39
The total fair market value of the shares issued upon the vesting of restricted stock awards during the yearsended December 31, 2008, 2007 and 2006 was $5.4 million, $2.1 million and $0.2 million, respectively. As ofDecember 31, 2008, there were 150,000 restricted stock awards outstanding which require the Company or therecipient to achieve minimum performance targets in order for the awards to vest.
Bonus Incentives
For 2008 and 2007, the Company entered into arrangements with certain key employees that allows theCompany to issue shares of its common stock in lieu of cash bonus payments. For the year ended December 31,2008, the Company has recorded $20.9 million and $2.1 million of non-cash compensation expense in selling,general and administrative and corporate expenses, respectively, related to bonus incentives to be issued. For theyear ended December 31, 2007, the Company has recorded $11.1 million and $0.8 million of non-cashcompensation expense in selling, general and administrative and corporate expenses, respectively, related tobonus incentives. Additionally, $(0.9) million and $0.9 million was recorded in discontinued operations for theyears ended December 31, 2008 and 2007, respectively. Based on the closing stock price of the Company’scommon stock on December 31, 2008, this would result in the issuance of approximately 3.9 million shares in2009.
Warrants
In April 2008, the Company issued a warrant to purchase 500,000 shares of the Company’s common stockat an exercise price of $13.73 per share in connection with the formation of a joint venture. The warrant vestsover three years in equal installments beginning on the first anniversary of the issuance date. As the counterpartyis not required to provide any future service in order to retain and exercise the warrant, it was expensed at thetime of issuance in selling, general and administrative expenses. The Company valued the warrant at $2.1 millionusing the Black-Scholes valuation model.
NOTE 16—EMPLOYEE SAVINGS PLANS
The Company’s employees are eligible to participate in various 401(k) savings and other plans establishedfor the purpose of providing retirement benefits for substantially all employees. Both the employees and theCompany make contributions to the plan. The Company matches 50% of the employee’s first 5% of paycontributed to the plan. Company matched contributions vest to the employees based upon their years of serviceto the Company.
125

LIVE NATION, INC.
NOTES TO CONSOLIDATED FINANCIAL STATEMENTS—(Continued)
Contributions to these plans of $2.3 million, $1.8 million and $1.6 million were charged to expense for theyears ended December 31, 2008, 2007 and 2006, respectively.
The Company provides a non-qualified deferred compensation plan for highly compensated employees anddirectors. The plan allows employees to defer up to 50% of their annual salary and up to 80% of their bonusbefore taxes and allows directors to defer up to 100% of their compensation. Matching contributions are made atthe sole discretion of the Company’s compensation committee and the Company retains ownership of all assetsuntil distributed and records a liability to the employees. The liability under the deferred compensation plan atDecember 31, 2008 and 2007 was approximately $2.1 million and $2.5 million, respectively, which is recordedin other long-term liabilities.
NOTE 17—OTHER INFORMATION
Included in other expense (income)—net for the year ended December 31, 2006 is income of $5.9 millionrelated to a fee received on the sale of land in Ireland which was sold in April 2006 to the minority interest holderin this entity. This fee was for payment of services provided by the Company in completing the sale since, underthe terms of the original acquisition that included this asset, the Company did not have the rights to theappreciation in the value of this property. The minority interest holder contributed his share of the appreciation inthe value of the land to the entity to fund future expenditures.
For the Year Ended December 31,
2008 2007 2006
(in thousands)
The following details the components of “Other expense (income)—net”:Loss (gain) on sale of investments . . . . . . . . . . . . . . . . . . . . . . . . . . . . . . . . . . $— $ (64) $ 1,659Currency exchange loss . . . . . . . . . . . . . . . . . . . . . . . . . . . . . . . . . . . . . . . . . . 52 902 3,130Other, net . . . . . . . . . . . . . . . . . . . . . . . . . . . . . . . . . . . . . . . . . . . . . . . . . . . . . (80) (985) (5,278)
Total other expense (income)—net . . . . . . . . . . . . . . . . . . . . . . . . . . . . . . . . . . . . . $ (28) $(147) $ (489)
126

LIVE NATION, INC.
NOTES TO CONSOLIDATED FINANCIAL STATEMENTS—(Continued)
As of December 31,
2008 2007
(in thousands)
The following details the components of “Other current assets”:Investments in theatrical productions . . . . . . . . . . . . . . . . . . . . . . . . . . . . . . . . . . . . . . $ — $ 8,778Inventory . . . . . . . . . . . . . . . . . . . . . . . . . . . . . . . . . . . . . . . . . . . . . . . . . . . . . . . . . . . . 18,107 20,188Cash held in escrow . . . . . . . . . . . . . . . . . . . . . . . . . . . . . . . . . . . . . . . . . . . . . . . . . . . . 7,294 12,088Other . . . . . . . . . . . . . . . . . . . . . . . . . . . . . . . . . . . . . . . . . . . . . . . . . . . . . . . . . . . . . . . 3,116 3,668
Total other current assets . . . . . . . . . . . . . . . . . . . . . . . . . . . . . . . . . . . . . . . . . . . . . . . . . . . $ 28,517 $ 44,722
The following details the components of “Other long-term assets”:Prepaid management and booking fees . . . . . . . . . . . . . . . . . . . . . . . . . . . . . . . . . . . . . $ 1,106 $ 11,280Prepaid rent . . . . . . . . . . . . . . . . . . . . . . . . . . . . . . . . . . . . . . . . . . . . . . . . . . . . . . . . . . 20,140 21,289Long-term advances . . . . . . . . . . . . . . . . . . . . . . . . . . . . . . . . . . . . . . . . . . . . . . . . . . . 154,689 53,040Debt issuance costs . . . . . . . . . . . . . . . . . . . . . . . . . . . . . . . . . . . . . . . . . . . . . . . . . . . . 15,812 15,606Other . . . . . . . . . . . . . . . . . . . . . . . . . . . . . . . . . . . . . . . . . . . . . . . . . . . . . . . . . . . . . . . 18,467 19,465
Total other long-term assets . . . . . . . . . . . . . . . . . . . . . . . . . . . . . . . . . . . . . . . . . . . . . . . . . $210,214 $120,680
The following details the components of “Accrued expenses”:Accrued event expenses . . . . . . . . . . . . . . . . . . . . . . . . . . . . . . . . . . . . . . . . . . . . . . . . $ 68,473 $124,868Collections on behalf of others . . . . . . . . . . . . . . . . . . . . . . . . . . . . . . . . . . . . . . . . . . . 56,944 117,165Current deferred tax liabilities . . . . . . . . . . . . . . . . . . . . . . . . . . . . . . . . . . . . . . . . . . . 1,696 5,285Accrued insurance . . . . . . . . . . . . . . . . . . . . . . . . . . . . . . . . . . . . . . . . . . . . . . . . . . . . . 22,120 20,445Accrued royalties . . . . . . . . . . . . . . . . . . . . . . . . . . . . . . . . . . . . . . . . . . . . . . . . . . . . . . 17,639 12,947Accrued payroll and benefits . . . . . . . . . . . . . . . . . . . . . . . . . . . . . . . . . . . . . . . . . . . . . 24,019 20,823Accrued expenses—other . . . . . . . . . . . . . . . . . . . . . . . . . . . . . . . . . . . . . . . . . . . . . . . 188,101 210,103
Total accrued expenses . . . . . . . . . . . . . . . . . . . . . . . . . . . . . . . . . . . . . . . . . . . . . . . . . . . . . $378,992 $511,636
The following details the components of “Other current liabilities”:Contractual advances . . . . . . . . . . . . . . . . . . . . . . . . . . . . . . . . . . . . . . . . . . . . . . . . . . . $ 29,201 $ —Other . . . . . . . . . . . . . . . . . . . . . . . . . . . . . . . . . . . . . . . . . . . . . . . . . . . . . . . . . . . . . . . 35,180 18,348
Total other current liabilities . . . . . . . . . . . . . . . . . . . . . . . . . . . . . . . . . . . . . . . . . . . . . . . . . $ 64,381 $ 18,348
The following details the components of “Other long-term liabilities”:Deferred taxes . . . . . . . . . . . . . . . . . . . . . . . . . . . . . . . . . . . . . . . . . . . . . . . . . . . . . . . . $ 33,782 $ 6,672Unrecognized tax benefits . . . . . . . . . . . . . . . . . . . . . . . . . . . . . . . . . . . . . . . . . . . . . . . 21,952 24,201Deferred revenue . . . . . . . . . . . . . . . . . . . . . . . . . . . . . . . . . . . . . . . . . . . . . . . . . . . . . . 4,536 7,190Accrued rent . . . . . . . . . . . . . . . . . . . . . . . . . . . . . . . . . . . . . . . . . . . . . . . . . . . . . . . . . 44,831 35,691Other . . . . . . . . . . . . . . . . . . . . . . . . . . . . . . . . . . . . . . . . . . . . . . . . . . . . . . . . . . . . . . . 41,259 17,711
Total other long-term liabilities . . . . . . . . . . . . . . . . . . . . . . . . . . . . . . . . . . . . . . . . . . . . . . $146,360 $ 91,465
127

LIVE NATION, INC.
NOTES TO CONSOLIDATED FINANCIAL STATEMENTS—(Continued)
NOTE 18—SEGMENT DATA
In 2009, the Company reorganized its business units and the way in which these business units are assessedand therefore changed its reportable operating segments to North American Music, International Music andTicketing. Prior to 2009, the Company reported an Artist Nation segment which is now reported in the NorthAmerican Music and International Music segments. The Company’s business formerly reported as Artist Nationincludes the promotion and/or production of global tours and also provides other services to artists. These artistrelationships tend to be long-term and typically involve multiple revenue streams for an artist. The Companyenters into these relationships in order to fill the distribution platform of the businesses with recurring events,both domestically and internationally. This is not a separate part of these businesses but is just one more facet ofthe North American Music and International Music segments. Therefore, the Company is now allocating theseactivities based on where the profits for services to these artists are being generated. Prior to 2008, the Companyreported a Global Theater segment, which has been eliminated after the divestiture of substantially all of theCompany’s North American theatrical business in January 2008, which is reported as discontinued operations.The remaining North American theatrical venues which were not sold and the Company’s theatrical assets in theUnited Kingdom, both previously included in Global Theater, are now reported in the North American Musicsegment and other operations, respectively.
The North American Music segment principally involves the promotion of live music events in theCompany’s owned and/or operated venues and in rented third-party venues and the operation and management ofmusic venues primarily in the United States and Canada, as well as providing various services to artists includingmerchandise, artist fan sites and VIP tickets, broadcasting/digital media rights, sponsorship and marketingservices. The International Music segment principally involves the promotion of live music events in theCompany’s owned and/or operated venues and in rented third-party venues, the production of music festivals andthe operation and management of music venues outside of North America. The Ticketing segment principallyinvolves the management of the Company’s internal ticketing operations, the development of the Company’snew ticketing platform and online and wireless distribution activities, including the development of theCompany’s website. Other operations include United Kingdom theatrical venue operations and other businesses.The Company’s motor sports business was sold in September 2008 and the Company sold the events business inOctober 2008, both of which were previously included in other operations and are now reported as discontinuedoperations.
The Company has reclassified all periods presented to conform to the 2009 presentation. Corporateexpenses, interest income, interest expense, equity in losses (earnings) of nonconsolidated affiliates, otherexpense (income)—net, income tax expense (benefit) and net income (loss) attributable to minority interests aremanaged on a total company basis.
128

LIVE NATION, INC.
NOTES TO CONSOLIDATED FINANCIAL STATEMENTS—(Continued)
There are no customers that individually account for more than ten percent of the Company’s consolidatedrevenue in any year.
NorthAmericanMusic
InternationalMusic Ticketing Other Corporate Consolidated
(in thousands)
2008Revenue . . . . . . . . . . . . . . . . . . . . . . . . . . . . . . . . . . . $2,678,309 $1,378,104 $ 22,393 $ 88,032 $ — $4,166,838Direct operating expenses . . . . . . . . . . . . . . . . . . . . . . 2,161,119 1,127,235 9,370 26,215 733 3,324,672Selling, general and administrative expenses . . . . . . . 408,067 172,604 33,332 41,348 — 655,351Depreciation and amortization . . . . . . . . . . . . . . . . . . 99,573 30,418 5,569 7,961 3,946 147,467Goodwill impairment . . . . . . . . . . . . . . . . . . . . . . . . . 269,902 — — — — 269,902Loss (gain) on sale of operating assets . . . . . . . . . . . . 19 203 — 62 824 1,108Corporate expenses . . . . . . . . . . . . . . . . . . . . . . . . . . . — — — — 52,498 52,498
Operating income (loss) . . . . . . . . . . . . . . . . . . . . . . . $ (260,371) $ 47,644 $(25,878) $ 12,446 $(58,001) $ (284,160)
Identifiable assets . . . . . . . . . . . . . . . . . . . . . . . . . . . . $1,460,782 $ 736,136 $ 39,636 $182,261 $ 57,908 $2,476,723Capital expenditures . . . . . . . . . . . . . . . . . . . . . . . . . . $ 62,566 $ 93,372 $ 23,757 $ 4,048 $ 3,177 $ 186,920
2007Revenue . . . . . . . . . . . . . . . . . . . . . . . . . . . . . . . . . . . $2,295,535 $1,307,714 $ 11,358 $140,863 $ — $3,755,470Direct operating expenses . . . . . . . . . . . . . . . . . . . . . . 1,851,588 1,077,805 3,128 71,089 — 3,003,610Selling, general and administrative expenses . . . . . . . 371,109 151,962 15,379 54,533 — 592,983Depreciation and amortization . . . . . . . . . . . . . . . . . . 77,756 19,855 3,311 10,358 5,554 116,834Loss (gain) on sale of operating assets . . . . . . . . . . . . (6,725) (18,807) — 5,047 (169) (20,654)Corporate expenses . . . . . . . . . . . . . . . . . . . . . . . . . . . — — — — 45,854 45,854
Operating income (loss) . . . . . . . . . . . . . . . . . . . . . . . $ 1,807 $ 76,899 $(10,460) $ (164) $(51,239) $ 16,843
Identifiable assets . . . . . . . . . . . . . . . . . . . . . . . . . . . . $1,582,763 $ 677,857 $ 19,334 $384,732 $ 85,134 $2,749,820Capital expenditures . . . . . . . . . . . . . . . . . . . . . . . . . . $ 46,708 $ 39,927 $ 14,180 $ 8,798 $ 7,236 $ 116,849
2006Revenue . . . . . . . . . . . . . . . . . . . . . . . . . . . . . . . . . . . $2,060,145 $1,048,136 $ 8,893 $177,297 $ — $3,294,471Direct operating expenses . . . . . . . . . . . . . . . . . . . . . . 1,741,769 842,338 2,665 92,097 — 2,678,869Selling, general and administrative expenses . . . . . . . 263,778 123,824 11,829 69,539 — 468,970Depreciation and amortization . . . . . . . . . . . . . . . . . . 84,323 17,228 501 18,559 3,017 123,628Loss (gain) on sale of operating assets . . . . . . . . . . . . (63) 1,041 — (10,844) (121) (9,987)Corporate expenses . . . . . . . . . . . . . . . . . . . . . . . . . . . — — — — 33,863 33,863
Operating income (loss) . . . . . . . . . . . . . . . . . . . . . . . $ (29,662) $ 63,705 $ (6,102) $ 7,946 $(36,759) $ (872)
Identifiable assets . . . . . . . . . . . . . . . . . . . . . . . . . . . . $1,143,742 $ 571,485 $ 7,443 $454,210 $ 48,122 $2,225,002Capital expenditures . . . . . . . . . . . . . . . . . . . . . . . . . . $ 24,783 $ 6,553 $ 5,473 $ 21,510 $ 7,386 $ 65,705
129

LIVE NATION, INC.
NOTES TO CONSOLIDATED FINANCIAL STATEMENTS—(Continued)
The following table provides information on the Company’s foreign operations included in the consolidatedamounts above:
UnitedKingdomOperations
OtherForeign
Operations
TotalForeign
Operations
TotalDomesticOperations
ConsolidatedTotal
(in thousands)
2008Revenue . . . . . . . . . . . . . . . . . . . . . . . . . . . . . . . $557,006 $947,889 $1,504,895 $2,661,943 $4,166,838Identifiable assets . . . . . . . . . . . . . . . . . . . . . . . . $453,823 $547,446 $1,001,269 $1,475,454 $2,476,723
2007Revenue . . . . . . . . . . . . . . . . . . . . . . . . . . . . . . . $575,180 $780,060 $1,355,240 $2,400,230 $3,755,470Identifiable assets . . . . . . . . . . . . . . . . . . . . . . . . $456,703 $461,279 $ 917,982 $1,831,838 $2,749,820
2006Revenue . . . . . . . . . . . . . . . . . . . . . . . . . . . . . . . $533,534 $487,355 $1,020,889 $2,273,582 $3,294,471Identifiable assets . . . . . . . . . . . . . . . . . . . . . . . . $437,989 $308,471 $ 746,460 $1,478,542 $2,225,002
130

LIVE NATION, INC.
NOTES TO CONSOLIDATED FINANCIAL STATEMENTS—(Continued)
NOTE 19—QUARTERLY RESULTS OF OPERATIONS (Unaudited)
March 31, June 30, September 30, December 31,
2008 2007 2008 2007 2008 2007 2008 2007
(in thousands, except per share data)Revenue . . . . . . . . . . . . . . . . . . . . . $532,689 $418,507 $1,129,735 $966,033 $1,588,462 $1,448,495 $ 915,952 $922,435Operating expenses:
Direct operating expenses . . . . 402,311 305,327 891,716 760,554 1,295,416 1,197,399 735,229 740,330Selling, general andadministrative expenses . . . 154,397 136,527 166,669 155,039 174,245 151,079 160,040 150,338
Depreciation andamortization . . . . . . . . . . . . 34,229 26,679 33,042 23,978 31,490 26,020 48,706 40,157
Goodwill impairment . . . . . . . — — — — — — 269,902 —Loss (gain) on sale ofoperating assets . . . . . . . . . . 449 4,575 — (19,269) (1,230) (6,112) 1,889 152
Corporate expenses . . . . . . . . . 11,641 9,796 10,474 9,263 13,062 11,335 17,321 15,460
Operating income (loss) . . . . . . . . . (70,338) (64,397) 27,834 36,468 75,479 68,774 (317,135) (24,002)Interest expense . . . . . . . . . . . . . . . 17,766 14,928 16,321 15,248 17,220 16,478 19,363 18,352Interest income . . . . . . . . . . . . . . . . (2,162) (2,657) (3,266) (4,308) (2,978) (3,732) (1,786) (2,779)Equity in (earnings) losses ofnonconsolidated affiliates . . . . . . (288) 2,135 1,396 1,436 (1,979) (115) (1,393) 1,602
Other expense (income)—net . . . . . (863) (47) (252) (307) 277 (213) 810 420
Income (loss) from continuingoperations before incometaxes . . . . . . . . . . . . . . . . . . . . . . (84,791) (78,756) 13,635 24,399 62,939 56,356 (334,129) (41,597)
Income tax expense (benefit) . . . . . (13,962) (8,705) 14,072 13,600 (31,848) 10,384 15,813 (2,005)
Income (loss) from continuingoperations . . . . . . . . . . . . . . . . . . (70,829) (70,051) (437) 10,799 94,787 45,972 (349,942) (39,592)
Income (loss) from discontinuedoperations, net of tax . . . . . . . . . 31,362 21,957 (2,456) 2,595 47,550 1,884 12,140 19,116
Net income (loss) . . . . . . . . . . . . . . (39,467) (48,094) (2,893) 13,394 142,337 47,856 (337,802) (20,476)Net income (loss) attributable tominority interests . . . . . . . . . . . . (2,226) (3,045) (2,241) 3,472 4,344 7,763 1,710 (321)
Net income (loss) attributable toLive Nation, Inc. . . . . . . . . . . . . . $ (37,241) $ (45,049) $ (652) $ 9,922 $ 137,993 $ 40,093 $(339,512) $ (20,155)
Basic income (loss) per commonshare attributable to commonstockholders:Income (loss) from continuingoperations attributable toLive Nation, Inc. . . . . . . . . . $ (0.92) $ (1.02) $ 0.02 $ 0.11 $ 1.17 $ 0.55 $ (4.51) $ (0.54)
Income (loss) fromdiscontinued operations . . . 0.42 0.33 (0.03) 0.04 0.61 0.03 0.15 0.26
Net income (loss) attributableto Live Nation, Inc. . . . . . . . $ (0.50) $ (0.69) $ (0.01) $ 0.15 $ 1.78 $ 0.58 $ (4.36) $ (0.28)
Diluted income (loss) per commonshare attributable to commonstockholders:Income (loss) from continuingoperations attributable toLive Nation, Inc. . . . . . . . . . $ (0.92) $ (1.02) $ 0.02 $ 0.11 $ 1.10 $ 0.53 $ (4.51) $ (0.54)
Income (loss) fromdiscontinued operations . . . 0.42 0.33 (0.03) 0.04 0.56 0.02 0.15 0.26
Net income (loss) attributableto Live Nation, Inc. . . . . . . . $ (0.50) $ (0.69) $ (0.01) $ 0.15 $ 1.66 $ 0.55 $ (4.36) $ (0.28)
131

LIVE NATION, INC.
NOTES TO CONSOLIDATED FINANCIAL STATEMENTS—(Continued)
NOTE 20—SUBSEQUENT EVENTS
In February 2009, Live Nation entered into an Agreement and Plan of Merger (the “Merger Agreement”)with Ticketmaster Entertainment, Inc., a Delaware corporation (“Ticketmaster”), pursuant to which, among otherthings, Ticketmaster will merge (the “Merger”) with and into a Delaware limited liability company and whollyowned subsidiary of Live Nation (“Merger Sub”), with Merger Sub continuing as the surviving corporationfollowing the Merger. The Merger, the Merger Agreement and the transactions contemplated thereby have beenapproved by the boards of directors of both Live Nation and Ticketmaster.
At the effective time of the Merger (the “Effective Time”), each issued and outstanding share ofTicketmaster’s common stock, par value $0.01 per share (“Ticketmaster Common Stock”), will be automaticallyconverted into the right to receive 1.384 (the “Exchange Ratio”) fully paid and non-assessable shares of LiveNation common stock, par value $0.01 per share. The Exchange Ratio shall be subject to adjustment prior toclosing in order to ensure that the holders of 100% of the voting power of Ticketmaster’s equity securitiesimmediately prior to the Effective Time (which voting power is expected at such time to be represented solely byshares of Ticketmaster Common Stock) receive 50.01% of the voting power of the equity securities of LiveNation immediately following the Merger (which voting power is expected at such time to be represented solelyby shares of Live Nation common stock). No fractional shares of Live Nation common stock will be issued inconnection with the Merger, and holders of Ticketmaster Common Stock will be entitled to receive cash in lieuthereof.
Also in connection with the Merger, (i) all outstanding options to purchase Ticketmaster Common Stockgranted pursuant to a Ticketmaster stock plan (“Ticketmaster Stock Options”) will be converted into an option toacquire, on the same terms and conditions as were applicable under such Ticketmaster Stock Options, a numberof shares of Live Nation common stock determined by multiplying the number of shares of TicketmasterCommon Stock subject to such Ticketmaster Stock Options immediately prior to the Effective Time by theExchange Ratio; (ii) each award of restricted Ticketmaster Common Stock outstanding shall be converted, on thesame terms and conditions applicable to restricted Ticketmaster Common Stock immediately prior to theEffective Time, into the number of shares of restricted Live Nation common stock determined by multiplying thenumber of shares of restricted Ticketmaster Common Stock subject to such award immediately prior to theEffective Time by the Exchange Ratio; and (iii) all outstanding awards of Ticketmaster restricted stock units ordirector share unit accounts will be converted, on the same terms and conditions applicable to such awards, intorestricted stock units or an account of director share units (as the case may be) of Live Nation common stock bymultiplying the number of shares of outstanding Ticketmaster Common Stock subject to such award immediatelyprior to the Effective Time by the Exchange Ratio.
132

PART IV
ITEM 15. EXHIBITS, FINANCIAL STATEMENT SCHEDULES
(a)1. Financial Statements.
The following consolidated financial statements are included in Item 8:
Consolidated Balance Sheets as of December 31, 2008 and 2007
Consolidated Statements of Operations for the Years Ended December 31, 2008, 2007 and 2006
Consolidated Statements of Comprehensive Income (Loss) for the Years Ended December 31, 2008, 2007and 2006
Consolidated Statements of Changes in Stockholders’ Equity for the Years Ended December 31, 2008, 2007and 2006
Consolidated Statements of Cash Flows for the Years Ended December 31, 2008, 2007 and 2006
Notes to Consolidated Financial Statements
(a)2. Financial Statement Schedule.
The following financial statement schedule for the years ended December 31, 2008, 2007 and 2006 is filedas part of this report and should be read in conjunction with the consolidated financial statements.
Schedule II Valuation and Qualifying Accounts
All other schedules for which provision is made in the applicable accounting regulation of the Securities andExchange Commission are not required under the related instructions or are inapplicable, and therefore have beenomitted.
133

LIVE NATION, INC.
SCHEDULE IIVALUATION AND QUALIFYING ACCOUNTS
Allowance for Doubtful Accounts(in thousands)
Description
Balance atBeginningof Period
Chargesto Costs,Expensesand Other
Write-offof AccountsReceivable Other
Balanceat End ofPeriod
Year ended December 31, 2006 . . . . . . . . . . . . . . . . . . $ 9,518 $ 5,923 $ (1,693) $ (283)(1) $13,465
Year ended December 31, 2007 . . . . . . . . . . . . . . . . . . $13,465 $11,079 $ (5,855) $ 239 (2) $18,928
Year ended December 31, 2008 . . . . . . . . . . . . . . . . . . $18,928 $ 3,898 $(10,812) $(1,638)(3) $10,376
(1) Elimination of allowance for doubtful accounts resulting from dispositions, partially offset by foreigncurrency adjustments and the addition of allowance for doubtful accounts resulting from acquisitions.
(2) Foreign currency adjustments.(3) Reclassification of allowance for doubtful accounts to long-term assets and elimination of allowance for
doubtful accounts resulting from dispositions.
134

LIVE NATION, INC.
SCHEDULE IIVALUATION AND QUALIFYING ACCOUNTS
Deferred Tax Asset Valuation Allowance(in thousands)
Description
Balance atBeginningof Period
Chargesto Costs,Expenses
and Other(1) Deletions Other(1)
Balanceat End ofPeriod
Year ended December 31, 2006 . . . . . . . . . . . . . . . . . . $ 77,266 $26,124 $— $ 87,934 $191,324
Year ended December 31, 2007 . . . . . . . . . . . . . . . . . . $191,324 $28,301 $— $ 27,084 $246,709
Year ended December 31, 2008 . . . . . . . . . . . . . . . . . . $246,709 $53,035 $— $(92,990) $206,754
(1) In 2006, the Company established allowances against deferred tax assets recorded in connection with theCompany’s acquisition of HOB Entertainment, Inc. In 2007, the Company recorded valuation allowancesagainst: (i) previously unrecorded deferred tax assets arising from the Internal Revenue Service settlementof $38.2 million and a capital loss carryforward of $18.9 million, (ii) deferred tax assets established inconnection with the HOB Entertainment, Inc. and the Signatures Network, Inc. business combinations of$1.8 million and (iii) other assets of $(1.1) million. In 2007, the Company reduced valuation allowances by$27.9 million resulting from the recognition of a corresponding deferred tax liability related to theCompany’s convertible debt. During 2008, principal drivers of other reductions in the valuation allowancewere the estimated utilization of U.S. net operating losses of $29.8 million and the establishment of $51.1million of deferred tax liabilities in connection with 2008 business combinations and artist rights contracts.
135

MARKET FOR REGISTRANT’S COMMON EQUITY, RELATED STOCKHOLDERMATTERS AND ISSUER PURCHASES OF EQUITY SECURITIES
Our common stock was listed on the New York Stock Exchange under the symbol “LYV” on December 21,2005. There were 3,417 stockholders of record as of June 16, 2009. This figure does not include an estimate ofthe indeterminate number of beneficial holders whose shares may be held of record by brokerage firms andclearing agencies. The following table presents the high and low sales prices of the common stock on the NewYork Stock Exchange during the calendar quarter indicated.
Common StockMarket Price
High Low
2007First Quarter . . . . . . . . . . . . . . . . . . . . . . . . . . . . . . . . . . . . . . . . . . . . . . . . . . . . . . . $25.63 $21.07Second Quarter . . . . . . . . . . . . . . . . . . . . . . . . . . . . . . . . . . . . . . . . . . . . . . . . . . . . . $24.09 $18.75Third Quarter . . . . . . . . . . . . . . . . . . . . . . . . . . . . . . . . . . . . . . . . . . . . . . . . . . . . . . . $23.27 $16.85Fourth Quarter . . . . . . . . . . . . . . . . . . . . . . . . . . . . . . . . . . . . . . . . . . . . . . . . . . . . . . $24.03 $12.502008First Quarter . . . . . . . . . . . . . . . . . . . . . . . . . . . . . . . . . . . . . . . . . . . . . . . . . . . . . . . $15.04 $ 9.26Second Quarter . . . . . . . . . . . . . . . . . . . . . . . . . . . . . . . . . . . . . . . . . . . . . . . . . . . . . $16.15 $10.23Third Quarter . . . . . . . . . . . . . . . . . . . . . . . . . . . . . . . . . . . . . . . . . . . . . . . . . . . . . . . $18.75 $ 9.60Fourth Quarter . . . . . . . . . . . . . . . . . . . . . . . . . . . . . . . . . . . . . . . . . . . . . . . . . . . . . . $16.75 $ 2.73
Dividend Policy
Since the Separation and through December 31, 2008, we have not declared or paid any dividends. Wepresently intend to retain future earnings, if any, to finance the expansion of our business. Therefore, we do notexpect to pay any cash dividends in the foreseeable future. Moreover, the terms of our senior secured creditfacility and the designations of our preferred stock limit the amount of funds which we will have available todeclare and distribute as dividends on our common stock. Payment of future cash dividends, if any, will be at thediscretion of our board of directors in accordance with applicable law after taking into account various factors,including our financial condition, operating results, current and anticipated cash needs, plans for expansion andcontractual restrictions with respect to the payment of dividends.
136

PERFORMANCE GRAPH
The graph below shows the relative investment performance of our common stock, the NYSE Market Indexand the Hemscott Group Index for the period from December 22, 2005 through December 31, 2008 assumingreinvestment of dividends at date of payment into the common stock of the indexes. The Hemscott Group Indexconsists of the following twelve companies: Carnival Corporation, Carnival plc, Cedar Fair, L.P., Live Nation,Inc., Orchard Enterprises, Inc., Outdoor Channel Holdings, Inc., Premier Exhibitions, Inc., Royal CaribbeanCruises Ltd., Six Flags, Inc., Tix Corporation, Warner Music Group Corp. and World Wrestling Entertainment,Inc. The information reflected below is not necessarily indicative of our future performance.
COMPARISON OF CUMULATIVE TOTAL RETURNAMONG LIVE NATION, INC.,
NYSE MARKET INDEX AND HEMSCOTT GROUP INDEX
0255075
100125150175200225250
12/22/05 12/31/05 3/31/06 6/30/06 9/30/06 12/31/06 3/31/07 6/30/07 9/30/07 12/31/089/30/086/30/083/31/0812/31/07
DO
LL
AR
S
NYSE MARKET INDEX
ASSUMES $100 INVESTED ON DEC. 22, 2005ASSUMES DIVIDEND REINVESTED
FISCAL YEAR ENDING DEC. 31, 2008
LIVE NATION, INC.
HEMSCOTT GROUP INDEX
Live Nation,Inc.
NYSE MarketIndex
HemscottGroup Index
December 22, 2005 . . . . . . . . . . . . . . . . . . . . . . . $100.00 $100.00 $100.00December 30, 2005 . . . . . . . . . . . . . . . . . . . . . . . 123.58 100.00 100.00March 31, 2006 . . . . . . . . . . . . . . . . . . . . . . . . . . 187.17 105.60 92.16June 30, 2006 . . . . . . . . . . . . . . . . . . . . . . . . . . . 192.08 104.99 83.66September 29, 2006 . . . . . . . . . . . . . . . . . . . . . . . 192.64 109.62 91.12December 29, 2006 . . . . . . . . . . . . . . . . . . . . . . . 211.32 117.51 94.87March 30, 2007 . . . . . . . . . . . . . . . . . . . . . . . . . . 208.11 119.68 91.54June 29, 2007 . . . . . . . . . . . . . . . . . . . . . . . . . . . 211.13 126.60 94.06September 28, 2007 . . . . . . . . . . . . . . . . . . . . . . . 200.47 127.78 90.46December 31, 2007 . . . . . . . . . . . . . . . . . . . . . . . 136.98 123.84 84.34March 31, 2008 . . . . . . . . . . . . . . . . . . . . . . . . . . 114.43 113.03 75.58June 30, 2008 . . . . . . . . . . . . . . . . . . . . . . . . . . . 99.81 112.23 61.16September 30, 2008 . . . . . . . . . . . . . . . . . . . . . . . 153.49 100.44 64.04December 31, 2008 . . . . . . . . . . . . . . . . . . . . . . . 54.15 76.87 43.63
137

[THIS PAGE INTENTIONALLY LEFT BLANK]

[THIS PAGE INTENTIONALLY LEFT BLANK]

[THIS PAGE INTENTIONALLY LEFT BLANK]

Board of DirectorsAriel EmanuelFounding Partner, Endeavor Talent Agency
Robert Ted Enloe, IIIManaging General Partner, Balquita Partners, Ltd.
Jeffrey T. HinsonPresident and Chief Executive Officer, Border Media Partners, LLC
James S. KahanAT&T Senior Executive Vice President – Corporate Development, Retired
L. Lowry MaysChairman, Clear Channel Communications, Inc.
Randall T. Mays, ChairmanPresident and Chief Financial Officer, Clear Channel Communications, Inc.
Connie McCombs McNabPrivate Investor
Michael RapinoPresident and Chief Executive Officer, Live Nation
Mark ShapiroPresident and Chief Executive Officer, Six Flags, Inc.
Executive and Other Key OfficersMichael RapinoPresident and Chief Executive Officer
Jason GarnerChief Executive Officer – Global Music
Alan B. RidgewayChief Executive Officer – International Music
Michael G. RowlesGeneral Counsel and Secretary
Kathy WillardChief Financial Officer
Brian CapoChief Accounting Officer
Arthur FogelChairman – Global Music and Chief Executive Officer – Global Touring
John HopmansExecutive Vice President – Mergers and Acquisitions and Strategic Finance
Nathan HubbardChief Executive Officer – Ticketing
Thomas O. JohanssonChairman – International Music
Ben WeedenChief Operating Officer – North American Music
Corporate InformationIndependent Registered Public Accounting FirmErnst & Young LLPLos Angeles, California
Investor RelationsLinda BandovSenior Vice President, Investor RelationsLive Nation9348 Civic Center DriveBeverly Hills, California 90210(310) 867-7000
Press InquiriesJohn VlautinSenior Vice President, CommunicationsLive Nation9348 Civic Center DriveBeverly Hills, California 90210(310) 867-7000
Transfer Agent and RegistrarBNY Mellon Shareowner ServicesP.O. Box 358015Pittsburgh, Pennsylvania 15252-8015 or480 Washington Boulevard, Jersey City, New Jersey 07310-1900(877) 296-7874(201) 680-6578 (for callers outside the United States)
Internet address: www.bnymellon.com/shareowner/isdE-mail address: [email protected]
Stock ListingLive Nation’s common stock is listed on the New York Stock Exchange under thesymbol “LYV.”
Annual Report on Form 10-K
Live Nation’s Annual Report on Form 10-K for the year ended December 31, 2008 is
included in this annual report. The exhibits accompanying the report are filed with the
U.S. Securities and Exchange Commission and can be accessed in the EDGAR data-
base at the SEC’s website, www.sec.gov, or through the “Investors” section of Live
Nation’s website, at www.livenation.com/investors. We will provide these items to
stockholders upon request. Requests for any such exhibits should be made to:
Live Nation
Attention: Corporate Secretary
9348 Civic Center Drive
Beverly Hills, California 90210
Certifications
Live Nation’s Chief Executive Officer and Chief Financial Officer have provided to the
Securities and Exchange Commission their certifications regarding the quality of the
company’s public disclosure as required by Section 302 of the Sarbanes-Oxley Act of
2002. These certifications are included as Exhibits 31.1 and 31.2, respectively, to Live
Nation’s Annual Report on Form 10-K for the year ended December 31, 2008.
In July 2008, Live Nation’s Chief Executive Officer also submitted his annual certifica-
tion to the New York Stock Exchange stating that he was not aware of any violation
by the company of the NYSE’s corporate governance listing standards.
Forward-Looking Statements
In accordance with the Private Securities Litigation Reform Act of 1995, Live Nation
notes that this annual report contains forward-looking statements that involve risks
and uncertainties, including those relating to the company’s future success and
growth. Actual results may differ materially due to risks and uncertainties as described
in Live Nation's filings with the U.S. Securities and Exchange Commission. Live Nation
does not intend to update these forward-looking statements.
Proxy Solicitation
In connection with the proposed transaction with Ticketmaster Entertainment, Inc.,
Live Nation intends to file relevant materials with the SEC, including a joint proxy state-
ment/prospectus. INVESTORS ARE URGED TO READ THESE MATERIALS WHEN
THEY BECOME AVAILABLE BECAUSE THEY WILL CONTAIN IMPORTANT INFOR-
MATION ABOUT TICKETMASTER ENTERTAINMENT, LIVE NATION AND THE
TRANSACTION. The joint proxy statement/prospectus and other relevant materials
(when they become available) and any other documents filed by Live Nation with the
SEC may be obtained free of charge at the SEC’s website at http://www.sec.gov. In
addition, investors may obtain free copies of the documents filed with the SEC by
contacting Live Nation’s Investor Relations Department at (310) 867-7000 or by
accessing Live Nation’s investor relations website at www.livenation.com/investors.
Live Nation and its executive officers and directors may be deemed to be participat-
ing in the solicitation of proxies in connection with the transaction. Information about
the executive officers and directors of Live Nation and the number of shares of Live
Nation’s common stock beneficially owned by such persons is set forth in Live
Nation’s Amended Annual Report on Form 10-K/A which was filed with the SEC on
April 30, 2009. Investors may obtain additional information regarding the direct and
indirect interests of Live Nation and its executive officers and directors in the transac-
tion by reading the joint proxy statement/prospectus regarding the transaction when
it becomes available.
Brad EdwardsBrainerd Communicators, Inc.521 Fifth Avenue, 8th FloorNew York, New York 10175(212) 986-6667

9348 CIVIC CENTER DRIVEBEVERLY HILLS, CA. 90210310 867 7000


