80
A NNUAL R EPORT 2008

A N N U A L R E P O R T
2 0 0 8
Financial Highlights
(In thousands except per share data and number of employees)
2008 2007 % Change
Sales and service fees $223,994 $188,047 19.1%Operating income $ 35,806 $ 30,958 15.7%Net income $ 22,520 $ 20,889 7.8%Earnings per common share (diluted) $ 3.49 $ 3.24 7.7%Order intake $ 212,530 $198,975 6.8%Working capital $ 100,183 $ 76,050 31.7%Total debt $ - $ - -Shareholders’ equity $ 123,477 $ 97,603 26.5%Number of employees 427 382 11.8%Stock price October 31 $ 22.50 $ 57.10 (60.6%) High $ 58.68 $ 60.44 (2.9%) Low $ 16.92 $ 24.61 (31.2%)
Annual Report 2008
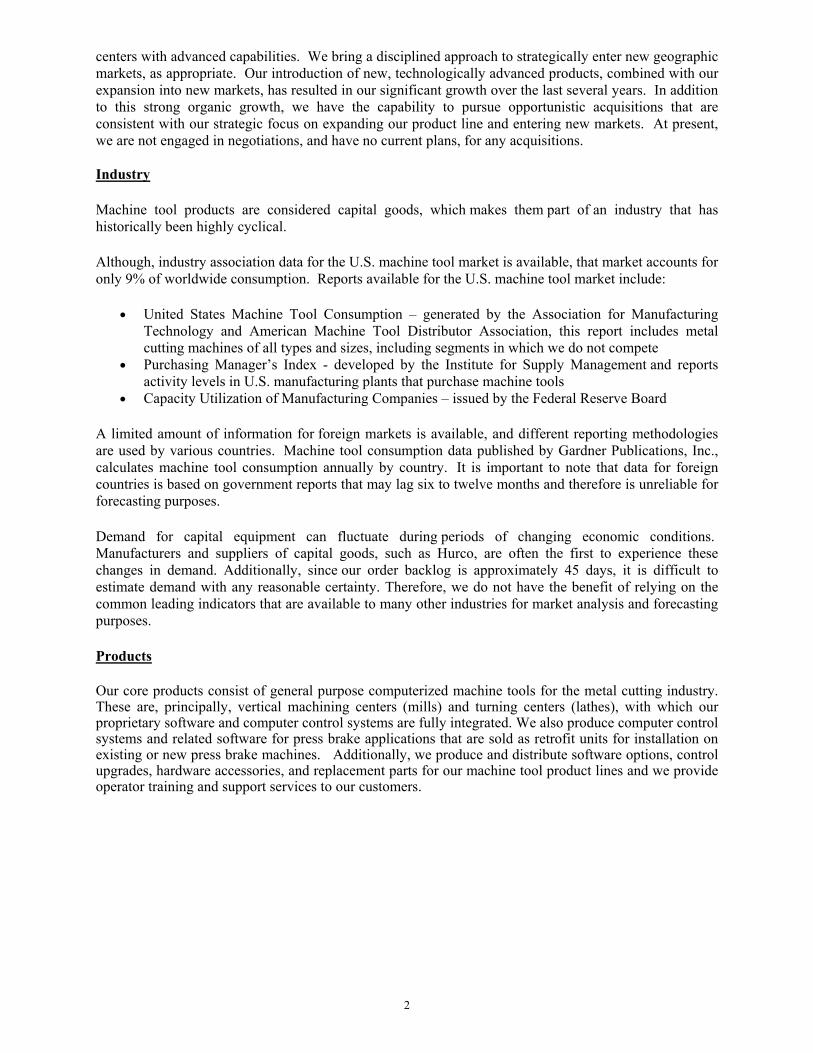
Shareholders’ Equity(Millions)
$123.5
$97.6
2006 2007 2008
$75.4
0
30
60
90
120
150
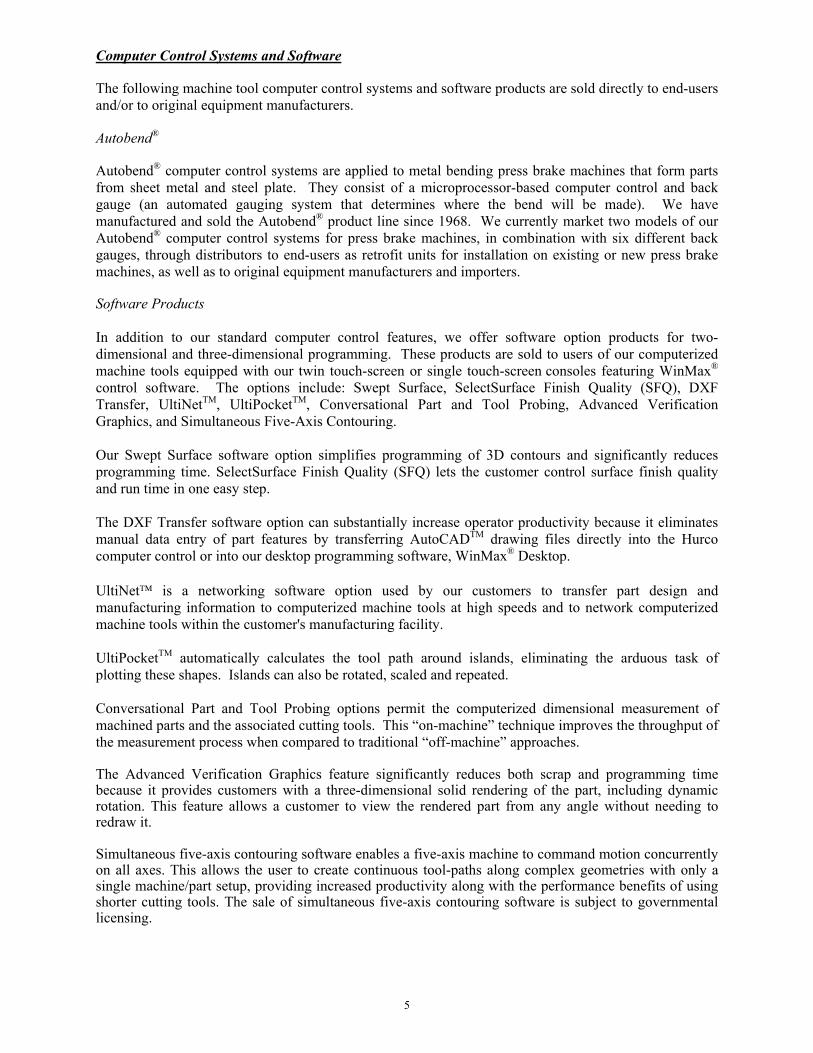
Sales and Service Fees(Millions)
$148.5
$188.0
$224.0
2006 2007 20080
50
100
150
200
250
Operating Income(Millions)
$30.9$35.8
2006 2007 2008
$22.6
0
5
10
15
20
25
30
35
40
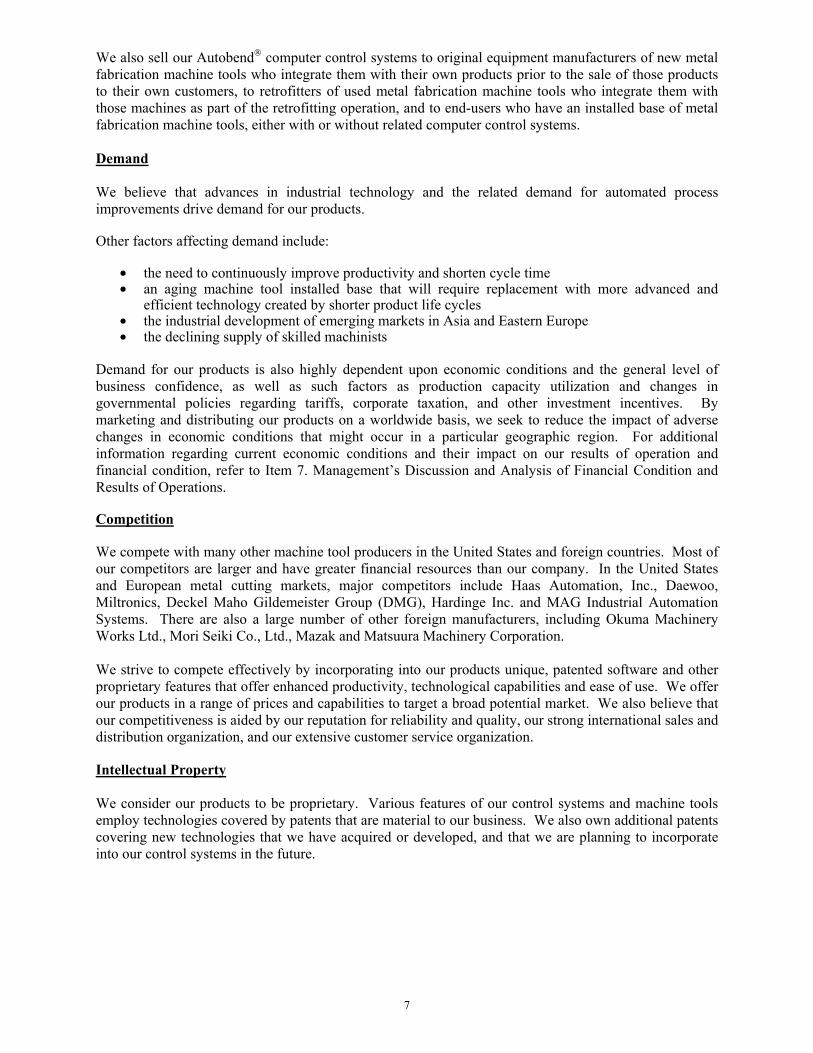
$0
Total Debt (Millions)
$4.0
2006 2007 2008
$00.0
0.5
1.0
1.5
2.0
2.5
3.0
3.5
4.0

Report to Shareholders
While we are pleased to report another record breaking year for 2008, our elation is tempered by the global economic downturn that has affected our customers who serve a variety of industries, such as automotive, aerospace, energy, medical device, etc. This year’s revenues of $223,994,000, refl ect a 19% increase compared to 2007. Our fi scally conservative, Midwestern culture and commitment to strategic planning has led to a strong cash position that will help Hurco endure this economic downturn. We continue to reinvest in the business through product and technology innovation that yields measurable productivity benefi ts for our customers.
In 2008, we simultaneously introduced a record number of new products at the International Manufacturing Technology Show held in Chicago in September. Of the 14 new products we introduced, the investment we made in large machining centers, multi-axis machining centers, and complementary software features warrants special emphasis. We also held the offi cial grand opening ceremony of Hurco India at the Chennai technical center to showcase Hurco products and technology for this key market. To support effi cient manufacturing of our newest large machining centers, we opened a second plant at Hurco Manufacturing Limited (HML) and continue to reap the benefi ts of an effi cient global supply chain. The agility of our supply chain and manufacturing processes is an integral part of our success because we are able to effi ciently develop and manufacture new products and continually identify cost containment opportunities.
CustomersWhile our customers throughout the world are experiencing the strain from economic uncertainty, the ingenuity of small business owners and their resiliency should not be underestimated. At Hurco, we view our customers as collaborative partners and our goal is to develop technology and products that perpetuate productivity and profi tability for their businesses. Investment in relevant technology is the most expedient way for these customers to gain the speed and fl exibility they need to succeed. Responding to our customers’ need to compete drives product innovation at Hurco. Therefore, our investment in developing advanced technology and machines that yield increased productivity, such as our multi-axis products and new multi-tasking machines, is an important part of serving our customers who must continuously fi nd ways to stay competitive.
Core CompetenciesOur core competencies include software and product innovation, effi cient manufacturing, and targeted expansion in emerging markets. Even though we are considered a manufacturing company, it is our technology that sets us apart. In 2008, we saw the fruition of massive product and technology development efforts we undertook in previous years with the introduction of a record number of new machines and new software products. Additionally, all of our product development efforts generated more new patents for us to add to the Hurco intellectual property portfolio. As for targeted expansion in emerging markets, we continued to establish relationships throughout India and successfully opened our technical center in Chennai as planned.
Profi tabilityIn addition to record sales fi gures for 2008, Hurco recorded net income of $22.5 million ($3.49/share), which is a $1.6 million, or 8%, increase compared to 2007. Other key fi nancial data include Shareholders’ Equity of $123.5 million, an increase of $25.8 million compared to 2007, and Operating Income of $35.8 million, a 15.7% increase from 2007.
Going Forward 2009In 2009, we will carefully continue our strategic expansion throughout the world including emerging markets, such as Indonesia, Korea, South Africa, and Vietnam. We also plan to devote more resources in Spain and Turkey to further develop these markets. Although these individual markets are modest compared to the global market, they are important for future growth and can be developed effi ciently by existing subsidiaries without the need to devote signifi cant resources.
The investment we have made in new products will allow our sales organizations more opportunities to serve existing customers and to meet the needs of new customers, especially those customers who need machines that can produce large parts and molds for the aerospace and energy sectors. Worldwide, our total solutions control and software features continue to yield premium benefi ts for all markets and user-levels.
We want to thank our shareholders for their continued support. We also want to thank our employees for their dedication and strong work ethic. We especially want to thank our loyal customers and welcome our new customers to Hurco. We look forward to growing with you and continuing to provide you with the most innovative, user-friendly machine tools in the world.
Michael DoarChairman and Chief Executive Offi cer
James D. FabrisPresident and Chief Operations Offi cer

HURCO COMPANIES, INC.ELEVEN-YEAR SELECTED FINANCIAL DATA
(In thousands except per share data and number of employees)
For the Fiscal Year Ended 2008 2007 2006 Sales and service fees $223,994 $188,047 $148,517 Cost of sales and service (1) $ 141,377 $116,965 $ 95,192 Operating expenses (SG&A) $ 46,811 $ 40,124 $ 30,697 Restructuring and other expenses, net $ - $ - $ - Operating income (loss) $ 35,806 $ 30,958 $ 22,628 License fee income, net $ - $ - $ - Other income (expense) $ (1,640) $ 1,807 $ 486 Income before taxes $ 34,166 $ 32,765 $ 23,114 Income tax expense (benefi t) (2) $ 11,646 $ 11,876 $ 7,635 Net income (loss) $ 22,520 $ 20,889 $ 15,479
Average shares outstanding - Basic 6,415 6,382 6,317 Diluted/Primary 6,444 6,440 6,397 Earnings per share Basic $ 3.51 $ 3.27 $ 2.45 Diluted/Primary $ 3.49 $ 3.24 $ 2.42 Capital expenditures $ 5,514 $ 4,510 $ 3,301 Depreciation and amortization $ 3,023 $ 2,106 $ 1,504 EBITDA $ 37,252 $ 35,072 $ 24,977 EBITDA, excluding license fees and restructuring charge $ 37,252 $ 35,072 $ 24,977 Gross profi t margin % 36.9% 37.8% 35.9% Operating income as % of sales 16.0% 16.5% 15.2% Net return on sales 10.1% 11.1% 10.4% Return on average equity 20.4% 24.2% 23.0% Stock price range High $ 58.68 $ 60.44 $ 37.47 Low $ 16.92 $ 24.61 $ 17.74
At Fiscal Year End 2008 2007 2006 Working capital $ 100,183 $ 76,050 $ 59,094 Current ratio 2.96 2.20 2.33 Total assets $ 177,444 $163,781 $125,545 Total debt $ - $ - $ 4,010 Shareholders’ equity $ 123,477 $ 97,603 $ 75,375 Total debt to capitalization % - - 5.1% Shareholders’ equity per share (3) $ 19.16 $ 15.16 $ 11.78 Net operating assets per $ revenue (4) $ .404 $ 0.308 $ 0.334 Number of employees 427 382 320
Annual Report 2008
Certain prior year amounts have been reclassifi ed to conform to the current year presentation.
(1) Cost of Sales in fi scal 2002 includes restructuring write-downs of inventory of $1.1 million.
(2) Fiscal 2005 includes an approximate $2.3 million benefi t from the reduction of valuation allowances on our deferred tax assets.
(3) Based on shares outstanding at fi scal year end - diluted
(4) Excluding cash, short-term investments, and debt.

2005 2004 2003 2002 2001 2000 1999 1998$125,509 $99,572 $75,532 $70,486 $92,267 $96,204 $88,238 $93,422$ 82,951 $69,274 $54,710 $55,240 $69,005 $70,827 $64,064 $65,483$ 26,057 $21,401 $18,749 $19,658 $24,040 $23,538 $ 21,259 $21,786$ - $ 465 $ (124) $ 2,755 $ 143 $ 300 $ (103) $ 1,162$ 16,501 $ 8,432 $ 2,197 $ (7,167) $ (921) $ 1,539 $ 3,018 $ 4,991$ - $ - $ - $ 163 $ 723 $ 5,365 $ 304 $ 6,974$ (419) $ (864) $ (777) $ (670) $ (622) $ (1,298) $ (1,268) $ (777)$ 16,082 $ 7,568 $ 1,420 $ (7,674) $ (820) $ 5,606 $ 2,054 $11,188$ (361) $ 1,299 $ 958 $ 589 $ 777 $ 571 $ 252 $ 1,934$ 16,443 $ 6,269 $ 462 $(8,263) $ (1,597) $ 5,035 $ 1,802 $ 9,254
6,171 5,784 5,582 5,583 5,670 5,952 5,980 6,4986,336 6,026 5,582 5,583 5,670 6,020 6,061 6,670
$ 2.66 $ 1.08 $ 0.08 $ (1.48) $ (0.28) $ 0.85 $ 0.30 $ 1.42 $ 2.60 $ 1.04 $ 0.08 $ (1.48) $ (0.28) $ 0.84 $ 0.30 $ 1.39 $ 3,040 $ 2,052 $ 1,215 $ 1,716 $ 1,918 $ 1,899 $ 2,157 $ 2,328 $ 1,331 $ 1,223 $ 1,429 $ 1,929 $ 2,196 $ 2,519 $ 2,428 $ 2,138 $ 17,768 $ 9,259 $ 3,507 $ (5,111) $ 2,166 $ 9,064 $ 5,775 $14,202 $ 17,768 $ 9,724 $ 3,383 $(2,519) $ 1,586 $ 3,999 $ 5,368 $ 8,390
33.9% 30.4% 27.6% 21.6% 25.2% 26.4% 27.4% 29.9% 13.1% 8.5% 2.9% (10.2%) (1.0%) 1.6% 3.4% 5.3% 13.1% 6.3% 0.6% (11.7%) (1.7%) 5.2% 2.0% 9.9% 33.8% 18.7% 1.6% (26.0%) (4.3%) 13.4% 4.9% 27.4%
$ 20.00 $ 17.37 $ 3.15 $ 3.35 $ 4.19 $ 5.88 $ 6.63 $ 9.25 $ 10.25 $ 2.52 $ 1.30 $ 1.45 $ 2.08 $ 3.00 $ 3.38 $ 6.25
2005 2004 2003 2002 2001 2000 1999 1998$ 43,057 $26,347 $22,236 $20,350 $31,293 $26,071 $33,276 $29,349
2.40 1.87 2.10 1.96 2.72 2.13 2.70 2.14 $ 94,114 $73,446 $57,958 $ 57,152 $66,217 $65,024 $ 69,632 $71,696 $ 4,136 $ 4,600 $ 9,222 $ 8,885 $12,000 $ 3,736 $ 14,172 $ 8,358 $ 58,944 $38,455 $28,741 $28,017 $35,468 $38,891 $ 36,148 $ 37,740
6.6% 10.7% 24.3% 24.1% 25.3% 8.8% 28.2% 18.1%$ 9.30 $ 6.38 $ 5.15 $ 5.02 $ 6.26 $ 6.46 $ 5.96 $ 5.66 $ 0.363 $ 0.347 $ 0.424 $ 0.462 $ 0.476 $ 0.408 $ 0.531 $ 0.458
284 250 232 240 277 293 280 306


UNITED STATES SECURITIES AND EXCHANGE COMMISSION
Washington, D.C. 20549
FORM 10-K (Mark One)
Annual report pursuant to Section 13 or 15(d) of the Securities Exchange Act of 1934 for the fiscal year ended October 31, 2008 or
Transition report pursuant to Section 13 or 15(d) of the Securities Exchange Act of 1934 for the transition period from _________ to _________.
Commission File No. 0-9143
HURCO COMPANIES, INC. (Exact name of registrant as specified in its charter)
Indiana 35-1150732 (State or other jurisdiction of (I.R.S. Employer Identification Number) incorporation or organization) One Technology Way Indianapolis, Indiana 46268 (Address of principal executive offices) (Zip code)
Registrant’s telephone number, including area code (317) 293-5309 Securities registered pursuant to Section 12(b) of the Act: None Securities registered pursuant to Section 12(g) of the Act: Common Stock, No Par Value (Title of Class) Indicate by check mark if the registrant is a well-known seasoned issuer, as defined in Rule 405 of the Securities Act. Yes [ ] No [X ] Indicate by check mark if the registrant is not required to file reports pursuant to Section 13 or Section 15(d). Yes [ ] No [X ] Indicate by check mark whether the registrant (1) has filed all reports required to be filed by Section 13 or 15(d) of the Securities Exchange Act of 1934 during the preceding 12 months, and (2) has been subject to the filing requirements for at least the past 90 days. Yes [X ] No [ ] Indicate by check mark if disclosure of delinquent filers pursuant to Item 405 of Regulation S-K is not contained herein, and will not be contained, to the best of registrant's knowledge, in definitive proxy or information statements incorporated by reference in Part III of this Form 10-K or any amendment to this Form 10-K. Indicate by check mark whether the registrant is a large accelerated filer, an accelerated filer or a non- accelerated filer. See definition of “accelerated filer” and “large accelerated filer” in Rule 12b-2 of the Exchange Act. Large accelerated filer [ ] Accelerated filer [ X ] Non-accelerated filer [ ] Smaller Reporting Company [ ] (Do not check if a smaller reporting company) Indicate by check mark whether the registrant is a shell company (as defined in Rule 12b-2 of the Exchange Act). Yes [ ] No [X ] The aggregate market value of the registrant’s voting stock held by non-affiliates as of April 30, 2008 (the last day of our most recently completed second quarter) was $294,011,000. The number of shares of the registrant’s common stock outstanding as of January 7, 2009 was 6,420,851. DOCUMENTS INCORPORATED BY REFERENCE: Portions of the registrant’s Proxy Statement for its 2009 Annual Meeting of Shareholders (Part III).


1
Disclosure Concerning Forward-looking Statements Certain statements made in this annual report on form 10-K may constitute “forward-looking statements” within the meaning of the Private Securities Litigation Reform Act of 1995. These forward-looking statements involve known and unknown risks, uncertainties and other factors that may cause our actual results, performance or achievements to be materially different from any future results, performance or achievements expressed or implied by such forward-looking statements. These factors include the risks identified in Item 1A.
PART I Item 1. BUSINESS General Hurco Companies, Inc. is an industrial technology company. We design, manufacture and sell computerized machine tools, consisting primarily of vertical machining centers (mills) and turning centers (lathes), to companies in the metal working industry through a worldwide sales, service and distribution network. Although our computer control systems and software products are proprietary, they predominantly use industry standard personal computer components. Our computer control systems and software products are primarily sold as integral components of our computerized machine tool products. As used in this report, the words “we”, “us” and “our” refer to Hurco Companies, Inc. and its consolidated subsidiaries. Since our founding in 1968, we have been a leader in the introduction of interactive computer control systems that automate manufacturing processes and improve productivity in the metal parts manufacturing industry. Hurco pioneered the application of microprocessor technology and conversational programming software for use in machine tools. We have concentrated on designing “user-friendly” computer control systems that can be operated by both skilled and unskilled machine tool operators and yet are capable of instructing a machine to perform complex tasks. The combination of microprocessor technology and patented interactive, conversational programming software in our computer control systems enables operators on the production floor to quickly and easily create a program for machining a particular part from a blueprint or computer-aided design file and immediately begin machining that part. Our executive offices and principal design and engineering operations are headquartered in Indianapolis, Indiana. Sales, application engineering and service subsidiaries are located in Mississauga, Canada; Shanghai, China; High Wycombe, England; Paris, France; Munich, Germany; Chennai, India; Milan, Italy; and Singapore, along with manufacturing operations in Taiwan and China. Products are sold through independent agents and distributors in North America, Europe and Asia. We also have direct sales forces in Canada, France, Germany, Italy, Singapore and the United Kingdom. Distribution facilities are located in Los Angeles, California, Venlo, the Netherlands, and Singapore. In August, we held the official grand opening ceremony for our newest sales, application engineering and service subsidiary, Hurco India, Ltd. The event was held at our Technical Center in Chennai and was an opportunity to illustrate the capabilities of Hurco technology and machining centers to this growing market. Hurco machine tools are advantageous to customers in India because the user-friendly control and conversational programming enables machine shop owners to hire workers with less technical skill sets. Our strategy is to design, manufacture and sell to the global metalworking market a comprehensive line of computerized machine tools that incorporate our proprietary, interactive computer control technology. Our technology is designed to enhance the machine tool user's productivity through ease of operation and higher levels of machine performance (speed, accuracy and surface finish quality). We use an open system software architecture that permits our computer control systems and software to be produced and employed using standard PC hardware. We have emphasized a “user-friendly” design that employs both interactive conversational and graphical programming software. Each year we have expanded our product offering to meet customer needs, which has led us to design and manufacture more complex machining
2
centers with advanced capabilities. We bring a disciplined approach to strategically enter new geographic markets, as appropriate. Our introduction of new, technologically advanced products, combined with our expansion into new markets, has resulted in our significant growth over the last several years. In addition to this strong organic growth, we have the capability to pursue opportunistic acquisitions that are consistent with our strategic focus on expanding our product line and entering new markets. At present, we are not engaged in negotiations, and have no current plans, for any acquisitions. Industry
Machine tool products are considered capital goods, which makes them part of an industry that has historically been highly cyclical.
Although, industry association data for the U.S. machine tool market is available, that market accounts for only 9% of worldwide consumption. Reports available for the U.S. machine tool market include:
• United States Machine Tool Consumption – generated by the Association for Manufacturing Technology and American Machine Tool Distributor Association, this report includes metal cutting machines of all types and sizes, including segments in which we do not compete
• Purchasing Manager’s Index - developed by the Institute for Supply Management and reports activity levels in U.S. manufacturing plants that purchase machine tools
• Capacity Utilization of Manufacturing Companies – issued by the Federal Reserve Board
A limited amount of information for foreign markets is available, and different reporting methodologies are used by various countries. Machine tool consumption data published by Gardner Publications, Inc., calculates machine tool consumption annually by country. It is important to note that data for foreign countries is based on government reports that may lag six to twelve months and therefore is unreliable for forecasting purposes.
Demand for capital equipment can fluctuate during periods of changing economic conditions. Manufacturers and suppliers of capital goods, such as Hurco, are often the first to experience these changes in demand. Additionally, since our order backlog is approximately 45 days, it is difficult to estimate demand with any reasonable certainty. Therefore, we do not have the benefit of relying on the common leading indicators that are available to many other industries for market analysis and forecasting purposes.
Products
Our core products consist of general purpose computerized machine tools for the metal cutting industry. These are, principally, vertical machining centers (mills) and turning centers (lathes), with which our proprietary software and computer control systems are fully integrated. We also produce computer control systems and related software for press brake applications that are sold as retrofit units for installation on existing or new press brake machines. Additionally, we produce and distribute software options, control upgrades, hardware accessories, and replacement parts for our machine tool product lines and we provide operator training and support services to our customers.

3
The following table sets forth the contribution of each of our product groups to our total sales and service fees during each of the past three fiscal years: Net Sales and Service Fees by Product Category(Dollars in thousands) Year ended October 31,
2008 2007 2006 Continuing Products and Services Computerized Machine Tools $199,238 89.0% $165,832 88.2% $128,946 86.8% Computer Control Systems and Software * 5,678 2.5% 5,291 2.8%
4,694 3.2%
Service Parts 13,240 5.9% 12,096 6.4% 10,494 7.0% Service Fees 5,838 2.6% 4,828 2.6% 4,383 3.0% Total $223,994 100% $188,047 100% $148,517 100% * Amounts shown do not include computer control systems sold as integrated components of computerized machine
tools. Computerized Machine Tools – Machining and Turning Centers We design, manufacture and sell computerized machine tools equipped with a fully integrated interactive computer control system that features our WinMax® software. Our computer control system enables a machine tool operator to create complex two-dimensional or three-dimensional machining programs directly from an engineering drawing or computer aided design geometry file. An operator with little or no machine tool programming experience can successfully create a program with minimal training and begin machining the part in a short period of time. The control features an operator console with a liquid crystal display (LCD), and incorporates an upgradeable personal computer (PC) platform using a Pentium®* class processor with solid rendering graphical programming. In addition, WinMax® has a Windows®** based operating system to enable users to improve shop floor flexibility and software productivity. In the intensely competitive global manufacturing marketplace, increases in productivity are being derived from control and software technologies. Companies using computer controlled machine tools are better able to:
• maximize the efficiency of their human resources • continue to expand their capability to make more advanced and complex parts from a wide range
of materials using multiple processes • maintain the ability to incorporate fast moving changes in technology into their operations to
keep their competitive edge • continue to integrate themselves into the global supply chain of their customers by supporting
small to medium lot sizes for “just in time” initiatives
Our Windows®** based control facilitates our ability to meet these customer needs. Companies are finding that the familiar Windows®** operating system coupled with the Hurco conversational style of program creation means that their operators are capable of creating and editing part-making programs without incurring the incremental overhead of specialized computer aided design and computer aided manufacturing programmers. With the ability to transfer most computer aided design data directly into a Hurco program, programming time becomes minutes instead of hours. Products today are being designed to meet the demand for machining complex parts with greater part accuracies. Our proprietary controls with WinMax® software and Pentium®* processors efficiently handle the large amounts of data these complex part-making programs require, which enables our customers to create parts with superb accuracy at world-class speeds. We continue to add technology to our control design as it becomes available. Our offering of machining centers, currently equipped with either a twin touch-screen console or a single touch-screen console, consists of the following six product lines:

4
VM Product Line The VM product line consists of moderately priced vertical machining centers for the entry-level market. Their design premise of a machining center with a large work cube and a small footprint optimizes the use of available floor space. The VM line consists of five models in three sizes with X-axis (horizontal) travels of 26, 40, and 50 inches. The base prices of the VM machines range from $40,000 to $80,000. VMX Product Line The VMX product line consists of higher performing vertical machining centers aimed at manufacturers that require greater part accuracy. It is our flagship series of machining centers. The VMX line consists of 14 models in seven sizes with X-axis travels of 24, 30, 40, 50, 60, 64, and 84 inches. The base prices of VMX machines range from $50,000 to $200,000. Five-Axis Product Line The five-axis product line is targeted at manufacturers seeking to produce complex multi-sided parts in a single setup. Machines in this product line can yield significant productivity gains for operations that previously processed each side of a part individually. Due to market demand for increased processing efficiency, we focused on five-axis technology in 2008 and introduced four new five-axis machining centers in September. In total, we now have six Hurco five-axis machining centers to offer customers. The base prices of the five-axis machines range from $100,000 to $180,000. TM/TMM Product Line Since its introduction in fiscal 2005, we have continued to expand the TM turning center (horizontal slant-bed lathe) product line. The TM series is designed for entry-level job shops and contract manufacturers seeking efficient processing of small to medium lot sizes. The TM is offered in three models with chucks of 6, 8, and 10 inches respectively. In September 2006, we further enhanced the capability of the TM turning centers with the addition of “live” or motorized tooling on the lathe turret. Designated as the TMM product line, these machines allow our customers to complete a number of secondary milling, drilling and tapping operations, while the part is still held in the chuck after the turning operations are complete. This ability to “mill/turn” or “multi-task” on the same machine in a single setup can provide significant productivity gains. Two TMM models with this capability are being offered. The base prices of the TM/TMM machines range from $40,000 to $85,000. TMX Product Line Introduced in September 2008, the TMX product line consists of high performance turning centers. There are three TMX models, all with chucks of 8 inches, but two of the models are equipped with an additional axis and motorized live tooling, and one of those models has an additional spindle. The base prices of TMX turning centers range from $80,000 to $180,000. Specialty Product Lines Two new specialty products were introduced in September 2008: the dual-column machining center and the zone machining center. Both of these machines are designed to facilitate production of large parts and molds. The horizontal machining center is also included in this category as it facilitates efficient and accurate machining of complex production parts. The base prices of these machines range from $235,000 to $350,000. *Pentium® is a registered trademark of Intel Corporation. **Windows® is a registered trademark of Microsoft Corporation.
5
Computer Control Systems and Software The following machine tool computer control systems and software products are sold directly to end-users and/or to original equipment manufacturers. Autobend® Autobend® computer control systems are applied to metal bending press brake machines that form parts from sheet metal and steel plate. They consist of a microprocessor-based computer control and back gauge (an automated gauging system that determines where the bend will be made). We have manufactured and sold the Autobend® product line since 1968. We currently market two models of our Autobend® computer control systems for press brake machines, in combination with six different back gauges, through distributors to end-users as retrofit units for installation on existing or new press brake machines, as well as to original equipment manufacturers and importers. Software Products In addition to our standard computer control features, we offer software option products for two-dimensional and three-dimensional programming. These products are sold to users of our computerized machine tools equipped with our twin touch-screen or single touch-screen consoles featuring WinMax® control software. The options include: Swept Surface, SelectSurface Finish Quality (SFQ), DXF Transfer, UltiNetTM, UltiPocketTM, Conversational Part and Tool Probing, Advanced Verification Graphics, and Simultaneous Five-Axis Contouring. Our Swept Surface software option simplifies programming of 3D contours and significantly reduces programming time. SelectSurface Finish Quality (SFQ) lets the customer control surface finish quality and run time in one easy step. The DXF Transfer software option can substantially increase operator productivity because it eliminates manual data entry of part features by transferring AutoCADTM drawing files directly into the Hurco computer control or into our desktop programming software, WinMax® Desktop. UltiNet™ is a networking software option used by our customers to transfer part design and manufacturing information to computerized machine tools at high speeds and to network computerized machine tools within the customer's manufacturing facility. UltiPocketTM automatically calculates the tool path around islands, eliminating the arduous task of plotting these shapes. Islands can also be rotated, scaled and repeated. Conversational Part and Tool Probing options permit the computerized dimensional measurement of machined parts and the associated cutting tools. This “on-machine” technique improves the throughput of the measurement process when compared to traditional “off-machine” approaches. The Advanced Verification Graphics feature significantly reduces both scrap and programming time because it provides customers with a three-dimensional solid rendering of the part, including dynamic rotation. This feature allows a customer to view the rendered part from any angle without needing to redraw it. Simultaneous five-axis contouring software enables a five-axis machine to command motion concurrently on all axes. This allows the user to create continuous tool-paths along complex geometries with only a single machine/part setup, providing increased productivity along with the performance benefits of using shorter cutting tools. The sale of simultaneous five-axis contouring software is subject to governmental licensing.

6
Parts and Service Our service organization provides installation, warranty, operator training and customer support for our products on a worldwide basis. In the United States, our principal distributors have primary responsibility for machine installation and warranty service and support for product sales. Our service organization also sells software options, computer control upgrades, accessories and replacement parts for our products. Our after-sales parts and service business strengthens our customer relationships and provides continuous information concerning the evolving requirements of end-users. Manufacturing Our computerized metal cutting machine tools are manufactured to our specifications primarily by our wholly owned subsidiary in Taiwan, Hurco Manufacturing Limited (HML). This subsidiary has increased our overall capacity and reduced our dependence on other manufacturers. HML conducts final assembly operations and is supported by a network of contract suppliers of components and sub-assemblies who manufacture components for our products in accordance with our proprietary designs, quality standards and cost specifications. This has enabled us to lower our production costs, reduce our working capital per sales dollar and increase our worldwide manufacturing capacity without significant incremental investment in capital equipment or personnel. In 2006, we opened a new manufacturing facility in Ningbo, China, that focuses on the machining of castings and components to support HML’s production in Taiwan. In the future, we can expand the Ningbo facility to include sub-assembly operations. Eventually, we expect that machines designed specifically for the Chinese market will be produced at the Ningbo facility. We have a contract manufacturing agreement for computer control systems with Hurco Automation, Ltd., a Taiwanese company in which we have a 35% ownership interest. This company produces all of our computer control systems to our specifications, sources industry standard computer components and our proprietary parts, performs final assembly and conducts test operations. We work closely with our subsidiaries, key component suppliers and our minority-owned affiliate to ensure that their production capacity will be sufficient to meet the projected demand for our machine tool products. Many of the key components used in our machines can be sourced from multiple suppliers. However, any prolonged interruption of operations or significant reduction in the capacity or performance capability at either of our Taiwanese manufacturing facilities, or at any of our key component suppliers, could have a material adverse effect on our operations. Marketing and Distribution We sell our products through more than 100 independent agents and distributors throughout North America, Europe and Asia. Although some distributors carry competitive products, Hurco is the primary line for the majority of our distributors globally. We also have direct sales personnel in Canada, France, Germany, Italy, Singapore and the United Kingdom, which are among the world's principal machine tool consuming markets. Approximately 91% of the worldwide demand for computerized machine tools and computer control systems is outside the United States. In fiscal 2008, more than 75% of our revenues were from overseas customers. No single end-user or distributor of our products accounted for more than 5% of our total sales and service fees. The end-users of our products are precision tool, die and mold manufacturers, independent metal parts manufacturers, and specialized production application or prototype departments within large manufacturing companies. Industries served include aerospace, defense, medical equipment, energy, automotive/transportation, electronics and computer equipment.
7
We also sell our Autobend® computer control systems to original equipment manufacturers of new metal fabrication machine tools who integrate them with their own products prior to the sale of those products to their own customers, to retrofitters of used metal fabrication machine tools who integrate them with those machines as part of the retrofitting operation, and to end-users who have an installed base of metal fabrication machine tools, either with or without related computer control systems. Demand We believe that advances in industrial technology and the related demand for automated process improvements drive demand for our products. Other factors affecting demand include:
• the need to continuously improve productivity and shorten cycle time • an aging machine tool installed base that will require replacement with more advanced and
efficient technology created by shorter product life cycles • the industrial development of emerging markets in Asia and Eastern Europe • the declining supply of skilled machinists
Demand for our products is also highly dependent upon economic conditions and the general level of business confidence, as well as such factors as production capacity utilization and changes in governmental policies regarding tariffs, corporate taxation, and other investment incentives. By marketing and distributing our products on a worldwide basis, we seek to reduce the impact of adverse changes in economic conditions that might occur in a particular geographic region. For additional information regarding current economic conditions and their impact on our results of operation and financial condition, refer to Item 7. Management’s Discussion and Analysis of Financial Condition and Results of Operations. Competition We compete with many other machine tool producers in the United States and foreign countries. Most of our competitors are larger and have greater financial resources than our company. In the United States and European metal cutting markets, major competitors include Haas Automation, Inc., Daewoo, Miltronics, Deckel Maho Gildemeister Group (DMG), Hardinge Inc. and MAG Industrial Automation Systems. There are also a large number of other foreign manufacturers, including Okuma Machinery Works Ltd., Mori Seiki Co., Ltd., Mazak and Matsuura Machinery Corporation. We strive to compete effectively by incorporating into our products unique, patented software and other proprietary features that offer enhanced productivity, technological capabilities and ease of use. We offer our products in a range of prices and capabilities to target a broad potential market. We also believe that our competitiveness is aided by our reputation for reliability and quality, our strong international sales and distribution organization, and our extensive customer service organization. Intellectual Property We consider our products to be proprietary. Various features of our control systems and machine tools employ technologies covered by patents that are material to our business. We also own additional patents covering new technologies that we have acquired or developed, and that we are planning to incorporate into our control systems in the future.

8
Research and Development
In the fiscal years set forth below, non-capitalized research and development expenditures for new products and significant product improvements and expenditures related to software development projects that were capitalized were as follows (in thousands):
Fiscal Year
Non-capitalizedresearch and development
Capitalized software
development
2008 $ 3,000 $ 900 2007 3,100 1,200 2006 2,500 2,100
Employees We had approximately 430 full-time employees at the end of fiscal 2008, none of whom were covered by a collective-bargaining agreement or represented by a union. We have experienced no employee-generated work stoppages or disruptions and we consider our employee relations to be satisfactory. Geographic Areas Financial information about geographic areas in which we sell our products is set forth in Note 15 of Notes to Consolidated Financial Statements. The risks of doing business on a global basis are set forth in Item 1A. Risk Factors below. Backlog For information on orders and backlog, see Item 7. Management’s Discussion and Analysis of Financial Condition and Results of Operations. Availability of Reports and Other Information Our website is www.hurco.com. We make available on this website, free of charge, access to our annual, quarterly and current reports and other documents filed by us with the Securities and Exchange Commission (SEC) as soon as reasonably practical after the filing date. These reports can also be obtained at the SEC’s Public Reference Room at 100 F Street, NE Washington, DC 20549. Item 1A. RISK FACTORS In this section we describe what we believe to be the material risks related to our business. The risks and uncertainties described below or elsewhere in this report are not the only ones to which we are exposed. Additional risks and uncertainties not presently known and/or risks we currently deem immaterial may also adversely affect our business and operations. If any of the developments included in the following risks were to occur, our business, financial condition, results of operations, cash flows or prospects could be materially adversely affected. The current global economic crisis is adversely affecting overall demand and our customers’ ability to purchase our products and services. The current global economic crisis has severely impacted banks and other lenders, limiting the ability of many businesses to access the credit markets. As a result of the credit crisis and the overall decline in economic activity, the ability of our customers to purchase our products and services has been adversely affected, the initial impact of which was reflected in our results for the fourth quarter of fiscal 2008. An

9
overall decline in economic activity may also have an adverse affect on our customers and distributors ability to pay us for the products they purchased. A prolonged recession or further decline in the global economy will materially adversely affect our results of operations and financial condition. For additional information regarding current economic conditions and their impact on our results of operations and financial condition, refer to Item 7. Management’s Discussion and Analysis of Financial Condition and Results of Operations. The cyclical nature of our business causes fluctuations in our operating results. The machine tool industry is highly cyclical and changes in demand can occur abruptly in the geographic markets we serve. As a result of this cyclicality, we have experienced significant fluctuations in our sales, which, in periods of reduced demand have adversely affected our results of operations and financial condition. Our international operations pose additional risks that may adversely impact sales and earnings. During the fiscal year ended October 31, 2008, more than 75% of our revenues were derived from sales to customers located outside the United States. We also have manufacturing facilities and assets located outside of the United States. These international operations are subject to a number of risks, including:
• trade barriers • regional economic uncertainty • differing labor regulation • risk of governmental expropriation • domestic and foreign customs and tariffs • current and changing regulatory environments affecting the importation and exportation of
products and raw materials • difficulty in obtaining distribution support • difficulty in staffing and managing widespread operations • differences in the availability and terms of financing • political instability and unrest • risks of changes in taxes • tax implications from repatriation of funds
Quotas, tariffs, taxes or other trade barriers could require us to change manufacturing sources, reduce prices, increase spending on marketing or product development, withdraw from or not enter certain markets or otherwise take actions that could be adverse to us. Also, in some foreign jurisdictions, we may be subject to laws limiting the right and ability of entities organized or operating therein to pay dividends or remit earnings to affiliated companies unless specified conditions are met. These factors may adversely affect our future operating results. All of our products are shipped from our manufacturing facility in Taiwan from the Port of Taichung to three ports of destination: Los Angeles, California, Venlo, the Netherlands, and Singapore. Changes in customs requirements, as a result of national security or other constraints put upon these ports, may also have an adverse impact on our results of operations.
We depend on limited sources for our products. Our wholly owned subsidiary in Taiwan, Hurco Manufacturing Ltd. (HML), produces all of our machine tools. Any interruption in manufacturing at HML would have a material adverse effect on our results of operations and financial condition. Interruption in manufacturing at HML could result from a change in the political environment in Taiwan or a natural disaster, such as an earthquake, typhoon, or tsunami. Any interruption with one of our key component suppliers may also have a material adverse effect on our results of operations and financial condition.
10
Fluctuations in the exchange rates between the U.S. Dollar and any of several foreign currencies can increase our costs or decrease our revenues. Our international sales divisions generate more than 75% of our revenues, which are received in several foreign currencies, primarily the Euro and Pound Sterling. Therefore, our results of operations and financial condition are affected by fluctuations in exchange rates between these currencies and the U.S. Dollar, both for purposes of actual conversion and for financial reporting purposes. In addition, payments for components incorporated into our products are made in the New Taiwan Dollar. We hedge our foreign currency exposure with the purchase of forward exchange contracts. Hedge contracts only mitigate the impact of changes in foreign currency rates that occur during the term of the related hedge contract period. Refer to Item 7. Management’s Discussion and Analysis of Financial Condition and Results of Operations and Note 1 of Notes to Consolidated Financial Statements for the impact of translation of foreign currencies and hedging on the consolidated financial statements. Our competitive position and prospects for growth may be diminished if we are unable to develop and introduce new and enhanced products on a timely basis that are accepted in the market. The machine tool industry is subject to technological change, evolving industry standards, changing customer requirements, and improvements in and expansion of product offerings. Our ability to anticipate changes in technology, industry standards, customers’ requirements and competitors’ product offerings and to develop and introduce new and enhanced products on a timely basis that are accepted in the market, will be significant factors in maintaining and improving our competitive position and growth prospects. If the technologies or standards used in our products become obsolete or fail to gain widespread commercial acceptance, our business would be materially adversely affected. Although we believe that we have the technological capabilities to remain competitive, developments by others may render our products or technologies obsolete or noncompetitive. We compete with larger companies that have greater financial resources, and our business could be harmed by competitors’ actions. The markets in which our products are sold are extremely competitive and highly fragmented. In marketing our products, we compete with other manufacturers in terms of quality, reliability, price, value, delivery time, service and technological characteristics. We compete with a number of U.S., European and Asian competitors, most of which are larger, have substantially greater financial resources and are supported by governmental or financial institution subsidies. While we believe our product lines compete effectively, our financial resources are limited compared to those of most of our competitors, making it challenging to remain competitive. Fluctuation of the price of raw materials, especially steel and iron, could adversely affect our sales, costs and profitability. We manufacture products with a high iron and steel content for which worldwide prices can change significantly. The availability and price for these and other raw materials are subject to volatility due to worldwide supply and demand forces, speculative actions, inventory levels, exchange rates, production costs and anticipated or perceived shortages. In some cases, those cost increases can be passed on to customers in the form of price increases; in other cases they cannot. If the prices of raw materials increase and we are not able to charge our customers higher prices to compensate, it would adversely affect our results of operations. Due to future changes in technology, changes in market demand, or changes in market expectations, portions of our inventory may become obsolete or excess. The technology within our products changes and generally new versions of machines are brought to market in three to five year cycles. The phasing out of an old product involves estimating the amount of inventory to hold to satisfy the final demand for those machines and to satisfy future repair part needs. Based on changing customer demand and expectations of delivery times for repair parts, we may find that

11
we have either obsolete or excess inventory on hand. Because of unforeseen future changes in technology, market demand or competition, we might have to write off unusable inventory, which would adversely affect our results of operations. We may make acquisitions that could disrupt our operations and harm our operating results. Although we are not currently engaged in negotiations, and have no current plans for any acquisitions, we may seek to expand our product offerings or the markets we serve by acquiring other companies, product lines, technologies and personnel. Acquisitions involve numerous risks, including the following:
• difficulties integrating the operations, technologies, products, and personnel of the acquired companies
• diversion of management’s attention from normal daily operations of the business • potential difficulties completing projects associated with in-process research and development • difficulties entering markets in which we have no or limited prior experience, especially when
competitors in such markets have stronger market positions • initial dependence on unfamiliar supply chains or relatively small supply partners • insufficient revenues to offset increased expenses associated with acquisitions • the potential loss of key employees of the acquired companies
Acquisitions may also cause us to:
• issue common stock that would dilute our current shareholders’ percentage ownership • assume liabilities • record goodwill and non-amortizable intangible assets that will be subject to impairment testing
on a regular basis and potential periodic impairment charges • incur amortization expenses related to certain intangible assets • incur large and immediate write-offs, and restructuring and other related expenses • become subject to litigation
Mergers and acquisitions are inherently risky. No assurance can be given that our acquisitions will be successful. Further, no assurance can be given that acquisitions will not adversely affect our business, operating results, or financial condition. Failure to manage and successfully integrate acquisitions could harm our business and operating results in a material way. Even when an acquired company has already developed and marketed products, there can be no assurance that product enhancements will be made in a timely manner or that pre-acquisition due diligence will identify all possible issues that might arise with respect to such products. Risks related to new product development also apply to acquisitions. For additional information, please see the risk factor above entitled, “Due to future changes in technology, changes in market demand, or changes in market expectations, portions of our inventory may become obsolete or excess.” Intangible or other assets may become impaired, requiring us to record a significant charge to earnings. Under U.S. Generally Accepted Accounting Principles, we review our assets for impairment when events or changes in circumstances indicate the carrying value may not be recoverable. Intangible assets and our investment accounted for under the equity method are required to be tested for impairment at least annually. We could be required to record a significant charge to earnings in our financial statements for the period in which any impairment of these assets is determined, which would adversely affect our results of operations for that period.

12
Our continued success depends on our ability to protect our intellectual property. Our future success depends in part upon our ability to protect our intellectual property. We rely principally on nondisclosure agreements, other contractual arrangements, trade secret law, trademark and patent law, to protect our intellectual property. However, these measures may be inadequate to protect our intellectual property from infringement by others or prevent misappropriation of our proprietary rights. In addition, the laws of some foreign countries do not protect proprietary rights to the same extent as do U.S. laws. Our inability to protect our proprietary information and enforce our intellectual property rights through infringement proceedings could have a material adverse effect on our business, financial condition and results of operations. The unplanned loss of current members of our senior management team and other key personnel may adversely affect our operating results. The unexpected loss of senior management or other key personnel could impair our ability to carry out our business plan. We believe that our future success will depend in part on our ability to attract and retain highly skilled and qualified personnel. The loss of senior management or other key personnel may adversely affect our operating results as we incur costs to replace the departed personnel and potentially lose opportunities in the transition of important job functions. Item 1B. UNRESOLVED STAFF COMMENTS None.

13
Item 2. PROPERTIES The following table sets forth the location, size and principal use of each of our facilities:
Location Square Footage Principal Uses Indianapolis, Indiana 165,000 (1) Corporate headquarters, design and
engineering, product testing, sales and marketing, application engineering and customer service
Los Angeles, California 13,000 Warehouse, distribution, sales, application
engineering and customer service Dexter, Michigan 3,000 Sales, design engineering, product testing
and customer service Mississauga, Canada
3,600 Sales, application engineering andcustomer service
High Wycombe, England 12,000 Sales, application engineering and
customer service Paris, France 9,700 Sales, application engineering and
customer service Munich, and Rodermark, Germany
26,000 Sales, application engineering andcustomer service
Milan and Venice, Italy 13,000 Sales, application engineering and
customer service Singapore 9,300 Sales, application engineering and
customer service Shanghai, China 8,000 Sales, application engineering and
customer service Guangzhou, China 2,400 Sales, application engineering and
customer service Chennai, India 5,400 Sales, application engineering and
customer service Liegnitz, Poland 2,900 Sales, application engineering and
customer service Taichung, Taiwan 221,000 Manufacturing Ningbo, China 34,000 Manufacturing (1) Approximately 50,000 square feet is leased to a third-party under a lease, which expires April 30, 2010.
We own the Indianapolis facility and lease all other facilities. The leases have terms expiring at various dates ranging from September 2009 to May 2017. We believe that all of our facilities are well maintained and are adequate for our needs now and in the foreseeable future. We do not believe that we would experience any difficulty in replacing any of the present facilities if any of our leases were not renewed at expiration.
14
Item 3. LEGAL PROCEEDINGS
We are involved in various claims and lawsuits arising in the normal course of business. We do not expect any of these claims, individually or in the aggregate, to have a material adverse effect on our financial position or results of operations. Item 4. SUBMISSION OF MATTERS TO A VOTE OF SECURITY HOLDERS None. Executive Officers of the Registrant Executive officers are elected each year by the Board of Directors at the first board meeting following the Annual Meeting of Shareholders to serve during the ensuing year and until their respective successors are elected and qualified. There are no family relationships between any of our executive officers or between any of them and any of the members of the Board of Directors. The following information sets forth as of October 31, 2008, the name of each executive officer and his or her age, tenure as an officer, principal occupation and business experience for the last five years: Name Age Position(s) with the CompanyMichael Doar 53 Chairman of the Board and Chief Executive Officer James D. Fabris 57 President and Chief Operating OfficerJohn G. Oblazney 40 Vice President, Secretary, Treasurer and Chief Financial OfficerSonja K. McClelland 37 Corporate Controller, Assistant Secretary
Michael Doar was elected Chairman of the Board and Chief Executive Officer on November 14, 2001. Mr. Doar had held various management positions with Ingersoll Milling Machine Company from 1989 until 2001. Mr. Doar has been a director of Hurco since 2000. James D. Fabris was elected President and Chief Operating Officer on November 14, 2001. Mr. Fabris served as Executive Vice President - Operations from November 1997 until his current appointment and previously served as a Vice President of Hurco since February 1995. John G. Oblazney was elected Vice President, Secretary, Treasurer and Chief Financial Officer in September 2006. Prior to joining us, Mr. Oblazney served as the Chief Financial Officer of Carrier Corporation’s Light Commercial Business, a division of United Technologies Corporation, since December 2005. Prior to that, Mr. Oblazney served in various other financial positions with Carrier Corporation from 2000 to 2005. Prior to joining Carrier Corporation, Mr. Oblazney was employed for six years with Cooper Industries and employed three years by an international public accounting firm. Sonja K. McClelland has been employed by Hurco since September 1996 and was elected Corporate Controller, Assistant Secretary in November 2004. Ms. McClelland served as Corporate Accounting Manager from September 1996 to 1999, then as Division Controller for Hurco USA from September 1999 to November 2004. Prior to joining Hurco, Ms. McClelland was employed for three years by an international public accounting firm.

15
PART II Item 5. MARKET FOR THE REGISTRANT'S COMMON EQUITY, RELATED STOCKHOLDER MATTERS AND ISSUER PURCHASES OF EQUITY SECURITIES Our common stock is traded on the Nasdaq Global Select Market under the symbol “HURC”. The following table sets forth the high and low sale prices of the shares of our common stock for the periods indicated, as reported by the Nasdaq Global Select Market. 2008 2007Fiscal Quarter Ended: High Low High Low January 31 .............................................. $58.68 $30.24 $33.18 $24.61 April 30.................................................. 52.12 33.41 47.86 33.07 July 31 ................................................... 49.30 23.11 56.28 39.12 October 31 ............................................. 38.24 16.92 60.44 39.77 At January 7, 2009, the closing price of our common stock on the Nasdaq Global Select Market was $14.76. We do not currently pay dividends on our common stock and intend to continue to retain earnings for working capital, and capital expenditures. There were186 holders of record of our common stock as of January 7, 2009. During the period covered by this report, we did not sell any equity securities that were not registered under the Securities Act of 1933, as amended. The disclosure under the caption “Equity Compensation Plan Information” is included in Item 12. Security Ownership of Certain Beneficial Owners and Management and Related Stockholder Matters.
16
Item 6. SELECTED FINANCIAL DATA
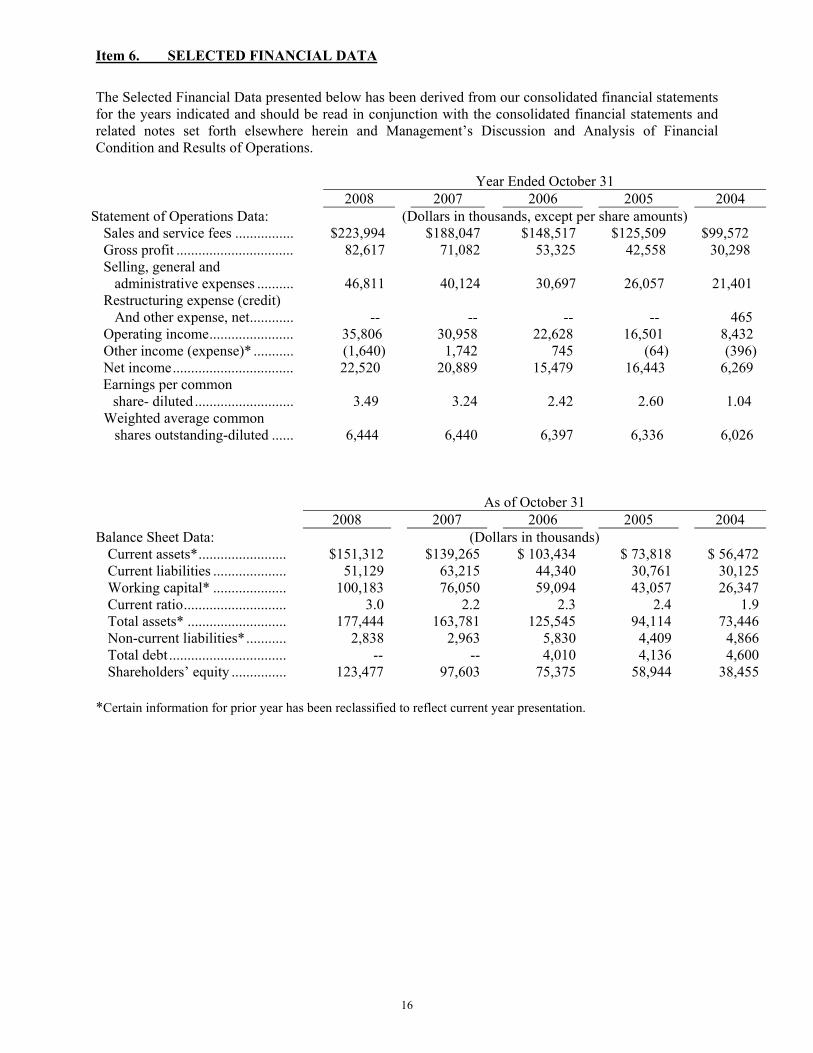
The Selected Financial Data presented below has been derived from our consolidated financial statements for the years indicated and should be read in conjunction with the consolidated financial statements and related notes set forth elsewhere herein and Management’s Discussion and Analysis of Financial Condition and Results of Operations.
Year Ended October 31 2008 2007 2006 2005 2004 Statement of Operations Data: (Dollars in thousands, except per share amounts) Sales and service fees ................ $223,994 $188,047 $148,517 $125,509 $99,572 Gross profit ................................ 82,617 71,082 53,325 42,558 30,298 Selling, general and administrative expenses ..........
46,811 40,124 30,697
26,057 21,401
Restructuring expense (credit) And other expense, net ............
-- -- --
--
465
Operating income ....................... 35,806 30,958 22,628 16,501 8,432 Other income (expense)* ........... (1,640) 1,742 745 (64) (396) Net income ................................. 22,520 20,889 15,479 16,443 6,269 Earnings per common share- diluted ...........................
3.49 3.24 2.42
2.60 1.04
Weighted average common shares outstanding-diluted ......
6,444 6,440 6,397
6,336 6,026
As of October 31 2008 2007 2006 2005 2004 Balance Sheet Data: (Dollars in thousands) Current assets* ........................ $151,312 $139,265 $ 103,434 $ 73,818 $ 56,472 Current liabilities .................... 51,129 63,215 44,340 30,761 30,125 Working capital* .................... 100,183 76,050 59,094 43,057 26,347 Current ratio ............................ 3.0 2.2 2.3 2.4 1.9 Total assets* ........................... 177,444 163,781 125,545 94,114 73,446 Non-current liabilities* ........... 2,838 2,963 5,830 4,409 4,866 Total debt ................................ -- -- 4,010 4,136 4,600 Shareholders’ equity ............... 123,477 97,603 75,375 58,944 38,455
*Certain information for prior year has been reclassified to reflect current year presentation.

17
Item 7. MANAGEMENT'S DISCUSSION AND ANALYSIS OF FINANCIAL CONDITION AND RESULTS OF OPERATIONS EXECUTIVE OVERVIEW Hurco Companies, Inc. is an industrial technology company operating in a single segment. We design and produce computerized machine tools, featuring our proprietary computer control systems and software, for sale through our own distribution network to the worldwide metal cutting market. We also provide software options, control upgrades, accessories and replacement parts for our products, as well as customer service and training support. The following overview is intended to provide a brief explanation of the principal factors that have contributed to our financial performance. This overview is intended to be read in conjunction with the more detailed information that follows and our audited financial statements that appear elsewhere in this report. The primary drivers of our operational performance in the past three years have been improved worldwide demand for our products, the increasing acceptance of our expanded product line and our success in selling and manufacturing outside of the United States. The market for machine tools is an international market. We have both significant foreign sales and manufacturing operations. During fiscal 2008, more than 75% of our revenues were attributable to customers located abroad. The percentage of revenues to customers located abroad has increased during the last fiscal year due in part to deterioration of the North American market for machine tool products, as well as the effect of a weaker U.S. Dollar when translating foreign sales to U.S. Dollars for financial reporting purposes. We sell our products through more than 100 independent agents and distributors in countries throughout North America, Europe and Asia. We also have our own direct sales and service organizations in Canada, France, Germany, Italy, Singapore and the United Kingdom. Our computerized metal cutting machine tools are manufactured in Taiwan to our specifications by our wholly owned subsidiary, Hurco Manufacturing Limited (HML). Our sales to foreign customers are denominated, and payments by those customers are made in the prevailing currencies—primarily the Euro and Pound Sterling—in the countries in which those customers are located, and our product costs are incurred and paid primarily in the New Taiwan Dollar and the U.S. Dollar. Changes in currency exchange rates may have a material effect on our operating results and consolidated balance sheets as reported under U.S. Generally Accepted Accounting Principles. For example, when a foreign currency increases in value relative to the U.S. Dollar, sales made (and expenses incurred) in that currency, when translated to U.S. Dollars for reporting in our financial statements, are higher than would be the case when that currency has a lower value relative to the U.S. Dollar. In our comparison of period-to-period results, we discuss not only the increases or decreases in those results as reported in our financial statements (which reflect translation to U.S. Dollars at exchange rates prevailing during the period covered by those financial statements), but also the effect that changes in exchange rates had on those results. For additional information on the impact of translation of foreign currencies and our hedging practices, see Note 1 of Notes to Consolidated Financial Statements. Our high levels of foreign manufacturing and sales also subject us to cash flow risks due to fluctuating currency exchange rates. We seek to mitigate those risks through the use of various derivative instruments – principally foreign currency forward exchange contracts. We experienced changes in material costs from inflation in fiscal 2008, which caused our gross margin to decline. While some material costs have recently declined, our production cycle of approximately six months requires us to establish material costs at the time a purchase order is accepted, when costs may have been higher. Government sources have confirmed that the U.S. economy has been in a recession since December 2007. We first experienced a decline in sales orders in our North American market during the first quarter of

18
fiscal 2008. The deterioration in that market continued and became more severe in subsequent quarters. During the second half of calendar year 2008, the recession became global in scope, impacting every market we serve and significantly affecting our sales and orders during the fourth fiscal quarter. Our sales in the fourth quarter of fiscal 2008 were 5.3% lower than in the corresponding quarter of fiscal 2007 and, most significantly, 17.2% below those of the third quarter of 2008. Similarly, our new orders in the fourth quarter of fiscal 2008 declined 27.0% from their level in the corresponding quarter of fiscal 2007 and 23.7% below the third quarter of fiscal 2008. Economic conditions have continued to worsen since the beginning of fiscal 2009. Many economists have indicated that the current deterioration in the global markets will remain or become more severe and continue for a prolonged period of time. During the fourth quarter, we implemented various initiatives to reduce expenses while staying committed to our strategic plan of product innovation and penetration of developing markets. We have also taken steps to reduce our inventories to reflect the decline in customer demand. Since our production lead time is approximately six months, the impact of reduced production levels on our inventories may take several quarters to be fully realized. We believe that, notwithstanding the severity of the current economic crisis, our company remains fundamentally stable. We have a broad product line due to recent new product introductions, no outstanding debt and a strong cash position. Results of Operations The following table presents, for the fiscal years indicated, selected items from the Consolidated Statements of Income expressed as a percentage of our worldwide sales and service fees and the year-to-year percentage changes in the dollar amounts of those items. Percentage of Revenues Year-to-Year % Change 2008 2007 2006 Increase (Decrease) ’08 vs. ’07 ’07 vs. ’06 Sales and service fees ........... 100.0% 100.0% 100.0% 19.1% 26.6% Gross profit .......................... 36.9% 37.8% 35.9% 16.2% 33.3% Selling, general and administrative expenses ....
20.9%
21.3%
20.7%
16.7%
30.7%
Operating income ................. 16.0% 16.5% 15.2% 15.7% 36.8% Other income (expense)* ..... (0.7%) 0.9% 0.5% (194.1%) 133.8% Net income ........................... 10.1% 11.1% 10.4% 7.8% 35.0% *Certain information for prior years has been reclassified to reflect current year presentation. Fiscal 2008 Compared to Fiscal 2007 Sales and Service Fees. Notwithstanding the severe decline in the fourth quarter of fiscal 2008, annual sales and service fees were the highest in our 40-year history, totaling $224.0 million, an increase of $35.9 million, or 19.1%, over fiscal 2007. Of this increase, $22.7 million was attributable to operational growth and approximately $13.2 million was due to the favorable effect of a weakening U.S. Dollar on currency translation. Computerized machine tool sales, which also were the highest in our history, totaled $199.2 million, an increase of 20.1% from the $165.8 million recorded in 2007, primarily driven by strong customer demand in European markets during the first nine months of the fiscal year, particularly for our higher end VMX product line.

19
Net Sales and Service Fees by Geographic Region The following table sets forth net sales and service fees by geographic region for the years ended October 31, 2008 and 2007 (in thousands): October 31, Increase (Decrease) 2008 2007 Amount % North America $ 48,373 21.6% $ 52,133 27.7% $ (3,760) (7.2%) Europe 163,807 73.1% 125,446 66.7% 38,361 30.6% Asia Pacific 11,814 5.3% 10,468 5.6% 1,346 12.9%
Total $223,994 100.0% $188,047 100.0% $ 35,947 19.1% In North America, sales and service fees decreased 7.2% as unit volumes decreased by 14.9% primarily in the second half of the year as a result of the global economic slowdown. This decrease in volume was partially offset by improved product mix. European sales and service fees increased by 30.6%, which includes a favorable impact due to changing currency rates of $12.4 million, or 9.9%. Unit sales increased by 11.5% in fiscal 2008 compared to fiscal 2007 as a result of a strong European market during the first three quarters of the fiscal year and continued expansion into eastern European markets. The remaining 9.2% of growth in European sales and service fees was primarily derived by continued demand for our higher end VMX product line. Sales and service fees in the Asia Pacific region increased by 12.9%, due to penetration into new markets along with the favorable impact of changes due to currency exchange rates of $778,000, or 7.4%. Net Sales and Service Fees by Product Category The following table sets forth net sales and service fees by product category for the years ended October 31, 2008 and 2007 (in thousands): October 31, Increase 2008 2007 Amount % Computerized Machine Tools $199,238 88.9% $165,832 88.2% $33,406 20.1% Service Fees, Parts and Other 24,756 11.1% 22,215 11.8% 2,541 11.4% Total $223,994 100.0% $188,047 100.0% $35,947 19.1%
Sales of computerized machine tools totaled $199.2 million in fiscal 2008, an increase of $33.4 million, or 20.1%, primarily driven by a strong European market and continued demand for our higher end VMX product line. Orders and Backlog. New order bookings in fiscal 2008, were $212.5 million, an increase of $13.6 million, or 6.8%, over the prior year. Orders for fiscal 2008 compared to fiscal 2007 were favorably affected by approximately $11.7 million, or 5.9%, due to changes in currency exchange rates. Unit orders increased 1.1% in Europe and decreased by 18.0% and 11.5% in North America and Asia Pacific, respectively. These order rates were significantly impacted by an overall fourth quarter decline in unit orders of 32.4%. Orders declined in all regions as our customers reacted to the sudden downturn in the markets they serve and limitations on their own ability to access the credit markets. Backlog was $15.7 million at October 31, 2008, compared to $29.4 million at October 31, 2007. We do not believe backlog is a useful measure of past performance or indicative of future performance. Backlog orders as of October 31, 2008 are expected to be fulfilled in fiscal 2009.
20
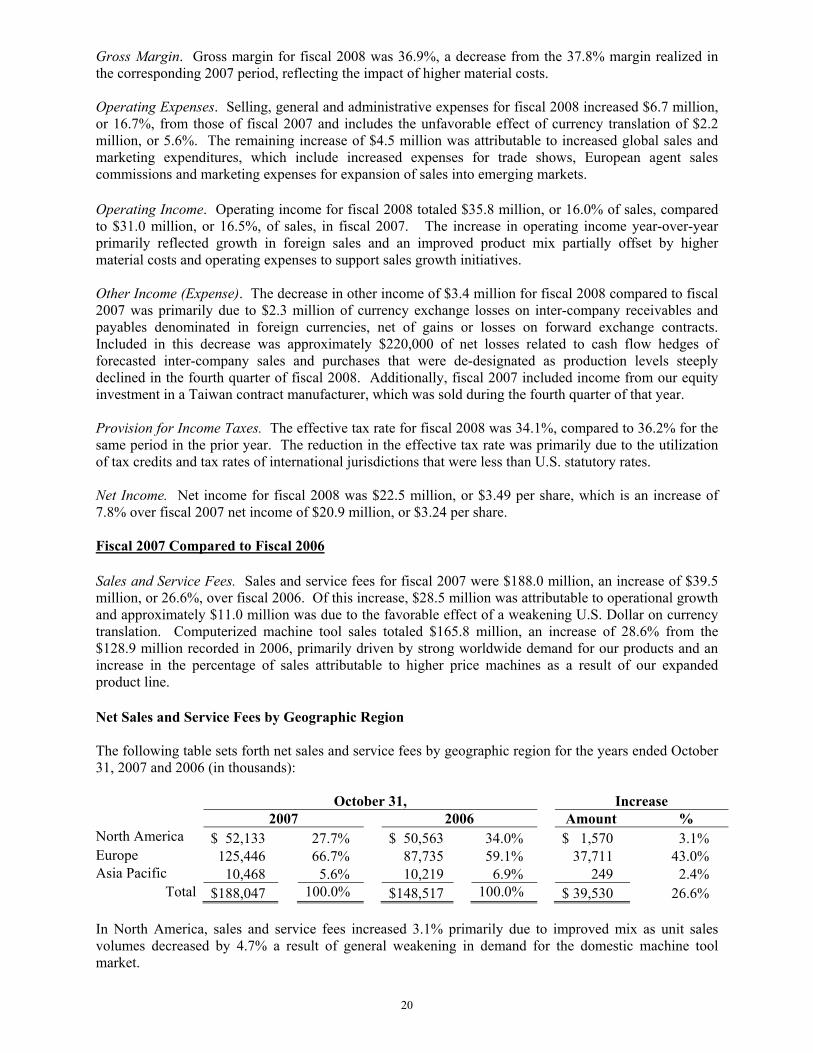
Gross Margin. Gross margin for fiscal 2008 was 36.9%, a decrease from the 37.8% margin realized in the corresponding 2007 period, reflecting the impact of higher material costs. Operating Expenses. Selling, general and administrative expenses for fiscal 2008 increased $6.7 million, or 16.7%, from those of fiscal 2007 and includes the unfavorable effect of currency translation of $2.2 million, or 5.6%. The remaining increase of $4.5 million was attributable to increased global sales and marketing expenditures, which include increased expenses for trade shows, European agent sales commissions and marketing expenses for expansion of sales into emerging markets. Operating Income. Operating income for fiscal 2008 totaled $35.8 million, or 16.0% of sales, compared to $31.0 million, or 16.5%, of sales, in fiscal 2007. The increase in operating income year-over-year primarily reflected growth in foreign sales and an improved product mix partially offset by higher material costs and operating expenses to support sales growth initiatives. Other Income (Expense). The decrease in other income of $3.4 million for fiscal 2008 compared to fiscal 2007 was primarily due to $2.3 million of currency exchange losses on inter-company receivables and payables denominated in foreign currencies, net of gains or losses on forward exchange contracts. Included in this decrease was approximately $220,000 of net losses related to cash flow hedges of forecasted inter-company sales and purchases that were de-designated as production levels steeply declined in the fourth quarter of fiscal 2008. Additionally, fiscal 2007 included income from our equity investment in a Taiwan contract manufacturer, which was sold during the fourth quarter of that year. Provision for Income Taxes. The effective tax rate for fiscal 2008 was 34.1%, compared to 36.2% for the same period in the prior year. The reduction in the effective tax rate was primarily due to the utilization of tax credits and tax rates of international jurisdictions that were less than U.S. statutory rates. Net Income. Net income for fiscal 2008 was $22.5 million, or $3.49 per share, which is an increase of 7.8% over fiscal 2007 net income of $20.9 million, or $3.24 per share. Fiscal 2007 Compared to Fiscal 2006 Sales and Service Fees. Sales and service fees for fiscal 2007 were $188.0 million, an increase of $39.5 million, or 26.6%, over fiscal 2006. Of this increase, $28.5 million was attributable to operational growth and approximately $11.0 million was due to the favorable effect of a weakening U.S. Dollar on currency translation. Computerized machine tool sales totaled $165.8 million, an increase of 28.6% from the $128.9 million recorded in 2006, primarily driven by strong worldwide demand for our products and an increase in the percentage of sales attributable to higher price machines as a result of our expanded product line. Net Sales and Service Fees by Geographic Region The following table sets forth net sales and service fees by geographic region for the years ended October 31, 2007 and 2006 (in thousands): October 31, Increase 2007 2006 Amount % North America $ 52,133 27.7% $ 50,563 34.0% $ 1,570 3.1% Europe 125,446 66.7% 87,735 59.1% 37,711 43.0% Asia Pacific 10,468 5.6% 10,219 6.9% 249 2.4%
Total $188,047 100.0% $148,517 100.0% $ 39,530 26.6% In North America, sales and service fees increased 3.1% primarily due to improved mix as unit sales volumes decreased by 4.7% a result of general weakening in demand for the domestic machine tool market.

21
European sales and service fees increased by 43.0%, which includes a favorable impact due to changing currency rates of $10.5 million, or 11.9%. Unit sales increased by 28.0% in fiscal 2007 compared to fiscal 2006 as a result of a strong European market and continued expansion into eastern European markets. The remaining 15.0% of growth in European sales and service fees was primarily derived by continued demand for our higher end VMX product line. Sales and service fees in the Asia Pacific region increased by 2.4%, due to increased volume of larger higher priced machines, partially offset by a 10.1% decline in overall unit volume. The effect of a weaker U.S. Dollar when translating foreign sales for financial reporting purposes had a favorable impact of approximately $539,000, or 5.3%, on this region’s sales comparison for the full year. Net Sales and Service Fees by Product Category The following table sets forth net sales and service fees by product category for the years ended October 31, 2007 and 2006 (in thousands): October 31, Increase 2007 2006 Amount % Computerized Machine Tools $165,832 88.2% $128,946 86.8% $36,886 28.6% Service Fees, Parts and Other 22,215 11.8% 19,571 13.2% 2,644 13.5% Total $188,047 100.0% $148,517 100.0% $39,530 26.6%
Sales of computerized machine tools totaled $165.8 million in fiscal 2007, an increase of $36.9 million, or 28.6%, primarily driven by a strong European market and continued demand for our higher end VMX product line. Orders and Backlog. New order bookings in fiscal 2007 were $199.0 million, an increase of $44.2 million, or 28.6%, over the prior year. New order bookings increased by 6.1%, 43.6% and 5.2% in North America, Europe and Asia Pacific, respectively. Europe was the primary contributor to the increased orders, driven by a strong market, expansion into new markets and favorable product mix. Unit orders increased 26.1% in Europe and decreased by 6.7% and 10.7% in North America and Asia Pacific, respectively. The reduction in North America was primarily due to a general weakening in demand for the domestic machine tool market, while Asia Pacific orders were down slightly due to continued development of the selling channels in China and India. Orders for fiscal 2007 compared to fiscal 2006 were favorably affected by approximately $11.7 million, or 7.5%, due to changes in currency exchange rates. Backlog was $29.4 million at October 31, 2007, compared to $16.1 million at October 31, 2006. We do not believe backlog is a useful measure of past performance or indicative of future performance. Backlog orders as of October 31, 2007 are expected to be fulfilled in fiscal 2008. Gross Margin. Gross margin for fiscal 2007 was 37.8%, an increase over the 35.9% margin realized in the corresponding 2006 period, reflecting the impact of higher sales and improved mix. Operating Expenses. Selling, general and administrative expenses for fiscal 2007 of $40.1 million increased $9.4 million, or 30.7%, from those of fiscal 2006 and includes the unfavorable effect of currency translation of $1.5 million, or 5.0%. The increase was attributable to a $571,000 increase in product development expenses, a $4.5 million increase in global sales and marketing expenditures and a $4.4 million increase in general and administrative expenses. The increased global sales and marketing expenditures include increased expenses for local trade shows, increased European agent sales commissions and marketing expenses for expansion of sales into emerging markets. General and administrative expenses increased primarily as a result of incentive compensation, incremental healthcare related benefits, and increases in other miscellaneous administrative expenses.

22
Operating Income. Operating income for fiscal 2007 totaled $31.0 million, or 16.5% of sales, compared to $22.6 million or 15.2% of sales, in fiscal 2006. The increase in operating income year-over-year primarily reflected growth in foreign sales and service fees and improved mix partially offset by higher operating expenses. Other Income (Expense). Other income (expense), net in fiscal 2007 relates primarily to increased income from investments in minority-owned contract manufacturers in Taiwan accounted for under the equity method, tax deferred income earned on investments of cash, and currency exchange gains on inter-company receivables and payables denominated in foreign currencies, net of gains or losses on related forward contracts. Provision for Income Taxes. The effective tax rate for fiscal 2007 was 36.2%, compared to 33.0% for the same period in the prior year. The 2006 lower effective tax rate was primarily due to a deduction generated from a change in tax code. Net Income. Net income for fiscal 2007 was $20.9 million, or $3.24 per share, which is an increase of 35.0% over fiscal 2006 net income of $15.5 million, or $2.42 per share. Liquidity and Capital Resources At October 31, 2008, we had cash and cash equivalents of $26.4 million compared to $29.8 million at October 31, 2007. Approximately 54.9% of the $26.4 million of cash and cash equivalents is denominated in U.S. Dollars. The remaining balances are denominated in the local currencies of our various foreign entities and are subject to fluctuations in currency exchange rates. Working capital, excluding cash and short-term debt, was $67.1 million at October 31, 2008, compared to $36.3 million at October 31, 2007. The increase in working capital primarily relates to increased derivative assets related to unrealized gains on forward exchange contracts, increased accounts receivable, increased inventory due to the recent decline in demand and the introduction of new products, and a reduction in accounts payable as a result of the cutback in production volume. Capital expenditures were $5.5 million in fiscal 2008, $4.5 million in fiscal 2007, and $3.3 million in fiscal 2006. Capital expenditures were primarily for an integrated computer system, software development projects and purchases of equipment related to expansion of our manufacturing facilities. We funded these expenditures with cash flow from operations.
As of October 31, 2008, we had no debt or borrowings outstanding under any of our bank credit facilities.
We have an effective “shelf” registration statement on file with the SEC that allows us to offer and sell a variety of securities, including common stock, preferred stock, warrants, depositary shares and debt securities, up to an aggregate amount of $200.0 million, if and when authorized by the Board of Directors. As of October 31, 2008 we had $6.7 million in investments of auction rate securities. During December 2008, our auction rates securities were sold at par value. Although we have not made any significant acquisitions in the recent past, we continue to receive information on businesses and assets, including intellectual property assets that are being sold. Should attractive opportunities arise, we believe that our earnings, cash flow from operations, borrowings under our bank credit facilities, and the sale of securities from our shelf registration would provide sufficient resources to finance a possible acquisition.

23
Contractual Obligations and Commitments The following is a table of contractual obligations and commitments as of October 31, 2008 (all amounts in thousands):
Payments Due by Period
Total
Less than
1 Year
1-3
Years
3-5
Years
More than 5 Years
Operating Leases ........................... $ 6,500 $ 2,533 $ 2,410 $ 1,017 $ 540 Deferred Credits and Other ........... 782 -- -- -- 782 Total .......................................... $ 7,282 $ 2,533 $ 2,410 $ 1,017 $ 1,332 In addition to the contractual obligations and commitments disclosed above, we also have a variety of other obligations for the procurement of materials and services, none of which subject us to any material non-cancelable commitments. While some of these obligations arise under long-term supply agreements, we are not committed under these agreements to accept or pay for requirements that are not needed to meet our production needs. We have no material minimum purchase commitments or “take-or-pay” type agreements or arrangements. Unrecognized tax benefits in the amount of approximately $613,000 have been excluded from the table above because we are unable to determine a reasonably reliable estimate of the timing of future payment. We expect capital spending in fiscal 2009 to be approximately $4.4 million, which includes investments for capitalized software, capital equipment and costs to continue implementation of our integrated computer system. We will fund these commitments with cash on hand and income from operations. Off Balance Sheet Arrangements From time to time, our subsidiaries guarantee third party payment obligations in connection with the sale of machines to customers that use financing. At October 31, 2008, 56 such guarantees were outstanding totaling approximately $1.7 million. Upon shipment, the customer has the risk of ownership. The customer does not obtain title until the machine is paid in full. We believe that the proceeds obtained from liquidation of the machine would cover any payments required by the guarantee. Critical Accounting Policies and Estimates Our discussion and analysis of financial condition and results of operations is based upon our consolidated financial statements, which have been prepared in accordance with U.S. Generally Accepted Accounting Principles. The preparation of financial statements in conformity with those accounting principles require us to make judgments and estimates that affect the amounts reported in the consolidated financial statements and accompanying notes. Those judgments and estimates have a significant effect on the financial statements because they result primarily from the need to make estimates about the effects of matters that are inherently uncertain. Actual results could differ from those estimates. We frequently re-evaluate our judgments and estimates that are based upon historical experience and on various other assumptions that are believed to be reasonable under the circumstances. We do not believe we have any critical accounting policies or estimates. We have evaluated our significant accounting policies and estimates that are disclosed in Note 1 of the Notes to Consolidated Financial Statements.

24
Item 7a. QUANTITATIVE AND QUALITATIVE DISCLOSURES ABOUT MARKET RISKS Interest Rate Risk We had no borrowings outstanding under our bank credit facilities at October 31, 2008 and have not borrowed from our bank credit facilities since February 2005. Note 5 of Notes to Consolidated Financial Statements set forth the interest rates related to our current credit facilities. Foreign Currency Exchange Risk In fiscal 2008, we derived more than 75% of our revenues, including export sales, from foreign markets. All of our computerized machine tools and computer control systems, as well as certain proprietary service parts, are sourced by our U.S.-based engineering and manufacturing division and re-invoiced to our foreign sales and service subsidiaries, primarily in their functional currencies. Our products components are sourced from foreign suppliers and built to our specifications by our wholly owned subsidiary in Taiwan. Our purchases are predominantly in foreign currencies and in some cases our arrangements with these suppliers include foreign currency risk sharing agreements, which reduce (but do not eliminate) the effects of currency fluctuations on product costs. The predominant portion of the exchange rate risk associated with our product purchases relates to the New Taiwan Dollar. We enter into foreign currency forward exchange contracts from time to time to hedge the cash flow risk related to forecasted inter-company sales and forecasted inter-company and third party purchases denominated in, or based on, foreign currencies (primarily the Euro, Pound Sterling, and New Taiwan Dollar). We also enter into foreign currency forward exchange contracts to protect against the effects of foreign currency fluctuations on receivables and payables denominated in foreign currencies. We do not speculate in the financial markets and, therefore, do not enter into these contracts for trading purposes. Forward contracts for the sale or purchase of foreign currencies as of October 31, 2008, which are designated as cash flow hedges under FASB Statement 133, “Accounting Standards for Derivative Instruments and Hedging Activities,” were as follows:
Forward Contracts
Notional Amount
in Foreign Currency
Weighted
Avg. Forward
Rate
Contract Amount at Forward Rates in
U.S. Dollars Contract
Date October 31,
2008 Maturity
Dates Sale Contracts:
Euro 33,400,000 $1.5046 $52,252,730 $42,500,042 Nov 2008-Oct 2009 Sterling 4,215,000 $1.9247 $ 8,112,611 $ 6,756,793 Nov 2008-Oct 2009 Purchase Contracts: New Taiwan Dollar 990,000,000 30.15* $32,834,950 $30,266,754 Nov 2008-Oct 2009 *NT Dollars per U.S. Dollar
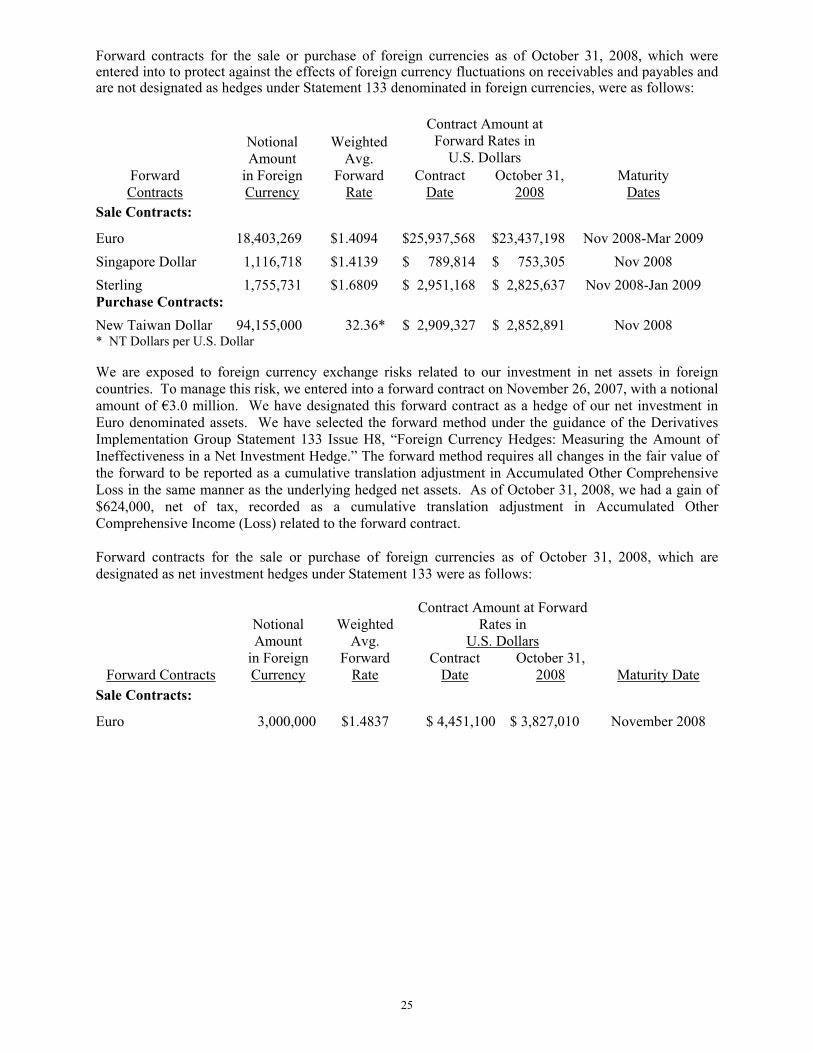
25
Forward contracts for the sale or purchase of foreign currencies as of October 31, 2008, which were entered into to protect against the effects of foreign currency fluctuations on receivables and payables and are not designated as hedges under Statement 133 denominated in foreign currencies, were as follows:
Forward Contracts
Notional Amount
in Foreign Currency
Weighted Avg.
Forward Rate
Contract Amount at Forward Rates in
U.S. Dollars
Contract Date
October 31, 2008
Maturity Dates
Sale Contracts:
Euro 18,403,269 $1.4094 $25,937,568 $23,437,198 Nov 2008-Mar 2009 Singapore Dollar 1,116,718 $1.4139 $ 789,814 $ 753,305 Nov 2008 Sterling 1,755,731 $1.6809 $ 2,951,168 $ 2,825,637 Nov 2008-Jan 2009 Purchase Contracts: New Taiwan Dollar 94,155,000 32.36* $ 2,909,327 $ 2,852,891 Nov 2008 * NT Dollars per U.S. Dollar We are exposed to foreign currency exchange risks related to our investment in net assets in foreign countries. To manage this risk, we entered into a forward contract on November 26, 2007, with a notional amount of €3.0 million. We have designated this forward contract as a hedge of our net investment in Euro denominated assets. We have selected the forward method under the guidance of the Derivatives Implementation Group Statement 133 Issue H8, “Foreign Currency Hedges: Measuring the Amount of Ineffectiveness in a Net Investment Hedge.” The forward method requires all changes in the fair value of the forward to be reported as a cumulative translation adjustment in Accumulated Other Comprehensive Loss in the same manner as the underlying hedged net assets. As of October 31, 2008, we had a gain of $624,000, net of tax, recorded as a cumulative translation adjustment in Accumulated Other Comprehensive Income (Loss) related to the forward contract. Forward contracts for the sale or purchase of foreign currencies as of October 31, 2008, which are designated as net investment hedges under Statement 133 were as follows:
Notional Amount
Weighted Avg.
Contract Amount at Forward Rates in
U.S. Dollars
Forward Contracts in Foreign Currency
Forward Rate
Contract Date
October 31, 2008 Maturity Date
Sale Contracts:
Euro 3,000,000 $1.4837 $ 4,451,100 $ 3,827,010 November 2008

26
Management’s Annual Report on Internal Control Over Financial Reporting To the Shareholders and Board of Directors of Hurco Companies, Inc.: Management of Hurco Companies, Inc. (the “Company”), has assessed the effectiveness of internal controls over financial reporting as of October 31, 2008, based on criteria established in Internal Control—Integrated Framework issued by the Committee of Sponsoring Organizations of the Treadway Commission (COSO). Management is responsible for these financial statements, for maintaining effective internal control over financial reporting, and for its assessment of the effectiveness of internal control over financial reporting. Because of its inherent limitations, the Company’s internal control over financial reporting may not prevent or detect misstatements. Also, projections of any evaluation of effectiveness to future periods are subject to the risk that controls may become inadequate because of changes in conditions, or that the degree of compliance with the policies or procedures may deteriorate. In management’s opinion, the Company’s internal controls over financial reporting as of October 31, 2008, are effective based on the criteria specified above. Our independent registered accounting firm, Crowe Horwath, LLP, who also audited our consolidated financial statements, audited the effectiveness of our internal control over financial reporting. Crowe Horwath LLP has issued their attestation report, which is included in Part II, Item 8 of this Annual Report on Form 10-K. /s/ Michael Doar Michael Doar, Chairman of the Board & Chief Executive Officer /s/ John G. Oblazney John G. Oblazney, Vice President & Chief Financial Officer /s/ Sonja K. McClelland Sonja K. McClelland Corporate Controller, Assistant Secretary (Principal Accounting Officer) Indianapolis, Indiana January 12, 2009

27
Item 8. FINANCIAL STATEMENTS AND SUPPLEMENTARY DATA Report of Independent Registered Public Accounting Firm To the Shareholders and Board of Directors of Hurco Companies, Inc. We have audited the accompanying consolidated balance sheets of Hurco Companies, Inc. and Subsidiaries as of October 31, 2008, and 2007, and the related consolidated statements of income, changes in shareholders’ equity and cash flows for each of the three years in the period ended October 31, 2008. In connection with our audits of the consolidated financial statements, we also have audited the consolidated financial statement schedule listed in the index under Item 15. We also have audited the Company’s internal control over financial reporting as of October 31, 2008, based on criteria established in Internal Control – Integrated Framework issued by the Committee of Sponsoring Organizations of the Treadway Commission (COSO). Hurco Companies, Inc. management is responsible for these financial statements and the financial statement schedule, for maintaining effective internal control over financial reporting, and for its assessment of the effectiveness of internal control over financial reporting included in the accompanying management’s annual report on internal control over financial reporting. Our responsibility is to express an opinion on these financial statements and the financial statement schedule and an opinion on the company’s internal control over financial reporting based on our audits. We conducted our audits in accordance with the standards of the Public Company Accounting Oversight Board (United States). Those standards require that we plan and perform the audits to obtain reasonable assurance about whether the financial statements are free of material misstatement and whether effective internal control over financial reporting was maintained in all material respects. Our audits of the financial statements included examining, on a test basis, evidence supporting the amounts and disclosures in the financial statements, assessing the accounting principles used and significant estimates made by management, and evaluating the overall financial statement presentation. Our audit of internal control over financial reporting included obtaining an understanding of internal control over financial reporting, assessing the risk that a material weakness exists, and testing and evaluating the design and operating effectiveness of internal control based on the assessed risk. Our audits also included performing such other procedures as we considered necessary in the circumstances. We believe that our audits provide a reasonable basis for our opinions. A company's internal control over financial reporting is a process designed to provide reasonable assurance regarding the reliability of financial reporting and the preparation of financial statements for external purposes in accordance with U.S. generally accepted accounting principles. A company's internal control over financial reporting includes those policies and procedures that (1) pertain to the maintenance of records that, in reasonable detail, accurately and fairly reflect the transactions and dispositions of the assets of the company; (2) provide reasonable assurance that transactions are recorded as necessary to permit preparation of financial statements in accordance with U.S. generally accepted accounting principles, and that receipts and expenditures of the company are being made only in accordance with authorizations of management and directors of the company; and (3) provide reasonable assurance regarding prevention or timely detection of unauthorized acquisition, use, or disposition of the company's assets that could have a material effect on the financial statements. Because of its inherent limitations, internal control over financial reporting may not prevent or detect misstatements. Also, projections of any evaluation of effectiveness to future periods are subject to the risk that controls may become inadequate because of changes in conditions, or that the degree of compliance with the policies or procedures may deteriorate.

28
In our opinion, the consolidated financial statements referred to above present fairly, in all material respects, the financial position of Hurco Companies, Inc and Subsidiaries as of October 31, 2008 and 2007, and the results of their operations and their cash flows for each of the three years in the period ended October 31, 2008 in conformity with accounting principles generally accepted in the United States of America. Also, in our opinion, the related consolidated financial statement schedule, when considered in relation to the basic consolidated financial statements taken as a whole, presents fairly, in all material respects, the information set forth therein. Also, in our opinion, Hurco Companies, Inc. and Subsidiaries maintained, in all material respects, effective internal control over financial reporting as of October 31, 2008, based on criteria established in Internal Control-Integrated Framework issued by the Committee of Sponsoring Organizations of the Treadway Commission (COSO). /s/Crowe Horwath LLP Indianapolis, Indiana January 12, 2009
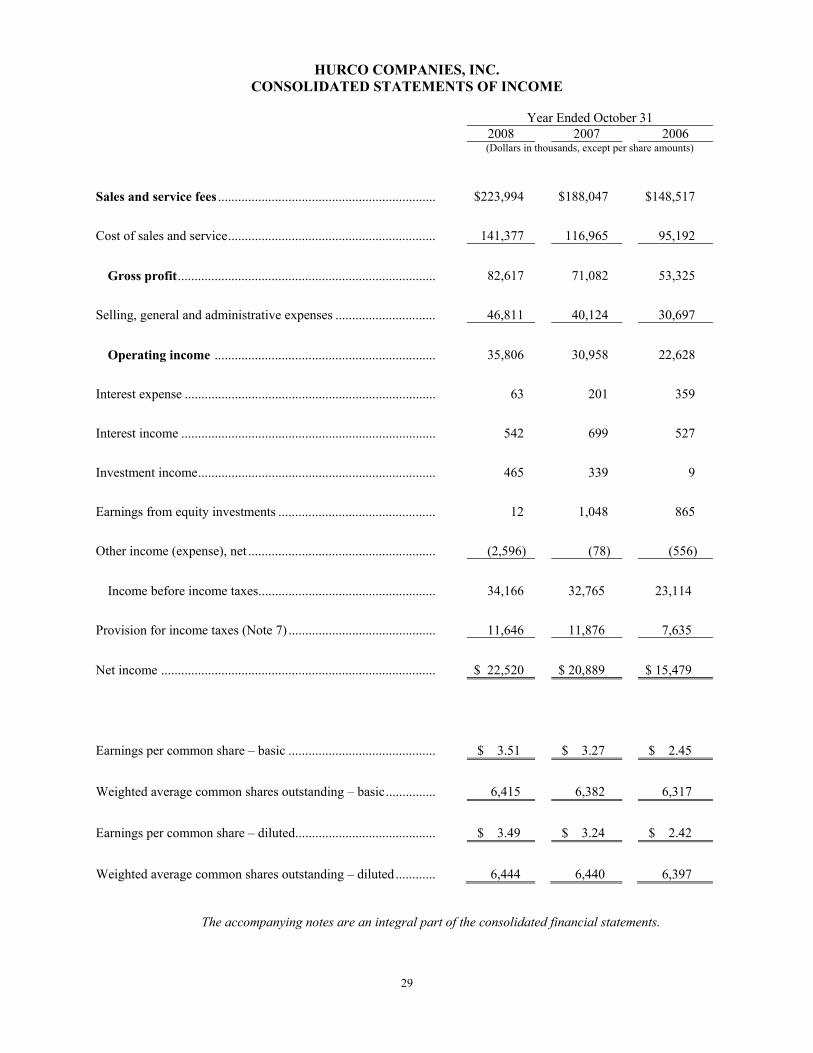
29
HURCO COMPANIES, INC. CONSOLIDATED STATEMENTS OF INCOME
Year Ended October 31 2008 2007 2006 (Dollars in thousands, except per share amounts)
Sales and service fees ................................................................. $223,994 $188,047 $148,517
Cost of sales and service .............................................................. 141,377 116,965 95,192
Gross profit ............................................................................. 82,617 71,082 53,325
Selling, general and administrative expenses .............................. 46,811 40,124 30,697
Operating income .................................................................. 35,806 30,958 22,628
Interest expense ........................................................................... 63 201 359
Interest income ............................................................................ 542 699 527
Investment income ....................................................................... 465 339 9
Earnings from equity investments ............................................... 12 1,048 865
Other income (expense), net ........................................................ (2,596) (78) (556)
Income before income taxes..................................................... 34,166 32,765 23,114
Provision for income taxes (Note 7) ............................................ 11,646 11,876 7,635
Net income .................................................................................. $ 22,520 $ 20,889 $ 15,479
Earnings per common share – basic ............................................ $ 3.51 $ 3.27 $ 2.45
Weighted average common shares outstanding – basic ............... 6,415 6,382 6,317
Earnings per common share – diluted .......................................... $ 3.49 $ 3.24 $ 2.42
Weighted average common shares outstanding – diluted ............ 6,444 6,440 6,397
The accompanying notes are an integral part of the consolidated financial statements.

30
HURCO COMPANIES, INC. CONSOLIDATED BALANCE SHEETS
ASSETS
As of October 31 2008 2007
Current assets: (Dollars in thousands, except per share amounts)
Cash and cash equivalents ................................................................... $ 26,394 $ 29,760 Short-term investments ........................................................................ 6,674 10,000 Accounts receivable, less allowance for doubtful accounts of $678 in 2008 and $751 in 2007...................................................
31,952
28,625
Inventories ........................................................................................... 66,368 61,121 Deferred tax assets, net ........................................................................ 5,444 8,258 Derivative assets .................................................................................. 12,463 485 Other .................................................................................................... 2,017 1,016 Total current assets ........................................................................ 151,312 139,265 Property and equipment: Land .................................................................................................... 782 776 Building .............................................................................................. 7,127 7,135 Machinery and equipment ................................................................... 14,885 13,629 Leasehold improvements .................................................................... 1,765 1,473 24,559 23,013 Less accumulated depreciation and amortization ................................ (10,961) (11,617) 13,598 11,396 Software development costs, less accumulated amortization ................. 5,711 5,960 Investments and other assets ................................................................... 6,823 7,160 $ 177,444 $ 163,781
LIABILITIES AND SHAREHOLDERS’ EQUITYCurrent liabilities: Accounts payable ................................................................................ $ 26,691 $ 33,056 Accounts payable-related parties ........................................................ 1,612 2,430 Accrued expenses and other ................................................................ 17,598 21,558 Accrued warranty expenses ................................................................. 2,536 2,449 Derivative liabilities ........................................................................... 2,692 3,722 Total current liabilities ................................................................... 51,129 63,215 Non-current liabilities: Deferred tax liability, net .................................................................... 2,056 1,956 Deferred credits and other ................................................................... 782 1,007 2,838 2,963 Commitments and contingencies (Notes 11 and 12) Shareholders’ equity: Preferred stock: no par value per share, 1,000,000 shares authorized, no shares issued ..........................................................
--
--
Common stock: no par value, $.10 stated value per share, 13,250,000 shares authorized, 6,420,851 and 6,392,220 shares issued and outstanding in 2008 and 2007, respectively ...................................
642
639
Additional paid-in capital .................................................................... 51,690 50,971 Retained earnings ................................................................................ 71,889 49,369 Accumulated other comprehensive loss .............................................. (744) (3,376) Total shareholders’ equity ............................................................. 123,477 97,603 $ 177,444 $ 163,781
The accompanying notes are an integral part of the consolidated financial statements.

31
HURCO COMPANIES, INC. CONSOLIDATED STATEMENTS OF CASH FLOWS
Year Ended October 31
2008 2007 2006 Cash flows from operating activities: (Dollars in thousands)
Net income ............................................................................... $ 22,520 $ 20,889 $ 15,479 Adjustments to reconcile net income to Net cash provided by operating activities:
Provision for doubtful accounts .......................................... (73) 116 (207) Deferred Tax Provision ....................................................... 1,048 1,216 491 Equity in income of affiliates.............................................. (12) (1,048) (865) Depreciation and amortization ............................................ 3,023 2,106 1,504 Stock-based Compensation ................................................. 535 480 17 Change in assets/liabilities (Increase) decrease in accounts receivable ...................... (6,260) (1,742) (1,312) (Increase) decrease in inventories ................................... (11,832) (14,116) (12,726) Increase (decrease) in accounts payable .......................... (7,649) 7,821 9,318 Increase (decrease) in accrued expenses ......................... 3,304 6,474 3,423 Other ............................................................................... (4,443) (8,003) (1,076) Net cash provided by operating activities ................. 161 14,193 14,046
Cash flows from investing activities: Proceeds from sale of property and equipment ........................ 17 -- 16 Purchase of property and equipment ........................................ (4,580) (3,325) (1,212) Purchase of investments .......................................................... (9,100) (24,000) -- Sale of investments .................................................................. 12,100 14,000 -- Software development costs ..................................................... (934) (1,185) (2,089) Other proceeds (investments) ................................................... (80) 1,898 (335) Net cash used for investing activities ............................... (2,577) (12,612) (3,620) Cash flows from financing activities: Repayment of first mortgage ................................................... -- (4,010) (126) Tax benefit from exercise of stock options 36 298 744 Proceeds from exercise of common stock options ................... 151 186 562 Net cash provided by (used for) financing activities ...... 187 (3,526) 1,180 Effect of exchange rate changes on cash .................................. (1,137) 1,859 681 Net increase (decrease) in cash ........................................ (3,366) (86) 12,287 Cash and cash equivalents at beginning of year ..................... 29,760 29,846 17,559 Cash and cash equivalents at end of year ................................ $ 26,394 $ 29,760 $ 29,846
Supplemental disclosures: ....................................................... Cash paid for: Interest ................................................................................ $ 12 $ 157 $ 314 Income taxes ....................................................................... $ 15,799 $ 9,971 $ 3,920
The accompanying notes are an integral part of the consolidated financial statements.

32
HURCO COMPANIES, INC. CONSOLIDATED STATEMENTS OF CHANGES IN SHAREHOLDERS' EQUITY
Common Stock
Additional
Accumulated
Other Comprehensive
(Dollars in thousands, except Shares Issued and Outstanding)
Shares Issued &
Outstanding
Amount Paid-In Capital
Retained Earnings
Income (Loss)
Total
Balances, October 31, 2005 .................................... 6,220,220 $ 622 $ 48,701 $ 13,001 $ (3,380) $ 58,944 Net income ............................................................... -- -- -- 15,479 -- 15,479 Translation of foreign currency financial statements .................................................................
--
--
--
--
1,288
1,288
Unrealized loss of derivative instruments, net of tax.............................................................................. -- -- -- -- (1,659) (1,659)
Comprehensive income ........................................... 15,108 Exercise of common stock options ........................... 126,300 13 549 -- -- 562 Tax benefit from exercise of stock options .............. -- -- 744 -- -- 744 Stock-based compensation expense ......................... -- -- 17 -- -- 17 Balances, October 31, 2006 6,346,520 635 50,011 28,480 (3,751) 75,375 Net income ............................................................... -- -- -- 20,889 -- 20,889 Translation of foreign currency financial statements .................................................................
--
--
--
--
2,568
2,568
Unrealized loss of derivative instruments, net of tax..............................................................................
--
--
--
--
(2,193)
(2,193)
Comprehensive income ........................................... 21,264 Exercise of common stock options ........................... 45,700 4 182 -- -- 186 Tax benefit from exercise of stock options .............. -- -- 298 -- -- 298 Stock-based compensation expense ......................... -- -- 480 -- -- 480 Balances, October 31, 2007 6,392,220 639 $ 50,971 49,369 (3,376) 97,603 Net income ............................................................... -- -- -- 22,520 -- 22,520 Translation of foreign currency financial statements .................................................................
--
--
--
--
(3,747)
(3,747)
Unrealized gain of derivative instruments, net of tax..............................................................................
--
--
--
--
6,581
6,581
Unrealized loss on investments, net of tax ............... -- -- -- -- (202) (202) Comprehensive income ........................................... 25,152 Exercise of common stock options ........................... 28,631 3 148 -- -- 151 Tax benefit from exercise of stock options .............. -- -- 36 -- -- 36 Stock-based compensation expense ......................... -- -- 535 -- -- 535 Balances, October 31, 2008 6,420,851 $ 642 $ 51,690 $ 71,889 $ (744) $123,477
The accompanying notes are an integral part of the consolidated financial statements.
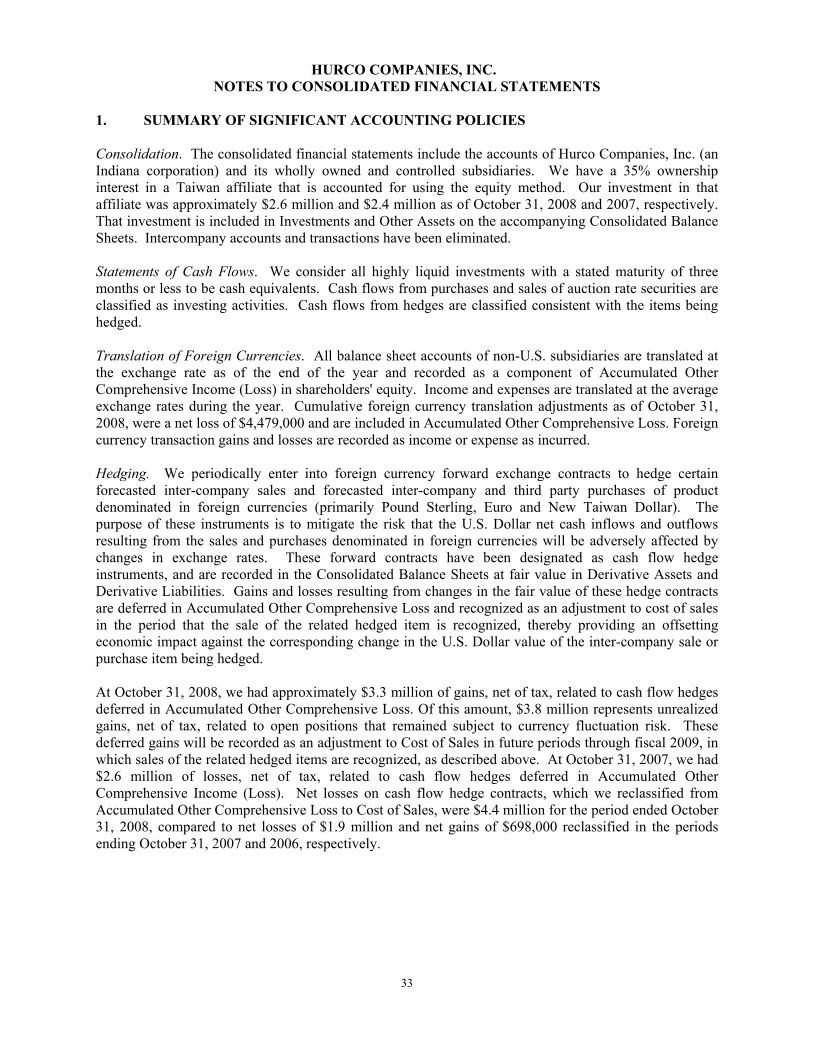
33
HURCO COMPANIES, INC. NOTES TO CONSOLIDATED FINANCIAL STATEMENTS
1. SUMMARY OF SIGNIFICANT ACCOUNTING POLICIES Consolidation. The consolidated financial statements include the accounts of Hurco Companies, Inc. (an Indiana corporation) and its wholly owned and controlled subsidiaries. We have a 35% ownership interest in a Taiwan affiliate that is accounted for using the equity method. Our investment in that affiliate was approximately $2.6 million and $2.4 million as of October 31, 2008 and 2007, respectively. That investment is included in Investments and Other Assets on the accompanying Consolidated Balance Sheets. Intercompany accounts and transactions have been eliminated. Statements of Cash Flows. We consider all highly liquid investments with a stated maturity of three months or less to be cash equivalents. Cash flows from purchases and sales of auction rate securities are classified as investing activities. Cash flows from hedges are classified consistent with the items being hedged. Translation of Foreign Currencies. All balance sheet accounts of non-U.S. subsidiaries are translated at the exchange rate as of the end of the year and recorded as a component of Accumulated Other Comprehensive Income (Loss) in shareholders' equity. Income and expenses are translated at the average exchange rates during the year. Cumulative foreign currency translation adjustments as of October 31, 2008, were a net loss of $4,479,000 and are included in Accumulated Other Comprehensive Loss. Foreign currency transaction gains and losses are recorded as income or expense as incurred. Hedging. We periodically enter into foreign currency forward exchange contracts to hedge certain forecasted inter-company sales and forecasted inter-company and third party purchases of product denominated in foreign currencies (primarily Pound Sterling, Euro and New Taiwan Dollar). The purpose of these instruments is to mitigate the risk that the U.S. Dollar net cash inflows and outflows resulting from the sales and purchases denominated in foreign currencies will be adversely affected by changes in exchange rates. These forward contracts have been designated as cash flow hedge instruments, and are recorded in the Consolidated Balance Sheets at fair value in Derivative Assets and Derivative Liabilities. Gains and losses resulting from changes in the fair value of these hedge contracts are deferred in Accumulated Other Comprehensive Loss and recognized as an adjustment to cost of sales in the period that the sale of the related hedged item is recognized, thereby providing an offsetting economic impact against the corresponding change in the U.S. Dollar value of the inter-company sale or purchase item being hedged. At October 31, 2008, we had approximately $3.3 million of gains, net of tax, related to cash flow hedges deferred in Accumulated Other Comprehensive Loss. Of this amount, $3.8 million represents unrealized gains, net of tax, related to open positions that remained subject to currency fluctuation risk. These deferred gains will be recorded as an adjustment to Cost of Sales in future periods through fiscal 2009, in which sales of the related hedged items are recognized, as described above. At October 31, 2007, we had $2.6 million of losses, net of tax, related to cash flow hedges deferred in Accumulated Other Comprehensive Income (Loss). Net losses on cash flow hedge contracts, which we reclassified from Accumulated Other Comprehensive Loss to Cost of Sales, were $4.4 million for the period ended October 31, 2008, compared to net losses of $1.9 million and net gains of $698,000 reclassified in the periods ending October 31, 2007 and 2006, respectively.

HURCO COMPANIES, INC. NOTES TO CONSOLIDATED FINANCIAL STATEMENTS – Continued
34
We also enter into foreign currency forward exchange contracts to protect against the effects of foreign currency fluctuations on receivables and payables denominated in foreign currencies. These derivative instruments are not designated as hedges under SFAS 133, “Accounting Standards for Derivative Instruments and Hedging Activities” (SFAS 133) and, as a result, changes in fair value are reported currently as Other Expense, Net in the Consolidated Statements of Income consistent with the transaction gain or loss on the related foreign denominated receivable or payable and non-hedged foreign currency gains and losses. We recognized a net transaction loss of $2.3 million for the year ended October 31, 2008, compared to a net transaction gain of $19,000 for the year ended October 31, 2007 and a net transaction loss of $423,000 for the year ended October 31, 2006. We are exposed to foreign currency exchange risks related to our investment in net assets in foreign countries. To manage this risk, we entered into a forward contract on November 26, 2007, with a notional amount of €3.0 million. We have designated this forward contract as a hedge of our net investment in Euro-denominated assets. We have selected the forward method under the guidance of the Derivatives Implementation Group Statement 133 Issue H8, “Foreign Currency Hedges: Measuring the Amount of Ineffectiveness in a Net Investment Hedge.” The forward method requires all changes in the fair value of the forward contract to be reported as a cumulative translation adjustment in Accumulated Other Comprehensive Loss in the same manner as the underlying hedged net assets. As of October 31, 2008, we had a gain of $624,000, net of tax, recorded as a cumulative translation adjustment in Accumulated Other Comprehensive Loss related to this forward contract. Inventories. Inventories are stated at the lower of cost or market, with cost determined using the first-in, first-out method. Property and Equipment. Property and equipment are carried at cost. Any impairment would be recognized based on an assessment of future operations (including cash flows) to ensure that assets are appropriately valued. Depreciation and amortization of assets are provided primarily under the straight-line method over the shorter of the estimated useful lives or the lease terms as follows: Number of Years Building 40 Machines 7-10 Shop and office equipment 3-7 Leasehold improvements 3-40 Total depreciation expense for the years ended October 31, 2008, 2007 and 2006 was $1.5 million, $1.4 million, and $1.1 million, respectively. Revenue Recognition. We recognize revenue from sales of our products upon delivery of the products to the customers, which is normally at the time of shipment, because persuasive evidence of an arrangement exists, delivery has occurred, the selling price is fixed and determinable and collectability is reasonably assured. In certain foreign locations, we retain title after shipment under a “retention of title” clause solely to protect collectability. The retention of title is similar to UCC filings in the United States and provides the creditor with additional rights to the machine if the customer fails to pay. Revenue recognition at the time of shipment is appropriate in this instance as long as all risks of ownership have passed to the buyer. Our principal products are general-purpose computer controlled machine tools that are typically used in stand-alone operations. Transfer of ownership and risk of loss are not contingent upon contractual customer acceptance. Prior to shipment, we test each machine to ensure the machine’s compliance with standard operating specifications as listed in our sales literature. Depending upon geographic location, after shipment a machine may be installed at the customer’s facilities by a distributor, independent contractor or Hurco service technician. In most instances where a
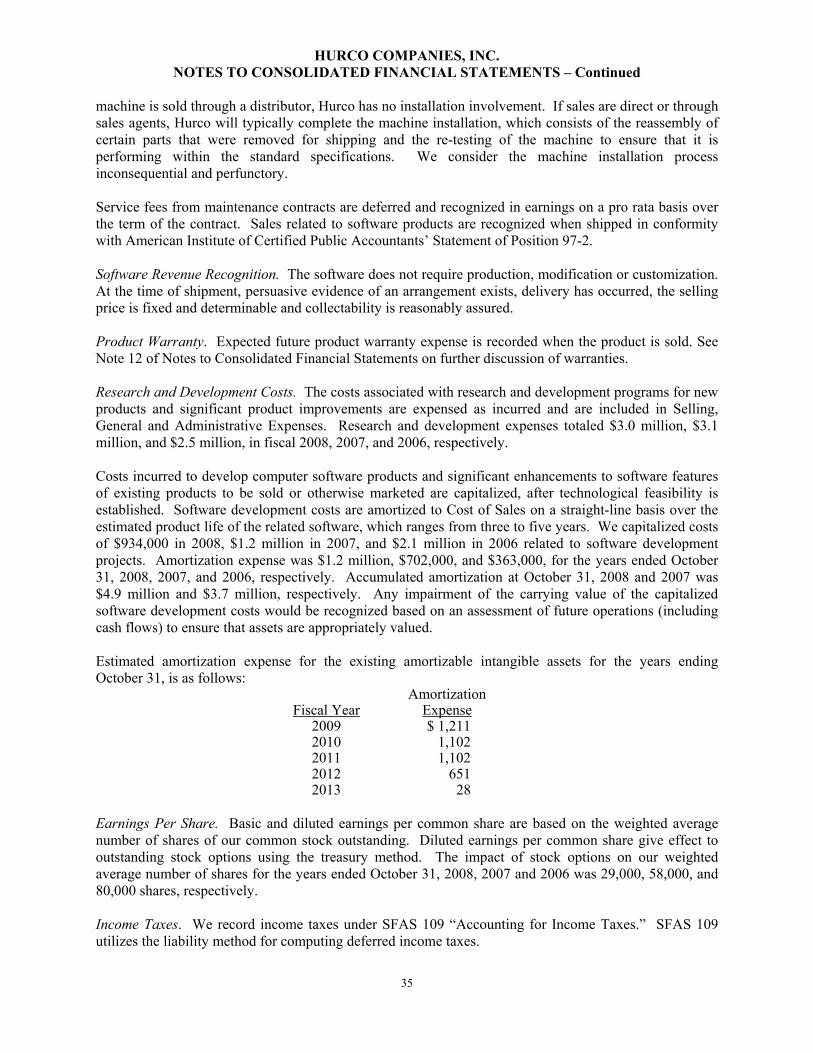
HURCO COMPANIES, INC. NOTES TO CONSOLIDATED FINANCIAL STATEMENTS – Continued
35
machine is sold through a distributor, Hurco has no installation involvement. If sales are direct or through sales agents, Hurco will typically complete the machine installation, which consists of the reassembly of certain parts that were removed for shipping and the re-testing of the machine to ensure that it is performing within the standard specifications. We consider the machine installation process inconsequential and perfunctory. Service fees from maintenance contracts are deferred and recognized in earnings on a pro rata basis over the term of the contract. Sales related to software products are recognized when shipped in conformity with American Institute of Certified Public Accountants’ Statement of Position 97-2. Software Revenue Recognition. The software does not require production, modification or customization. At the time of shipment, persuasive evidence of an arrangement exists, delivery has occurred, the selling price is fixed and determinable and collectability is reasonably assured. Product Warranty. Expected future product warranty expense is recorded when the product is sold. See Note 12 of Notes to Consolidated Financial Statements on further discussion of warranties. Research and Development Costs. The costs associated with research and development programs for new products and significant product improvements are expensed as incurred and are included in Selling, General and Administrative Expenses. Research and development expenses totaled $3.0 million, $3.1 million, and $2.5 million, in fiscal 2008, 2007, and 2006, respectively. Costs incurred to develop computer software products and significant enhancements to software features of existing products to be sold or otherwise marketed are capitalized, after technological feasibility is established. Software development costs are amortized to Cost of Sales on a straight-line basis over the estimated product life of the related software, which ranges from three to five years. We capitalized costs of $934,000 in 2008, $1.2 million in 2007, and $2.1 million in 2006 related to software development projects. Amortization expense was $1.2 million, $702,000, and $363,000, for the years ended October 31, 2008, 2007, and 2006, respectively. Accumulated amortization at October 31, 2008 and 2007 was $4.9 million and $3.7 million, respectively. Any impairment of the carrying value of the capitalized software development costs would be recognized based on an assessment of future operations (including cash flows) to ensure that assets are appropriately valued. Estimated amortization expense for the existing amortizable intangible assets for the years ending October 31, is as follows:
Fiscal Year
AmortizationExpense
2009 $ 1,2112010 1,1022011 1,1022012 6512013 28
Earnings Per Share. Basic and diluted earnings per common share are based on the weighted average number of shares of our common stock outstanding. Diluted earnings per common share give effect to outstanding stock options using the treasury method. The impact of stock options on our weighted average number of shares for the years ended October 31, 2008, 2007 and 2006 was 29,000, 58,000, and 80,000 shares, respectively. Income Taxes. We record income taxes under SFAS 109 “Accounting for Income Taxes.” SFAS 109 utilizes the liability method for computing deferred income taxes.

HURCO COMPANIES, INC. NOTES TO CONSOLIDATED FINANCIAL STATEMENTS – Continued
36
The determination of our provision for income taxes requires judgment, the use of estimates and the interpretation and application of complex tax laws. Our provision for income taxes reflects a combination of income earned and taxed at the federal and state level in the U.S., as well as in various foreign jurisdictions. We have not provided for any U.S. income taxes on the undistributed earnings of our foreign subsidiaries or equity method investments based upon our determination that such earnings will be indefinitely reinvested abroad. On November 1, 2008, we adopted FIN 48, and we currently account for uncertain tax positions in accordance with the provisions of FIN 48 guidance. Refer to Note 7, Income Taxes, for information related to the effect of adoption of FIN 48, and the accounting for the Company's uncertain tax positions. As part of our financial reporting process, we must assess the likelihood that our deferred tax assets can be recovered. If recovery is not likely, the provision for taxes must be increased by recording a reserve in the form of a valuation allowance for the deferred tax assets that are estimated not to be ultimately recoverable. In the process, certain relevant criteria are evaluated including the existence of deferred tax liabilities that can be used to absorb deferred tax assets, the taxable income in prior carry-back years that can be used to absorb net operating losses and credit carry-backs, and taxable income in future years. Our judgment regarding future profitability may change due to future market conditions, changes in U.S. or foreign tax laws and other factors. These changes, if any, may require material adjustments to these deferred tax assets and an accompanying reduction or increase in net income in the period when such determinations are made. In addition to the risks to the effective tax rate described above, the future effective tax rate reflected in forward-looking statements is based on currently effective tax laws. Significant changes in those laws could materially affect these estimates. Estimates. The preparation of financial statements in conformity with U.S. Generally Accepted Accounting Principles requires us to make estimates and assumptions that affect the reported amounts presented and disclosed in our consolidated financial statements. Significant estimates and assumptions in these consolidated financial statements require the exercise of judgment and are used for, but not limited to, allowance for doubtful accounts, estimates of future cash flows and other assumptions associated with intangible and long-lived asset impairment tests, useful lives for depreciation and amortization, warranty programs, income taxes and deferred tax valuation allowances, lease classification, and contingencies. Due to the inherent uncertainty involved in making estimates, actual results reported in future periods may be different from these estimates. Stock Based Compensation. In fiscal 2006 we adopted SFAS No. 123(R), “Share Based Payment,” using the modified prospective method. We began applying the provisions of SFAS No. 123(R) to option grants, as well as to the nonvested portion of outstanding options granted before that date. Compensation expense is determined at the date of grant using the Black-Scholes valuation model. We recorded $535,000, $480,000 and $17,000 of compensation expense during the fiscal years ending October 31, 2008, 2007 and 2006, respectively for vested options. We expect to record additional compensation expense of approximately $57,000 per quarter, ratably, through the fourth quarter of fiscal 2009 for the options granted in November 2006. Reclassifications. Certain prior year amounts have been reclassified to conform to the current year presentation. We reclassified auction rate securities previously classified as cash and cash equivalents to short-term investments in the amount of $10.0 million as of October 31, 2007. This reclassification was made in the Consolidated Balance Sheets and net cash used in investing activities on the Consolidated Statements of Cash Flows. This reclassification had no impact on previously reported net income or shareholders’ equity.

HURCO COMPANIES, INC. NOTES TO CONSOLIDATED FINANCIAL STATEMENTS – Continued
37
2. BUSINESS OPERATIONS Nature of Business. We design and manufacture computer control systems, software and computerized machine tools for sale through our own distribution system to the worldwide machine tool industry. The machine tool industry is highly cyclical and declines in demand can and will occur abruptly in the geographic markets we serve. As a result, we have recently experienced a significant decline in our sales and orders during the fourth quarter of fiscal 2008 that significantly adversely affected our results of operations. For additional information regarding current economic conditions and their impact on our results of operation and financial condition, refer to Item 7. Management’s Discussion and Analysis of Financial Condition and Results of Operations.
The end market for our products consists primarily of precision tool, die and mold manufacturers, independent job shops, and specialized short-run production applications within large manufacturing operations. Industries served include: aerospace, defense, medical equipment, energy, automotive/transportation, electronics and computer industries. Our products are sold through independent agents and distributors throughout North America, Europe and Asia. We also maintain direct sales operations in Canada, England, France, Germany, Italy, Singapore and China. Credit Risk. We sell products to customers located throughout the world. We perform ongoing credit evaluations of customers and generally do not require collateral. Allowances are maintained for potential credit losses. Concentration of credit risk with respect to trade accounts receivable is limited due to the large number of customers and their dispersion across many geographic areas. Although a significant amount of trade receivables are with distributors primarily located in the United States, no single distributor or region represents a significant concentration of credit risk. Manufacturing Risk. Our wholly owned subsidiary in Taiwan, Hurco Manufacturing Ltd. (HML) produces all of our machine tools. Any interruption in manufacturing at HML would have an adverse effect on our financial operating results. Interruption in manufacturing at HML could result from a change in the political environment or a natural disaster, such as an earthquake, typhoon, or tsunami. Any interruption with our contract manufacturer or one of our key component suppliers may also have an adverse effect on our operating results and our financial condition.
3. INVESTMENTS As of October 31, 2008 and October 31, 2007, we held $6.7 million and $10.0 million, respectively, of investments in auction rate securities, which represented investments in student loan obligations and municipal bonds. Auction rate securities are intended to provide liquidity via an auction process that resets the applicable interest rate at predetermined intervals allowing us to either roll over the holdings or sell the investment at par value. All income generated from these auction rate securities was recorded as Investment Income. During fiscal 2008, the uncertainties in the credit markets adversely affected the liquidity of our holdings in auction rate securities, and multiple auctions for these securities were unsuccessful. All of the auction rate securities were “AAA” rated and were in compliance with our investment policy at the time of the acquisition. As of October 31, 2008, these securities were classified as Short-term Investments on our Consolidated Balance Sheets and had a weighted average tax exempt interest rate of approximately 4.7%. During fiscal 2008, we classified our auction rate securities as “available for sale” in accordance with the provisions of Statement of Financial Accounting Standards No. 115, “Accounting for Certain Investments in Debt and Equity Securities”. Due to the lack of observable quotes in the market, we engaged an independent registered investment advisor to provide expert investment information in order to estimate the fair value of our auction rate securities. In estimating the fair value of these securities, each prospectus was researched, recent auction history was reviewed, and current collateral performance was

HURCO COMPANIES, INC. NOTES TO CONSOLIDATED FINANCIAL STATEMENTS – Continued
38
examined. The underlying collateral for these securities was compared to other securities currently trading in the market, as well as, non-auction based debt with similar characteristics. Although these securities continued to pay interest according to their stated terms, during the second quarter of fiscal 2008 we recorded an unrealized loss of $202,000, net of tax in Accumulated Other Comprehensive Loss, reflecting adjustments to our auction rate securities to record what we concluded was a temporary decline in estimated fair value. We deemed this impairment temporary because the underlying reason for the impairment was primarily related to liquidity, as there had not been a change in credit risk of the investment since acquisition, the severity of the impairment was not significant compared to the total investment balance, and we did not expect to sell these investments for less than par value. Subsequent to October 31, 2008, we sold all of our holdings of auction rate securities, totaling $6.7 million, at par value. 4. INVENTORIES Inventories as of October 31, 2008 and 2007 are summarized below (in thousands): 2008 2007 Purchased parts and sub assemblies .............................................................. $ 13,098 $ 10,956 Work-in-process ........................................................................................... 11,243 11,692 Finished goods .............................................................................................. 42,027 38,473 $ 66,368 $ 61,121
5. DEBT AGREEMENTS We are party to an unsecured domestic credit agreement that provides us with a $30.0 million unsecured revolving credit facility and a separate letter of credit facility in the amount of 100.0 million New Taiwan Dollars. We are also party to a Taiwan revolving credit agreement of 100.0 million New Taiwan Dollars, which is an uncommitted demand credit facility. In the event the Taiwan facility is not available, the Taiwan letter of credit facility from the domestic agreement would enable us to provide credit enhancement to a replacement lender in Taiwan. We also entered into a £1.0 million revolving credit facility in the United Kingdom.
The domestic and U.K. facilities mature on December 7, 2012.
Borrowings under the domestic facility may be used for general corporate purposes and will bear interest at a LIBOR-based rate or an alternate base rate, in each case, plus an applicable margin determined by reference to the ratio of the interest-bearing debt and obligations and the undrawn face amount of all letters of credit outstanding, on a consolidated basis, to consolidated EBITDA. The domestic facility contains customary affirmative and negative covenants and events of default for an unsecured commercial bank credit facility, including, among other things, limitations on consolidations, mergers and sales of assets. The financial covenants are a minimum quarterly consolidated net income covenant and a covenant establishing a maximum ratio of consolidated total indebtedness to total indebtedness and net worth.
As of October 31, 2008 we had no debt or borrowings outstanding under our domestic or European credit facilities. As of October 31, 2008 and 2007, we had $615,000 and $1,081,000, respectively, of outstanding letters of credit issued to non-U.S. suppliers for inventory purchase commitments. As of October 31, 2008 we had unutilized credit facilities of $36.0 million available for either direct borrowings or commercial letters of credit.

HURCO COMPANIES, INC. NOTES TO CONSOLIDATED FINANCIAL STATEMENTS – Continued
39
6. FINANCIAL INSTRUMENTS The carrying amounts for trade receivables and payables approximate their fair values. We also have financial instruments in the form of foreign currency forward exchange contracts as described in Note 1 of Notes to Consolidated Financial Statements. The U.S. Dollar equivalent notional amount of these contracts was $128.2 million and $133.1 million at October 31, 2008 and 2007, respectively. The net fair value of Derivative Assets recorded on our Consolidated Balance Sheets at October 31, 2008 and 2007 was $12.5 million and $485,000, respectively. The net fair value of Derivative Liabilities recorded on our Consolidated Balance Sheets at October 31, 2008 and 2007 was $2.7 million and $3.7 million, respectively. Current market prices were used to estimate the fair value of the foreign currency forward exchange contracts. The future value of the foreign currency forward exchange contracts and the related currency positions are subject to offsetting market risk resulting from foreign currency exchange rate volatility. The counterparties to these contracts are substantial and creditworthy financial institutions. We do not consider either the risk of counterparty non-performance or the economic consequences of counterparty non-performance as material risks. 7. INCOME TAXES In the fiscal years set forth below, the provision (benefit) for income taxes consisted of the following: Year Ended October 31 2008 2007 2006 Current: U.S. taxes ................................................................ $ 8,768 $ 9,290 $ 5,359 Foreign taxes .......................................................... 3,926 3,802 2,767 12,694 13,092 8,126 Deferred: U.S. taxes ................................................................ (1,163) (1,657) (787) Foreign taxes .......................................................... 115 441 296 (1,048) (1,216) (491) $ 11,646 $ 11,876 $ 7,635 A comparison of income tax expense at the U.S. statutory rate of 35% in 2008, 2007 and 2006, to the Company’s effective tax rate is as follows: Income before income taxes (in thousands): Year Ended October 31 2008 2007 2006 Domestic ................................................................. $ 20,856 $ 20,463 $ 13,688 Foreign ................................................................... $ 13,310 $ 12,302 $ 9,426 Earnings before taxes on income $ 34,166 $ 32,765 $ 23,114 Tax rates: U.S. statutory rate .........................................................
35.0%
35.0%
35.0%
Effect of tax rate of international jurisdictions In excess of (less than) U.S. statutory rates ............... (1.9)% 0.1% (0.2)%State income taxes ......................................................... 1.9% 2.4% 3.8%Permanent items ............................................................ 0.1% 0.8% (2.7)%All other ........................................................................ (1.0)% (2.1)% (1.9)%Effective tax rate ........................................................... 34.1% 36.2% 34.0%

HURCO COMPANIES, INC. NOTES TO CONSOLIDATED FINANCIAL STATEMENTS – Continued
40
We have not provided any U.S. income taxes on the undistributed earnings of our foreign subsidiaries or equity method investments based upon our determination that such earnings will be indefinitely reinvested. Estimated undistributed earnings of foreign investments and subsidiaries at October 31, 2008 are approximately $29.6 million. In the event these earnings are later distributed to the U.S., such distributions could result in additional U.S. tax that may be offset, at least in part by associated foreign tax credits. Deferred tax assets and liabilities are determined based on the difference between the amounts used for financial reporting purposes and tax basis of assets and liabilities using enacted tax rates in effect for the year in which the differences are expected to reverse. Significant components of our deferred tax assets and liabilities at October 31, 2008 and 2007 were as follows (in thousands): October 31 2008 2007Deferred Tax Assets: Current: Inter-company profit in inventory........................................................ $ 5,575 $ 5,176 Derivative liabilities(assets) ................................................................. (2,477) 1,451 Accrued inventory reserves ................................................................. 1,070 991 Accrued warranty expenses ................................................................. 148 158 Deferred compensation ........................................................................ 264 214 Other accrued expenses ....................................................................... 864 280 Other .................................................................................................... - (12) Current deferred tax assets, net ....................................................... 5,444 8,258 Deferred Tax Liabilities: Non-current:
Depreciation and amortization ............................................................. (2,717) (2,730) Other .................................................................................................... 661 774 Non-current deferred tax liabilities, net ............................................ (2,056) (1,956)
Net deferred tax assets $3,388 $6,302 On November 1, 2007, we adopted the provisions of FASB Interpretation No. 48, which clarifies the accounting for uncertainty in income tax positions. As a result of adoption, there was no change to beginning retained earnings. A reconciliation of the beginning and ending amount of unrecognized tax benefits, excluding the related accrual for interest or penalties, is as follows (in thousands): Balance, at November 1, 2007 $ 576 Additions based on tax positions related to the current year - Additions for tax positions of prior years 40 Reduction for tax positions of prior years - Settlements - Reductions due to statute expiration (3)
Balance, at October 31, 2008 $ 613 We had $613,000 of unrecognized tax benefits at October 31, 2008, that if recognized, would favorably affect the effective tax rate in future periods. Any adjustments to our reserves for income taxes will be recorded as an increase or decrease to our provision for income taxes and would impact our effective tax rate.

HURCO COMPANIES, INC. NOTES TO CONSOLIDATED FINANCIAL STATEMENTS – Continued
41
We recognize accrued interest and penalty related to unrecognized tax benefits as components of our income tax provision. We believe there is substantial support for taking these tax benefits and therefore have estimated no tax penalties. As of October 31, 2008, the gross amount of interest accrued, reported in other liabilities, was approximately $82,000, which did not include the federal tax benefit of interest deductions. We do not currently anticipate that our existing reserves related to uncertain tax positions as of October 31, 2008 will significantly increase or decrease during the twelve-month period ending October 31, 2009; however, various events could cause our current expectations to change in the future. The statute of limitation with respect to unrecognized tax benefits related to FIN 48 will expire between July 2009 and July 2012. We anticipate a reduction of $105,000 due to statute expiration during the next fiscal year. We or one of our subsidiaries files U.S. federal and/or state income tax returns and as well as tax returns in one or more foreign jurisdictions. A summary of open tax years by major jurisdiction is presented below:
United States federal Fiscal 2005 through the current period Indiana Fiscal 2005 through the current period California Fiscal 2004 through the current period Germany¹ Fiscal 2004 through the current period Taiwan Fiscal 2003 through the current period
¹ Includes federal as well as state, provincial or similar local jurisdictions, as applicable. 8. EMPLOYEE BENEFITS We have defined contribution plans that include a majority of our employees, under which our contributions are discretionary. The purpose of these plans is generally to provide additional financial security during retirement by providing employees with an incentive to save throughout their employment. Our contributions to the plans are based on employee contributions or compensation. Our contributions totaled $877,600, $460,200, and $382,300, for the fiscal years ended October 31, 2008, 2007 and 2006, respectively. We also have life insurance agreements with certain executive officers. The insurance premiums we paid will be repaid from the cash surrender value of the policies when the policies are terminated or upon the death of the insured. 9. STOCK OPTIONS In March 2008, we adopted the Hurco Companies, Inc. 2008 Equity Incentive Plan (the “2008 Plan”), which allows us to grant awards of stock options, Stock Appreciation Rights settled in stock (SARs), restricted shares, performance shares and performance units. The 2008 Plan replaced the 1997 Stock Option and Incentive Plan (the “1997 Plan”) which expired in March 2007. The Compensation Committee of the Board of Directors has authority to determine the officers, directors and key employees who will be granted awards; designate the number of shares subject to each award; determine the terms and conditions upon which awards will be granted; and prescribe the form and terms of award agreements. We have granted stock options under both Plans which are currently outstanding. No stock option may be exercised more than ten years after the date of grant or such shorter period as the Compensation Committee may determine at the date of grant. The number of shares of our common stock currently available for issuance as awards under the 2008 Plan is 740,000. The market value of a share of our common stock, for purposes of the 2008 Plan, is the closing sale price as reported by the
HURCO COMPANIES, INC. NOTES TO CONSOLIDATED FINANCIAL STATEMENTS – Continued
42
Nasdaq Global Select Market on the date in question or, if not a trading day, on the last preceding trading date. During fiscal 2008, options to purchase 28,631 shares were exercised, resulting in cash proceeds of approximately $151,000 and an additional tax benefit of approximately $36,000, compared to 45,700 shares exercised in the prior year period resulting in cash proceeds of $186,700 and an additional tax benefit of approximately $298,000. Effective November 1, 2005, we adopted SFAS No. 123(R), “Share Based Payment,” using the modified prospective method, and began applying its provisions to all options granted, as well as, to the nonvested portion of previously granted options outstanding at that date. Compensation expense is determined at the date of grant using the Black-Scholes valuation model. On May 28, 2008, the Compensation Committee granted fully vested options with respect to 5,000 shares under the 2008 Plan to each of two new directors. The fair value of options awarded was estimated on the date of grant using a Black-Scholes valuation model with assumptions for expected volatility based on the historical volatility of the Company’s stock of 88%, contractual term of the options of ten years and a risk-free interest rate based upon a three-year U.S. Treasury yield as of the date of grant of 2.7%. The directors’ options were granted with immediate vesting as of the date of grant. Based upon the foregoing factors, the fair value of the options was determined to be $30.71 per share. On November 16, 2006, the Compensation Committee granted options with respect to an aggregate of 40,000 shares under the 1997 Plan to two new employees and two new directors. The fair value of options awarded was estimated on the date of grant using a Black-Scholes valuation model with assumptions for expected volatility based on the historical volatility of the Company’s stock of 110%, contractual term of the options of ten years and a risk-free interest rate based upon a three-year U.S. Treasury yield as of the date of grant of 4.7%. The options granted to employees vest in three equal annual installments and the directors’ options were granted with immediate vesting as of the date of grant. Based upon the foregoing factors, the fair value of the options was determined to be $22.84 and $24.97 for employees and directors, respectively. During fiscal 2008, approximately $535,000 of stock-based compensation expense was recorded related to grants under the Plans compared to $480,000 for the same period in the prior year. As of October 31, 2008, there was approximately $229,000 of total unrecognized stock-based compensation cost that we expect to recognize by the end of fiscal 2009.

HURCO COMPANIES, INC. NOTES TO CONSOLIDATED FINANCIAL STATEMENTS – Continued
43
A summary of the status of the options as of October 31, 2008, 2007 and 2006 and the related activity for the year is as follows:
Shares Under Option
Weighted Average Exercise Price Per Share
Balance October 31, 2005 215,400 $ 3.63 Granted ....................................................... -- -- Cancelled .................................................... -- -- Expired ........................................................ (400) 2.15 Exercised ..................................................... (126,300) $ 4.45
Balance October 31, 2006 88,700 $ 2.46 Granted ....................................................... 40,000 26.69 Cancelled .................................................... -- -- Expired ........................................................ -- -- Exercised ..................................................... (45,700) $ 4.08
Balance October 31, 2007 83,000 $ 13.24 Granted ....................................................... 10,000 35.83 Cancelled .................................................... -- -- Expired ........................................................ -- -- Exercised ..................................................... (28,631) $ 5.26
Balance October 31, 2008 64,369 $ 20.29 The total intrinsic value of stock options exercised during the twelve months ended October 31, 2008, 2007 and 2006 was approximately $0.5 million, $2.4 million and $2.7 million respectively. As of October 31, 2008, the total intrinsic value of outstanding stock options already vested and expected to vest and the intrinsic value of options that are outstanding and exercisable as of October 31, 2008 was $417,000. Stock options outstanding and exercisable on October 31, 2008, are as follows:
Range of Exercise Prices Per Share
Shares Under Option
Weighted Average Exercise Price Per
Share
Weighted Average
Remaining Contractual Life in Years
Outstanding $ 2.13 – 5.13 20,500 $ 2.15 3.1 5.81 – 8.25 -- -- -- 26.69 33,869 $26.69 8.0 35.83 10,000 $35.83 9.6 $ 2.13 – 35.83 64,369 $20.29 6.7 Exercisable $ 2.13 – 5.13 20,500 $ 2.15 -- 5.81 – 8.25 -- -- -- 26.69 13,869 $26.69 -- 35.83 10,000 $35.83 -- $ 2.13 – 26.69 44,369 $ 17.41 --

HURCO COMPANIES, INC. NOTES TO CONSOLIDATED FINANCIAL STATEMENTS – Continued
44
10. RELATED PARTY TRANSACTIONS Until the fourth quarter of fiscal 2007, we owned approximately 24% of the outstanding shares of a Taiwanese-based contract manufacturer, Quaser Machine Tools, Inc. This investment was accounted for using the equity method and was included in Investments and Other Assets on the Consolidated Balance Sheets. On August 16, 2007, we entered into a contract for the sale of our shares for $2.1 million, which was approximately our carrying value. The sale closed during the fourth quarter of 2007. We did not recognize any material financial gain or loss as a result of this transaction, but, did recognize a tax gain on the sale of the investment that resulted in a tax liability of $740,000. Our purchases of product from this manufacturer totaled $3.4 million and $2.0 million for the years ended October 31, 2007 and 2006, respectively. Our sales of product to this manufacturer were $176,000 and $70,000 in fiscal 2007 and 2006, respectively. Our trade payables to this manufacturer were $857,000 at October 31, 2007. Our trade receivables from this manufacturer were $37,000 at October 31, 2007. As of October 31, 2008, we owned approximately 35% of the outstanding shares of another Taiwanese-based contract manufacturer, Hurco Automation, Ltd. (HAL). HAL’s scope of activities includes the design, manufacture, sales and distribution of industrial automation products, software systems and related components, including control systems and components produced under contract for sale exclusively to us. We are accounting for this investment using the equity method. The investment of $2.6 million and $2.4 million at October 31, 2008 and 2007 is included in Investments and Other Assets on the Consolidated Balance Sheets. Purchases of product from HAL amounted to $10.3 million, $11.7 million and $10.5 million in 2008, 2007 and 2006, respectively. Sales of product to HAL were $2.0 million, $1.9 million and $2.0 million for the years ended October 31, 2008, 2007 and 2006, respectively. Trade payables to HAL were $1.6 million and $2.4 million at October 31, 2008 and 2007, respectively. Trade receivables from HAL were $296,000 and $426,000 at October 31, 2008 and 2007, respectively. Summary financial information for these two related parties is as follows: (in thousands) 2008 2007 (1) 2006 Net Sales ...................................................... $ 11,935 $ 58,053 $ 58,286 Gross Profit .................................................. 1,883 10,061 10,932 Operating Income ......................................... 159 3,757 4,209 Net Income ................................................... 147 3,467 3,727 Current Assets .............................................. $ 8,658 $ 36,945 $ 27,903 Non-current Assets ....................................... 2,195 10,636 7,684 Current Liabilities ........................................ 3,176 18,785 20,156 (1) Financial information for Quaser Machine Tools for fiscal 2007 includes financial information through
the date of sale. 11. CONTINGENCIES AND LITIGATION We are involved in various claims and lawsuits arising in the normal course of business. We do not expect any of these claims, individually or in the aggregate, to have a material adverse effect on our consolidated financial position or results of operations.

HURCO COMPANIES, INC. NOTES TO CONSOLIDATED FINANCIAL STATEMENTS – Continued
45
12. GUARANTEES During fiscal 2003, we adopted Financial Accounting Standards Board (FASB) Interpretation No. 45 (“FIN 45”), “Guarantor’s Accounting and Disclosure Requirements for Guarantees, Including Indirect Guarantees of Indebtedness of Others, an interpretation of FASB Statements No. 5, 57 and 107 and Rescission of FASB Interpretation No. 34.” FIN 45 clarifies the requirements of FASB Statement No. 5, Accounting for Contingencies, relating to the guarantor’s accounting for, and disclosures of, the issuance of certain types of guarantees. From time to time, our subsidiaries guarantee third party payment obligations in connection with the sale of certain machines to customers that use financing. At October 31, 2008, we had 56 outstanding third party guarantees totaling approximately $1.7 million. The terms of our subsidiaries guarantees are consistent with the underlying customer financing terms. Upon shipment, the customer has the risk of ownership. The customer does not obtain title until the machine is paid in full. A retention of title clause allows us to obtain the machine if the customer defaults on the lease. We believe that the proceeds obtained from liquidation of the machine would cover any payments required by the guarantee. We provide warranties on our products with respect to defects in material and workmanship. The terms of these warranties are generally one year for machines and shorter periods for service parts. We recognize a reserve with respect to this obligation at the time of product sale, with subsequent warranty claims recorded against the reserve. The amount of the warranty reserve is determined based on historical trend experience and any known warranty issues that could cause future warranty costs to differ from historical experience. A reconciliation of the changes in our warranty reserve is as follows (in thousands): 10/31/08 10/31/07 Balance, beginning of period $ 2,449 $ 1,926 Provision for warranties during the period 2,944 2,459 Charges to the accrual (2,666) (2,087) Impact of foreign currency translation (189) 151 Balance, end of period $ 2,536 $ 2,449 13. OPERATING LEASES
We lease facilities, certain equipment and vehicles under operating leases that expire at various dates through 2017. Future payments required under operating leases as of October 31, 2008, are summarized as follows (in thousands):
2009 .................................................................................................. $ 2,533 2010 .................................................................................................. 1,483 2011 .................................................................................................. 927 2012 .................................................................................................. 575 2013 .................................................................................................. Thereafter ..........................................................................................
442 540
Total .................................................................................................. $ 6,500 Lease expense for the years ended October 31, 2008, 2007, and 2006 was $2.6 million, $2.3 million, and $1.9 million, respectively. We recorded approximately $180,000 of lease income during fiscal 2008 from subletting 50,000 square feet of our Indianapolis facility. The sublease expires on April 30, 2010.

HURCO COMPANIES, INC. NOTES TO CONSOLIDATED FINANCIAL STATEMENTS – Continued
46
14. QUARTERLY HIGHLIGHTS (Unaudited)
First Quarter
Second Quarter
Third Quarter
Fourth Quarter
2008 (In thousands, except per share data)
Sales and service fees ................................... $ 60,923 $ 58,285 $ 57,318 $ 47,468
Gross profit .................................................. 24,857 20,331 20,879 16,550
Gross profit margin ...................................... 40.8% 34.9% 36.4% 34.9%
Selling, general and administrative expenses 12,376 11,676 11,829 10,930
Operating income ......................................... 12,481 8,655 9,050 5,620
Provision for income taxes ........................... 4,522 3,054 2,954 1,116
Net income ................................................... 7,805 5,467 5,826 3,422
Income per common share – basic ............... $1.22 $0.85 $0.91 $0.51
Income per common share – diluted ............ $1.21 $0.85 $0.90 $0.50
First Quarter
Second Quarter
Third Quarter
Fourth Quarter
2007 (In thousands, except per share data)
Sales and service fees ................................... $ 46,878 $ 42,494 $ 48,555 $ 50,120
Gross profit .................................................. 17,324 16,349 18,417 18,992
Gross profit margin ...................................... 37.0% 38.5% 37.9% 37.9%
Selling, general and administrative expenses 9,250 9,405 10,228 11,241
Operating income ......................................... 8,074 6,944 8,189 7,751
Provision for income taxes ........................... 2,998 2,764 3,659 2,455
Net income ................................................... 5,395 4,680 5,163 5,651
Income per common share – basic ............... $0.85 $0.73 $0.81 $0.88
Income per common share – diluted ............ $0.84 $0.73 $0.80 $0.88
15. SEGMENT INFORMATION We operate in a single segment: industrial automation equipment. We design and produce interactive computer control systems and software and computerized machine tools for sale through our own distribution network to the worldwide metal working market. We also provide software options, control upgrades, accessories and replacement parts for our products, as well as customer service and training support.

HURCO COMPANIES, INC. NOTES TO CONSOLIDATED FINANCIAL STATEMENTS – Continued
47
We sell our products through more than 100 independent agents and distributors throughout North America, Europe and Asia. The Hurco line is the primary line for the majority of our distributors globally even though some may carry competitive products. We also have our own direct sales personnel in Canada, England, France, Germany, Italy, Singapore and China, which are among the world's principal machine tool consuming countries. During fiscal 2008, no distributor accounted for more than 5% of our sales and service fees. Approximately 89% of the worldwide demand for computerized machine tools and computer control systems comes from outside the U.S. In fiscal 2008, more than 75% of our revenues were from overseas customers and no single end-user of our products accounted for more than 5% of our total sales and service fees. The following table sets forth the contribution of each of our product groups to our total sales and service fees during each of the past three fiscal years (in thousands): Net Sales and Service Fees by Product Category Year ended October 31,
2008 2007 2006 Computerized Machine Tools................................... $ 199,238 $ 165,832 $ 128,946 Computer Control Systems and Software * .............. 5,677 5,291 4,694 Service Parts ............................................................. 13,240 12,096 10,494 Service Fees .............................................................. 5,838 4,828 4,383 Total .................................................................... $ 223,994 $ 188,047 $ 148,517 *Amounts shown do not include computer control systems and software sold as an integrated component of computerized machine systems. The following table sets forth revenues by geographic area, based on customer location, for each of the past three fiscal years (in thousands): Revenues by Geographic Area Year Ended October 31 2008 2007 2006 North America ............................................................. $ 48,087 $ 50,010 $ 48,711 Germany ....................................................................... 81,945 58,860 39,764United Kingdom ........................................................... 20,877 19,326 16,089France ........................................................................... 13,412 11,019 9,107Other Europe ................................................................ 46,531 35,245 22,113 Total Europe ............................................................. 162,765 124,450 87,073 Asia .............................................................................. 11,816 12,493 11,866Other Foreign ............................................................... 1,326 1,094 867 Total Foreign ............................................................ 175,907 138,037 99,806 $ 223,994 $ 188,047 $ 148,517 Long-lived tangible assets by geographic area were (in thousands): As of October 31 2008 2007 2006 United States ...................................................................... $ 8,421 $ 7,795 $ 8,308 Foreign countries ............................................................... 6,996 5,489 2,934 $ 15,417 $ 13,284 $ 11,242

HURCO COMPANIES, INC. NOTES TO CONSOLIDATED FINANCIAL STATEMENTS – Continued
48
16. NEW ACCOUNTING PRONOUNCEMENTS During 2006, the FASB released Statement No. 157, “Fair Value Measurements,” a new standard that provides further guidance on using fair value to measure assets and liabilities, the information used to measure fair value and the effect of fair value measurements on earnings. Statement 157 applies whenever other standards require (or permit) assets or liabilities to be measured at fair value, but does not expand the use of fair value in any new circumstances. The changes to current practice resulting from the adoption of this statement relate to defining fair value, the methods used to measure fair value and expanding our financial statement disclosures about our fair value measurements. We will be required to adopt and report the impact of Statement 157 in the first quarter of fiscal 2009. In February 2008, the FASB issued Staff Position (FSP) 157-2, “Effective Date of FASB Statement No. 157.” This FSP delays the effective date of Statement 157 for all nonfinancial assets and nonfinancial liabilities, except those that are recognized or disclosed at fair value on a recurring basis (at least annually) to fiscal years beginning after November 15, 2008. Although we have not adopted this statement, we have assessed the potential impact and have concluded that its adoption will not have a material effect on our financial position or results of operations. In March 2008, the FASB released Statement No. 161, “Disclosures about Derivative Instruments and Hedging Activities,” an amendment of SFAS No. 133.” Statement 161 will require increased disclosure of our derivative and hedging activities, including how derivative and hedging activities affect our consolidated statement of operations, balance sheet, and cash flows. Statement 161 is effective for interim periods and fiscal years beginning after November 15, 2008. The adoption of Statement 161 will increase the required disclosure of our derivative and hedging activities, but is not expected to have a material impact on our financial position or results of operations.

49
Item 9. CHANGES IN AND DISAGREEMENTS WITH ACCOUNTANTS ON ACCOUNTING AND FINANCIAL DISCLOSURE
None. Item 9A. CONTROLS AND PROCEDURES Under the supervision and with the participation of management, including our Chief Executive Officer and Chief Financial Officer, we carried out an evaluation of the effectiveness of the design and operation of our disclosure controls and procedures as of October 31, 2008 pursuant to Rule 13a-15(b) under the Securities Exchange Act of 1934, as amended. Based upon that evaluation, our management, including the Chief Executive Officer and Chief Financial Officer, concluded that our disclosure controls and procedures were effective as of the evaluation date. There have been no changes in our internal controls over financial reporting that occurred during the fourth quarter of the fiscal year ended October 31, 2008 that have materially affected, or are reasonably likely to materially affect, our internal controls over financial reporting.

50
Item 9B. OTHER INFORMATION During the fourth quarter of fiscal 2008, the Audit Committee of the Board of Directors did not engage our independent registered public accounting firm to perform any non-audit services. This disclosure is made pursuant to Section 10A(i)(2) of the Securities Exchange Act of 1934, as added by Section 202 of the Sarbanes-Oxley Act of 2002. The following graph illustrates the cumulative total shareholder return on Hurco common stock for the five-year period ended October 31, 2008, as compared to the Russell 2000 and a peer group consisting of traded securities for U.S. companies in the same three digit SIC group as Hurco (SIC 3540-3549 – Metal Working Machinery and Equipment). The comparisons in this table are required by the SEC and are not intended to forecast or be indicative of possible future performance of Hurco common stock.
$0
$500
$1,000
$1,500
$2,000
$2,500
10/03 10/04 10/05 10/06 10/07 10/08
COMPARISON OF 5 YEAR CUMULATIVE TOTAL RETURN*Among Hurco Companies, Inc., The Russell 2000 Index
And Peer Group - SIC Codes 3540-3549
Hurco Companies, Inc. Russell 2000 Peer Group - SIC Codes 3540-3549
*$100 invested on 10/31/03 in stock & index-including reinvestment of dividends.Fiscal year ending October 31.
10/03 10/04 10/05 10/06 10/07 10/08 Hurco Companies, Inc. 100.00 557.59 693.77 1014.01 2221.79 875.49 Russell 2000 100.00 111.73 125.23 150.25 164.18 108.09 Peer Group - SIC Codes 3540-3549 100.00 159.75 170.26 177.47 220.27 116.68
*The stock price performance included in this graph is not necessarily indicative of future stock price performance

51
PART III Item 10. DIRECTORS, EXECUTIVE OFFICERS AND CORPORATE GOVERNANCE The information required by this item is incorporated herein by reference to the definitive proxy statement for our 2009 annual meeting of shareholders except that the information required by Item 10 regarding our executive officers is included herein under a separate caption at the end of Part I. Item 11. EXECUTIVE COMPENSATION The information required by this item is incorporated herein by reference to the definitive proxy statement for our 2009 annual meeting of shareholders. Item 12. SECURITY OWNERSHIP OF CERTAIN BENEFICIAL OWNERS AND
MANAGEMENT AND RELATED STOCKHOLDER MATTERS Except for the information concerning equity compensation plans, the information required by this item is incorporated herein by reference to the definitive proxy statement for our 2009 annual meeting of shareholders. Equity Compensation Plan Information
The following table gives information about our common stock that may be issued upon the exercise of options, warrants and rights under all of our existing equity compensation plans as of October 31, 2008:
Plan Category
Number of securities to be
issued upon exercise of outstanding
options, warrants and rights (a) (#)
Weighted-average
exercise price of outstanding
options, warrants and rights (b) ($)
Number of securities remaining available for future issuance under equity compensation
plans (excluding securities reflected in
column (a)) (c) (#) Equity compensation plans approved by security holders
64,369 $20.29 740,000
Equity compensation plans not approved by security holders
-- -- -- Total 64,369 $20.29 740,000
As of October 31, 2008, there were no outstanding non-qualified options that had been granted other than pursuant to a plan approved by our shareholders. Item 13. CERTAIN RELATIONSHIPS AND RELATED TRANSACTIONS, AND DIRECTOR INDEPENDENCE The information required by this item is incorporated herein by reference to the definitive proxy statement for our 2009 annual meeting of shareholders. Item 14. PRINCIPAL ACCOUNTING FEES AND SERVICES The information required by this item is incorporated herein by reference to the definitive proxy statement for our 2009 annual meeting of shareholders.

52
PART IV Item 15. EXHIBITS AND FINANCIAL STATEMENT SCHEDULES (a) 1. Financial Statements. The following consolidated financial statements of Registrant are
included herein under Item 8 of Part II: Page Report of Independent Registered Public Accounting Firm – Crowe
Horwath LLP .................................................................................................
27 Consolidated Statements of Income – years ended
October 31, 2008, 2007 and 2006...............................................................
29 Consolidated Balance Sheets – as of October 31, 2008 and 2007................. 30 Consolidated Statements of Cash Flows – years
ended October 31, 2008, 2007 and 2006 ....................................................
31 Consolidated Statements of Changes in Shareholders’ Equity –
years ended October 31, 2008, 2007 and 2006...........................................
32 Notes to Consolidated Financial Statements ................................................. 33 2. Financial Statement Schedule. The following financial statement schedule is included in this
Item. Page Schedule II - Valuation and Qualifying Accounts and Reserves ............................................................................. 53 All other financial statement schedules are omitted because they are not applicable or the required
information is included in the consolidated financial statements or notes thereto. (b) Exhibits Exhibits being filed with this Form 10-K or incorporated herein by reference are listed on page 54.

53
Schedule II - Valuation and Qualifying Accounts and Reserves for the years ended October 31, 2008, 2007, and 2006
(Dollars in thousands)
Description
Balance at Beginning of Period
Charged to Costs and Expenses
Charged To Other Accounts
Deductions
Balance At End
Of Period Allowance for doubtful Accounts for the year ended:
October 31, 2008 .................. $ 751 $ (42) -- $ 31 (1) $ 678 October 31, 2007 .................. $ 635 $ 128 -- $ 12 (2) $ 751 October 31, 2006 .................. $ 842 $ (227) -- $ (20) (3) $ 635 Accrued warranty expenses For the year ended:
October 31, 2008 .................. $ 2,449 $ 2,755 -- $ 2,666 $ 2,536 October 31, 2007 .................. $ 1,926 $ 2,610 -- $ 2,087 $ 2,449 October 31, 2006 .................. $ 1,618 $ 2,201 -- $ 1,893 $ 1,926
(1) Receivable write-offs of $39,000, net of cash recoveries on accounts previously written off of $8,000.
(2) Receivable write-offs of $20,000, net of cash recoveries on accounts previously written off of $8,000.
(3) Receivable write-offs of $5,000, net of cash recoveries on accounts previously written off of $25,000.

54
EXHIBITS INDEX Exhibits Filed. The following exhibits are filed with this report: 10.1* 10.2*
Summary compensation table.Form of restated split-dollar insurance agreement
11 Statement re: computation of per share earnings.21 Subsidiaries of the Registrant.23.1 Consent of Independent Registered Public Accounting Firm, Crowe Horwath LLP 31.1 Certification by the Chief Executive Officer, pursuant to Rule 13a-15(b) under the Securities
and Exchange Act of 1934, as amended. 31.2 Certification by the Chief Financial Officer, pursuant to Rule 13a-15(b) under the Securities
and Exchange Act of 1934, as amended. 32.1 Certification by the Chief Executive Officer pursuant to Section 906 of the Sarbanes-Oxley
Act of 2002. 32.2 Certification by the Chief Financial Officer pursuant to Section 906 of the Sarbanes-Oxley
Act of 2002. Exhibits Incorporated by Reference. The following exhibits are incorporated into this report: 3.1 Amended and Restated Articles of Incorporation of the Registrant, incorporated by reference to
Exhibit 3.1 to the Registrant's Quarterly Report on Form 10-Q for the quarter ended July 31, 2000.
3.2 Amended and Restated By-Laws of the Registrant as amended through September 27, 2006,
incorporated by reference to Exhibit 3.1 to the Registrant’s Current Report on Form 8-K filed on September 27, 2006.
10.2 Credit Agreement dated as of December 7, 2007, between Hurco Companies, Inc. And JP
Morgan Chase Bank, N.A. incorporated by reference to Exhibit 10.1 to the Registrant’s Current Report on Form 8-K filed December 12, 2007.
10.3* Employment Agreement between the Registrant and John G. Oblazney dated January 12, 2007,
incorporated by reference to Exhibit 10.1 to the Registrant’s Annual Report on Form 10-K for the year ended October 31, 2006.
10.4* Employment Agreement between the Registrant and James D. Fabris dated November 18,
1997, incorporated by reference as Exhibit 10.15 to the Registrant's Quarterly Report on Form 10-Q for the quarter ended January 31, 1998.
10.5* Employment Agreement between the Registrant and Michael Doar dated November 13, 2001,
incorporated by reference as Exhibit 10.2 to the Registrant’s Quarterly Report on Form 10-Q for the quarter ended January 31, 2002.
10.6* Amended 1997 Stock Option and Incentive Plan incorporated by reference as Exhibit 10 to the
Registrant’s Quarterly Report on Form 10-Q filed for the quarter ended July 31, 2005. 10.7 Hurco Companies, Inc. 2008 Equity Incentive Plan incorporated by reference to Appendix A
of the Registrant’s definitive Proxy Statement on Schedule 14A filed January 28, 2008.
* The indicated exhibit is a management contract, compensatory plan or arrangement required to be listed by Item 601 of Regulation S-K.

55
SIGNATURES Pursuant to the requirements of Section 13 or 15(d) of the Securities Exchange Act of 1934, the Registrant has duly caused this Report to be signed on its behalf by the undersigned, thereunto duly authorized, this 12th day of January 2009.
HURCO COMPANIES, INC.
By: /s/ John G. Oblazney John G. Oblazney Vice-President, Secretary, Treasurer and Chief Financial Officer

56
Pursuant to the requirements of the Securities Exchange Act of 1934, this report has been signed below by the following persons on behalf of the Registrant and in the capacities and on the dates indicated: Signature and Title(s) Date _/s/Michael Doar____________________ _____ January 12, 2009Michael Doar, Chairman of the Board, Chief Executive Officer and Director of Hurco Companies, Inc. (Principal Executive Officer) _/s/John G. Oblazney______________________ January 12, 2009John G. Oblazney Vice-President, Secretary, Treasurer and Chief Financial Officer of Hurco Companies, Inc. (Principal Financial Officer) _/s/Sonja K. McClelland _______________ ____ January 12, 2009Sonja K. McClelland Corporate Controller, Assistant Secretaryof Hurco Companies, Inc. (Principal Accounting Officer) _/s/Stephen H. Cooper______________________ January 12, 2009Stephen H. Cooper, Director _/s/Robert W. Cruickshank__________________ January 12, 2009Robert W. Cruickshank, Director _/s/Philip James___________________________ January 12, 2009Philip James, Director _/s/Michael P. Mazza ______________________Michael P. Mazza, Director January 12, 2009 _/s/Richard T. Niner________________________ January 12, 2009Richard T. Niner, Director _/s/Charlie Rentschler______________________ January 12, 2009Charlie Rentschler, Director _/s/Janaki Sivanesan ______________________ January 12, 2009Janaki Sivanesan, Director

57
Exhibit 10.1
SUMMARY COMPENSATION SHEET January 1, 2009
Compensation of Non-Employee Directors
Annual Retainer. Non-employee members of the Board of Directors of Hurco Companies, Inc. (the “Company”) receive a cash retainer of $5,000 per fiscal quarter.
Committee Retainers. Committee chairs and audit committee members also receive the following
cash payments:
• Audit Committee Chair - $5,000 per fiscal quarter.
• All other Committee Chairs - $2,500 per fiscal quarter.
• Audit Committee Members - $2,500 per fiscal quarter
Meeting Fees. Non-employee directors also receive a cash fee of $1,500 for each Board meeting attended.
Reimbursement. The Company reimburses non-employee directors for travel and other expenses incurred in attending Board and committee meetings.
Compensation of Named Executive Officers
Base Salaries. The executive officers of the Company serve at the discretion of the Board of Directors. The Compensation Committee of the Board sets or ratifies the annual base salaries of the Company’s executive officers. The following are the annual base salary levels as of January 1, 2009 for the Company’s current Chief Executive Officer, Chief Financial Officer and its two other most highly compensated executive officers (the “Named Executive Officers”) identified in the proxy statement for the Company’s 2009 annual meeting of shareholders:
Michael Doar Chairman and Chief Executive Officer
$ 375,000
John G. Oblazney Secretary, Treasurer and Chief Financial Officer
$ 185,000
James D. Fabris President and Chief Operating Officer
$ 335,000
Sonja K. McClelland Corporate Controller and Assistant Secretary
$ 130,000
Employment Agreements. The Company has entered into employment agreements with the Chief Executive Officer, the Chief Financial Officer and the Chief Operating Officer. These contracts generally provide for salary payments and other benefits for twelve months if the officer’s employment terminates for a qualifying event or circumstance other than gross misconduct. The employment agreements are filed as exhibits to the Company’s Annual Report on Form 10-K for the fiscal year ended October 31, 2008.

58
Bonuses. Each of the Named Executive Officers may be eligible to receive a discretionary bonus set or ratified by the Compensation Committee. On November 20, 2008, the Compensation Committee approved the following bonuses for the Named Executive Officers for fiscal 2008:
Michael Doar Chairman and Chief Executive Officer
$ 670,000
John G. Oblazney Secretary, Treasurer and Chief Financial Officer
$ 100,000
James D. Fabris President and Chief Operating Officer
$ 600,000
Sonja K. McClelland Corporate Controller and Assistant Secretary
$ 90,000
Deferred Compensation Plan. The Company maintains a nonqualified deferred compensation
plan in which senior managers and other highly compensated employees are eligible to participate. Eligible participants of the plan are able to defer between 2% and 50% of base salary and up to 100% of long-term annual bonus less required and voluntary payroll deductions in a given plan year. The Board of Directors may declare a discretionary amount of matching credits for participants deferring compensation, up to a maximum of 6% of compensation. Participants are 100% vested in all deferral and matching accounts at all times. Amounts deferred under the plan are credit with earnings at the rate of return generated by mutual fund investment options elected by the participants that are offered in the Company’s 401(k) Plan.
Medical, Disability and Life Insurance. The Named Executive Officers participate in benefits
coverage to help manage the financial impact of ill health, disability and death. All Named Executive Officers are provided a supplemental disability benefit and the Chief Executive Officer and the Chief Operating Officer are provided a split-dollar life insurance benefit.
Retirement Benefits. The Company sponsors a 401(k) Plan in which full-time employees are
eligible to participate. The purpose of the plan is to provide an incentive for employees to save for their retirement income needs and to provide additional attraction and retention of employees. Executive officers participate in the 401(k) Plan on the same basis as other eligible employees.
Perquisites. Perquisites offered to the Named Executive Officers include reimbursement of a
health club membership, personal travel, and use of company leased vehicles.

59
Exhibit 10.2
FORM OF RESTATED SPLIT-DOLLAR INSURANCE AGREEMENT
THIS RESTATED AGREEMENT is entered into as of this 31st day of December, 2008, by and between Hurco Companies, Inc., an Indiana corporation (the "Employer"), and ________________, (the "Employee").
Recitals
A. The Employee is a valued employee of the Employer, and the Employer wishes to retain him in its employ.
B. The Employer, as an inducement to such continued employment, has determined to assist the Employee with his personal life insurance program.
C. Prior to the execution of this restated agreement, the Employer has been operating a split-dollar insurance program pursuant to which it became the owner of certain life insurance policies (the "Policies") issued by The Northwestern Mutual Life Insurance Company on the life of the Employee, naming the Employer as an insured party and providing the Employee with the right to designate the beneficiary for a portion of the life insurance proceeds and certain other rights.
D. The Employer and the Employee now wish to amend and restate the terms of the program by entering into this Restated Split-Dollar Insurance Agreement (the "Restated Agreement").
Agreement
Now, therefore, in consideration of the foregoing and the following mutual undertakings, the Employer and the Employee agree as follows:
1. The Employer will continue to be the sole owner of the Policies.
2. In the event of the Employee's death, the beneficiaries of the Policies shall have the following interests in the proceeds of the Policies:
(a) The Employer shall be the direct beneficiary of the Policies to the extent of (i) the total premium advances paid to the Insurer, plus (ii) the Employer's other cash payments to or on behalf of the Employee related to the Policies, less (iii) the outstanding indebtedness on the Policies ("Primary Interest").
(b) If the proceeds of the Policies exceed the amount of the Primary Interest, the Employee's designated beneficiaries shall be the direct beneficiaries of the remaining proceeds to the extent of 200% of the Employee's annual compensation rate at his date of death, plus 100% of the Employee's most recently received bonus as of his date of death ("Secondary Interest").
(c) If the proceeds of the Policies exceed the sum of the Primary Interest and the Secondary Interest, the Employer shall be the direct beneficiary of any remaining proceeds.
3. The Employee shall have the right to designate and change direct and contingent beneficiaries of the Secondary Interest and to elect and change a payment plan for such beneficiaries with respect to the Secondary Interest.
4. The Employer shall pay all premiums on the Policies as they become due.

60
5. Policy dividends shall be applied to purchase paid-up additional insurance protection.
6. The Employer shall not sell, surrender, change the insured, or transfer ownership of the Policies while this Restated Agreement is in effect.
7. In the event of the Employee's termination for any reason other than death, the Restated Agreement shall terminate, and the Employee shall have the option, for a period of 60 days, to purchase the Policies by paying the Employer in cash an amount equal to the Primary Interest. The 60-day purchase period will begin six months following the Employee's termination date. If the Employee does not purchase a Policy pursuant to this Section, the Employer may sell, surrender, change the insured, or transfer ownership of the Policy, and the Employee shall forfeit all rights under the Policy.
8. The Restated Agreement shall terminate automatically with respect to the Policies at the end of the 15th policy year of the first-issued Policy. In that event, the Employee shall have the option, for 60 days following the Restated Agreement's termination date, to purchase the Policies by paying the Employer in cash an amount equal to the Primary Interest. If the Employee does not purchase a Policy pursuant to this Section, the Employer may sell, surrender, change the insured, or transfer ownership of the Policy, and the Employee shall forfeit all rights under the Policy.
9. The Insurer shall be bound only by the provisions of the Policies and any endorsements, and any payments made or action taken by it in accordance with the Policies and any endorsements shall fully discharge it from all claims, suits and demands of all persons whatsoever. It shall in no way be bound by or be deemed to have notice of the provisions of this Restated Agreement.
10. The Employee shall have the right to assign any part or all of the Employee's interest in the Policies and this Restated Agreement to any person, trust, or other entity by execution of a written assignment delivered to the Employer and to the Insurer.
11. Subject to Section 13, the Employer and Employee may amend this Restated Agreement at any time by written amendment signed by the Employer and Employee
12. This Restated Agreement shall bind and inure to the benefit of the Employer and its successors and assigns; the Employee and his heirs, executors, administrators and assigns; and any beneficiary of the Policies.
13. This Restated Agreement shall be interpreted and applied in a manner consistent with the applicable standards for nonqualified deferred compensation plans established by Internal Code Section 409A and its interpretive regulations and other regulatory guidance. To the extent that any terms of this Restated Agreement would subject the Employee to gross income inclusion, interest, or additional tax pursuant to Code Section 409A, those terms are to that extent superseded by, and shall be adjusted to the minimum extent necessary to satisfy, the applicable Code Section 409A standards.
14. The following provisions are part of this Restated Agreement and are intended to meet the requirements of the Employee Retirement Income Security Act of 1974 with respect to the benefit plan ("Plan") established by this Restated Agreement:
(a) The named fiduciary shall be the Employer.
(b) The funding policy under this Plan is that all premiums on the Policies be remitted to the Insurer when due.
(c) Direct payment by the insurer is the basis of payment of benefits under this Plan, with those benefits in turn being based on the payment of premiums as provided in the Plan.
61
(d) For claims procedure purposes, the "Claims Manager" shall be the Employer.
(1) The Employee may claim Plan benefits by filing a written application with the Claims Manager. The Claims Manager will notify the claimant of its decision within 90 days of the date the claim is filed. If special circumstances require an extension of time, the Claims Manager may extend the period for up to 90 days by notifying the claimant of the extension in writing, the reason for the extension, and the expected decision date.
(2) If a claim for Plan benefits is denied, the Claims Manager will deliver to the claimant a written explanation setting forth the specific reasons for the denial; references to the specific Plan provisions on which the denial is based; a description of any additional material or information necessary for the claimant to perfect the claim and an explanation of why such material or information is necessary; and a description of the Plan's review procedures and the claimant's right to bring a civil action in federal court following any denial of the claim on review.
(3) The claimant shall have 60 days following receipt of the claim denial to file with the Claims Manager a written request, signed by the claimant or his authorized representative, for review of the denial. For such review, the claimant or his representative may submit written comments, documents, records, and other information relating to the claim. In addition, the claimant may, upon request and free of charge, have reasonable access to and copies of all documents, records, and other information relevant to the claim.
(4) In completing the review, the Claims Manager will take into account all submitted information, without regard to whether it was submitted as part of the initial claim. Within 60 days of the request for review, the Claims Manager will decide the issue on review and notify the claimant. If special circumstances require an extension of time, the Claims Manager may extend the period for up to 60 days by notifying claimant of the extension in writing, the reason for the extension, and the expected decision date.
(5) If the claim in denied on review, the Claims Manager will notify the claimant of the decision in writing and will include specific reasons for the denial; specific references to the pertinent Plan provisions on which the denial is based; a description of the claimant's right to receive, upon request and free of charge, reasonable access to and copies of all documents, records, and other information relevant to the claim; and an explanation of the claimant's right to bring a civil action in federal court.

62
IN WITNESS WHEREOF, the parties have executed this Restated Agreement.
HURCO COMPANIES, INC.
by _______________________________ Signature _______________________________ Title
EMPLOYEE
__________________________________ Signature

63
Exhibit 11
STATEMENT RE: COMPUTATION OF PER SHARE EARNINGS
Three Months Ended Twelve Months Ended October 31, October 31, 2008 2007 2008 2007 (in thousands, except per share amount) Basic Diluted Basic Diluted Basic Diluted Basic Diluted Net income $ 3,422 $ 5,648 $ 5,648 $ 5,648 $ 20,520 $ 20,520 $ 20,889 $ 20,889 Weighted average shares outstanding 6,415 6,415 6,382 6,382 6,415 6,415 6,382 6,382 Assumed issuances under stock options plans -- 21 -- 63 -- 29 -- 58 6,415 6,436 6,382 6,445 6,415 6,444 6,382 6,440 Income per common share $ .53 $ .53 $ .88 $ .88 $ 3.51 $ 3.49 $ 3.27 $ 3.24

64
Exhibit 21
SUBSIDIARIES OF THE REGISTRANT
SUBSIDIARIES OF HURCO COMPANIES, INC.
Jurisdiction Name Of Incorporation Hurco B.V. the Netherlands Hurco Europe Limited United Kingdom Hurco GmbH Federal Republic of Germany Hurco Manufacturing Ltd. Taiwan R.O.C. Hurco S.a.r.l. France Hurco S.r.l. Italy Hurco (S.E. Asia) Pte Ltd. Singapore
The foregoing list does not include other subsidiaries which, individually or in the aggregate, did not constitute a significant subsidiary as of October 31, 2008.

65
Exhibit 23.1
CONSENT OF INDEPENDENT REGISTERED PUBLIC ACCOUNTING FIRM Crowe Horwath LLP
We consent to the incorporation by reference in the Registration Statements on Form S-3 (No. 333-144510) and Form S-8 (Nos. 333-48204 and 333-149809) of Hurco Companies, Inc. of our report dated January 12, 2009, with respect to the consolidated financial statements and financial statement schedule and the effectiveness of internal control over financial reporting which appears in this Form 10-K of Hurco Companies, Inc. as of and for the year ended October 31, 2008. /s/Crowe Horwath LLP Indianapolis, Indiana January 12, 2009

66
Exhibit 31.1 CERTIFICATION PURSUANT TO RULE 13a-14(a) UNDER THE SECURITIES EXCHANGE
ACT OF 1934, AS AMENDED I, Michael Doar, certify that:
1. I have reviewed this annual report on Form 10-K of Hurco Companies, Inc.;
2. Based on my knowledge, this report does not contain any untrue statement of a material fact or omit to state a material fact necessary to make the statements made, in light of the circumstances under which such statements were made, not misleading with respect to the period covered by this report;
3. Based on my knowledge, the financial statements, and other financial information included in this report, fairly present in all material respects the financial condition, results of operations and cash flows of the registrant as of, and for, the periods presented in this report;
4. The registrant's other certifying officer and I are responsible for establishing and maintaining disclosure controls and procedures [as defined in Exchange Act Rules 13a-15(e) and 15d-15(e)] and internal control over financial reporting [as defined in Exchange Act Rules 13a-15(f) and 15d-15(f)] for the registrant and have:
(a) Designed such disclosure controls and procedures, or caused such disclosure controls and procedures to be designed under our supervision, to ensure that material information relating to the registrant, including its consolidated subsidiaries, is made known to us by others within those entities, particularly during the period in which this report is being prepared;
(b) Designed such internal control over financing reporting, or caused such internal control over financial reporting to be designed under our supervision, to provide reasonable assurance regarding the reliability of financial reporting and the preparation of financial statements for external purposes in accordance with U.S. Generally Accepted Accounting Principles.
(c) Evaluated the effectiveness of the registrant's disclosure controls and procedures and presented in this report our conclusions about the effectiveness of the disclosure controls and procedures, as of the end of the period covered by this report based on such evaluation; and
(d) Disclosed in this report any change in the registrant's internal control over financial reporting that occurred during the registrant's most recent fiscal quarter (the registrant's fourth fiscal quarter in the case of an annual report) that has materially affected, or is reasonably likely to materially affect, the registrant's internal control over financial reporting; and
5. The registrant's other certifying officer and I have disclosed, based on our most recent evaluation of internal control over financial reporting, to the registrant's auditors and the audit committee of registrant's board of directors (or persons performing the equivalent functions):
(a) All significant deficiencies and material weaknesses in the design or operation of internal control over financial reporting which are reasonably likely to adversely affect the registrant's ability to record, process, summarize and report financial information; and
(b) Any fraud, whether or not material, that involves management or other employees who have a significant role in the registrant's internal control over financial reporting.
__/s/Michael Doar________________________ Michael Doar, Chairman of the Board & Chief Executive Officer January 12, 2009

67
Exhibit 31.2
CERTIFICATION PURSUANT TO RULE 13a-14(a) UNDER THE SECURITIES EXCHANGE ACT OF 1934, AS AMENDED
I, John G. Oblazney, certify that:
1. I have reviewed this annual report on Form 10-K of Hurco Companies, Inc.;
2. Based on my knowledge, this report does not contain any untrue statement of a material fact or omit to state a material fact necessary to make the statements made, in light of the circumstances under which such statements were made, not misleading with respect to the period covered by this report;
3. Based on my knowledge, the financial statements, and other financial information included in this report, fairly present in all material respects the financial condition, results of operations and cash flows of the registrant as of, and for, the periods presented in this report;
4. The registrant's other certifying officer and I are responsible for establishing and maintaining disclosure controls and procedures [as defined in Exchange Act Rules 13a-15(e) and 15d-15(e)] and internal control over financial reporting [as defined in Exchange Act Rules 13a-15(f) and 15d-15(f)] for the registrant and have:
(a) Designed such disclosure controls and procedures, or caused such disclosure controls and procedures to be designed under our supervision, to ensure that material information relating to the registrant, including its consolidated subsidiaries, is made known to us by others within those entities, particularly during the period in which this report is being prepared;
(b) Designed such internal control over financing reporting, or caused such internal control over financial reporting to be designed under our supervision, to provide reasonable assurance regarding the reliability of financial reporting and the preparation of financial statements for external purposes in accordance with U.S. Generally Accepted Accounting Principles.
(c) Evaluated the effectiveness of the registrant's disclosure controls and procedures and presented in this report our conclusions about the effectiveness of the disclosure controls and procedures, as of the end of the period covered by this report based on such evaluation; and
(d) Disclosed in this report any change in the registrant's internal control over financial reporting that occurred during the registrant's most recent fiscal quarter (the registrant's fourth fiscal quarter in the case of an annual report) that has materially affected, or is reasonably likely to materially affect, the registrant's internal control over financial reporting; and
5. The registrant's other certifying officer and I have disclosed, based on our most recent evaluation of internal control over financial reporting, to the registrant's auditors and the audit committee of registrant's board of directors (or persons performing the equivalent functions):
(a) All significant deficiencies and material weaknesses in the design or operation of internal control over financial reporting which are reasonably likely to adversely affect the registrant's ability to record, process, summarize and report financial information; and
(b) Any fraud, whether or not material, that involves management or other employees who have a significant role in the registrant's internal control over financial reporting.
_/s/John G. Oblazney_________________________ John G. Oblazney Vice President & Chief Financial Officer January 12, 2009

68
Exhibit 32.1
CERTIFICATION PURSUANT TO SECTION 906 OF THE SARBANES-OXLEY ACT OF 2002
In connection with the Annual Report of Hurco Companies, Inc. (the “Company”) on Form 10-K for the period ending October 31, 2008, as filed with the Securities and Exchange Commission on the date hereof (the “Report”), the undersigned hereby certifies, pursuant to § 906 of the Sarbanes-Oxley Act of 2002, that:
(1) The Report fully complies with the requirements of section 13(a) or 15(d) of the Securities Exchange Act of 1934; and
(2) The information contained in the Report fairly presents, in all material respects, the financial condition and results of operations of the Company.
/s/Michael Doar Michael Doar Chairman of the Board & Chief Executive Officer January 12, 2009

69
Exhibit 32.2
CERTIFICATION PURSUANT TO SECTION 906 OF THE SARBANES-OXLEY ACT OF 2002
In connection with the Annual Report of Hurco Companies, Inc. (the “Company”) on Form 10-K for the period ending October 31, 2008, as filed with the Securities and Exchange Commission on the date hereof (the “Report”), the undersigned hereby certifies, pursuant to § 906 of the Sarbanes-Oxley Act of 2002, that:
(1) The Report fully complies with the requirements of section 13(a) or 15(d) of the Securities Exchange Act of 1934; and
(2) The information contained in the Report fairly presents, in all material respects, the financial condition and results of operations of the Company. /s/John G. Oblazney John G. Oblazney Vice President & Chief Financial Officer January 12, 2009

HURCO COMPANIES, INC. LEADERSHIP
Board of DirectorsStephen H. Cooper Attorney and Educator (2)
Robert W. CruickshankIndependent Business Consultant (1,2,3)
Michael DoarChairman and Chief Executive Offi cer Hurco Companies, Inc.
Philip JamesPresident of James Consulting Associates LLC
Michael P. Mazza Attorney, Michael P. Mazza, LLC(2)
Richard T. NinerPrivate Investor (1)
Charlie RentschlerVice President of Wall Street Access(1)
Janu Sivanesan Attorney, Katten Muchin Rosenman LLP
1 Nominating and Governance Committee
2 Audit Committee
3 Compensation Committee
Corporate Offi cers and Division ExecutivesMichael Doar Chairman and Chief Executive Offi cer
James D. Fabris President and Chief Operating Offi cer
John G. Oblazney Vice President, Secretary, Treasurer and Chief Financial Offi cer
Sonja K. McClelland Corporate Controller, Assistant Secretary
James D. Kawaguchi General Manager, Hurco North America.
Gerhard Kohlbacher President, Hurco Germany
David Waghorn General Manager, Hurco United Kingdom
Phillippe Chevalier General Manager, Hurco France
Paolo Casazza General Manager, Hurco Italy
William Chan General Manager, Hurco Southeast Asia, China
Charlie Tsai General Manager, Hurco Manufacturing Limited (Taiwan) and Ningbo Hurco Machine Tool Co., Ltd. (Ningbo, China)
Kumar Narayan General Manager, Hurco India
Annual Report 2008
CORPORATE INFORMATION
Annual MeetingAll shareholders are invited to attend our annual meeting, which will be held on Thursday, March 19, 2009 at 10 a.m. Eastern Daylight Time at Hurco’s Corporate Offi ces, One Technology Way, Indianapolis, Indiana.
Transfer AgentComputershare Trust Company, N.A., P.O. Box 43078, Providence, RI 02940-3078
Legal CounselCorporate Law: Baker & Daniels LLPPatent Law: Baker & Daniels LLP
Independent AuditorsCrowe Chizek and Company LLC, 3815 River Crossing Parkway, Suite 300, P.O. Box 40977, Indianapolis, IN 46240-0977
Investor Relations John G. Oblazney, Vice President, Secretary, Treasurer and Chief Financial Offi cer, One Technology Way, Indianapolis, Indiana 46268, Telephone (317) 293-5309
Stock Market InformationHurco Common Stock is traded on the Nasdaq Global Select Market under the ticker symbol HURC. Stock price quotations are printed daily in major newspapers.
The following table sets forth the high and low sales prices of the shares of Common Stock for the periods indicated, as reported by the Nasdaq Global Select Market.
The Company does not currently pay dividends on its Common Stock and intends to continue to retain earnings for working capital and capital expenditures.
There were approximately 186 holders of record of Hurco Common Stock as of January 7, 2008.
Disclosure Concerning Forward-Looking StatementsCertain statements made in this annual report may constitute “forward-looking statements” within the meaning of the Private Securities Litigation Reform Act of 1995. These forward-looking statements involve known and unknown risks, uncertainties and other factors that may cause our actual results, performance or achievements to be materially different from any future results, performance or achievements expressed or implied by such forward-looking statements. These factors include the risks identifi ed in Item 1A of the annual report on form 10K.
Fiscal Quarter Ended 2008 2007 High Low High LowJanuary 31 $ 58.68 $ 30.24 $ 33.18 $ 24.61April 30 $ 52.12 $33.41 $ 47.86 $33.07July 31 $ 49.30 $ 23.11 $ 56.28 $39.12October 31 $38.24 $ 16.92 $60.44 $39.77

Hurco (S.E. Asia) Pte. Ltd.Serving Singapore, Malaysia, Thailand, Australia, New
Zealand, Philippines, Indonesia, and Myanmar
Hurco USAHurco Companies, Inc.Hurco USA
Serving the USA, Mexico, and South America
Hurco Europe Ltd.Serving the United Kingdom, Ireland, Africa, the Middle
East, and Scandinavia
Hurco Germany (GmbH)Serving Germany, Austria, Belarus, Bosnia-Herzegovina, Croatia, the Czech
Republic, Hungary, Latvia, Lithuania, the Netherlands, Poland, Portugal, Romania, Russia, Slovakia, Spain, Turkey, Ukraine, and the Federal Republic of Yugoslavia
Hurco Italy (S.r.l.)
Netherlands
Hurco ChinaHurco France (S.a.r.l.) Ningbo
Hurco Canada Ltd.
Shenzhen Technical Center
Hurco South Africa
Hurco South Korea
Taiwan (HML/HAL)Hurco Manufacturing Ltd.Hurco Automation Ltd.
HML is responsible for the manufacturing and assembly of Hurco machine tools.
HAL is responsible for the manufacturing and assembly of Hurco controls.
Singapore
L.A. Technical CenterIndianapolis, Indiana
EnglandGermanyItaly
France
Hurco India Pte. Ltd.Serving India, Pakistan, Bangladesh,
and Sri Lanka
Canada
Sweden
Spain
GLOBAL LOCATIONS

One Technology Way PO Box 68180 Indianapolis, IN 46268 800.634.2416 www.hurco.com


