61


September 2009 Sharekhan ValueGuide2
CONTENTS
Some lingeringconcerns alongwith certain positivedevelopments keptthe market volatileand bound in anarrow range thewhole of lastmonth. Afterfluctuating throughout the month and traversing nearly3,000 points the benchmark index, Sensex, remainedflattish and ended the month around the 15,000 mark.Despite some fresh signs of recovery in both domestic aswell as global economy, mainly three factors succeededin capping the market’s upside during the month and couldcontinue to do so in the weeks ahead.
Monthly economy review
In June 2009, India’s trade deficit, though lower by 32.5%year on year (yoy), grew by 4% month on month (mom;the third consecutive sequential increase) and stood atUSD6.2 billion. The exports contracted by 29.2% yoywhile the imports fell by 39.2% yoy during the month.Though the pace of the decline in exports has moderated,we believe there is still some time before we could see aconclusive recovery in exports.
Sharekhan Special
REGULAR FEATURES
Report Card 4
Earnings Guide I
TRADER'S TECHNIQUES
Sensex 39
Turmeric 39
Copper 40
Derivatives view 40
INVESTMENT INSIGHTS
Market Outlook 7
Sharekhan Top Picks 13
Stock Ideas 16
Stock Update 26
Mutual Funds 36
Viewpoint 37
COMMODITIES CORNER
Castor seed 42
Copper 42
From Sharekhan’s Desk ValueGuide Index
PREMIER PORTFOLIOS
Smart Trades Portfolio 44
Nifty Portfolio 44
Derivatives Portfolio 44
3
3 8
4 3
3 5
4 1
6
Pit stop before the next lap

Sharekhan ValueGuide September 20093

September 2009 Sharekhan ValueGuide4
STOCK IDEAS STANDING (AS ON SEPTEMBER 04, 2009)
REPORT CARD
COMPANY RECO PRICE RECO CURRENT PRICE AS ON GAIN- ABSOLUTE PERFORMANCE RELATIVE TO SENSEX
PRICE TARGET DATE RECO 04-SEP-09 LOSS (%) 1M 3M 6M 12M 1M 3M 6M 12M
EVERGREEN
HDFC 2,700.0 2,517.0 19-Nov-07 Hold 2,462.7 -8.8 -6.0 1.4 100.8 -1.4 -2.9 -2.9 9.0 -4.8
HDFC Bank 358.0 1,654.0 23-Dec-03 Buy 1,454.3 306.2 -3.9 5.4 73.7 7.8 -0.7 1.0 -5.7 4.2
Infosys Technologies 689.1 2,368.0 30-Dec-03 Hold 2,201.1 219.4 5.3 34.3 84.1 25.2 8.8 28.7 -0.1 20.9
Larsen & Toubro 1,768.0 ** 18-Feb-08 Hold 1,567.4 -11.3 0.4 8.6 166.7 13.5 3.7 4.0 44.8 9.6
Reliance Ind 567.0 2,020.0 5-Feb-04 Hold 1,981.2 249.4 -4.3 -14.0 61.3 -12.7 -1.1 -17.6 -12.4 -15.7
TCS 426.3 588.0 6-Mar-06 Hold 531.9 24.8 0.4 54.8 141.7 28.5 3.7 48.3 31.2 24.1
APPLE GREEN
Aditya Birla Nuvo 714.0 ** 6-Dec-05 Hold 984.3 37.9 9.9 3.3 152.1 -23.8 13.5 -1.0 36.8 -26.4
Apollo Tyres 37.0 53.0 27-Jul-09 Buy 42.9 15.9 5.6 46.8 137.9 13.3 9.0 40.6 29.1 9.5
Bajaj Auto 586.2 1,290.0 15-Nov-05 Hold 1,234.5 110.6 -6.9 10.9 154.9 - -3.8 6.2 38.4 -
Bajaj Finserv 545.0 396.0 26-May-08 Buy 272.3 -50.0 -17.7 -34.1 83.5 - -15.0 -36.9 -0.4 -
Bajaj Holdings 741.9 810.0 26-May-08 Buy 472.0 -36.4 -6.0 9.2 123.5 -2.8 -2.9 4.6 21.3 -6.1
Bank of Baroda 239.0 444.0 25-Aug-06 Hold 427.3 78.8 -2.9 3.3 109.0 44.9 0.3 -1.1 13.5 40.0
Bank of India 135.0 397.0 25-Aug-06 Hold 333.9 147.3 -3.0 -2.3 60.1 17.9 0.2 -6.4 -13.1 13.9
Bharat Electronics 1,108.0 1,694.0 25-Sep-06 Buy 1,400.4 26.4 -4.9 8.1 66.1 51.0 -1.7 3.6 -9.8 45.8
Bharat Heavy Electricals 602.0 2,335.0 11-Nov-05 Hold 2,212.1 267.5 -6.1 3.3 61.5 24.2 -3.0 -1.1 -12.3 20.0
Bharti Airtel 313.0 453.0 8-Jan-07 Buy 405.0 29.4 -1.3 1.7 35.0 -2.7 1.9 -2.6 -26.7 -6.1
Corporation Bank 218.0 438.0 19-Dec-03 Buy 382.9 75.6 10.6 28.2 147.8 35.0 14.2 22.8 34.5 30.4
Crompton Greaves 88.1 ** 19-Aug-05 Hold 315.7 258.1 6.1 6.9 159.5 14.9 9.6 2.4 40.8 11.0
Glenmark Pharma 599.0 251.0 17-Jul-08 Hold 223.5 -62.7 -9.9 -8.6 49.5 -66.0 -6.9 -12.4 -18.8 -67.1
Godrej Consumer 145.0 240.0 7-May-09 Hold 237.1 63.5 4.8 27.3 88.9 88.5 8.3 21.9 2.5 82.1
Grasim 1,119.0 3,067.0 30-Aug-04 Hold 2,678.6 139.4 -6.6 14.3 93.3 31.7 -3.5 9.5 4.9 27.2
HCL Technologies 103.0 343.0 30-Dec-03 Hold 304.9 196.0 19.0 75.3 222.6 29.0 22.9 67.9 75.1 24.5
Hindustan Unilever 172.0 303.0 24-Nov-05 Hold 273.1 58.8 -6.1 13.4 12.5 10.1 -3.0 8.6 -38.9 6.3
ICICI Bank 284.0 781.0 23-Dec-03 Hold 743.9 161.9 -4.9 3.8 152.6 4.6 -1.7 -0.6 37.1 1.0
Indian Hotel Company 76.6 82.0 17-Nov-05 Buy 66.5 -13.3 -4.1 -12.0 93.9 -13.5 -0.9 -15.7 5.2 -16.5
ITC 69.5 248.0 12-Aug-04 Buy 233.3 235.6 -8.6 13.7 34.1 18.7 -5.6 8.9 -27.2 14.7
Lupin 403.5 1,181.0 6-Jan-06 Buy 982.9 143.6 2.9 17.0 56.3 32.4 6.3 12.1 -15.2 27.9
M&M 232.0 897.0 1-Apr-04 Hold 867.5 273.9 -11.5 18.3 165.3 40.8 -8.6 13.3 44.0 36.0
Marico 7.7 90.0 22-Aug-02 Hold 87.7 1,038.3 0.4 23.6 53.4 47.2 3.7 18.4 -16.8 42.2
Maruti Suzuki 360.0 1,609.0 23-Dec-03 Hold 1,546.6 329.6 2.7 44.7 125.2 127.2 6.1 38.6 22.2 119.4
Piramal Healthcare 146.0 373.0 16-Mar-04 Buy 321.1 119.9 -2.6 17.6 64.5 -1.7 0.6 12.7 -10.7 -5.1
Punj Lloyd 519.0 294.0 12-Dec-07 Buy 260.6 -49.8 0.6 18.1 264.6 -17.7 3.9 13.1 97.9 -20.5
SBI 476.0 1,957.0 19-Dec-03 Hold 1,762.5 270.3 -5.4 -5.5 82.3 16.6 -2.3 -9.5 -1.1 12.6
Sintex Industries 286.0 248.0 26-Sep-08 Buy 233.7 -18.3 5.0 4.1 167.3 -28.2 8.4 -0.3 45.1 -30.7
Tata Tea 789.0 ** 12-Aug-05 Hold 940.8 19.2 6.1 22.4 75.2 34.3 9.6 17.3 -4.9 29.7
Wipro 418.0 572.0 9-Jun-06 Hold 552.3 32.1 12.4 40.7 177.5 23.6 16.1 34.8 50.6 19.4
EMERGING STAR
3i Infotech 66.0 98.0 6-Oct-05 Hold 87.0 31.7 10.5 1.9 224.2 -22.4 14.1 -2.4 76.0 -25.0
Allied Digital Services 379.0 532.0 21-Aug-09 Buy 479.4 26.5 21.5 16.2 156.3 -35.2 25.5 11.3 39.1 -37.4
Alphageo India 150.0 ** 29-Nov-06 Buy 215.8 43.8 51.6 6.0 194.9 -38.0 56.6 1.6 60.1 -40.1
Axis (UTI) Bank 229.4 909.0 24-Feb-05 Hold 907.3 295.6 -3.6 23.9 177.8 18.8 -0.4 18.7 50.8 14.7
Balrampur Chini 98.0 148.0 8-Jun-09 Buy 119.3 21.7 -0.9 31.9 160.2 36.6 2.4 26.4 41.2 31.9
Cadila Healthcare 297.5 511.0 21-Mar-06 Buy 494.9 66.3 5.9 50.8 98.4 59.2 9.4 44.5 7.7 53.7
EMCO 81.2 115.0 29-Jun-09 Buy 91.3 12.4 2.6 6.4 209.7 -20.5 6.0 1.9 68.1 -23.2

Sharekhan ValueGuide September 20095
STOCK IDEAS STANDING (AS ON SEPTEMBER 04, 2009)
COMPANY RECO PRICE RECO CURRENT PRICE AS ON GAIN/ ABSOLUTE PERFORMANCE RELATIVE TO SENSEX
PRICE TARGET DATE RECO 04-SEP-09 LOSS (%) 1M 3M 6M 12M 1M 3M 6M 12M
REPORT CARD
** Under review * Reco price adjusted for demerger
Navneet Publications 56.8 107.0 22-Aug-05 Buy 98.7 73.7 9.0 45.7 163.8 55.3 12.6 39.6 43.2 50.0
Network 18 Fincap 476.0 143.0 20-Jun-07 Buy 97.2 -79.6 -3.1 -37.0 34.9 -50.5 0.1 -39.6 -26.8 -52.2
Opto Circuits India 199.0 216.0 13-May-08 Buy 187.4 -5.8 -1.1 -1.3 131.8 -2.2 2.1 -5.4 25.8 -5.5
Orchid Chemicals 254.0 163.0 16-Jan-06 Buy 128.5 -49.4 23.8 -12.7 90.9 -52.5 27.9 -16.4 3.6 -54.1
Patels Airtemp 88.2 94.0 7-Dec-07 Buy 55.8 -36.8 5.3 0.7 109.5 1.2 8.8 -3.6 13.7 -2.2
Thermax 430.0 390.0 14-Jun-05 Reduce 449.5 -4.3 3.9 17.5 194.9 -7.1 7.3 12.6 60.1 -10.2
Zee News 54.0 55.0 18-Oct-07 Buy 45.4 -15.9 12.8 2.0 55.1 7.3 16.5 -2.3 -15.8 3.6
UGLY DUCKLING
BASF 220.0 350.0 18-Sep-06 Buy 293.0 33.2 0.6 -0.9 77.5 9.4 3.9 -5.1 -3.7 5.7
Deepak Fert 50.6 109.0 17-Mar-05 Buy 87.5 72.8 2.9 -15.1 73.0 -3.4 6.3 -18.6 -6.1 -6.7
Genus Power 101.0 288.0 6-Jul-05 Buy 186.4 84.6 -3.2 -29.9 153.2 -43.1 0.0 -32.9 37.4 -45.0
ICI India 250.0 578.0 26-May-05 Buy 554.0 121.6 3.5 9.7 37.3 16.6 6.9 5.1 -25.5 12.6
India Cements 220.0 160.0 28-Sep-06 Hold 128.8 -41.5 -10.6 -21.3 30.1 -8.7 -7.6 -24.6 -29.4 -11.8
Ipca Laboratories 660.0 770.0 5-Nov-07 Buy 700.0 6.1 13.2 24.1 125.5 24.8 17.0 18.9 22.4 20.5
Jaiprakash Associates 25.0 266.0 30-Dec-03 Hold 217.8 771.2 -14.1 -4.6 241.4 24.9 -11.2 -8.6 85.3 20.7
Mold-Tek Technologies 46.0* 112.0 19-Dec-07 Buy 74.0 60.8 - - - - - - - -
Orbit Corporation 800.0 208.0 17-Dec-07 Hold 179.5 -77.6 -5.2 -13.7 305.1 -41.4 -2.1 -17.3 119.9 -43.4
Punjab National Bank 180.0 764.0 19-Dec-03 Hold 681.4 278.5 -3.7 6.3 123.8 35.5 -0.5 1.9 21.4 30.8
Ratnamani Metals 54.0 104.0 8-Dec-05 Buy 91.4 69.2 16.2 14.7 169.0 -41.3 20.0 9.9 46.0 -43.3
Selan Exploration 58.0 ** 20-Mar-06 Buy 275.5 375.0 50.4 28.4 144.0 4.0 55.4 23.0 32.4 0.5
Shiv-Vani Oil & Gas 370.0 370.0 4-Oct-07 Buy 339.5 -8.2 -7.4 11.0 227.8 -40.4 -4.3 6.3 77.9 -42.4
SEAMEC 190.0 258.0 12-Oct-06 Buy 183.3 -3.5 -7.6 11.4 219.2 55.2 -4.5 6.7 73.2 49.9
Subros 41.2 42.0 26-Apr-06 Buy 38.6 -6.4 5.6 26.0 160.1 23.8 9.1 20.7 41.2 19.5
Sun Pharmaceutical 302.0 1,217.0 24-Dec-03 Hold 1,209.6 300.5 2.3 -4.4 23.4 -21.7 5.7 -8.4 -33.0 -24.4
Torrent Pharma 185.0 328.0 4-Oct-07 Buy 279.6 51.1 25.0 53.3 124.9 39.5 29.1 46.8 22.0 34.7
UltraTech Cement 384.0 850.0 10-Aug-05 Buy 751.9 95.8 -7.5 2.6 63.0 22.1 -4.5 -1.7 -11.6 18.0
Union Bank of India 46.0 278.0 19-Dec-03 Hold 219.4 377.0 -6.9 2.8 78.6 44.8 -3.8 -1.5 -3.1 39.8
United Phosphorus 163.0 225.0 27-Aug-09 Buy 166.9 2.4 -8.6 -4.2 112.6 -0.2 -5.6 -8.3 15.4 -3.6
Zensar Technologies 342.0 262.0 18-Jun-07 Hold 234.4 -31.5 29.7 86.6 209.3 63.6 34.0 78.8 67.9 58.0
VULTURE'S PICK
Esab India 60.0 522.0 21-May-04 Buy 433.3 622.2 2.6 9.0 112.2 5.5 6.0 4.4 15.2 1.9
Mahindra Lifespace 799.0 411.0 9-Jan-08 Buy 360.1 -54.9 8.6 18.6 286.5 -26.6 12.1 13.6 109.8 -29.1
Orient Paper 21.4 67.0 30-Aug-05 Buy 55.2 157.9 6.3 7.0 186.5 61.8 9.8 2.5 55.5 56.2
Tata Chemicals 411.0 272.0 31-Dec-07 Hold 246.9 -39.9 -5.7 11.7 123.5 -23.4 -2.5 7.0 21.3 -26.0
Unity Infraprojects 692.0 430.0 26-Feb-08 Buy 352.9 -49.0 0.5 36.0 354.4 -23.6 3.8 30.3 146.7 -26.2
WS Industries 51.0 69.0 2-Dec-05 Hold 43.4 -15.0 7.0 -22.1 86.7 -7.2 10.6 -25.4 1.3 -10.4
CANNONBALL
Allahabad Bank 73.0 106.0 25-Aug-06 Buy 93.2 27.6 0.0 4.9 139.4 43.5 3.3 0.5 29.9 38.6
Andhra Bank 85.0 112.0 25-Aug-06 Buy 91.9 8.1 -3.6 2.9 128.4 58.4 -0.5 -1.4 24.0 53.0
IDBI Bank 106.0 169.0 19-Jun-09 Buy 106.5 0.5 -6.0 15.8 130.8 20.0 -2.8 11.0 25.3 15.9
Madras Cements 149.8 127.0 17-Nov-05 Hold 108.1 -27.8 -9.6 -7.5 81.0 -16.6 -6.6 -11.4 -1.7 -19.5
Phillips Carbon Black 135.0 185.0 14-Aug-09 Buy 144.0 6.7 30.8 77.7 392.7 -11.0 35.1 70.2 167.4 -14.0
Shree Cement 445.0 1,750.0 17-Nov-05 Buy 1,499.0 236.8 -11.9 44.0 171.3 153.1 -9.0 38.0 47.2 144.5
TFCI 17.1 30.0 25-Jun-07 Buy 23.0 34.2 6.6 -13.6 66.7 15.1 10.2 -17.3 -9.5 11.2

September 2009 Sharekhan ValueGuide6
Pit stop before the next lap
FROM SHAREKHAN’S DESK
fro
m s
ha
rek
ha
n’s
de
sk Some lingering concerns along with certain positive developments kept the market volatile and bound
in a narrow range the whole of last month. After fluctuating throughout the month and traversingnearly 3,000 points the benchmark index, Sensex, remained flattish and ended the month around the15,000 mark. Despite some fresh signs of recovery in both domestic as well as global economy,mainly three factors succeeded in capping the market’s upside during the month and could continue todo so in the weeks ahead.
First and foremost, there is little comfort on the valuation front with the Sensex trading at 16-17x one-year forward earnings even after factoring in the recent earnings upgrades. The current valuation isaround 10-15% higher than the historical average multiple of 15.0-15.5x for the Sensex on one-yearforward earnings estimate. However, the buying interest was quite evident in the mid-cap space due tothe sizeable valuation gap compared with the large-cap companies. Last month, while the Sensex closedflat, the BSE Mid-cap Index and the BSE Small-cap Index surged by 5.6% and 12.7% respectively.
In addition to valuations, the persisting weakness in the monsoon and the growing volatility inequities globally also acted as a drag on the domestic markets. Among the global equity markets, theworst hit has been the Chinese equity market, with the Shanghai Composite Index correcting by over20% in the past few weeks.
On the brighter side, the economic data from the developed countries has seen fresh signs of improvingtrend. For instance, last month manufacturing activity in the USA grew for the first time in 19 months,indicating the world’s largest economy is slowly and steadily moving towards recovery. In Europe,France and Germany, the two biggest economies of the eurozone, have come out of a year-longrecession with a sequential growth of 0.3% each in the second quarter of CY2009.
However, it appears to be a jobless recovery with subdued consumer spending trend, which puts aquestion mark on the sustainability of the improving trend in economic data in the developed markets.Please refer to our Market Outlook report on page 7 for further details.
Furthermore, there are heightened concerns that the Chinese economy might have overheated andthat one of the key engines of global growth could be faltering. The concern related to the Chineseeconomy is clearly reflected in the recent volatility in the commodity prices and the declining trend inthe Baltic Dry Index which shows that the global commodity trade is slowing down again.
Domestically, India reported gross domestic product (GDP) growth of 6.1% in Q1FY2010 as comparedwith an expansion of 5.8% in the previous quarter, indicating acceleration for the first time since theDecember 2007 quarter. The growth was achieved on the back of a strong revival in the industrysector (industrial output grew by 5% in Q1FY2010 vs a 1.8% growth in Q4FY2009). The performancecould have been better but for the weakness in the agricultural and service sectors.
Clearly, the Q1FY2010 GDP growth indicates revival in economic activity. However, the growinglikelihood of a poor kharif crop (due to deficient monsoon rains) will have serious implications for thecontinuation of the accelerating trend in GDP growth. A continued deficient rainfall can also take itstoll on the winter crop (rabi) and consequently have adverse impact on the rural demand that hasbeen a key pillar of consumption demand in the country.
However, as of now, key sectors such as automobiles, cement and telecommunications continue toshow a robust growth trend. For instance, automobile giants such as Maruti Suzuki and Hero HondaMotors reported a year-on-year increase of 41. 6% and 35.9% respectively in the volumes sold inAugust 2009. Moreover, the GDP growth is likely to be aided by the enhanced production of oil &gas (thanks to the commencement of production of oil from Cairn’s Rajasthan fields and the ramp-upof gas production from the Krishna-Godavari D6 block by Reliance Industries) in the coming quarters.
Overall, the mixed economy data and the increasingly erratic foreign fund inflow trend could keepthe market volatile in the days ahead with a negative bias. However, there is a growing consensusamong market participants that any correction or pull-back from the current levels would only bepart of the healthy consolidation process before the next upmove.�

Sharekhan ValueGuide September 20097
Pause and PlayMARKET OUTLOOK SEPTEMBER 04, 2009
� The improving trend in the economic data of many developedcountries and institutional buying interest have aided the mar-kets to hover around the 15,000 mark over the past couple ofmonths, in spite of some distinct negative developments, suchas a weak monsoon and edgy Chinese markets.
� Domestically, the leading indicators (automobile [auto] sales,cement production, freight traffic etc) continue to churn stronggrowth rates. Moreover, the spurt in industrial production andthe reversal in the gross domestic product (GDP) growth trendsreflect a much wider improving trend. The corporate perfor-mance during Q1FY2010 surprised the street on the upside,leading to upwards revision in the consensus earnings estimates—after a gap of four quarters. All these positives in the domesticgrowth story are attracting foreign inflows and August was thefifth consecutive month when foreign inflows in the Indian eq-uity markets were healthy.
� However, the cues from the global equity markets can turnnegative in the near term on the back of growing concerns aboutthe overheating of the Chinese economy, one of the key enginesof global economic recovery. In the developed countries (espe-cially the USA), the high unemployment rate and the subduedretail spending are putting a question mark on the sustainabilityof the economic recovery and the possibility of a “W-shaped”(or double dip) recovery remains alive.
� In addition to the global and domestic issues, there is little com-fort on the valuation front. The Sensex trades at 16.6x one-year forward earnings, which is ~12% premium over its long-term average multiple. The next leg of the upsurge in the Indianmarket would need to be supported by another round of up-grades in the earnings estimates. However, the poor monsooncoupled with the possible hardening of the interest rates on theback of the huge (and now expanded) government borrowingprogramme could potentially delay the earnings upgrade cycle.Consequently, the market would do well to consolidate withina narrow range or even pull back a bit before a likely year-endrally in the last quarter of 2009.
GLOBAL ECONOMY RECOVERS BUT IS RECOVERY
SUSTAINABLE?
US: Economic indicators improve but recovery in
unemployment and retail spending remains subdued
The latest data from the US economy shows improving and en-
couraging trends. Backed by the stimulus programmes, such as
“cash for clunker” (a programme to boost auto sales by offering
subsidies), the manufacturing sector has shown expansion (the ISM
Manufacturing Index has crossed 50) and the Lead Economic In-
dex has turned positive (a comprehensive index of ten key compo-
nents of the US economy).
What’s more important is the fact that the housing sector is finally
seeing some respite. There has been a marked improvement in hous-
ing sales (existing as well as new), as US home buyers are trying to
take advantage of the low housing prices and government spon-
sored stimulus schemes. The improvement in housing demand has
MARKET OUTLOOK
� The existing homes sales in the USA jumped by 7.2% in July 2009 to the highest levelin almost two years. Along these lines, the new home sales jumped by 9.6% monthon month (mom). Though home sales are still declining on a year-on-year (y-o-y)basis, the pace of decline has lessened rapidly recently.
TRENDS IN NEW AND EXISTING HOME SALES HAVE BEEN ENCOURAGING…
- 5 0
- 4 0
- 3 0
- 2 0
- 1 0
0
1 0
2 0
3 0
4 0
Feb
-00
Feb
-01
Feb
-02
Feb
-03
Feb
-04
Feb
-05
Feb
-06
Feb
-07
Feb
-08
Feb
-09
N e w H o m e S a le s % y o y
Ex is t in g H o m e S a le s % y o y
� The S&P Case Shiller House Price Index was down 15.4% year on year (yoy) in June 2009,which indicates a recovery from the ~19% decline in January 2009. On a month-on-month(m-o-m) basis, the June data indicated an increase of 1.4% in the housing prices.
…HELPING ARREST FURTHER DECLINE IN HOUSING PRICES
- 2 5 %
- 2 0 %
- 1 5 %
- 1 0 %
- 5 %
0 %
5 %
1 0 %
1 5 %
2 0 %
Jan-
01
Jul-0
1
Jan-
02
Jul-0
2
Jan-
03
Jul-0
3
Jan-
04
Jul-0
4
Jan-
05
Jul-0
5
Jan-
06
Jul-0
6
Jan-
07
Jul-0
7
Jan-
08
Jul-0
8
Jan-
09
- 4 %
- 3 %
- 2 %
- 1 %
0 %
1 %
2 %
3 %
S & P C a s e S h ille r H o u s in g P r ic e In d e x % Y o Y M o M R H S
� US Leading Indicator Index has improved significantly with a 0.2% growth in July 2009.
� Eurozone Leading Indicators too have registered a smart improvement with a y-o-y decline of 3.6% in July 2009 vs that of 8.6% in February 2009.
US & EUROZONE LEADING INDICATORS CONTINUE TO CLIMB
- 1 0
- 8
- 6
- 4
- 2
0
2
4
6
8
1 0
1994
1996
1998
2000
2002
2004
2006
2008
U S L e a d in g In d ic a to r s y o y Eu r o z o n e L e a d in g In d ic a to r s y o y
� The headline ISM Manufacturing Index rose to 52.9, which is consistent with theexpansion in the manufacturing sector, on the back of gains in new orders (a leadingindicator) and production.
US ISM MANUFACTURING ABOVE THE WATERLINE
helped arrest the acceleration in the decline of the housing prices(refer chart below).
25
30
35
40
45
50
55
60
65
70
75
1990
1991
1992
1993
1994
1995
1996
1997
1998
1999
2000
2001
2002
2003
2004
2005
2006
2007
2008
2009
ISM Manufacturing PMI SA ISM New Orders PMI SA

September 2009 Sharekhan ValueGuide8
The above improvements have started to trickle down to the grossdomestic product (GDP) growth level, as can be seen in the chartbelow. The trends in the developed real economies is a little mixedwith some economies registering a clear improvement while othersreporting a slower pace of decline.
REAL GDP GROWTH IN DEVELOPED NATIONS
-10
-8
-6
-4
-2
0
2
4
6
Mar
-05
Jun-
05
Sep
-05
Dec
-05
Mar
-06
Jun-
06
Sep
-06
Dec
-06
Mar
-07
Jun-
07
Sep
-07
Dec
-07
Mar
-08
Jun-
08
Sep
-08
Dec
-08
Mar
-09
Jun-
09
US Eurozone
UK JapanAustralia
But where are the jobs?
Despite all these improvements in the key variables, the trend in unem-ployment remains unnerving. The fact that the unemployment rateacross economies continues to inch up is one major reason why therecovery might be “W-shaped”. To emerge out of the crisis on a sus-tainable basis, the private consumption/spending has to come to therescue once the effect of the government stimuli starts to wane. Withthe unemployment rate having a strong bearing on consumer spend-ing, the impetus from the private sector may not materialise, therebyweakening the incremental improvement in economic activity.
TREND IN US UNEMPLOYMENT RATE & RETAIL SALES
3
4
5
6
7
8
9
1 0
Nov
-96
Nov
-97
Nov
-98
Nov
-99
Nov
-00
Nov
-01
Nov
-02
Nov
-03
Nov
-04
Nov
-05
Nov
-06
Nov
-07
Nov
-08
- 6
-4
-2
0
2
4
6
8
Un emp loy me n t ra te Re ta il s a les % y oy 3MMA
� The improvement in retail sales during April this year was short-lived as theunemployment rate continued to climb.
� A similar trend had developed after the tech bubble burst when the retail sales hadimproved sharply for three straight months but had fizzled out later as unemploymentrates had continued to climb up.
� The trend in unemployment is not encouraging in case of most of the developednations. In the USA and eurozone the unemployment rate is already hovering at around9.4% and the same is close to 7.8% in the UK followed by 5.8% in China and 5.4% in Japan.
� Importantly, the unemployment trend is not showing any signs of easing yet andmay imply a little longer wait before consumer spending revives.
UNEMPLOYMENT RATE IN DEVELOPED NATIONS
3
5
7
9
1 1
1 3
1 5
Feb
-95
Feb
-96
Feb
-97
Feb
-98
Feb
-99
Feb
-00
Feb
-01
Feb
-02
Feb
-03
Feb
-04
Feb
-05
Feb
-06
Feb
-07
Feb
-08
Feb
-09
0
2
4
6
8
1 0
1 2
U S Eu r o z o n e C h in a U K Ja p a n
China: Overheated and showing signs of faltering
While the world is celebrating the improvement in recent incremen-tal data, trouble seems to be brewing in China, the economy that isleading the world in the ongoing recovery. Though China haschurned out a stupendous double-digit growth rate in industrialproduction, some of its other economic indicators are causing worryamong economists.
The economic recovery in China is driven by an unprecedentedincrease in bank credit and public sector investments in infrastruc-ture. The huge liquidity infusion is already creating bubbles in Chinawith the real estate prices soaring above the levels prevailing in thepre-Lehman collapse days. The continued declining trend in theBaltic Dry Index also indicates that the commodity trade is slowingdown globally and the Chinese thrust on infrastructure investmentscould be losing steam.
� The cumulative assets of the Chinese banks are growing rapidly (up 27.7% yoy inQ2CY2009)—the growth rate is higher than that seen prior to the crisis. The recordlending has led to fears of overcapacity in many industries (steel, cement etc) withthe government curbing incremental lending to certain industries.
BANK ASSETS HAVE GROWN AT FAST PACE…
81012141618202224262830
Dec
-05
Mar
-06
Jun-
06
Sep
-06
Dec
-06
Mar
-07
Jun-
07
Sep
-07
Dec
-07
Mar
-08
Jun-
08
Sep
-08
Dec
-08
Mar
-09
Jun-
09
0
10000
20000
30000
40000
50000
60000
70000
80000Bank A ssets
Bank A ssets % yoy
� The trend in retail sales as well as exports remains weak. This indicates that moneyis surely not going to domestic consumers or export manufacturers.
…DESPITE WEAKNESS IN RETAIL SALES & EXPORTS…
8
10
12
14
16
18
20
22
24
Oct
-05
Dec
-05
Feb
-06
Apr
-06
Jun-
06
Aug
-06
Oct
-06
Dec
-06
Feb
-07
Apr
-07
Jun-
07
Aug
-07
Oct
-07
Dec
-07
Feb
-08
Apr
-08
Jun-
08
Aug
-08
Oct
-08
Dec
-08
Feb
-09
Apr
-09
Jun-
09
-40
-30
-20
-10
0
10
20
30
40
50
60
Reta il s a les % y oy Ex por ts % y oy
� A weakening Baltic Dry Index further corroborates the feebleness in global tradeand adds credibility to the argument that the recent recovery in the Baltic Dry Indexwas more a result of inventory restocking than any improvement in consumerspending/consumption.
…AND WEAKNESS IN BALTIC DRY INDEX…
0
2000
4000
6000
8000
10000
12000
Sep
-05
Nov
-05
Jan-
06
Mar
-06
May
-06
Jul-0
6
Sep
-06
Nov
-06
Jan-
07
Mar
-07
May
-07
Jul-0
7
Sep
-07
Nov
-07
Jan-
08
Mar
-08
May
-08
Jul-0
8
Sep
-08
Nov
-08
Jan-
09
Mar
-09
May
-09
Jul-0
9
MARKET OUTLOOK

Sharekhan ValueGuide September 20099
� The property prices have surged at a stupendous rate. The above chart plots m-o-m change in housing prices. Clearly, the m-o-m growth rate is pretty close to thelevels seen prior to the Lehman debacle and may mean speculative demand.
…IMPLYING SPECULATIVE USE OF MONEY
- 1 .0
- 0 .5
0 .0
0 .5
1 .0
1 .5
2 .0
Oct
-05
Dec
-05
Feb
-06
Apr
-06
Jun-
06
Aug
-06
Oct
-06
Dec
-06
Feb
-07
Apr
-07
Jun-
07
Aug
-07
Oct
-07
Dec
-07
Feb
-08
Apr
-08
Jun-
08
Aug
-08
Oct
-08
Dec
-08
Feb
-09
Apr
-09
Jun-
09
N D R C Pr o p e r ty Pr ic e In d e x % M o M
DOMESTIC ECONOMY: IMPROVING TREND BUT DEFICIENT
MONSOON RAINS A THREAT
The Indian economy has shown some distinct signs of improve-
ment in the past few months with very encouraging trends in some
of the leading indicators. In fact, the improvement in certain sec-
tions of the economy has become more widespread than in recent
months, as evidenced by the better industrial production growth
and the uptick in GDP growth.
But again, the recovery still lacks the support of some of the major
indicators (exports, credit offtake etc). Amidst the ongoing recovery
process, corporate performance surprised us on the upside, driven
largely by aggressive cost-cutting measures and a decline in the cost of
raw materials. Of course, all these factors have manifested themselves
in the form of the performance of the equity market, a general return
of risk appetite among investors, the return of the foreign institu-
tional investors (FIIs) etc. However, the deficit monsoon rainfall threat-
ens to derail the acceleration in the GDP growth rate.
Leading indicators going strong
The leading indicators (such as commercial vehicle [CV] sales, goods
traffic, cement production etc) have seen a strong revival in growth
rates, which provides further evidence of the Indian economy’s re-
silience and ability to bounce back quickly.
� CV sales have witnessed an impressive recovery.
� After a steep decline of 58.2% in December 2008, CV sales registered a growth of5.1% in July 2009.
TREND IN CV SALES
-70000
-50000
-30000
-10000
10000
30000
50000
70000
Jul-0
6
Sep
-06
Nov
-06
Jan-
07
Mar
-07
May
-07
Jul-0
7
Sep
-07
Nov
-07
Jan-
08
Mar
-08
May
-08
Jul-0
8
Sep
-08
Nov
-08
Jan-
09
Mar
-09
May
-09
Jul-0
9
-60%
-40%
-20%
0%
20%
40%
60%
Comm Vehicles % yoy
� The trend in goods traffic (rail and port) had remained largely stable during December2008-May 2009. In June 2009, goods traffic for both the modes saw a significantimprovement (refer chart above), indicating improving economic activity.
TREND IN GOODS TRAFFIC
- 1 0 %
- 5 %
0 %
5 %
1 0 %
1 5 %
2 0 %
Jul-0
7
Sep
-07
Nov
-07
Jan-
08
Mar
-08
May
-08
Jul-0
8
Sep
-08
Nov
-08
Jan-
09
Mar
-09
May
-09
R a ilw a y g o o d s t r a f f ic 3 M M A % y o y
P o r t t r a f f ic 3 M M A % y o y
� The trend in both cement production and dispatches has remained strong since
November 2008, buoyed by the acceleration in government spending on
infrastructure projects and an unexpectedly resilient rural demand.
TREND IN CEMENT PRODUCTION
0
2000
4000
6000
8000
10000
12000
14000
16000
18000
20000
Jul-0
6
Sep
-06
Nov
-06
Jan-
07
Mar
-07
May
-07
Jul-0
7
Sep
-07
Nov
-07
Jan-
08
Mar
-08
May
-08
Jul-0
8
Sep
-08
Nov
-08
Jan-
09
Mar
-09
May
-09
- 1%
1%
3%
5%
7%
9%
11%
13%
15%
17%
19%Cement Produc tion % y oy
Positive surprise in Q1FY2010…
The Q1FY2010 earnings growth was ahead of expectations largelyon the back of a pleasant surprise in terms of a healthy marginexpansion and a lower interest rate burden. The net sales growthfor the Sensex companies (ex-oil companies) remained flat owing toweaker corporate and individual demand coupled with lowerrealisations, and the performance was largely in line with our ex-pectations. However, the cumulative operating profit margin (OPM)for the Sensex companies (ex-oil) improved by 60 basis points yoyand by 130 basis points quarter on quarter (qoq), resulting in a2.9% growth in the operating profit as against the street’s expecta-tions of a close to double-digit decline. The margin expansion wasdriven by a lower raw material cost, a stronger rupee (and change inaccounting norms related to AS-11) and the benefits of costrationalisation undertaken by companies. Consequently, the de-cline in the bottom line of the Sensex companies (ex-oil) was con-tained at 1.1% yoy vs our estimate of a 4.9% drop.
TREND IN SENSEX (EX-OIL) EARNINGS GROWTH VS EXPECTATIONS
-20%
-10%
0%
10%
20%
30%
40%
50%
Q3F
Y05
Q4F
Y05
Q1F
Y06
Q2F
Y06
Q3F
Y06
Q4F
Y06
Q1F
Y07
Q2F
Y07
Q3F
Y07
Q4F
Y07
Q1F
Y08
Q2F
Y08
Q3F
Y08
Q4F
Y08
Q1F
Y09
Q2F
Y09
Q3F
Y09
Q4F
Y09
Q1F
Y10
Expected Adjusted PAT
MARKET OUTLOOK

September 2009 Sharekhan ValueGuide10
SECTOR-WISE EBITDA MARGIN (CHANGE YOY)
-2100 -1600 -1100 -600 -100 400
Pharma
Real estate
Metal
Telecom
Capital goods
IT
Power
FMCG
Auto
Diversified
Cement
Sizeable earnings revision after Q1 results
The consensus earnings estimate for the Sensex has been raised by2.1% for FY2010 and by 3.7% for FY2011 since the start of theQ1FY2010 earnings season. The latest consensus estimate indi-cates a 19.8% y-o-y growth in the earnings per share (EPS) forFY2011, which is much better than the 13.3% y-o-y growth esti-mated at the beginning of the current fiscal. The upward revision inthe earnings estimate has been largely driven by auto, cement, infor-mation technology (IT) services and banking stocks. On the otherhand, there has been a downgrade in the earnings estimates forReliance Industries and certain pharmaceutical stocks.
TREND IN EARNINGS REVISIONS FOR SENSEX COMPANIES
800
850
900
950
1000
1050
1100
1150
1200
1250
1300
Apr
-08
May
-08
Jun-
08
Jul-
08
Aug
-08
Sep
-08
Oct
-08
Nov
-08
Dec
-08
Jan-
09
Feb
-09
Mar
-09
Apr
-09
May
-09
Jun-
09
Jul-
09
Aug
-09
FY 2010E Consensus EPS
FY 2011E Consensus EPS 13.3%
19.8%
Similar trends at wider level as well…
The earnings performance during Q1FY2010 was even better at awider level. We have analysed below the key trends in the BSE 200companies at an aggregate level. As evident, the reported profit forthe BSE 200 companies grew by 20.1% yoy. The growth was impres-sive considering that the net sales were largely flat on a y-o-y basis.The profitability was primarily driven by a sharp drop in the cost ofthe raw materials consumed (down 19.5% yoy), which was the pri-mary reason behind the 8.2% y-o-y expansion in the earnings beforeinterest, tax, depreciation and amortisation (EBITDA) margin forthe universe. Besides, the pace of growth in employee expenses as wellas the sells & administrative cost has cooled off significantly in re-sponse to the smart cost-saving initiatives adopted by India Inc.
PROFITABILITY HAS IMPROVED QOQ FOR BSE 200 COMPANIES…
0%
2%
4%
6%
8%
10%
12%
14%
16%
Mar
-01
Sep
-01
Mar
-02
Sep
-02
Mar
-03
Sep
-03
Mar
-04
Sep
-04
Mar
-05
Sep
-05
Mar
-06
Sep
-06
Mar
-07
Sep
-07
Mar
-08
Sep
-08
Mar
-09
-40%
-20%
0%
20%
40%
60%
80%
Reported PA T Margin
Reported PA T % y oy RHS
…DESPITE FLATTISH SALES (AMOUNT)…
0
100
200
300
400
500
600
700
Mar
-01
Sep
-01
Mar
-02
Sep
-02
Mar
-03
Sep
-03
Mar
-04
Sep
-04
Mar
-05
Sep
-05
Mar
-06
Sep
-06
Mar
-07
Sep
-07
Mar
-08
Sep
-08
Mar
-09
Tho
usan
d cr
ore
(Rs)
-20%
-10%
0%
10%
20%
30%
40%
50%
Net Sales % yoy
…AS COST OF RAW MATERIALS HAVE DROPPED
-30%
-20%
-10%
0%
10%
20%
30%
40%
50%
60%
70%
Mar
-01
Sep
-01
Mar
-02
Sep
-02
Mar
-03
Sep
-03
Mar
-04
Sep
-04
Mar
-05
Sep
-05
Mar
-06
Sep
-06
Mar
-07
Sep
-07
Mar
-08
Sep
-08
Mar
-09
Raw Material Consumed % yoy
GDP growth too has revived, though agri remains wildcard
The GDP for the March-June 2009 quarter came in at Rs830,555
crore, up 6.1% yoy. This is better than the 5.8% y-o-y growth seen
during the previous quarter, though lower than the 7.8% rate a
year ago. The growth in the GDP for the quarter was achieved on
the back of a strong revival in the industry sector (5% in Q1FY2010
vs 1.8% in Q4FY2009). However, this was partially mitigated by
the weakness in the agricultural and service sectors during the same
period. Clearly, the Q1FY2010 GDP growth indicates a revival in
economic activity. However, the growing likelihood of a poor kharif
crop will have serious implications for the continuation of the accel-
erating trend in the GDP growth.
TREND IN REAL GDP GROWTH
8.1%
7.1%
5.5%
9.1% 9.5% 10
.4%
9.7% 10
.2%
9.4%
9.0%
7.7%
5.8% 6.1%
8.3%
9.0% 9.
1% 9.8%
9.2%
9.3%
8.6%
7.8%
5.8%
0%
2%
4%
6%
8%
10%
12%
Mar
-04
Jun-
04
Sep
-04
Dec
-04
Mar
-05
Jun-
05
Sep
-05
Dec
-05
Mar
-06
Jun-
06
Sep
-06
Dec
-06
Mar
-07
Jun-
07
Sep
-07
Dec
-07
Mar
-08
Jun-
08
Sep
-08
Dec
-08
Mar
-09
Jun-
09
Real GDP % yoy
MARKET OUTLOOK

Sharekhan ValueGuide September 200911
TREND IN GROWTH OF GDP COMPONENTS
-6%
-4%
-2%
0%
2%
4%
6%
8%
10%
12%
14%
Mar
-04
Jun-
04
Sep
-04
Dec
-04
Mar
-05
Jun-
05
Sep
-05
Dec
-05
Mar
-06
Jun-
06
Sep
-06
Dec
-06
Mar
-07
Jun-
07
Sep
-07
Dec
-07
Mar
-08
Jun-
08
Sep
-08
Dec
-08
Mar
-09
Jun-
09
Agriculture Industry Services
Investors’ risk appetite has returned
In light of the resilience displayed by the Indian economy and the
improvement in some of the key macro variables, the risk appetite
of global and domestic investors has returned to an extent. A case
in point is the surge in the qualified institutional placements (QIPs)
and private placements in recent months, especially in the real estate
sector. Moreover, the reception received by the recent initial public
offerings (IPOs)/rights issues indicates a general anticipation of bet-
ter times ahead. In line, the FII inflows have returned after signifi-
cant exits in 2008. In fact, about 62% of the FII outflows during
2008 has already returned in 2009 (till date).
TREND IN CAPITAL RAISING
0
5000
10000
15000
20000
25000
30000
35000
40000
Aug
-06
Oct
-06
Dec
-06
Feb
-07
Apr
-07
Jun-
07
Aug
-07
Oct
-07
Dec
-07
Feb
-08
Apr
-08
Jun-
08
Aug
-08
Oct
-08
Dec
-08
Feb
-09
Apr
-09
Jun-
09
Rs
cror
e
Overseas primary
Pvt placement
Domestic (IPOs, Rights)
TREND IN FII FLOWS
-15
-10
-5
0
5
10
15
20
CY
1999
CY
2000
CY
2001
CY
2002
CY
2003
CY
2004
CY
2005
CY
2006
CY
2007
CY
2008
CY
2009
YT
D
Jan-
09
Feb
-09
Mar
-09
Apr
-09
May
-09
Jun-
09
Jul-0
9
Aug
-09
sands
FII Flow s (US$ Mn)
RISKS
Monsoon
� Worst monsoon in at least 40 years: Cumulative rains for theperiod June 01-August 26, 2009 came in at 514.30mm, 25%lower than the long period average of 682mm. At 25% deficit,the current monsoon season is the worst at least in the last 40years. While kharif sowing (till August 28, 2009) is only 8%lower than that in the corresponding period of the last year, thekharif agri production is likely to fall short by 15-20%. Theshortfall in kharif production has again stocked fears of a surgein the already high food prices. Importantly, the anticipated dipin agriculture production threatens the key aspect of Indianeconomy’s resilience, the rural demand.
� Impact on rural demand may be limited: In view of the deficientmonsoon and the fact that 278 of India’s 626 districts have beendeclared drought prone, the street is churning out varied estimatesas to the impact of a drought on the economy. While droughtshave had a strong impact on rural demand in the past, there arecertain aspects that may lessen the impact this time round.
� The share of kharif production in total agri output hascome down to ~53% from ~65% in 1970.
� The net irrigated area under cultivation has increased to19.7% in 2006 from ~10% in 1970.
� Support prices of key crops have risen by 50-60% over thepast five years, which puts more money in the hands of therural populace.
� The share of non-farm output (diary, fishing etc) in agricul-ture is high at 34%, which should be relatively more resilient.
� The government plans to increase the number of days ofguaranteed employment from 100 days currently for thedrought prone areas under the National Rural Employ-ment Guarantee Scheme.
Inflation: Upturn ahead…
Despite the risks arising from a weaker monsoon and the increas-ing likelihood of food prices remaining firm, the inflation rate (asindicated by the Wholesale Price Index [WPI]) is likely to remain innegative territory through September 2009. However, after thatthe inflation rate may rise sharply as the high base effect starts towear off. We present below three possible trajectories for inflationover the remaining part of the current fiscal. In the worst case sce-nario, we expect inflation to reach 6.8% by March 2010 based onfirmer prices of agri-commodities and fuels. Meanwhile, our basecase—factoring in a normal monsoon and stable fuel prices—indi-cates an inflation rate of 5.2%.
TREND IN INFLATION RATE (WPI)
6.8%
5.2%
-4%
-2%
0%
2%
4%
6%
8%
10%
12%
14%
Jul-0
6
Sep
-06
Nov
-06
Jan-
07
Mar
-07
May
-07
Jul-0
7
Sep
-07
Nov
-07
Jan-
08
Mar
-08
May
-08
Jul-0
8
Sep
-08
Nov
-08
Jan-
09
Mar
-09
May
-09
Jul-0
9
Sep
-09
Nov
-09
Jan-
10
Mar
-10
High base ef fect w ill start w earing of f from Oct 2009
MARKET OUTLOOK

September 2009 Sharekhan ValueGuide12
…ditto for interest rates
Given our view on the likely trajectory for inflation (the WPI), and
the uptick in real GDP growth and industrial production growth,
we believe that the central bank would consider hiking policy rates
towards the end of the current fiscal or the beginning of the next
fiscal. Already, the Reserve Bank of India has taken a breather by
keeping borrowing costs unchanged in its last monetary policy state-
ment announced on July 28, 2009, thereby signaling an end to its
deepest round of interest rate cuts.
OUTLOOK
In addition to the global and domestic issues, there is little comfort
on the valuation front. The Sensex trades at 16.6x one-year for-
ward earnings, which is ~12% premium over its long-term average
multiple. The next leg of the upsurge in the Indian market would
need to be supported by another round of upgrades in the earnings
estimates. However, the poor monsoon coupled with the possible
hardening of the interest rates on the back of the huge (and now
expanded) government borrowing programme could potentially
delay the earnings upgrade cycle. Consequently, the market would
do well to consolidate within a narrow range or even pull back a bit
before a likely year-end rally in the last quarter of 2009.�
TREND IN SENSEX ONE-YEAR FORWARD PE
5
10
15
20
25
30
Aug
-95
Aug
-96
Aug
-97
Aug
-98
Aug
-99
Aug
-00
Aug
-01
Aug
-02
Aug
-03
Aug
-04
Aug
-05
Aug
-06
Aug
-07
Aug
-08
Aug
-09
VALUATION MATRIX
Mexico
UK
Taiw anIndia
US
Germany
S Korea
Russia
Thailand
Brazil
PhillpIndonesia
MalaysiaSingp
6
7
8
9
10
11
12
13
14
15
16
0% 10% 20% 30% 40% 50% 60%
Consensus EPS grow th
Mul
tiple
The author doesn’t hold any investment in any of the companies mentioned in the article.
MARKET OUTLOOK

Sharekhan ValueGuide September 200913
Sharekhan top picksSHAREKHAN TOP PICKS
With the late upsurge on September 4, 2009, the benchmark indices,
the Sensex and the Nifty, managed to report marginal gains of
1.1% and 2.1% respectively since our last ValueGuide issue dated
August 6, 2009. Throughout the month the markets remained in a
narrow range. Our basket of stocks performed in line with the
market, delivering a 2.1% return during the month. Amongst our
picks, Godrej Consumer Products continued its smart upmove and
gained 9.8% while our new addition last month, Emco, too delivered
handsome returns of 8.8% during the month.
* CMP as on September 04, 2009
SHAREKHAN TOP PICKS
NAME CMP* PER ROE (%) TARGET UPSIDE
(RS) FY09 FY10E FY11E FY09 FY10E FY11E PRICE (%)
Apollo Tyres 43 20.4 6.6 6.1 7.9 19.9 17.9 53 23.5
Bajaj Holdings 472 21.7 - - - - - 810 71.6
Bharti Airtel 405 18.2 15.3 13.4 26.2 23.8 21.3 453 11.9
BHEL 2,212 34.5 24.4 18.9 23.8 26.6 27.0 2,335 5.6
Emco 91 10.1 8.3 7.1 13.3 13.5 14.3 115 26.0
Godrej Consumer 237 35.4 25.0 22.0 46.9 38.8 36.1 240 1.2
IDBI Bank 107 9.0 7.2 5.7 12.1 13.2 14.5 169 58.7
IPCA Labs 700 17.4 9.9 8.2 15.2 24.6 25.3 770 10.0
ITC 233 27.1 22.9 19.8 25.3 25.8 25.1 248 6.3
Reliance Industries 1,981 20.0 16.6 12.9 13.2 14.5 15.8 2,020 2.0
NAME CMP PER ROE (%) TARGET UPSIDE
(RS) FY09 FY10E FY11E FY09 FY10E FY11E PRICE (%)
APOLLO TYRES 43 20.4 6.6 6.1 7.9 19.9 17.9 53 23.5
Remarks: � Apollo Tyres Ltd (APL) is the market leader in truck & bus tyres and light truck tyres in India. The company also enjoys significant market share in the passengercar tyre segment. While the improving demand in replacement and OEM markets augurs well for the top line growth, much lower rubber prices will help APLpost 3x jump in the net profit in FY2010 from domestic operations.
� To improve its market share and expand further the company is increasing its capacity in India from 850 tonne per day to around 1,000 tonne per day byestablishing a new greenfield plant in Chennai. In international markets APL has presence in South Africa, and to further augment its international presencethe company has recently acquired Vredestein Banden BV, a high-end passenger car tyre manufacturer in Netherlands. We believe the above organic andinorganic expansions coupled with improving business environment in the domestic market would help the company post strong growth in the coming years.
� We believe the key risks for APL lie in any sharp upward movement in rubber prices and crude derivatives used as inputs. Also, the near-term performance ofthe recently acquired European business is susceptible to difficult business environment in these markets.
� At the current market price the stock trades at 6.6x and 6.1x (its stand-alone) FY2010E and FY2011E earnings respectively. We maintain our Buyrecommendation on the stock.
For September 2009, we are making two changes in the portfolio.We are replacing Balrampur Chinni Mills and Lupin with IDBIBank and Ipca Laboratories. Balrampur Chinni Mills couldunderperform in the near term due to the expected governmentintervention to control sugar prices. On the other hand, IDBI Bankcould get re-rated on the back of capital infusion by the government,as media reports suggest that the World Bank has approved theproposed loan for re-capitalisation of certain public sector banksin India. Our second pick, Ipca Laboratories, is a tactical switchfrom Lupin within the pharmaceutical space.�
BAJAJ HOLDINGS 472 21.7 - - - - - 810 71.6
Remarks: � Bajaj Holdings & Investments Ltd (BHIL) was created by de-merging Bajaj Auto and the company primarily functions in investment space. The company isalso on a lookout for new business opportunities.
� BHIL holds Rahul Bajaj Group’s strategic investments in Bajaj Auto, Bajaj Finserv, Bajaj Auto Holdings and Maharashtra Scooters. It also looks into otherinvestments in equity markets and government securities, bonds, debentures and mutual funds.
� We value BHIL based on our price target for Bajaj Auto, Bajaj Finserv and other investments at market value and give the holding company a discount of 50%for the same. Moreover, we add the value of its cash and liquid investments, which gives us a fair value of Rs810 for the stock, which is substantially aboveits current market price of Rs471.
� Further, zero-debt status of the company makes the stock attractive. We therefore maintain Buy recommendation on the stock.
September 2009 Sharekhan ValueGuide14
NAME CMP PER ROE (%) TARGET UPSIDE
(RS) FY09 FY10E FY11E FY09 FY10E FY11E PRICE (%)
SHAREKHAN TOP PICKS
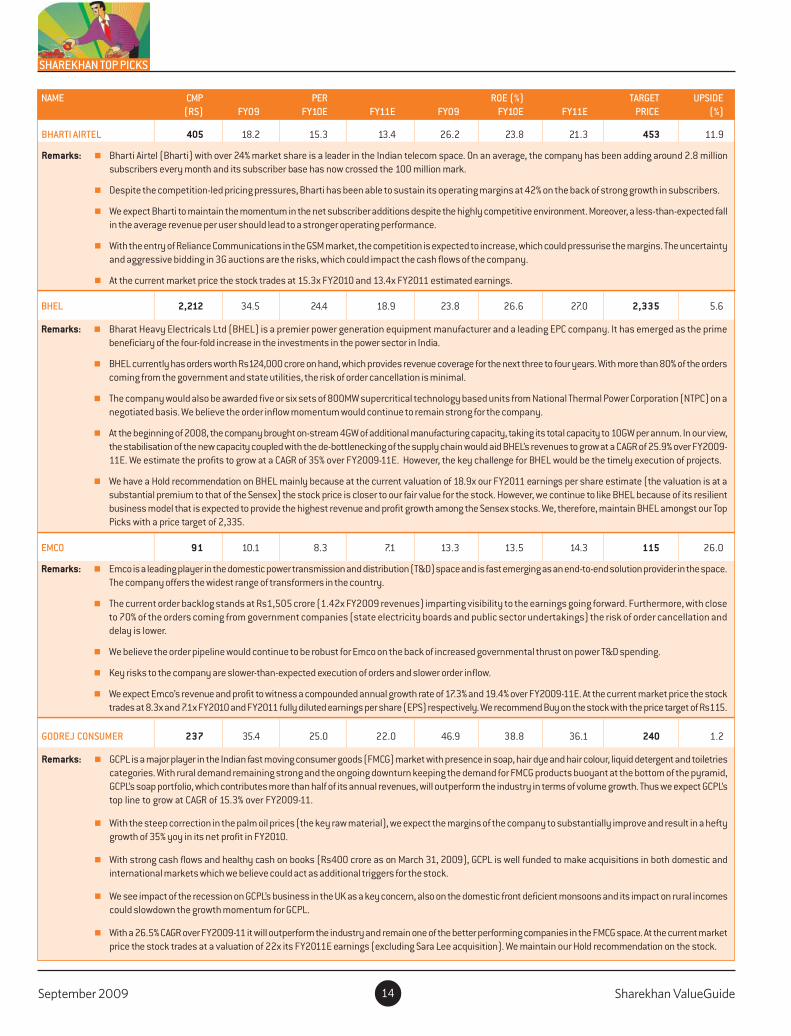
BHARTI AIRTEL 405 18.2 15.3 13.4 26.2 23.8 21.3 453 11.9
Remarks: � Bharti Airtel (Bharti) with over 24% market share is a leader in the Indian telecom space. On an average, the company has been adding around 2.8 millionsubscribers every month and its subscriber base has now crossed the 100 million mark.
� Despite the competition-led pricing pressures, Bharti has been able to sustain its operating margins at 42% on the back of strong growth in subscribers.
� We expect Bharti to maintain the momentum in the net subscriber additions despite the highly competitive environment. Moreover, a less-than-expected fallin the average revenue per user should lead to a stronger operating performance.
� With the entry of Reliance Communications in the GSM market, the competition is expected to increase, which could pressurise the margins. The uncertaintyand aggressive bidding in 3G auctions are the risks, which could impact the cash flows of the company.
� At the current market price the stock trades at 15.3x FY2010 and 13.4x FY2011 estimated earnings.
BHEL 2,212 34.5 24.4 18.9 23.8 26.6 27.0 2,335 5.6
Remarks: � Bharat Heavy Electricals Ltd (BHEL) is a premier power generation equipment manufacturer and a leading EPC company. It has emerged as the primebeneficiary of the four-fold increase in the investments in the power sector in India.
� BHEL currently has orders worth Rs124,000 crore on hand, which provides revenue coverage for the next three to four years. With more than 80% of the orderscoming from the government and state utilities, the risk of order cancellation is minimal.
� The company would also be awarded five or six sets of 800MW supercritical technology based units from National Thermal Power Corporation (NTPC) on anegotiated basis. We believe the order inflow momentum would continue to remain strong for the company.
� At the beginning of 2008, the company brought on-stream 4GW of additional manufacturing capacity, taking its total capacity to 10GW per annum. In our view,the stabilisation of the new capacity coupled with the de-bottlenecking of the supply chain would aid BHEL’s revenues to grow at a CAGR of 25.9% over FY2009-11E. We estimate the profits to grow at a CAGR of 35% over FY2009-11E. However, the key challenge for BHEL would be the timely execution of projects.
� We have a Hold recommendation on BHEL mainly because at the current valuation of 18.9x our FY2011 earnings per share estimate (the valuation is at asubstantial premium to that of the Sensex) the stock price is closer to our fair value for the stock. However, we continue to like BHEL because of its resilientbusiness model that is expected to provide the highest revenue and profit growth among the Sensex stocks. We, therefore, maintain BHEL amongst our TopPicks with a price target of 2,335.
EMCO 91 10.1 8.3 7.1 13.3 13.5 14.3 115 26.0
Remarks: � Emco is a leading player in the domestic power transmission and distribution (T&D) space and is fast emerging as an end-to-end solution provider in the space.The company offers the widest range of transformers in the country.
� The current order backlog stands at Rs1,505 crore (1.42x FY2009 revenues) imparting visibility to the earnings going forward. Furthermore, with closeto 70% of the orders coming from government companies (state electricity boards and public sector undertakings) the risk of order cancellation anddelay is lower.
� We believe the order pipeline would continue to be robust for Emco on the back of increased governmental thrust on power T&D spending.
� Key risks to the company are slower-than-expected execution of orders and slower order inflow.
� We expect Emco’s revenue and profit to witness a compounded annual growth rate of 17.3% and 19.4% over FY2009-11E. At the current market price the stocktrades at 8.3x and 7.1x FY2010 and FY2011 fully diluted earnings per share (EPS) respectively. We recommend Buy on the stock with the price target of Rs115.
GODREJ CONSUMER 237 35.4 25.0 22.0 46.9 38.8 36.1 240 1.2
Remarks: � GCPL is a major player in the Indian fast moving consumer goods (FMCG) market with presence in soap, hair dye and hair colour, liquid detergent and toiletriescategories. With rural demand remaining strong and the ongoing downturn keeping the demand for FMCG products buoyant at the bottom of the pyramid,GCPL’s soap portfolio, which contributes more than half of its annual revenues, will outperform the industry in terms of volume growth. Thus we expect GCPL’stop line to grow at CAGR of 15.3% over FY2009-11.
� With the steep correction in the palm oil prices (the key raw material), we expect the margins of the company to substantially improve and result in a heftygrowth of 35% yoy in its net profit in FY2010.
� With strong cash flows and healthy cash on books (Rs400 crore as on March 31, 2009), GCPL is well funded to make acquisitions in both domestic andinternational markets which we believe could act as additional triggers for the stock.
� We see impact of the recession on GCPL’s business in the UK as a key concern, also on the domestic front deficient monsoons and its impact on rural incomescould slowdown the growth momentum for GCPL.
� With a 26.5% CAGR over FY2009-11 it will outperform the industry and remain one of the better performing companies in the FMCG space. At the current marketprice the stock trades at a valuation of 22x its FY2011E earnings (excluding Sara Lee acquisition). We maintain our Hold recommendation on the stock.

Sharekhan ValueGuide September 200915
NAME CMP PER ROE (%) TARGET UPSIDE
(RS) FY09 FY10E FY11E FY09 FY10E FY11E PRICE (%)
SHAREKHAN TOP PICKS
RELIANCE INDUSTRIES 1,981 20.0 16.6 12.9 13.2 14.5 15.8 2,020 2.0
Remarks: � With the start of commercial production of gas in April 2009 and that of crude oil in September 2008 (both from KG basin), Reliance Industries Ltd (RIL) holdsa great promise in the E&P business. The E&P business is expected to add significantly to the company’s earnings and cash flow from FY2010 onwards withmajority of the earnings coming from the less volatile natural gas business. The gas production will begin in small tranches initially and is expected to80mmscmd by the end of 2009. At present, the company’s reserves are estimated at 9 billion barrels of oil equivalents.
� We expect the gross refining margin (GRM) of RIL to contract in the near to medium term, as new refineries with total capacity of 1.5-2.0 million barrel perday (including Reliance Petroleum Ltd [RPL]) are expected to come on-stream in 2009 in the environment of weak demand. However, we expect RIL to fetcha premium over Singapore Complex’ GRM due to its superior refinery complexity. The refining volumes would also double as RPL’s refinery became operationalon December 25, 2008.
� We believe that RIL would be bale to maintain superior margin in the petrochemical business given its increased focus on the domestic market (strongdemand and high price realisation environment).
� A delay in the ramp-up of KG D-6 gas production and an adverse verdict of the Supreme Court of India on its legal feud with RNRL and another legal case withNTPC are the key risks to our estimates. Furthermore, there is still ambiguity related to the likely change in the section 80IB, which could take away the benefitof the seven-year tax holiday from the gas production. Any further fall in the refining and petrochemical margins could result in deviation from our estimates.
� At the current market price, the stock is trading at 12.9x FY2011E consolidated earnings.
ITC 233 27.1 22.9 19.8 25.3 25.8 25.1 248 6.3
Remarks: � ITC’s cigarette business that has dominance in the category continues to be a cash cow for the company. ITC has chalked out an aggressive roadmap formaking a mark in the Indian FMCG market with successful brands such as Bingo, Sunfeast and Aashirwaad already in the reckoning among the best in theindustry. The company has further ventured into the personal care category with the launch of Superia and Fiama Di Wills soaps and shampoos that wouldcompete with the likes of products from HUL and Procter & Gamble.
� After a sharp increase in the excise duty on cigarettes in the last two union budgets, the government was less lethal in the FY2009-10 union budget and didnot increase the excise duty. This augurs well for ITC’s cigarette business. Further, the sharp correction in the raw material prices, rationalisation of thecompany’s biscuit portfolio and an increase in the scale of its personal care business would lower the losses in the non-cigarette FMCG business in FY2010.
� An increase in taxation and the government’s intentions to curb consumption of tobacco products remain the key risks to ITC’s cigarette business over thelonger term.
� We expect ITC’s top line to grow at a CAGR of 13.6% and its bottom line to grow at a CAGR of 16.9% over FY2009-11. At the current market price, ITC trades at19.8x its FY2011E earnings. We maintain our Hold recommendation on the stock.
IPCA 700 17.4 9.9 8.2 15.2 24.6 25.3 770 10.0
Remarks: � With a strong presence in the branded segments in the semi-regulated markets, a significant scale-up expected in its US generic business and strongmomentum in its retail domestic formulation business, Ipca is a strong play on the global pharmaceutical opportunity.
� Driven by steady new launches, a strong therapy-focused field force and good brand building abilities, Ipca’s domestic formulation business has been growingat above industry growth rates. We expect Ipca's domestic formulation business to grow at 18% CAGR over FY2009-11.
� Africa and Russia would be the key growth drivers of exports on the back of the previous year’s low base and a substantial increase in product offerings. Thecontinued growth in exports at 13.5% CAGR over FY2005-09 and the expansion of margins are indicative of the underlying momentum in the overseas salesand reinforce our confidence in Ipca’s export competitiveness.
� Over the past few years Ipca has steadily invested in building its sales network across the world and in developing APIs at the lowest cost. We believe Ipcais now set to reap the benefits of its investments and strong API capabilities to participate aggressively in the global generic opportunity.
� With the Indore SEZ ready be commissioned, we believe the company is through with its major expansion plans and would sweat its assets going forward,thereby improving the cash flow.
� With a strong growth in the branded portfolio and a low-cost operating structure, we expect Ipca’s margins to remain on the up trend. At 9.9x FY2010E and 8.2xFY2011E earnings, the stock’s valuations seem absolutely compelling when viewed in context of the strong growth potential that awaits the company.
IDBI BANK 107 9.0 7.2 5.7 12.1 13.2 14.5 169 58.7
Remarks: � IDBI Bank, the eighth largest bank in India, is all set to improve its core performance with margin improvement already underway. The current environmentis quite conducive for the bank’s efforts to improve its net interest margin (NIM) further, as wholesale borrowing costs have come off significantly.
� Capital infusion by the government is on cards and would be a major catalyst in helping the bank improve its core banking operations. Already, the World Bankboard has approved the loan to the government of India, which is aimed at recapitalisation of some of the banks. Final approval on the same is expected inmid September 2009.
� We expect the bank’s return on equity (RoE; excluding revaluation reserves) to increase from 12.1% in FY2009 to 13.8% in FY2010 and to ~14% in FY2011 drivenby improved core performance. Considering this along with the value of the bank’s enviable investment portfolio, at the current valuation (of 1.0x FY2011Eadjusted book value) the bank is trading at attractive valuations.

September 2009 Sharekhan ValueGuide16
Allied Digital Services 17
Phillips Carbon Black 20
United Phosphorus 23
StockIdeas

Sharekhan ValueGuide September 200917
Riding high on RIMSCOMPANY DETAILS
Price target: Rs532
Market cap: Rs687 cr
52-week high/low: Rs794/146
NSE volume (No of shares): 30,394
BSE code: 532875
NSE code: ADSL
Sharekhan code: ADSL
Free float (No of shares): 1.0 cr
PRICE CHART
SHAREHOLDING PATTERN
(%) 1 m 3 m 6 m 12m
Absolute 32.2 27.9 34.5 -50.8
Relative 13.2 -5.3 -20.3 -52.7
to Sensex
PRICE PERFORMANCE
EMERGING STAR BUY; CMP: RS379 AUGUST 14, 2009ALLIED DIGITAL SERVICES
KEY POINTS� Well positioned in a fast growing niche segment: Allied Digital Services Ltd
(ADSL) is a leading player in the fast growing and niche segment of outsourcedremote infrastructure management services (RIMS). According to a McKinsey-Nasscom report, the outsourcing of IMS to India is expected to grow at aCAGR of over 30% to USD13-15 billion by 2013. The growth would bedriven by cost rationalisation, telecom and technology advancement, and in-creasing complexities of IT systems.
� En Pointe acquisition improves geographical reach: ADSL acquired an 80.5%stake in US-based En Pointe Global Solution Ltd (EGSL) at an equity valuationof ~USD24 million (total equity valuation ~USD30 million) in July 2008. Theacquisition has expanded ADSL’s reach into the US market as well as providedaccess to EGSL’s several Fortune 1,000 clients. Post-acquisition, ADSL hasbeen able to substantially drive EGSL’s contracted revenue base to USD60-62million currently from USD40 million at the time of the acquisition. The acqui-sition would also enable ADSL to leverage its offshore capabilities through itsNOC and SOC in the RIMS market.
� Large deals/alliances, next growth driver: ADSL is believed to be close to signinga pact with one of the leading PC server manufacturers to offer its services as abundled offering to the OEM clientele. Such deals can potentially bring in sub-stantial incremental revenues and act as the next growth driver for the company.
� Margins are sustainable: ADSL’s margins shall sustain in future in spite of ahighly competitive environment owing to: (i) the higher proportion of revenuesfrom the high-margin service segment; (ii) the improving EGSL margin as morework gets shifted offshore; (iii) conscious efforts to reduce its dependence onthe onsite employees; and (iv) cost efficiencies.
� Attractive valuation: Due to its unique positioning, ADSL shall ride the highgrowth in the RIMS and solution market. This coupled with the sustainabilityof its margins will help it to grow its earnings at a CAGR of 19.6% (on adjustedearnings basis) over FY2009-11. Considering its 19.6% earnings CAGR andhealthy return ratios, ADSL seems to be trading at attractive valuations of 7xFY2010 earnings estimate and 5.9x FY2011 earnings estimate. We initiatecoverage on ADSL with a Buy recommendation and price target of Rs532 (at6x FY2011 EV/EBITDA multiple). Our target price implies FY2011 PE mul-tiple of 8.3x, which is at ~30% discount to its average multiple of 11.6x sinceits listing in July 2007.
STOCK IDEASAllied Digital Services
Promoters56%
MF/ Institutions
10%
FIIs15%
Others19%
125
250
375
500
625
750
875
Aug
-08
Nov
-08
Feb
-09
May
-09
Aug
-09
KEY FINANCIALS
Particulars FY2007 FY2008 FY2009 FY2010E FY2011E
Net sales (Rs crore) 156.0 297.4 525.1 658.7 769.2
Adjusted net profit (Rs crore) 22.9 43.6 81.3 98.3 116.2
No of shares (crore) 1.3 1.7 1.8 1.8 1.8
EPS (Rs) 18.0 25.2 44.9 54.3 64.1
% y-o-y growth rate 40.3 78.1 20.9 18.2
PER(x) 21.1 15.0 8.4 7.0 5.9
Price/BV(x) 11.2 3.6 2.0 1.5 1.2
EV/EBITDA(x) 14.8 10.1 6.8 5.4 4.7
RoCE(%) 64.0 47.3 31.8 26.3 26.0
RoNW(%) 54.7 36.3 31.3 26.1 24.0
September 2009 Sharekhan ValueGuide18
operation centre (SOC), ADSL is the first company to startSOC services in the RIMS space in India. In the SOC, ADSLprovides proactive protection and risk management for enter-prise security on a 24x7 basis. The SOC facility has state-of-the-art physical security systems ranging from biometric accesscontrol, closed circuit TV, fire detection to suppression sys-tems. ADSL has tied up with one of the leading commercial SOCplayers in Singapore, e-Cop, and is exploring exclusive go-to-market strategy with the company.
The NOC and SOC were initially started with a joint capacity of 50seats (30 seats in NOC and 20 seats in SOC). The capacity waslater expanded to 150 seats. ADSL charges USD800 per month tomonitor one device. At the same time, one seat can handle severaldevices simultaneously. The EGSL acquisition would also enableADSL to leverage its NOC and SOC capabilities. We believe theNOC and SOC service centres are the key differentiator for ADSLand are likely to remain a prime growth driver in future. Hence, weexpect the service business’ revenues to grow at a compoundedannual growth rate (CAGR) of 32.4% over FY2009-11.
INVESTMENT ARGUMENTS
Well placed in high growing niche RIMS market
ADSL is a leading player in the RIMS market. It has uniquely posi-tioned itself in this space with its NOC and SOC. Due to its uniqueposition ADSL is likely to be the key beneficiary of the high growthto be seen in the RIMS market in the years ahead.
According to a McKinsey-Nasscom report, the global RIMS mar-ket stood at USD96-104 billion in 2008. Out of this only ~7%(USD6-7 billion) was outsourced globally. In the global RIMSoutsourcing market, India’s market share stood at USD3.6 billionin the same year. The report suggested that the RIMS market islikely to grow very rapidly over the next five years due to costrationalisation by corporates, telecommunications (telecom) andtechnology advancement, and increasing complexities of IT sys-tems. The report also suggested that ~70-75% of the RIMS can beoutsourced. On the back of these grow drivers, the business ofoutsourcing RIMS is expected to grow at over 30% CAGR toUSD26-28 billion globally and to USD13-15 billion in India by2013. Hence, due to its unique position in this space ADSL is likely tobenefit the most from the high growth expected in the RIMS market.
EGSL acquisition improves geographical reach
In July 2008, ADSL acquired an 80.5% stake in EGSL for ~USD24million (total equity valuation ~USD30 million). EGSL is an IT in-frastructure service provider and was a carved-out subsidiary of En
COMPANY BACKGROUND
Founded in 1995 ADSL is an information technology (IT) infra-structure management and technical support services outsourcingcompany. It currently operates in 132 locations with an em-ployee base of ~3,000 employees. It has over two decades ofexperience in technology and enterprise IT infrastructure imple-mentation, management and consulting on complex IT and busi-ness systems. ADSL went public in July 2007.
Business segments
Solution
The solution business accounted for 52.8% of the consolidated topline with an earnings before interest and tax (EBIT) margin of 30.6%in FY2009. In the solution segment, ADSL carries out system inte-gration and sets up complete IT infrastructure for its clients on aturnkey basis. ADSL designs the operating infrastructure on whichenterprise wide applications, such as enterprise resource planning(ERP), supply chain management (SCM) and customer resourcemanagement (CRM), run. It has frequently won complex consultingand system integration (SI) projects for large Indian companies de-spite competition from prominent Indian and global vendors. Thecompany has joined hands with global technology companies, suchas HP, IBM, Microsoft and Echelon, to provide these solutions. Inthis segment, the company is shifting its focus from low-margin tra-ditional SI services, which consist of higher hardware sales, to high-margin consultancy-based services. In view of the company’s highlycompetitive solution business and focus on the high-margin consult-ing business, we have considered only 10% compounded annualgrowth in the solution business for the period FY2009-11.
Services
The service segment accounted for 47.2% of ADSL’s consolidatedrevenues with an EBIT margin of 68.5% in FY2009. The companyoperates through two strategic business units (SBUs): IT service(consists of onsite infrastructure management service [IMS] andtechnical business process outsourcing [BPO]) and remote man-aged service. In the IT service division, ADSL provides services suchas test and repair/service centre, technical BPO, incident based support,annual maintenance contract, onsite infrastructure services, enterprisemanagement services and infrastructure/professional services.
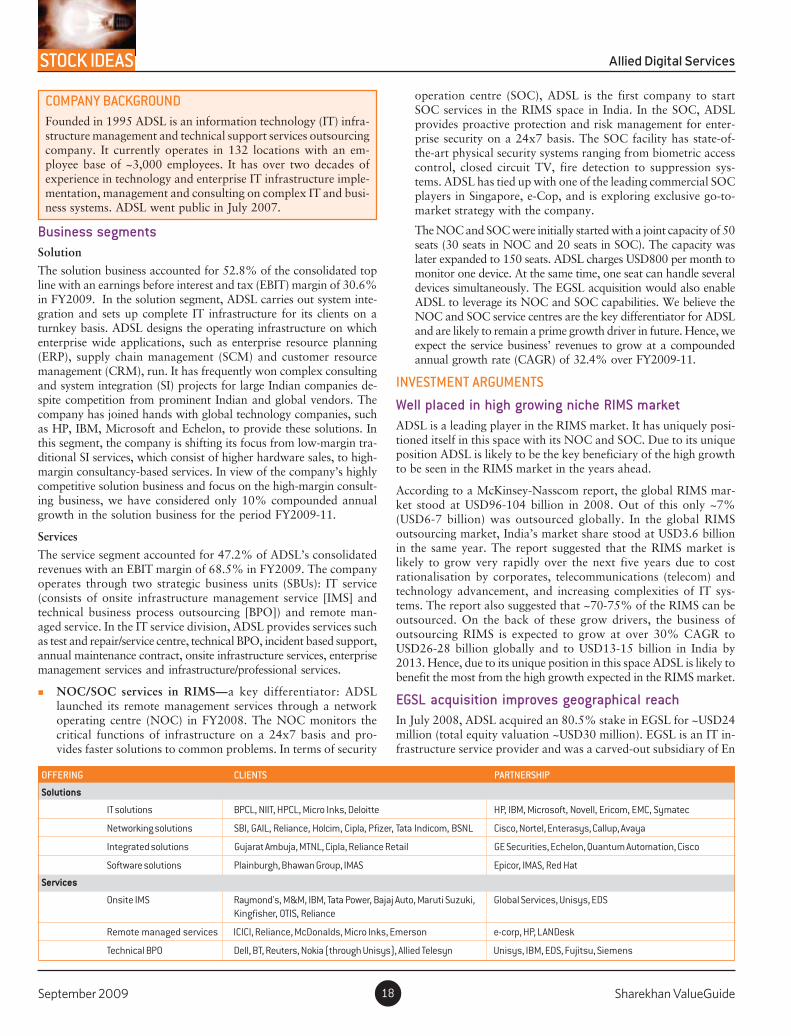
� NOC/SOC services in RIMS—a key differentiator: ADSLlaunched its remote management services through a networkoperating centre (NOC) in FY2008. The NOC monitors thecritical functions of infrastructure on a 24x7 basis and pro-vides faster solutions to common problems. In terms of security
OFFERING CLIENTS PARTNERSHIP
Solutions
IT solutions BPCL, NIIT, HPCL, Micro Inks, Deloitte HP, IBM, Microsoft, Novell, Ericom, EMC, Symatec
Networking solutions SBI, GAIL, Reliance, Holcim, Cipla, Pfizer, Tata Indicom, BSNL Cisco, Nortel, Enterasys, Callup, Avaya
Integrated solutions Gujarat Ambuja, MTNL, Cipla, Reliance Retail GE Securities, Echelon, Quantum Automation, Cisco
Software solutions Plainburgh, Bhawan Group, IMAS Epicor, IMAS, Red Hat
Services
Onsite IMS Raymond's, M&M, IBM, Tata Power, Bajaj Auto, Maruti Suzuki, Global Services, Unisys, EDSKingfisher, OTIS, Reliance
Remote managed services ICICI, Reliance, McDonalds, Micro Inks, Emerson e-corp, HP, LANDesk
Technical BPO Dell, BT, Reuters, Nokia (through Unisys), Allied Telesyn Unisys, IBM, EDS, Fujitsu, Siemens
STOCK IDEAS Allied Digital Services

Sharekhan ValueGuide September 200919
76% 80% 79% 79%
53% 46% 44%
21% 19% 20% 21%
47% 54% 56%
0.0%
20.0%
40.0%
60.0%
80.0%
100.0%
FY 2005 FY 2006 FY 2007 FY 2008 FY 2009 FY 2010E FY 2011E
Solution Services
Pointe Technologies (ENPT), a Nasdaq-listed company with rev-enues of USD340 million. The transaction was done through acombination of cash and equity swap. ADSL made an upfront pay-ment of USD10 million and issued 745,000 equity shares of ADSLto ENPT. Besides, ADSL made an additional cash infusion of USD10million in EGSL.
At the time of acquisition, EGSL had contracted revenues of USD40million from 32 clients (of which 11 were Fortune 1,000 compa-nies). These contracted revenues have now increased sharply toUSD60-62 million, thereby improving the visibility of the revenuesfrom the business, going forward. The acquisition has strength-ened the opportunity pipeline for the company in the US market forits remote service offerings (NOC and SOC). EGSL will receiveongoing marketing and business support from ENPT. ENPT has astrong sales team, a wide reach and credibility established over thelast 15 years of operations in the US market as well as an estab-lished presence across 44 states of the USA with a client base thatincludes several Fortune 1,000 corporates across the banking, fi-nancial services and insurance, healthcare, retail, manufacturing,aviation and transportation sectors.
Large deals/alliances and healthy order book, the next
growth drivers
ADSL is believed to be close to signing an agreement with one of theleading PC server manufacturers to offer its services as a bundledoffering to the original equipment manufacturer (OEM) clientele.Such deals can potentially bring in substantial incremental revenuesand act as the next growth driver for the company.
The bundled services to the OEM would be initially offered in theUSA and would be rolled out in the other continents as well in thenext few quarters. Apart from this, ADSL currently has a healthyorder book of Rs230 crore (solution business: Rs80 crore andservice business: Rs150 crore), which has improved the visibility ofits future revenues. Hence, we believe the ramp-up of the recentlywon deal and the execution of the order book would drive ADSL’sgrowth in the years ahead.
Margins are sustainable
Going forward, ADSL’s margins are sustainable in future in spite ofthe highly competitive environment that it operates in. We havefactored in a margin improvement of 150 basis points for FY2009-11 to be achieved on the back of: (i) a higher proportion of rev-enues from the high-margin service segment (driven by the NOCand SOC businesses); (ii) an improvement in EGSL’s margin asmore work gets shifted offshore; (iii) its conscious efforts to reduceits dependence on the onsite employees; and (iv) cost efficiencies.
REVENUE MIX
REVENUES AND OPM TREND
KEY CONCERNS
Stiff competition in solution business
ADSL may face stiff competition in its solution business (which ac-counted for ~53% of its total revenues in FY2009) from the bigplayers such as Tata Consultancy Services (TCS), Wipro and HCLTechnologies. This may affect its growth momentum, going forward.
High debtors days
The SI business generally has higher debtor days. ADSL has higherdebtor days due to the higher revenue contribution from the solu-tion business in FY2009. ADSL’s debtor days stood at 175 days(on a stand-alone basis) and at 140 days (on a consolidated basis)in FY2009. However, we highlight that the company is now focus-ing more on the service business as against the traditional solutionbusiness. Furthermore, even in the solution business, the companyis now focusing on consulting services as against on hardware com-ponent sales (its earlier focus). This should reduce its debtor daysgoing forward. In view of the declining share of revenues from thesolution business in the total revenues and the improvement in thebusiness environment, we expect the company’s working capitalcycle to improve going forward.
Integration of acquisition
To fill up its service gaps and maintain its high growth trajectory,ADSL may go for further acquisitions. This may pose integrationrisk. We have already seen the impact of the integration of the EGSLacquisition on ADSL’s margin in FY2009, though the company iscurrently working on offshoring EGSL’s work, which should im-prove EGSL’s margins going forward. Furthermore, EGSL derivesits revenues from the US geography. Hence, any protracted recov-ery in the US economy may affect ADSL’s revenue growth.
VALUATION AND VIEW
Due to its unique positioning ADSL shall ride the high growth inthe RIMS and solution market. This coupled with the sustainabilityof its margins will help it to grow its earnings at a CAGR of 19.6%(on adjusted earnings basis) over FY2009-11. Considering its19.6% earnings CAGR and healthy return ratios, ADSL seems tobe trading at attractive valuations of 7x FY2010 earnings estimateand 5.9x FY2011 earnings estimate. We initiate coverage on ADSLwith a Buy recommendation and price target of Rs532 (at 6xFY2011 EV/EBITDA multiple). Our target price implies FY2011price/earnings (PE) multiple of 8.3x, which is at ~30% discount toits average multiple of 11.6x since its listing in July 2007.�
0
100
200
300
400
500
600
700
800
900
FY 2006 FY 2007 FY 2008 FY 2009 FY 2010E FY 2011E
17.5%
18.0%18.5%
19.0%19.5%
20.0%
20.5%21.0%
21.5%22.0%
22.5%
Revenues OPM (%)
The author doesn’t hold any investment in any of the companies mentioned inthe article.
For the financials, please visit the Research section of our website, sharekhan.com
STOCK IDEASAllied Digital Services

September 2009 Sharekhan ValueGuide20
Fillip from improving demand environmentCOMPANY DETAILS
Price target: Rs185
Market cap: Rs380 cr
52-week high/low: Rs167/27
NSE volume (No of shares): 52,832
BSE code: 50 6590
NSE code: PHILIPCARB
Sharekhan code: PHILCARB
Free float (No of shares): 1.3 cr
PRICE CHART
SHAREHOLDING PATTERN
(%) 1 m 3 m 6 m 12m
Absolute 80.6 54.9 338.0 -16.8
Relative 81.3 41.7 146.9 -19.7
to Sensex
PRICE PERFORMANCE
CANNONBALL BUY; CMP: RS135 AUGUST 21, 2009PHILLIPS CARBON BLACK
KEY POINTS� Improving demand environment: Phillips Carbon Black Ltd (PCBL), a leading
carbon black manufacturer in India, is among the key beneficiaries of the re-vival in the domestic tyre industry. Apart from the strong demand from thepassenger car segment and the replacement market, the reduced imports oftruck bus radial (TBR) tyres from China have also boosted the demand forcarbon black from the domestic tyre companies.
� Anti-dumping duty to aid profitability: The recent notification regarding theimposition of anti-dumping duty on carbon black imports from China, Rus-sia, Australia and Thailand is expected to improve the pricing power of domes-tic carbon black producers. Thus, we believe that the domestic manufacturerswould be in a better position to protect their margins by passing on the costincreases (if any) on account of the rise in crude oil’s price.
� Timely expansion of manufacturing capacities: PCBL is expanding its carbonblack production capacity at Mundra by 90,000 million tonne (MT), taking itstotal carbon black capacity to 360,000MT by the end of Q2FY2010. Theaddition of new capacities is well timed given the improving demand environ-ment. We expect the company’s carbon black sales volume to grow by 17.5%in FY2010, resulting in segmental profits of Rs102.4 crore for the carbonblack business in FY2010 as against a loss of Rs35.6 crore in FY2009.
� Surplus power sale to boost earnings: PCBL has waste heat recovery (WHR)power project capacities at Baroda (12.5MW), Durgapur (30MW) and Mundra(16MW; scheduled to be commissioned in Q4FY2010). After catering to thecaptive needs, the company is able to generate substantial revenues from thesale of surplus power in the open market. We estimate the power divisionwould contribute 41% to the total EBIDTA of the company in FY2011.
� Attractive valuations: In view of the distinct improvement in the demand envi-ronment and the incremental earnings from the sale of surplus power, weexpect the company to report a significant improvement in its financial perfor-mance over the next two years. PCBL is estimated to report a net profit ofRs91.5 crore in FY2011 as against a net loss of Rs64.8 crore in FY2009.Despite the turnaround in its financial performance and healthy return ratios,the stock trades at attractive valuations of 4.2x FY2011 earnings and 4.3xFY2011 EV/EBIDTA. We initiate coverage on PCBL with a Buy recommenda-tion and a price target of Rs185.
STOCK IDEAS Phillips Carbon Black
15
40
65
90
115
140
165
190
Aug
-08
Nov
-08
Feb
-09
May
-09
Aug
-09
Foreign6%
Promoters54%
Public & Others18% Institutions
6%Non-promoter
corporate16%
KEY FINANCIALS
Particulars FY2007 FY2008 FY2009 FY2010E FY2011E
Net sales (Rs crore) 998.6 1033.2 1163.3 1351.9 1508.9
Adjusted net profit (Rs crore) 23.5 89.3 -64.8 75.8 91.5
No of shares (crore) 2.1 2.6 2.7 2.8 2.8
EPS (Rs) 11.5 34.2 -24.1 26.8 32.4
% y-o-y change 198.0 -170.6 -211.2 20.8
PER (x) 11.7 3.9 NM 5.0 4.2
Price/BV (x) 1.7 1.5 1.7 1.3 1.0
EV/EBITDA (x) 5.2 4.4 NM 5.3 4.3
RoCE (%) 16.1 27.9 -1.5 20.8 22.8
RoNW (%) 14.3 36.9 -29.8 25.8 23.8

Sharekhan ValueGuide September 200921
COMPANY BACKGROUND
Incorporated in 1960, PCBL is part of the RPG group. It is apioneer in the Indian carbon black industry and has technicalcollaborations with Phillips Petroleum, USA, Sid Richardson,USA and Columbian Chemicals Company, USA.
Currently, PCBL is the largest carbon black manufacturer inIndia with around 40% share in the domestic market. Its keycustomers include Goodyear India, MRF Tyres, CEAT and al-most all the other domestic tyre manufacturers. The company isset to increase its carbon black manufacturing capacity by90,000MT to 360,000MT by the end of the current quarter.
In addition, it has two power plants: one at Baroda (12.5MW; aWHR unit) and the other at Durgapur (30MW). Furthermore,the company would be adding 16MW capacity at the Mundraplant which is likely to be commissioned during Q4FY2010.The power generated from the existing capacities is used forcaptive consumption and the surplus is sold in the open market.
INVESTMENT ARGUMENTS
Revival in automobile and trye industries—PCBL to be
the key beneficiary
The automobile sector in India has witnessed a substantial improve-ment in demand, especially in the passenger car and commercialvehicle segments, and the replacement market, resulting in the re-vival of the domestic tyre industry. With its strong presence in thedomestic market, PCBL will be the key beneficiary of the recovery inthe tyre industry. In addition, the reduced imports of the TBR tyresfrom China have further boosted the demand from the domestictyre manufacturers.
YEAR-ON-YEAR GROWTH TREND IN DOMESTIC AUTO SALES VOLUME—CLEAR
SIGNS OF REVIVAL
We expect a robust growth in the domestic automobile sector, espe-cially in passenger car and commercial vehicle segments, on theback of the improvement in the macro environment and the recentrecovery seen in the demand for automobiles despite the economicslowdown. A robust growth in the automobile sector would, inturn, lead to an increase in the demand for tyres, thereby boostingthe demand for carbon black.
Imposition of anti-dumpting duty to support margins
The recent notification by the Government of India to impose anti-dumping duty on cheap imports of carbon black from China, Rus-sia, Thailand and Australia will improve the pricing power of thecarbon black producers in the country. Recently, the imports of
-70.0%-60.0%
-50.0%-40.0%-30.0%-20.0%
-10.0%0.0%
10.0%20.0%
30.0%40.0%
Apr
-08
May
-08
Jun-
08
Jul-0
8
Aug
-08
Sep
-08
Oct
-08
Nov
-08
Dec
-08
Jan-
09
Feb
-09
Mar
-09
Apr
-09
May
-09
Jun-
09
Jul-0
9
Passenger car sales Three- Wheeler Sales
Tw o- Wheeler sales Commercial vehicle sales
carbon black have reduced significantly and this would protect thedomestic carbon black manufacturers from price competition throughcheap imports. Hence, we believe that the domestic manufacturerswould be in a better position to protect their margins by passing onthe cost increases (if any) on account of the rise in crude oil’s price.
Timely expansion of carbon black capacity to meet rising
demand
PCBL has completed capital expenditure of Rs200 crore for theexpansion of its carbon black capacity by 90,000MT at Mundra.Consequently, the company’s carbon black capacity will increase to360,000MT by the end of this fiscal from 27,000MT in FY2009.The majority of the civil and engineering work has been completedand currently the pre-commissioning activity is under progress.The new capacity is expected to become operational in Q2FY2010while the production capacity will be ramped up in the next three tosix months.
We believe that the commissioning of the expanded capacity is welltimed, given the improvement in the demand for carbon black fromthe tyre industry. The improvement in the demand is expected toboost the sales volume of carbon black for the company fromQ3FY2010 onwards. We expect the company’s carbon black salesvolume to grow by 17.5% in FY2010 and by 9.1% in FY2011. Onthe back of the improving volumes and pricing power, we expectthe carbon black business to report a segmental profit of Rs102.4crore in FY2010 as against a loss of Rs35.6 crore in FY2009.
CAPACITY EXPANSION AND RISE IN DEMAND TO BOOST CARBON BLACK SALES
VOLUME
MARGINS TO RECOVER ON THE BACK HIGHER VOLUMES AND DECLINING COST
Power projects—a sweetener
PCBL has an installed capacity of 12.5MW to generate powerthrough a WHR power project at its Baroda plant and brought onstream additional 30MW capacity at Durgapur during Q1FY2010.Furthermore, the company would be adding 16MW of capacity at
0
50,000
100,000
150,000
200,000
250,000
300,000
350,000
400,000
FY2007 FY2008 FY2009 FY2010E FY2011E
Mill
ion
tonn
es
Capacity Sales volume
-5.0%
0.0%
5.0%
10.0%
15.0%
20.0%
FY2007 FY2008 FY2009 FY2010E FY2011E
EBITDA Margin
STOCK IDEASPhillips Carbon Black

September 2009 Sharekhan ValueGuide22
the Mundra plant and the same is likely to be commissioned duringQ4FY2010.
PCBL generates power through conversion of “off-gas”, a by-prod-uct of the carbon black manufacturing process. Given the pollutingnature of the gas, the gas needs to be let out only after it is treatedthrough pollution handling equipment. Alternatively, the gas canbe used to generate power. Accordingly, PCBL has set up powerplants at all its manufacturing facilities and the same use “off-gas”to generate power.
After using power for captive purposes (this helps the company insaving costs), PCBL sells the balance power in the open market.Selling power in the open market adds to the profitability of thecompany and the division is likely to contribute as much as 41% tothe company’s total earnings before interest, depreciation, tax andamortisation (EBIDTA) in FY2011. Currently, at the Durgapurfacility the company is selling 15MW of power to CESC at Rs2.5per unit. From the Baroda facility, the company sells 8MW of powerto Tata Power.
LOCATION CAPACITY CURRENTLY REMARKS
(MW) SELLING (MW)
Baroda 12.5 8 Selling to Tata Power onspot rate basis
Durgapur 30 15 Recently commissioned,selling to CESC @ Rs2.5 a unit
Mundra 16 Likely to be commissionedin Q4FY2010
Source: Company
RISK AND CONCERNS
Slowdown in the auto and tyre industries
The majority of PCBL’s sales come from the tyre industry, which, inturn, depends on the automobile industry for business. Any slow-down in the automobile industry due to an economic slowdownwould affect the revenues of the company significantly.
Volatility in the price of CBFS, the key raw material
The cost of raw material (carbon black feedstock [CBFS]) accountsfor 67-70% of the company’s revenues and CBFS is a derivative ofcrude oil, which is very volatile. Any adverse movement in the priceof crude oil may affect the margins of the company.
Fluctuations in the exchange rate
Around 90% of the company’s raw material is imported. Therefore,any fluctuation in the foreign exchange rates would affect its rawmaterial cost, which could lower the overall margins of the company.
VALUATION AND VIEW
In view of the distinct improvement in the demand environmentand the incremental earnings from the sale of surplus power, weexpect the company to report a significant improvement in its fi-nancial performance over the next two years. PCBL is estimated toreport a net profit of Rs91.5 crore in FY2011 as against a net lossof Rs64.8 crore in FY2009. Despite the turnaround in thecompany’s financial performance and its healthy return ratios, itsstock trades at attractive valuations of 4.2x FY2011 earnings and4.3x FY2011 enterprise value (EV)/EBITDA. We initiate coverageon PCBL with a Buy recommendation and price target of Rs185.�
Carbon black—key user industries
The most common use of carbon black is as a pigment and rein-forcing force in automobile tyres (64% of total carbon blackoutput). Carbon black helps in conducting heat away from thetread and belt area of the tyre, reducing the thermal damage andincreasing the tyre's life. Carbon black particles are also employedin some radar absorbent materials and in printer toner. A normalcar tyre contains about 3.63kg of carbon black.
USES OF CARBON BLACK
FINANCIALS
Tyre 64%
Rubber Hose Conveyor belting, Auto Components
33%
Printing Ink, PVC Master Batches
3%
PROFIT & LOSS STATEMENT Rs (cr)
Particulars FY07 FY08 FY09 FY10E FY11E
Net sales 998.6 1033.2 1163.3 1351.9 1508.9
Operating expenses 905.2 891.5 1168.7 1199.6 1329.2
EBITDA 93.4 141.7 -5.4 152.3 179.7
Other income 4.1 6.1 16.3 15.0 18.0
Interest 32.6 14.9 88.6 42.6 42.6
Depreciation 20.4 20.1 19.6 33.5 33.2
PBT 44.5 112.8 -97.3 91.3 122.0
Tax 21.0 23.5 -32.5 15.5 30.5
PAT 23.5 89.3 -64.8 75.8 91.5
BALANCE SHEET Rs (cr)
Share capital 29.7 29.7 28.3 28.3 28.3
Reserves & surplus 135.0 212.2 189.2 265.0 356.5
Net worth 164.8 241.9 217.5 293.2 384.7
Total debt 249.9 290.4 425.6 425.6 425.6
Deferred tax assets 43.4 35.3 1.7 1.7 1.7
Capital employed 458.1 567.6 644.7 720.5 812.0
Net fixed assets 260.3 244.9 228.0 269.5 311.3
Capital WIP 21.1 130.5 382.8 362.8 352.8
Investments 28.1 28.1 37.8 37.8 37.8
Net current assets 148.6 164.2 -3.8 50.4 110.1
Capital deployed 458.1 567.6 644.7 720.5 812.0
KEY RATIOS (%)
OPM (%) 9.4 13.7 -0.5 11.3 11.9
NPM (%) 2.4 8.6 -5.6 5.6 6.1
RoCE (%) 16.1 27.9 -1.5 20.8 22.8
RoNW (%) 14.3 36.9 -29.8 25.8 23.8
The author doesn’t hold any investment in any of the companies mentioned in the article.
STOCK IDEAS Phillips Carbon Black

Sharekhan ValueGuide September 200923
A global agrochemical playCOMPANY DETAILS
Price target: Rs225
Market cap: Rs7,143 cr
52-week high/low: Rs353/73
NSE volume (No of shares): 12.2 lakh
BSE code: 512070
NSE code: UNIPHOS
Sharekhan code: UNIPHOS
Free float (No of shares): 31.7 cr
PRICE CHART
SHAREHOLDING PATTERN
(%) 1 m 3 m 6 m 12m
Absolute 0.7 1.0 85.4 2.2
Relative -1.9 -13.0 4.5 -7.3
to Sensex
PRICE PERFORMANCE
UGLY DUCKLING BUY; CMP: RS163 AUGUST 27, 2009UNITED PHOSPHORUS
KEY POINTS� Wide product portfolio, diversified target markets: United Phosphorous Ltd
(UPL)’s diversified product portfolio, strong distribution network and pres-ence across geographies make it a good investment play in the agrochemicalspace. UPL derives its revenues from various geographies across the world,with India contributing around one-fifth of the revenues. Such well-diversifiedclient markets act as a natural hedge for the company during times of slow-down or drought in any particular region.
� Huge opportunities for crop protection products: Globally, the agrochemicalindustry is divided into products protected by patents and generic products.With a significant number of agrochemicals going off patent in the next coupleof years, opportunities for global generic players like UPL are likely to beimmense. UPL has a strong pipeline of products in the generic crop protectionspace. Domestically too, in view of the increasing focus on improving produc-tivity and the lower penetration of agrochemicals in the country, the demandfor crop protection products is likely to remain buoyant going forward.
� Margin expansion to boost earnings: UPL has achieved a stupendous 37%revenue growth (CAGR) over FY2005-09, though we expect its revenue growthto moderate in future (13% CAGR during FY2009-11E) due to lower averagerealisations globally. However, we expect the OPM to improve by 80 basispoints on the back of a lower raw material cost and improved profitability ofthe recently acquired entity, Cerexagri. Moreover, UPL plans to take advantageof its low-cost base in India and shift home some of the global manufacturingprocesses from its high-cost manufacturing destinations like Australia andArgentina. As a result, the net profit is estimated to grow at a CAGR of 28%during FY2009-11.
� Stock at discount to its average multiple: Despite its strong positioning in thecrop protection market and the healthy growth in its earnings, UPL trades at ahuge discount to its one-year forward average EV/EBITDA multiple of 9.4x,leaving scope for substantial upside. Moreover, we have not factored in anypossible upside from its seed business that is currently margin dilutive but isexpected to witness improvement in profitability. At the current market priceof Rs163, the stock is discounting its FY2010E and FY2011E EPS at 10.7xand 8.8x respectively. We initiate coverage on UPL with a Buy recommenda-tion. We arrive at a price target of Rs225 after valuing the company at 8.5x itsFY2011E EV/EBITDA, which is at ~10% discount to its historical average.
CONSOLIDATED
Particulars FY2007 FY2008 FY2009 FY2010E FY2011E
Net sales (Rs cr) 2449.8 3730.6 4931.7 5678.1 6335.7
Adj net profit (Rs cr) 265.6 372.3 475.2 645.9 783.3
No of shares(cr) 18.8 22.0 44.0 44.0 44.0
Fully diluted EPS (Rs) 15.0 12.8 11.0 14.5 17.5
% y-o-y change 30.2 -15.2 -13.5 31.0 20.9
PER (x) 21.6 25.5 14.7 10.7 8.8
P/BV (x) 4.1 3.2 2.7 2.3 1.9
EV/EBIDTA (x) 12.9 11.1 8.9 7.9 6.4
RoCE (%) 12.0 14.9 16.6 16.3 18.4
RoNW (%) 18.9 12.5 18.6 21.1 21.1
50
70
90
110
130
150
170
190
210
Aug
-08
Nov
-08
Feb
-09
May
-09
Aug
-09
MF & FI27.1%
Promoter28.0%
Foreign37.0%
Public & others7.9%
STOCK IDEASUnited Phosphorus

September 2009 Sharekhan ValueGuide24
26% 25% 22% 27%
22% 24% 26% 21%
27% 21% 21% 22%
25% 30% 32% 30%
0%10%20%30%40%50%60%70%80%90%
100%
FY2007 FY2008 FY2009 Q1FY2010
North America ROW India Europe
0
1000
2000
3000
4000
5000
6000
7000
FY
2005
FY
2006
FY
2007
FY
2008
FY
2009
FY
2010
E
FY
2011
E
Rs
cror
e
CAGR – 37%
CAGR – 13%
COMPANY BACKGROUND
Incorporated in 1969 UPL is a leading global producer of cropprotection products, intermediates, specialty chemicals and otherindustrial chemicals. UPL has its presence across value-addedagricultural inputs, ranging from seeds to crop protection prod-ucts, and post-harvest activities. UPL offers a wide range of prod-ucts including insecticides, fungicides, herbicides, fumigants androdenticides. The company operates across continents and has acustomer base in 86 countries. UPL ranks amongst the top fivepost-patent agrochemical manufacturers in the world.
INVESTMENT ARGUMENTS
Wide product portfolio, diversified target markets
UPL has a diversified business model, in terms of both geographiesand products. The company is a leading global producer of cropprotection products, intermediates, specialty chemicals and otherindustrial chemicals. It offers a wide range of products includinginsecticides, fungicides, herbicides, fumigants and rodenticides. More-over, with its recent acquisition of Advanta Netherlands HoldingsBV (Advanta), UPL has now introduced seeds in its product portfo-lio and sells Advanta’s products through its distribution network.
In terms of target markets, UPL has presence across continents andderives its revenues from various geographies across the world,with India contributing around one-fifth of its total revenues (as onJune 30, 2009). The largest contribution comes from the Europeanregion, which is also the most profitable region for the company.Such diversified client markets act as a natural hedge for the com-pany during times of a slowdown in any particular region. Thus,we see limited impact of the ongoing drought condition in India onthe financial performance of the company.
REGION-WISE BEAK-UP OF REVENUES
Huge opportunities in the crop protection market
UPL is among the top five players in the global agrochemical andcrop protection market. Globally, the agrochemical industry is di-vided into products protected by patents and products where thepatents have expired (generic products). With a significant numberof products going off patent in the next couple of years, opportuni-ties for global generic players like UPL are likely to be immense.
Globally, the main agrochemical product segments like herbicidescontributed around 50% of the industry’s revenues in 2007, fol-lowed by insecticides and fungicides, which make equal revenuecontribution for the rest. Currently, the generic players have ~40%market share. This share is likely to increase going forward as prod-ucts worth ~$4 billion (in revenue) are likely to come up for patentexpiry between 2009 and 2014.
Though globally the generic crop protection market is huge andthrows up enough opportunities, the industry is highly regulatedby specific and separate registration processes in different countriesand is subject to various environmental and safety legislations.Consequently, the higher regulatory requirements make the entryinto this space tough and unattractive for the new entrants. Thisaugurs well for established players like UPL.
On the domestic front too, the government’s focus will remain onimproving productivity to increase the agricultural output in orderto keep pace with the growing population. With lesser land avail-able for cultivation, the only way to increase output now is to im-prove productivity. As per the data available, in India the consump-tion of agrochemicals in terms of per kilogram per hectare is as lowas 0.5 in India as against 5.0 in the UK, 7.0 in the USA and 14.0 inChina. This clearly indicates the huge opportunity available at homeas the penetration of agrochemicals in the country remains low.
Lower revenue growth but margin expansion to boost
bottom line
During FY2005-09, UPL’s top line and bottom line grew at a com-pounded annual growth rate (CAGR) of 37% and 32% respec-tively on account of a number of acquisitions done by the companyover the period. However, we expect the pace of revenue growth tomoderate significantly (13% CAGR during FY2009-11) on ac-count of lower realisations globally. The average realisations areexpected to decline largely due to the partial pass-through of thesteep drop in the input cost. Moreover, the sharp exchange ratefluctuations too are likely to have a bearing on the revenue growthof the company. In addition, we have factored in our estimatesmarginal revenues from the company’s newly started seed business(based on the arrangement between UPL and Advanta). This shallpartially offset the decline expected in the revenues on account ofthe lower average realisation.
Importantly, despite a slower growth in the top line, we expectUPL’s bottom line to grow at a CAGR of 28% during FY2009-11.The higher growth in the bottom line would be driven by the ex-pansion in the company’s operating profit margin (OPM) led by alower raw material cost, lower restructuring expenses and benefitsof integration of Cerexagri with the company.
UPL’s margins took a hit in FY2009 due to the restructuring costincurred on account of the Cerexagri acquisition. We expect therestructuring expense to continue till H1FY2010 after which themargin is likely to expand following the completion of the Cerexagriintegration. Furthermore, the benefits of a lower raw material costare likely to trickle in in the coming quarters as the high cost inven-tory runs off.
TREND IN TOP LINE GROWTH
United PhosphorusSTOCK IDEAS

Sharekhan ValueGuide September 200925
0100200300400500600700800900
FY
2005
FY
2006
FY
2007
FY
2008
FY
2009
FY
2010
E
FY
2011
E
Rs
cror
e
CAGR – 32%
CAGR – 28%
24.7
26.9
23.1
18.9 19.219.4 19.8
0
200
400
600
800
1000
1200
1400
FY
2005
FY
2006
FY
2007
FY
2008
FY
2009
FY
2010
E
FY
2011
E
Rs
cror
e
15
18
21
24
27
30Op profit OPM (%) - RHS
The author doesn’t hold any investment in any of the companies mentioned inthe article.
For the financials, please visit the Research section of our website, sharekhan.com
COMPANY NAME LOCATION YEAR OF ACQUISITION
Reposo Argentina 2006
Advanta B.V. Netherlands 2006
Crop Serve South Africa 2006
Asulam, Trichlorfon and ODM Worldwide 2006
Bensulfuron-methyl Worldwide 2006
Propanil Worldwide 2006
Cerexagri Worldwide 2007
Super Tin, Vendex (Du Pont) Worldwide 2007
Icona Argentina 2007
Evofarms Colombia 2008
INVESTMENT CONCERNS
Rupee’s appreciationUPL derives majority of its revenues from its overseas subsidiaries.Hence, it runs the risk of sharp currency fluctuations, which arelikely to affect its revenues. A significant appreciation in the rupeecould hamper the company’s top line growth.
Delay in monsoon may affect demandThe company caters to the agriculture sector, which is highly de-pendent on the rains in India as well as globally. A weaker mon-soon in India could threaten the domestic demand, thereby affect-ing UPL’s domestic revenues. However, India contributes aroundone-fifth of the company’s total revenues and has a limited impacton its financial performance.
High cost acquisition could affect balance sheetThe company has followed the strategy of growing inorganically inthe past to expand its business and is currently scouting for moregood acquisition opportunities. As on March 31, 2009, the com-pany had comfortable net debt-to-equity position of 0.6x at theconsolidated level. However, a high cost acquisition may lead thecompany to excessively leverage its balance sheet.
Fall in agro commodity pricesA sharp fall in agro commodity prices domestically as well as glo-bally may hamper the demand for crop protection products, therebyaffecting the company’s top line.
VALUATIONWe believe UPL’s diversified product portfolio, strong distributionnetwork and presence across geographies make it a good invest-ment play in the agrochemical space. Despite its strong positioningin the crop protection market and the healthy growth in its earn-ings, UPL trades at a substantial discount to its one-year forwardaverage enterprise value (EV)/earnings before interest, tax, depreca-tion and amortisation (EBITDA) multiple of 9.4x, leaving scope forsubstantial upside. Moreover, we have not factored in any possibleupside from its seed business (in arrangement with Advanta), whichis currently margin dilutive but is expected to witness an improve-ment in profitability going ahead.
At the current market price of Rs163, the stock is discounting itsFY2010E and FY2011E earnings per share (EPS) at 10.7x and 8.8xrespectively. We initiate coverage on UPL with a Buy recommenda-tion. We arrive at a price target of Rs225 after valuing the companyat 8.5x its FY2011E EV/EBITDA, which is at ~10% discount to itshistorical average and offers 38% upside from the current levels.�
TREND IN ADJUSTED PROFIT GROWTH
TREND IN OPERATING PROFIT AND OPM (%)
In Q1FY2010, UPL registered a 26% year-on-year (y-o-y) increasein its revenues on account of a Rs77-crore income booked from thenewly started seed business. However, the company booked noprofits on the same. As a result, the OPM stood reduced at 18.7%in the first quarter. Importantly, excluding this the OPM for thequarter stood at 19.7%.
Inorganic growth strategy
Over the years, UPL has adopted the strategy of growing inorgani-cally and emerged as a global player. UPL has acquired 21 compa-nies in the past 20 years, thereby growing exponentially with thehelp of this strategy. Consequently, during FY2005-09, UPL’s topline and bottom line grew at a stupendous CAGR of 37% and 32%respectively. Moreover, UPL’s acquisitions like Cerexagri and stakein Advanta have added significant value in terms of allowing it toexpand/enter into newer geographies and introduce new productsin its portfolio.
With a sizeable amount of cash sitting on its balance sheet and acomfortable leverage position (net debt to equity of 0.6x), the com-pany is currently scouting for acquisitions worldwide, as indicatedby the management. We believe this could be the potential triggerfor the next upmove in the stock.
COMPANY NAME LOCATION YEAR OF ACQUISITION
MTM Agro UK 1994
Agrodan Denmark 1996
Devrinol USA 1996
Surflan USA 2004
Ultra Blazer Worldwide 2004
Lenacil Europe 2004
Ag Value Inc USA 2005
SWAL India 2006
STOCK IDEASUnited Phosphorus

September 2009 Sharekhan ValueGuide26
Apollo Tyres 27
Axis Bank 27
Balrampur Chini Mills 28
Bharti Airtel 28
Corporation Bank 29
Deepak Fertilisers & Petrochemicals Corporation 29
Genus Power Infrastructures 30
HCL Technologies 30
Lupin 31
Navneet Publications (India) 31
Network 18 Media & Investments 32
Orbit Corporation 32
SEAMEC 33
Subros 33
Torrent Pharmaceuticals 34
Unity Infraprojects 34
StockUpdate

Sharekhan ValueGuide September 200927
STOCK UPDATE
Rising input cost may jack up tyre priceCOMPANY DETAILS
Price target: Rs53
Market cap: Rs1,999 cr
52 week high/low: Rs44/15
NSE volume (No of shares): 16 lakh
BSE code: 500877
NSE code: APOLLOTYRE
Sharekhan code: APOLLOTYRE
Free float (No of shares): 30.6 cr
(%) 1 m 3 m 6 m 12m
Absolute 14.1 41.2 148.6 17.5
Relative to Sensex 13.4 35.4 50.6 14.0
For further details, please visit the Research section of our website, sharekhan.com
The author doesn’t hold any investment in any of
the companies mentioned in the article.
PRICE PERFORMANCE
APPLE GREEN BUY; CMP: RS40 AUGUST 20, 2009APOLLO TYRES
� According to media reports, Apollo Tyres is contemplating to increase tyre prices in thewake of rising raw material prices. Price of natural rubber, the key input for tyremanufacturers, has inched to around Rs102/kg at present from the low of aroundRs70/kg in January 2009.
� Also a recent rising trend in the prices of crude oil could impact the prices of othercrude- based raw materials such as carbon black, synthetic rubber, nylon tyre cordfabric and rubber chemicals .
� However we do not see any risk to our estimates, as we have factored in the averagerubber price of Rs106/kg for FY2010 and that of Rs119/kg for FY2011.
� The demand environment remains robust. The replacement market has been healthydue to fall in the import of cheap Chinese truck and bus radials, as the government ofIndia has included them in the restricted import list. The replacement demand hasgrown by more than 10% (year to date), which has offset the subdued demand fromthe truck and bus original equipment manufacturers (OEMs). Going forward, webelieve, healthy demand in replacement market and the lower base of last year’s volumefor OEMs will drive the growth in the domestic market. The international operationsare also likely to get support by the upturn in economy in its key markets.
� At the current market price the stock is trading at 5.4x its FY2011 earnings and anenterprise value (EV)/earnings before interest, depreciation, tax and amortisation(EBITDA) of 2.5x. We maintain our Buy recommendation with price target of Rs53.�
SHAREHOLDING PATTERN
Institutions17%
Promoters39%
Foreign12%
Non-promoter corporate
22%
Public & others10%
Price target revised to Rs909COMPANY DETAILS
Price target: Rs909
Market cap: Rs30,407 cr
52 week high/low: Rs969/279
NSE volume (No of shares): 40.7 lakh
BSE code: 532215
NSE code: AXISBANK
Sharekhan code: AXISBANK
Free float (No of shares): 20.8 cr
(%) 1 m 3 m 6 m 12m
Absolute -2.5 37.9 120.5 13.8
Relative to Sensex -8.9 4.5 25.1 5.7
For further details, please visit the Research section of our website, sharekhan.com
The author doesn’t hold any investment in any of
the companies mentioned in the article.
PRICE PERFORMANCE
EMERGING STAR HOLD; CMP: RS845 AUGUST 06, 2009AXIS BANK
The Axis Bank board has approved a proposal to raise tier-I capital via issue of fresh equityshares not exceeding 7.14 crore equity shares through global depository receipts, QIP orpreferential allotment to promoters. This translates into maximum equity dilution of 19.9%based on the bank’s current equity base. At the current market price (Rs850 per share), thebank can raise over Rs6,000 crore, assuming full equity dilution of ~20%. As per ourcurrent estimates, this implies a 50% increase in the FY2010 net worth estimate of ~Rs12,000crore. Consequently, the issue would be book value accretive.
However, despite significant accretion to book that the exercise would result in, one cannotoverlook the substantial equity dilution proposed. This in the near term would have itsimplications on the RoE of the bank. Our back-of-the-envelope calculations indicate thatin the near term the RoE could get compressed to ~15% vs our earlier expectation of~20%. Consequently, the contraction in the valuation multiple assigned to the bank wouldmitigate the impact of the book value accretion. Though the return ratios are likely to remainunder pressure in the near term, we believe a lot will depend on the bank’s strategy regardingthe utilisation of the funds to be mobilised, which could result in potential earnings accretion.This could help the bank in mitigating the pressure on the RoE to a certain extent.
Valuation: We would revise our earnings estimates for the bank after the completion of thebank’s fund raising activity, as further clarity regarding the extent of the equity dilutionand the utilisation of the funds to be raised will emerge only then. However, assuming a fullequity dilution and revising upwards our credit growth estimate for FY2011, we see anupside of ~25-30% to our current book value estimate. Moreover, after factoring in theeffect of the dilution in the valuation multiples assigned to the bank, we arrive at a fair valueof Rs909. At the CMP of Rs845, the stock trades at 10.7x its FY2011E EPS and 2.5x itsFY2011E ABV. The stock offers limited upside from the current levels and hence is likely tounderperform in the near term. Consequently, we maintain our Hold recommendation onthe stock with a revised price target of Rs909.�
SHAREHOLDING PATTERN
MF & FI16.4%
Promoter42.2%
Foreign36.1%
Public & others5.4%

September 2009 Sharekhan ValueGuide28
No risk to estimates from a higher sugar levy quotaCOMPANY DETAILS
Price target: Rs148
Market cap: Rs3,040 cr
52 week high/low: Rs129/30
NSE volume (No of shares): 14.3 lakh
BSE code: 500038
NSE code: BALRAMCHIN
Sharekhan code: BALCHINI
Free float (No of shares): 16.1 cr
(%) 1 m 3 m 6 m 12m
Absolute 9.7 50.2 107.1 28.4
Relative to Sensex 9.4 22.8 25.7 26.4
For further details, please visit the Research section of our website, sharekhan.com
The author doesn’t hold any investment in any of
the companies mentioned in the article.
PRICE PERFORMANCE
EMERGING STAR BUY; CMP: RS119 AUGUST 18, 2009BALRAMPUR CHINI MILLS
The government is mulling increasing the levy quota for sale of sugar from the existing
10% to 20% in a bid to ensure supplies of sugar at affordable prices. Also, the price of
levy sugar is likely to be increased to Rs20 per kg from Rs13 per kg to compensate the
sugar mills.
We see no risk to our earnings estimates for Balrampur Chini mills Ltd (BCML) as we
have factored in a very conservative average realisation of Rs26 per kg for FY2010 and
that of Rs26.2 per kg for FY2011 with cane cost of Rs180 and Rs200 per quintal
respectively. This is much lower than the current average realisation of Rs29-30 kg for
the past few weeks.
Assuming a free sugar sales realisation of Rs29 in FY2010, the average realisation would
decline by 0.7% if a 20% of levy quota is sold at Rs20 per kg. The decline in the average
realisation would be 3.3% if the revised price of Rs20 is applicable for only the incremental
10% quota of levy sugar. However in both cases, the average realisation would still remain
higher than our assumption of Rs26 per kg. We maintain our Buy recommendation on the
stock with a price target of Rs148.�
SHAREHOLDING PATTERN
Promoters37%
Institutions44%
Non promoter corporates
4%
Others15%
GoI fixes 3G reserve priceCOMPANY DETAILS
Price target: Rs453
Market cap: Rs161,362 cr
52 week high/low: Rs495/242
NSE volume (No of shares): 86.8 lakh
BSE code: 532454
NSE code: BHARTIARTL
Sharekhan code: BHARTI
Free float (No of shares): 123.7 cr
(%) 1 m 3 m 6 m 12m
Absolute 1.3 9.6 36.6 8.5
Relative to Sensex -2.5 -2.4 -24.3 -5.4
For further details, please visit the Research section of our website, sharekhan.com
The author doesn’t hold any investment in any of
the companies mentioned in the article.
PRICE PERFORMANCE
APPLE GREEN BUY; CMP: RS425 AUGUST 31, 2009BHARTI AIRTEL
� The government of India has recently fixed the reserve price for pan-India 3G spectrumat Rs3,500 crore (substantially higher than Rs2,020 crore proposed by TRAI earlier).In the initial phase of the auction, only five players will be allowed to offer 3G serviceswith one place reserved for BSNL/MTNL. Further, the government plans to completethe auction in the next 90 days.
� The speedy completion of 3G auctions is encouraging for all telecom companies. How-ever, the exorbitant level of 3G reserve price is seen as negative for all telecom compa-nies, as it would increase the capex and thereby the debt level on the balance sheet.Hence, we do not expect aggressive bidding by many domestic players.
� Assuming a wining bid of Rs6,000 crore for Bharti Airtel, the company’s net debt toequity ratio is expected to get stretched to 0.4x in FY2010 from our current estimate of0.2x. We believe this level of leverage is manageable by Bharti Airtel. In our projectionfor net debt to equity ratio, we have not considered any kind of incremental earningsfrom the launch of 3G services and the additional debt of USD4.1 billion required toacquire 49% stake in MTN Group. However, the impact on net debt to equity ratiomay dilute with incremental earnings from 3G services.
� Given the strength of having the largest subscriber base, we believe Bharti Airtel wouldemerge as the key beneficiary of the launch of 3G services in India. We highlight that theadditional funds of around USD4 billion required to acquire 49% stake in MTNGroup could further strain Bharti Airtel’s balance sheet and increase its interest outgo.
� At the current market price, the stock trades at 14.1x its FY2011 estimated earnings and7.8x enterprise value (EV)/earnings before interest, tax, depreciation and amortisation(EBITDA). We maintain our Buy recommendation on the stock with price target of Rs453.�
SHAREHOLDING PATTERN
Foreign20%
Institutions8%
Promoters68%
Public & Others
1%
Non-promoter corporate
3%
STOCK UPDATE

Sharekhan ValueGuide September 200929
Price target revised to Rs438COMPANY DETAILS
Price target: Rs438
Market cap: Rs5,280 cr
52 week high/low: Rs379/155
NSE volume (No of shares): 1.1 lakh
BSE code: 532179
NSE code: CORPBANK
Sharekhan code: CORPBANK
Free float (No of shares): 6.1 cr
(%) 1 m 3 m 6 m 12m
Absolute 9.3 63.1 115.1 31.6
Relative to Sensex 2.1 23.5 22.0 22.3
For further details, please visit the Research section of our website, sharekhan.com
The author doesn’t hold any investment in any of
the companies mentioned in the article.
PRICE PERFORMANCE
APPLE GREEN BUY; CMP: RS368 AUGUST 06, 2009CORPORATION BANK
RESULT HIGHLIGHTS� Corporation Bank has reported a healthy set of numbers for Q1FY2010, net profit
Rs261.3 crore, up by 41.8% yoy, led by robust treasury gains, stable margins andhealthy business growth during the quarter.
� The NII came in at Rs467.5 crore, up by 23.7% yoy on account of healthy 21.6% y-o-yadvances growth coupled with stable NIM at 2.26% (reported), up marginally by 7bps qoq.
� The non-interest income increased by staggering 128% yoy to Rs359.3 crore mainlydriven by strong treasury gains during the quarter and a robust 38.3% y-o-y growthin core fee income.
� The provision expenses grew sharply by 53.7% yoy to Rs155 crore on account of71.4% yoy increase in NPA provisions and a spike in other provisions due to provi-sions towards wage revision and restructured accounts.
� The asset quality deteriorated during the quarter, as the GNPAs increased by 6.3% yoyand 9.4% qoq to Rs611.6 crore. Notably, the provision coverage ratio improved to78.6% from 75.8% in the previous quarter. The total restructured assets now stand at5.1% of the total outstanding loans, which is largely in line with the quantum ofrestructuring done by its peers.
� The business growth during the quarter was healthy and well ahead of the industrygrowth. The advances grew by 21.6% yoy, while the deposits grew much faster at 31.8%yoy. However, the CASA ratio fell sharply by 800bps qoq and 400bps yoy to 23.3%.
� We have revised our earnings estimates upwards for FY2010 and FY2011 by 8.4%and 4.9% respectively to factor in robust treasury gains, strong core fee income growthand higher-than-expected business growth. At the CMP of Rs368, the stock trades at5.2x FY2011E EPS and 0.9x FY2011E ABV per share. We maintain our Buy recom-mendation on the stock with revised price target of Rs438.�
SHAREHOLDING PATTERN
MF & FI36.7%
Promoter57.2%
Foreign3.5%
Public & others2.7%
Upgraded to BuyCOMPANY DETAILS
Price target: Rs109
Market cap: Rs718 cr
52 week high/low: Rs116/40
NSE volume (No of shares): 2.2 lakh
BSE code: 500645
NSE code: DEEPAKFERT
Sharekhan code: DPKFERT
Free float (No of shares): 5.1 cr
(%) 1 m 3 m 6 m 12m
Absolute -3.3 27.6 59.5 -16.4
Relative to Sensex -10.8 -7.8 -4.8 -24.3
For further details, please visit the Research section of our website, sharekhan.com
The author doesn’t hold any investment in any of
the companies mentioned in the article.
PRICE PERFORMANCE
UGLY DUCKLING BUY; CMP: RS81 AUGUST 03, 2009DEEPAK FERTILISERS & PETROCHEMICALS CORPORATION
RESULT HIGHLIGHTS� For Q1FY2010 DFPCL has reported a net profit of Rs38.9 crore, indicating a drop of
13.3% yoy. The sharp increase in the bottom line was primarily driven by a robustother income during the quarter.
� Though the company has reported a higher than expected bottom line, it has disap-pointed on the top line front. Its net sales contracted by ~27% on both y-o-y and q-o-q bases to Rs238.4 crore, mainly due to a maintenance shutdown at its nitric acid andammonia plants. Besides, the sales from the fertiliser segment too remained subdued onaccount of lower trading activity and a sharp fall in fertiliser prices that resulted in alower realisation on a y-o-y basis.
� The other income came in at Rs24.2 crore led by a Rs10.2-crore dividend income from thesubsidiaries. Excluding this, the other income came in at Rs14 crore vs Rs4 crore in Q1FY2009on account of a Rs9-crore forex gain booked by the company during the quarter.
� Despite a sharp drop in the top line, the decline in the operating profit was lower, as thecompany recorded a sharp 319bps y-o-y increase in its OPM during the quarter to23.8%. The significant improvement in the OPM was driven by a 400bps y-o-y im-provement in the EBIT margin in the fertiliser segment, which partially made good forthe 270bps y-o-y contraction in the margin in the chemical segment.
� We have fine-tuned our earnings estimates for FY2010 and FY2011 to factor in thecompany’s Q1FY2010 performance. At the CMP of Rs81, the stock is trading at 4.6xits FY2011E EPS and 5.2x its FY2011E EV/EBITDA. After the recent price correction,the stock offers a healthy upside of over 30% from the current levels. Consequently, weare upgrading the stock to Buy from Hold recommendation but maintaining the pricetarget of Rs109.�
SHAREHOLDING PATTERN
MF & FI20.9%
Promoter42.6%
Foreign6.9%
Public & others29.6%
STOCK UPDATE

September 2009 Sharekhan ValueGuide30
Price target revised to Rs288COMPANY DETAILS
Price target: Rs288
Market cap: Rs237 cr
52 week high/low: Rs349/62
NSE volume (No of shares): 38,030
BSE code: 530343
NSE code: GENUSOVERE
Sharekhan code: GENUSOVER
Free float (No of shares): 0.9 cr
(%) 1 m 3 m 6 m 12m
Absolute -4.6 38.2 91.2 -44.1
Relative to Sensex -14.3 5.7 18.7 -47.2
For further details, please visit the Research section of our website, sharekhan.com
The author doesn’t hold any investment in any of
the companies mentioned in the article.
PRICE PERFORMANCE
UGLY DUCKLING BUY; CMP: RS160 AUGUST 17, 2009GENUS POWER INFRASTRUCTURES
� Genus Power Infrastructures Ltd (GPIL) has declared its audited numbers for FY2009,accounting for certain (explained below) one-time losses that had resulted in a cumula-tive write-off of Rs35.4 crore during the fiscal.
� In FY2009, the company had written off Rs36.32 crore towards various deductionsmade by its customers. These losses, as the management has indicated, pertained toproject delays and goods returned over the previous three to four years. The write-offwas of one-time in nature. Currently, GPIL does not make any provisions for anyunforeseen situations (eg project delays) in project execution and this could affect thecompany’s profitability. In order to avoid similar write-offs in future the company aimsto start making provisions for unforeseen situations from FY2010 onwards. In fact, ithas already made a provision of about Rs1.7 crore in Q1FY2010. Hence, this wouldnegate the risk of a cumulative write-off at the end of a year.
� Last fiscal, the company had also booked a loss of Rs3.1 crore from the sale of itsinvestment in Individualiza SA, Brazil. GPIL held a 50% stake in the Brazilian jointventure that was involved in trading in Brazil.
� We have revised downwards our estimates for the period FY2010-11 by 3.3-3.5% tofactor in the contraction in the margins to be caused by the provisions likely to be madeby the company during this period. Our FY2010 and FY2011 earnings per share(EPS) estimates now stand at Rs45.6 and Rs59.4 respectively. We have also revised ourprice target for the stock to Rs288 per share. We maintain our Buy recommendationon the stock. At the current market price the stock is trading at 3.5x and 2.7x FY2010and FY2011 EPS estimates.�
SHAREHOLDING PATTERN
Promoters39%Others
48%
Institutions3%
Foreign10%
Price target revised to Rs343COMPANY DETAILS
Price target: Rs343
Market cap: Rs20,707 cr
52 week high/low: Rs315/89
NSE volume (No of shares): 2.7 lakh
BSE code: 532281
NSE code: HCLTECH
Sharekhan code: HCLTECH
Free float (No of shares): 10.3 cr
(%) 1 m 3 m 6 m 12m
Absolute 23.7 73.8 190.3 38.5
Relative to Sensex 21.6 53.2 62.5 26.1
For further details, please visit the Research section of our website, sharekhan.com
The author doesn’t hold any investment in any of
the companies mentioned in the article.
PRICE PERFORMANCE
APPLE GREEN HOLD; CMP: RS307 AUGUST 25, 2009HCL TECHNOLOGIES
RESULT HIGHLIGHTS
� The consolidated revenues grew by 1.6% sequentially to Rs2,908.5 crore. In dollarterms, the revenues grew by 7.6% sequentially to US$607.2 million due to favourablecross-currency movement (3.7%). In constant currency terms, the revenues grew by3.9% sequentially driven by volume growth (2.7%).
� The EBIT margin improved by 164 basis points to 22.1% in Q4FY2009 on account ofhigher number of working days (70 basis points) and efficiency gains (146 basis points).
� The net income grew by 51.4% sequentially to Rs330.1 crore, above our expectationof Rs224 crore due to better-than-expected operating performance and lower-than-expected forex losses. The company reported forex losses of Rs88.6 crore in Q4FY2009v/s Rs201.6 crore in Q3FY2009.
� The unrecognised forex losses sitting on the balance sheet have also fell sharply toUS$161 million in the quarter from US$225 million in the previous quarter.
� Recently RDA, from whom HCL Tech bagged one long-term deal (worth US$350million) in March 2009, has filed for chapter 11 bankruptcy for restructuring its debt.While HCL Tech mentioned that the development would not impact RDA’s engage-ment with HCL Tech as informed by RDA, we believe this may delay the execution ofdeal from RDA’s end due to its difficult financial condition.
� We have fine-tuned our earning estimates upward to reflect better operating perfor-mance as well as to incorporate sharp reduction in unrecognised forex losses. wemaintain our Hold recommendation on the stock with a revised price target of Rs343.�
SHAREHOLDING PATTERN
Promoters67%
Non-promoter corporate
3%
Institutions23%
Public & Others
6%
STOCK UPDATE

Sharekhan ValueGuide September 200931
Price target revised to Rs1,181COMPANY DETAILS
Price target: Rs1,181
Market cap: Rs8,273 cr
52 week high/low: Rs1,009/518
NSE volume (No of shares): 17.8 lakh
BSE code: 500257
NSE code: LUPIN
Sharekhan code: LUPLTD
Free float (No of shares): 4.1 cr
(%) 1 m 3 m 6 m 12m
Absolute 25.2 25.5 59.2 36.5
Relative to Sensex 12.5 -1.4 1.6 36.2
For further details, please visit the Research section of our website, sharekhan.com
The author doesn’t hold any investment in any of
the companies mentioned in the article.
PRICE PERFORMANCE
APPLE GREEN BUY; CMP: RS995 AUGUST 11, 2009LUPIN
We reviewed the recently released annual report of Lupin. The highlights of this report arepresented below.� The domestic formulation business continues to outpace the industry growth of 10%
by growing at 20.2% driven by Lupin's renewed focus on chronic therapies. It’s strat-egy of focusing on niche products in the USA and the EU has enabled it to register agrowth of 61% in the formulation segment. Lupin has identified the oral contraceptivemarket and ophthalmology as the new growth engines for the US market.
� Lupin has started investing in creation of biological capabilities (seven proteins indifferent stages of development). Further, it has a healthy Para IV pipeline of eight FTFopportunities and seven ANDA filed in the niche area of oral contraceptives.
� Despite spending on acquisitions (~Rs1.8 billion), R&D- 7% of sales and capacityexpansions during the year, Lupin’s cash flow remains healthy (operating cash flowhas doubled to Rs469.5 crore).
� Lupin hedges about 1/3rd of its exports. It has a derivative exposure of $488mn largelyon account of cash flow hedges and interest rate swap contracts worth $405.5mn.Given the volatility in the forex markets, Lupin incurred MTM losses of Rs276.6 croretransferred directly on the balance sheet.
� The capex- ~Rs350 crore increased sharply due to capacity expansions for new thera-peutic areas at its Indore SEZ and its Biotech facility in Pune. Lupin spent Rs452.2crore on acquisitions in the last two years. The goodwill created (74% of acquisitioncosts) for these acquisitions is Rs333.1 crore.
� Lupin’s RoCE at 24.8% and RoNW at 37.5% witnessed a significant rise led by betterproduct and market mix and sizeable gains from its acquisitions of Kyowa (Japan) andPharma Dynamics (South Africa).
� At the CMP of Rs995, the stock trades at 14.2x FY2010E fully diluted earnings and at 12.2xFY2011E fully diluted earnings. We maintain Buy with a revised price target of Rs1,181.�
SHAREHOLDING PATTERN
Price target revised to Rs107COMPANY DETAILS
Price target: Rs107
Market cap: Rs866 cr
52 week high/low: Rs101/35
NSE volume (No of shares): 1.8 lakh
BSE code: 508989
NSE code: NAVNETPUBL
Sharekhan code: NAVNEET
Free float (No of shares): 3.6 cr
(%) 1 m 3 m 6 m 12m
Absolute 7.9 85.0 138.0 35.4
Relative to Sensex 0.7 31.6 35.7 23.1
For further details, please visit the Research section of our website, sharekhan.com
The author doesn’t hold any investment in any of
the companies mentioned in the article.
PRICE PERFORMANCE
EMERGING STAR BUY; CMP: RS91 AUGUST 04, 2009NAVNEET PUBLICATIONS (INDIA)
RESULT HIGHLIGHTS
� NavneetQ1FY2010 results were below our expectations, as the top line grew by just7.9% yoy to Rs262.0 crore during the quarter.
� The publication division registered a modest growth of 4.0% yoy to Rs159.1 croreduring the quarter much in line with our expectations. The stationery division regis-tered a revenue growth of just 14.1% yoy to Rs100.3 crore.
� The OPM expanded by 127 basis points yoy to 28.5% in the quarter, mainly onaccount of a 131-basis-point y-o-y decline in the other expenditure as percentage tosales. Thus the operating profit grew by 12.9% yoy to Rs74.8 crore during the quarter.
� Lower interest cost coupled with lower incidence of tax led to a 17.2% y-o-y increase inthe adjusted net profit to Rs48.3 crore in Q1FY2010.
� We believe the publication division is likely to post higher growth numbers beginningFY2011, as syllabus changes in the two states have been initialised. Also, with thestationery division likely to post 25%+ growth rate in the coming years, we expectNavneet’s top line to grow at a CAGR of 16.3% over FY2009-11 and the bottom lineto grow at a CAGR of 21.4% over FY2009-11.
� At the current market price the stock trades at 12.0x its FY2010E of Rs7.6 and 9.9x itsFY2011E of Rs9.1. As we see the revenues of the publication division to pick upsignificantly from FY2011 on the back of syllabus changes, we assign a valuation thatis 10% higher than the historic average of 10.6x 1-year forward. Thus we value thestock at 11.7x its FY2011E earnings and revise our price target to Rs107 and maintainour Buy recommendation on the stock.�
SHAREHOLDING PATTERN
Foreign28%
Promoter52%
Public13%
Institutions3%
Non-promoter4%
Promoters62%Institutions
8%
Others30%
STOCK UPDATE

September 2009 Sharekhan ValueGuide32
Price target revised to Rs143COMPANY DETAILS
Price target: Rs143
Market cap: Rs949 cr
52 week high/low: Rs210/59
NSE volume (No of shares): 67,302
BSE code: 532798
NSE code: NETWORK18
Sharekhan code: NETWORK18
Free float (No of shares): 4.9 cr
(%) 1 m 3 m 6 m 12m
Absolute -5.1 -23.7 42.9 -46.1
Relative to Sensex -7.7 -32.3 -20.1 -51.8
For further details, please visit the Research section of our website, sharekhan.com
The author doesn’t hold any investment in any of
the companies mentioned in the article.
PRICE PERFORMANCE
EMERGING STAR BUY; CMP: RS99 AUGUST 28, 2009NETWORK 18 MEDIA & INVESTMENTS
Following are the highlights of Network18’s annual report for FY2009:
� Fiscal year 2009 was an extremely difficult year for the Network18 group. With themajority of its businesses being in an expansion mode, the downturn in the advertise-ment market affected the group’s operating performance adversely. Thus while thecompany recorded an increase of 17% year on year (yoy) to Rs760.2 crore, it had anoperating loss of Rs200 crore and a net loss of Rs181.9 crore for the year.
� Raised ~Rs204 crore through the issue of partly convertible preference shares and an-other ~Rs50 crore through the conversion of one crore warrants by promoters. The debtas on the Balance Sheet date increased by ~Rs300 crore to Rs1,385 crore in FY2009.
� Also, after FY2009 the company has raised another ~Rs525 crore till date throughequity issuance and its debt level has also increased to ~Rs1,800 crore. The equity ofthe company has expanded 2.25x FY2008 till date. The recent equity infusions haveled to the trimming down of its gearing ratio from 2.9x as on March 31, 2009 to 1.7xas on date. With ~Rs1,150 crore cash on books we believe that this is sufficient to meetthe funding requirements in the near term.
Outlook and valuation
FY2009 was a year of severe pressure in terms of both operations and fund availability. Inour opinion, things are unlikely to get any worse. We maintain our Buy recommendationon the stock with a sum-of-the-parts price target of Rs143.�
SHAREHOLDING PATTERN
QIP to dilute earningsCOMPANY DETAILS
Price target: Rs208
Market cap: Rs649 cr
52 week high/low: Rs328/38
NSE volume (No of shares): 5.7 lakh
BSE code: 532837
NSE code: ORBITCORP
Sharekhan code: ORBITCORP
Free float (No of shares): 1.4 cr
(%) 1 m 3 m 6 m 12m
Absolute 45.2 116.7 242.1 -34.7
Relative to Sensex 30.5 65.8 112.3 -38.3
For further details, please visit the Research section of our website, sharekhan.com
The author doesn’t hold any investment in any of
the companies mentioned in the article.
PRICE PERFORMANCE
UGLY DUCKLING HOLD; CMP: RS179 AUGUST 17, 2009ORBIT CORPORATION
� Orbit Corporation (Orbit) has announced that pursuant to shareholders’ approvalfor the proposed qualified institutional placement (QIP) of up to Rs500 crore, theauthorised directors committee of the company has closed the bid period for the QIPand approved the QIP for Rs145 crore (issuance of 78.4 lakh shares at Rs185 per share).
� The funds raised from the QIP would be used partly to fund the ongoing projects andpartly to finance the acquisition of new re-development properties in south Mumbai.The QIP has marginally reduced the concern with regard to Orbit’s high leverageposition. After the QIP, Orbit’s debt-to-equity ratio is likely to come down to 1.0xfrom 1.3x reported in Q1FY2010.
� However, the QIP is likely to expand Orbit’s fully diluted equity base by 17.3% to 5.3crore shares. In terms of earnings, the sharp dilution in the earnings from the expan-sion in the equity base is likely to be partially offset by the interest savings on the debtto be repayed (assuming debt repayment of Rs100 crore). Consequently, we expect theearnings to get diluted by ~7-8%. Hence, the equity dilution is likely to remain anoverhang on the stock in the near term.
� In its recent management commentary, Orbit allayed the concern related to its perfor-mance in terms of sales volumes. The funds raised through the QIP are also likely tomarginally reduce the concern over the company’s high leverage position. However,this QIP is likely to result in an earnings dilution and is likely to remain an overhang onthe stock in the near term. Hence, we maintain our Hold recommendation on the stockwith the price target of Rs208. At the current market price, the stock is trading at 8.6xFY2011 earnings estimate and 1.1x FY2011 price/book value.�
SHAREHOLDING PATTERN
Promoters49%
Institutions21%
Non promoter corporates
13%
Others17%
Others15%
Public14%
Promoters60%
Institutions4%
FII7%
STOCK UPDATE

Sharekhan ValueGuide September 200933
Extension of contract for SEAMEC II—positiveCOMPANY DETAILS
Price target: Rs258
Market cap: Rs640 cr
52 week high/low: Rs206/30
NSE volume (No of shares): 79,741
BSE code: 526807
NSE code: SEAMECLTD
Sharekhan code: SEAMECLTD
Free float (No of shares): 0.85 cr
(%) 1 m 3 m 6 m 12m
Absolute 29.2 69.7 329.1 42.2
Relative to Sensex 15.9 36.4 168.4 42.2
For further details, please visit the Research section of our website, sharekhan.com
The author doesn’t hold any investment in any of
the companies mentioned in the article.
PRICE PERFORMANCE
UGLY DUCKLING BUY; CMP: RS189 AUGUST 13, 2009SEAMEC
Contract for SEAMEC II extended till September 09, 2009—positive impact on
CY2009E EPSSeamec has announced that the contract for the deployment of vessel SEAMEC II withRana Diving has been extended by one month till September 09, 2009 at USD95,000 perday. After the completion of the contract with Rana Diving, the vessel would be deployedwith Dulam, which whom it has singed 12 month contract at ~USD44,700 per day.
With the extension of the contract with Rana Diving at USD 95000 per day against for onemonth against our earlier expectation that the vessel would be deployed with Dulam forthat month, we have increased our revenue and earnings estimate for CY2009 by 2.3%and 4.3% respectively. Our revised CY2009 earnings estimate stands at Rs44.9 per share.
SEAMEC III continues to be deployed with Condux—no impact on estimatesSEAMEC III had a contract with Cobndux till August 3, 2009 with an option of extension.In its announcement, it mentioned that the vessel continues to be deployed with ConduxSA de CV, Mexico. We have already built in extension for this contract into our estimates.Hence, we do not expect any impact of this development on our estimates.
Valuation and viewWith the improvement in the macro situation and re-bound in the crude oil prices, weexpect E&P activities to increase in the medium term, thereby boosting the E&P capitalexpenditure globally. Moreover, the company is confident that all of its four vessels wouldget deployed, going forward. Considering strong return ratios and debt-free status, thestock appears to be trading at attractive valuations of 4.2x CY2009E earnings and 7.3xCY2010E earnings. We maintain buy with price target of Rs258.�
SHAREHOLDING PATTERN
Promoters75%
Foreign2%Public &
Others14%
Institutions6%
Non-promoter corporate
3%
Price target revised to Rs42COMPANY DETAILS
Price target: Rs42
Market cap: Rs209 cr
52 week high/low: Rs40/14
NSE volume (No of shares): 70,403
BSE code: 517168
NSE code: SUBROS
Sharekhan code: SUBROS
Free float (No of shares): 3.6 cr
(%) 1 m 3 m 6 m 12m
Absolute 25.4 29.0 128.6 14.1
Relative to Sensex 22.8 13.5 28.7 3.9
For further details, please visit the Research section of our website, sharekhan.com
The author doesn’t hold any investment in any of
the companies mentioned in the article.
PRICE PERFORMANCE
UGLY DUCKLING BUY; CMP: RS35 AUGUST 26, 2009SUBROS
� Subros, the market leader in auto air conditioning business, is benefiting from revival inthe volumes of its key customers Maruti Suzuki India (Maruti), Tata Motors andMahindra & Mahindra (M&M).
� Due to its market leadership Subros also has exclusive supply contracts for some of thelatest launched products such as Maruti’s A-Star and Ritz and M&M’s Xylo. Thecompany will also start supplying air conditioners to Tata Motors’ Nano from Janu-ary 2010.
� In a recent interaction, the company’s management indicated that it is planning torevive its capital expenditure (capex) plans and enhance its manufacturing capacityfrom 0.75 million units to 1 million units by the end of the current financial year. Itwould incur capex of around Rs70 crore over the next two years.
� Given the improvement in demand environment and lower base of FY2009, we expectthe company to report a stellar compounded annual growth rate (CAGR) of 38.2% inthe net profit for FY2009-2011. Apart from double-digit volume growth, the earningsgrowth would also be aided by lower interest outgo. Consequently, we have revised ourestimates sharply upwards for FY2010 and FY2011 by 12.5% and 40% to Rs3 andRs4.2 respectively.
� At the current market price the stock is trading at 8.3x its FY2011E earnings andenterprise value (EV)/earnings before interest, tax, depreciation and amortisation(EBITDA) of 3.2x. We maintain Buy recommendation on the stock with revised pricetarget of Rs42.�
SHAREHOLDING PATTERN
Promoters40%
Foreign27%
Institutions14%
Public & Others19%
STOCK UPDATE

September 2009 Sharekhan ValueGuide34
Another strong quarterCOMPANY DETAILS
Price target: Rs260
Market cap: Rs1,737 cr
52 week high/low: Rs229/112
NSE volume (No of shares): 14,036
BSE code: 500420
NSE code: TORNTPHARM
Sharekhan code: TORRPH
Free float (No of shares): 2.4 cr
(%) 1 m 3 m 6 m 12m
Absolute 16.4 44.3 69.6 18.7
Relative to Sensex 5.2 10.3 0.9 13.9
For further details, please visit the Research section of our website, sharekhan.com
The author doesn’t hold any investment in any of
the companies mentioned in the article.
PRICE PERFORMANCE
UGLY DUCKLING BUY; CMP: RS205 AUGUST 07, 2009TORRENT PHARMACEUTICALS
RESULT HIGHLIGHTS
� Torrent’ total operating income grew by 23.2% to Rs481.1 crore for Q1FY2010 andwas driven by strong growth across international businesses (up 26.5%) and steadytraction in the domestic business (up 18.6%).
� While Brazil, Europe and the RoW markets (up 26.9%) continued their buoyant per-formance, the CIS region (down by 12.5%) continued to face pricing pressures andliquidity crunch.
� Heumann grew by impressive 30.8% on the back of new introductions and highervolume growth in existing products. However, on account of uncertain market condi-tions prevailing in Germany (with shift to tender-based system) future prospects ofHeumann remain blurry.
� The OPM expanded by 260bps to 20.0% on the back of improved gross margins and highersales volume in both domestic and international businesses. Consequently, the operatingprofit grew by 41.7% to Rs96.3 crore. We expect Torrent’s margins to moderate slightlygoing forward on the back of hazy performance expected from Heumann and Russia.
� Torrent’s reported net profit declined by 69.3% to Rs15.1 crore pursuant to changesproposed in the Union Budget 2009 based on which the MAT credit entitlement ofRs53 crore, recognised in earlier years was written off during the quarter. ExcludingMAT credit entitlement in both the quarters the PAT grew by 55%, ahead of ourestimates. The adjusted EPS stood at Rs8.0.
� We expect the revenue to show a CAGR of 12.6% over FY2009-11E and the earningsCAGR of 14.2% over FY2009-11E. At the CMP of Rs205, Torrent is discounting itsFY2010E earnings by 8.4x and its FY2011E earnings by 6.9x. We maintain Buy witha price target of Rs260.�
SHAREHOLDING PATTERN
Promoter71%
Institutions6%
Foreign7%
Public12%
Non-Promoter4%
Price target revised to Rs430COMPANY DETAILS
Price target: Rs430
Market cap: Rs475 cr
52 week high/low: Rs484/67
NSE volume (No of shares): 32,788
BSE code: 532746
NSE code: UNITY
Sharekhan code: UNITYINFRA
Free float (No of shares): 0.4 cr
(%) 1 m 3 m 6 m 12m
Absolute 8.7 220.6 241.6 -12.5
Relative to Sensex 0.2 131.7 104.0 -20.8
For further details, please visit the Research section of our website, sharekhan.com
The author doesn’t hold any investment in any of
the companies mentioned in the article.
PRICE PERFORMANCE
VULTURE’S PICK BUY; CMP: RS355 AUGUST 03, 2009UNITY INFRAPROJECTS
RESULT HIGHLIGHTS
� Unity Q1FY2010 revenues grew by 24.6% year on year (yoy) to Rs278.6 crore.
� The OPM improved 102 bps to 13.6%, above our expectation of 12.9%. The higherthan anticipated OPM was due to reduction in the raw material cost (46 basis points)and staff cost (40 basis points).
� The net income rose by 1% yoy to Rs15.8 crore, above our expectation of Rs14.6crore, due to better-than-expected OPM and lower-than-expected interest expenses.
� The order book stood at Rs2,417.3 crore, 2.1x FY2009 revenues. Apart from this, thecompany is L-1 bidder for orders aggregating Rs400-500 crore and appears to bepositive on order inflow going forward. We highlight that though the company expectsstrong order inflow, we have factored in a flat order inflow in FY2010 due to upcom-ing election in Maharashtra, Unity’s major operating geography.
� Unity is looking to raise Rs220-Rs250 crore through QIP. The proceeds raised wouldbe used for meeting the working capital requirement and repaying the debt. As per ourrough working, QIP would be priced in the range of Rs405-555 per share in order to beearnings dilutive in the range of 5-15% and funds requirement of Rs220-Rs250 crore.
� We have fine-tuned our FY2010 and FY2011 earnings estimates. Furthermore, giventhe improvement in the macro environment, we have also revised Unity’s target mul-tiple to 7x (~50% discount to the current multiple of the basket of mid-cap construc-tion companies). We maintain our Buy recommendation on the stock with the revisedprice target of Rs430.�
SHAREHOLDING PATTERN
Promoters70%
MF / Institutions
8%
FIIs7%
Others15%
STOCK UPDATE

Sharekhan ValueGuide September 200935
SHAREKHAN SPECIAL
SHAREKHAN SPECIAL OCTOBER 06, 2008
Monthly economy reviewSHAREKHAN SPECIAL AUGUST 25, 2009
Economy: IIP growth surprises on upside
� In June 2009, India’s trade deficit, though lower by 32.5% yearon year (yoy), grew by 4% month on month (mom; the thirdconsecutive sequential increase) and stood at USD6.2 billion.The exports contracted by 29.2% yoy while the imports fell by39.2% yoy during the month. Though the pace of the decline inexports has moderated, we believe there is still some time beforewe could see a conclusive recovery in exports.
� The Index of Industrial Production (IIP) continued its upwardmarch in June 2009, as it jumped by 7.8% yoy as comparedwith the 2.2% year-on-year (y-o-y; revised) growth seen in theprevious month. The improvement in industrial productionprimarily stemmed from a smart uptick in the mining and manu-facturing output during the month. The output of the miningsegment grew by 7.5% yoy, the growth was the highest sinceNovember 2007. Besides, the manufacturing and the electricitysegments recorded a growth of 3.2% and 6.1% respectively inthe same month. The improvement in the IIP growth rate isquite encouraging and signals the early signs of recovery. How-ever, the trend needs to be sustained in the coming months topronounce a full-fledged recovery. Many of the important indi-cators (like credit growth and exports) are yet to revive, leadingus to believe that a conclusive recovery remains illusive. Havingsaid that, the second half of the current fiscal should see furtherimprovement in the overall economic activity and hence in theindustrial production growth rate as well.
� After entering the negative zone in the last month, the inflationrate remained negative well through the past few weeks andcame in at –1.53% for the week ended August 8, 2009. At –1.53% the inflation rate inched up on a week-on-week (w-o-w)basis from –1.74% in the previous week. The negative inflationrate is mainly due to the high base effect and not due to anyactual fall in prices. However, the inflation rate is likely to pickup in H2FY2010 as the favourable base effect wears off and theeconomy recovers, pushing up the overall consumption demand.
� Globally, the real economies have shown some early signs ofrevival with the major developed economies witnessing a steadyimprovement in the economic activity. Meanwhile, the emergingeconomies too are bucking the trend as can be seen from themovement in their leading indicators. However, the situationhas still not improved completely as some macro head windspersist (read more under “Global round-up”).
Banking: Bond yield inching up
� The non-food credit growth for the industry has inched upmarginally to 15.9% yoy (as on July 31, 2009) after touching alow of 15.2% in the June 2009. Moreover, the deposit growthfor the industry has remained fairly stable at 21.8% vs 21.6%in the previous month.
� In line, the incremental credit-deposit (ICD) ratio slipped to52% from 53.3% in the previous month. However, the deploy-ment rate (ie the credit-deposit [CD] ratio) has remained largelystable at ~68% on a month-on-month (m-o-m) basis.
� The money supply (M3) growth improved marginally to 20%(as on July 31, 2009) as compared with 19.8% in the previousmonth.
� The yields on government securities (G-Secs; ten-year) stood at7.24% as on August 21, 2009, up from 7.15% seen in theprevious month. The yields for longer and short maturities haveinched up following the upward revision in the borrowingprogramme of the government. Importantly, the yields onshorter maturities (one to three years) have hardened more thanthat on longer maturities, which bodes ill for the treasury per-formance of banks.
Equity markets: Volume growth takes a pause
� During the month-till-date (MTD) period (August 1-21, 2009)the average daily volumes in the futures and options (F&O)remained largely flat while the same contracted for the cashsegment. In July 2009 the average daily volume in the F&O andcash segments declined by 1.8% mom and 15.8% mom respec-tively. During the MTD period in August 2009 (ie August 1–21, 2009), the average daily volume in the F&O and cash seg-ments fell by 0.7% and 7.5% respectively.
� On the mutual fund (MF) front, the total industry assets undermanagement (AUMs) in July 2009 grew by a healthy 30.4%yoy; the growth was higher compared with the 18.7% y-o-ygrowth seen in the previous month. On an m-o-m basis, thetotal industry AUMs grew by 3.1% vs a 5% increase seen in theprevious month and stood at Rs690,679 crore as in July 2009.
Insurance: A steeper decline
� After declining by 8% yoy in the previous month, the annualisedpremium equivalent (APE) for the life insurance industry con-tracted by 13.1% yoy in June 2009. Though the APE for theprivate players declined sharply by 25.3% yoy, the decline inthe industry’s APE was partially mitigated by a healthy 8.7% y-o-y increase in the APE of LIC.
� In June 2009, the growth in the gross premium underwrittenfor the general insurance industry picked up to 6.4% yoy from3.2% in the previous month. Notably, the growth was equallydriven by public sector players and private sector players whocontributed 6.3% and 6.5% growth respectively.
Outlook for banking sector
Since our last issue (Sharekhan Monthly Economy Review datedJuly 23, 2009), the BSE Bankex has performed largely in line withthe broader market (BSE Sensex). In absolute terms, both the indi-ces have increased by ~1.5% since then on account of positive glo-bal cues coupled with earnings revision after a healthy Q1FY2010earnings season. The strong correlation between the Bankex andthe Sensex implies that the banking stocks are tuned in to domesticand global macro movements with no strong trigger in the nearterm. With valuations near ripe, further upside has to be backed byfundamentals (revival in credit growth/stability in bond yields/fur-ther easing in asset quality concerns).�

September 2009 Sharekhan ValueGuide36
MUTUAL FUNDS
Last month, after the Union Budget failed to live up to the market’sexpectations, the market went into a tailspin, dropping from 14913to 13,400 in a matter of just six trading sessions. The downwarddrift continued till India Inc lent a helping hand by announcingmuch better than expected results for the first quarter of FY2010.
The earnings of Sensex companies (ex-oil companies) declined byjust 1.1% year on year (yoy) in the first quarter. The decline wasmuch lower than our estimate of a 4.9% drop yoy and the 8.8%year-on-year fall seen in Q4FY2009. In fact, excluding the real estateand metal companies, the Sensex’ earnings grew by 4.1% yoy in thequarter. The performance was much better than expected due toimproving operating margins on the back of a lower raw materialcost, a stronger rupee and the benefits of cost rationalisation.
The strong Q1 performance has triggered earnings upgrades. TheSensex’ consensus earnings estimate (as per Bloomberg) for bothFY2010 and FY2011 has been raised by 2.3% after the announce-ment of the Q1 results. In our universe of active coverage, the earn-ings estimate upgrades have exceeded downgrades after a gap offive quarters. This development is in line with our view expressed inour latest Market Outlook report (“Fundamentals come to thefore now”, dated July 7, 2009) that the downgrade cycle has bot-tomed out and the expected earnings upgrades could support fur-ther upside in the markets.
Whilst the encouraging Q1 performance indicates a turn-around inthe earnings cycle, the markets were also boosted by positive globalcues and improving economic data in both the USA and Europe.However, the concerns are emerging from China. A bubble seemsto be in the making in China, which despite a 20% drop in itsexports continues to grow at a fast clip of 8% per annum on theback of forced bank lending (Rmb7,400 billion in the first half of2009 alone) and a massive government stimulus package. Thougha growing China ought to be good news for the global economy,there are now concerns that the Chinese economy may be on acrash course, thanks to the Chinese government’s method of artifi-cially stimulating it by pushing up investments. Thus, bank fundedinvestments have soared, accounting for 88% of the Chinese grossdomestic product (GDP) growth in H1CY2009. If the Chinesebubble indeed bursts, it will be a major setback for the beleagueredglobal economy and take its toll on India as well.
Another of the market’s concern is homegrown: the monsoon con-tinues to be deficient this year. Though the seasonal deficiency inrainfall has come down from 54% in June to 19% in July, whichreceived normal 90%+ rainfall, the rainfall remains below the long-period average (LPA). Moreover, August has commenced on a nega-tive note with the rainfall for the week ended August 5, 2009 esti-mated at 66% below the LPA. A poor monsoon could stoke infla-tion again especially in food items. More importantly, it could seri-ously dent rural demand, thereby turning out to be a key risk tofurther earnings upgrades in consumer-driven sectors such as au-tomobiles, consumer goods and cement.
The good news is that after the clear mandate of the United ProgressiveAlliance government and the relatively much better GDP growth out-look for India, the interest of foreign institutional investors remainsstrong in India. They had pumped in Rs11,066 crore in the Indianmarket in July 2009. In the first two days of August also, the FIIs
Sharekhan’s top equity fund picksMUTUAL GAINS AUGUST 12, 2009
OPPORTUNITIES CATEGORY
Scheme Name NAV Returns as on Jul 31, 09 (%)
3 Months 1 Year 2 Years
DBS Chola Opportunities 35.30 48.19 8.22 4.01
DWS Investment Opp 30.73 36.15 1.89 3.96
ICICI Prudential Discovery 31.40 56.37 27.07 4.52
IDFC Imperial Equity 16.18 31.52 21.92 9.13
UTI Opportunities 20.47 40.40 29.80 10.73
Indices
BSE Sensex 15670.31 37.42 9.16 0.38
AGGRESSIVE FUNDS
MID-CAP CATEGORY
Scheme Name NAV Returns as on Jul 31, 09 (%)
3 Months 1 Year 2 Years
Birla Sun Life Mid Cap 81.75 60.11 19.10 0.90
IDFC Premier Equity 21.47 44.65 15.74 10.37
Reliance Growth 351.49 44.71 10.72 4.13
Sundaram BNP Paribas 105.90 60.00 15.89 1.82Select Midcap
Indices
BSE Sensex 15670.31 37.42 9.16 0.38
bought Indian equities to the tune of Rs787 crore at the net level, liftingthe market to a 14-month high of 15,963 on an intra-day basis.
We have identified the best equity-oriented schemes available in themarket today based on the following three parameters: the pastperformance as indicated by the one and two year returns, theSharpe ratio and Fama (net selectivity).
The past performance is measured by the one- and -two year re-turns generated by the scheme. Sharpe indicates risk-adjusted re-turns, giving the returns earned in excess of the risk-free rate foreach unit of the risk taken. The Sharpe ratio is also indicative of theconsistency of the returns as it takes into account the volatility inthe returns as measured by the standard deviation.
FAMA measures the returns generated through selectivity, ie thereturns generated because of the fund manager's ability to pick theright stocks. A higher value of net selectivity is always preferred asit reflects the stock picking ability of the fund manager.
We have selected the top 10 schemes upon ranking on each of theabove four parameters and then calculated the mean value of eachof the four parameters for the top 10 schemes. Thereafter, we havecalculated the percentage underperformance or over performanceof each scheme (relative performance) in each of the four param-eters vis a vis their respective mean values.
For our final selection of schemes, we have generated a total scorefor each scheme giving 30% weightage each to the relative perfor-mance as indicated by the one and two year returns, 30% weightageto the relative performance as indicated by the Sharpe ratio and theremaining 10% to the relative performance as indicated by theFAMA of the scheme.
All the returns stated on next page, for less than one year are abso-lute and for more than one year, the returns are annualised.

Sharekhan ValueGuide September 200937
VIEWPOINT
Every individual has a different investment requirement, which depends on hisfinancial goals and risk-taking capacities. We at Sharekhan first understand theindividual’s investment objectives and risk-taking capacity, and then recom-mend a suitable portfolio. So, we suggest that you get in touch with our MutualFund Advisor before investing in the best funds.�
The author doesn’t hold any investment in any of the companies mentioned in the article.
THEMATIC/EMERGING TREND FUNDS
Scheme Name NAV Returns as on Jul 31, 09 (%)
3 Months 1 Year 2 Years
Birla Sun Life Dividend Yield Plus 56.97 44.19 31.75 8.77
ICICI Prudential Infra 25.66 27.98 4.61 6.03
Templeton India Growth 89.13 43.01 12.58 7.30
UTI Contra 11.89 37.46 24.90 7.54
UTI Dividend Yield 22.70 35.28 21.33 10.64
Indices
BSE Sensex 15670.31 37.42 9.16 0.38
EQUITY DIVERSIFIED/CONSERVATIVE FUNDS
Scheme Name NAV Returns as on Jul 31, 09 (%)
3 Months 1 Year 2 Years
Birla Sun Life Frontline Equity 67.76 42.00 21.48 6.08
Canara Robeco 40.26 41.16 21.93 5.47
Equity Diversified
DSP BlackRock Top 100 79.06 35.88 19.09 8.35
HDFC Equity 187.63 47.63 23.67 4.34
HDFC Top 200 156.61 45.57 26.40 10.76
Sundaram BNP Paribas SMILE 24.93 56.57 17.30 9.00
Indices
BSE Sensex 15670.31 37.42 9.16 0.38
BALANCED FUNDS
Scheme Name NAV Returns as on Jul 31, 09 (%)
3 Months 1 Year 2 Years
Birla Sun Life 95 236.72 33.54 27.18 6.51
Canara Robeco Balance 46.76 28.82 19.59 5.99
DSP BlackRock Balanced 50.68 29.92 13.03 7.29
HDFC Balanced 38.13 29.30 14.75 6.39
Reliance RSF - Balanced 17.15 36.14 31.47 15.04
Indices
Crisil Balanced Fund Index 2993.42 21.18 11.65 5.34
TAX PLANNING FUNDS
Scheme Name NAV Returns as on Jul 31, 09 (%)
3 Months 1 Year 2 Years
Fidelity Tax Advantage 15.41 39.09 15.44 1.66
Franklin India Index Tax 35.76 32.77 6.97 0.58
HSBC Tax Saver Equity 11.50 39.19 19.31 1.61
Religare Tax Plan 12.66 41.45 21.97 5.28
Sundaram BNP Paribas Taxsaver 36.70 39.73 18.01 9.49
Indices
BSE Sensex 15670.31 37.42 9.16 0.38
The author doesn’t hold any investment in any of the companies mentioned in the article.
For further details, please visit the Research section of our website, sharekhan.com
Set for re-rating
ABAN OFFSHORE
VIEWPOINT AUGUST 25, 2009CMP: RS1,210
Debt restructuring to become easier now
The recent contracts will bring in incremental revenues of around$244 million in FY2011. This would essentially result in a steepupgrade of FY2011 earnings (roughly around 28-30% in case ofour estimates). But more importantly, the improved visibility offuture cash flows would make it easier for the company to restruc-ture its debt, especially the $3.2 billion foreign currency loans.
Consequently, the recent contracts largely mitigate the fundamen-tal concerns related to generating sufficient future cash flows toservice the debt on books.
Valuation
Taking into consideration the recent contracts and also assumingthat the company would be able to deploy rest of the idle assets bythe end of this fiscal, our price target works out to Rs1,438 (basedon average of P/E and DCF method)—an upside of around 20%from the current level. However, there could be further upside toour price target on the back lower interest burden (post the debtrestructuring) and early deployment of its other idle assets.�
Aban Offshore (Aban) is set to get re-rated post the announcement
of contract wins worth $695 million for four of its jack-up rigs
today. This has come on the heels of a $180-million contract for its
semi-submersible rig—Deep Venture—announced a fortnight ago.
What’s more encouraging is the fact that these are longer duration
contracts and three of the jack-up rigs are getting deployed at ex-
tremely healthy day rates of $184,000 for a period of three years.
JACK-UP RIGS CONTRACTS BAGGED
Location No Duration Value of Deployment
(months) contract ($ mln)
Middle East 3 36 603 Q2FY10
Latin America 1 25.5 92 Q2FY10
Idle assets deployed
One of the biggest concern for Aban was the management’s inabil-
ity to deploy newly-built jack-up rigs for the past few quarters. In
all, seven of its jack-up rigs (out of its fleet of 15 jack-up rigs) were
lying idle. This is serious in a situation where the balance sheet is
highly stretched and debt servicing is turning out to be an issue.
However, the recent contracts ensure that more than half of the idle
assets would get deployed now at healthy day rates.

September 2009 Sharekhan ValueGuide38

Sharekhan ValueGuide September 200939
TURMERIC: BUBBLE READY TO BURST
Turmeric price on the national commodity and derivatives ex-change (NCDEX) that have been on a bull run and had assumedbubble-like form in the later stages seems to have begun the pro-cess of bursting. Turmeric is currently trading near the astro-nomical peak of Rs8,300 achieved in mid-August. It is also trad-ing 42% above the 200-daily simple moving average (DSMA),which suggests a bubble like nature. From technical perspective, ithas hit the channel (magenta) resistance at Rs8,330 and has re-tested the internal channel (white) at Rs8,000. On weekly chartsan 'inverted hammer' candlestick pattern has been formed, whichalso signals the end of the trend. The momentum has alreadyweakened on daily charts with negative divergences. Additionally,the weekly stochastic oscillator has rolled into sell with breakbelow the 80 line. From current levels, we expect a sharp move-down in turmeric initially targeting Rs6,150 (21-weekly expo-nential moving average [WEMA]) and thereafter a support clusterat Rs5500-5000 (key retracement levels of the up-move fromRs4,650 to Rs8,300). For traders, this is a high probability trade(with excellent risk-reward opportunity), where the upside seemsto be capped by Rs8,300 on multi-month basis.
SENSEX: INFLECTION CORNER
SENSEX
WEEKLY CHART
The Sensex posted a negative close in August, completing the final
leg with a Doji candlestick pattern, just around the previous month’s
close. This suggest that the journey in the northward direction is
about to end. The benchmark index was consolidating all through
the month between 16002.46 and 14684.45, and has formed a
rising wedge pattern which is a bearish sign for the market. Also,
the Sensex is facing resistance at 16050, which is 61.8% retracement
of the fall from the high of 21207 till 7697. Further, from here the
downside is expected to take the index down to 13200 levels, which
is the previous month’s swing’s low.
The Sensex’ weekly and daily charts suggest weakness in the KST
momentum indicator, which has given a negative crossover. The
rising wedge pattern has been witnessed on the leading indices. This
is a bearish pattern that begins wide at the bottom, and contracts as
the price moves higher and the trading range narrows with the
volumes increasing in the end. Moreover, the mid-caps and small-
caps have outperformed the other two major indices, which itself
shows an inter-market divergence. Overall, the Indian markets are
now looking exhausted at these levels and are ripe for a correction.
On the way down the markets may find support around the 20-
day moving average (DMA) and 40-DMA, ie 15373 and 15185
respectively, which are acting as crucial supports, and only a deci-
sive move below these averages will confirm the next leg down for a
target of 13200. The bullish island gap formed in August on the
daily chart is an important trigger point for bears to get aggressive.
However, if the market is unable to convincingly breach the bullish
island gap on the downside, we may see an upside rally till 16600.
Bullish Island – Upper level – 15362.93
Lower level - 15275.17
TURMERIC
TRADER'S TECHNIQUES
DAILY CHART

September 2009 Sharekhan ValueGuide40
TRADER'S TECHNIQUES
COPPER: RIPE FOR A CORRECTION
After making a low of $1.255, copper on COMEX has pulled back.
The pull-back has been a channelised one and the commodity has
completed a five-wave rally. As per the Elliott Wave Principle, a
three-wave decline follows a five-wave rally. This qualifies copper
for a corrective move. The pull-back has retraced 61.8% of the fall
from July 2008. At the crucial Fibonacci level, copper has faced
resistance from the upper channel line. The weekly momentum cycle
KST has been showing a negative divergence and currently its tra-
jectory has turned southward. These technical observations indi-
cate that the probability of a slide in the metal is significant. The
target for copper is $2.35, ie 38.2% retracement of the pull-back.
The importance of the level is magnified by the fact that the 21-
weekly exponential moving average (WEMA) and the 50-DEMA
are at the same level. Thus, the metal is expected to come down to
touch the moving averages. On the flip side, a close above $3 on a
closing basis will negate the bearish bias.
DERIVATIVES VIEW
COPPER
The August series ended with a modest gain of around 2%, indicat-ing the exhaustion of the current uptrend at around the 4750 mark.We might spend some time around these levels before taking a cleardirection in the market. The September series started on a very opti-mistic note in terms of rollover, which is significantly higher than thatseen in the previous few months, indicating volatility would remainvery high throughout the month with a slightly negative bias.
On the option side, we saw the implied volatility remained in therange of 30-35% throughout the month, indicating a possible risein the implied volatility which would make the life of intra-daytraders more difficult. Activity on the option side is relatively higherin the September series and put options are attracting more interestthan call options. The 4600 and 4500 put options are very activewhereas the 4700 to 5000 call options have good interest, indicat-ing the market would remain in a broad range of 4400 and 4900.
STOCK FUTURES OPEN INTEREST (RS CRS)
Reliance 1075.0
JSW Steel 994.0
LT 715.1
LITL 688.9
Infosys 679.1
Top five stock options with the highest open interest in the currentseries are:
STOCK OPTIONS OPEN INTEREST (RS CRS)
Reliance 307.4
ICICI Bank 215.5
ONGC 155.5
SBI 149.3
Tata Steel 73.4
Top five stock futures with the highest open interest in the currentseries are:
Nifty strategy
In this month we expect Nifty to remain range bound with high
volatility so one can look for buying opportunity around 4450
with a stop loss of 4400 on closing basis and selling opportunity
around 4750-4800 with a stop loss of 4850. As implied volatility is
pretty low one should try to restrict to option side rather than
taking position in futures as volatility is expected to go up.
The author doesn’t hold any investment in any of the companies mentioned in the article.

Sharekhan ValueGuide September 200941

September 2009 Sharekhan ValueGuide42
COMMODITIES CORNER
Castor seed: Dip on lower exports, new crop arrival
Copper: Likely to come down to Rs260 level
Copper price has shot up sharply this year on China's re-stocking andrenewed hopes of global economic recovery. Presently, copper price isup by nearly 105% since the start of this year and 125% up from itscycle low of $2,817 when price crashed on global financial crisis.
Copper is trading at $6,320 level at the time of writing this reportand sentiments are quite buoyant, as investors and traders con-tinue to discount global economic recovery. On the face of it themetal looks like rising further to Rs345 level by the end of this year,as we continue to get encouraging economic reports and indicatorsamid extremely loose monetary policies by major economies. How-ever, we think that the metal is likely to see a sharp fall before it rises,as lot of good news and supportive developments are already priced
Castor seed is primarily grown for castor oil, which find use inpaint and varnish, cosmetic, medicine and lubricant industry. Cas-tor seed contains around 45% oil, while oilcake, the by-product, isused as fertiliser.
India is the largest producer and exporter of castor oil in the world.With annual production in the range of 8-10 lakh tonne, Indiacontributes around 70% to annual global production. China andBrazil are the other major producers of castor oil.
Current scenarioGujarat contributes around 75% to India’s castor oil productionwhile Andhra Pradesh and Rajasthan contributes the remaining 25%.Crop arrivals from Andhra region begins in October/Novemberonwards, while that from Gujarat and Rajasthan starts in January.
Last fiscal India reaped a bumper crop thereby enhancing castor oilexport to 2.9 lakh tonne in the marketing year 2007-08. Indiancastor oil export during the year also rose due to lower crop in China—the other major producer. India exports castor oil to European coun-tries and China with China accounting for 40% of our exports.
International demand for castor oil has been affected following theglobal economic meltdown that hit industrial production acrosseconomies. China and Europe were no exception and this in turnhit Indian castor oil exports.
On an average India exports around 2.5 lakh tonne of castor oil.However the exports in the first four months of the fiscal 2010(April-July 2009) are reported at 1 lakh tonne, 35% lower thanthat in the corresponding period of the last year. Castor plantingtill August 21, 2009 is reported at 5 lakh hectare and the processwould continue in September in some regions of Gujarat. Givengood rains in Gujarat this year, we expect sowing to remain steadyat 7.5 lakh hectare this year, which could again mean a crop size of9.75-10 lakh tonne given the productivity of 1.3 tonne per hectare.
We expect castor seed price to correct in the coming weeks, as newcrop from Andhra Pradesh arrives the market. Further, there issufficient old crop stock to meet any upsurge in demand in thecoming weeks. Castor at benchmark Deesa market of Gujarat istrading at Rs2,700 a quintal. We expect price to correct to Rs2,500due to lower exports and emerging supply in the coming days.
in, and going forward any disappointment on economic data frontwould weigh heavily on the metal.
The first leg of copper rally was driven by China's re-stocking as theAsian dragon re-stocked the metal to take advantage of lower prices.Massive restocking by China's state reserve bureau and traderssaw China's imports hitting record high in March through Juneperiod. “The country may have stockpiled as much as 400,000tonne of copper in the first half because of sizeable imports andseasonal slowdown in demand”, Macquarie Group Ltd said onJuly 06, 2009. The re-stocking exercise by China helped copper torise from $2,817 level to around $4,500 level. However, China'scopper imports slumped to 406,612 metric tonne in July 2009,which is 15% down from the record 477,217 tonne in June 2009.The second leg of copper rally came into play on recovering globaleconomy, as we got supportive indicators out of China, the US andthe Euro region. Recovering global economy saw copper rising to$6,000 level, as traders discounted future recovery. Presently whatwe are seeing is the third leg of the rally on the assumption thatdeveloped nations are going to re-stock the metal, as these econo-mies recover amid low inventory levels at manufacturers' end. Cop-per recently topped $6,500 level on this optimism.
In our opinion the metal is likely to drop sharply in the comingweeks before it hits $7,000. Our opinion is premised on below-mentioned factors.
1. Global economic recovery still weak : Despite all talks of sharprecovery in global economy, it is worth noting that this very recoveryhas come on the back of pump-priming (huge stimulus packages) bymajor global economies. For example "cash for clunkers" programand tax credit of $8,500 for the first-time home buyer in the US sup-ported auto and housing sectors there. However it is yet to be seen howthe economies fare once the effect of stimulus packages wanes.
2. Consumers on their back: It is still too early to say if govern-ments' efforts would result into a V-shaped recovery, as consumerspending remains subdued amid grim employment scenario. TheUS unemployment rate could easily rise to 11%. Thus it doesn'tbode well for global economy as it would result into further spend-ing cut-backs by debt-laden consumers.
3. High level of inventories: China's imports are likely to drop fur-ther after witnessing record level in the first half of the year. Copperstockpiles at the Shanghai Futures Exchange (SHFE)-monitoredwarehouses of China have already reached the highest level in thelast two years. London Metal Exchange (LME) stockpiles stand at300,000 tonne, which would suffice to meet six days of globalconsumption. This is far higher that the stockpiles of below 100,000lakh tonne during copper’s bull run in 2006. LME cancelled ton-nage is less than 3%, which is not an encouraging ratio, as it showsthat there is not much interest in copper at prevailing levels.
4. No sign of re-stocking: Inventories at both wholesaler and pro-ducers levels in the USA continue to decline, which shows that de-stocking is still continuing, let alone the re-stocking.
5. US Dollar can rally: Weakness in greenback has been the majorreason for pushing up commodities prices. However US Dollar’ssafe heaven appeal has suffered, as global economy recovered. Butthe US Dollar can rally sharply if equities falter. And this is quitepossible, as the run-up in equities has been pretty sharp despite nosignificant improvement in consumer status. It is also worth men-tioning that equities have worked as an indicator of recovery in thisbull run of base metals. Thus sharp decline in equities would weighheavily on the base metal complex.
As confluence of above-mentioned factors, we conclude that cop-per can fall to Rs260 level in the coming months before it rises to$7,000 level if global economic recovery is sustainable.
CASTOR STATISTICS
Year Acreage Yield Production Castor oil Export of oil
(MY Oct-Sept) (hect) (Tons/hect) (lakh tonns) production (45%) (lakh tonns)
2007-08 748000 1.41 10.53 473850 289600
2008-09 826000 1.35 11.15 501750 208090

Sharekhan ValueGuide September 200943

September 2009 Sharekhan ValueGuide44
SMART TRADES PORTFOLIO
In this model trading portfolio ideas are generated based on the
market’s pulse or the flavour of the season (the stock calls are
not based on fundamental research). This portfolio is ideal for
the short-term delivery trader with a medium risk profile. The
portfolio is managed actively and its performance is reported on
a daily basis. In addition to the daily report, a monthly report
card shall also be released.
DERIVATIVES PORTFOLIO
It’s a model trading portfolio run by Sharekhan Derivatives Desk
based on the analysis of open interest in the market and the
PREMIER PORTFOLIOS
PRODUCT DETAILS (FOR AUGUST 2009)
Product Initial portfolio size (Rs) No of calls initiated Notional profit/loss (Rs) Portfolio returns%
Smart Trades Portfolio 500,000 11 263.0 0.05
Derivative Portfolio 500,000 17 -1,748.0 -0.35
Nifty Portfolio 300,000 16 6,117.35 2.04
other indicators. It is ideal for traders looking for aggressive
returns with appropriate risk. It is a leveraged product with a
super strike rate. It is actively managed.
NIFTY PORTFOLIO
It’s a trading portfolio that trades short and long on indices (Niftyand Bank Nifty) based on technical study. It is meant for aggres-sive traders wanting to actively trade on the market indices. Theportfolio calls are reported on a daily basis. A monthly reportshall also be released.
If you do not have time to monitor the market tick by tick, to shiftthrough pages of research or to pour over complex charts, thenPremier Portfolios are what you need.
disclaimerDISCLAIMER: “This document has been prepared by Sharekhan Ltd.(SHAREKHAN) This Document is subject to changes without prior notice and is intended only for the person or entity to which it is addressed
to and may contain confidential and/or privileged material and is not for any type of circulation. Any review, retransmission, or any other use is prohibited. Kindly note that this document does not constitutean offer or solicitation for the purchase or sale of any financial instrument or as an official confirmation of any transaction. Though disseminated to all the customers simultaneously, not all customers may
receive this report at the same time. SHAREKHAN will not treat recipients as customers by virtue of their receiving this report. The information contained herein is from publicly available data or other sourcesbelieved to be reliable. While we would endeavour to update the information herein on reasonable basis, SHAREKHAN, its subsidiaries and associated companies, their directors and employees (“SHAREKHAN and
affiliates”) are under no obligation to update or keep the information current. Also, there may be regulatory, compliance, or other reasons that may prevent SHAREKHAN and affiliates from doing so. We do notrepresent that information contained herein is accurate or complete and it should not be relied upon as such. This document is prepared for assistance only and is not intended to be and must not alone betaken
as the basis for an investment decision. The user assumes the entire risk of any use made of this information. Each recipient of this document should make such investigations as it deems necessary to arriveat an independent evaluation of an investment in the securities of companies referred to in this document (including the merits and risks involved), and should consult its own advisors to determine the merits
and risks of such an investment. The investment discussed or views expressed may not be suitable for all investors. We do not undertake to advise you as to any change of our views. Affiliates of Sharekhanmay have issued other reports that are inconsistent with and reach different conclusion from the information presented in this report. This report is not directed or intended for distribution to, or use by, any
person or entity who is a citizen or resident of or located in any locality, state, country or other jurisdiction, where such distribution, publication, availability or use would be contrary to law, regulation or whichwould subject SHAREKHAN and affiliates to any registration or licensing requirement within such jurisdiction. The securities described herein may or may not be eligible for sale in all jurisdictions or to certain
category of investors. Persons in whose possession this document may come are required to inform themselves of and to observe such restriction. SHAREKHAN & affiliates may have used the information setforth herein before publication and may have positions in, may from time to time purchase or sell or may be materially interested in any of the securities mentioned or related securities. SHAREKHAN may from
time to time solicit from, or perform investment banking, or other services for, any company mentioned herein. Without limiting any of the foregoing, in no event shall SHAREKHAN, any of its affiliates or anythird party involved in, or related to, computing or compiling the information have any liability for any damages of any kind. Any comments or statements made herein are those of the analyst and do not necessarily
reflect those of SHAREKHAN.”
PREMIER PORTFOLIOS

Sharekhan ValueGuide September 200945
SHAREKHAN EARNINGS GUIDE Prices as on September 04, 2009
*FY2009 is of 15 months ending March 2009 as company has changed reporting year from CY to FY **June ending company
# September ending company @Stand-alone financials
Company Price Sales Net Profit EPS (%) EPS PE (x) ROCE (%) RONW (%) DPS Div
(Rs) Growth Yield
(%)
Evergreen
HDFC 2,462.7 3,585.2 4,000.4 4,879.8 2,282.5 2,635.1 3,217.3 80.2 92.6 113.1 19% 30.7 26.6 21.8 - - 18.9 20.4 30.0 1.2
HDFC Bank 1,454.3 10,711.8 12,950.7 16,201.6 2,244.9 2,854.1 3,818.0 52.8 61.1 81.7 24% 27.6 23.8 17.8 - - 16.3 17.4 10.0 0.7
Infosys Tech 2,201.1 21,693.0 22,062.0 24,848.1 5,880.0 5,796.5 6,448.9 102.8 101.3 112.7 5% 21.4 21.7 19.5 32.8 32.0 26.2 24.3 23.5 1.1
Larsen & Toubro 1,567.4 40,187.0 45,107.0 56,632.0 2,918.1 3,880.4 4,654.6 49.8 66.3 79.5 26% 31.5 23.6 19.7 18.2 19.5 24.2 23.8 8.5 0.5
Reliance Ind 1,981.2 146,291.0 194,574.8254,917.2 15,607.0 18,756.8 24,101.7 99.2 119.2 153.2 24% 20.0 16.6 12.9 12.8 14.4 14.5 15.8 13.0 0.7
TCS 531.9 27,812.9 28,921.8 32,307.3 5,171.9 5,784.2 6,451.7 26.4 29.6 33.0 12% 20.1 18.0 16.1 26.5 25.8 31.7 30.4 5.0 0.9
Apple Green
Aditya Birla Nuvo@ 984.3 4,786.2 4,855.9 5,445.1 137.4 104.3 202.2 14.5 9.2 17.8 11% 68.0 107.1 55.3 14.3 19.7 2.0 3.7 4.0 0.4
Apollo Tyres 42.9 4,070.4 4,621.8 5,338.2 108.2 328.6 354.3 2.1 6.5 7.0 83% 20.4 6.6 6.1 24.8 23.3 19.9 17.9 0.5 1.2
Bajaj Auto 1,234.5 8,437.0 9,533.1 10,862.0 823.5 1,196.1 1,332.4 56.9 82.7 92.1 27% 21.7 14.9 13.4 44.2 39.9 44.3 36.3 22.0 1.8
Bajaj Finserv 272.3 385.3 - - 71.3 - - 4.9 - - - 55.6 - - - - - - 1.0 0.4
Bajaj Holdings 472.0 221.6 - - 174.8 - - 21.8 - - - 21.7 - - - - - - 10.0 2.1
Bank of Baroda 427.3 7,786.1 8,838.0 10,663.3 2,227.2 2,503.0 2,742.0 60.9 68.5 75.0 11% 7.0 6.2 5.7 - - 20.3 19.1 9.0 2.1
Bank of India 333.9 8,550.9 9,392.2 11,077.8 3,007.5 3,110.1 3,371.3 57.2 59.1 64.1 6% 5.8 5.6 5.2 - - 24.7 21.9 8.0 2.4
Bharat Electronics 1,400.4 4,570.7 5,434.6 6,087.7 808.5 921.5 971.1 101.1 115.2 121.4 10% 13.9 12.2 11.5 25.3 21.9 17.4 15.0 20.7 1.5
BHEL 2,212.1 26,234.2 33,543.9 41,860.1 3,138.2 4,431.5 5,716.0 64.1 90.5 116.8 35% 34.5 24.4 18.9 40.5 46.0 26.6 27.0 15.3 0.7
Bharti Airtel 405.0 36,961.5 43,711.8 48,923.1 8,469.9 10,078.7 11,475.4 22.3 26.5 30.2 16% 18.2 15.3 13.4 26.7 24.4 23.8 21.3 0.0 0.0
Corp Bank 382.9 2,798.2 3,117.5 3,556.2 892.7 964.4 1,008.4 62.2 67.2 70.3 6% 6.2 5.7 5.4 - - 18.3 16.7 12.5 3.3
Crompton Greaves 315.7 8,737.3 9,639.6 10,957.2 562.5 654.1 765.0 15.3 17.8 20.9 17% 20.6 17.7 15.1 37.7 37.1 27.4 25.2 2.0 0.6
Glenmark Pharma 223.5 2121.5 2505.4 2933.1 310.4 329.5 444.4 12.4 13.0 17.6 19% 18.0 17.2 12.7 15.6 18.1 16.5 18.3 0.4 0.2
Godrej Consumer 237.1 1393.0 1631.6 1851.6 173.3 244.2 277.2 6.7 9.5 10.8 27% 35.4 25.0 21.9 31.9 30.7 38.8 36.1 4.0 1.7
Grasim 2,678.6 10,804.0 11,469.2 11,376.2 1,648.0 1,742.1 1,658.3 179.8 190.0 180.9 0% 14.9 14.1 14.8 12.3 11.0 16.0 13.5 30.0 1.1
HCL Tech** 304.9 10,591.0 11,255.2 12,173.4 1,200.9 1,115.6 1,568.1 17.9 16.5 22.9 13% 17.0 18.5 13.3 31.0 36.2 19.9 24.4 9.0 3.0
HUL * 273.1 20,239.3 18,294.4 20,670.9 2,391.4 2,303.0 2,641.7 8.8 10.6 12.1 17% 31.0 25.8 22.6 124.0 112.6 100.3 96.1 7.5 2.7
ICICI Bank 743.9 15,970.3 16,430.8 19,044.7 3,758.1 4,013.1 4,798.0 33.8 36.1 43.1 13% 22.0 20.6 17.3 - - 7.9 9.0 11.0 1.5
Indian Hotel Co 66.5 1,619.6 1,702.9 1,922.1 234.0 258.1 301.0 3.5 3.6 4.2 10% 19.0 18.5 15.8 10.3 11.5 8.0 8.8 1.2 1.8
ITC 233.3 15,582.7 17,562.4 20,117.2 3,263.6 3,862.8 4,457.6 8.6 10.2 11.8 17% 27.1 22.9 19.8 34.5 34.3 25.8 25.1 3.7 1.6
Lupin 982.9 3866.6 4453.8 5056.7 533.8 624.7 730.4 64.4 69.7 81.5 12% 15.3 14.1 12.1 22.2 22.4 24.4 23.1 12.5 1.3
M&M 867.5 12,649.1 16,237.3 17,364.2 772.9 1,438.3 1,541.9 30.6 57.0 61.1 41% 28.3 15.2 14.2 20.4 20.2 22.6 20.4 10.0 1.2
Marico 87.7 2,388.4 2,718.8 3,034.6 209.1 238.5 276.3 3.4 3.9 4.5 15% 25.8 22.5 19.5 39.3 39.8 43.4 36.4 0.7 0.8
Maruti Suzuki 1,546.6 20,455.4 27,170.3 31,666.0 1,218.8 1,913.5 2,325.5 42.2 66.2 80.5 38% 36.7 23.4 19.2 25.4 26.4 17.0 17.4 3.5 0.2
Piramal Helath 321.1 3281.1 3775.6 4307.6 360.9 483.8 557.1 17.3 23.1 26.7 24% 18.6 13.9 12.0 23.1 23.3 30.7 27.4 4.2 1.3
Punj Lloyd 260.6 11,912.0 13,173.5 14,511.0 -216.3 514.9 638.0 - 17.0 21.0 - - 15.3 12.4 16.4 16.7 17.2 17.6 0.3 0.1
SBI 1,762.5 33,563.9 37,035.2 44,058.1 9,121.2 10,016.1 11,629.6 143.7 157.8 183.2 13% 12.3 11.2 9.6 - - 16.2 16.6 29.0 1.6
Sintex industries 233.7 3,135.6 3,485.1 3,833.0 327.4 346.0 397.9 24.0 25.4 29.1 10% 9.7 9.2 8.0 13.0 14.4 16.4 16.0 1.0 0.4
Tata Tea 940.8 4,874.1 5,382.1 5,892.4 338.4 398.5 456.1 54.7 64.4 73.8 16% 17.2 14.6 12.7 8.4 9.2 9.4 10.0 17.5 1.9
Wipro 552.3 25,456.2 27,423.4 30,020.1 3,451.4 3,821.2 4,215.1 23.6 26.1 28.8 11% 23.4 21.1 19.2 14.0 13.1 20.6 19.1 4.0 0.7
Emerging Star
3i Infotech 87.0 2,285.6 2,659.2 2,969.9 248.6 240.0 280.7 15.5 15.0 17.5 6% 5.6 5.8 5.0 11.7 11.9 12.4 12.9 1.5 1.7
Allied Digital 479.4 525.1 658.7 769.2 81.3 98.3 116.2 44.9 54.3 64.1 20% 10.7 8.8 7.5 26.3 26.0 26.1 24.0 2.0 0.4
Alphageo India 215.8 63.9 79.8 95.0 6.0 8.3 10.3 11.6 16.1 20.1 32% 18.6 13.4 10.7 22.1 25.9 13.9 15.1 1.5 0.7
Axis Bank 907.3 6,583.1 8,457.3 10,047.1 1,815.4 2,331.2 2,839.4 50.6 64.9 79.1 25% 17.9 14.0 11.5 - - 21.0 21.8 10.0 1.1
Balrampur Chini# 119.3 1,703.7 1,975.4 2,257.6 226.1 294.2 317.0 8.8 11.5 12.4 19% 13.6 10.4 9.6 19.2 19.7 22.6 20.3 0.5 0.4
Cadila Healthcare 494.9 2,927.5 3,315.5 3,733.9 327.3 371.4 435.5 24.0 27.2 31.9 15% 20.6 18.2 15.5 18.5 19.5 23.2 22.2 4.5 0.9
EMCO 91.3 996.3 1,161.6 1,372.6 58.5 64.6 83.4 9.0 11.0 12.8 19% 10.1 8.3 7.1 16.1 17.5 13.5 14.3 1.4 1.5
Navneet Pub 98.7 516.9 595.3 699.3 59.2 72.1 87.1 6.2 7.6 9.1 21% 15.9 13.0 10.8 20.2 21.2 23.8 24.2 2.6 2.6
Network 18 Fincap 97.2 765.5 - - -188.0 - - - - - - - - - - - - - 0.0 0.0
FY09 FY10E FY11E FY09 FY10E FY11E FY09 FY10E FY11E FY11/FY09 FY09 FY10E FY11E FY10E FY11E FY10E FY11E (Rs)

Sharekhan ValueGuide September 200946
Company Price Sales Net Profit EPS (%) EPS PE (x) ROCE (%) RONW (%) DPS Div
(Rs) Growth Yield
(%)FY09 FY10E FY11E FY09 FY10E FY11E FY09 FY10E FY11E FY11/FY09 FY09 FY10E FY11E FY10E FY11E FY10E FY11E (Rs)
Opto Circuits India 187.4 818.5 1049.4 1326.2 213.1 269.8 348.8 13.2 16.1 20.8 26% 14.2 11.6 9.0 29.0 28.7 32.8 31.9 4.0 2.1
Orchid Chemicals 128.5 1,211.3 1,494.2 1,773.3 -11.7 80.0 157.2 - 8.3 16.3 - - 15.5 7.9 8.8 11.5 5.9 10.5 1.0 0.8
Patels Airtemp 55.8 68.4 80.1 92.7 7.1 7.9 9.1 14.1 15.5 18.0 13% 4.0 3.6 3.1 42.8 39.1 26.3 23.7 1.5 2.7
Thermax 449.5 3,264.4 3,189.8 3,638.8 346.7 285.5 331.8 29.1 24.0 27.9 -2% 15.4 18.7 16.1 50.0 43.4 28.4 25.1 5.0 1.1
Zee News 45.4 522.1 624.6 725.8 44.7 52.6 69.8 1.9 2.2 2.9 24% 23.9 20.6 15.7 22.6 26.7 20.1 22.4 0.4 0.9
Ugly Duckling
BASF 293.0 1,316.1 1,536.0 1,754.7 48.6 68.5 82.3 17.2 24.3 29.2 30% 17.0 12.1 10.0 23.3 26.3 18.7 21.4 7.0 2.4
Deepak Fert 87.5 1,404.0 1,343.3 1,505.9 152.1 130.3 157.9 16.9 14.8 17.9 3% 5.2 5.9 4.9 10.4 10.7 15.3 16.4 4.0 4.6
Genus Power Infra 186.4 556.6 682.3 811.7 48.6 65.6 87.9 32.9 45.6 59.4 34% 5.7 4.1 3.1 16.5 18.9 17.6 19.4 1.5 0.8
ICI India 554.0 908.7 981.2 1,117.0 140.4 150.5 166.3 36.9 43.3 47.9 14% 15.0 12.8 11.6 20.8 21.8 16.0 16.9 16.0 2.9
India Cements 128.8 3,426.8 3,883.2 4,108.5 485.1 499.6 418.0 17.2 17.7 14.8 -7% 7.5 7.3 8.7 16.8 13.4 14.5 10.9 2.0 1.6
Ipca Laboratories 700.0 1,292.6 1,486.4 1,750.5 100.8 177.2 213.7 40.3 70.9 85.5 46% 17.4 9.9 8.2 22.7 21.8 24.6 25.3 11.0 1.6
Jaiprakash Asso 217.8 5,775.0 9,648.8 12,824.1 826.2 1,163.4 1,402.4 5.8 8.2 9.9 30% 37.4 26.6 22.0 17.8 18.6 22.9 19.2 1.0 0.5
Mold Tek Tech 74.0 21.8 26.0 32.9 4.4 4.3 5.7 12.3 12.1 15.9 14% 6.0 6.1 4.7 19.2 21.4 21.6 22.9 2.0 2.7
Orbit Corporation 179.5 283.5 356.9 544.3 36.6 47.7 94.3 8.1 10.5 20.8 61% 22.3 17.1 8.6 9.0 14.6 8.1 13.9 0.0 0.0
PNB 681.4 9,949.9 11,540.6 13,343.4 3,090.9 3,398.9 3,944.9 98.0 107.8 125.1 13% 7.0 6.3 5.4 - - 23.6 23.0 20.0 2.9
Ratnamani Metals 91.4 955.2 996.1 1,197.2 95.9 94.1 108.4 21.3 20.9 24.1 6% 4.3 4.4 3.8 30.8 30.1 27.4 25.7 1.4 1.5
Selan Exploration 275.5 99.9 96.7 123.1 46.6 39.9 52.3 28.9 24.9 32.6 6% 9.5 11.1 8.5 34.9 34.7 25.3 25.2 0.0 0.0
Shiv-Vani Oil & Gas 339.5 817.5 1,085.1 1,170.8 151.9 185.7 205.4 34.6 42.3 46.8 16% 9.8 8.0 7.3 19.6 18.0 15.6 16.2 1.0 0.3
SEAMEC 183.3 268.6 330.1 261.2 88.2 152.1 88.2 26.0 44.9 26.0 0% 7.1 4.1 7.1 40.0 18.2 32.1 16.3 0.0 -
Subros 38.6 694.7 842.9 992.1 13.2 18.2 25.2 2.2 3.0 4.2 38% 17.5 12.9 9.2 12.4 14.8 8.7 10.6 0.0 0.0
Sun Pharma 1,209.6 4272.3 4316.2 5081.4 1817.7 1648.7 1777.6 87.8 79.6 85.8 -1% 13.8 15.2 14.1 22.6 20.7 21.2 19.2 13.8 1.1
Torrent Pharma 279.6 1,630.7 1,825.7 2,067.2 184.4 206.0 252.0 21.8 24.3 29.8 17% 12.8 11.5 9.4 20.0 20.2 27.9 27.2 4.0 1.4
UltraTech Cement 751.9 6,383.1 6,959.8 6,852.4 977.0 1,085.3 840.3 78.5 87.2 67.5 -7% 9.6 8.6 11.1 29.5 21.4 23.6 15.7 5.0 0.7
Union Bank of India 219.4 5,296.1 5,873.7 7,592.1 1,726.6 1,855.7 2,194.1 34.2 36.7 43.4 13% 6.4 6.0 5.1 - - 23.7 23.0 5.0 2.3
United Phosphorus 166.9 4,931.7 5,678.1 6,335.7 475.2 645.9 783.3 11.0 14.5 17.5 26% 15.1 11.5 9.5 16.3 18.4 21.1 21.1 1.5 0.9
Zensar Tech 234.4 908.1 970.5 1,062.8 86.5 98.5 104.9 36.0 41.0 43.6 10% 6.5 5.7 5.4 30.4 27.0 30.1 24.7 3.8 1.6
Vulture's Pick
Esab India^ 433.3 423.6 449.7 504.3 61.2 65.1 73.2 39.7 42.3 47.5 9% 10.9 10.2 9.1 64.2 57.9 37.7 34.3 15.5 3.6
Mahindra Lifespace 360.1 341.8 485.0 672.2 65.6 109.2 154.4 16.1 26.7 37.8 53% 22.4 13.5 9.5 14.2 16.3 11.1 13.9 2.5 0.7
Orient Paper 55.2 1,503.2 1,593.3 1,867.7 231.5 196.6 223.6 12.1 10.3 11.7 -2% 4.6 5.4 4.7 30.8 31.9 23.8 21.8 1.5 2.7
Tata Chemicals 246.9 12,257.7 9,398.4 10,809.9 1,051.8 680.8 831.9 43.2 28.0 34.1 -11% 5.7 8.8 7.2 13.4 14.0 13.4 14.0 9.0 3.6
Unity Infraprojects 352.9 1,130.8 1,375.0 1,560.0 69.7 76.9 82.2 52.1 57.5 61.5 9% 6.8 6.1 5.7 18.6 17.7 16.6 15.1 4.0 1.1
WS Industries 43.4 222.5 278.4 307.2 8.1 16.6 20.6 3.8 7.9 9.7 60% 11.4 5.5 4.5 13.8 15.1 16.3 17.1 1.0 2.3
Cannonball
Allahabad Bank 93.2 3,300.6 3,760.1 4,608.3 768.6 985.6 1,127.7 17.2 22.1 25.2 21% 5.4 4.2 3.7 - - 18.2 17.8 3.0 3.2
Andhra Bank 91.9 2,392.3 2,658.0 2,983.9 653.1 759.4 845.3 13.5 15.7 17.4 14% 6.8 5.9 5.3 - - 19.6 19.4 4.5 4.9
IDBI Bank 106.5 2,715.8 4,070.3 5,186.1 858.5 1,067.0 1,347.4 11.8 14.7 18.6 25% 9.0 7.2 5.7 - - 13.2 14.5 2.5 2.3
Madras Cements 108.1 2,530.4 3,000.1 2,999.6 363.5 430.5 367.9 15.3 18.1 15.5 1% 7.1 6.0 7.0 18.5 15.8 26.4 19.0 2.0 1.9
Phillips Carbon 144.0 1,163.3 1,351.9 1,508.9 -64.8 75.8 91.5 -24.1 26.8 32.4 - -6.0 5.4 4.4 20.8 22.8 25.8 23.8 0.0 -
Shree Cement 1,499.0 2,715.0 3,120.7 3,256.2 602.7 509.5 429.1 173.0 146.3 123.2 -16% 8.7 10.2 12.2 25.5 20.0 30.6 21.0 10.0 0.7
TFCI 23.0 42.7 52.7 62.7 24.1 28.5 33.8 3.0 3.5 4.2 18% 7.7 6.5 5.5 - - 9.6 10.4 1.0 4.4
^Year CY instead of FY

Sharekhan ValueGuide September 200947
Remarks
Evergreen
HDFC � HDFC provides housing loans to individuals, corporates and developers. It has interests in banking, assetmanagement and insurance through its key subsidiaries. Three of these—HDFC Bank, HDFC Life Insurance andHDFC Mutual Fund—are valued at Rs934 per share of HDFC. As these subsidiaries are growing faster than HDFC,the value contributed by them would be significantly higher going forward.
HDFC Bank � HDFC Bank has merged Centurion Bank of Punjab with itself and the reported numbers for FY2009 represent thefinancials of the merged entity. Relatively high margins (compared with its peers), strong branch network and betterasset quality make HDFC Bank a safe bet.
Infosys Tech � Infosys is India's premier IT and IT-enabled service company. It is one of the key beneficiaries of the strong trend ofoffshore outsourcing. It is relatively better positioned to weather the current uncertainties related to the slowdownin the USA and its fallout on the overall demand environment.
L&T � Larsen & Toubro, being the largest engineering and construction company in India, is a direct beneficiary of the strongdomestic infrastructure boom. Strong potential from its international business, its sound execution track record,bulging order book and strong performance of subsidiaries further reinforce our faith in it. There also lies great growthpotential in some of its new initiatives.
Reliance Ind � RIL holds great promise in E&P business with the start of gas production from KG basin in April 2009 and that ofcrude oil in September 2008. We expect the GRM to remain low due to narrowing down of light-heavy crude pricedifferential and declining middle distillate crack spread. However, RIL is likely to fetch premium over SingaporeComplex’ GRM due to its superior refinery complexity. Petrochem margins of the company have improved with theuptake in the domestic demand and higher price realisation in the domestic market. We expect these levels of petrochemmargins to sustain in the medium term.
TCS � TCS pioneered the IT services outsourcing business from India and is the largest IT service firm in the country. It isa leader in most service offerings and is in the process of further consolidating its leadership position through theinorganic route and large deals.
Apple Green
Aditya Birla Nuvo � We believe the value businesses of ABN (insulators, textiles, fertilisers, carbon black and rayon) would experience marginimprovement in the coming quarters, as the steep decline in commodity prices is expected to bring down the raw materialcost. With the approval of shareholders to raise capital of Rs1,000 crore through the issue of preferential warrants, webelieve the funding requirement for the expansion of life insurance and other growth businesses will be fulfilled.
Apollo Tyres � Apollo Tyres is the market leader in truck and bus tyre segments with 28% market share. Lower raw material costand improving demand in OEM as well as replacement segment will lead to a three-fold jump in FY2010 net profits.In long term, the company is likely to benefit from acquisitions made in international markets and capacity expansionin domestic business.
Bajaj Auto � Bajaj Auto is a leading two-wheeler automobile company. It is moving up the value chain by concentrating on theexecutive and premium motorcycle segments. The performance of the company would depend on the new launchesplanned during the year and the company’s strategy to regain its lost market share in the 125cc+ segment.
Bajaj Finserv � Bajaj Finserv is the only pure insurance play available in the market currently. It is one of the top three players in thefast growing life insurance segment and also has a sizable presence in the general insurance segment.
Bajaj Holdings � Bajaj Holdings is the holding company of the Bajaj group, having a 30% stake each in Bajaj Auto and Bajaj Finserv.The two-wheeler sales are expected to improve going forward with new product launches. The insurance businessmakes it one of the largest players in the insurance space.
Bank of Baroda � BoB, with a wide network of over 2,900 branches across the country, has a stronghold in the western and eastern partsof India. The bank has laid out aggressive plans to grow supplementary businesses including insurance and onlinebroking, which should boost its fee income. We expect its earnings to grow at a CAGR of 11% over FY2009-11E.
Bank of India � BoI has a wide network of branches across the country and abroad. With a diversified product & services portfolio,and steady asset growth, we expect a 6% growth (CAGR) in its earnings over FY2009-11E.
Bharti Airtel � Bharti Airtel is leading the wireless telephony revolution and has emerged as the largest mobile operator in the country.Strong addition of subscribers by the company will mitigate the adverse effect of declining trend in the tariffs. Thecompany maintains its market leadership and remains our top pick in the sector.
BEL � BEL, a public sector unit involved in manufacturing electronic, communication and defence equipment, is benefitingfrom the enhanced capital expenditure outlay in the budget to strengthen and modernise security systems. Moreover,civilian and export orders are also expected to aid the overall growth in the revenues. However, we are positive onthe full-year estimates and long-term prospects of the company.

Sharekhan ValueGuide September 200948
Remarks
BHEL � BHEL, India's biggest power equipment manufacturer, will be the prime beneficiary of the four-fold increase ininvestments being made in the domestic power sector. BHEL’s order book of Rs124,000 crore stands at around 4.4xits FY2009 revenues and we expect the company to maintain strong growth momentum.
Corp Bank � Corporation Bank has one of the highest Tier-I CAR among its peers. This leaves ample scope for the bank to leveragethe balance sheet without diluting the equity, quite unlike the other state-owned banks. The bank is most aggressiveon technology implementation with all its branches under Core Banking Solution, covering 100% business of thebank, giving it a competitive edge over its peers.
Crompton Greaves� The outlook is buoyant for Crompton Greaves' key business of industrial and power systems. A consolidated orderbook of close to Rs6,315 crore generates clear earnings visibility. The synergy from the acquisition of Pauwels, GTVand Microsol will drive Crompton Greaves’ consolidated earnings.
Glenmark Pharma� Through the successful development and out-licensing of three molecules in a short span of six years, Glenmark hasbecome India's best play on research-led innovation. It has built a pipeline of 13 molecules and has managed to clinchfour out-licensing deals worth $734 million. Its core business has seen stupendous success due to its focus on nichespecialties and brand building. Out-licensing deals of its key molecules would provide further impetus to the earnings.
GCPL � Godrej Consumer Products is major player in the Indian FMCG market with presence in soap, hair colour, liquiddetergent and toilet soap segments. The soap category (~50% of top line) is expected to outperform industry volumegrowth with buoyancy in rural demand and downtrading in soaps. The margins are expected to surge in FY2010with the correction in the palm oil prices. Thus we expect the bottom line to grow at a CAGR of 26.5% over FY2009-11 and outperform the industry.
Grasim � Grasim Industries is in the process of augmenting its cement capacity by 4.5MMT at Kotputli and by 2.6MMT atShambhupura in Rajasthan by Q2FY2010. Due to revival in the demand for VSF, prices of the same have improved.The volume growth due to capacity addition in cement division will drive the earnings of the company.
HCL Tech � HCL Tech is one of the leading Indian IT service vendors. It has bagged large deals in the recent quarters. However,we see risk to the company’s earnings due to upfront free transition cost on the recent deals, margin dilution fromAxon acquisition and huge unrecognised forex loss sitting on its balance sheet.
HUL � HUL is India's largest fast moving consumer good (FMCG) company. With sales volumes and market share undersevere pressure the company has shifted its focus from profitability to regain volumes. The company has implementedcorrective measures, which will improve the volumes in the coming quarters. A sharp correction in the key raw materialprices will help HUL to improve margins, which will be the key driver of bottom line growth in FY2010.
ICICI Bank � ICICI Bank is India's second largest bank. With strong positioning in retail segment, it enjoys healthy growth in bothloans and fee income. However, deteriorating asset quality is a cause for concern. Its various subsidiaries add ~Rs177to the overall valuation. Moreover, the bank offers substantial value unlocking opportunities with the expected listingof its subsidiaries like ICICI Securities and ICICI Prudential Life Insurance.
Indian Hotels Co � Indian Hotels is the largest hotelier in India with a vast portfolio of hotel properties around the globe. Over the long termthe company would benefit from increase in tourism and corporate travels in India. Also, a turnaround in profitabilityof its overseas properties would boost its earnings. In the near term the gloomy macro scenario will affects ARRs andoccupancies of the company.
ITC � ITC has a strategy of effectively utilising the excess cash generated from its cash cow, the cigarette business, tostrengthen and enhance it’s other non-cigarette businesses. This would nurture the growth of these businesses someof which are at nascent stage. As ITC gains leadership position in each of these businesses, we expect its valuationsto improve further, reducing the gap between its valuation and that of HUL.
Lupin � Leading pharma company Lupin is set to take off in the export market by targeting the US market (primarily forformulations) while maintaining its dominance in the anti-TB segment globally. Further, with an expanded fieldforce and therapy focused marketing division, Lupin's branded formulation business in the domestic market hasbeen performing better than the industry. Lastly, Lupin's ongoing R&D activities are expected to yield sweet fruitsgoing forward.
M&M � M&M is a leading maker of tractors and utility vehicles in India. New product launches are likely to drive its growthgoing forward in the automobile segment, while the company has consolidated well in the tractor segment with theacquisition of Punjab Tractors. Further, its investments with world majors in passenger cars and commercial vehicleshave helped it diversify into various automobile segments, while the value of its subsidiaries adds to its sum-of-the-parts valuation.

Sharekhan ValueGuide September 200949
Remarks
Marico � Marico is India's leading FMCG company. Its core brands, Parachute and Saffola, have a strong footing in the market.It intends to play on the broader beauty and health platform. It follows a three-pronged strategy that shall ensureits growth in the long term. The strategy hinges on expansion of existing brands, launch of new product categoriesand growth through acquisitions. Thus while Marico has entered new categories like health foods and Kaya clinics,it has also expanded its presence in markets such as UAE and South Africa through acquisitions.
Maruti Suzuki � Maruti Suzuki is India's largest small car maker. The company is the only pure passenger car play in the domestic marketand has been outperforming the industry consistently. With new launches and strong existing product basket, thecompany continues to outperform the market growth rate. Suzuki has identified India as a manufacturing hub for smallcars for its worldwide markets.
Piramal Health � Pharma major Piramal Healthcare is ready to gain from the ramp-up in its contract manufacturing deals with MNCs.Further, the acquisition of Pfizer's Morpeth facility in the UK adds glory to its global contract manufacturing strength.
Punj Lloyd � Punj Lloyd Ltd (PLL) is the second largest EPC player in the country with a global presence. In FY2007, PLL acquiredSEC and Simon Carves, which helped it in plugging gaps in services offered by it. The average order size and executioncapability of PLL has also increased significantly making it the only player capable of competing with L&T, the largestEPC player in the country.
SBI � Despite being the largest bank of India, SBI is growing at a high rate which is commendable. Its loan growth is likelyto remain healthy at ~20% with improving core operating performance and stable net interest margins. Successfulmerger of associate banks could provide further upside for the parent bank. The asset quality of the bank would remaina key monitorable.
Sintex Industries � Sintex Industries, a key player in plastic specialties space, now has a diverse business model with presence inconstruction, prefabs, custom molding and textiles. Being a pioneer in monolithic construction technique, we believeSintex is all set to witness strong traction in order inflows of this division in the future, given the need for affordablehousing in India. The company is present in exciting growth businesses, and we expect the revenue and profit of thecompany to grow at a CAGR of 10.2% and 10.5% respectively over FY2009-11E.
Tata Tea � Over the past two years, Tata Tea has transformed itself from just a commodity (tea) seller to a branded tea maker.It has acquired management control of Mount Everest Mineral water, owner of the Himalayan brand and plans toenter RTD beverage segment through launch of TION in the domestic market. This makes the company a completebeverage company having presence in the entire vertical: tea, coffee, Fruit drinks and water. However its valuationis much cheaper than that of its peers.
Wipro � Wipro is one of the leading Indian IT service companies. The company has shown strong performance in recentquarters specially on the margin front. However, the outlook for two of Wipro’s key user industries (telecom OEMand technology) remains muted due to change in the management at client level and reduction in discretionaryspending. Moreover, huge pile of unrecognised forex losses on the balance sheet due to its aggressive hedge positionremain a cause for concern.
Emerging Star
3i Infotech � 3i Infotech offers software products and solutions to BFSI sector. The growth momentum is expected to continuedue to healthy order book and recent acquisition of Regulus. It has relatively higher proportion of revenues fromgeographies other than the US and Europe. Hence, it is less likely to be affected by the slowdown in the US and Europe.Moreover, the recent buyback of FCCBs by the company has considerably eased the concern of equity dilution forthe company, which is likely to generate value for shareholders.
Allied Digital � Allied Digital Service Ltd (ADSL) is a leading player in the fast-growing remote infrastructure management service.The company is believed to be close to signing a pact with one of the leading PC server manufacturer to offer its servicesas bundled offering to its OEM clientele. This coupled with sustainable margin, we expect ADSL’s earnings to growat a CAGR of 19.6% during FY2009-11.
Alphageo � Alphageo provides seismic survey and other related support services to oil exploration & production companies inIndia. The recent order wins and a healthy pipeline of orders have considerably improved the company's revenuegrowth visibility.
Axis Bank � Over the last few years, Axis Bank (UTI Bank) has grown its balance sheet aggressively. Notably, the bank hasmaintained a delicate balance between aggressive balance sheet growth and profitability. Besides the core bankingbusiness, the bank plans to foray into asset management business under a joint venture with Banque Privee. We expectthe quality of its earnings to improve as the proportion of fee income goes up.
Balrampur Chini � Balrampur Chini is the second largest sugar producer in the country and has an integrated business model withdistillery and power co-generation facilities. The Indian sugar cycle is witnessing a strong uptrend with productiondeficit leading to a sharp jump in sugar prices. We expect Balrampur Chini’s profits to grow at a hefty CAGR of 59.2%over FY2008-11 driven by sugar prices.

Sharekhan ValueGuide September 200950
Remarks
Cadila � Cadila's improving performance in the US generic and French market, along with the steady progress in the CRAMSspace, enriches its growth visibility. With key subsidiaries turning profitable, Cadila is all set to harvest the fruits ofits long-term investments.
EMCO � Emco is one of the leading players in the transformer space. It is also fast emerging as an end-to-end player in the powerT&D space. The company has a strong order book of Rs1,505 crore (1.4x FY2009 revenues). Furthermore, its newbusiness initiatives (coal mining) could be value accretive in the future.
Navneet Pub � Navneet Publications’ core publication business will record a moderate growth in FY2010. However, with syllabuschange for some standards in schools of Gujarat and Maharashtra, we expect the publication business to post highergrowth in FY2011. Also the stationery business is likely to post 25%+ growth rate in the coming years. Overall weexpect the company’s top line to grow at a CAGR of 16.3% over FY2009-11 and the bottom line to grow at a CAGRof 21.4% over FY2009-11.
Network 18 � Network 18, the holding company of the TV18 group, owns the best media properties through its holdings in TV18and GBN. While TV18 owns business channels CNBC and Awaaz, and Internet properties such as moneycontrol.com;GBN controls CNN-IBN and IBN-7. GBN has successfully launched the Hindi channel, Colors, via its tie-up withViacom. It also operates a home shopping network inclusive of a dedicated home shopping channel. We expectNetwork 18 to create value through its holdings.
Orchid Chem � Niche product opportunities in the USA are driving the growth of Orchid. Its entry into European and Canadian marketswill further boost its sales in the coming years. With UK MHRA approval for its plants and marketing tie-ups in place,Orchid is all set to make its entry into the European market, which will catapult its growth to a different trajectory.
Opto Circuits � A leading player in manufacturing medical equipment like sensors and patient monitors, Opto has diversified intothe invasive space where it supplies stents for medical use. Lower cost base and attractive pricing strategies have enabledOpto's stents to gain acceptance globally. Steady growth in the non-invasive segment and increasing acceptance ofDIOR, a revolutionary cardiac balloon, in Europe would drive Opto's growth. Further, Criticare acquisition willenable Opto to diversify into gas monitoring systems and strengthen its position in the USA.
Patels Airtemp � Patels Airtemp, a manufacturer of heat transfer technology products, would benefit immensely from the strong boomin its user industries, particularly oil and gas, refineries and power. It currently has a strong order book of Rs48 crorewhile the order inflow is expected to remain steady in the next two years too.
Thermax � Continued rise in India Inc's capex will benefit Thermax' energy and environment businesses. Its order book standsat Rs3,426 crore, which is 1x its FY2009 consolidated revenues.
Zee News � Zee News operates a unique bouquet comprising seven regional entertainment channels and four news channels. Thekey revenue contributors are Zee News, Zee Marathi and Zee Bangla, with the latter two channels being the leadersin their respective genres. Zee News is making steady progress in garnering better market share in Telugu and Kannadamarkets, which would drive its growth going forward. Also, the flow of hefty subscription revenues in future augurswell for the company’s growth.
Ugly Duckling
BASF India � BASF India is set to benefit from the changing demographics and the resulting consumption boom in India. BASF isbuilding a 9,000 tonne per annum engineering plastics compounding plant at its existing Thane facility. The companyis likely to benefit from the new capacity additions that would help it cater to the demand from user industries likeautomobiles, construction, white goods, home furnishings and paper.
Deepak Fert � DFPCL manufactures and supplies industrial chemicals and ANP fertilisers. With Dahej-Uran pipeline into operation,the company would benefit from higher capacity utilisation and increased ammonia capacity. The company is inprocess of forming a JV with Yara International USA. The JV will provide DFPCL stability and flexibility in itsoperations through Yara International's leadership in the ammonia value chain.
Genus Power Inf � Genus, India's leading electric meter making company, is all set to reap the benefits of APDRP’s initiatives like 100%metering programme and replacement of mechanical meters with electronic meters. A healthy order book of Rs1,070crore will maintain the growth in revenue and profitability.
India Cements � Due to its modified capex plan, India Cements has joined the league of top five cement players with 14MMT capacityat the end of June 2009 and that of 16MMT by FY2010. Volume growth due to capacity addition will drive theearnings of the company. Moreover, it is likely to be the biggest beneficiary of the recent correction in imported coalprices, as it imports around 60-70% of its total coal requirement. The company is also setting up 100MW captivepower plant, which is expected to come on-stream by March 2011.

Sharekhan ValueGuide September 200951
RemarksRemarks
Ipca Lab � A well-known name in the domestic formulation space, Ipca has successfully capitalised on its inherent strength inproducing low-cost APIs to tap export markets. The company's ongoing efforts in the branded promotional businessin emerging economies, revival in the UK operations, pan-European initiatives and a significant scale-up in the USbusiness will drive its formulation exports.
ICI India � Improvement in macro-economic conditions and consequential improvement in consumer sentiment will boost thepaint sales volume in the coming years. However in the near term the bottom line growth will be a function of marginexpansion due to sharp correction in the prices of crude oil and its derivatives. The company has Rs1,000 crore ofliquid investments on its book, which translates into free cash and cash equivalents of around Rs265 per share. Theongoing buy-back will keep the stock price buoyant in the near term. Moreover with ICI UK getting acquired by AkzoNobel, the company would get access to wider portfolio of products coming from Akzo Nobel’s stable.
Jaiprakash Asso � Jaiprakash Associates, India's leading cement and construction company, is all set to reap the benefits of India'sinfrastructure spending. The company has also monetised very well on the real estate properties of YamunaExpressway. Moreover, the marked improvement in macro environment has improved accessibility to capital andthus eased the concerns of liquidity to some extent. However, higher leverage could act as drag on the valuation.
Mold Tek Tech � Mold-Tek Technologies has a steady-growing plastic packaging business and is aggressively scaling up the knowledgeprocess outsourcing business. The company is also likely to expand into the infrastructure vertical apart from high-rise building verticals. We expect the company’s revenues and earnings to grow at 22.8% and 13.7% respectivelyduring FY2009-11.
Orbit Corp � Given its unique business model, Orbit is expected to cash in the massive re-development opportunities in southern andcentral Mumbai. The company has shown marked pick-up in volume in the recent past. However, Orbit’s recent QIP issueis likely to result in earning dilution and to remain an overhang on the stock in the near term.
PNB � PNB has one of the best deposit mixes in the banking space with low-cost deposits constituting around 39% of itstotal deposits. A strong liability franchise and technology focus will help the bank boost its core lending operationsand fee income related businesses.
Ratnamani Metals � Ratnamani is the largest maker of stainless steel tubes and pipes in the country. In view of the buoyant demand forstainless steel tubes and pipes from its clients, including BHEL and L&T, and an order book of Rs350 crore, we expectits revenues to grow at a CAGR of 12% over FY2009-11E.
Selan Exploration � Selan is an oil exploration & production company with five oil fields in the oil rich Cambay Basin off Gujarat. Theinitiatives taken to develop and monetise the oil reserves in its Bakrol and Lohar oil fields are likely to significantlyramp up the production capacity and lead to re-rating of the stock.
SEAMEC � SEAMEC, with its fleet of four MSVs, is a key beneficiary of higher rates for MSVs due to the surge in oil explorationspends. Going forward, the operations of all the four vessels would boost the company's overall performance, whileabsence of any dry docking days in the current year would improve utilisation.
Shiv-vani � Shiv-Vani Oil & Gas Exploration has emerged as the largest onshore oil exploration service provider in the domesticmarket. Its strong order book of Rs3,500 crore, which is 4.3x its FY2009 revenues, provides great visibility to its earningsfor the next two years. The earnings are estimated to show a CAGR of 16.3% during FY2009-11E.
Subros � Subros, the largest integrated manufacturer of automobile air conditioning systems in India. The company is expectedto be the prime beneficiary of buoyancy in the passenger car segment led by its key clients Maruti Suzuki India,TataMotors and Mahindra & Mahindra.
Sun Pharma � With stronghold in domestic formulation market, an impressive growth in the US outfit, Caraco, Sun Pharma has recentlybecome an aggressive participant in the Para IV patent challenge space. Having already garnered four exclusivityopportunities in the USA, further news flow on Para IV challenges and Taro acquisition would drive the stock. However,the recent FDA action on Caraco significantly compounds the near-term growth outlook for Sun’s base US business.
Torrent Pharma � A well-known name in the domestic formulation market, Torrent has been investing in expanding its internationalpresence. With the investment phase now over, Torrent should start gaining from its international operations inRussia and Brazil. The impending turnaround of its German acquisition, Heumann, will also drive the profitabilityof the company.
UltraTech Cement � Going forward, UltraTech Cement should benefit from capacity expansion and investment in captive power plants.Despite our expectation of subdued cement prices in future, its OPM is expected to improve in FY2010E. A 4.9MTPAcapacity expansion in Andhra Pradesh and savings accruing on account of new captive power plants will improvecost efficiency of the company. Further, synergies with Grasim Industries will reduce its freight and marketing cost,thereby improving its OPM.

Sharekhan ValueGuide September 200952
RemarksRemarks
United Phos � United Phosphorus Ltd (UPL) is a leading global producer of crop protection products, intermediates, specialtychemicals and other industrial chemicals. The company has presence across value-added agricultural inputs rangingfrom seeds to crop protection products and post-harvest activities. We expect UPL’s bottom line to grow at CAGRof 28% during FY2009-11E. The company’s diversified product portfolio, strong distribution network and presenceacross geographies make it a good investment play in agrochemical space.
UBI � Union Bank has a strong branch network and an all-India presence. The net NPAs are below 1%, indicating strongasset quality along with a healthy asset growth. With strong return ratios and stable performance in terms of variousoperating parameters, the bank is a good investment play.
Zensar � Zensar, promoted by the RPG group, has effectively utilised the inorganic route to gain critical mass in the fast growingenterprise solutions segment and extend its presence in newer markets.
Vultures’s Pick
Esab India � ESAB India is a leading manufacturer of electrodes and welding equipment. A change in the positioning of its productsfrom low-margin, high-volume products to quality and high-margin products would further boost its profitability.
Mahindra Lifespace� Mahindra Lifespace Developers is the only private sector player to have an operational SEZ in the country—theChennai SEZ. Leveraging its rich expertise, the company is planning to develop one more SEZ in Jaipur. We also expectsignificant improvement in the margins primarily due to higher revenue contribution from Chennai's non-processingarea and better realisation for Jaipur SEZ processing area. Consequently, we expect the company's net income to growat a CAGR of 53.4% over FY2009-11.
Orient Paper � Orient Paper is in the process of increasing its capacity from 3.4 million tonne to 5 million tonne. The 50MW captivepower plant and cement plant at Devapur is delayed by a quarter and now expected to come on stream by Q2FY2010.The new capacities are expected to drive the earnings of the company.
Tata Chemicals � Tata Chemicals, the leading soda ash producer in India, is set to benefit from a diversified business model and its globalpresence. With the acquisition of GCIP, the company has become the second highest soda ash producer in the worldwith a combined capacity of 5.5mmtpa. It is also a leading manufacturer of nitrogen and phosphate fertilisers in India.It has de-bottlenecked its urea capacity to 1.3mmtpa and is expected to benefit from regulatory changes in fertiliserindustry.
Unity Infra � Unity Infraprojects, a leading construction company with well-diversified expertise across projects, is expected to bethe key beneficiary of realty sector's growth and the government's thrust on infrastructure spending. Moreover, themarked improvement in macro environment should ease the pressure going forward. The order book remains strongat around~Rs2,800 crore, 2.5x its FY2009 revenues. We expect its top line to grow at CAGR of 17.5% on the backof a strong order book during FY2009-11.
WS Industries � WSI, country's leading insulator maker, is all set to benefit from the three-fold rise in investment in the power T&Dsegment. A strong order book of about Rs200 crore for insulators and Rs60 crore for projects coupled with a shiftto higher-margin hollow insulators will drive the earnings. The company is planning to develop a 10-lakh sq ft ITpark in Chennai. Taking WSI's current 59% stake in its realty venture, we arrive at a value of Rs20.3 per share forthe realty venture alone.
Cannonball
Allahabad Bank � Allahabad Bank with a wide network of over 2,200 branches across the country has a strong hold in the northernand eastern parts of India. With an average RoE of ~17% during FY2009-11E, the bank is available at an attractivevaluation.
Andhra Bank � Andhra Bank, with a wide network of over 1,200 branches across the country, has a strong presence in south Indiaspecially in Andhra Pradesh. With an average RoE of ~19% during FY2009-11E, the bank is available at attractivevaluation.
IDBI Bank � IDBI Bank is one of leading public sector banks of India. The bank is expected to improve its core performance significantly,which is likely to reflect in the form of better margins and return ratios. Furthermore, the much-expected capital assistancefrom the government would fuel business growth going forward. Moreover, a huge investment portfolio adds substantialvalue to the bank.
Madras Cement � Madras Cement, one of the most cost-efficient cement producers in India, will be benefited due to capacity additioncarried out ahead of its peers in the southern region that would lead to higher volume growth. The 3-million-tonneexpansion will provide the much-needed volume growth in future. However we believe company to face much higherpressure on realisation due to upcoming capacity.

Sharekhan ValueGuide September 200953
RemarksRemarks
Phillips Carbon � Phillips Carbon Black Ltd, a leading carbon black manufacturer in India, is one of the key beneficiaries of the revivalseen in the domestic tyre industry. The company also generates substantial revenue from the sale of surplus powerin the open market after meeting its captive demand. The surplus power sale is likely to be a major positive impacton its earnings. Consequently, we expect the company to report significant improvement in its financial performanceover the next two years.
Shree Cement � Shree Cement's 1-million-tonne seventh clinker line has come on stream in March 2009. The cement grinding capacityof the company now stands at 9.1 million tonne and is expected to be 12MMT by the end of FY2010. Thus, the volumegrowth in the cement division and additional revenue through sale of surplus power capacity will drive the earningsof the company.
TFCI � TFCI provides financial assistance to hotel and tourism sector. As TFCI is exposed only to this sector, its performanceis inextricably linked to the prospects of this sector. This was largely responsible for TFCI's earlier financial problems.However, things are now looking very promising for TFCI with improved asset quality and strong loan demand dueto significant expansion plans lined up by the hotel and tourism sector. We expect TFCI's earnings to grow at a CAGRof 18% over FY2009-11E.


Sharekhan PartnersANDHRA PRADESH � Guntur—Mrs.A. Padmavathi, 227571; � Hyderabad—Mr. Srinivasa, 32950585; Mr. K. Aswani Kumar, 24041949; Mr. Yasoob Akbar Hussain / Mr. Gulam Mohammad Hashim,24574114; Mr.G.Gopala Krishna, 32423129; Mrs M Shantha Kumari, 23042908; Mr. Mohammed Vikhar Mohiuddin, 9963106942; Mr.K Ventaka Ramana, 9440767124; Mr.SubrahmanyamKorisapati, 9949652597; Mr.Kishore Babu Bejawada, 9849079774; (1)Mr.S.N.V.Krishna.(2)Mr. Ashvin Kulkarni, 30425211; Mr. Kamruddin Kalimuddin, 27670511; Mrs. Madhavi Sunkara,64562065; Mr.Koduri Venkata Reddy, 42024131; Mr. Gopireddy Laxma Reddy, 32577377; Mr. Karra Bhaghavan Reddy, 9866615862; Mr. Srinath Bompalli, 9959745451; Mr. Srisailam Kolupula,9866358540; Mr. Patha Rajesham, 9246374320; � Kadapa—Mr. Syed Tajuddin Baba, 241244; � Karimnagar—Mr.Vemula Akkanna, 2253777; Mr.K.Sampath Reddy, 6451286; Mr. MenganiShashikanth, 9912146618; � Kuchipudi—Mr. Chinda Ashoka Raju, 252006; �Kurnool—Mr.O.Prabhakar Reddy, 276485; � Mahabubnagar—Mr. Kassa shiva Kumar, 220175; � Mandapeta—Ms. Sarojini Kaki, 233553; � Metpalli—Mr. Ramu Akula, 226820; � Nalagonda—Praveen Kumar Reddy M, 9885582718; � Rajamundry—Mr.Maridiyya Yajjavarapu, 2434180; � Secunderabad—Mr.Thumeti Jagadeesh Kumar, 9849274284; Mr. G Vinaya Chandran, 27861304; Mr. Venugopal Shankar Bodhuna, 27071546; Mr.G.Gopala Krishna, 32423129; � Shadnagar—Vuppu karthik,9885508180; � Siddipet—Mr. Praveen Kumar Poloju, 9985087304; � Vijaywada—Mr. Shyam / Mr Narendra Kumar, 2550713; Mr. Maganti Rajyalakshmi, 9440180390; � Visakhapatnam—Mr. V. Vankatram, 2505642; Mr. Sunil Kumar Chaudhari, 2794172; Mr. Praveen Yarra, 6467679; Mr. Gopichand Lingamaneni, 2798844; � Vizianagaram—Mr. Pachigolla Arun Kumar, 232282;� Warangal—Mr.Satish Kumar Athirajula, 9959860898; � West Godavari—Mr. I Pardha Saradhi, 252250; ASSAM � Duliaganj—Ms. Sabera Sahin; � Moranhat—Mr. Ankush Kumar Agarwalla,9864452262; � Sivasagar—Mr. Rajesh Goenka, 220195. BIHAR� Arrah—Mr. Kamal Das/ Ms. Gunjita Das, 238885; Mr. Arun Kumar Singh, 9835455978; � Begusarai—Mr. Dinanath Jha, 237307;� Bettiah —Mr. Niraj Chowdhary, 241512; � Bhagalpur—Mr. Rajesh Ranjan / Mr. Sanjeev Ranjan, 2409556; � Biharsharif—Mr.Rajiv Kumar, 233232; � Darbanga—Mr. Bijay Mohan, 9334022554;Dumraon—Mr. Jeetendra Kumar Prasad, 222947; � Gaya—Mr.Shashi Bhushan Kumar, 2220298; � Harnaut—Mr. Santosh K Kumar, 276213; � Motihari—Mr. Anil Kumar, 239398; � Muzzaffarpur—Mr. Manoj Lohia, 2269982; � Narkatiaganj—Mr. Sushil Agrawal, 242269; � Patna—Mr. Ajay Kumar, 2222649; Mr. Vivek Anand, 2266230; Ms. Renu Bairoliya, 2238428; Mr. Mohammed Ata Ashaf,2226495; Mr. Alok Kumar, 222953; Mr. Krishna Rungta, 2213112; Mr.Satyendra Kumar Singh, 9334640448; Mr. Rajesh Choudhary, 2616104; Mr. Vidyanand Singh, 2207887; Mr. Ranjay KumarSinha, 9835232766; Mr. Romit Kumar, 3252465; Mr Dhiraj kumar singh, 3256359; � Raxual—Mr. Vikash Agarwal, 225023; � Sitamarhi—Mr. Prabhat Kumar Goenka, 252400; � Siwan—Mr.PankajKumar Verma, 9430211114. CHATTISGARH � Ambikapur—Mr. Bir Bhadra Pratap Singh, 224382; � Balod—Mr. Dinesh Tapariya, 222416; � Bilaspur—Mr. Deepak Verma, 255055; � Dhamtari—Smt.Sarita Nankani, 237922; � Durg—Mr. Prashant Yadav, 2329968; Mr. Amit Shukla, 2320924; � Korba—Mr. Nalin Shah/Mr. Deepak shah/Mr. Kiran Jit Rajpal/Mrs. Maya Agrawal/Mrs. KomalAgrawal, 9425532513; � Raipur—Mr. Premchand Jain / Mr. Pukhraj R Bardia, 4033229; � Rajnandgoan—Mr. Pramod Agrawal, 404115. GOA � Margao—Mr. Suresh Fernandes, 3235892; MsJudith Kalpana De Almeida, 2736607; � Merces—Mr. Sunil Kumar Kamta Singh, 2903174; � Panaji—Mr. Praveen Vishnu Shamain / Mr. Shirish Jagdish Sardesai, 6653231; � Vasco—Mr. ParagMehta, 2512361; GUJARAT � Ahmedabad—Mrs. Asha Tejas Patel / Mr. Tejas Patel, 69465183; Mr. Ibrarul Haque Mohd Akhtar, 26826115; Mr. Tejas Amin, 30021096; Ms. Falguni Asim Mehta,26440394; Mrs. Daxa Vimal Patel, 26464013; Mrs. Paulomi Sanjay Golaskar, 40035001; Mrs. Kuntal Vijay Modi, 26850577; Mr Vivek Ganesh Prajapati, 27450641; Mr. Sanjay Basantram Gidwani,22820879; Mr. Sanjay Balubhai Savaliya, 9879958715; Mr. Usha Satish Ailani, 22171064; Mr. Shivbhadra Zala, 27532131; Mr. Harish Mohan patel/Mr. Tejash Girish Shah, 22810929; Mr. RashmikantNatwarlal Shah, 9924917277; Mr. Tejas Narendrapuri Goswami/Mrs. Ritaben Chavda, 30172030; Mr. Samir Avnitbhai Shah, 9374656818; Mrs. Monita Dharmendra Somaiya, 66614014; Mr. ParagMahendrakumar panchal, 40068205 Mr.Niraj Shah, 26303637; Mr.Harsh Govindlal Devmani, 27516064; Mr.Parag Arvindbhai Dave, 9998941719; Mr. Naresh patel, 9979972783; Mr. RameshNatwarlal Shah, 22819442; Mr. Samir patel/Ms. Kamini patel/Mr. Hiren patel/Mr. Ambalal Patel, 9974165032; Mr. Alpeshkumar Punjabhai Patel, 9879530810; Ms. Rabea Narmawala, 26641548;Mr. Alkesh Vinodbhai Chokshi, 30160222; Mr. Navinchandra Fulchand Ravani, 22730237; Mr. Jitendrabhai Mohanbhai Patel, 25834410; Mr. Pravindan Shambhudan Gadhavi, 9825852658;Mr. Harshal Barbhaiya, 26620888; Mr. Shaikh Mohd Saajid, 9328134301; Mrs. Vaisakhi Pratik Shah, 9998143855; Mr. Rajesh Thakkar/Mr. Ketan Chandubhai Barot/Saurabh Ravindrabhai Bhatt,9725327265; Mrs. Sejal Amit Shah, 26632439; Mr. Bijal S Shah, 9825972962; Mr. Ankit Upendra Shah, 40066059; � Anand—Mr. Jignesh Thakorbhai Ray, 655706; Mr. Virenkumar DipakkumarDesai, 278707; � Anaval—Mr. Dharmishtha Girishbhai Parmar, 252232; � Anjar—Mr. Denish Vasantbhai Manek, 240311; � Ankleshwar—Mr. Jaydeepsinh B. Borasia, 270237; Mrs. Nilam MayankPatel, 227120; Mrs. Kairshma Chintan Mehta, 9825567080; Mr.Nilesh Bavishi, 9824131209; Mr. Mehulkumar Dineshchandra Patel, 9824733942. � Banaskantha—Mr. Pasheriya NoormohmedH, 9898950520; � Becharaji—Mr. Vipulkumar Sheth, 286001; � Borsad—Mrs. Tejal Vijaykumar Shah, 288454; � Bharuch—Mr. Nehal Anilbhai Patel / Mr. Pinakin Janmejay Mahant, 226322;Mr. Mazhar Abdeali Hirkani, 257312; Mr. Sasikumar Manjanath Velaydhan, 288742; Mr. Arpan Kishorchandra Parikh, 9979476697; Mrs.Nishaben Vipulbhai Patel, 240502; Mrs. MinaxibenKamlesh Parmar, 240632; Mr. Zubin Rohinton Jambusarwala, 226243/226244; Mr. Krunal Bhagvatbhai Jadhav, 9824477744; Mrs. Daxa Sanjay Patel, 246056; � Bhavnagar—Mr. JaypalsinhJasubha Chudasama, 3005712; Mr. Nrusinh Bansidas Tilavat, 2227051; Mr. Dhaval Jagdishbhai Thadesar, 2429844; � Bhuj—Mr. Mansukhbhai Thacker, 30936581; Mr. Rakesh patel, 9879320507;Mrs. Lopa Jignesh Vasa, 645229; Mr. Pradipsinh Jadeja, 9925171191; Mr.Pranay Manojbhai Sompura, 9428898278; � Billimora—Mr. Piyush Gandhi, 286100; Mr. Bhavin Patel, 285097;� Botad—Mr. Tushar Kalathiya, 242799; Mr. Narendra Kanubhai Vala, 51740; � Dahod—Mr. Mahendra Vadilal Kadia/Mr. Prakash Mamnani, 645569; Mr. Jignesh N Kabrawala, 242876;� Deesa—Mr Vinaykumar Agrawal, 9824252715; � Dhasa—Mr. Ghanshyam V Padhariya, 233400; � Dholka—Mr. Firoz Ahmed Abdul Karim Mansuri, 221919; � Dhrangadhara—Mr. Vipulkumarlalitchandra Halani, 9825922024; � Gandhidham— Mr. Sunil Rupchand Virwani, 229447; Mr. Manish Tribhovan Mirani, 230401; Mr. Tinu Dhirajlal Gandhi, 232174; � Gandhinagar—Mr. UrvishShah, 30583058; Mr. Vivek Anilgiri Goswami, 9879977100; Mr. Ajay Chandubhai Patel, ;9427054721; Mr. Tushar Hansrajbhai Thakkar, 9327359389; � Godhara—Ms. Jayshri Haren Shah / Mr.Bhavin Patel, 249791; Mr. Kiran D Pathak, 249793; � Gozaria—Mr Sandipkumar Yogeshbhai Patel, 9998219439; � Halol—Mr. Ketan patel, 9824545939; � Hansot—Mr. Dhaval Natvarlal Patel,262278; � Himatnagar—Mr. Atulkumar Haribhai Patel, 244573; Mrs. Nurjhabanu Mamon, 240796; � Idar—Ms. Rathod Jyotikaben Dilipsinh, 251052; � Jamnagar—Mr. Bhavesh K Kataria /Mr. Hitendra K Kataria, 2713306; Mr. Jyotiraja Sodha, 2665053; Mr. Pradipbhai Radia / Mr. Vasantbhai Barai / Mr. Paras Popat, 2510712; Mr. Narendra Vrajpal Sumaria, 2567288; Mr. KalpeshKundalia, 9879225375; Mr. Naishdh Chandarana, 2677710; � Junagadh—Mr. Manish padaliya/Mr. Dipak Fadalu/Mr. Bhavesh Bhalani, 9824204462; Mr. Nitin Mansukhbhai Savaliya, 2650824;Mr. Jignesh Navnitbhai Mehta, 9724343747; Mr. Siddharth Gopaldas Lathigara, 9824350452; Mr. Mehul Jentilal Zinzuvadiya/Mr. Mukesh Ashokbhai Pritmani, 9998777799; Mr. RajeshChimanbhai Shilu, 2573938. � Kadi—Ms. Linaben Nilpesh Patel, 244466; Mr. Mayur Dilipkumar Barot, 4263109; � Kalol—Mr. Hitesh Shah, 236555; Mr. Giriraj Vitthalbhai Makwana, 9898935749;� Kapadwanj—Mr. Dinesh Mafatlal parekh, 253210; � Kathlal—Mr. Ketankumar Patel, 243192; � Keshod—Mr. Nilesh Savjibhai Kotadia, 233680; Mr. Divyesh Kotadia, 233479. � Khedbrahma—Mr. Himmatkumar M Vaishnav, 221942; � Kosamba—Mrs. Priti Ajitsingh Atodaria, 232817; � Lunavda—Mr. Jayantibhai Hirabhai Patel / Mr. Iqbal Ahmed Mansur, 250163. � Mahudha—Mr. Dipenkumar Mukeshkumar Patel, 9427855281. � Limdi—Mr. Jasmin Medhia, 237277; � Mehsana—Mr.Patel Bharat Haribhai/Mr.Nareshbhai Girdharbhai, 220254; Mr. Govind MaganlalPatel, 223294; Mr.Patel Lalitkumar Hargovanbhai, 290701; Mr. Mehulkumar Dashrathbhai Patel, 231480; Mr. Bhaveshkumar Babulal Dave, 9925042521; Ms. Ramilaben B Patel, 251251; Mr.Tejas H Shah, 9824058609; � Mithapur—Mr. Rana Visabhai Chanpa, 223777; Mr. Sanjaykumar Vallabhdas Gokani, 223222; � Modasa—Mr. Jayram Chandrakant Soni, 244095; � Morbi—Mrs.Smita Pravin Vajaria,223579; � Mundra—Mr. Suresh Vishanji Patel, 9879032211; � Nadiad—Mr. Ganpat Ramji Parmar, 9427077389; � Nakhatrana—Mrs. Alpa Gopalbhai Bhatt, 221738;� Navsari—Mrs. Rikita Keyur Patel, 272426; Mr. Vishal Mahendrabhai Patel, 9879488088; � Okha—Mr. Priteshkumar Parsotam Savjani, 9228262495; � Padra—Mr. Mukesh Nandlal Thakkar,224664; � Palanpur—Mr. Ashok Virsang Patel, 9825732305; Mr. Vinodkumar Somalal Thakkar, 250451; � Patan—Mr. Shripal D. Shah, 325759; � Petlad—Mr.Jeetendra Mohanbhai Relani,9824590848; � Prantij—Mr. Viral Patel, 571931; � Rajkot—Mr. Ketan Masrani / Mr. Mihir, 2227687; Mr. Mihir Pravinbhai Jivrajani, 2440664; Mr. Vishal Jaysukh Shah, 2226496; Mr. Narendrahasmukhlal Shah, 2572800; � Sihor—Mr. Jaydeepsinh Anirudhsinh Gohil, 222750; � Silvassa—Mr. Faisal Anisahmed Siddique, 3294958;� Surat—Mr. Shailesh Ambalia, 2453070; Mr. GaurangParvadia, 3257809; Mr. Shreyas Shroff, 2474400; Mr. Shailesh Kusumchand Jhaveri, 2598898; Ms. Krutika Amit Mehta, 9825831781; Mr. Biren Chhatrapati, 5537174-73; Mr. Devraj ShambhubhaiBaldha, 0261-2632524; Mr. Ismail Faruk Tai, 2499121; Ms. Rakhi Jignesh Surti, 276182; Ms. Khatijabibi Ismail Alloo, 9879524676; Mr. Nitin Shanti Parmar, 6543562; Mr. Amit Mehta, 9925207088;Mr. Jayesh P Madhani/Mr. Babulal madhani, 2492733; Mr.Dipak Hasmukhlal Majithiya, 2532013; Mr. Jayesh Dhirajlal Vaghasiya, 9913072701; Mr. Nilesh Khimjibhai Ajudiya, 9925533815;Mr. Ritesh Batukbhai Thumar, 9377780208; Mr. Amit Changanlal Chauha, 9909242324; Mr. Pravin Murlidhar Tahiliani, 9974045892; Mr. Parshvakumar Ashokbhai Jhaveri, 2593100.� Surendranagar—Mr. Himanshu Chandulal Thakkar, 221477; � Unjha—Mr. Namik H Bhatt, 645171; Mr. Hemant P Patel, 240666. � Upleta—Mr. Saurabh Suresh Parmar, 9998932963;� Vadodara—Mr. Ashish Vishwanath Rana, 6454622; Mr. Durgesh D. Babariya, 6531799; Mr. Mohit Sadarangani, 6640971; Mr.Tirthank J. Rindani/ Ritu T, 2353684; Mr.Jaydeep RanchhodbhaiShah, 2353336; Mr. Viresh Chandrakant Thakkar, 2233457; Mr. Bharatbhai Patel, 2711647; Mr. Rohit Sarabhai Gandhi, 2464012; Mr. Mittal Naik, 5545557; Mr. Sandip Dinesh Patil, 6454514; Mr.Tejas Shah / Mr. ZAKIR TINWALA, 2783040; Mr. Naimish S. Tiwari, 3919543; Mr. Minesh Hasmukhlal Shah, 3916182; Mr. Anish Vipin Salat, 2351548; Mr. Pranav Dineshbhai Patel/Mr. Keyur HarishbhaiPatel, 9909100720; Mrs. Amita Arun Mehta, 2661784; Mr. Imranbeg Mahmadbeg Mirza, 2416633; Mr. Jayesh Dave, 2634326; Mr. Vishesh ray, 6640776; Mr. Harish Babu Shetty, 9925142692;Mrs. Toral Rupeshkumar Patel, 9998979227; Mr.Sajid Tareq Shaikh, 9898463462; Mr. Vinod Ratilal Patel, 2283487; Mr. Ketankumar Kishorebhai Thaker, 9426765022; Mr. SiddharthsinhAshoksinh Mahida, 9879296583; Mr. Vishal Narendrabhai Parikh, 2314797; Mr. Dinesh Kumar Sharma, 2354220; Mr. Niraj Arvindbhai Patel, 2662281; Mr. Dhiren Girishbhai Patel, 2341942.� Vadtal—Mr. Mishankkumar Vasantbhai patel, 2589572; � Valsad—Mr.Kaushal C. Gandhi, 243636; Mr. Amin Ramju Sameja, 253720; � Veraval—Mr. Prakashbhai Jayantlal Jogia, 9228395847;� Veraval—Mr. Prakashbhai Jayantlal Jogia, 9228395847; � Vijapur—Mr. Satish A Patel, 9824154282; � Visavadar—Mr. Paresh Ramniklal Nathwani/Mr. Yagneshbhai Dineshbhai Sadrani,9375934409; � Visnagar—Mr.Patel Bharat Haribhai /Mr.Nareshbhai Girdharbhai, 9375934409; Mr. Govind Maganlal Patel, 223294. HARYANA � Ambala—Mrs.Aruna Yadav, 2691014; Mr. AjitSingh Dogra, 2670375; Mr. Priyank Jain, 2443020. � Bahadurgarh—Mr. Vijay Dandeva, 65474625; � Faridabad—Mr. Subhas Chand Jain / Mr. Anilkumar Jain, 4004191; Mrs. Madhu Mangla/Mrs. Sarika Pandhi, 4037370; Mr. Madhu sudan sharma, 250779; Mr. Dheeraj Kant, 9911798871; � Farrukhnagar—Mr. Rajat Jain, 2375310; � Fatehabad—Mr. Parmender Malik, 9416499086;� Gurgaon—Mrs. Harsha Mangla, 4063785; Mr. Raj Kumar, 3242549. � Hisar—Mr. Dipender Malik, 9416926662; � Karnal—Mr. Manish Aggarwal, 4032675; � Khanna—Mr.Rajeev Garg,221440; � Kundli—Mr. Dinesh Kumar Bansal, 2372073; � Ladwa—Mr.Rohit Kumar, 9896485864; � Rewari—Mr.Akhilesh Kaushik, 9315511131; � Rohtak—Mr. Pawan Kumar, 299634; Mr. AzadSingh, 9255476147. � Samalkha—Mr. Ashok Kumar, 6499793. � Sonipat—Mr Sanjeev Gupta, 2243898; Mr.Ravinder Suresh Kumar, 6452238. � Yamunanagar—Mr. Sanjeev Kumar/Mrs. MeghaSharma, 9896920899. HIMACHAL PRADESH � Chamba—Mr. Vijay Abrol, 223567. � Hamirpur—Ms.Promila Devi, 224066. JAMMU & KASHMIR � Jammu—Mr. Ajay Kapoor, 2574145; Ms. LaxieKapoor / Mr. Ajay Kapoor, 21073341; Mr. Ajay Kapoor, 2107722/6421; Mr. Ajay Kapoor, 2594885; Mr. Ajay Kapoor, 9419193526 � Pulwama—Mr. Irshad Mushtaq Zarqoop, 2485730; � Srinagar—Mr. Irshad Mushtaq Zarqoop, 2485730. � Udhampur—Mr. Ajay Kapoor, 202458/59. JHARKHAND � Jamshedpur—Mr. Navin Kumar Thaker, 275191; Mr. Sunil Kumar Singh, 2441182; � Bokaro
Steel City—Mr. Mihir Kumar Jha, 231087; � Chakulia—Mr. Prabhat Kumar Lodha, 233393; � Dhanbad—Mr. Dhiraj, 2301714; Mr. Kalicaran Paul, 9334350164; � Jamshedpur—Mr. Manoj KumarAgarwal / Mr. Dilip Agarwal, 2428435; Mr. Dilip Agarwal, 2428034; Mr.Dilip Kumar Agarwal, 2423015; Mr. Dinesh Ahuja, 2290640; Mrs. Jayshree Vyas, 9304973177. � Pakur—Mr. Tripurari KumarPandey, 9334922789. � Ramgarh—Mr. Rajeev Murarka, 230710; � Ranchi—Mr. Pravin Murarka. / Mr. Rajiv Murarka, 2208205; Mr. Subinoy Banerjee, 3295162; Mr. Rajeev Murarka, 2242684;� Sahibganj—Mr. Naiyarul Islam, 278911. KARNATAKA � Bangalore—Mr. Raghupathi Bhai, 41674396; Mrs. Bhavna Mohandas, 26494500; Mr. B. G. Anirudh.,26560931; Mr. Naveen Talreja,41234042; Mr. Nagendra Gupta Prashanth, 26522725; Mr. Malar Anand, 23548398; Mr. Malar Anand, 41757016; Mr. Chandrashekhar B, 22274353; Mr. Kishore Srinivasa Murthy, 41285784; Mr.

Siddarame Gowda, 57731320; Ms.Lakshmi S. Sundar, 41279779; Mr. Pankaj Bafna / Bhavesh Mehta, 23445136; Mr. Vinod Mahajan, 32002235; Mr. Aswin Babu, 26791414; Mr. Subbiah GaneshValliappa, 9791662256; Mr. Vamana Prabhu R, 41744272; Mr. Varun Pratap Singh Chauhan, 41643756; Mr. Govardhan Lakshminarayan Thapsi, 41526047; Mr. Naveen kumar S U, 23147609;Mr.Garikehalli Bettegowda, 41426224; Mrs. Naina Patawari, 9845772345; Mr.Vinod Kumar Mahajan, 9448411212; Mrs.Srivanitha Subbarao, 23465807; Mr.Manikandan Panchavaranam,41317348; Mr.Srinivas Megaravalli, 22424874; Mr.Dayananda Shayana, 9886377371; Mr. Aurel David, 3653622; Mr. Purushotham Channd Gowda, 9845187119; Mr. Jonak Gupta, 64531562/63;Mrs. Meera Srinivasan, 26545701; Mr. T P Ravi, 23461990; Mr. Ravindra Prasad Krishnamurthy/Mr. Ajay Nagaraj, 9980012307; Mr. Bharath Rajathadripura Narasimhaswamy, 26549212; Mr.Trilok Hebbur Gopalkrishna Gupta, 9740322996. � Belgaum—Mr. Sameer / Mr. Chandrakant Anvekar, 2427077; Mr. Shivanand Ballappa Shirasangi, 9731570202. � Chintamani—Mr. VinodMahajan/Mr. Gopinath N A, 9343801223/9886063855. � Davangere—Mr. Raju Chilukuri, 234446; � Dharwad—Mr. Avinash Mehta, 2747808; � Gadag—Mr. Vivek H Kulkarni, 656946; �Gulbarga—Mr Jaganathreddy Girareddy Sherikar, 9886444521; � Hubli—Ms. Nanda Virupax Umarani, 4256666; Mr. Prashant Gudisagar, 9916014139; � Karwar—Mr. Uttam Maruti Pavaskar,229108; � Kolar—Ms. Sumar M R, 286535. � Kundapur—Mr. Vittaldas Prabhu, 234855. � Malleshwaram—Mr. M.I.S. Iyengar, 23565041; � Mangalore—Mr. Pradeep Rao / Mr. Girish Revankar,2441318; Mr. Shrikrishna Bhat, 2423612; � Manipal—Mr. P Gurudas Shenoy, 2574505; � Mysore—Mr. Dinesh Bhansali / Mr. Vijayraj, 4262374; � Sagar—Mr. H. V. Ramamurthy, 220055; �Shimoga—Mr. Pankaj Baid, 9880598895; � Sirsi—Mr. Santosh Sharma, 266204; � Tumkur—Mr.K.N.Sreenivas, 9448693868; Mrs. K N Hema, 2254299. � Udupi—Mr. Anantha Nayak, 2520844;� Vijaynagar—Mr. Gnaneshwara N / Mr. Ramamurthy B, 41515376. KERALA � Alleppey—Mr. Ajith kumar R.N., 2263636; � Calicut—Mr. Jijeesh kumar .P.G, 2741962; Mr. Vasudevan M. P., 2377006;Mr.Remmy Padmanabhan Palolickal, 2369379; � Chalakudy—Mr N.K.Shiju, 2706898; � Changaramkulam—Ms. Raiza Mohamed, 9744096530. � Ernakulam—Mr. P V Santosh Kumar, 353875;Mr Sinil U S, 4062606; Mr. Cherian Manamel Ninan, 353432/3258973. � Irinialakuda—Mr. Pradeep Thommana Devassy, 9946242003. � Kannur—Mr. Jose Joseph, 2456357. � Kochi—Mr.Cherian M. Ninan / Philp, 2369280; Jose Varghese, 2445455; Mr. Suresh Babu, 2356507; Mrs. Noby.P.Kuriakose, 2376676; � Kodungallur—Mr. Arun David Poruthukkaran Rappai, 2810147. �Kollam—Mr. Soosamma Pathrose, 2399500. � Kottayam—Mr.Ajith V.Karthikeyan, 9447888880; � Mannarkkad—Mr. Junhas K P, 223467; � Pala—Mr. Mathews Joseph, 221028; � Pavaratty—Mr. Abhilash Ramanathan, 2645372; � Perinthalmanna—Mr. Narayanan Purayannur, 396839; � Thalassery—Mr.P.Govindan Kutty, 2335829; � Thiruvalla—Mr. Jacob Varkey / Mr. Vijayakumar.K.K,2631046; � Thrissur—Mr. T R Gangadharan, 2605877; Mr. Joe Alex, 2331799; Mr. Shinto Sunny, 2426683; Mr. K Venugopal, 2402475. � Tirur—Mr. Surendran Patatil, 2125167. MADHYA PRADESH
� Balaghat—Mr. Manish Burade, 247879; � Betul— Mr. Vivek Agrawal, 233233. � Bhind—Mr. Ved Prakash Singh, 9301568011. � Bhopal—Mr.Sanjay Chauhan, 4287788; Mr. Mayank Naryani,4224358; Mr. Praveen Patidar, 9826023107. � Burhanpur—Mr. Ravindra R Aswani, 400185; Mr. Dushyant Arora, 401006. � Chhindwara—Mr. Sanket Chouksey, 236104 � Chhatarpur—Mr.Kuldeep Agrawal, 244210. � Dewas—Mr. Kushal Pisal, 9827240089. � Gwalior—Mr. Mayank Khandelwal, 4029490; Mrs. Bharti Verma, 4035369. � Ichhawar—Mr. Manish Kumar, 274556. �Indore—Mr. Dilip Bagora, 4067967; Mr. Hemant Mulchandani, 2543755; Mr. Vikas Sethia / Mr. Yogesh Gachkeshwar, 3013043, Mr. Praveen Kumar Agrawal, 9302107163. � Jabalpur—Mrs.RollyBardia / Mr. Saurabh Bardia, 4007775; Mr.Ashish Kumar Jain, Mr.Vivek Kumar Tamrakar, Mr.Vittal Rao Pottey, 2641214; � Katni—Mr. Amit Jain, 401892; � Khandwa—Mr.Dilip Kumar Thadhani,2221210; � Malanjkhand—Mr. Rajendra Nema, 257810; � Morena—Mr.Naval Agrawal, 250003; � � Nagda—Mr. Pavan Banka, 246320; � Neemuch—Mr. Kapil Balani, 225891; � Ratlam— Mr.Dhirendra Bhartiya / Mr. Ritesh Bafna, 400558; � Rewa—Mr.Rajneesh Gupta, 253417; � Sagar—Mr. Raja Jain, 403931; � Satna— Mr. Kuldeep Jaiswal, 224747; Mr.Ajay Sukhdani, 416844; �Seoni—Mr.Mukesh Garhewal, 222601; � Singrauli—Mr.Tejinder Singh, 267606. � Ujjain—Mr.Gaurav Surya, 2520708; Ms. Nidhi Jain, -2516126. MAHARASHTRA � Ahmadnagar—Mr. AmitSampatlal Khabiya, 2411667; Mr. Dattatraya Maruti Gabhale, 221741; Mr. Suresh Tathe, 2544004; Mrs. Vijaya Sushil Mutha, 2323163; Mr. Yogesh Prakash Supekar/Mrs. Manisha DnyaneshwarKale, 2322334; Mr.Shrenik Sureshlal Bhalgat, 230110; Mr. Ashutosh Vijaykumar Sonar, 2470800; Mr. Satiskumar Walke/ Mr. Deepak Dhadiwal/ Mr. Sunil Adsul, 2411005; Mr. Shivaji KondibaBandgar,9922843177. � Akluj—Mr. Rajendra Murlidhar Mogali, 225652; Ms. Manali Gandhi, 225620. � Amalner—Mr. Satish Khanderia, 224089; � Ambejogai—Mr. Sachin Bembade, 244999.� Amgaon—Mr. Sanjay Chandrakumar Agrawal, 225999. � Amravati—Mr. Himanshu Surendra Bhuyar, 9970094242. � Aurangabad—Mr. Kishor Soni, 2361240; Mr. Anand Kuril, 2363822; Mr.Jitendra Tejmal Burad, 2340800; Mr. Nilesh Kankaria, 6502601; Mr. Uday Ravindra Joshi / Mr. Arif Akber Patel / Mr. Waseem Khan Rafe, 2471469. � Baramati—Mr. Kiran Sampatrao Sawant,9822567641; � Barshi—Mr. Prashant Vijay Thakkar, 229137; � Bhandara —Mr. Amit Jayant Kavishwar / Shrikant Kale, 4560261. � Bhilwadi—Mr. Abhijeet Jaypal Walvekar, 237272. �Bhusawal—Mr. Milind Vasant Chaudhari, 202312. � Boisar—Mr. Imran N. Gilani, 324474. � Chandrapur—Mr. Harsh Ajaykumar Mittal, 252760. � Chinchwad—Mr.Sujay Sudhakar Kulkarni,27614332; Mr. Prashant Shinde / Mr. Atul Deshmukh, 65103510; Mrs. Sanjana Mahadeo Magar, 46701141. � Dhamangaon—Mr. Vivek Subhasrao Thakare, 251091. � Dhule—Mr. Jagdish Agarwal,237576; Mr. Nitin Gokuldas Ahuja, 9881261463; � Gondia—Mr. Nimit Patel, 235113; � Hinganghat—Mr. Mitesh M Joshi, 329200; � Ichalkaranji—Mr. Nilesh Kulkarni, 2439955; � Jalgaon—Mrs Mangala Kesharlal Bhadade, 2239346; � Jalna—Mr. Gaurav Ramniwas Kabra/Mr. Nitin Badrinarayan Agrawal, 9422216092. � Jaysingpur—Mr. Shrenik Ashokkumar Mangave, 229766.� Karad—Mr. Aniruddha Madhav Dhopate, 222338; � Khapoli—Mr. Mukund Bembade, 262442. � Kirloskarwadi—Mr. Prashant Jayprakash Hake, 223324. � Kolhapur—Mr. Ajay AnantKulkarni, 6681138; Mr. Arvind Savant, 2621998; Mr. Kamlesh Tarachand Oswal, 2541001; Mr. Shripad Vijay Deshpande, 2536609. � Latur—Mr.Mane Sudhir Vishwanathrao, 251053; Mr. RameshDeshmukh, 253510. � Mahad—Mr. Nadeem Nizamuddin Juwle, 223238/9. � Mahud—Ms. Sangita Pandurang Kadam, 246933. � Maindargi—Mr. Ravindra Mahadev Butte, 255037. �Malegaon—Mr. Sanjay Agrawal / Mr. Vijay Agrawal, 329750. � Nagpur—Mr. Amit Jayant Kavishwar / Ashok Narayan Alkari, 2222325; Mr. Hermahendrasingh Gulabrai Hura, 3256272; Mr. AjitPendharkar, 3255866; Mr. Radheshyam Taori, 2722360 ; Mr.Atul Gopalrao Saraf, 6455320; Mr. Pankaj Bhavnani, 2766033 ; Mr. Sanjay Jain, 2733 858 ; Mr. Pramod Kumar Bagdi, 2723487 ;Mr. Sushil Parakh, 2525584; Mr. Samit Thakkar, 6617009 ; Mr. Vishal Asnani, 6615385; Mr. Anand Shandejamikar / Mr Gopal M. Wankhede, 5603583; Mr. Amit Jayant Kavishwar / Banarasi Agrawal,9860608943; Mr. Amit Jayant Kavishwar, 9860608943; Mr. Amit Jayant Kavishwar / Shridhar Tungar, 3956408; Mr. Chandmal Surana, 9326945155; Mrs. Dipika Yogesh raja, 2778910; Mr.MonikSatish Gangar.,2737237; Mr.Kapil Suresh Thakkar, 2764021; Ms.Priyanka Varyani, 9226765310; � Nanded—Mr. Mahesh Shrichand Wadhwa, 242053; � Nandurbar—Mr. Dhruv RameshchandraAgrawal, 250633; � Nashik—Ms. Vinita Sandeep Sinkar, 2506117; Mr. Pramod Vasant Kakad, 2454104; Mr. Chandan Hemnani, 3201539; Mr. Suyog Khandve, 2597942; Mr. Kailas Puranik,2534138; Mr. Sanjay Shinde, 9822324309; Mr. Santosh Laxman Kothule, 2524195; Mr. Sachin Kulkarni, 2570983; Mr. Rohit Raman sagore, 2581951; Mr. Chetan S Pingale, 6610996; Mrs. NeelamNemichand Jain, 3012727; Mr. Mustafa Dilawar Mansuri, 9373888897. � Omerga—Mr. Yelikar Shafik Rajak/Pandit Santosh Bibhishan, 250101. � Palghar—Mr. Girish Tilwani, 251684; � Palus—Mr. Prashant Hake, 228343; � Parbhani—Mr. Mahesh Khake, 9422113882. � Parli Vaijnath—Mr. Vineesh Maroo, 225024. � Parner—Mr. Jitendra Shamrao Kale, 221392. � Phaltan—Mr. RamChandradas Gunani, 222449; � Pimpalner—Mr.Vinod B. Kuwar, 224288; � Pune—Mr. Vashu Balani, 7414751 ; Mr. Gopal Harsule, 25656573; Mr.Nitin Chandrakant Kulkarni, 227922; Mr.BalvirBaldevraj Chawla, 65316048 ; Mr. M. Ramachandran, 27030823 ; Mr. Mahendra Rasiklal Luniya, 26823659 ; Mr. Amit Ashok Ghatol / Mr. Saurabh Ghatol, 25510838; Mr. Kalera Sanjay Vashulal,26452442; Mr. Suhas Bhalchandra Chatane, 26990406; Mr. Ketan Ashok Shah, 26331485; Mr. Samir Nandkumar Harnol, 27272858; Mr.Nitin Mahendra Pareek, 27277719;Mr. Anil Tabib, 9822015488; Mr. Sachin Eknath Tapkir, 25280038; Mr. Aazam Shamsuddin Sayed, 26833691; Mr. Krishna Gowda, 26633344; Mr. Arun Sooryakant Gandhi, 65251693; Mr.Krishnamachari Iyengar, 24225650; Mrs. Neha kanani, 64701528; Mr. Deepakkumar Madanlal Sharma, 9890129943; Ms. Aarti ashok Mohire, 26056233; Mr Manish Ashok borkar, 9730021671;Mr. Bhushan Ratnakar Mahajan, 25452060; Mr.Aditya Jayant Kopardekar/Mr. Rupesh Subhashchandra Paliwal, 9922660022; Mrs. Archanan Santosh Jadhav, 65303542; Mr. Yogesh PrakashPingle, 65006447; Ms. Vaishali J Bagelikar, 30220845; Mr. Jignesh Kanani / Mr. Yograj Patel, 24215821; Mrs. Aditi Abhijit Kulkarni, 26055242; Mr. Ketan Ashok Shah, 9860045140; Mr. Nitin BabanBhosale, -66021301. � Rahata—Mr. Atul Sahebrao Shinde, 242163. � Rahuri—Mr. Jagannath Warkhede, 9271553457. � Ris—Mr. Jayaram Shravan Kokane, 9271553457. � Ratnagiri—MrBharat Premji Patel, 227244. � Roha—Mr. Pramod Anant Mhaskar, 9271101382. � Sahada—Mr. Naresh Lalchand Jain, 223529; � Sangamner—Mrs. Ujwala Chandrakant parakh, 221614;� Sangli—Mr. Rajesh Shah, 2326159, Mr. Chaitanya Mahadev Kulkarni, 9890691319; Mrs. Priyadarshani Kulbhushan Patil, 6957033. � Satara—Mr. Sachin Sadashiv Divakar, 234286; Mr.Jaywant Shrirang Kadam/ Mr. Umesh Pandurang Kadam, 248588; Mr. Sadashiv Ramhari Bagal, 232080. � Sinnar—Mr. Rahul Ratnakar Gujarathi, 220412; � Solapur—Mr. Amit Suresh Dhupad,3290925. � Talegaon—Mrs. Sharmila Hrushikesh Ranadive, 645104. � Umbraj—Mrs. Shital Sagar Mahamuni, 651696. � Varangaon—Mr. Yashwant Shambhudayal Chaurasiya, 263894.� Wai—Mr. Pisal Ganesh Uttamrao, 227534; � Yeola—Mr.Nilesh P. Shrishrimal, 268137. MIZORAM � Aizawl—Mr. Laldintluanga Sailo, 232778/223235. NEW DELHI � New Delhi—Mr. Tarun Bansal.,23288539; Mr. Balender Singh Negi, 40590739; Mr. Sunil Rana/ Mr. Jitendra Chawla, 42334416; Mr. Raman Sood, 25131127; Mr.Sunil Gambhir, 22373717; Mr. Kamalpreet Singh Ahuja, 42502527;Mr. Lucky Mehra / Mr. Pradeep Kumar, 25525087; Mr. Sudhir Kumar, 65544151; Ms. Anita Mittal, 45588396; Mr. Vikash Jha, 9910600557; Mr. Rajiv Mehta., 30888835 ; Saurabh Shukla, 55186037;Shyamal R. Sinha, 42184332; Suneel Kumar, 32922811; Mr.Suresh Chandra Agrawal, 32412089; Mr.Vijayant Verma, 32924702; Mr.Vimal Goel, 55857952; Mr. Arun Jain, 26931704 ; Mr. ManishJain, 9312196489; Mr. Narendra Singh Uniyal/Mrs. Rekha Uniyal, 64608810; Mrs.Vineeta Agrawal / Sanjeev Agrawal, 29944010; Mrs.Rama Thareja, 20407005; Mrs.Shashi Bala, 4019345; Mr.Tilak raj, 47563277; Mr.Hemant Kumar, Mrs.Archana Rani, 9810996998; Mr.Raman Kumar Jha, 45579306; Mrs.Sangeeta Sharma, 47046406; Mr. Mukesh Sharma., 47057628; Mr. Ashish Mangal,22486478; Mr. Vivek Jain/ Mr. Sanjay Jain, 9210300005; Mr. Vinay Kumar Gupta, 26076790; Mr. Syed Mohd Sajid, 26989105; Mr. Sunil Kumar Yadav, 9810560594; Mr. Ijesh Bedi, 27831055. ORISSA
� Angul—Mr. Deepak Roshan, 260224. � Bhubaneshwar—Mr. Ashok K Tripathy / Vaibhavi Bandekar / Ms Saroj Kr Mishra / Sonia Mohanty, 2536821; Mr. Ashok Tripathy / Ranjit Pal, 2302607;Mr. Bhabani Shankar Mishra, 2534046; Ms.Bandana Behera, 9437022622; Mr. Shaikh Sahid Hossen, 2561065; Mr. Ripti Ranjan Dash, 9861438939; Mr. Larens Kumar Nanda, 9937761040.� Bolangir—Mr. Sanjay Kumar Pradhan, 234139; � Sambalpur—Mr. Ghana Shyam Dash, 2410508. PUNJAB � Chandigarh—Mr. Yuvraj Gupta, 4614441; Mr. Baljit kaur, 9814192955. � Fazilka—Mr.Sunil Kumar, 261112; � Firozpur—Mr. Narinder Khurana, 503694; � Hoshiarpur—Mr. Dhanpat Rai, 237173; � Jalandhar—Mr. Gurpreet Singh Chugh, 5055201. � Ludhiana—Mr. DeepakKumar Chhabra, 2740084; Mr. Harsh Arora, 4637221. � Mohali—Mr. Vinod jain, 6579011. � Nabha—Mr. Harpreet Singh, 504308. � Nawanshahar—Mr. Kuldip Ram, 226266. � Pathankot—Mr. Shiv Kumar Malhotra, 2256475; Mr.Vijay Abrol, 5100110. RAJASTHAN � Abu Road—Mr.Sanjay Agarwal, 222610. � Ajmer—Mr. Vikas Sharma, 2429372. � Alwar—Mr. Kushal Sacheti / Mr. SanjaySacheti, 2360880; � Beawer—Ms. Mamta Chauhan / Mr. Rajendra Chauhan, 257141; Mr. R.S Chauhan, 257328; � Bhilwara—Mr. Shailendra Bapna, 239533; Mr. Atul Goyal, 247868; � Bhinmal—Mr. Sanjay Jain / Ms. Babita Jain, 220050. � Bikaner—Mr. Gaurav Bothra, 2270232; Mr. Raj Kumar Duggar, 2522539; Mr. Rajesh Surana, 2273223. � Dausa—Mr. Jagdish Prasad Swarnkar,220369.� Dungarpur—Mr.Bhaveen Shrimal, 233944; � Falna—Mr. Mahendra Parihar, 222082. � Jaipur—Mr. Sachin Singal, 5114137; Mr. Rohan Sharma, 2297230; Mr. Santosh Kumar Gupta, 2372893;Mr. Praveen Kumar Bangrawa, 2651856; Mr.Sunil Kumar Bhageria, 2569629, Mr. Pradeep Kumar Sharma 2230749-51; Mr. Sunil Kumar Sharma, 9829428060; Mr. Vishal Jhalani, 9829008001;Mr. Rohit Bhargava, 2741669; Mr. Prashant Matolia, 2224891; Mr. Pradeep Jain, 2564260. � Jodhpur—Mr. Pankaj Abani, 24247; Mr.Laxminarayan Panchariya, 9784777850; Mr.Krishan Joshi,9414560318; Mr. Mahaveer Sharma, 9829364905; Mr.Gajendra Rathi, 3254385. � Kankroli—Mr. Kunal Jain, 329330; � Kishangarh—Mr. Abhishek Rathi, 326755; � Kota—Mr. Unnat Goyal,2391206; � Pali—Mr. Amar Chand Sancheti, 510050; � Phulera—Mrs.Santra Kumawat, 244237. � Pindwara—Mr. Alkesh Kumar Luhar, 9983009917. � Sagwada—Ms. Vaishali Sargia, 251639.� Sikar—Mr. Mahesh Kumar Saini, 9351373029; Mr. Ram Lakhan Gupta, 252466; Mr. Mukesh Kumar Joshi/ Mr. Ramesh Kumar Vedi/ Mr. Bholendra Chaturvedi, 270235. � Sirohi—Mr.PraveenKumar Jain, 220136; Mr.Mahendra Parihar, 222670; � Sri Ganganagar—Mr. Mukesh Singal, 2475510; � Sumerpur—Mr. Bharat Kumar, 252971; � Udaipur—Mr. Ananth Acharya, 2426945; Mr.
Sharekhan Partners

MUMBAI � Andheri—Mr. Abhinav Angirish, 26343322; Mr. Abhijit Periwal, 2673 3643; Mr. Manoj Lalwani, 26351629; Mr. Ravi Jain, 32555965; Mr. Hitesh Mehta, 66921338; Mr. Ravindra LalJagasia, 26392584; Mr. Dipesh Chadva, 40794242; Mr. Jigar Thakkar, 67770014; Mr. Govind Pathak, 65217353. � Babulnath—Mr. Dipen Shah / Mr. Ashish Shah, 23610772. � Bandra—Ms. SoniaRaju Kanal, 9867777261; � Bhandup—Mr. Delvin M. Rajan, 25947699;Mr.Dipak Pisal, 25955632; Mr. Swapnil Rawool, 9833016555; Mr. Ashish Ramsarup Budhiraja, 69563565. � Bhayander—Mrs. Varsha Navneet Rathore, 28150382, Mr. Gaurav I Jain, 28195017. � Borivali—Mrs.Vidula S.Lele, 24225424; � C P Tank—Mr. Sanjay Jain, 66595956; � Charni Road—Mr. Rajal RashmikantKanani, 30015270; � Chembur—Mr. Manish Negandhi, 9820257549; � Cuffe Parade—Mr. Hem Tejuja, 40595959; � Dadar—Mr. Lekhendra Trilokchand Parmar, 24366602; Mr. Varun AjitDeshmukh, 24374110; � Dahisar—Mr. Jagdish V.Gada, 28282306; Mr. Pradeep K. Sawant, 28973622; Mr.Mahesh V. Rege, 28919132; � Fort—Mr. Nikhil Shah, 22871500; Mr. PremalSanghvi,66632921; Ms. Salome Shah, 22666039; Mr. Rajiv Sheth, 22722781; Mr. Somen Sangani, 22070427; Mr. Sachin Morakhia, 22659327; Mr. Vijay Kumar, 22656569; Ashok Shah, 9322595178;Mr. Hardik Rajendra Mandvia, 64409094; Mr. Mohsin Rahimuddin Shaikh/Mr. Ahmed Ali, 9821448908; Mr. Manish Negandhi, 9820257549; Mr. Mehul Shah, 66105604; Mr. Bhavin Haresh Zaveri,22022901-09. � Ghatkopar—Ms. Monisha Mehta / Mr. Gaurav Shah, 25100068; Mr. Santosh Dhondu Kodere, 9221920277, � Girgaum—Mr.Narendra Khushalraj Kothari/Sachin BharatDodhiwala/Mrs. Charulata Hemant Shah, 23800734; � Jogaswari—Mr.Atif Ashfaq, 26788181; � Kalbadevi—Mr. Mehul Shah, 66105604; Mr. Hemant Shah / Mr.Bharat Dodhiwala, 22013789;� Kandivali—Ms. Payal Gulabdas Lal, 28651242; Mr. Sunny Sharma, 28680093; Mr. Pratik Shah, 28019804; � Khetwadi—Mr.Nayan Savani, 23809380. � Kurla—Mr. Anwar Badsha, 26503994;Mr. Muzaffar Kazi, 26500116; Mr. Santosh Mahadev Patil, 9833447399. � Mahalaxmi—Mr. Tarun Birani, 32439684; � Mahim—Mr. Hemant Kumar Garg/Ms. Savita Gupta, 24456715; Mr.Prashant Marathe/Mr. Girish Marathe/Mr. Chetan Chikale, 9819207043. � Malad—Mr. Dilip Shah, 65267143; Ms. Indu Mahendra Purohit, 28806704; Mr. Shyam Sunder Kabra, 28773221; Mr.Bhandarkar, 28030661; Mr. Neelkamal Mehta, 28017707; Ms. Nidhi Verma, 28010406; Mr. Praveen Nathulal Jain, 9833636035. � Masjid Bunder—Mr. Lata Metha /Rajubhai Metha, 23444590;Mr. Mohanlal Sukhija, 23427814; Mr. Manish Vakil, 23462690; Mrs. Fatema Mustan Lakdawala, 23432455. � Matunga—Mr. Hardik Chandrakant thakkar, 9867303989; Mr. Arjun TapanMukherjee, -65139230/31/32. � Mazgaon—Mr. Bhavik Jogesh Thakkar, 23772121; � Mira Road— Ms. Naina Miyani / Mr. Chetan Miyani, 2813 1522;Mr. Balu Govind Waghmare, 9967097105.� Mulund—Mr. Winson Martin D'Sa, 20320724; Ms. Rekha Bhagwan Jadhav, 21637711; Mr. Tejinderpal Singh Wahi, 25691033; Mr. Shambhu Sharan Singh, 25688194; Mr. Manish Laheri Thakker,9930171719. � Nalasopara—Mr. Richard J. Almeida, 2404133; � Napanse Rd—Mrs. Jayashree S. Sardesai, 23680608; � Prabhadevi—Mr Kishor Shah / Nilesh Shah, 66662444; Mr. Nikhil AjitDoshi, 24307805; � Vile Parle—Mr. Vasant Amin, 32416941; Mr. Naveen Kaul/ Mrs. Renu Ashok ahuja, 9819878343. Mr. Omprakash G. Bajaj, 26399491/92; Mr. Nitin Bhalchandra Desai, 26149218;Ms. Rupal Bhatt, 26100031; Mr. Krunal Abhubhai Desai, 26245289; Mr. Dipesh Jayantilal Shah, 26490853; Ms.Ekta Choudhary, 26711392. THANE � Thane—Mr. Balbhadra Mulshankar Joshi,25390320 ; Mr. Sanjay Yewale, 25375135 ; Mr. Sandeepan Marutirao Reddy, 25471720; Mr. Abhijit Joshi / Mrs.Akshata Joshi, 9224567541; Mr. Yogeshwar Vashishtha, 67257917; Mr. VijayKundanlal Gera, 25383253; Mr. Deepak shinde, 9323846903; Mr. Amol Lahu Kamble, 22991283; Mrs. Twinkle Sinha/ Mr. Pramod Kumar Mishra, 9920570608; Mr. Ratish Ravindra Nagwekar,25854775 ; Mr.Mohammed Idris., 25429478; Mr.Momin Faizan Mohd Ishaque, 227311; Mr. Hitendra Ramesh Gupte, 25431072; Ms. Poonam Jagdish Nenwani, 25980251; Mr. Ashok Thool,2529936; Mrs. Janhavi Ramchandra Surpur;Mrs. Janhavi Ramchandra Surpur, 21720128; Mr. Pradeep Ramchandra Shinde, 25304858; � Badlapur—Mrs.Swati Dileep Patwa, 2692841; Mr.Mahesh Laxman Khamitkar, 6449952. � Dombivali—Mr. Prakash V Gor/Mr. Dilesh, 5617530; Mr. Kishor Ladulal Gokhru, 2482882; Mr. Shankar Chaugule, 2442475; Mr. Vinayak Parab, 6456012.Mr. Harish Bhanushali, 9224767616;Mr. Ganesh Ramdas Ghanwat, 9773666182. � Kalyan—Mr. Vijay Gopal Barhate, 3248909; Mr. Mahek naresh Gala, 9833675106; � Vasai —Mrs. HeenaRushit Dave, 6455037/38; � Virar—Mr. Nasaruddin Abdulmalik Damania, 9923241118; Mr. Damjibhai Patel, 9221270777; � Ulhasnagar—Mrs. Latika S. Dudani, 2570700. NAVI MUMBAI �
Airoli—Mr. Manohara.M.Shetty, 32171212. � Belapur—Ms. Seema Sonu Tandel, 27580801. � Khargar—Mr. Manohar Krishnan Nair, 32694049; Ms. Manisha M Shelke, 27742699. � Koparkhairane—Mr.Ganesh Jadhav, 27545425; � Nerul—Mr. Bipin / Nisha Gupata, 32599995; Mr. Mahesh A Pansare, 27707929; Mr.Rajesh Kanayalal Vazirani, 27700002; Mr. Suhas Shivaji Pandhare.,9960339092. � Panvel—Ms. Supriya K. Bhandurge / Mr. Dhanesh Bhandurge, 64522685.
Sharekhan PartnersNarendra Harkawat, 5121322; Mr. Vinod Sharma, 5133016; Mr. Chandeep Sethi, 2413774; Mr. Narendra Harkawat , 9414238892; Mr. Yasin Mohd Chhipa, 2429038. SIKKIM � Gangtok—Mr.MahendraMohan Marda, 9332336624. TAMIL NADU � Arni—Mr. Vinoth Kumar Nithya, 9443437183. � Attur—Ms. Sumathi Duraisamy, 240971. � Chennai—Mr. Prasad, 23451091; Mr. Prasad, 26564812;Mr. R. karunakaran, 55874625; Mr. Shanmugharaj Gnanaselvi, 42029037; Mrs. Hemamalini Chandrashekhar / S.R.Chandrasekaran, 24328413; Mr. Arvindhan M, 42023724; Mr. KesarichandSethia, 25386019; Mr. Kanaga Sabapathy, 9444356660; Mr.Prakash T, 24614385; Mr. Panchatcharam perumal, 9444072219; Mr. Ibathul Raziq Abdull Kareem, 43566130; Ms. RekhaMohanasundaram, 42645417; Mr. Karthigayan G, 64617566; Mr. Suresh Paramanand Jangid, 42759942; Mr. K R Ramesh, 9942610000. � Chidambaram—Mr. K R Ramesh, 9942610000.� Coimbatore—Mr. Madanlal R Tukrel, 4370411; Mr. R. Palaniswamy / Mr. P.S. Senthil Kumar, 4216406; � Cuddalore—Mr.Jayraman Ganesh, 236927; Mr. Subakkar Padmanaban, 04142-228938.� Devakottai—Mr. SP Manojkumar, 9942610000. � Dharmapuri—Mr.Vengiyagounder Selvakumar, 221893; Mr.Sundaramoorthi Anbalagan, 267257; � Dindigul—Mr R Senthil Kumar, 6533227;� Erode—Mr. G K Guru, 230327; Mr. Ramarathinam Manivasagam, 9865617488; Mrs. R Revathi, 2253534; Mr. Balakrishnan Ragunandhan/ Mr. Cinnusamy Kalaivani, 2264264; � Hosur—Mrs.Shobha Srinivasan Sathyanarayanan, 22224. � Kallakurichi—Mr. Ranganathan Ashok Khumaar, 225188. � Kanchipuram—Mr. K S Saravanan, 47203561; Mrs. Jothilakshmi Arunkumar,4272772. � Karaikal—Mr. A Paul daniel Gnanaraj, 221288. � Karaikudi—Ms. Vallippan Chitra, 329253; � Karumathampatty—Ms. K. Parvathavarthini, 4218005; � Karur—Mr. MohanrajKaruppanan, 241471; Mr.Subramani Bharathiraju, 646204; � Krishnagiri—Mr. M Thirumurugan, 238911. � Kumbakonam—Mr. Suresh S, 2425576. � Madurai—Mr. I Baskar, 4370069; Mr.Nagarajan Murugesan, 4347294; Mr. Rajendran Ganesan, 9894932921; Mr. Mugunthan Bhalakumar, 2389100. � Nagapattinam—Mrs.Parvathi, 9443588864. � Palladam—Mr. S KrishnaKumar, 291613 � Rajapalayam—Mr. Ranjithkumar Thangamuniyandi, 231602. � Rasipuram—Mr. M Ganapathy, 220088. � Sankari—Mr. S.P.Karthik Keyan, 242838. � Sivaganga—Mr. S PVenkatachalam, 267707. � Thanjavur—Mr. Shanmugam Madhavan, 235263; Mr. S Engels, 253000. � Thiruchengode—Mr Ramasamy Arunachalam, 9443712399. � Tirunelveli—Mr. N.Kameswaron, 2320544. � Tirupur—Mr. B. Jagan, 4322356; Ms. R Kalpana, 9994491555. � Trichy—Mr. Mothi Padmanaban, 2700997, Mr.Krishnasamy Sivakumar, 262310; Mr. Balaji Nandakumar,9444132552; Mr. Anantha Krishnan S, 4220502; Mr. A Austin Christopher, 9952226677. � Tuticroin—Mr. G Jasper GNANA Martin / Mr. S Aravinth Narayanan, 2345744; � Udumalpet—Mr. RSampath, 225323; � Vaniyambadi—Mr. K.Uvaiz Ahmed /Mr. C.Md.Faisa, 9366114017. � Velachery—Mr. Gnan Guru N, 42021226; � Vellakovil—Mr. K. G. Lokessh, 303222; � Villupuram—Mr.Krishnasamy Srinivasan, 229755; TRIPURA � Agartala—Mrs. Sukla Ghosh, 2314095; � Teliamura—Mr. Debabrata Majumder, 262436/262497. � Udaipur—Mr.Biplap Majumder, 227021.UTTAR PRADESH � Agra—Mrs.Kalpana Gupta, 9219618594; � Aligarh—Mr. Tarun Kumar/ Mr. Neeraj Gupta, 9759008438. � Allahabad—Mr. Ravi Agrawal, 2500462; Mr. Santosh Kumar Maurya,9839246766; � Ambedkar Nagar—Mr. Sandeep Tripathi, 9839659494; � Bahraich—Mr. H. P. Srivastav, 228284; Mr.Ashish Jaiswal, 9792230922; � Balrampur—Mr. K. N. Gupta, 220533;Mr.Shailesh Kumar Srivastava, 9792230922. � Barabanki—Mrs. Rachna Subodh Jain, 9935023187. � Bareilly—Mr.Ajay Kumar Mathur, 9837085599;Mr. Neeraj Chand, 9719546492; Mr.HemantKumar Dass, 9259061490; Mr. Mohd Mazhar, 2520688. � Bhadohi—Mr.Fazlur Rahman, 300091; � Bijnore—Mr. Satendra Kumar Malik, 9837267091. � Ghaziabad—Mr. Anil Kumar Duhan,9810965469; Mr. Vijay Sadana, 4103618. � Gonda—Mr. Kameshwar Gupta / Mr. Hanumant Srivastav, 223150; Mr. Raman Srivastava, 9838813443. � Gorakhpur—Mrs. Lalita Jaiswal, 9935144041.� Hapur—Mrs. Urmila Gupta, 971921558. � Hardoi—Mr. Akash Singh, 9984201900. � Jhansi—Mr. Tarun Gandhi, 2446751; � Kanpur—Mr. Lalit Singhal, 2307045; Mr. Girish Chandra Tandon,3252613; Mr. Jai Prakash Saxena, 570090; Mrs.Priyanka Agrawal, 2654110; Mr.Jitendra Khatri, 2363033; � Lakhimpur—Mr. Sanjeev Bajpai, 259681; � Lalitpur—Mr. Pankaj Arora / Mr. SanjaySabharwal, 274397; � Lucknow—Mr. Anupam Atal, 2287000; Mr. Kuldeep Darbari, 2257721; Mr. Manish Gupta, 2201626; Mr. Prashant Kishore Khuntia, 3234465; Mr. Mukesh Kushwaha,4063065; Mr. Neeraj Verma / Mr Mukesh Varma, 2326680; Mr. Nitin Kumar Bansal, 4016700; Mr. Ravi Prakash Agarwal, 9335264490; Ms. Seema Sarraf, 4024880; Mr. Shakeel Ahmed Khan,2288888; Ms. Sneh Lata Kushwaha, 4008277; Mr. Shariq Nafees, 2623000; Mr. Mohd Faizal, 4025529; Mr. Rehan Ahmad, 4010342; Ms. Seema Gupta, 4045902; Ms. Rachna Agarwal, 2461053;Ms. Seema Saraf, 4024880; Mr. Naresh Kumar Rastogi, 9415082954; Mr. Amit Kumar Singh, 2310879; Mr. Mehdi Sarwar Alam, 9838374376; Mr. Mahendra Kumar, 4025838; Mrs.Deepti Tondon,2230751; Mrs.Rekha Dixi, 9415061134; Mrs.Pratiksha Singh, 2739518; � Mankapur—Mr. Manish Tripathy / Mr. Kameshwar Gupta / Mr. Hanumant Srivastav, 231500. � Mau—Ms. ShradhaKhandelwal, 2227323. � Meerut—MR. Kuldeep Chaudhary, 2630059; � Muradabad—Mr. Akash Garg, 2435047; Mr. Mustizab Malik, 2520688. � Muzaffarnagar—Mr. Amit Jain, 3292715.� Nanpara—Mr. Prashant Vaibhav, 234645; � Noida—Mr.Niraj Kumar Singh, 9891187886; � Orai—Mr. Sanjay Kumar Agarwal, 252569; � Pilibhit—Mr. Anoop Kumar Agarwal, 9412554791;� Pratapgarh—Mr.Vishnu Kumar Patidar, 221027; � Renukoot— Mr. Ravi Kant Pal, 254265. � Saharanpur—Mr. Parveen kapoor, 2713565. � Saraswasti—Mr. Surendra Singh, 9792230922;� Shahjahanpur—Mr. Amit Yadav, 228102; � Sitapur—Mr. Sanjeev Kapoor/Mrs. Neeru Sahni, 9415084966; � Sultanpur—Mr. Ishwari Kumar Dwivedi, 9415156412. � Utraulla—Mr. PhoolchandDwivedi, 253277/78. � Varanasi—Mr. Lalji Choube, 2507621; Mr. Raj Gaurav Rai, 2312087. UTTARANCHAL � Dehradun—Mr. Ashish Sethi/Mrs. Garima Sethi, 6545914; Mr. Bhagat Singh Negi,6457725; Mr. Saurabh Thapliyal, 2520185. � Haldwani—Mr. Rajendra Pant, 9837776832; � Rudrapur—Mr. Vishal Garg, 9927072515. � Roorkee—Mr. Pravej Alam, 321013. � Tehri Garhwal—Mr. Bhupendra Singh Chauhan, 9927072515. WEST BENGAL � Asansol—Mr. MD Shahnawaz Alam, 3203895/96. � Bakhrahat—Mr. Gadadhar Roy, 9830398245. � Bankura—Mr. SomsubhraDatta, 257350; � Barasat—Mr.Sibdas Ray, 9331834313; � Barrackpore—Mr. Ratan Lal Ghosh, 2592-8564; � Bongaon—Mr. Laxman Gosh, 240685; � Burdwan—Mr.Prodosh Sanyal/Mr.Shekhar Maity, 3208259; Mr. Ravi Agarwal, 2442548; Mr. Arnab Das, 255525. � Dalhousie—Mr. Sumit Adhikari, 9733648892. � Durgapur—Ms. Jayanta Chakraborty, 2565989. � Gangarampur—Mr. Ranada Prasad Das/Mr. Farman Ali sarkar/Mr. Khurshed Alam sarkar, 255472; � Hooghly—Mr. Pulak Gosh, 26634743; � Howrah—Mr. Snehashis Ray / Mr. Somen, 26786351; Praveen Tewari,32510718; Mr. Kumar chattopadhyay, 9830895322. � Ichapur—Mr. Robins Kumar Shaw, 32584190; � Kolkata—Mr. Manik De, 24215624; Mr. Deepak Kanoria, 32501523; Mr. Sibdas Tapadar/ Mr. Suchanda Chudhary, 5514 1949; Mr. Sujit Deb, 256838; Mr. Kailash Todi, 26550436; Mr. Lalit Chhawchharia, 22133553; Mr. Ravi K. Agarwal, 22131373; Tapas Chakraborty, 9830279697;Mr. Mahfuzur Rahaman, 9433876837; Susamoy Chatterjee, 22365539; Mr.Deepchand Jaiswal /Mr.Biswajit Banerjee /Mr.Gyanchand Jaiswal, 22259458; Mr. Somnath roy, 69449636; Mr.Prasun Choudury, 0343-3205197; Mr. Rahul Sheth, 24747629; Mr. Tapas Kumar dey, 9836109681; Mr. Partha Sarathi Chakraborti, 24196100; Mr. Bisakh sen, 9831138881; Mr.Shyamal Banik,9333730175; Mr. Irfan Taufique, 22290945; Mr. Ankit nevatia, 9831012456; Mr. Ashish Kumar Agarwal, 30221852; Mr. Tapan Chandra Modak, 25228581; Mr. Subhash Soni, 22693089;� Krishnagar—Mr.Subashis Biswas, 255545. � Madhyamgram—Mrs. Sulata Biswas, 25268895/8372. � Malda—Mr. Siddique Hossain/Mr. MD Nazmul Islam/Ms. Asim Bari, 9832047726� Midnapore—Mr.Giriraj Bhutra, 273385; � Purulia—Mr. Praveen kumar choudhary, 9933457177. � Siliguri—Mr. Nitin Agarwal, 2503404. � Sodepur—Mr. Apurba kanchan Dutta, 9231923053.

AgraF-3, First Floor, Friends Trade Center, Nehru Nagar,Opp.Anjana Cinema, M.G.Marg, Agra-282 002.Tel: (0562) 4032060.
Ahmedabad - Maninagar208, Rajvi Complex, Opp Rambaug Police Station, Maninagar,Ahmedabad-380 008. Tel: (079) 65410102 / 65410829
Ahmedabad - Navrangpura201/202, Dynamic House, Near Vijay Cross Road,Navrangpura, Ahmedabad-380009. Tel: (079) 66060141to 52
Ahmedabad - Sattelite406, Shivalik Corporate Park, Shyamal Cross Road Sattelite,Ahmedabad-380 015.Tel: (079) 6525 48 08-13
Ahmedabad - Paldi201/202, Dynamic House, Near Vijay Cross Road,Navrangpura, Ahmedabad-380009. Tel: (079) 66060141to 52.
AhmednagarShop No 1 & 2, Kaware Complex, Vasant Talkies Road,Ahmednagar-414 001. Tel: 0241-6611011 to 20.
Ajmer195/11, Rajhonda, Kutchery Road, Ajmer-305 001.Tel: (0145) 6100919 / 6100920 / 2422665.
Allahabad1st Floor, Shop No.14 & 15, Vashishti Vinayak Tower,Nr Yatrik Hotel, Tashkant Marg, Civil Lines, Allahabad-211 003.Tel: (0532) 2260848, 2260849, 2260850.
Ambala167/18, 1st Floor, Adjoining Airtel Office, Rai Market,Ambala Cantt - 133001. Tel: (0171) 6450284to 87.
AmravatiTank Plaza, Above Union Bank. Rajkamal Squre.Amravati -444 601. Tel: (0721) 6451282/83.
Amritsar5 Deep Complex, 1st floor , Opp Doaba Automobiles , CourtRoad, Amritsar - 143001. Tel: (0183) 6451903 / 904 / 905.
AnandF/5, Prarthana Vihar Complex, Near Panchal Hall, VidyanagarRoad, Anand, Gujarat-388 001. Tel: (02692) 245615 to 16 /655022.
Anand - Vidyanagar1st Floor, P.M.Chamber, Mota Bazar, Vallabh Vidyanagar,Anand, Gujarat - 388120. Tel: (02692) 655015 to 17.
AnkleshwarF-1, F-2 & F-3, 1st Floor, Shree Narmada Arcade, Opp HDFCBank, Ankleshwar - 393002. Tel: (02646) 227120/21.
Bangalore - Advisory#2307, Swanlines Building, 12th Main Road, Jayanagar 3rdBlock East, Bangalore - 560011. Tel: (080) 42876666.
Bangalore - GandhinagarBrigade Majestic, 201 A Block,25 Kalidasa Marg, 1st MainRoad, Gandhinagar, Bangalore -9. Tel: (080) 64527413 to 15.
Banglore- Church StreetG-34, Brigade Gardens, 19, Churuch Street, Bangalore -560001. Tel: (080) 41480330/41480333
Bangalore - MalleshwaramNo 311, 2nd Floor, 2nd Main, Between 15th and 16th Cross,Sampige Road, Malleshwaram, Bangalore-3. Tel: (080)64527401-03.
Bangalore - MarathalliUnit no. 201 / B, 2nd Floor, Sigma Arcade -II, Marathalli,Bangalore – 560037 Tel: (080) 42063278 / 79 / 80 /81
Bangalore - Electronic City2nd Floor, Shop No. 5, Shopping Complex Road, ElectronicCity, Bangalore-560100. Tel: (080) 65395261 to 66
Bangalore - BanashankariNo.77 1st Floor, N.R.Towers, 100Ft Ring Road, Bhanashankari,3rd Stage, 5th Block, Bangalore-560 085. Tel: (080)26421481 to 85
Bangalore - BTMNo: 736/C, 7th Cross, 11th Main Mico Layout, BTM 2nd Stage,Bangalore-76. Tel: (080) 653952 70 to 75 / 420560 31 to 34
Bangalore - Jayanagar#2307, Swanlines Building, 12th Main Road, Jayanagar 3rdBlock East, Bangalore - 560011. Tel: (080) 42876666.
Bardoli303/304, Millenium Mall, Opp.Sardar Vallabhbhai Patel Musium,Station Road, Bardoli-394 003. Tel: (02622) 657229.
Bareilly148, Civil Lines, Bareilly-243 001. Tel: (0581) 2510922 / 925.
Bharuch221-227, 2nd Floor, Dream Land Plaza, Opp Nagar Palika,Station Road, Bharuch - 392 001. Tel: (02642) 244998/99.
BhavnagarGangotri Plaza, Plot No-8A 3 rd Floor , Opp DakshinamurtiSchool, Waghawadi Road, Bhavnagar, Gujarat - 364 001.Tel: (0278) 2573938/2573939/2571333/3201333
BhubaneshwarA/B-2nd Floor, 501/1741, Centre Point, Unit No.3, KharvelNagar, Bhubaneshwar-751 001. Tel: (0674) 6534373.
Bhilai216, 1st Floor, Khichariya Complex, Nehru Nagar chowk,Bhilai (C.G.) 490006 Tel: (0788) 4092512 / 4092672.
BhiwandiOffice no 1&2, Presidency Plaza, Khadipar Road, Nr ShivajiChowk, Bhiwandi- 421 302. Tel: (02522) 645690 to 96.
BhopalShop No. 114,115 & 116, 1st Flr, Plot No. 2, Akansha Parisar,Zone-1, M.P. Nagar, Bhopal-11. Tel: (0755) 42916004262200.
Bhuj1st Floor, RTO Relocation, Opp Fire brigade Station, Bhuj,Kutch-370 001. Tel: (02832) 229463/229473/229483
Calicut3rd Floor, 6/1002 J, City Mall, Opp. YMCA,Kannur Road, Calicut – 673001.Tel: (0495) 6450307 / 308 / 312/ 316/ 317 /318
Chandigarh
SCO : 185, 1st Floor, Sector 38-C, Chandigarh-160036(Punjab). Tel (0172) 4643000/ 4643001/ 4647024.
Chennai - Anna NagarNew No 91 , Old No 106, D Block, Chintamani, Anna Nagar(E), Chennai-2. Tel: (044) 45501100 / 50 / 45501268 / 69.
Chennai - ChetpetG-2, Salzburg Square, 107-Harrington Road, Chetpet,Chennai-600031. Tel: (044) 28362800 / 2900 / 28363160.
Chennai - ParrysBegum Isphani Complex, No 44 Armenian Street, Parrys,Chennai - 600001. Tel: (044) 64552951 / 52/ 53 / 54
Chennai - PurasawalkamF-13, Dr Rajivi Tower, 231/28 Purasawalkam High Road, OppGangadeeshwar Temple Tank, Chennai - 7.Tel: 42176004 to 9.
Chennai - Mylapore
Old No. 21 New No. 35, 3rd Floor, EVS Towers, Dr. RadhakrishnanSalai, Mylapore, Chennai-600004. Tel: (044) 43009001- 06.
CoimbatoreVignesvar Cresta, 2nd Block, 3rd Flr, 1095 - Avinashi Road,P N Palayam, Coimbatore -641037.Tel: (0422) 2213434/2214282.
Dehradun
58, Rajpur Road, Opp. Hotel Madhuban,Dehradun-248001. Tel: (0135) 2740 190 to 94.
ErodeAkhil Plaza, Block No.1, T.S.No.121, Perundurai Road, OppPadmam Restaurant, Erode - 638011. Tel: (0424) 2241000/2241005.
Erode - GobichettipalayamChamundeswari Agencies Bldg, 279, Cutchery Street,Sathy Main Road, Gobichettipalayam-638 452.Tel: (04285) 229013/14/15.
FaizabadMehramat Plaza, 4099, Civil Lines, Near Pushpraj GuestHouse, Rly Station Road, Faizabad-224001. Tel: (05278)222604-222519.
FaridabadSCF 56, 1st Floor, Near Rebock Showroom, Sector 15, MainMarket, Faridabad-121007. Tel: (0129) 2220825/26.
GandhidhamPlot No.147, Sector 1 A, Near Big Byte Resturant,Gandhidham –370201. Tel: (02836) 323113 / 323114.
GandhinagarGF/04, Infocity-Super Mall-2, Infocity, CH-0 Circle,Gandhinagar-382 009. Tel: (079) 64512663.
GhaziabadJ-3 II Floor, RDC, Raj Nagar, Near New Ghaziabad RailwayStation, Ghaziabad - 201001.Tel: (0120) 4154003,4154358.
Goa-MapusaShop No. 4, 3rd Floor, Commnunidade Ghar, Angod,Mapusa - 403 507. Tel: (0832) 2910052 / 51/53/54.
Goa-PanajiF49/F50, 1st Floor, 'B' Block, Alfran Plaza, M.G. Road,Panaji, Goa - 403001. Tel: (0832) 2421460.
Goa-VascoShop No 4, Gabmar Apt, Gr Flr Swatantra Path , Vasco,Goa -2.Tel: (0832) 2510 175 / 2511 823
GorakhpurShop No. 17, M. P. Building, Above TNG Show Room, Golghar,Gorakhpur-273 001. Tel: (0551) 2202645/ 2202683
GuwahatiHouse No-60, Chandra Prabha Barua Lane, Pub Sarania,Guwahati-781003.
GunturD.No.5-87-89, 2nd Lane, Beside HDFC Bank, LakshmipuramMain Road, Guntur - 522 007. Tel: (0863) 6452334.
GurgoanGF 10, JMD Regent Square, DLF Phase- II, Opp Sahara Mall,Gurgaon Road, Gurgaon-122001. Tel: (0124) 4104555 - 57.
Gurgoan-IISCF 89, 1st Floor, Sector 14, Urban Estate,Gurgoan - 122 001. Tel: (0124) 4115431/32.
GwaliorPortion No.3, 1st Floor, Parimal Complex, Opp KotcharPetrol Pump, Gwalior -474 009. Tel: (0751) 4097500.
Hyderabad7-1-22/3/1-5/C, Afzia Towers, 1st Floor, Begumpet,Hyderabad-500016 Tel: (040) 66827469-70 (D) 4020354.
Hyderabad - Himayat NagarHome Plaza, 2nd floor, Opp Mahindra Show Room, 3-6-384/2Himayat Nagar Main Road, Himayatnagar, Hyderabad -500029 Tel: (040) 42406245 to 248.
Hyderabad - Dilsukhnagar2-41, Chaitanya Chambers, Chaitanya Puri, Dilsukhnagar,Hyderabad, A.P. - 500 060. Tel: (040) 66805615/16/17/18/19.
Indore
102-104, Darshan Mall, 15/2 Race Course Rd,Indore - 452 001. Tel: (0731) 4205520 to 24
Indore - Vijay Nagar
R 11 - 12, Metro Tower, AB Road, Vijay Nagar, Indore, M.P. -452010. Tel: (0731) 3062469/70/71/72/73//74
JaipurFlat No 401/402, 4th Floor, Green House, Ashok Marg,C-scheme, Jaipur-302001. Tel: (0141) 6456098 / 6456114.
JalgaonGround Floor, Ramdayal Plaza, Near Kiran Tea, Navi Peth,Jalgaon - 425001. Tel: (0257) 2239461.
Jamnagar4/5, Avantika Commercial Complex, 2nd Floor, Limda LaneCorner, Jamnagar -361 001. Tel: (0288) 2676818/2671559.
JamshedpurUG, 2&3 Shreeji Arcade, 76B, Pennar Road, Sakchi,Jamshedpur-831001. Tel: (0657) 2442000 / 01 / 02 / 03 .JodhpurA-3, 1st Floor, Olympic Tower, Station Road,Jodhpur-342001. Tel: (0291) 2648000 / 4 / 5Junagadh6/7/8, 2nd Floor, Raiji Nagar, Motibaug Raod,Junagadh-362001. Tel: (0285) 2650434.Kanpur515 & 516, Kan Chambers, 14/113, Civil Lines, Kanpur -1.Tel: (0512) 2333007-012.KalyanShop No. 9,10,11,Navjyoti Darshan Apt., Near PurnimaTalkies, Murbad Road, Kalyan(W), Pin: 421304.Tel: (0251) 2211342.KannurRamananda Compound,1st Floor, TPN 264 A, N.H 17, Talap,Kannur - 670002, Kerala. Tel: (0497) 6451515 / 6451616.
KochiChicago Plaza, 1st Floor, Rajaji Road, Ernakulam,Kochi-682 035. Tel: (0484) 2368411/12/13/17
KolhapurNo 5, 3rd Flr, Ayodha Tower, Bldg No 1,511 / KH -1/2, DabholkarCorner, Station Rd, Kolhapur-1. Tel: (0231) 6687063-66.
KolkataKankaria Estate, 1st floor, 6-Little Russell Street,Kolkata - 700 071. Tel: (033) 22830055 / 22805555.
Kolkata - Durgapur111/95, Nachal Road, Benachity, Dist Burdwan, Durgapur,Kolkata - 713 213. Tel: (0343) 6452701 /02/03.
Kolkata - UltadangaKankaria Estate, 1st Floor, 6-Little Russell Street, Kolkata -700 071. Tel: (033) 22830055/ 22805555/ 22837188/ 89 /91
Kolkata - Saltlake (Advisory)Kankaria Estate, 1st Floor, 6-Little Russell Street, Kolkata -700 071. Tel: (033) 22830055/ 22805555/ 22837188/ 89 /91
Sharekhan Branches
A-206, Phoenix House, 2nd Floor, Senapati Bapat Marg, Lower Parel, Mumbai - 400 013.

Kolkata - GariahatKankaria Estate, 1st Floor, 6-Little Russell Street, Kolkata -700 071. Tel: (033) 22830055/ 22805555/ 22837188/ 89 /91
KollamFirst Floor, A. Narayanan Shopping Complex, Kadappakada,Kollam - 691008. Tel: (0474) 2769120 to 25.
Lucknow2/159, Vivek Khand, Gomti Nagar, Lucknow - 226 010.Tel: (0522) 4009832 to 33.
Lucknow - Hazratganj
1st Floor, Marie Gold, 4,Shahnajaf Road, Hazaratganj,Lucknow-226 001. Tel: (0522) 4010342,4010343.
Lucknow - Rajajipuram
Neeru Enclave, Jal Sansthan Crossing, CP, 7/201, Sector - 7,Raja Ji Puram, Lucknow - 226017. Tel: (0522) 2418996 /97.
LudhianaSCO 145 1st Flr Feroze Gandhi Market, Near Ludhiana StockExchange, Ludhiana -141001. Tel: (0161) 6547349 / 459 /469.
MaduraiSaran Centre, A-2, 1st Floor, 19, Gokhale Road,Chinnachokikulam, Madurai-625 002. Tel: (0452) 4288888.
MangaloreC-1, 1st Floor, Presidium Commercial Complex, Anand ShettyCircle, Attavar, Mangalore - 575001. Tel: (0824) 6451503-4.
Meerut105, Om Plaza, Begum Bridge Road, Meerut-250001 (U.P.)Tel: (0121) 4028354/55.
Mehsana14-15, 1st Floor, Prabhu Complex, Near Rajkamal PetrolPump, Mehsana - 384002. Tel: (02762) 248980/249012.
MysoreShop No.3, Mythri Arcade (Next to Saraswathi Theatre),Kantharaj Urs Road, Chamaraja Mohalla, Saraswati Puram,Mysore-570 009. Tel: (0821) 6451601 / 6451602
Nadiad201/202, City Point Complex, Near Parash Cinema,SantramRoad, Nadiad - 387001. Tel: (0268) 2550555.
Nagpur (C A)409/412, Heera Plaza, Near Telephone Exchange Square,Central Avenue, Nagpur-440 008. Tel: (0712) 2731922/23.
Nagpur - DharampethPlot No. 79, 1st Floor, Universal Annex, DharampethExtension, Opposite New Wockhardt Hospital, Shivaji Nagar,Nagpur – 440010. Tel: (0712) 6610752 to 58.
Navsari1-Nirmal Complex, 1st Floor, Station Road, Sayaji Road,Navsari - 396 445. Tel: (02637) 652300/652400/248888.
Nashik - College Road5 SK Open Mall, Yeolekar Mala, Near BYK College,College Road, Nashik-422 005. Tel: (0253) 6610975 to 978.
Nashik Road1 st floor, Pratik Arcade, Bytco Point.Opp MSEB Office,Nashik-Pune Road, Nashik Road, Maharashtra - 422 101.
New Delhi - Bharakhamba Road903 & 903A, Kanchenjunga Bldg., 18-Bharakhamba Road,New Delhi-110001.
New Delhi - Pusa Road18/1 A, Ground Floor, Opposite City Hospital, Pusa Road,New Delhi -110005. Tel: (011) 45117000.
New Delhi - Lajpat NagarA95 B, II nd Floor, Lajpat Nagar –II, New Delhi - 110024.Tel: (011) 46590373-376.
New Delhi - Pitampura411/412, Aagarwal Cyber Plaza, Netaji Subhash Place,Pitampura, New Delhi - 110 034. Tel: (011) 47567000.
New Delhi - Vasant ViharE-20, Basant Lok Community Center,Vasant Vihar,New Delhi -110057. Tel: (011) 26155086/7/9.
New Delhi - Mayur ViharShri Durga Ji shooping complex, Pocket II, Mayur Vihar,Phase I New Delhi -110091. Tel: (011) 43067091- 96.
New Delhi - Rajouri GardenA - 29, 2nd Floor, Ring Road, Rajouri Garden,New Delhi - 110027. Tel: (011) 45608923 to 27.
NoidaP-12A, 3rd Floor, BHS Liberty, Sector-18, Noida - 201 301.Tel: (0120) 4646200.
Palakkad1st Floor, Shree Laxmi Vilas Buildings,G. B. Road, Palakkad- 678 014. Tel: (0491) 6450179 / 6450188.
PatialaSCO- 135, Chotti Baradari, Patiala -147 001 (PUNJAB)
Tel: (0175) 6622200 /01/02/03/04/05.
PulgaonKhurana Complex, Near Balaji Hotel, Nachangoan Road,Pulgaon - 442 302.
Pune - F C Road301, Millenium Plaza, 3rd Floor, Opp Fergusson College mainGate, Shivaji Nagar, Pune-411 004. Tel: (020) 66021301 - 06.
Pune - Bun Garden301, Millenium Plaza, 3rd Floor, Opp Fergusson College mainGate, Shivaji Nagar, Pune-411 004. Tel: (020) 66039301-2.
Pune - Satara Road301, Millenium Plaza, 3rd Floor, Opp Fergusson College MainGate, Fergusson College Road, Shivaji Nagar, Pune-411 004.Tel: (020) 66021301 /02/03/04/05/06.
Pune - NigdiABC Plaza (Agarwal Complex), 2nd Flr, Plot No 6, Sector No25, Bhel Chowk, Pradhikaran, Nigdi, Pune-44.Tel: (020) 66300690-97.
Pondicherry312/10, Vallar Salai,Vengata Nagar, Saram Revenue Village,Pondicherry - 605001. Tel: (0413) 4304904 to 09.
Raipur"Ridhi House", 27/218, New Shanti Nagar, Raipur(Chattisgarh)-492007. Tel: (0771) 4217777, 4281172,4001004.
Rajkot102/103, Hem Arcade, Opp Vivekanand Statue, Dr Yagnik Road,Rajkot-360001 Tel: (0281) 2482483/84/85.
SalemSri Ganesh Tower, 561, 2nd Floor, Saradha College Main Road,Salem - 636 007. Tel: (0427) 6454864 / 65/ 66.
SangliRanjit's Empire, Office No-36,37,38, 2nd Floor, CS No.517 , Opp.Zillaparishad, Sangli-416416.
SataraFirst Floor, Shree Balaji Prestige, Powai Naka, Satara,Maharashtra – 415001. Tel: (02162) 239824.
Siliguri2nd Floor, Ganeshayan Bldg,112,Sevoke Road, BesideSunflower Shopping Mall, Siliguri-734001.Tel: (0353) 6453475 -79.
SecunderabadMarrideep Bldg, 1st Floor, 12-5-4, Vijayapuri,Opp St Annes College, Tarnaka, Secunderabad-500 017.Tel: (040) 64533871 to 75.
SuratM-1 to 6,Jolly Plaza, Mezzanine Floor, Athwa Gate,Surat - 395 001. Tel: (0261) 6560310 to 6560314.
Surat - Advisory419, Jolly Plaza, Athwagate, Surat-1. Tel: (0261) 6646841-45.
ThrissurPooma Complex, M G Road, Thrissur-1. Tel: (0487) 2446971-73.
Trichy - CantonmentF-1, Achyuta, 111-Bharatidasan Salai, Cantonment, Trichy-620001 (Tamilnadu). Tel: (0431) 4000705 / 2412810
TirupurRam Arcade, No 27, Muncif Court Street,Tirupur- 641 601. Tel: (0421) 6454316 to 20.
TrivandrumLaxmi Bldg, 1st Floor, T.C.No.26/430, Vanrose Road,Trivandrum - 695 039. Tel: (0471) 6450657 / 58 / 59.
Udaipur
17 C, Kutumb Apt, Opp. ICICI Bank, Madhuban, Udaipur-313001.Tel: (0294) 6454647
Vadodara6-8/12, Sakar Complex, 1st Flr, Opp ABS Tower, HaribhaktiExtension, Vadodara-390 015. Tel: (0265) 6649261-70.
Vadodara - Manjalpur1st Floor, Rutukalsh Complex, Tulsidham Char Rasta,Manjalpur, Vadodara - 390 011. Tel: (0265) 2647970-71.
VapiRoyal Fortune, D-101, E-101, 1st Floor, Vapi-Daman Road,Vapi - 396 191. Tel: (0260) 6452931 to 36
Varachha - SuratG-20/21, Rajhans Point, Varachha Main Road, Varachha Road,Surat-395006. Tel: (0261) 6453499.
Varanasi2nd Floor, Banaras TVS Bldg., D-58/12, A-7, Sigra,Varanasi - 221 010 (UP). Tel: 0542 - 222 1073 / 81 / 83.
Vellore20/B, First East Main Road, Land Mark Bldg, 2nd Floor,Gandhi Nagar, Vellore-632006 Tel: (0416) 6454306 - 310.
VijaywadaCenturian Plaza, D. No: 40-1-129, 2nd Floor, Old CoolexBuilding, M. G. Road, Vijaywada - 520 010.Tel: (0866) 6619992/6629993.
Vizag10-1-35/B, 3rd Flr, Parvathaneni House, Val Tair Uplands,Vishakhapatman - 530003. Tel: (0891) 6673000/6671744.
WardhaRadhe Complex, 2nd Flr, Indira Mkt Road, Above AkolaUrban co-op Bank, Wardha-442001. Tel: (07152) 645023to 26.
Mumbai - AndheriB/204, Kotia Nirman, 2nd Floor, Next to Fun RepublicCinema,New Link Road, Andheri (W), Mumbai - 400 053.Tel: 6675 0755 / 6675 0758 / 6675 0760 / 6675 0763.
Mumbai - BorivaliShankar Ashish Bldg, 1st Floor, R.S.Marg, ChandavarkarCross Road lane, Near ICICI Bank,Borivali (W), Mumbai-400 092. Tel: (022) 65131221/65131222.
Mumbai - BhayanderShop No.20 & 21, Walchand Complex, Opp. Porwal School,Bhayander (W),Mumbai- 101. Tel: (022 ) 2804 1083/84/85
Mumbai - Ghatkopar202, Sai Plaza, 2nd Floor, Junction of Jawahar Road &R. B. Mehta Marg, Ghatkopar (E), Mumbai 400 077.Tel: (022) 2510 8844 / 2510 8833.
Mumbai - Goregaon301, 3rd floor, Plot No.343, Above ICICI Bank, S. V. Road,Jawahar Nagar, Goregaon (West), Mumbai - 400 062.Tel (022) 67418570.
Mumbai - Kandivali10, Om Sai Ratna Rajul, Corner of Patel Nagar, M G Road,Kandivali (W), Mumbai-67. Tel: (022) 28090509/589.
Mumbai - Kandivali (Thakur Village)Shop No 37, EMP-6, Jupitar CHS Ltd,Evershine MilleniamParadise, Thakur Village, Kandivali (E), Mumbai- 400 101.
Mumbai - Khar703, Prem Sagar Building , 1st Flr, 3 A Linking Road, Khar(W), Mumbai - 400 052 Tel: (022) 65135333, 65133972-76.
Mumbai - Lower Parel"C" Phoenix House, 4th Floor, Senapati Bapat Marg,Lower Parel, Mumbai-400 013. Tel: (022) 6618 9300.
Mumbai - Malad502, Rishikesh Apartment, Opp to N L High School,S.V.Road, Malad (W), Mumbai- 64. Tel: (022) 6513 3969.
Mumbai - MatungaFlat No 4B, Gr. Floor, Ashwin Villa, Telang Road, Matunga(E), Mumbai - 400019. Tel: (022) 6513 9230/31/32
Mumbai - MulundShop No. 1, Hetal Building, Gr Flr, Opp.Punjab National Bank,Zaver Road, Mulund (West), Mumbai -80.Tel: (022) 2565 6805-10.
Shop No. 2, New Krishna Dham, Veena Nagar, L.B.S.Marg, Mulund (West), Mumbai - 400080.Tel: (022) 4024 1501-6
Mumbai - Opera HouseGogate Mansion, Gr Floor, 89-Jagannath Shankar SethRoad, Girgaum, Opera House, Mumbai-4.Tel: (022) 6610 5671-75.
Mumbai - Thane2nd Floor, Gulmohar Tower, Mahatma Phule Road,Opp.A.K.Joshi High School. Naupada, Thane - 400 602.Tel: (022) 2537 2158 to 61/ 2539 7778 - 9.
Mumbai - Stock Exchange (Rotunda)1st floor, Hamam House, Hamam Street, Fort, Mumbai400 023. Mumbai-23. Tel: (022) 6610 5600 to 15
Mumbai - VashiPersipolis Bldg., 108, 1st floor, Opp. St. Lawrence School,Sector-17, Navi Mumbai-400703. Tel: (022)27882979-82.
Mumbai - Vile Parle7-Alka CHS, Ground Floor, Dadabhai Road, Vile Parle (W),Mumbai - 400056. Tel: (022) 26253010/11/12/13
PCG Branch
PCG - KolkataKankaria Estate, 2nd Floor, 6-Little Russell Street,Kolkata - 700 071. Tel: (033) 22830055
AbudhabiNo:201-A Al Ain Jewellery Building (Sahara Abudhabi),Liwa Street, Abu Dhabi, UAE. Tel: 971-4-3963889.
Dubai213, Nasir Lootah Bldg, Khalid Bin Walid Street (BankStreet), P.O. Box: 120457, Dubai, U A E. Tel: 971-4-3963889Direct : 971-4-3963869.
Sharekhan Branches
Sharekhan Representative Office


