120
2009 AISA Aquaculture Benchmarking Survey

2009 AISA Aquaculture Benchmarking Survey
Aquaculture Institute of South Africa (AISA)
Postal Address: AISA, PO Box 51743, West Beach, Cape Town, South Africa, 7449Physical Address: AISA, The Avenues - Unit 3C1, Village Walk Rd, Parklands, Cape Town, South Africa
Tel: +27 (0)21 556 7339, Fax: +27 (0)21 556 4428, www.ai-sa.org.za
Vision:To be a globally competitive Aquaculture sector in the Western Cape
and in general in South Africa
Mission:To promote the integrated development of a sustainable and
equitable Aquaculture sector in the Western Cape and in general for all South Africans
Design and print: Loud Advertising

Prepared for:
Aquaculture Institute of South AfricaPO Box 51743, West Beach, Cape TownSouth Africa 7449Contact: Dr Lizeth BotesEmail: [email protected]: 021 556 7339
Swisscontact3rd Floor , Anton Anreith Arcade,The Business Place, Foreshore,Cape Town, 8001, South Africa.Contact: Juancho HagnauerEmail: [email protected]: 012 346 5102
Enviro-Fish Africa (Pty) Ltd22 Somerset StreetGrahamstown 6140South AfricaEmail: [email protected]: 046 622 8241
Prepared by:
The report should be cited as:
Britz, P.J., Lee, B. and Botes, L. 2009. AISA 2009 Aquaculture Benchmarking Survey: Primary Production and Markets. AISA report produced by Enviro-Fish Africa (Pty) Ltd. 117p.
Project funded by:
2009 AISA Aquaculture Benchmarking Survey

2009 AISA Aquaculture Benchmarking Survey
Contents
ACronyms And AbbreviATions ....................................................................3
Preface .................................................................................................................................. 4
Acknowledgements ................................................................................................................ 4
Executive Summary ............................................................................................................... 5
1. introduction .................................................................................................................... 9
2. methodology ................................................................................................................. 10
3. Aquaculture Production in south Africa .................................................................... 12
3.1 Species Cultured in South Africa................................................................................ 123.2 Number of Active Producers....................................................................................... 133.3 Total Aquaculture Production and Value..................................................................... 153.4 Production and Value to Export and Local Market....................................................... 20
4. enTerPrise develoPmenT ............................................................................................ 22
4.1 Form of Enterprise..................................................................................................... 224.2 Age of Aquaculture Enterprises.................................................................................. 224.3 Size of Aquaculture Enterprise................................................................................... 234.4 Percentage of Production Capacity............................................................................. 254.5 Sources of finance of aquaculture enterprises............................................................ 254.6 Value Chain Participation........................................................................................... 264.7 Constraints to Aquaculture Enterprise Development.................................................. 274.8 Interventions needed to Promote Enterprise Development......................................... 284.9 BEE Score Awareness................................................................................................ 32
5. emPloymenT .................................................................................................................. 33
5.1 Employment by species group................................................................................... 335.2 Employment by Province........................................................................................... 345.3 Seasonal Employment............................................................................................... 355.4 Employment by Skills Level and Race........................................................................ 37
6. ProduCTs And mArkeTs ............................................................................................... 42
6.1 Market Channels........................................................................................................ 426.2 Form of Product......................................................................................................... 436.3 Determination of Price............................................................................................... 436.4 Domestic Market for Aquaculture Products................................................................. 436.5 International Markets for Aquaculture Products......................................................... 446.5 Product Standards..................................................................................................... 446.6 Product Grades.......................................................................................................... 456.7 Marketing Activities................................................................................................... 466.8 Government Assistance in Accessing Markets............................................................ 46
1

7. ProduCer views And inTerviews.... .................................................................... ..........47
7.1 The business environment ...................................................................................477.2 Abalone ............................................................................................................477.3 Trout ................................................................................................................487.4 Marine Fish ........................................................................................................497.5 Oysters.......................................................................................................................... 497.7 Mussels......................................................................................................................... 507.8 Ornamental Fish and Koi Carp ..............................................................................507.9 Catfish........................................................................................................................... 527.10 Marron..........................................................................................................................527.11 Access to Finance ...............................................................................................52
8. Consumer survey .............................................................................................................52
8.1 Sample Demographic Profile..........................................................................................528.2 Seafood Purchasing Behaviour.......................................................................................538.3 Consumer Perceptions of Aquaculture............................................................................628.4 Frequency of Seafood Purchase ............................................................................70
9. seAfood buyer survey ....................................................................................................75
9.1 Restaurant Buyers.........................................................................................................759.2 Wholesale Buyers ...............................................................................................799.3 Supermarket Buyers......................................................................................................82
10. mArkeT survey imPliCATions for AquACulTure develoPmenT................................85
11. reCommendATions for PromoTing growTh of The
AquACulTure seCTor ......................................................................................................87
11.1....A Comprehensive set of Industrial Support Measures...................................................87
11.2 Support for Small Aquaculture Enterprise Development...............................................8711.3 Facilitated Compliance with Environmental Legislation.................................................8811.4 Veterinary Services......................................................................................................8911.5. Support Freshwater Aquaculture Research...................................................................8911.6 Water Zoning, Infrastructure and Services for Marine Fish Farming ..........................9011.7 Access to Finance........................................................................................................9011.8 Promotion of aquaculture education, training and skills development................................................................................................................9011.9 Promotion of South African Aquaculture Products........................................................9011.10 Promote increased Aquaculture Production to supply market demand for fresh fish...................................................................................................9011.11 Promote Aquaculture Sustainability Schemes...............................................................9111.12 A National Strategy and Coordinated Government Support..........................................91
12. referenCes ......................................................................................................................92
13. APPendiCes ...................................................................................................................... 93
13.1 Production Survey Questionnaire.................................................................................9313.2 Consumer Questionnaire............................................................................................ 10013.3 Restaurant Seafood Buyers Questionnaire.................................................................10513.4 Retail and Supermarket Buyers Questionnaire...........................................................10913.5 Wholesale Seafood Buyers Questionnaire...................................................................113
2009 AISA Aquaculture Benchmarking Survey
2
2009 AISA Aquaculture Benchmarking Survey
Acronyms and Abbreviations
AISA - Aquaculture Institute of South AfricaBEE - Black Economic EmpowermentDAFF - Department of Agriculture, Forestry and FisheriesDEAT - Former Department of Environmental Affairs and TourismDoA - Former Department of AgricultureDST - Department of Science and TechnologyDTI - Department of Trade and IndustryDWAF - Former Department of Water Affairs and ForestryDWEA - Department of Water and Environmental AffairsE.Cape - Eastern Cape ProvinceEIA - Environmental Impact AssessmentEU - European UnionFAMDA - Fishing and Mariculture Development AssociationHACCP - Hazard Alert Critical Control PointKZN - KwaZulu-Natal ProvinceMCM - Marine and Coastal Management Branch of the Department of Agriculture, Forestry and FisheriesN.Cape - Northern Cape ProvinceNEMBA - National Environmental Management: Biodiversity ActOIE - Office International des EpizootiesQHMP - Quality and Health Management ProgrammeSABS - South African Bureau of Standards SME - Small and Medium EnterprisesSMEDP - Small and Medium Size Enterprise Development ProgrammeSTP - Skills development and Training ProgrammeWWF - Worldwide Fund for Nature
3

Preface
Due to the previous lack of reliable statistics about the Aquaculture Sector, the Aquaculture Institute of South Africa (AISA) initiated the “aquaculture benchmarking” project in 2006, with the aim of surveying the industry every three years. The ability to provide reliable statistics to all stakeholders in the aquaculture sector is a key objective for AISA. The 2009 Benchmarking Survey was made possible through a partnership and funding from Swisscontact SA. It was decided to broaden the scope of the 2009 Benchmarking Survey to include a marketing survey that would provide information about species markets, consumer perceptions about aquaculture, factors influencing consumer preferences, and product distribution etc.
At AISA we are acutely aware of the need for reliable production statistics, as we receive a constant stream of requests for data (provincially, nationally and internationally). Since one of AISA’s primary functions is promotion of aquaculture sector development, reliable statistics are especially important in order to establish the growth of the sector over the past three years, the contribution that the sector has made to economic growth, and most importantly to establish the needs of the sector in order to grow the sector over the next five years. This information is used to inform national and provincial strategies, as well as our own organisational business strategy and planning. The success of the 2009 survey was overwhelming, and I’d like to thank all participants for the time they have dedicated to assist us in this survey. We hope that the 2009 survey will go far in supporting decision making in the interest of the development of the Aquaculture Sector in South Africa. Dr. Lizeth Botes (PhD) Chief Executive Officer (CEO) Aquaculture Institute of South Africa (AISA)September 2009
The individuals in all branches of aquaculture who generously gave of their time to complete yet another survey of opinion are thanked most sincerely. We trust that this product, and the processes that it will support justify your support. The real value of this survey lies in the near 100% sample that your cooperation made possible. Special thanks are due to Mr Ferdi Endemann of the Western Cape Province Department of Agriculture for surveying the small farmers and to Analytix Business Intelligence who assisted with the Market survey questionnaire design and who executed the consumer survey. The financial support from the Swiss State Secretariat for Economic Affairs through Swisscontact SA that made this survey possible is greatly appreciated.
4
2009 AISA Aquaculture Benchmarking Survey
Acknowledgements

2009 AISA Aquaculture Benchmarking Survey
5
executive summary
The present report is the second national aquaculture benchmarking survey undertaken by the Aquaculture Institute of South Africa (AISA) which included surveys of primary production and markets
A combination of methods was used to survey the primary producers of aquaculture industry for the period 2005-2008. These included a questionnaire, telephone and face-to face interviews, aggregated production data from producer associations and government sources, and various reports and industry association minutes. One hundred and eleven responses were received, of which 79 were active producers, 14 had left aquaculture, and 14 were not currently producing aquaculture products.
The major commercial freshwater species groups were trout, ornamental fish, koi carp and African catfish, while the main marine species groups were mussels, oysters, and abalone. The most significant recent development was the emergence of pilot commercial scale marine fish culture, visibly, dusky kob, silver kob and yellowtail. Total South Africa aquaculture production in 2008 was 3654 tons worth R327 million. Production tonnage grew at an average rate of 7.8% between 2005 and 2008, and total value at an average annual rate of 32% over the same period. A steady growth in abalone production occurred over the survey period to 934 tons. A consistent production of seaweed for abalone feed was reported by four abalone farms. Oyster production rose by 42% over the survey period to 289 tons in 2008. The first sales of locally cultured marine fish were recorded during 2007 and 2008 by pilot commercial farms producing dusky kob. Mussel production was constant around 500t per annum. Trout production fluctuated over the survey period but rose to 943 tons in 2008. Ornamental fish and koi farmers reported steady production with modest growth. African catfish production was reported to be constant around the 180t level for the last few years. The existing marron farmers did not record any production over the survey period. Pilot tilapia production was approximately 10 tons in 2008. In terms of value, South African aquaculture was dominated by abalone production which was R268 million in 2008, representing 81% of the total rand value of the aquaculture sector. Trout production was second at R28 million in 2008, representing 8.5% of the total. Koi and ornamental were worth R11.5 million, followed by oysters (R8.5 million) and mussels (R6 million).
The provincial distribution of aquaculture production was dominated by the Western Cape Province in both the marine and freshwater sectors, which accounted for 61% of the tonnage and 83% value of total South African output in 2008. Second was the Eastern Cape Province, where predominantly marine farms accounted for 18% of total production representing 7% of the value of South African output in 2008. Mpumalanga, with mainly trout production, was third in terms of value (3.4% of total), with its tonnage making up 8.7% of total production. The other provinces made up the balance of production with production tonnages below 200t.
Exports of South African aquaculture production were made up almost entirely of abalone in 2008, representing 24% of total tonnage and 82% of the total value of South African aquaculture production in 2008. Small quantities of koi carp and trout ova were also exported.
Most South African aquaculture enterprises were relatively young businesses, with 50% less than 10 years old, and 31% less than five years old. Only 20% of enterprises were older than 20 years. Most (76%) aquaculture enterprises were small businesses with a turnover of less than R5 million. Of the larger enterprises with turnover above R5 million, the majority (14) were marine and produced abalone. In terms of provincial distribution, most (13) larger commercial enterprises (R5 million turnover) were located in the Western Cape Province, while small scale commercial enterprises (< R5 million turnover) were more evenly distributed amongst the provinces.

2009 AISA Aquaculture Benchmarking Survey
A high degree of vertical integration was evident in primary production, with 69% of producers operating hatcheries, and 75% raising fry or early juveniles. Producers tended to be vertically integrated into secondary production activities as well, with almost half involved in packing and distribution, and 31% in processing.
The most important ranked constraints to aquaculture enterprise development were environmental regulatory requirements, site selection, processing, permitting, access to finance, and access to research and development. The most important ranked interventions to promote aquaculture were:
• National policy, strategic plan and implementation plan for the sector• Facilitation of access to finance• Promotion of aquaculture education, training and skills development• Capacity to monitor and guarantee the safety of the aquaculture products• Monitoring of water quality to ensure export of aquaculture product• Veterinary Services for Aquaculture• Identification and zoning of areas for aquaculture development • Research, technology development and transfer • Promotion of South African aquaculture• Promotion of best management practices • Promotion of trade in aquaculture products
The South African aquaculture industry employed 1837 full-time, and 355 part-time/ temporary workers, in 2008. This figure excludes the secondary services which are part of the sector but not primary fish producers. The abalone sub-sector was the largest employer with just over 1000 full time employees, and 141 part-time. Second was trout production with 346 full time and 163 part-time. Employment in the aquaculture sector grew by approximately 80% between 2005 and 2008, and was highest in the abalone sector where the number of people employed rose by 234%. On a regional basis, the Western Cape Province was the largest employer with 1022 permanent and 286 part-time employees in 2008. Second was the Eastern Cape (384 full time; 12 part-time) and third Gauteng (185 full-time; 8 part-time). The balance was made up by the other provinces with substantially lower numbers. The survey revealed that very few (<10%) aquaculture farms employed seasonal labour. As is the case in most South African primary industries, the professional skills level was mainly white, while the unskilled and semi-skilled categories comprised predominantly of black and coloured employees. A more balanced racial profile was evident in the “skilled” and “middle services” categories.
The “small to medium size enterprise” characteristic of many aquaculture ventures was reflected in the market channels utilised. The most commonly used market channel was wholesalers, with 35 primary aquaculture enterprises utilising this option. However, a relatively high number of enterprises (26) sold directly to consumers, particularly trout and koi producers. Two thirds of respondents sold their product as either live or freshly killed, whereas only one third employed some form of processing or value adding. The largest volume of trout (45%), mussels (55%) and oysters (61%) was sold in the Western Cape Province, while the Gauteng provided the biggest market for ornamentals (28%), koi carp (53%), catfish (99%) and dusky kob (100%) (Table 6.4). The second biggest market for trout was KZN (19.5%), with Gauteng third (11.6%).
Interviews with producers revealed that the odds are stacked heavily against the entry of small businesses into aquaculture. Fourteen respondents indicated that they were no longer in production, and a further 14 were not producing any product at the time of the survey; - mainly because their enterprises were not financially viable, or there was a regulatory hurdle which they could not overcome. There was a net exodus of small producers over the survey period, juxtaposed with a phase of consolidation and expansion of larger producers. Apart from government sponsored small scale farmers, there were few small scale entrants into the aquaculture industry. A great many of the constraints related to the application of environmental legislation and permitting, lack of coordination between government departments, and compliance with health and product quality standards. The back bone of the South African aquaculture industry is clearly the established
6

medium size enterprises, which have achieved the critical mass to run vertically integrated operations. Medium size producers interviewed were generally optimistic about market prospects for aquaculture products, but were acutely aware of the dynamic nature of markets which are increasingly affected by global forces.
The market survey component of the 2009 Aquaculture Benchmarking survey, was divided into two related surveys:- a consumer survey and a buyer (restaurant, supermarket and wholesale) survey. The surveys aimed to gather data on:
1. The South African seafood market and contribution of aquaculture species.2. Consumer perceptions and needs in terms of seafood and aquaculture products.3. Factors influencing consumer preferences, e.g:. geographic location, culture, religion etc.4. Market trends.
Key findings from the consumer and seafood buyer marketing surveys, which have implications for aquaculture development, were:
Consumers:• Consumers lack awareness of aquaculture and the associated product characteristics. Eighty-
five percent of consumers have not heard of aquacultre, and do not distinguish between wild and farmed aquaculture products. If offered a choice between wild and farmed seafood products, they would choose wild – due to perceived more “natural” product qualities.
• Religion and culture did not strongly influence consumer buying choices, but geographic location and race group did.
• Consumers in the Western Cape displayed the greatest awareness of aquaculture.• South African consumers are conservative in their seafood choices, sticking to what they
know. Black consumers are the most conservative in their seafood product choices, but displayed a strong growth in seafood buying compared to other race groups.
• Better educated, and higher LSM group, consumers were more aware of what aquaculture was and purchased a greater variety of seafood including sushi.
• Consumers would like more information about whether their products were farmed or imported, and indicated a preference for local seafood products.
Seafood buyers:• Seafood buyers for restaurants, wholesalers, and supermarkets, were familiar with
aquaculture products and their positive product characteristics. They expected a greater proportion of the market to be supplied by aquaculture products in the future.
• Buyers do not distinguish between aquaculture and wild products, but buy on the basis of required product characteristics, particularly: quality, freshness, availability, appearance and price. They generally do not inform the customer whether a product is of farmed or wild origin.
• Aquaculture products feature prominently in the mix of products purchased by restaurants and wholesale seafood outlets. Fewer aquaculture products are stocked by supermarkets, which sell mainly frozen, wild seafood products. The highest selling aquaculture products are imported namely, salmon, prawns and mussels.
• The supply of certain wild seafood products was becoming increasingly limited, particularly items such as fresh tuna and linefish.
• Restaurant and seafood wholesale buyers would purchase more aquaculture products, particularly fresh products, if they were available.
• Seafood buyers were aware of seafood sustainability issues, and generally supported awareness and labelling schemes such as the WWF’s Sustainable Seafood Initiative (SASSI), and the Marine Stewardship Council (MSC) certification in their purchase choices. Aquaculture products were perceived as a potentially sustainable supply of seafood.
7
2009 AISA Aquaculture Benchmarking Survey

The surveys confirmed that the seafood market is in a period of transition, with declining supplies of traditional, local wild fish, and increasing market share by imported wild and farmed products. There is an opportunity for locally farmed products to gain a greater market share in the fresh high value product markets. It is unlikely that locally cultured products will be competitive in the frozen, commodity type product niches – with the possible exception of mussels. There is a trend to pre-cooked, ready to eat products in supermarkets which aquaculture producers may be able to exploit.
The survey showed that South African seafood suppliers are buying into the concept of sustainable seafood, and sustainability is becoming important in purchase decisions. Aquaculture products were regarded as potentially sustainable products, although consumers and buyers were aware of some of the negative health and environmental associations with intensively farmed products. Therefore, if the aquaculture industry establishes itself as a credible source of sustainable seafood, this should help to secure market share in the future.
The following recommendations for promoting the growth of the Aquaculture Sector over the next five years were made:
• A comprehensive set of industrial support measures.• Support for Small Aquaculture Enterprise Development• Facilitated Compliance with Environmental Legislation• Veterinary Services• Recognise and Support Ornamental Fish Aquaculture• Support Aquaculture Research• Water Zoning, Infrastructure and Services • Access to Finance• Promotion of aquaculture education, training and skills development• Promotion of South African Aquaculture Products• Promote Aquaculture Sustainability Schemes • A National Aquaculture Strategy and Coordinated Government Support
8
2009 AISA Aquaculture Benchmarking Survey
2009 AISA Aquaculture Benchmarking Survey
1. introduction
This report presents a survey of primary aquaculture production and markets in South Africa, which was undertaken as part of the Aquaculture Institute of South Africa’s (AISA) 2009 Aquaculture Benchmarking Survey.
The first benchmarking survey, conducted in 2006, provided valuable primary data and opinions directly from producers, which has assisted government planning in support of aquaculture sector development1. In the light of the significant developments in South African aquaculture since 2006, particularly the increasing government support for sector development, the benchmarking survey was repeated in 2009.
Reliable primary information and statistics on industry trends are vital to investment decisions and planning, by both industry and government. A further factor motivating the 2009 Benchmarking Survey is maintaining continuity of production statistics as the collection and publication of aquaculture production data has been erratic in South Africa123. Although various government departments compile data on components of the sector, the “AISA Aquaculture Benchmarking Survey” represents the only comprehensive attempt to document the status of both marine and freshwater aquaculture on a regular basis. In addition to gathering production data, the survey provided a valuable opportunity to interview producers and gain a comprehensive snapshot of the “state of play” of South African aquaculture.
The local aquaculture literature reflects an almost complete absence of any primary research on the South African market for aquaculture products, as research has historically focussed on production technology. Local seafood market information is almost entirely locked up in private enterprises, and is effectively a “black box” for new producers and aquaculture sector planners. Reliable primary information and statistics on industry trends are vital to investment decisions and planning, by both industry and government. It was therefore decided to conduct a pilot survey on the local market and consumer perceptions about aquaculture products.
The AISA 2009 aquaculture benchmarking survey consisted of two components:
1. The primary production survey which aimed to:a. Establish the growth of production the sector since 2006b. Provide insight into the value chain and the sector’s contribution to economic developmentc. Establish the needs of the sector in order to grow over the next five years.
2. The marketing survey which aimed to determine:
a. The markets for aquaculture species.b. Consumer perceptions and needs in terms of aquaculture products.c. Factors influencing consumer preferences, e.g:. geographic location, culture, religion etc.d. How these factors influence the market and product distribution.
In this report the results of the AISA 2009 Aquaculture Benchmarking Survey are presented and discussed. Recommendations for promoting growth of the sector over the next five years are based on a synthesis of both the production and marketing surveys are presented.
� Botes,ThompsonandLouw,2006.BenchmarkingsurveyoftheSouthAfrican(marineandfreshwater)aquaculturesector. AquacultureInstituteofSouthAfricareport.94p.
2 Hoffman,L.C.,J.J.SwartandD.Brink.2000“The�998productionandstatusofaquacultureinSouthAfrica.”Water SA26(�).
� Sauer,W,Hecht,T.,Britz,P.J.,andMather,D.(eds).“AnEconomicandSectoralStudyoftheSouthAfricanFishingIndustry.Volume2. FisheryProfiles.”ReportpreparedbyRhodesUniversityforMarineandCoastalManagement,DepartmentofEnvironmentAffairsand Tourism,200�,Chapter�5Mariculture,pp.29��08..
9

2009 AISA Aquaculture Benchmarking Survey
2. methodology
2.1 Production survey
2.1.1 Production survey methodologyA combination of methods was used to survey the primary producers of aquaculture industry. These included a questionnaire (Appendix 1), telephone and face-to face interviews, aggregated production data from producer associations and government sources, and various reports and industry association minutes. The data and producer opinions were gathered during the months of May and June 2009. The questionnaire was emailed or faxed to the respondents, and telephonic and email follow-ups were conducted to elicit responses and perform selected interviews. In the Western Cape Province, Mr Ferdi Endemann, an Aquaculture Extension Specialist with the Department of Agriculture assisted by surveying the 23 active small scale trout farmers associated with the “Hands-On Cooperative”.
2.1.2 Database of ContactsThe confidential database of producer contacts from the 2006 benchmarking was updated during the survey. Contact information for current producers was obtained from producer associations, government sources, the 2006 AISA survey database, and personal contacts. Those no longer in production, or not involved in primary production, were removed from the active producer lists.
2.1.3 Data Capture and AnalysisThe data from the surveys was captured into an Excel spreadsheet from which aggregate data was extracted for analysis and presentation in the report.
2.1.4 Survey ReturnsThe high number of survey returns yielded a total estimate of total production, value and employment in the primary aquaculture sector (Table2.1). Eighty three active producers were identified of which only four declined to participate in the survey. Fourteen respondents indicated they had closed their operations, and another 14 were not currently producing any aquaculture products. We could not verify a further 37 contacts in the 2006 AISA and other databases, but were confident that few, if any, were active producers, as we asked key industry informants and producer association representatives to verify our list of active aquaculture operations.
Table 2.1 Number and category of returns for the AISA 2009 Survey.
2.2. market survey
2.2.1 Survey MethodologyThe market research was divided into two related surveys: - a consumer survey and a buyer (restaurant, supermarket and wholesale) survey.
survey Participants n percent
Surveys returned 79 53.3
Closed operations 14 9.4
Not active producers 14 9.4
Declined to participate 4 2.7
Could not verify contact 37 25.0
Total respondents 111 75.0
Survey forms sent 148 100.0
10

11
The aims of the consumer study were to gain insights into: • The market for specific seafood types.• The consumer needs with regard to how sales of aquaculture products compare to other
produce.• Consumer preferences for certain products. • Awareness, understanding and perceptions of aquaculture products. • Purchasing behaviour and trends of seafood forms and value-added products.
The aims of the buyer study were to gain insights into: • The quantity of wild vs. aquaculture seafood purchased; • The quantity of local vs. imported seafood purchased; • The buyers’ knowledge of aquaculture related issues; and international and local seafood
trends
2.2.2 Survey QuestionnairesThe survey content and questionnaire were developed by Analytix Business Intelligence and AISA with input from the production survey team. The questionnaires are contained in appendices as follows:
• Consumer questionnaire – Appendix 2• Restaurant buyer questionnaire – Appendix 3• Wholesale buyer questionnaire – Appendix 4• Supermarket buyer questionnaire - Appendix 5
2.2.3 Sample Size and Geographical DistributionThe sample of the consumer study consisted of 300 respondents who were randomly selected and interviewed. Face to face interviews were conducted at supermarkets and in residential areas, each survey taking an average of 15-20 minutes to complete. The total sample margin of error was 5.6% with a 95% level of confidenceIn order to ensure that respondents were representative of the national urban South African population, the sample was drawn from Gauteng (GP, n=100), the Western Cape (WC, Cape Town n=100), the Eastern Cape (EC, Port Elizabeth n=50) and Kwazulu-Natal (KZN, Durban n=50). The focus was placed on these metropolitan areas as they contribute more than 70% to national food expenditure (Stats SA Income and Expenditure survey 2005/2006).
The racial mix of respondents was white n=100; coloured n=75; Indian n=75; and black n=50. A quota sample was used to ensure that we gained feedback that accurately reflects the perceptions, opinions and behaviour from a diverse geo-demographic population of end-consumers (within the given budget parameters) within major metropolitan areas and to ensure that we received credible and reliable feedback from the multitude of cultures and racial groups and consisted of a White; Coloured; Indian; and Black respondents.
The majority respondents (70%) were female while thirty percent were male. It was assumed that more females than males were responsible for the monthly household grocery shopping. A 70% female quota was used to reflect secondary research from AMPS 2008, where the majority of supermarket grocery shopping was found to be done by females. The sample was drawn from consumers categorised within the Living Standards Measure4 (LSM) 8 (16%), 9 (41%) and 10 (44%), so that a robust sample of people were surveyed who were hypothesised to consume more seafood/fish than people within lower income sectors.
The buyer sample consisted of five restaurant (of which three responded), four supermarket (of which two responded), and four wholesale (of which three responded) buyers. Buyers were contacted telephonically and asked to complete the questionnaires which were returned via email and fax.
4 The South African Advertising Research Foundation’s LSM (Living Standards Measure) has become the most widely used marketing research tool in Southern Africa. It divides the population into 10 LSM groups, 10 (highest) to 1 (lowest). The LSM cuts across race and other outmoded techniques of categorising people, and instead groups people according to their living standards using criteria such as degree of urbanisation and ownership of cars and major appliances.
2009 AISA Aquaculture Benchmarking Survey

3. Aquaculture Production in south Africa
3.1 species Cultured in south Africa
The lists of marine and freshwater species cultured in South Africa during the period 2005-2008 are presented in Tables 3.1 and 3.2 respectively. Approximately five commercial species groups were cultured in the marine and freshwater environments respectively. However, a greater number of marine species were at a pilot commercial and research stage of development, indicating that more investment and economic growth was occurring in the marine sector.
The major commercial freshwater species groups were trout, ornamental fish, koi carp and African catfish, while the main marine species groups were mussels, oysters, and abalone.
Table 3.1 Freshwater Species Cultured in South Africa during the Period 2005-2008.
Table 3.2 Marine Species Cultured in South Africa during the Period 2005-2008.
Common Name Scientific Name Status Origin
Rainbow Trout Onchorynchus mykiss Commercial Exotic
Brown trout Salmo trutta Commercial Exotic
Ornamental fish Mixed Species Commercial Exotic
Koi Carp Cyprinus carpio Commercial Exotic
African Catfish Clarias gariepinus Commercial Indigenous
Mozambique Tilapia Oreochromis mossambicus Pilot commercial Indigenous
Nile tilapia Oreochromis niloticus Pilot commercial Exotic
Marron Cherax tenuimanus Pilot commercial Exotic
Waterblommetjies Aponogeton distachyos Commercial Indigenous
Common Name Scientific Name Status Origin
Abalone Haliotis midae Commercial Indigenous
Spanish Mussel Mytilus galloprovincialis Commercial Exotic
Brown Mussel Perna perna Commercial Indigenous
Oysters Crassostrea gigas Commercial Exotic
Dusky Kob Aryrosomus japonicus Pilot commercial Indigenous
Silver Kob Aryrosomus inodorus Pilot commercial Indigenous
Yellowtail Seriola lalandii Pilot commercial Indigenous
Atlantic Salmon Salmo salar Pilot commercial Exotic
Clownfish Various species Pilot commercial Exotic
White Margined Sole Dagichthyes marginatus Research Indigenous
Pacific White Prawn Litopenaeus vannamei Pilot commercial Exotic
White Prawn Penaeus indicus Commercial Indigenous
West Coast Rock Lobster Jasus lalandii Research Indigenous
East Coast Rock Lobster Panulirus homarus homarus Research Indigenous
Scallop Pecten sulcicostatus Research Indigenous
Blood Worm Arenicola loveni Research Indigenous
Seaweed Ulva lactuca Commercial Indigenous
Seaweed Gracillaria Commercial Indigenous
2009 AISA Aquaculture Benchmarking Survey
12
The most significant development since the 2006 benchmarking survey was the emergence of pilot commercial scale marine fish culture, visibly, dusky kob, silver kob and yellowtail.
In the freshwater sub-sector, 7 of the 10 species cultured were exotic, while in the marine sub-sector, 13 were indigenous and 5 exotic, reflecting a research and development focus on developing local marine species for commercial aquaculture.
Commercial production of species that had terminated by the end of the survey period included Nile tilapia, Atlantic salmon, and white prawn.
3.2. number of Active Producers
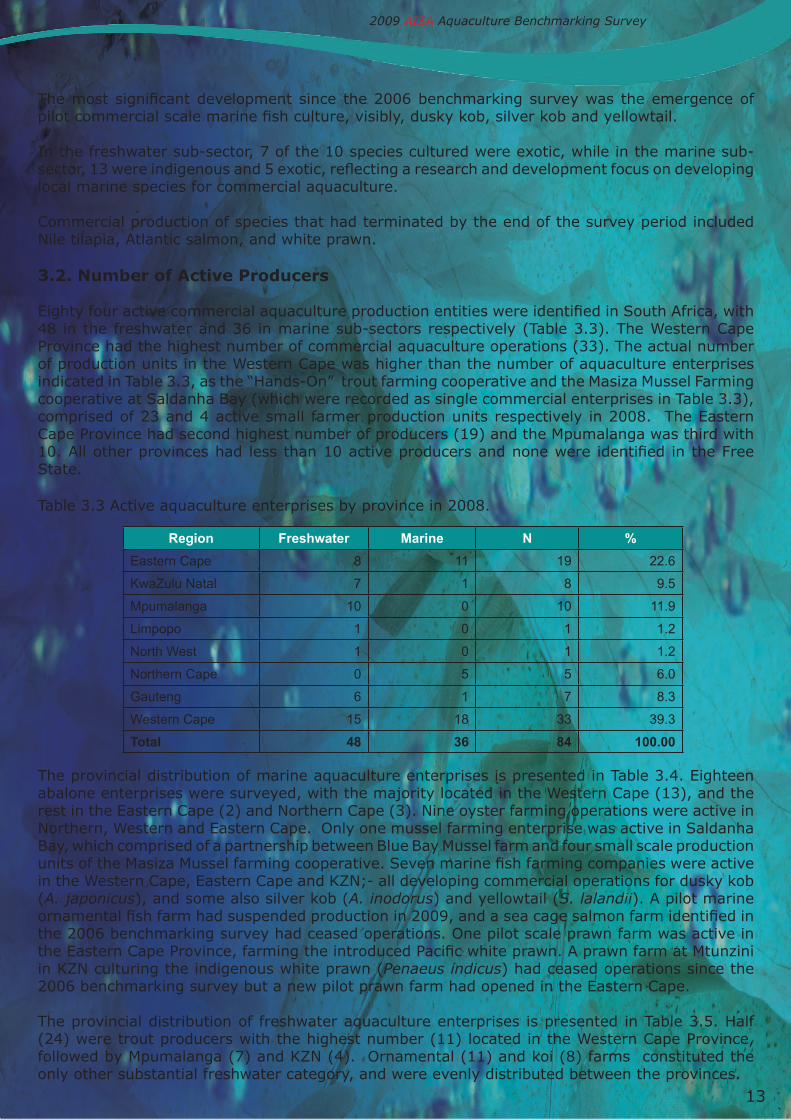
Eighty four active commercial aquaculture production entities were identified in South Africa, with 48 in the freshwater and 36 in marine sub-sectors respectively (Table 3.3). The Western Cape Province had the highest number of commercial aquaculture operations (33). The actual number of production units in the Western Cape was higher than the number of aquaculture enterprises indicated in Table 3.3, as the “Hands-On” trout farming cooperative and the Masiza Mussel Farming cooperative at Saldanha Bay (which were recorded as single commercial enterprises in Table 3.3), comprised of 23 and 4 active small farmer production units respectively in 2008. The Eastern Cape Province had second highest number of producers (19) and the Mpumalanga was third with 10. All other provinces had less than 10 active producers and none were identified in the Free State.
Table 3.3 Active aquaculture enterprises by province in 2008.
The provincial distribution of marine aquaculture enterprises is presented in Table 3.4. Eighteen abalone enterprises were surveyed, with the majority located in the Western Cape (13), and the rest in the Eastern Cape (2) and Northern Cape (3). Nine oyster farming operations were active in Northern, Western and Eastern Cape. Only one mussel farming enterprise was active in Saldanha Bay, which comprised of a partnership between Blue Bay Mussel farm and four small scale production units of the Masiza Mussel farming cooperative. Seven marine fish farming companies were active in the Western Cape, Eastern Cape and KZN;- all developing commercial operations for dusky kob (A. japonicus), and some also silver kob (A. inodorus) and yellowtail (S. lalandii). A pilot marine ornamental fish farm had suspended production in 2009, and a sea cage salmon farm identified in the 2006 benchmarking survey had ceased operations. One pilot scale prawn farm was active in the Eastern Cape Province, farming the introduced Pacific white prawn. A prawn farm at Mtunzini in KZN culturing the indigenous white prawn (Penaeus indicus) had ceased operations since the 2006 benchmarking survey but a new pilot prawn farm had opened in the Eastern Cape.
The provincial distribution of freshwater aquaculture enterprises is presented in Table 3.5. Half (24) were trout producers with the highest number (11) located in the Western Cape Province, followed by Mpumalanga (7) and KZN (4). Ornamental (11) and koi (8) farms constituted the only other substantial freshwater category, and were evenly distributed between the provinces.
13
2009 AISA Aquaculture Benchmarking Survey
Region Freshwater Marine N %
Eastern Cape 8 11 19 22.6
KwaZulu Natal 7 1 8 9.5
Mpumalanga 10 0 10 11.9
Limpopo 1 0 1 1.2
North West 1 0 1 1.2
Northern Cape 0 5 5 6.0
Gauteng 6 1 7 8.3
Western Cape 15 18 33 39.3
Total 48 36 84 100.00

One pilot tilapia (E. Cape) and two very small marron farms (one W.Cape and one E.Cape) were surveyed. While it is known that waterblommetjies (Aponogeton distachyos) are grown in water, the producers do not participate in aquaculture institutional structures, and none were identified during the survey. Two catfish (C. gariepinus) producers were identified, one in the North-West Province and one in the Western Cape.
Common Name Scientific Name ProvinceNumber of
farms
Abalone Haliotis midae Eastern Cape 2
Abalone Haliotis midae Western Cape 13
Abalone Haliotis midae Northern Cape 3
Mussels Mytilus galloprovincialis Western Cape 11
Oysters Crassostrea gigas Eastern Cape 4
Oysters Crassostrea gigas Northern Cape 2
Oysters Crassostrea gigas Western Cape 3
Marine FishAryrosomus japonicus, Argyrosomus inodorusSeriola lalandii
Eastern Cape 4
Marine Fish Aryrosomus japonicus Kwazulu Natal 1
Marine Fish Aryrosomus japonicus Gauteng 1
Marine FishAryrosomus japonicusArgyrosomus inodorusSeriola lalandii
Western Cape 1
Seaweed Ulva lactuca and Gracillaria Eastern Cape 3
Seaweed Ulva lactuca Western Cape 2
Prawns Litopenaeus vannamei Eastern Cape 1
Total 352
Table 3.4 Marine aquaculture enterprises by species and province in 2008.
14
2009 AISA Aquaculture Benchmarking Survey
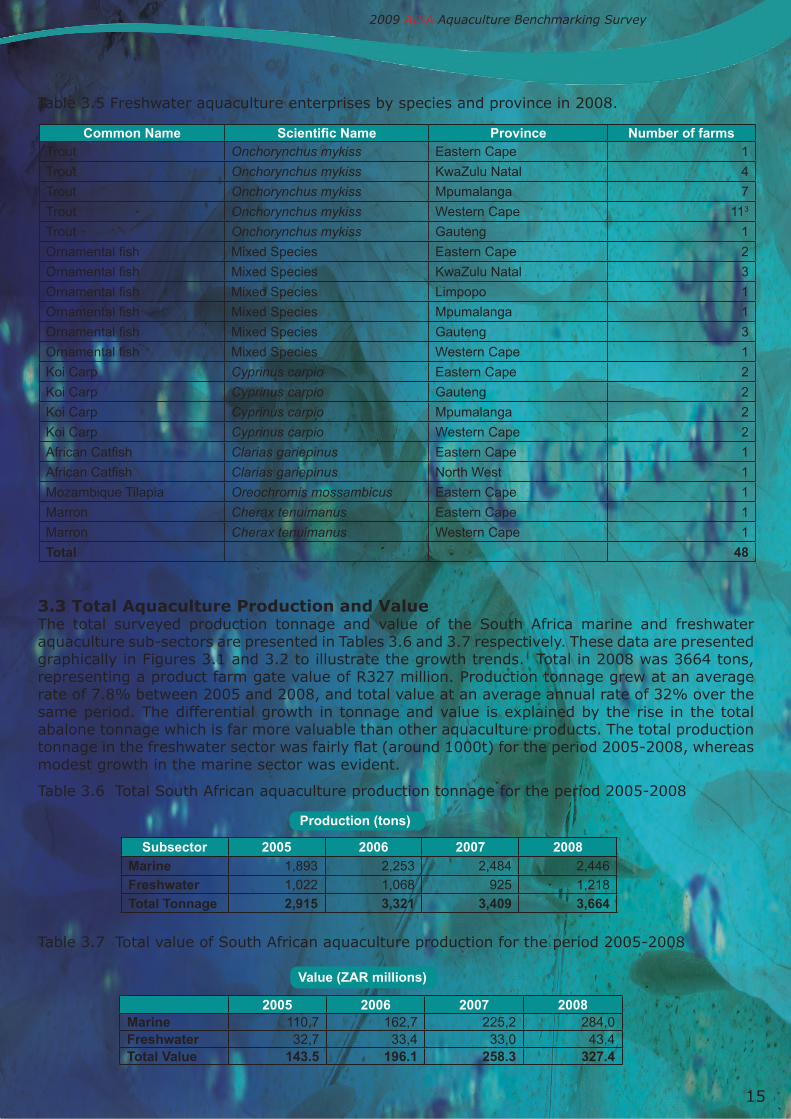
Table 3.5 Freshwater aquaculture enterprises by species and province in 2008.
3.3 Total Aquaculture Production and valueThe total surveyed production tonnage and value of the South Africa marine and freshwater aquaculture sub-sectors are presented in Tables 3.6 and 3.7 respectively. These data are presented graphically in Figures 3.1 and 3.2 to illustrate the growth trends. Total in 2008 was 3664 tons, representing a product farm gate value of R327 million. Production tonnage grew at an average rate of 7.8% between 2005 and 2008, and total value at an average annual rate of 32% over the same period. The differential growth in tonnage and value is explained by the rise in the total abalone tonnage which is far more valuable than other aquaculture products. The total production tonnage in the freshwater sector was fairly flat (around 1000t) for the period 2005-2008, whereas modest growth in the marine sector was evident.
Table 3.6 Total South African aquaculture production tonnage for the period 2005-2008
Table 3.7 Total value of South African aquaculture production for the period 2005-2008
Common Name Scientific Name Province Number of farmsTrout Onchorynchus mykiss Eastern Cape 1
Trout Onchorynchus mykiss KwaZulu Natal 4
Trout Onchorynchus mykiss Mpumalanga 7
Trout Onchorynchus mykiss Western Cape 113
Trout Onchorynchus mykiss Gauteng 1
Ornamental fish Mixed Species Eastern Cape 2
Ornamental fish Mixed Species KwaZulu Natal 3
Ornamental fish Mixed Species Limpopo 1
Ornamental fish Mixed Species Mpumalanga 1
Ornamental fish Mixed Species Gauteng 3
Ornamental fish Mixed Species Western Cape 1
Koi Carp Cyprinus carpio Eastern Cape 2
Koi Carp Cyprinus carpio Gauteng 2
Koi Carp Cyprinus carpio Mpumalanga 2
Koi Carp Cyprinus carpio Western Cape 2
African Catfish Clarias gariepinus Eastern Cape 1
African Catfish Clarias gariepinus North West 1
Mozambique Tilapia Oreochromis mossambicus Eastern Cape 1
Marron Cherax tenuimanus Eastern Cape 1
Marron Cherax tenuimanus Western Cape 1
Total 48
Subsector 2005 2006 2007 2008
Marine 1,893 2,253 2,484 2,446
Freshwater 1,022 1,068 925 1,218
Total Tonnage 2,915 3,321 3,409 3,664
Production (tons)
Value (ZAR millions)
2005 2006 2007 2008Marine 110,7 162,7 225,2 284,0Freshwater 32,7 33,4 33,0 43,4Total Value 143.5 196.1 258.3 327.4
15
2009 AISA Aquaculture Benchmarking Survey

If the production tonnage by species group is considered (Table 3.8), a steady growth in abalone production occurred over the survey period with existing farms building up to full production. Abalone production levelled off somewhat in 2008. A consistent production of seaweed for abalone feed was reported by four abalone farms. Oyster production rose by 42% over the survey period, but was fairly stable during 2007/8. The first sales of locally cultured marine fish were recorded during 2007 and 2008 by pilot commercial farms producing dusky kob. Mussel production was constant around 500t per annum. Trout production fluctuated over the survey period with a poor production year being recorded in 2007 due to environmental conditions. Ornamental fish and koi farmers reported steady production with modest growth. African catfish production was reported to be constant around the 180t level for the last few years. The existing marron farmers did not record any production over the survey period.
In terms of value, South African aquaculture is dominated by abalone production which was R268 million in 2008, representing 81% of the total rand value of the aquaculture sector (Table 3.9). Trout production was second at R28 million in 2008, representing 8.5% of the total. Koi and ornamental were worth R11.5 million, followed by oysters (R8.5 million) and mussels (R6 million).
figure 3.1 south African marine and freshwater aquaculture production 2005-2008.
figure 3.2 south African marine and freshwater aquaculture production value 2005-2008.
16
2009 AISA Aquaculture Benchmarking Survey
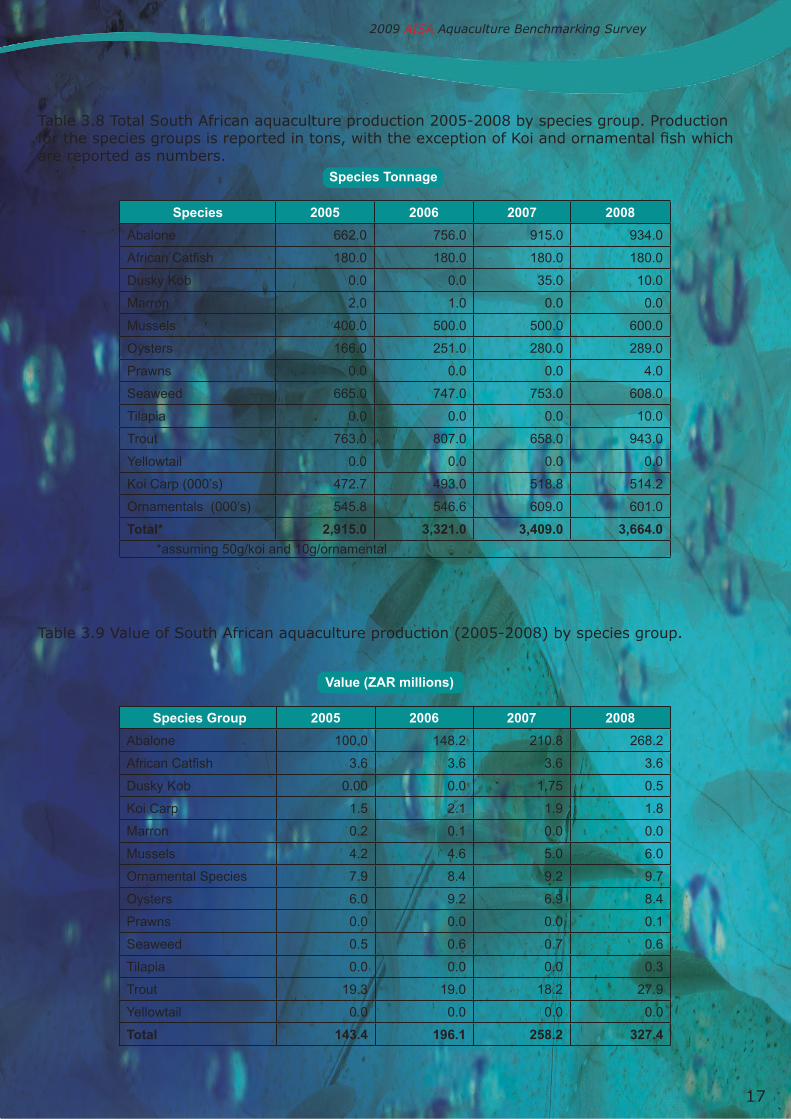
Table 3.8 Total South African aquaculture production 2005-2008 by species group. Production for the species groups is reported in tons, with the exception of Koi and ornamental fish which are reported as numbers.
Table 3.9 Value of South African aquaculture production (2005-2008) by species group.
Species 2005 2006 2007 2008
Abalone 662.0 756.0 915.0 934.0
African Catfish 180.0 180.0 180.0 180.0
Dusky Kob 0.0 0.0 35.0 10.0
Marron 2.0 1.0 0.0 0.0
Mussels 400.0 500.0 500.0 600.0
Oysters 166.0 251.0 280.0 289.0
Prawns 0.0 0.0 0.0 4.0
Seaweed 665.0 747.0 753.0 608.0
Tilapia 0.0 0.0 0.0 10.0
Trout 763.0 807.0 658.0 943.0
Yellowtail 0.0 0.0 0.0 0.0
Koi Carp (000’s) 472.7 493.0 518.8 514.2
Ornamentals (000’s) 545.8 546.6 609.0 601.0
Total* 2,915.0 3,321.0 3,409.0 3,664.0
*assuming 50g/koi and 10g/ornamental
Species Group 2005 2006 2007 2008
Abalone 100.0 148.2 210.8 268.2
African Catfish 3.6 3.6 3.6 3.6
Dusky Kob 0.00 0.0 1.75 0.5
Koi Carp 1.5 2.1 1.9 1.8
Marron 0.2 0.1 0.0 0.0
Mussels 4.2 4.6 5.0 6.0
Ornamental Species 7.9 8.4 9.2 9.7
Oysters 6.0 9.2 6.9 8.4
Prawns 0.0 0.0 0.0 0.1
Seaweed 0.5 0.6 0.7 0.6
Tilapia 0.0 0.0 0.0 0.3
Trout 19.3 19.0 18.2 27.9
Yellowtail 0.0 0.0 0.0 0.0
Total 143.4 196.1 258.2 327.4
Species Tonnage
Value (ZAR millions)
17
2009 AISA Aquaculture Benchmarking Survey

The provincial distribution of aquaculture production was dominated by the Western Cape Province in both the marine and freshwater sectors, which accounted for 61% of the tonnage and 83% value of total South African output in 2008 (Tables 3.10 and 3.11, Figs. 3.3 and 3.4). Second was the Eastern Cape Province, where predominantly marine farms accounted for 18% of total production representing 7% of the value of South African output in 2008. Mpumalanga, with mainly trout production, was third in terms of value (3.4% of total), with its tonnage making up 8.7% of total production. The other provinces made up the balance of production with production tonnages below 200t.
Table 3.10 Provincial profile of South African aquaculture production volume in 2008.
*assuming 50g/koi and 10g/ornamental Table 3.11 Provincial profile of the value of South African aquaculture production in 2008.
Su
b-s
ecto
r
Eas
tern
C
ape
Kw
aZu
lu
Nat
al
Gau
ten
g
Lim
po
po
Mp
um
a-la
ng
a
No
rth
Wes
t
No
rth
ern
C
ape
Wes
tern
C
ape
Marine 668.4 2.5 2.5 0.0 0.0 0.0 56.7 1,715.5
Freshwater 2.9 142.1 56.5 0.4 318.7 180.0 0.0 517.8
Total (tons)* 671.4 144.6 59.0 0.43 318.7 180.0 56.7 2,233.2
Sub-sectorEastern
CapeKwaZulu
NatalGauteng Limpopo
Mpuma-langa
North West
Northern Cape
Western Cape
Marine Species
24.5 0.1 0.2 0.0 0.0 0.0 4.4 256.8
Freshwater Species
1.7 5.6 6.4 0.2 11.2 4.6 0.0 16.7
Total 24.2 5.7 7.6 0.2 11.2 4.6 4.4 272.5
Production (tons)
Value (ZAR million)
18
2009 AISA Aquaculture Benchmarking Survey

figure 3.3 south African provincial aquaculture production (tons) in 2008.
figure 3.4 value of south African provincial aquaculture production in 2008 (rand millions).
19
2009 AISA Aquaculture Benchmarking Survey
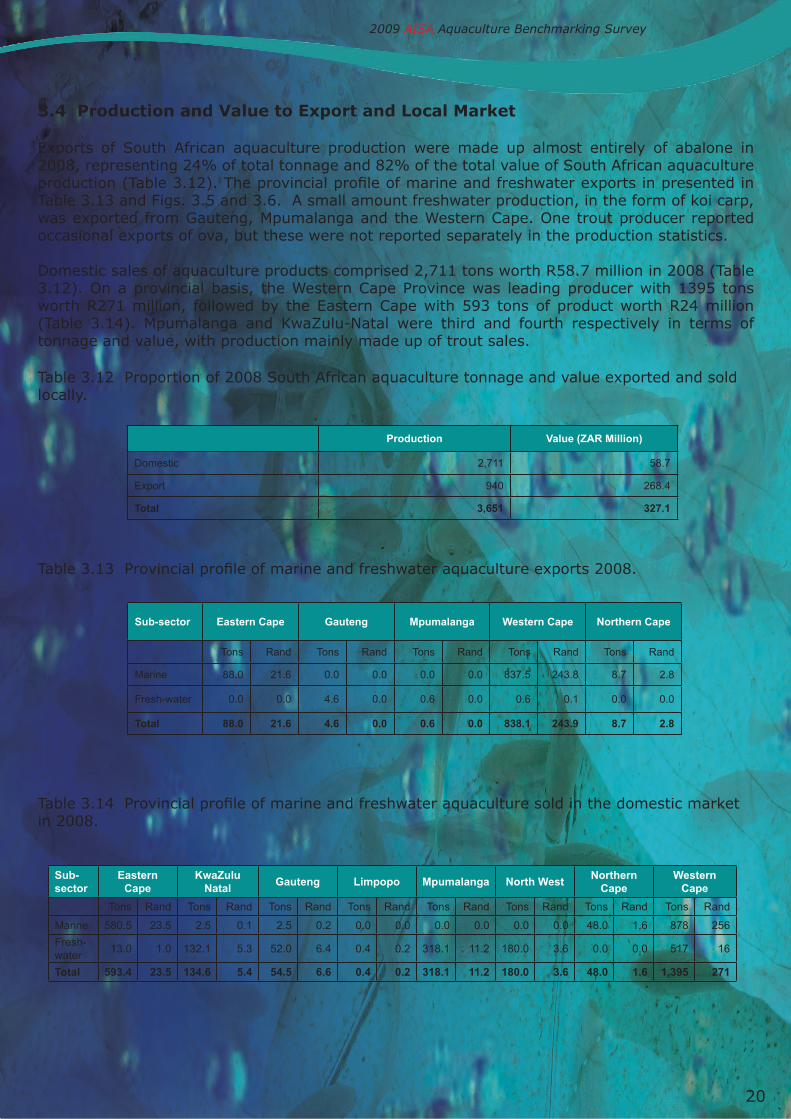
3.4 Production and value to export and local market
Exports of South African aquaculture production were made up almost entirely of abalone in 2008, representing 24% of total tonnage and 82% of the total value of South African aquaculture production (Table 3.12). The provincial profile of marine and freshwater exports in presented in Table 3.13 and Figs. 3.5 and 3.6. A small amount freshwater production, in the form of koi carp, was exported from Gauteng, Mpumalanga and the Western Cape. One trout producer reported occasional exports of ova, but these were not reported separately in the production statistics.
Domestic sales of aquaculture products comprised 2,711 tons worth R58.7 million in 2008 (Table 3.12). On a provincial basis, the Western Cape Province was leading producer with 1395 tons worth R271 million, followed by the Eastern Cape with 593 tons of product worth R24 million (Table 3.14). Mpumalanga and KwaZulu-Natal were third and fourth respectively in terms of tonnage and value, with production mainly made up of trout sales.
Table 3.12 Proportion of 2008 South African aquaculture tonnage and value exported and sold locally.
Table 3.13 Provincial profile of marine and freshwater aquaculture exports 2008.
Table 3.14 Provincial profile of marine and freshwater aquaculture sold in the domestic market in 2008.
Production Value (ZAR Million)
Domestic 2,711 58.7
Export 940 268.4
Total 3,651 327.1
Sub-sector Eastern Cape Gauteng Mpumalanga Western Cape Northern Cape
Tons Rand Tons Rand Tons Rand Tons Rand Tons Rand
Marine 88.0 21.6 0.0 0.0 0.0 0.0 837.5 243.8 8.7 2.8
Fresh-water 0.0 0.0 4.6 0.0 0.6 0.0 0.6 0.1 0.0 0.0
Total 88.0 21.6 4.6 0.0 0.6 0.0 838.1 243.9 8.7 2.8
Sub-sector
Eastern Cape
KwaZuluNatal
Gauteng Limpopo Mpumalanga North WestNorthern
CapeWestern
Cape
Tons Rand Tons Rand Tons Rand Tons Rand Tons Rand Tons Rand Tons Rand Tons Rand
Marine 580.5 23.5 2.5 0.1 2.5 0.2 0.0 0.0 0.0 0.0 0.0 0.0 48.0 1.6 878 256
Fresh-water
13.0 1.0 132.1 5.3 52.0 6.4 0.4 0.2 318.1 11.2 180.0 3.6 0.0 0.0 517 16
Total 593.4 23.5 134.6 5.4 54.5 6.6 0.4 0.2 318.1 11.2 180.0 3.6 48.0 1.6 1,395 271
20
2009 AISA Aquaculture Benchmarking Survey

figure 3.5 south African aquaculture exports by province in 2008
figure 3.6 value of south African aquaculture exports in 2008 by province.
21
2009 AISA Aquaculture Benchmarking Survey

4. enterprise development
4.1 form of enterprise
The majority (52%) of enterprises in the South African aquaculture sector in 2008 were registered as proprietary limited companies (Table 4.1). There were more closed corporation and sole trader registered enterprises (20) in the freshwater sector than the marine sector (2), reflecting that the marine aquaculture enterprises tend to be more capital intensive, medium size enterprises. Trusts and cooperatives were used as vehicles for small farmer enterprises requiring joint management and marketing structures.
Table 4.1 Number and type of business enterprises in the South African aquaculture industry in 2008.
4.2 Age of Aquaculture enterprises
Most South African aquaculture enterprises were relatively young businesses, with 50% less than 10 years old, and 31% less than five years old (Tables 4.2 and 4.3, Figure 3.7). Only 20% of enterprises (mainly trout) were older than 20 years. The provincial distribution of the age of aquaculture ventures reflects 1) the relatively young, mainly marine dominated aquaculture sector in the Western and Eastern Cape Provinces and 2) the mature, stable trout production sector in Mpumalanga which developed in the 1980’s.
Table 4.2 Age of aquaculture ventures in South Africa in 2008.
Entity type Freshwater Marine n %
Sole Trader 6 1 7 8.9
Closed Corporation
14 1 15 19.0
Pty Ltd 15 26 41 51.0
Trust 2 1 3 3.8
Co-operative 1 0 1 1.3
Other 4 2 6 7.6
No response 3 3 6 7.6
Total 45 34 79 100.0
Years Number of farms %
<1 4 5
1-5 20 26
6-10 15 19
11-15 11 14
16-20 10 13
21-25 4 5
>25 12 15
no response 2 3
Total 78 100
22
2009 AISA Aquaculture Benchmarking Survey
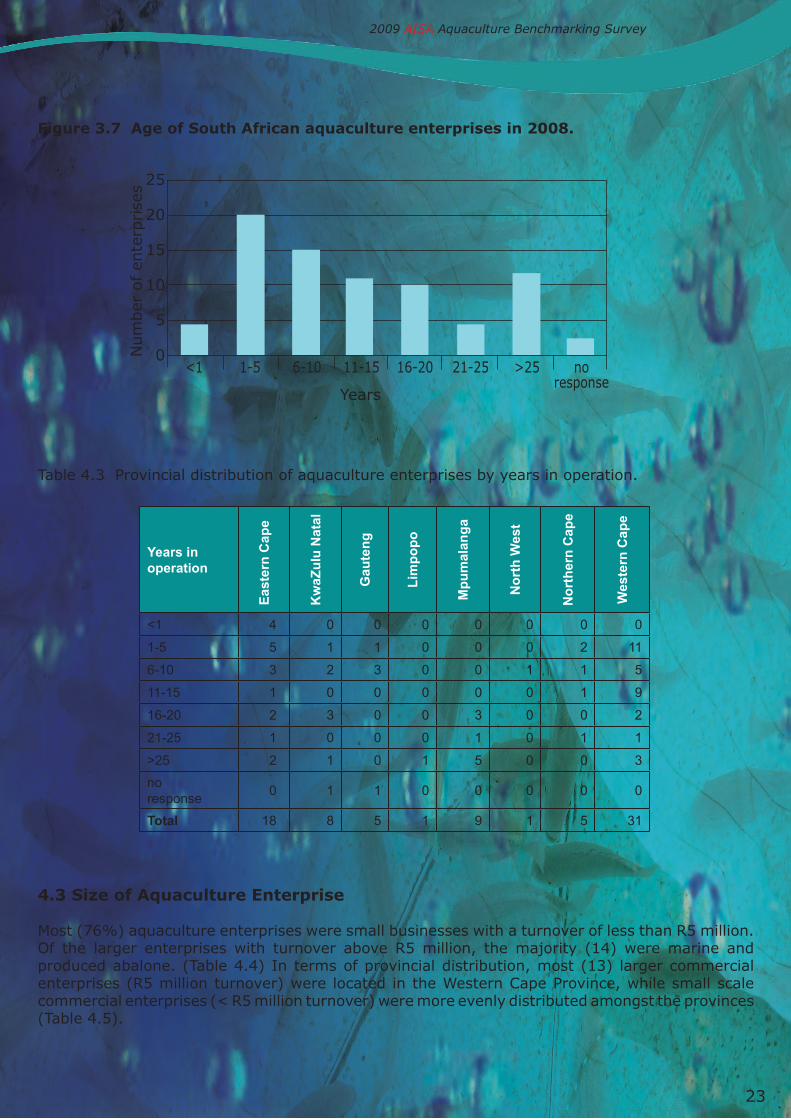
figure 3.7 Age of south African aquaculture enterprises in 2008.
Table 4.3 Provincial distribution of aquaculture enterprises by years in operation.
4.3 size of Aquaculture enterprise
Most (76%) aquaculture enterprises were small businesses with a turnover of less than R5 million. Of the larger enterprises with turnover above R5 million, the majority (14) were marine and produced abalone. (Table 4.4) In terms of provincial distribution, most (13) larger commercial enterprises (R5 million turnover) were located in the Western Cape Province, while small scale commercial enterprises (< R5 million turnover) were more evenly distributed amongst the provinces (Table 4.5).
Years in operation
Eas
tern
Cap
e
Kw
aZu
lu N
atal
Gau
ten
g
Lim
po
po
Mp
um
alan
ga
No
rth
Wes
t
No
rth
ern
Cap
e
Wes
tern
Cap
e<1 4 0 0 0 0 0 0 0
1-5 5 1 1 0 0 0 2 11
6-10 3 2 3 0 0 1 1 5
11-15 1 0 0 0 0 0 1 9
16-20 2 3 0 0 3 0 0 2
21-25 1 0 0 0 1 0 1 1
>25 2 1 0 1 5 0 0 3
no response
0 1 1 0 0 0 0 0
Total 18 8 5 1 9 1 5 31
23
2009 AISA Aquaculture Benchmarking Survey
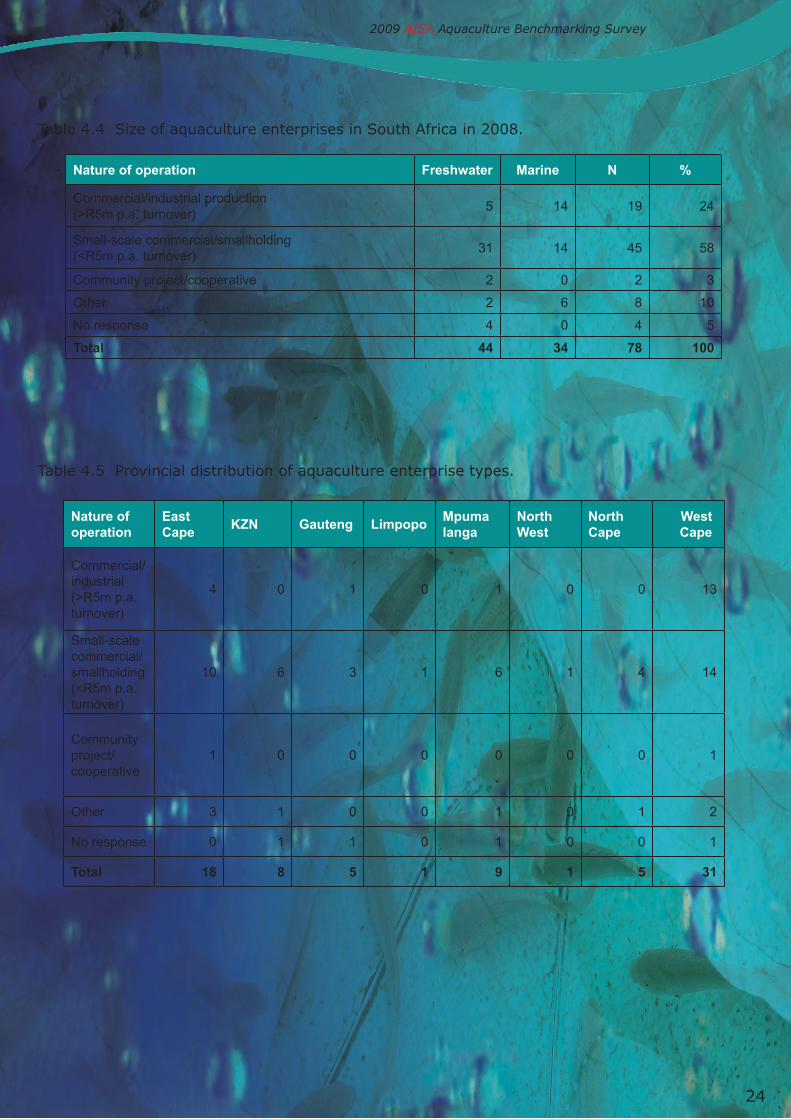
Table 4.4 Size of aquaculture enterprises in South Africa in 2008.
Table 4.5 Provincial distribution of aquaculture enterprise types.
Nature of operation Freshwater Marine N %
Commercial/industrial production (>R5m p.a. turnover)
5 14 19 24
Small-scale commercial/smallholding (<R5m p.a. turnover)
31 14 45 58
Community project/cooperative 2 0 2 3
Other 2 6 8 10
No response 4 0 4 5
Total 44 34 78 100
Nature of operation
East Cape
KZN Gauteng LimpopoMpumalanga
North West
North Cape
WestCape
Commercial/industrial (>R5m p.a. turnover)
4 0 1 0 1 0 0 13
Small-scale commercial/smallholding (<R5m p.a. turnover)
10 6 3 1 6 1 4 14
Community project/cooperative
1 0 0 0 0 0 0 1
Other 3 1 0 0 1 0 1 2
No response 0 1 1 0 1 0 0 1
Total 18 8 5 1 9 1 5 31
24
2009 AISA Aquaculture Benchmarking Survey
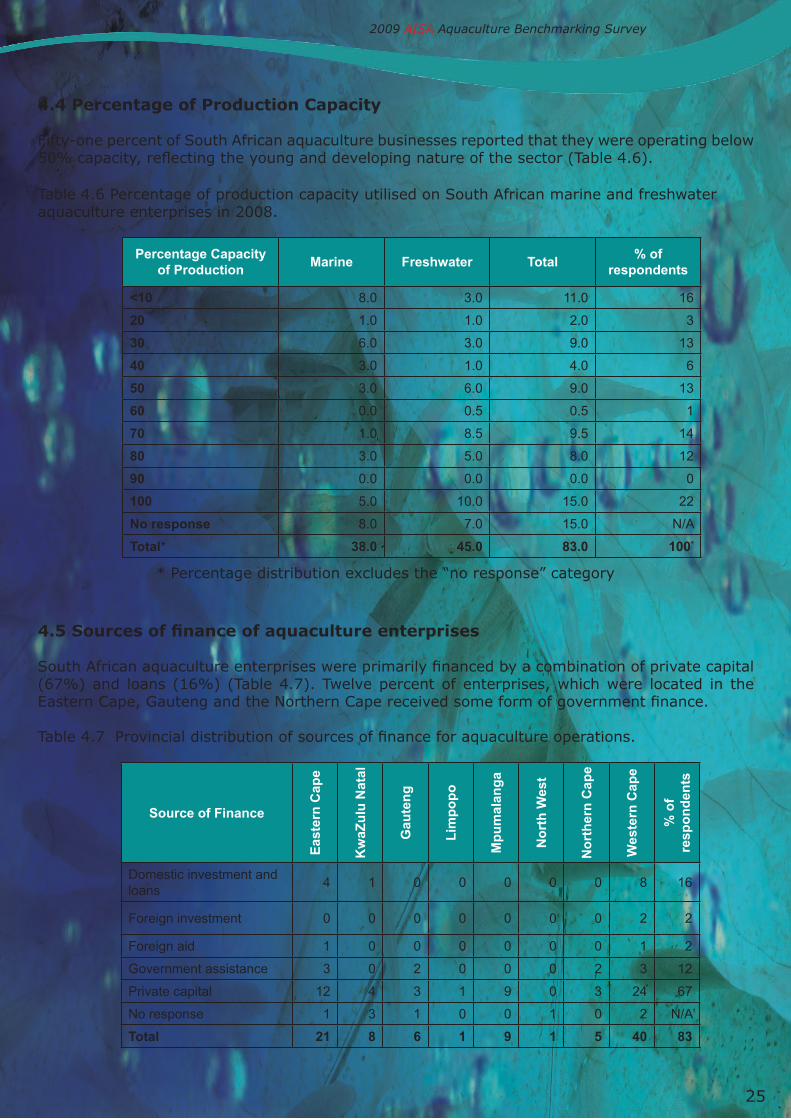
4.4 Percentage of Production Capacity
Fifty-one percent of South African aquaculture businesses reported that they were operating below 50% capacity, reflecting the young and developing nature of the sector (Table 4.6).
Table 4.6 Percentage of production capacity utilised on South African marine and freshwater aquaculture enterprises in 2008.
* Percentage distribution excludes the “no response” category
4.5 Sources of finance of aquaculture enterprises
South African aquaculture enterprises were primarily financed by a combination of private capital (67%) and loans (16%) (Table 4.7). Twelve percent of enterprises, which were located in the Eastern Cape, Gauteng and the Northern Cape received some form of government finance.
Table 4.7 Provincial distribution of sources of finance for aquaculture operations.
Percentage Capacity of Production
Marine Freshwater Total% of
respondents
<10 8.0 3.0 11.0 16
20 1.0 1.0 2.0 3
30 6.0 3.0 9.0 13
40 3.0 1.0 4.0 6
50 3.0 6.0 9.0 13
60 0.0 0.5 0.5 1
70 1.0 8.5 9.5 14
80 3.0 5.0 8.0 12
90 0.0 0.0 0.0 0
100 5.0 10.0 15.0 22
No response 8.0 7.0 15.0 N/A
Total* 38.0 45.0 83.0 100*
Source of Finance
Eas
tern
Cap
e
Kw
aZu
lu N
atal
Gau
ten
g
Lim
po
po
Mp
um
alan
ga
No
rth
Wes
t
No
rth
ern
Cap
e
Wes
tern
Cap
e
% o
f re
spo
nd
ents
Domestic investment and loans
4 1 0 0 0 0 0 8 16
Foreign investment 0 0 0 0 0 0 0 2 2
Foreign aid 1 0 0 0 0 0 0 1 2
Government assistance 3 0 2 0 0 0 2 3 12
Private capital 12 4 3 1 9 0 3 24 67
No response 1 3 1 0 0 1 0 2 N/A
Total 21 8 6 1 9 1 5 40 83
25
2009 AISA Aquaculture Benchmarking Survey

4.6 value Chain Participation
All aquaculture enterprises were involved in some form of primary production and grow-out. A high degree of vertical integration was evident in primary production, with 69% of producers operating hatcheries, and 75% raising fry or early juveniles (Tables 4.8 and 4.9). Producers tended to be vertically integrated into secondary production activities as well, with almost half involved in packing and distribution, and 31% in processing. The trends were similar in the freshwater and marine sub-sectors, as well as by province.
Table 4.8 Participation of marine and freshwater aquaculture enterprises in value chain activities.
Table 4.9 Number of aquaculture enterprise respondents in the value chain activities by province.
Business process Freshwater Marine n = 78% of
respondents
Spawning 29 18 47 69.12
Fry-rearing/weaning 32 19 51 75.00
Grading 19 21 40 58.82
grow out 40 29 69 100.00
Processing 11 10 21 30.88
Packing 20 18 38 55.88
Distribution 21 12 33 48.53
Other 4 5 9 13.24
No response 2 0 2 N/A
Business process
Eas
tern
Cap
e
Kw
aZu
lu N
atal
Gau
ten
g
Lim
po
po
Mp
um
alan
ga
No
rth
Wes
t
No
rth
ern
Cap
e
Wes
tern
Cap
e
Tota
l
% o
f re
spo
nd
ents
Spawning 12 7 3 1 5 1 2 16 47 69
Fry-rearing/weaning
12 6 3 1 6 1 3 19 51 75
Grading 12 3 2 0 3 1 0 19 40 59
grow out 18 6 5 1 8 1 2 28 69 100
Processing 6 2 1 0 3 1 0 8 21 31
Packing 11 4 3 0 3 1 0 16 38 56
Distribution 12 3 4 1 3 1 0 9 33 49
Other 4 2 0 0 0 0 1 2 9 13
No response 0 1 0 0 1 0 0 0 2 N/A
26
2009 AISA Aquaculture Benchmarking Survey

4.7 Constraints to Aquaculture enterprise development
The response rate to producers rating a series of “constraints” to enterprise development differed markedly between freshwater and marine farmers, with an average of 58% freshwater producers offering “no response” for each issue, compared to only 23% of marine producers (Tables 4.10 and 4.11).
A majority of freshwater respondents ranked site selection, environmental regulatory requirements, permitting, access to finance, access to skilled labour and access to research and development as “very important” or of “some importance”. A third of freshwater producers, comprising importers of salmonid products and ornamental fish, rated import tariffs as a “very important” constraint, while 50% rated it as not important for their businesses. A majority of marine aquaculture respondents ranked environment regulatory requirements, site selection, processing, permitting, access to finance, and access to research and development as “very important” or of “some importance”. Tariffs for imports were rated as “not important” by most respondents. Access to skilled labour was rated as being of “some importance” by a majority of respondents.
Table 4.10 Rating of constraints to enterprise development by freshwater aquaculture producers. The highest response rate is highlighted in bold. (imp. = importance)
Constraints Not imp.Little imp.
NeutralSome imp.
Very imp.No
responseTotal
response
Environmental regulatory requirements
5 3 6 6 11 13 31
Site selection 5 3 4 4 13 15 29
Processing 12 3 4 2 3 15 24
Tariffs for imports 12 3 2 1 9 17 27
Permitting 5 1 3 8 11 16 28
Extension services
7 1 6 5 6 19 25
Access to finance 7 3 4 5 9 16 28
Access to skilled labour
3 2 6 9 7 17 27
Access to Research and Development
3 1 9 9 8 14 30
27
2009 AISA Aquaculture Benchmarking Survey

Table 4.11 Rating of constraints to enterprise development by marine aquaculture producers. The highest response rate is highlighted in bold. (imp. = importance)
4.8 interventions needed to Promote enterprise development
The highest number of marine aquaculture producers rated the following issues as “very important” interventions to promote the aquaculture sector (Table 4.12):
• Research, technology development and transfer
• Capacity to monitor and guarantee the safety of the aquaculture products
• Facilitation of access to finance
• Monitoring of water quality to ensure export of aquaculture product
• Promotion of aquaculture education, training and skills development
Constraints Not imp.Little imp.
NeutralSome imp.
Very imp.No
responseTotal
response
Environmental regulatory requirements
1 0 7 8 11 6 27
Site selection 5 1 2 8 12 6 28
Processing 6 2 6 6 11 8 31
Tariffs for imports 15 4 3 3 3 6 28
Permitting 5 1 7 3 12 6 28
Extension services
6 4 10 3 5 6 28
Access to finance 1 4 6 5 11 7 27
Access to skilled labour
4 1 7 10 6 6 28
Access to Research and Development
3 1 8 4 12 6 28
28
2009 AISA Aquaculture Benchmarking Survey

Table 4.12 Marine aquaculture producers ranking of the importance of interventions to promote aquaculture enterprise development. (imp. = importance). This highest number of respondents for category is in bold.
Government support Not imp.Little imp.
NeutralSome imp.
Very impNo
responseTotal
response
Research, technology development and transfer
6 1 2 4 15 6 28
Facilitate access to finance and investment
4 2 6 4 12 6 28
National policy, strategic plan and implementation plan for the sector
2 8 6 4 8 6 28
Extension services 6 5 8 5 4 6 28
Infrastructure development
9 2 5 4 8 6 28
Promote South Africa aquaculture
4 6 6 4 8 6 28
Enhance industry-led development initiatives
2 1 10 6 9 6 28
Promote best practice management guidelines
4 3 11 3 7 6 28
Identify and zone areas for aquaculture development
3 1 8 7 9 6 28
Promote trade in aquaculture products
3 4 8 6 7 6 28
Capacity to monitor and guarantee the safety of the aquaculture products
2 5 6 2 13 6 28
Monitoring of water quality to ensure export of aquaculture product
4 4 5 5 10 6 28
Promote aquaculture education, training and skills development
3 2 3 7 13 6 28
Employees family support programme, for issues affecting work performance
5 2 10 5 6 6 28
29
2009 AISA Aquaculture Benchmarking Survey

Opinions of marine aquaculture producers surveyed were mixed on the importance of (Table 4.12):
• National policy, strategic plan and implementation plan for the sector• Extension services• Infrastructure development• Promote South Africa aquaculture• Enhance industry-led development initiatives• Promotion of trade in aquaculture products• Employees family support programme, for issues affecting work performance
A much higher proportion of freshwater producers (53%) did not respond to the ranking of government interventions to promote the aquaculture sector. The highest number of freshwater aquaculture producers rated the following issues as “very important” government interventions to promote the aquaculture sector (Table 4.13):
• Research, technology development and transfer • Facilitation of access to finance• National policy, strategic plan and implementation plan for the sector• Promotion of South African aquaculture• Identify and zone areas for aquaculture development• Promotion of best practice management• Promotion of trade in aquaculture products• Capacity to monitor and guarantee the safety of the aquaculture products• Promotion of aquaculture education, training and skills development
Opinions of freshwater aquaculture producers surveyed were mixed on the importance of (Table 4.13):
• Extension services• Infrastructure development• Enhance industry-led development initiatives• Promote best practice management• Monitoring of water quality to ensure export of aquaculture product• Employees family support programme, for issues affecting work performance
30
2009 AISA Aquaculture Benchmarking Survey

Table 4.13 Freshwater aquaculture producers ranking of the importance of government interventions to promote aquaculture enterprise development. (imp. = importance). This highest number of respondents for category is in bold.
Government support
Not imp.Little imp.
NeutralSome imp
Very imp.No
responseTotal
response
Research, technology development and transfer
8 2 4 6 11 13 31
Facilitate access to finance and investment
12 0 2 5 11 14 30
National policy, strategic plan and implementation plan for the sector
4 1 3 6 16 14 30
Extension services 9 0 5 6 7 17 27
Infrastructure development
6 1 4 11 6 16 28
Promote South Africa aquaculture
3 2 4 10 10 15 29
Enhance industry-led development initiatives
8 1 5 8 7 15 29
Promote best practice management guidelines
4 1 10 7 6 16 28
Identify and zone areas for aquaculture development
3 4 5 6 11 15 29
Promote trade in aquaculture products
4 2 2 10 11 15 29
Capacity to monitor and guarantee the safety of the aquaculture products
3 2 7 7 9 16 28
Monitoring of water quality to ensure export of aquaculture product
5 5 7 5 6 16 28
Promote aquaculture education, training and skills development
3 0 4 11 12 14 30
Employees family support programme, for issues affecting work performance
7 4 9 1 7 16 28
31
2009 AISA Aquaculture Benchmarking Survey

4.9 bee score Awareness
In terms of the Black Economic Empowerment (BEE) Act, a scoring system for calculating the BEE status of an enterprise has been introduced. The survey determined the extent of awareness of the BEE scorecard amongst aquaculture enterprises.
In terms of government regulations under the BEE Act:
1. If you are a new company or have a turn-over of less than R5m p.a, you do not need to obtain a BEE Rating/Verification Certificate. You only require a Statement qualifying that you are Exempted from BEE Verification. 2. If your company has a turn-over of between R5m and R35m, you are defined as a Qualifying Small Enterprise (QSE). The QSE BEE Scorecard has 7 Elements: i.e. ownership, management control, employment equity, skills development, preferential procurement, enterprise development and socio-economic development. QSE’s only need to comply with 4 of these elements. 3. Companies with a turn-over of in excess of R35m p.a. must comply with all the elements of the Generic Score Card.
Seventy-eight percent of enterprises surveyed responded to the question on whether they were aware of the BEE scorecard system (Table 4.1.4). Of those who responded, the majority respondents (70%) were aware of the BEE scorecard system.
Table 4.14 Awareness of the BEE scorecard system by province. Respondents were asked whether they were aware of the BEE scorecard requirements (yes or no).
In response to whether they had calculated a BEE score, or whether they were required to calculate one, the benchmarking survey revealed that most aquaculture businesses are classified as small enterprises (turnover <R5 million), and hence do not have to calculate a BEE score to comply with the BEE Act (Table 4.15). Six qualifying small enterprises indicated that they had calculated a BEE scorecard, and nine indicated that they had not.
AWARENESS OF BEE SCORECARD SYSTEM
Number of farmsProvince Yes No No response
Eastern Cape 8 5 5
Free State 0 0 0
Gauteng 2 1 2
KwaZulu Natal 2 4 2
Limpopo Province 0 0 1
Mpumalanga 6 2 1
Northern Cape 4 1 0
North West 0 0 1
Western Cape 21 5 5
Total 43 18 17
32
2009 AISA Aquaculture Benchmarking Survey

Table 4.15 Awareness of BEE scorecard in the aquaculture industry.
5. employment
5.1 employment by species group
The survey revealed that the South African aquaculture industry employed 1837 full-time, and 355 part-time/ temporary workers, in 2008 (Tables 5.1 and 5.2). This figure excludes the aquaculture secondary services and is only reflective of the primary producers. The abalone sub-sector was the largest employer with just over 1000 full time employees, and 141 part-time. Second was trout production with 346 full time and 163 part-time. The higher proportion of part time employees can be ascribed to the seasonal nature of trout hatchery operations, and in some instances grow-out. The ornamental fish and oyster production industries were relatively labour intensive for their size, with 199 and 100 full time employees respectively. Although marine fish farming is still in a pilot commercial phase, the sub-sector already employed 68 people in 2008, indicating the substantial investment into its development.
Employment in the aquaculture sector grew by approximately 80% between 2005 and 2008, and was highest in the abalone sector where the number of people employed rose by 234% (Tables 5.1 and 5.2). Employment in the marine fish sector more than trebled, although it was coming off a low base on the newly established pilot production units. Modest growth in employment was evident in the trout, ornamental, and oyster sub-sectors.
NUMBER OF FARMS THAT HAVE CALCULATED A BEE SCORE
Number of farms
Province Yes NoDon’t need one-less than R5 million turnover
No response
Eastern Cape 0 4 11 3
Free State 0 0 0 0
Gauteng 0 0 2 3
KwaZulu Natal 0 1 6 1
Limpopo Province 0 0 0 1
Mpumalanga 1 0 7 1
Northern Cape 0 0 5 0
North West 0 0 0 1
Western Cape 5 4 15 7
Total 6 9 46 17
33
2009 AISA Aquaculture Benchmarking Survey

Table 5.1 Full time employment in the South African aquaculture industry by species group for the period 2005-2008.
Table 5.2 Part-time employment in the South African aquaculture industry by species group for the period 2005-2008.
5.2 employment by Province
On a regional basis, the Western Cape Province was the largest employer with 1022 permanent and 286 part-time employees in 2008 (Table 5.3 and 5.4). Second was the Eastern Cape (384 full time; 12 part-time) and third Gauteng (185 full-time; 8 part-time). The balance was made up by the other provinces with substantially lower numbers. The growth in employment in the aquaculture sector was highest in the Western and Eastern Cape Provinces, with strong growth also evident in Gauteng Province (Tables 5.3 and 5.4). Modest growth was evident in KwaZulu-Natal, Northern Cape, and Mpumalanga.
TOTAL FULL-TIME EMPLOYMENT PER SPECIES
Total Employment
Species 2005 2006 2007 2008
Trout 283.5 309.5 327.0 346.0
Abalone 440.0 836.0 973.0 1,040
Ornamentals 137.0 162.0 182.0 199.0
Koi carp 42.0 42.0 41.0 44.0
Mussels 26.0 26.0 26.0 26.0
Oysters 69.0 79.0 91.0 100.0
Marine fish 19.0 31.0 34.0 68.0
Catfish 6.0 6.0 6.0 8.0
Tilapia 2.0 2.0 2.0 2.0
Marron 5.0 5.0 4.0 4.0
Total 1,029.5 1,498.5 1,686.0 1,837.0
TOTAL PART-TIME EMPLOYMENT PER SPECIES
Total Employment
Species 2005 2006 2007 2008
Trout 147 151 156 163
Abalone 56 67 86 141
Ornamentals 5 5 5 5
Koi carp 13 13 13 15
Mussels 0 0 0 0
Oysters 6 6 11 11
Dusky kob 0 6 6 17
Catfish 8 3 3 3
Tilapia 0 0 0 0
Marron 0 0 0 0
Total 235 251 280 355
34
2009 AISA Aquaculture Benchmarking Survey
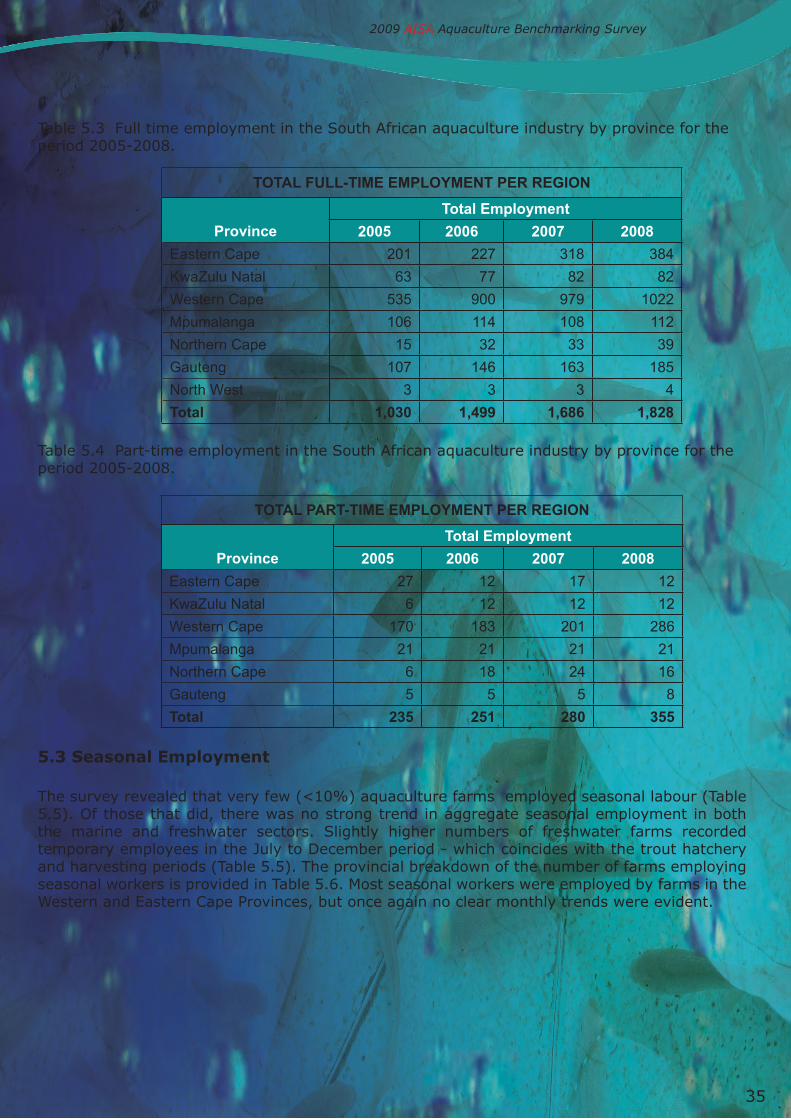
Table 5.3 Full time employment in the South African aquaculture industry by province for the period 2005-2008.
Table 5.4 Part-time employment in the South African aquaculture industry by province for the period 2005-2008.
5.3 seasonal employment
The survey revealed that very few (<10%) aquaculture farms employed seasonal labour (Table 5.5). Of those that did, there was no strong trend in aggregate seasonal employment in both the marine and freshwater sectors. Slightly higher numbers of freshwater farms recorded temporary employees in the July to December period - which coincides with the trout hatchery and harvesting periods (Table 5.5). The provincial breakdown of the number of farms employing seasonal workers is provided in Table 5.6. Most seasonal workers were employed by farms in the Western and Eastern Cape Provinces, but once again no clear monthly trends were evident.
TOTAL FULL-TIME EMPLOYMENT PER REGION
Total Employment
Province 2005 2006 2007 2008
Eastern Cape 201 227 318 384
KwaZulu Natal 63 77 82 82
Western Cape 535 900 979 1022
Mpumalanga 106 114 108 112
Northern Cape 15 32 33 39
Gauteng 107 146 163 185
North West 3 3 3 4
Total 1,030 1,499 1,686 1,828
TOTAL PART-TIME EMPLOYMENT PER REGION
Total Employment
Province 2005 2006 2007 2008
Eastern Cape 27 12 17 12
KwaZulu Natal 6 12 12 12
Western Cape 170 183 201 286
Mpumalanga 21 21 21 21
Northern Cape 6 18 24 16
Gauteng 5 5 5 8
Total 235 251 280 355
35
2009 AISA Aquaculture Benchmarking Survey
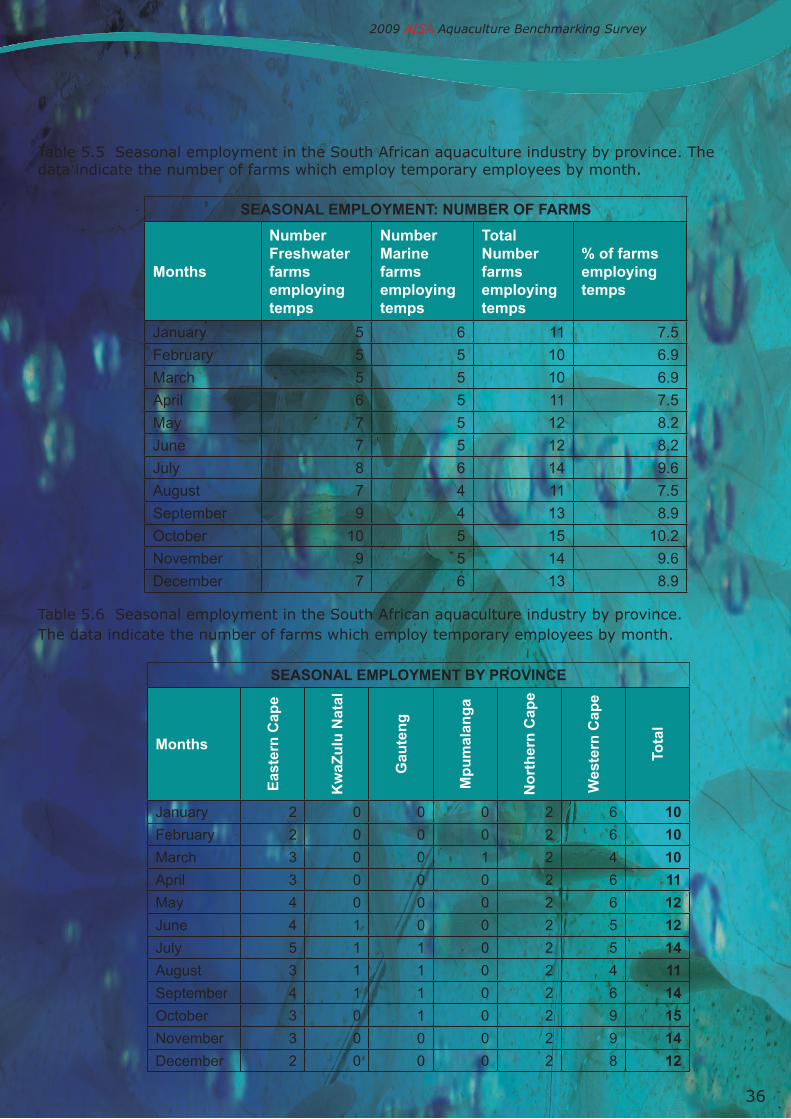
Table 5.5 Seasonal employment in the South African aquaculture industry by province. The data indicate the number of farms which employ temporary employees by month.
Table 5.6 Seasonal employment in the South African aquaculture industry by province. The data indicate the number of farms which employ temporary employees by month.
SEASONAL EMPLOYMENT: NUMBER OF FARMS
Months
Number Freshwater farms employing temps
Number Marine farms employing temps
Total Number farms employing temps
% of farms employing temps
January 5 6 11 7.5
February 5 5 10 6.9
March 5 5 10 6.9
April 6 5 11 7.5
May 7 5 12 8.2
June 7 5 12 8.2
July 8 6 14 9.6
August 7 4 11 7.5
September 9 4 13 8.9
October 10 5 15 10.2
November 9 5 14 9.6
December 7 6 13 8.9
SEASONAL EMPLOYMENT BY PROVINCE
Months
Eas
tern
Cap
e
Kw
aZu
lu N
atal
Gau
ten
g
Mp
um
alan
ga
No
rth
ern
Cap
e
Wes
tern
Cap
e
Tota
l
January 2 0 0 0 2 6 10
February 2 0 0 0 2 6 10
March 3 0 0 1 2 4 10
April 3 0 0 0 2 6 11
May 4 0 0 0 2 6 12
June 4 1 0 0 2 5 12
July 5 1 1 0 2 5 14
August 3 1 1 0 2 4 11
September 4 1 1 0 2 6 14
October 3 0 1 0 2 9 15
November 3 0 0 0 2 9 14
December 2 0 0 0 2 8 12
36
2009 AISA Aquaculture Benchmarking Survey
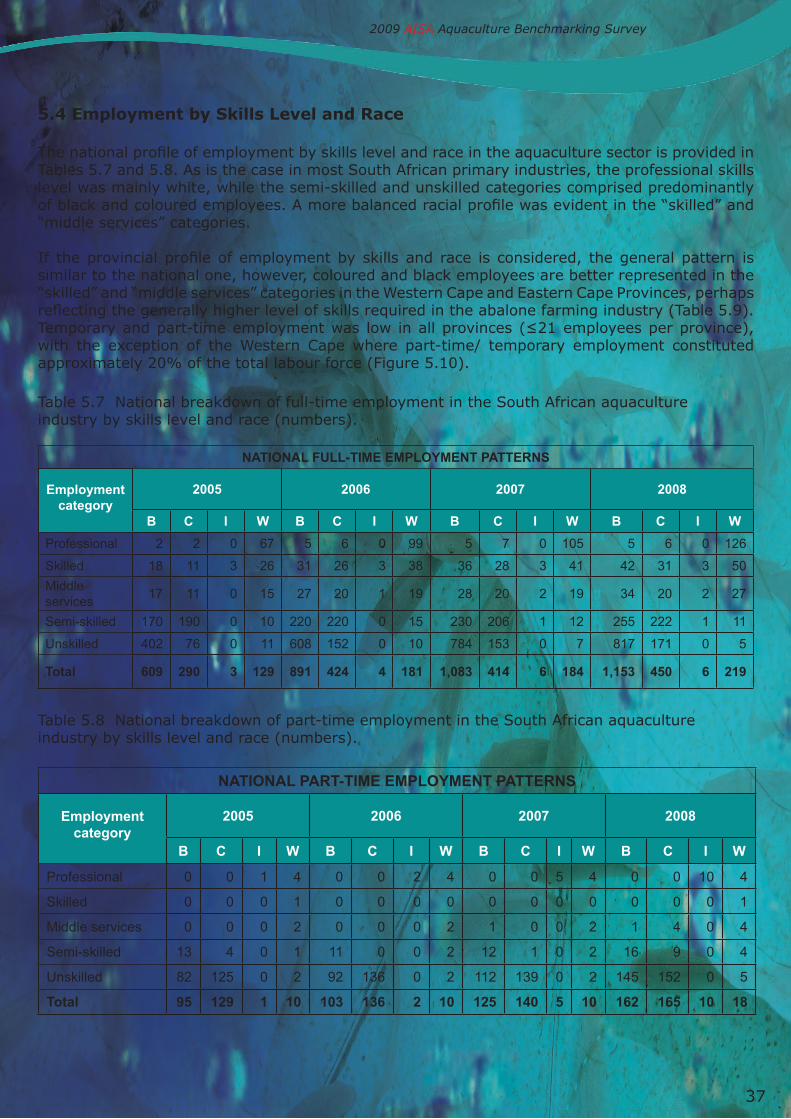
5.4 employment by skills level and race
The national profile of employment by skills level and race in the aquaculture sector is provided in Tables 5.7 and 5.8. As is the case in most South African primary industries, the professional skills level was mainly white, while the semi-skilled and unskilled categories comprised predominantly of black and coloured employees. A more balanced racial profile was evident in the “skilled” and “middle services” categories.
If the provincial profile of employment by skills and race is considered, the general pattern is similar to the national one, however, coloured and black employees are better represented in the “skilled” and “middle services” categories in the Western Cape and Eastern Cape Provinces, perhaps reflecting the generally higher level of skills required in the abalone farming industry (Table 5.9). Temporary and part-time employment was low in all provinces (≤21 employees per province), with the exception of the Western Cape where part-time/ temporary employment constituted approximately 20% of the total labour force (Figure 5.10). Table 5.7 National breakdown of full-time employment in the South African aquaculture industry by skills level and race (numbers).
Table 5.8 National breakdown of part-time employment in the South African aquaculture industry by skills level and race (numbers).
NATIONAL FULL-TIME EMPLOYMENT PATTERNS
Employment category
2005 2006 2007 2008
B C I W B C I W B C I W B C I W
Professional 2 2 0 67 5 6 0 99 5 7 0 105 5 6 0 126
Skilled 18 11 3 26 31 26 3 38 36 28 3 41 42 31 3 50
Middle services
17 11 0 15 27 20 1 19 28 20 2 19 34 20 2 27
Semi-skilled 170 190 0 10 220 220 0 15 230 206 1 12 255 222 1 11
Unskilled 402 76 0 11 608 152 0 10 784 153 0 7 817 171 0 5
Total 609 290 3 129 891 424 4 181 1,083 414 6 184 1,153 450 6 219
NATIONAL PART-TIME EMPLOYMENT PATTERNS
Employment category
2005 2006 2007 2008
B C I W B C I W B C I W B C I W
Professional 0 0 1 4 0 0 2 4 0 0 5 4 0 0 10 4
Skilled 0 0 0 1 0 0 0 0 0 0 0 0 0 0 0 1
Middle services 0 0 0 2 0 0 0 2 1 0 0 2 1 4 0 4
Semi-skilled 13 4 0 1 11 0 0 2 12 1 0 2 16 9 0 4
Unskilled 82 125 0 2 92 136 0 2 112 139 0 2 145 152 0 5
Total 95 129 1 10 103 136 2 10 125 140 5 10 162 165 10 18
37
2009 AISA Aquaculture Benchmarking Survey

Table 5.9 Full time employment in the aquaculture primary production sub-sector by province, skills level, and race for the period 2005-2008.
full-Time emPloymenT: eAsTern CAPe
employment category
2005 2006 2007 2008
B C I W B C I W B C I W B C I W
Professional 0 0 0 16 1 0 0 18 1 0 0 19 1 0 0 32
Skilled 5 2 1 6 6 2 1 6 8 2 1 7 11 3 1 10
Middle services
5 2 0 4 5 2 0 4 7 2 0 4 7 2 0 4
Semi-skilled 43 9 0 0 47 6 0 0 51 0 0 1 62 1 0 1
Unskilled 108 2 0 0 129 2 0 0 213 2 0 0 243 6 0 0
Total per group
161 15 1 26 188 12 1 28 280 6 1 31 324 12 1 47
Total 203 229 318 384
full-Time emPloymenT: kwAZulu nATAl
employment category
2005 2006 2007 2008
b C i w b C i w b C i w b C i w
Professional 0 0 0 6 0 0 0 7 0 0 0 7 0 0 0 7
Skilled 0 0 0 0 2 0 0 0 2 0 0 1 2 0 0 1
Middle services
0 0 0 1 0 0 1 1 0 0 2 0 0 0 2 0
Semi-skilled 13 0 0 0 20 0 0 0 24 0 0 0 25 0 0 0
Unskilled 43 0 0 0 46 0 0 0 46 0 0 0 45 0 0 0
Total per group
56 0 0 7 68 0 1 8 72 0 2 8 72 0 2 8
Total 63 77 82 82
full-Time emPloymenT: wesTern CAPe
employment category
2005 2006 2007 2008
B C I W B C I W B C I W B C I W
Professional 1 2 0 27 1 6 0 52 1 7 0 56 1 6 0 64
Skilled 4 9 1 16 12 22 1 27 13 23 1 27 14 24 1 30
Middle services
6 9 0 6 14 18 0 9 12 18 0 11 15 18 0 17
Semi-skilled 77 175 0 9 98 204 0 14 100 201 1 10 106 213 1 10
Unskilled 112 66 0 10 269 137 0 7 363 139 0 5 361 143 0 3
Total per group
200 261 1 68 394 387 1 109 489 388 2 109 497 404 2 124
Total 530 891 988 1,027
38
2009 AISA Aquaculture Benchmarking Survey

39
Table 5.9 (cont.) Full time employment in the aquaculture primary production sub-sector by province, skills level, and race for the period 2005-2008
full-Time emPloymenT: mPumAlAngA
employment category
2005 2006 2007 2008
b C i w b C i w b C i w b C i w
Professional 1 0 0 8 1 0 0 9 1 0 0 9 1 0 0 10
Skilled 6 0 0 2 6 0 0 2 7 0 0 2 8 0 0 2
Middle services 6 0 0 1 7 0 0 1 7 0 0 1 8 0 0 2
Semi-skilled 29 0 0 0 33 0 0 0 32 0 0 0 35 0 0 0
Unskilled 53 0 0 0 55 0 0 0 49 0 0 0 46 0 0 0
Total per group 95 0 0 11 102 0 0 12 96 0 0 12 98 0 0 14
Total 106 114 108 112
full-Time emPloymenT: gAuTeng
employment category
2005 2006 2007 2008
b C i w b C i w b C i w b C i w
Professional 0 0 0 7 2 0 0 8 2 0 0 9 2 0 0 10
Skilled 3 1 2 5 0 1 3 6 1 1 4 7 2 1 7
Middle services 0 0 0 3 1 0 0 3 2 0 0 3 4 0 0 4
Semi-skilled 6 0 0 0 18 0 0 0 20 0 0 0 24 0 0 0
Unskilled 85 0 0 0 105 0 0 0 115 0 0 0 124 0 0 0
Total per group 94 0 1 12 131 0 1 14 145 1 1 16 161 2 1 21
Total 107 146 163 185
full-Time emPloymenT: norThern CAPe
employment category
2005 2006 2007 2008
b C i w b C i w b C i w b C i w
Professional 0 0 0 2 0 0 0 3 0 0 0 4 0 0 0 2
Skilled 0 0 0 0 0 1 0 0 0 2 0 0 0 2 0 0
Middle services 0 0 0 0 0 0 0 0 0 0 0 0 0 0 0 0
Semi-skilled 0 6 0 1 0 6 0 1 0 8 0 1 0 9 0 0
Unskilled 0 0 0 1 2 8 0 1 2 14 0 2 2 23 0 2
Total per group 0 6 0 4 2 15 0 5 2 24 0 7 2 34 0 4
Total 10 22 33 40
2009 AISA Aquaculture Benchmarking Survey
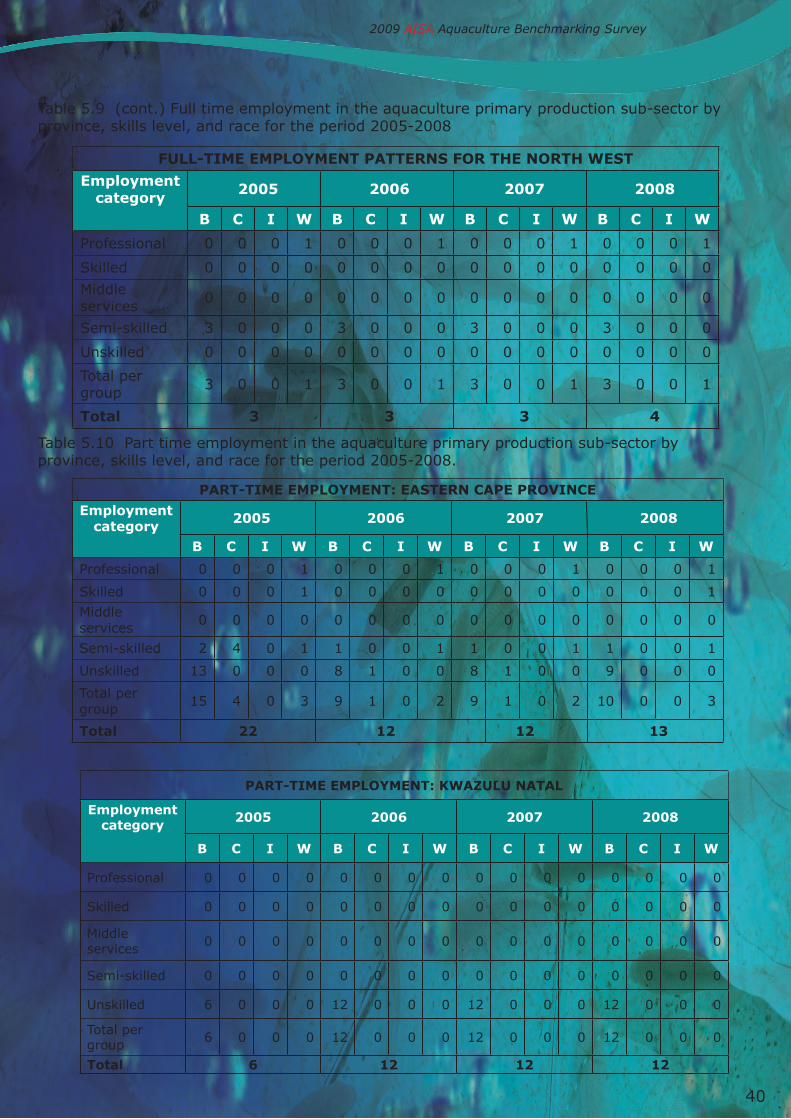
40
Table 5.9 (cont.) Full time employment in the aquaculture primary production sub-sector by province, skills level, and race for the period 2005-2008
Table 5.10 Part time employment in the aquaculture primary production sub-sector by province, skills level, and race for the period 2005-2008.
PArT-Time emPloymenT: eAsTern CAPe ProvinCe
employment category
2005 2006 2007 2008
b C i w b C i w b C i w b C i w
Professional 0 0 0 1 0 0 0 1 0 0 0 1 0 0 0 1
Skilled 0 0 0 1 0 0 0 0 0 0 0 0 0 0 0 1
Middle services 0 0 0 0 0 0 0 0 0 0 0 0 0 0 0 0
Semi-skilled 2 4 0 1 1 0 0 1 1 0 0 1 1 0 0 1
Unskilled 13 0 0 0 8 1 0 0 8 1 0 0 9 0 0 0
Total per group 15 4 0 3 9 1 0 2 9 1 0 2 10 0 0 3
Total 22 12 12 13
PArT-Time emPloymenT: kwAZulu nATAl
employment category
2005 2006 2007 2008
b C i w b C i w b C i w b C i w
Professional 0 0 0 0 0 0 0 0 0 0 0 0 0 0 0 0
Skilled 0 0 0 0 0 0 0 0 0 0 0 0 0 0 0 0
Middle services 0 0 0 0 0 0 0 0 0 0 0 0 0 0 0 0
Semi-skilled 0 0 0 0 0 0 0 0 0 0 0 0 0 0 0 0
Unskilled 6 0 0 0 12 0 0 0 12 0 0 0 12 0 0 0
Total per group 6 0 0 0 12 0 0 0 12 0 0 0 12 0 0 0
Total 6 12 12 12
2009 AISA Aquaculture Benchmarking Survey
full-Time emPloymenT PATTerns for The norTh wesT
employment category
2005 2006 2007 2008
b C i w b C i w b C i w b C i w
Professional 0 0 0 1 0 0 0 1 0 0 0 1 0 0 0 1
Skilled 0 0 0 0 0 0 0 0 0 0 0 0 0 0 0 0
Middle services 0 0 0 0 0 0 0 0 0 0 0 0 0 0 0 0
Semi-skilled 3 0 0 0 3 0 0 0 3 0 0 0 3 0 0 0
Unskilled 0 0 0 0 0 0 0 0 0 0 0 0 0 0 0 0
Total per group 3 0 0 1 3 0 0 1 3 0 0 1 3 0 0 1
Total 3 3 3 4

Table 5.10 (Cont.) Part time employment in the aquaculture primary production sub-sector by province, skills level, and race for the period 2005-2008.
41
PArT-Time emPloymenT: wesTern CAPe ProvinCe
employment category
2005 2006 2007 2008
b C i w b C i w b C i w b C i w
Professional 0 0 1 2 0 0 2 2 0 0 5 2 0 0 10 2
Skilled 0 0 0 0 0 0 0 0 0 0 0 0 0 0 0 0
Middle services 0 0 0 2 0 0 0 2 1 0 0 2 1 0 0 2
Semi-skilled 9 0 0 0 10 0 0 1 10 1 0 1 11 4 0 1
Unskilled 38 113 0 2 48 117 0 2 70 120 0 4 95 128 0 5
Total per group 47 113 1 6 58 117 2 7 81 121 5 9 107 132 10 10
Total 167 184 216 259
PArT-Time emPloymenT: mPumAlAngA
employment category
2005 2006 2007 2008
b C i w b C i w b C i w b C i w
Professional 0 0 0 1 0 0 0 1 0 0 0 1 0 0 0 1
Skilled 0 0 0 0 0 0 0 0 0 0 0 0 0 0 0 0
Middle services 0 0 0 0 0 0 0 0 0 0 0 0 0 0 0 0
Semi-skilled 0 0 0 0 0 0 0 0 0 0 0 0 0 0 0 0
Unskilled 17 3 0 0 21 3 0 0 17 3 0 0 17 3 0 0
Total per group 17 3 0 1 21 3 0 1 17 3 0 1 17 3 0 1
Total 21 25 21 21
PArT-Time emPloymenT: norThern CAPe ProvinCe
employment category 2005 2006 2007 2008
b C i w b C i w b C i w b C i w
Professional 0 0 0 0 0 0 0 0 0 0 0 0 0 0 0 0
Skilled 0 0 0 0 0 0 0 0 0 0 0 0 0 0 0 0
Middle services 0 0 0 0 0 0 0 0 0 0 0 0 0 0 0 0
Semi-skilled 0 0 0 0 0 0 0 0 0 0 0 0 0 0 0 0
Unskilled 0 6 0 0 0 16 0 0 0 16 0 0 0 16 0 0
Total per group 0 6 0 0 0 16 0 0 0 16 0 0 0 16 0 0
Total 6 16 16 16
2009 AISA Aquaculture Benchmarking Survey

42
PArT-Time emPloymenT: gAuTeng
employment category
2005 2006 2007 2008
b C i w b C i w b C i w b C i w
Professional 0 0 0 0 0 0 0 0 0 0 0 0 0 0 0 0
Skilled 0 0 0 0 0 0 0 0 0 0 0 0 0 0 0 0
Middle services 0 0 0 0 0 0 0 0 0 0 0 0 0 0 0 0
Semi-skilled 0 0 0 0 0 0 0 0 0 0 0 0 0 0 0 0
Unskilled 5 0 0 0 5 0 0 0 5 0 0 0 8 0 0 0
Total per group 5 0 0 0 5 0 0 0 5 0 0 0 8 0 0 0
Total 5 5 5 8
Table 5.10 (Cont.) Part time employment in the aquaculture primary production sub-sector by province, skills level, and race for the period 2005-2008.
mArkeT ChAnnels used Per seCTor
Channel used
Tro
ut
Ab
alo
ne
orn
am
en
tal
fish
ko
i ca
rp
mu
ssels
oyst
ers
du
sky k
ob
Catfi
sh
Tilap
ia
marr
on
To
tal
Direct to consumers 10 1 3 5 0 4 1 2 0 0 26
Wholesalers 7 9 5 5 1 4 2 1 0 1 35
Restaurants/hotels 7 2 0 0 0 4 2 0 0 0 15
Processors 14 4 0 0 1 2 2 0 0 0 23
Supermarkets 4 1 0 0 0 1 2 0 0 0 8
Exporters 1 2 0 1 0 0 0 0 0 0 4
Other 1 1 3 1 0 3 0 1 0 0 10
Not applicable 3 3 2 1 0 1 3 0 1 1 15
6. Products and markets
6.1 market Channels
The “small to medium size enterprise” characteristic of many aquaculture ventures was reflected in the market channels utilised (Table 6.1, Figure 6.1). The survey revealed that the most commonly used market channel was wholesalers, with 35 primary aquaculture enterprises utilising this option. However, a relatively high number of enterprises (26) sold directly to consumers, particularly trout and koi producers. A high proportion of trout and oyster producers sold their product to restaurants and hotels. For trout enterprises, the highest number (14) sold their product to processors, whereas in the abalone sector, only four sold to processors, with most (11) selling to wholesalers or exporters. Where abalone processing is required, the farmers usually pay a factory a fee to can their product under their own brand, and then market it themselves.
Table 6.1 Market channels used by enterprises in aquaculture sub-sectors.
2009 AISA Aquaculture Benchmarking Survey

43
6.2 form of Product
Two thirds of respondents sold their product as either live or freshly killed, whereas only one third employed some form of processing or value adding (Table 6.2). If the respective sub-sectors are considered, a similar split was evident for trout producers, however an approximately equal number of abalone producers sold live/freshly killed and processed products. All ornamental and koi producers sold their products alive. Two oyster producers employed some form of value adding.
Table 6.2 Form of product sold by producers in the respective aquaculture sub-sectors.
6.3 determination of Price
The majority of respondents (58%) negotiated the price of their product with the buyer, while 32% set their price themselves. No aquaculture products were auctioned.
Table 6.3 Determination of the price of products sold by primary aquaculture producers for the period 2005-2008.
6.4 domestic market for Aquaculture Products
The largest volume of trout (45%), mussels (55%) and oysters (61%) was sold in the Western Cape Province, while Gauteng provided the biggest market for ornamentals (28%), koi carp (53%), catfish (99%) and dusky kob (100%) (Table 6.4). The second biggest market for trout was KZN (19.5%), with Gauteng third (11.6%).
form of ProduCT Per seCTor
form of product T
rou
t
Ab
alo
ne
orn
am
en
tal
fish
ko
i ca
rp
mu
ssels
oyst
ers
du
sky k
ob
Catfi
sh
Til
ap
ia
marr
on
tota
l
Live/whole freshly killed 20 12 8 7 1 8 4 1 0 1 62
Some form of processing and value adding
11 11 0 0 1 2 1 2 0 0 28
Not applicable 3 2 0 0 0 1 3 0 1 1 11
deTerminATion of PriCe
options number of farms
Producer sets price 24
Auction 0
Bargain and negotiate with buyer 43
Other 10
Not applicable 7
2009 AISA Aquaculture Benchmarking Survey
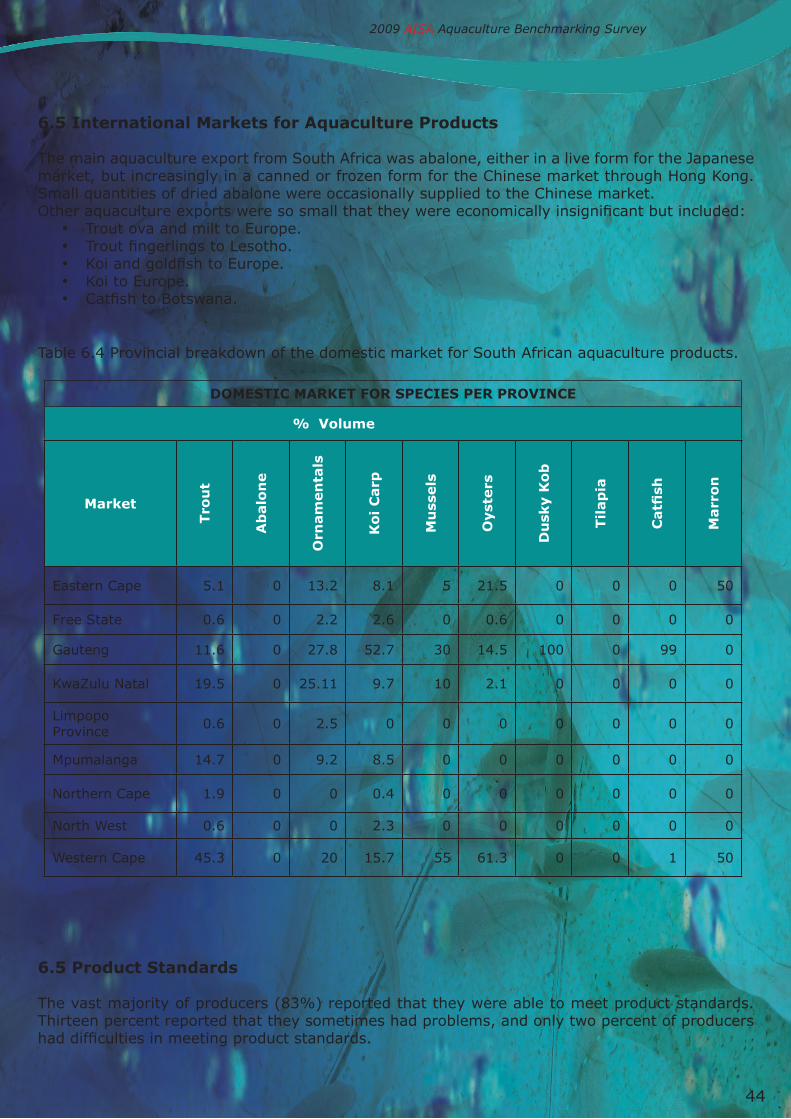
44
6.5 international markets for Aquaculture Products
The main aquaculture export from South Africa was abalone, either in a live form for the Japanese market, but increasingly in a canned or frozen form for the Chinese market through Hong Kong. Small quantities of dried abalone were occasionally supplied to the Chinese market.Other aquaculture exports were so small that they were economically insignificant but included:
• Trout ova and milt to Europe.• Trout fingerlings to Lesotho.• Koi and goldfish to Europe.• Koi to Europe.• Catfish to Botswana.
Table 6.4 Provincial breakdown of the domestic market for South African aquaculture products.
6.5 Product standards
The vast majority of producers (83%) reported that they were able to meet product standards. Thirteen percent reported that they sometimes had problems, and only two percent of producers had difficulties in meeting product standards.
domesTiC mArkeT for sPeCies Per ProvinCe
% volume
market
Tro
ut
Ab
alo
ne
orn
am
en
tals
ko
i C
arp
mu
ssels
oyst
ers
du
sky k
ob
Til
ap
ia
Catfi
sh
marr
on
Eastern Cape 5.1 0 13.2 8.1 5 21.5 0 0 0 50
Free State 0.6 0 2.2 2.6 0 0.6 0 0 0 0
Gauteng 11.6 0 27.8 52.7 30 14.5 100 0 99 0
KwaZulu Natal 19.5 0 25.11 9.7 10 2.1 0 0 0 0
Limpopo Province 0.6 0 2.5 0 0 0 0 0 0 0
Mpumalanga 14.7 0 9.2 8.5 0 0 0 0 0 0
Northern Cape 1.9 0 0 0.4 0 0 0 0 0 0
North West 0.6 0 0 2.3 0 0 0 0 0 0
Western Cape 45.3 0 20 15.7 55 61.3 0 0 1 50
2009 AISA Aquaculture Benchmarking Survey
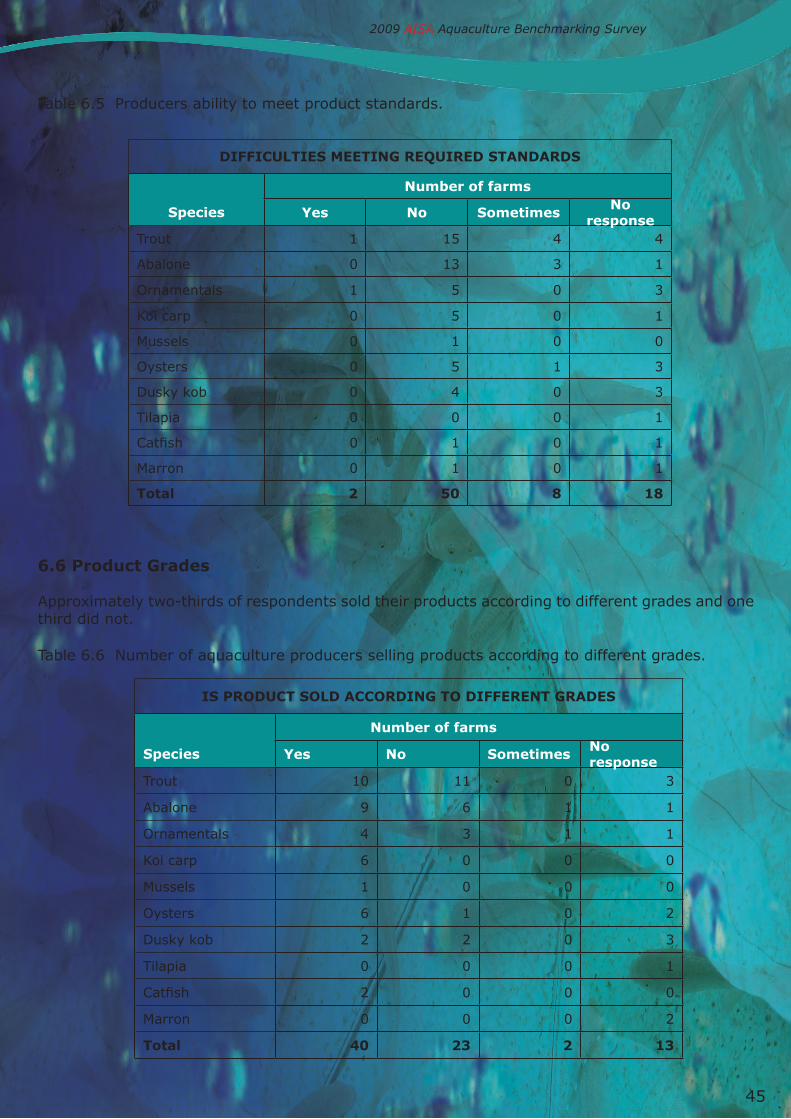
45
Table 6.5 Producers ability to meet product standards.
6.6 Product grades
Approximately two-thirds of respondents sold their products according to different grades and one third did not.
Table 6.6 Number of aquaculture producers selling products according to different grades.
diffiCulTies meeTing required sTAndArds
number of farms
species yes no sometimes no response
Trout 1 15 4 4
Abalone 0 13 3 1
Ornamentals 1 5 0 3
Koi carp 0 5 0 1
Mussels 0 1 0 0
Oysters 0 5 1 3
Dusky kob 0 4 0 3
Tilapia 0 0 0 1
Catfish 0 1 0 1
Marron 0 1 0 1
Total 2 50 8 18
is ProduCT sold ACCording To differenT grAdes
number of farms
species yes no sometimes no response
Trout 10 11 0 3
Abalone 9 6 1 1
Ornamentals 4 3 1 1
Koi carp 6 0 0 0
Mussels 1 0 0 0
Oysters 6 1 0 2
Dusky kob 2 2 0 3
Tilapia 0 0 0 1
Catfish 2 0 0 0
Marron 0 0 0 2
Total 40 23 2 13
2009 AISA Aquaculture Benchmarking Survey

46
6.7 marketing Activities
Thirty-three percent of respondents reported that they undertook marketing activities, with a further 25% stating that they did sometimes. Forty-three percent of respondents did not undertake any marketing activities. In the trout sector, a higher proportion of producers did not do marketing perhaps reflecting long established relationships with processors. A high proportion of abalone farmers undertook marketing activities, which are regarded by many as essential to selling product into overseas markets.
Table 6.7 Marketing activities undertaken by producers.
6.8 government Assistance in Accessing markets
The survey revealed that five abalone exporters had availed themselves of assistance offered by government in accessing markets.
Table 6.8 Producers assisted by government in accessing markets.
mArkeTing ACTiviTies underTAken
number of farms
species yes no sometimes no response
Trout 5 10 6 3
Abalone 9 4 3 1
Ornamentals 2 4 1 2
Koi carp 3 0 3 0
Mussels 1 0 0 0
Oysters 1 4 2 2
Dusky kob 0 4 0 3
Tilapia 0 1 0 0
Catfish 1 1 0 0
Marron 0 0 0 2
Total 22 28 15 13
2009 AISA Aquaculture Benchmarking Survey
governmenT/PubliC seCTor linkAge To mArkeT
number of farms
species yes no don’t knowno
responseTrout 0 20 0 4
Abalone 5 10 0 2
Ornamentals 0 7 0 2
Koi carp 0 5 1 0
Mussels 0 1 0 0
Oysters 0 7 0 2
Dusky kob 0 4 1 2
Tilapia 0 1 0 0
Catfish 0 2 0 0
Marron 0 0 0 2
Total 5 57 2 14

47
7. Producer views and interviews
The survey process provided the author of the report with an opportunity to talk to a broad range of producers in short period of time, which facilitated insights into issues and experiences within each sub-sector. The semi-structured interviews allowed the capture of individual views and anecdotes on the realities of running an aquaculture enterprise in South Africa. The perspective provided below is a personal one, based on the interviews and my experience in promoting aquaculture sector development
7.1 The business environment
The over-riding impression gained from interview after interview, was that the odds are stacked heavily against the entry of small businesses into aquaculture. This should be a serious cause for concern to policy makers who favour small business development, which is seen as the backbone of job creation and a prosperous society. Fourteen respondents indicated that they were no longer in production, and a further 14 were not producing any product at the time of the survey. There was a net exodus of small producers over the survey period, juxtaposed with a phase of consolidation and expansion of larger producers. Apart from government sponsored small scale farmers, there were few small scale entrants into the aquaculture industry. In verbal interviews, many small producers listed factors beyond their control, that threatened the viability of their enterprises. Most of the constraints related to the application of environmental legislation and permitting, and compliance with health and product quality standards. Perhaps the most telling comment by a dedicated small scale producer was that he felt very lonely and unsupported in his business. These are clearly issues within the ambit of government which can be addressed to create a more conducive environment for small business development in the aquaculture sector.. It needs to be recognised that the aquaculture industry is small and fragmented, in fact it is not yet an industry;- as it does not yet have the requisite services sector, and the cost of doing business is high. A set of industrial incentives and support measures will be required to kick start investment into the industry until it is competitive. To an extent this is being realised with schemes to link disadvantaged small scale farmers with established producers and markets. But much more comprehensive and sustained support from government will be required.
The back bone of the South African aquaculture industry is clearly the established medium size enterprises, which have achieved the critical mass to run vertically integrated operations. As such, they are resilient enough to be a market force, self sufficient in the provision of many elements of the value chain and services, and to comply with an increasing array of legislative and product quality requirements. Medium size producers interviewed were generally optimistic about market prospects for aquaculture products, but were acutely aware of the dynamic nature of markets which are increasingly affected by global forces. The medium size enterprises are the foundation from which satellite small producers, and a service sector can grow. The medium size aquaculture entrepreneurs are dynamic, innovative and have an appetite for risk. They are the pioneers of the South African aquaculture sector and need to be nurtured and encouraged as their success will breed further success.
7.2 Abalone
The biggest success story is the abalone industry which has done particularly well over the survey period. It is based on a substantial capital investment and long term commitment. The industry players exhibited a high level of cooperation and had invested many initiatives to improve their efficiency and reduce risk. The interviews were conducted in a time of financial uncertainty following the global financial crisis. Abalone producers felt particularly exposed as they were completely reliant on the export market, as well as externalities such as exchange rates. Concerns were expressed about downward pressure on prices due to rising production in Korea. However, the fundamentals of the abalone sector appeared sound, as producers had invested in promoting a unique brand identity and in efficient technology. Some were of the opinion that production was no longer demand driven and that production was beginning to level off. Several were using their
2009 AISA Aquaculture Benchmarking Survey

48
foundation in the abalone business to explore new aquaculture opportunities.
Industry representatives commented: ”We impress upon the government controlling body to develop a proper reportable disease monitoring structure as is available in the Department of Agriculture for the Agricultural Sector”.
7.3 Trout
The trout production sector is the longest established in South Africa with several producers having been in business for over 25 years. There was a stable base of producers with few new entrants.
On the positive side, all producers reported strong demand for large trout (>1kg) - in fact they could not meet demand which was increasingly being supplied by imports. Producers were seeking innovative means such as recirculation, to grow more fish with less water, and to hold fish through the summer season. A desire was expressed for more research support to improve the technology for South African environmental conditions.
The NEMBA biodiversity zoning regulations were identified as a major issue affecting trout farmers. While KZN trout farmers were largely satisfied with the proposed zones to control the use of trout – due to a good consultative process, Mpumalanga Province farmers were concerned that the zones are being made as small as possible and that some existing trout operations had been excluded. Concern was expressed that many existing and potential trout waters, where no biodiversity harm could be done, would be excluded due to the restrictive zonation. This would make it difficult for small enterprises to start a trout fishery on a dam as they would have to undertake risk assessments and/or a full EIA.
Water quality and quantity were also negatively affecting trout production. Increasing development such as urban development, agriculture and golf estates means that trout farms downstream get less water, and water quality is degraded. Production is shrinking at some localities as a result. Total production in Mpumalanga and KZN was reported to be stagnant, maybe reducing. Disease issues are an ongoing concern for many farmers.
In Mpumalanga, government red tape and regulation were cited as the main reason preventing new aquaculture development, particularly small farmer cage culture. While established farmers were prepared to invest in and mentor small farmer projects, a lack of response from the Department of Environmental Affairs and Department of Water Affairs discouraged proposers. It was alleged that departments were not talking to each other, and that there was no development focus and no decision making. A respondent said that after four and a half years and a lot of money spent, BEE candidates had been trained for the project, but no decision was made by the responsible government agencies about a cage culture project. The view was expressed that this was not really an environment in which small business could flourish.
An innovative new source of trout production and small scale enterprise was the “Hands-On Cooperative” sponsored by the Department of Science and Technology’s “Technology for Sustainable Livelihoods” programme under the auspices of Stellenbosch University. The cooperative comprised of some 32 production units on dams in the Western Cape Province, producing 142 tons of trout in 2008. While the project had been effective in the roll out of production units and achieving a significant tonnage of trout, there were concerns about the viability of some of the units. Not all had produced fish in 2008, and a lack of skills and motivation were pervasive issues. In some units it was felt that there were too many beneficiaries for the project to be viable. These issues were being addressed by the Western Cape Department of Agriculture at Elsenburg.
One trout producer reported that he had been successful in accessing the Department of Trade and Industry’s SMEDP incentive scheme for aquaculture with the help of a consultant which provided over R1 million/ year subsidy.
2009 AISA Aquaculture Benchmarking Survey

49
Further comments from producers included:• “Financial assistance would assist in the improvement of infra-structure to increase output
and diversify the range aquaculture products to make better use of facilities.”• “Our Project is well established and has paid most of the school fees to be a smooth running
operation. (As smooth running as aquaculture can be!)”• “Very little work done on trout in the veterinary field. Need state support.”
7.4 marine fish
Marine fish producers were generally positive about the prospects for commercialisation. Valuable experience had been gained from the Department of Science and Technology’s pilot kob cage aquaculture project with Irvin & Johnson at Port Elizabeth. This experience emphasised that the costs to pioneer farmers are very high due to high transaction costs, lack of dedicated infrastructure and lack of services. For example, feed was cited as a major cost factor, and business profitability was particularly sensitive to this. Imported feed was subject to duties but local feeds were not of a good quality. It costs millions to set up an aquaculture feed mill and at least a 10,000 tons feed volume would be required. Access to finance was an issue raised by marine fish producers (and respondents in all other sub-sectors).
Possible interventions and incentives suggested for government to stimulate establishment of marine fish sector included:
• Support joint industry actions. e.g. subsidise companies collaborating to establish service sector such as feed companies, health management services.
• Put in infrastructure. e.g. facilities at ports to service cages offshore. Service vessels are very expensive – can be shared between companies. Possibly subsidise.
• Environmental certification – is becoming paramount for market access. Government should facilitate certification schemes.
• Remove import tax on feed.• Biosecurity. Lack of EU certification currently inhibiting industry growth. Water quality
monitoring currently subsidised by industry. There was not enough money to do it properly.
• Government could play a leading role in facilitating the process of exporting.• A Government hatchery would create opportunities for smaller Aquaculture entrepreneurs
to enter the industry.• There is a need for Government Aquaculture veterinary support as is available to the
Agricultural sector.
7.5 oysters
Oyster producers reported gradual market growth, and that the production sector had not yet realized its full potential. One producer stated: ”After twenty years of bivalve cultivation, I am hoping to see some real progress in our industry – value adding, export product development, organic accreditation to name but a few”. Water quality monitoring and achieving EU accreditation were seen as important government led interventions which could assist the development of the oyster industry. Small oyster farmers found it very difficult to carry the cost of water quality monitoring and product testing. Once again, if government wants to stimulate the growth of small producers, the barriers to entry need addressing. Oyster spat importers stated that there appeared to be no rational reason for renewing their import permits every three months, along with all the requisite paperwork including tax clearance certificates. They asked “why could it not be done annually along with their marine aquaculture permit?”
2009 AISA Aquaculture Benchmarking Survey

50
Producer comments included:• “Permitting is far too complicated, e.g. tax certificate should not be an issue to withhold a
permit especially when the party concerned has a tax dispute.” • “EIA’s are taken too far in mined out areas.” • “The industry needs to also take into account small farmers and not only large cooperate
businesses.” • “Permit applicators should have the right to appeal their application in person in the event
of a permit being rejected. Those rejecting the permit without good reason need to be held accountable.”
• “Some of the bureaucracy and compliance factors have become totally unreasonable and do little to ensure enthusiasm within the industry, and create the envisaged “enabling environment” that I have heard being mentioned on a few occasions. A minor example that I will mention is that our permit conditions restrict our farm to a production figure similar to 2008, which was a bad year owing to the loss of 60% of our stock due to floods during the previous season. Now, surely this is similar to instructing any farmer in agriculture, after a bad drought, that he should curtail his production during a year of high rainfall. If this principal was applied, we would soon be starving and without farmers in this country. I fail to see the logic.”
• “The oyster cultivation industry in South Africa needs to become pro-active in eliminating unintended negative environmental effects, notably the introduction of potentially invasive organisms, pathogens and diseases. In order to do so, there should be strong state support for a hatchery or hatcheries in South Africa. Oyster imports should be restricted to larvae or small post larval oysters that have been reared in controlled hatcheries where contact with the natural ecosystem is prevented.”
• “The state needs to do far more to create and enabling environment for our industry. Exports are severely restricted by the failure of the state to put in place internationally compliant regulatory and monitoring systems.
7.7 mussels
Mussel production was reported to be fairly stable. The Masiza small farmer empowerment scheme in association with a commercial producer in Saldanha Bay was working well, with all four small production units working well and on business lines. Mentorship and management support by the commercial partner was cited as the key to its success.
7.8 ornamental fish and koi Carp
The bulk of locally produced ornamental fish were grown by a small number of well established, medium sized enterprises. The number of small scale/part time growers appeared to have decreased over the survey period. The major ornamental fish producers supplemented their production with imported fish in order to offer variety. In fact, it was reported that local ornamental fish production only meets approximately 20% of demand. Producers agreed that there was scope for growing local production, but that knowledge of production techniques as well as the market are essential. Government was generally viewed as an impediment to the ornamental sector:
• In was reported that it was becoming increasingly difficult to import fish due to difficulties in getting them through customs, and that only the larger, regular importers could now do it effectively.
• A producer stated: “The value of ornamental fish sold in SA is equal to that of the trout industry, yet the state does nothing to promote the local production of species that are being imported. The size of local production could easily be doubled with consequent social and economic benefits.”
• An ESKOM sponsored marine ornamental fish project aiming to promote community based grow-out units was reported to be on hold, as they could not get workable permitting arrangements with MCM for small satellite growers. They reported that it was feasible for a medium size enterprise to comply, but that there was too much red tape and costs for a
2009 AISA Aquaculture Benchmarking Survey

51
small business. For example, an environmental impact assessment was beyond the means of a small producer, as was the R150 permit required for each sale and the veterinary health certificate.
• A black producer in KZN was disillusioned with unfulfilled promises of government support for his business, and now avoided officials.
• A producer stated: “Government is attempting to promote aquaculture to benefit the rural poor, but there is a lack of coordination, even within Mapumalanga’s Agriculture Department. The former DWAF has policy guidelines which include the support and promotion of aquaculture as a duty of officials. Yet the policy regarding aquaculture as a non-consumptive use seems not to be understood, other than it is not to be viewed as irrigation.”
• A producer stated: “NEMBA poses threats to certain operations. Rather than supporting and facilitating aquaculture, it seems it will become more and more difficult to survive
• A producer stated: “Our country does not appropriately support ornamental fish production, despite the significant potential for export earnings. The focus is on food fish production. Nationally we do not have a policy and protocols in place to deal with the OIE or EU requirements for ornamental species. Veterinary services refuse to issue health certificates due to lack of understanding of complex documentation or unwillingness to commit in the absence of official guidelines or procedure. Veterinary services do not have the capacity to prepare or issue compliance protocols nor appropriately monitor producers. We do not survey and monitor for OIE reportable diseases of ornamental fish, and do not have action plans in place. In short, we officially prevent the export of certain farmed ornamental fish species.”
• A producer stated: “The Ornamental fish sector has the potential to achieve the following for the promotion of aquaculture in South Africa:
o It is an established industry in South Africa and thus a stable market already exists locally.
o The production of ornamental fish is well suited to SME’s and small biosecure units that do not require large amounts of capital for start up.
o Setting up numerous SME’s will help to promote a culture of aquaculture amongst communities in South Africa. This is possible due to the market chain that already exists and large variety of species and varieties that are available for production.
o The more fish that are produced locally the fewer fish will be imported.”
• “Currently a large number of ornamental fish are imported into South Africa by consolidators. These importers order fish on behalf of large end users and send them onto their customers without any form of disease control apart from a health certificate issued in the country of origin. This could pose a problem in the future for the international recognition of aquaculture products from South Africa.”
• “The pet trade is currently experiencing problems with the trade in imported ornamental birds with regards to Avian Influenza and the poultry industry. I feel that we need to be proactive and innovative with regards to aquaculture in such a way that both food fish and the ornamental fish trade can benefit.”
• “South Africa needs to develop more specialists in the field of aquaculture who are directly involved with disease and their control.”
• “Food security is not solely the provision of food items to people. It is also the ability to provide people with a means of generating disposable income in order to purchase food items. Ornamental fish can achieve this.”
• “We are seeing an increasing trend towards 'underground unregulated operations'. Government bungling of the regulation of the industry is costing us opportunity costs on a massive scale. Frankly, there is far too much regulation and red tape which is choking the Aquaculture industry on a massive scale and such legislation is simply likely to be ignored.“
2009 AISA Aquaculture Benchmarking Survey
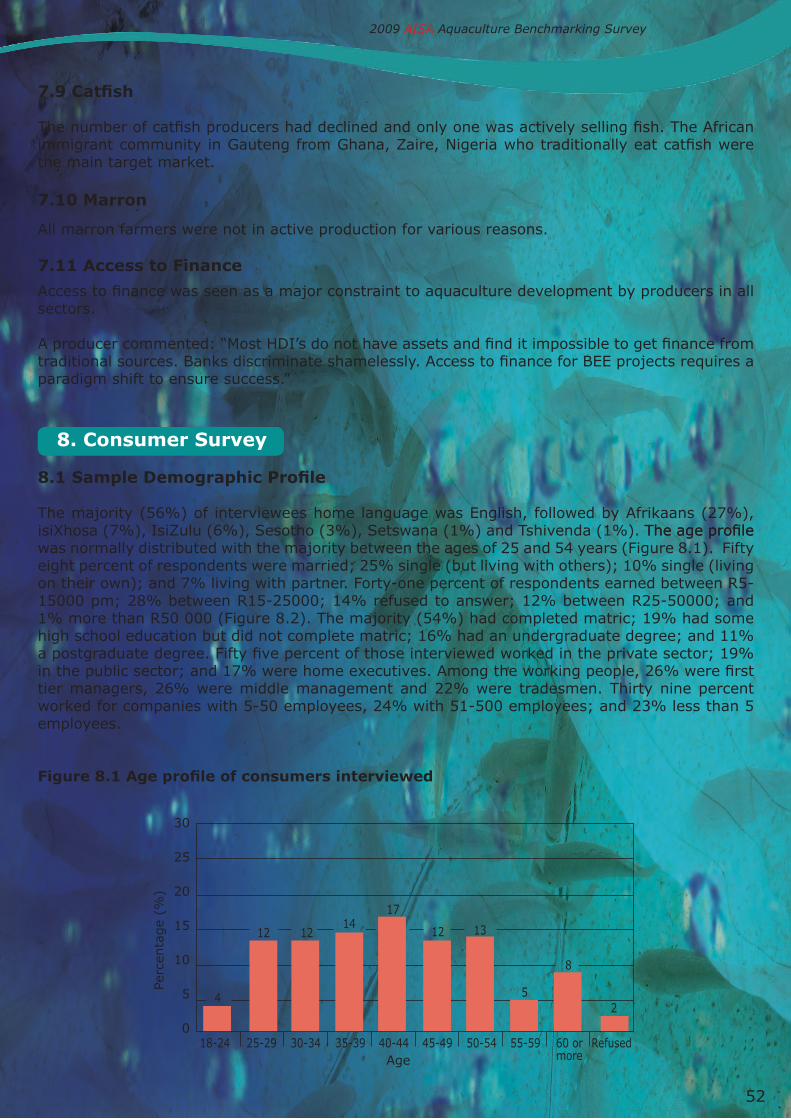
52
7.9 Catfish
The number of catfish producers had declined and only one was actively selling fish. The African immigrant community in Gauteng from Ghana, Zaire, Nigeria who traditionally eat catfish were the main target market.
7.10 marron
All marron farmers were not in active production for various reasons.
7.11 Access to finance
Access to finance was seen as a major constraint to aquaculture development by producers in all sectors.
A producer commented: “Most HDI’s do not have assets and find it impossible to get finance from traditional sources. Banks discriminate shamelessly. Access to finance for BEE projects requires a paradigm shift to ensure success.”
8. Consumer survey
8.1 Sample Demographic Profile
The majority (56%) of interviewees home language was English, followed by Afrikaans (27%), isiXhosa (7%), IsiZulu (6%), Sesotho (3%), Setswana (1%) and Tshivenda (1%). The age profile The age profile was normally distributed with the majority between the ages of 25 and 54 years (Figure 8.1). Fifty eight percent of respondents were married; 25% single (but living with others); 10% single (living on their own); and 7% living with partner. Forty-one percent of respondents earned between R5-15000 pm; 28% between R15-25000; 14% refused to answer; 12% between R25-50000; and 1% more than R50 000 (Figure 8.2). The majority (54%) had completed matric; 19% had some high school education but did not complete matric; 16% had an undergraduate degree; and 11% a postgraduate degree. Fifty five percent of those interviewed worked in the private sector; 19% in the public sector; and 17% were home executives. Among the working people, 26% were first tier managers, 26% were middle management and 22% were tradesmen. Thirty nine percent worked for companies with 5-50 employees, 24% with 51-500 employees; and 23% less than 5 employees.
Figure 8.1 Age profile of consumers interviewed
2009 AISA Aquaculture Benchmarking Survey

53
figure 8.2 monthly income of consumers interviewed.
8.2 seafood Purchasing behaviour
8.2.1 Responsibility for household shoppingEighty-seven percent of consumers interviewed were responsible for doing most of the house shopping. The percentage responsible for household shopping was however higher among female respondents (97%) compared to male (61%).
8.2.2 Where seafood is purchasedThe most common outlet for purchasing seafood was supermarkets, followed by restaurants, fish and chips shops and fast food outlets (Figure 8.3). A relatively small percentage of consumers (<10%) purchased seafood from fishing boats, fish shops, fish markets and other sources.
figure 8.3. Percentage of consumers utilising different seafood outlets
8.2.3 Type of seafood purchased when eating at homeHake, snoek and kingklip were the most frequently purchased products when eating at home. Aquaculture products were however popular with significant percentages of consumers purchasing prawns/shrimps (29%), salmon (21%), mussels (21%), oysters (5%) and trout (3%) (Figure 8.4b). The relatively scarcity of “linefish” (apart from snoek) was reflected in the generally low percentage of consumers (mostly <10) purchasing available species (Figure 8.4b).
2009 AISA Aquaculture Benchmarking Survey

54
Provincial differences were evident in consumer purchase of seafood to eat at home (Figure 8.5). Fewer consumers in KZN (78%) bought hake to eat at home compared to the other provinces. Snoek and mussels were most popular in the Western Cape with 80% of consumers purchasing it, compared to only 18% and 10% respectively in KZN. Similarly, the purchase of kingklip was most frequent amongst Western Cape (41%), and Eastern Cape (35%) consumers, compared to only 14% of consumers in KZN. Frequency of purchase of prawns/shrimp was highest in KZN (42%), compared to less than 30% other provinces. The purchase of calamari was highest (53%) in the Eastern Cape Province, compared to <30% for the other provinces.
figure 8.4a and b Type of seafood bought when eating at home.
2009 AISA Aquaculture Benchmarking Survey
(a)
(b)

55
figure 8.5 Provincial trends for buying seafood to eat at home.
The Living Standards Measure (LSM) categories did not reveal any clear trends in purchasing behaviour for hake, kingklip and calamari (Figure 8.6). However, the percentage of consumers purchasing the relatively economical snoek product decreased as LSM increased from LSM 8 to 10. Conversely, the percentage of consumers purchasing the more “luxury” products, such as shrimps/prawns, salmon, and mussels, increased as the LSM increased from 8 to 10.
Interesting racial differences were evident in the patterns of seafood purchase for eating at home (Figure 8.7). The percentage of consumers purchasing hake was similar for all race groups, indicating its wide acceptance as a white fish commodity product. The purchase of snoek and calamari were clearly highest amongst coloured consumers, probably due to the traditional Cape culture of consuming snoek and calamari. Other than for hake, the white consumer’s purchasing behaviour is fairly consistent amongst the various products. Black consumers were more conservative in their seafood choices, with a low percentage of black consumers purchasing kingklip (19%), and more “exotic” seafood such as shrimps/ prawns (6%), calamari (9%), salmon (11%), and mussels (2%). The purchase of shrimp/prawn products was highest amongst Indian consumers (51%), probably also reflecting traditional cuisine patterns.
figure 8.6. Consumer living standards measure (lsm) trends for purchasing seafood to eat at home.
figure 8.7 Consumer choice by race group in purchasing seafood to eat at home
2009 AISA Aquaculture Benchmarking Survey
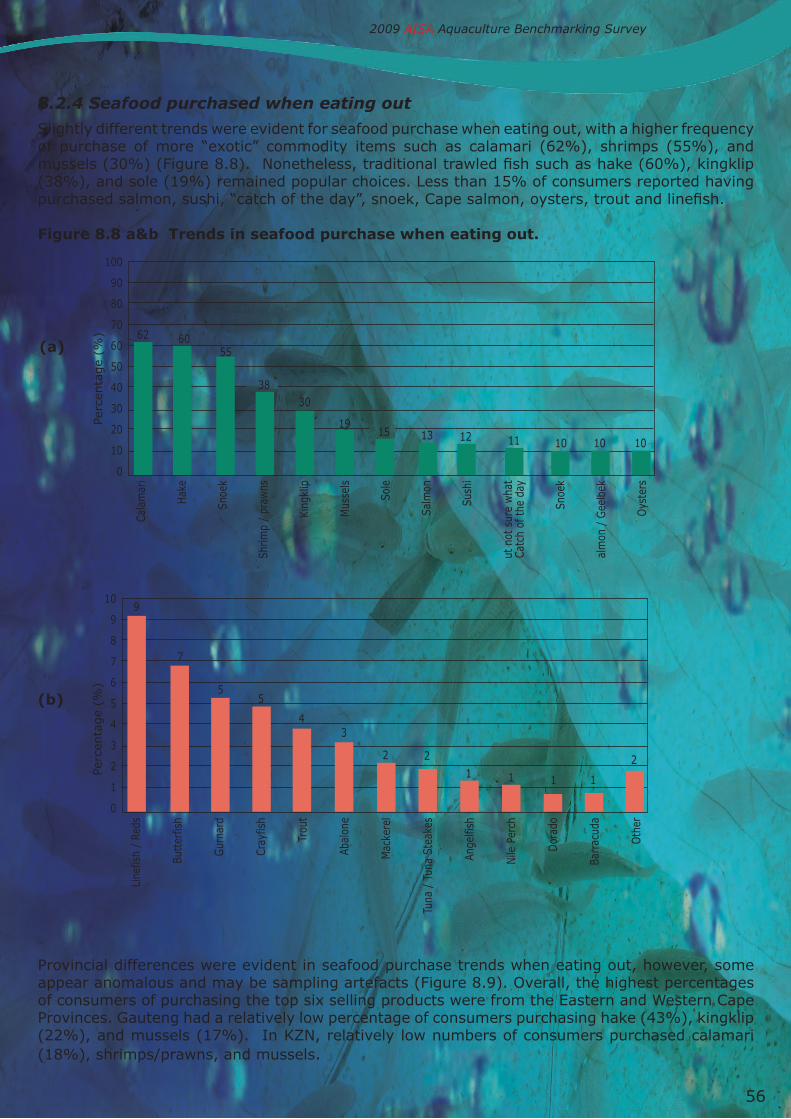
56
8.2.4 Seafood purchased when eating out
Slightly different trends were evident for seafood purchase when eating out, with a higher frequency of purchase of more “exotic” commodity items such as calamari (62%), shrimps (55%), and mussels (30%) (Figure 8.8). Nonetheless, traditional trawled fish such as hake (60%), kingklip (38%), and sole (19%) remained popular choices. Less than 15% of consumers reported having purchased salmon, sushi, “catch of the day”, snoek, Cape salmon, oysters, trout and linefish.
figure 8.8 a&b Trends in seafood purchase when eating out.
Provincial differences were evident in seafood purchase trends when eating out, however, some appear anomalous and may be sampling artefacts (Figure 8.9). Overall, the highest percentages of consumers of purchasing the top six selling products were from the Eastern and Western Cape Provinces. Gauteng had a relatively low percentage of consumers purchasing hake (43%), kingklip (22%), and mussels (17%). In KZN, relatively low numbers of consumers purchased calamari (18%), shrimps/prawns, and mussels.
2009 AISA Aquaculture Benchmarking Survey
(a)
(b)
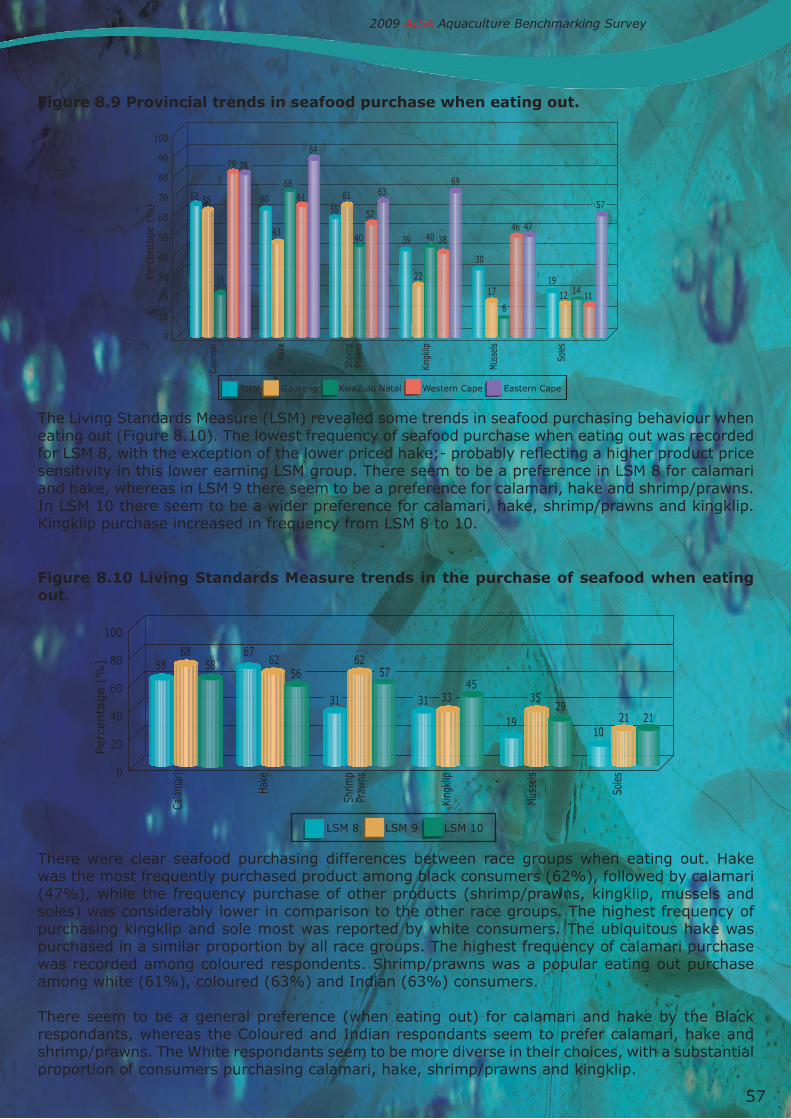
57
figure 8.9 Provincial trends in seafood purchase when eating out.
The Living Standards Measure (LSM) revealed some trends in seafood purchasing behaviour when eating out (Figure 8.10). The lowest frequency of seafood purchase when eating out was recorded for LSM 8, with the exception of the lower priced hake;- probably reflecting a higher product price sensitivity in this lower earning LSM group. There seem to be a preference in LSM 8 for calamari and hake, whereas in LSM 9 there seem to be a preference for calamari, hake and shrimp/prawns. In LSM 10 there seem to be a wider preference for calamari, hake, shrimp/prawns and kingklip. Kingklip purchase increased in frequency from LSM 8 to 10.
figure 8.10 living standards measure trends in the purchase of seafood when eating out.
There were clear seafood purchasing differences between race groups when eating out. Hake was the most frequently purchased product among black consumers (62%), followed by calamari (47%), while the frequency purchase of other products (shrimp/prawns, kingklip, mussels and soles) was considerably lower in comparison to the other race groups. The highest frequency of purchasing kingklip and sole most was reported by white consumers. The ubiquitous hake was purchased in a similar proportion by all race groups. The highest frequency of calamari purchase was recorded among coloured respondents. Shrimp/prawns was a popular eating out purchase among white (61%), coloured (63%) and Indian (63%) consumers.
There seem to be a general preference (when eating out) for calamari and hake by the Black respondants, whereas the Coloured and Indian respondants seem to prefer calamari, hake and shrimp/prawns. The White respondants seem to be more diverse in their choices, with a substantial proportion of consumers purchasing calamari, hake, shrimp/prawns and kingklip.
2009 AISA Aquaculture Benchmarking Survey

58
figure 8.11 seafood purchase trends when eating out among race groups.
8.2.5. Seafood versus meat and poultryConsumers ranked poultry as the most important protein, with 89% of respondents categorising it as the most important or 2nd most important protein type in their diet, compared to 60% for seafood and 51% for meat (Figure 8.12). This preference is almost certainly influenced by price, as poultry was considered the most affordable protein (Figure 8.13). Seventy-two of respondents ranked poultry as most affordable, compared to 15% for seafood and 13% for meat. 8.2.6 Culture, religion, and health factors in determining seafood buyingCulture and religion were not considered influential factors in terms of why people choose to eat fish/ seafood, while health was considered as an influential factor by 36% of respondents (Figure 8.14). Most people (56%) who were influenced by health factors in purchasing seafood, purchased fish because they feel “it’s healthier” (Figure 8.15). Lower percentages (<25%) of interviewees provided more specific health reasons such as “it contains protein”, it has “omega-3 oil”, “doesn’t contain fat”, “it’s low in cholesterol”. It is interesting to note, the number of people who purchased seafood because they perceived it to be healthy increased with age (Figure 8.16).
figure 8.12 Consumer ranking of the importance of meat, seafood and poultry in their diets.
2009 AISA Aquaculture Benchmarking Survey

59
figure 8.13 Consumer ranking of the affordability of meat, seafood and poultry in their diets.
Figure 8.14 Consumer ranking of factors influencing their choices in purchasing seafood.
Figure 8.15 Consumer ranking of health factors influencing their choices in purchasing seafood.
2009 AISA Aquaculture Benchmarking Survey

60
Figure 8.16 Factors influencing why consumers purchase seafood by age group.
8.2.7 Product FamiliarityNinety-one percent of consumers stated that when they purchase seafood in a supermarket, they tended to stick with products that they were familiar with. Eighty five percent of consumers tended to purchase familiar seafood products when eating out in restaurants.
8.2.8 Local versus imported productsIn response to the question: “On a scale of 1-10, how important is it to you whether you buy local or imported seafood”; 53% of respondents felt the distinction was important (ranking 8-10) (Figure 8.17). Correspondingly, 54% of respondents felt that it was important to have information (ranking 8-10) on whether seafood was local or imported (Figure 8.18).
figure 8.17 Consumer ranking of importance of whether they buy local or imported seafood.
2009 AISA Aquaculture Benchmarking Survey
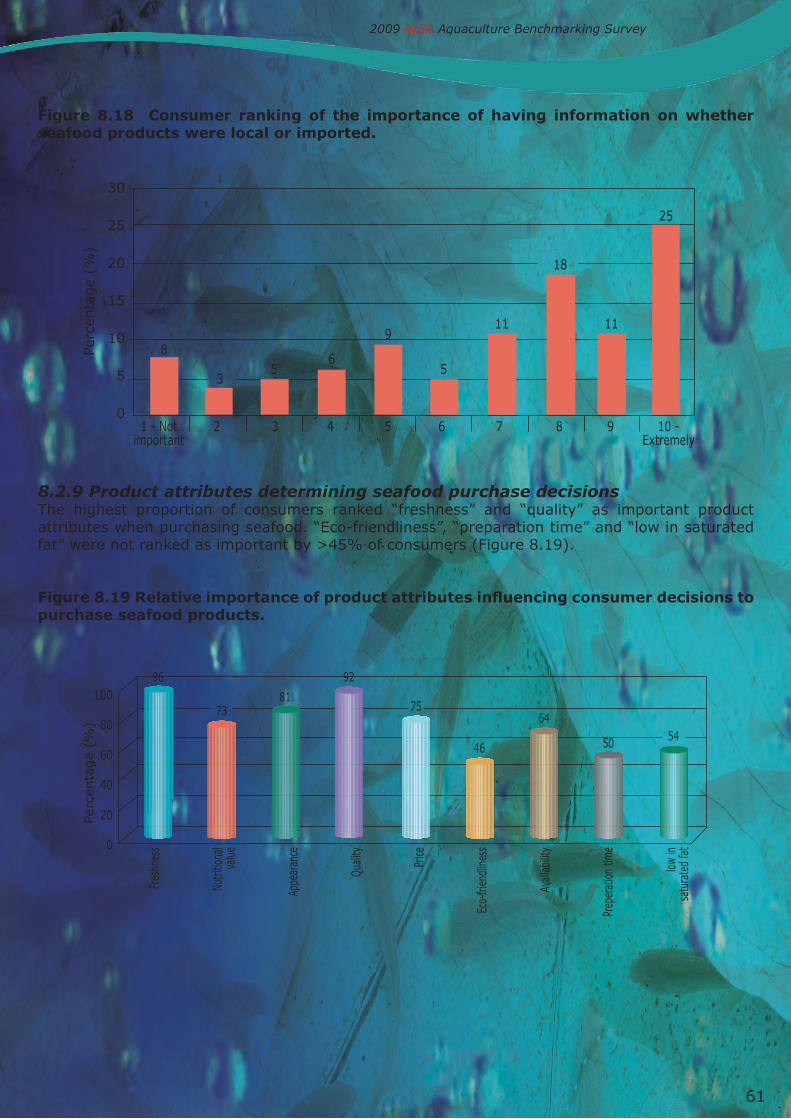
61
figure 8.18 Consumer ranking of the importance of having information on whether seafood products were local or imported.
8.2.9 Product attributes determining seafood purchase decisionsThe highest proportion of consumers ranked “freshness” and “quality” as important product attributes when purchasing seafood. “Eco-friendliness”, “preparation time” and “low in saturated fat” were not ranked as important by >45% of consumers (Figure 8.19).
Figure 8.19 Relative importance of product attributes influencing consumer decisions to purchase seafood products.
2009 AISA Aquaculture Benchmarking Survey
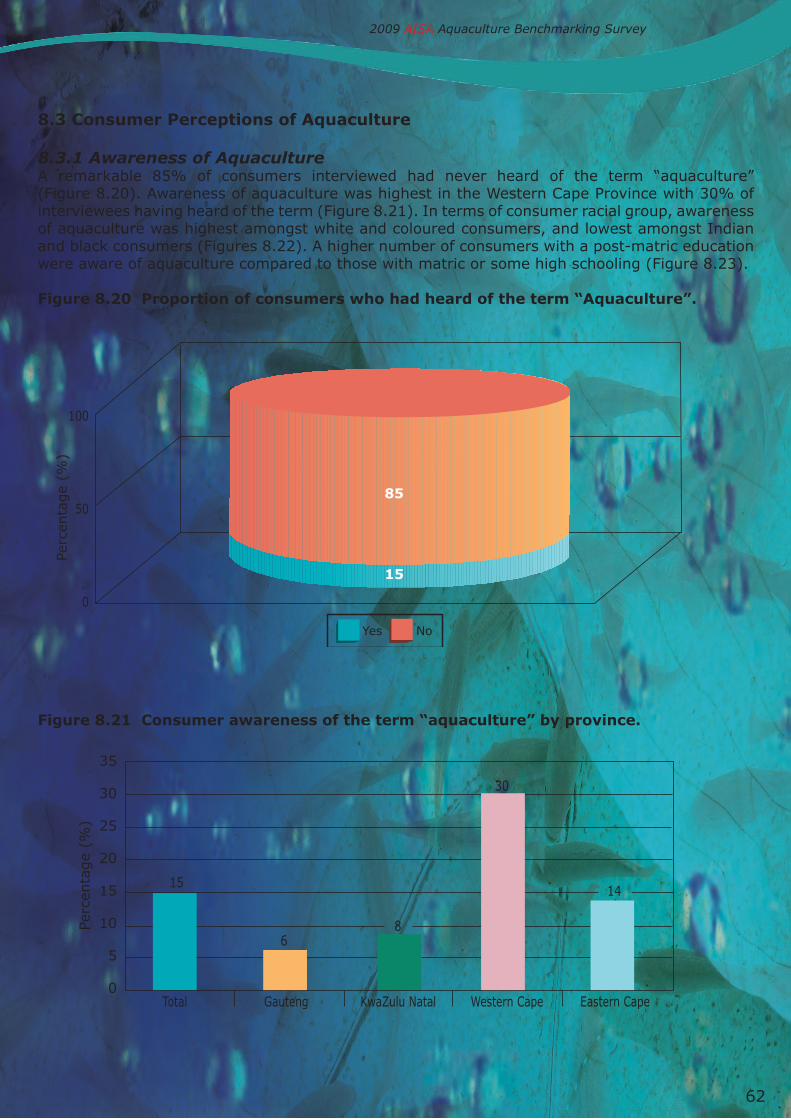
62
8.3 Consumer Perceptions of Aquaculture
8.3.1 Awareness of AquacultureA remarkable 85% of consumers interviewed had never heard of the term “aquaculture” (Figure 8.20). Awareness of aquaculture was highest in the Western Cape Province with 30% of interviewees having heard of the term (Figure 8.21). In terms of consumer racial group, awareness of aquaculture was highest amongst white and coloured consumers, and lowest amongst Indian and black consumers (Figures 8.22). A higher number of consumers with a post-matric education were aware of aquaculture compared to those with matric or some high schooling (Figure 8.23).
figure 8.20 Proportion of consumers who had heard of the term “Aquaculture”.
figure 8.21 Consumer awareness of the term “aquaculture” by province.
2009 AISA Aquaculture Benchmarking Survey

63
figure 8.22 Awareness of the term “aquaculture” by consumer’s race.
figure 8.23 Awareness of the term “aquaculture” by consumer’s education level.
8.3.2 Understanding of AquacultureOf the 15% who had heard of the term “aquaculture”, the majority (37%) responded that their understanding of the word was “fish farming”, 21% responded as “breeding fish”, and 11% “breeding in tanks or aquariums” (Figure 8.24). Twenty six percent of respondents knew that aquaculture seafood products were not removed from their natural ocean habitat (Figure 8.25). The proportion of consumers knowing that aquaculture products were not sourced from their natural ocean habitat, but were farmed, was highest in the Western Cape Province (46%) (Figure 8.26).
2009 AISA Aquaculture Benchmarking Survey
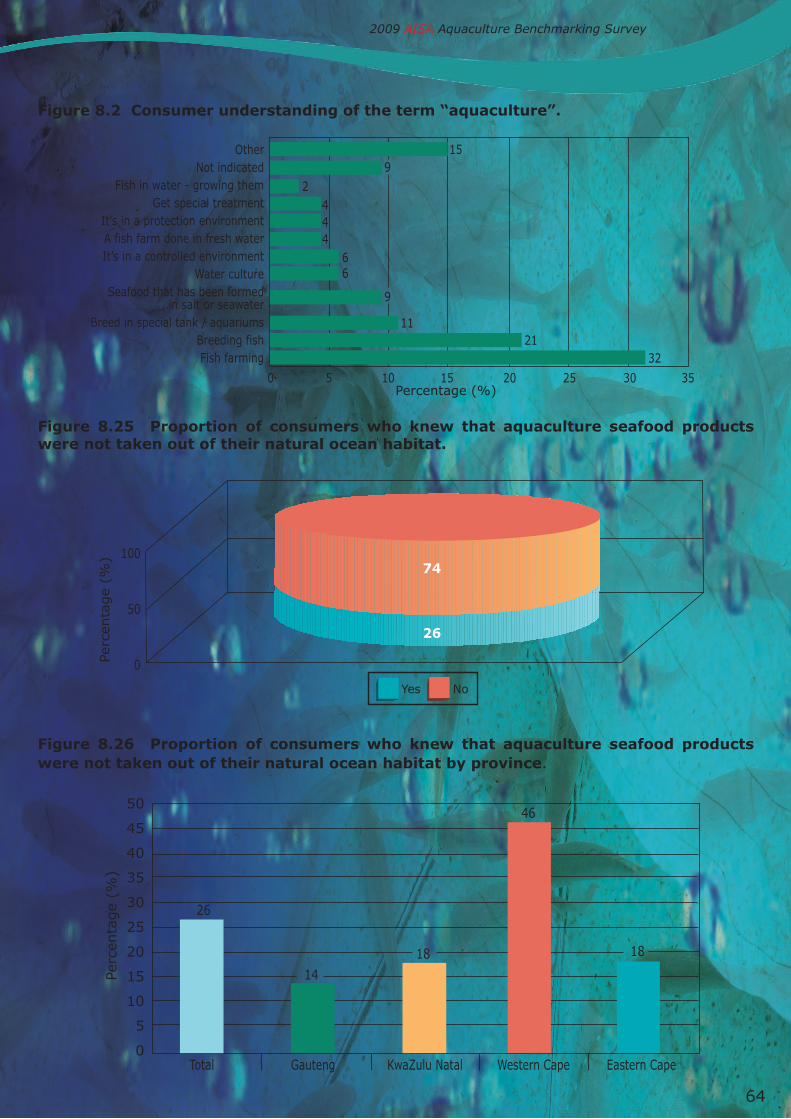
64
figure 8.2 Consumer understanding of the term “aquaculture”.
figure 8.25 Proportion of consumers who knew that aquaculture seafood products were not taken out of their natural ocean habitat.
figure 8.26 Proportion of consumers who knew that aquaculture seafood products were not taken out of their natural ocean habitat by province.
2009 AISA Aquaculture Benchmarking Survey

65
8.3.3 Preference for Wild versus Farmed SeafoodThe majority (56%) of respondents stated that they preferred to buy wild seafood; 5% preferred farmed and 39% had no preference (Figure 8.27). A higher proportion of Indian (72%) and coloured (71%) consumers stated that they preferred wild seafood (Figure 8.28). The preference for wild seafood increased as the Living Standards Measure increased from LSM 8 to 10 (Figure 8.29). The most common reason for preferring wild seafood, cited by 28% of respondents, was that it originated from a “natural” environment or was “more natural” (Figure 8.30). The second and third most commonly cited reasons were “not fed man-made products and chemicals” (19%) and “tastes better” (16%) (Figure 8.31). In response to the question “On a scale of 1-10, how important is it you to buy wild or farmed seafood”, 33% of consumers rated the distinction as very important (ranking 8-10; Figure 8.31). Fifty-one percent of respondents felt it was important (ranking 8-10) to have information on whether seafood products were wild or farmed (Figure 8.32). figure 8.27 Consumer preference for wild or farmed seafood.
figure 8.28 Preference for wild of farmed seafood by consumer racial group.
2009 AISA Aquaculture Benchmarking Survey

66
figure 8.29 Preference for wild of farmed seafood by living standards measure.
figure 8.30 reasons for preferring wild seafood to farmed.
2009 AISA Aquaculture Benchmarking Survey

67
figure 8.31 relative importance of wild versus farmed in consumer purchasing decisions.
figure 8.32 relative importance of wild versus farmed in consumer purchasing decisions.
2009 AISA Aquaculture Benchmarking Survey
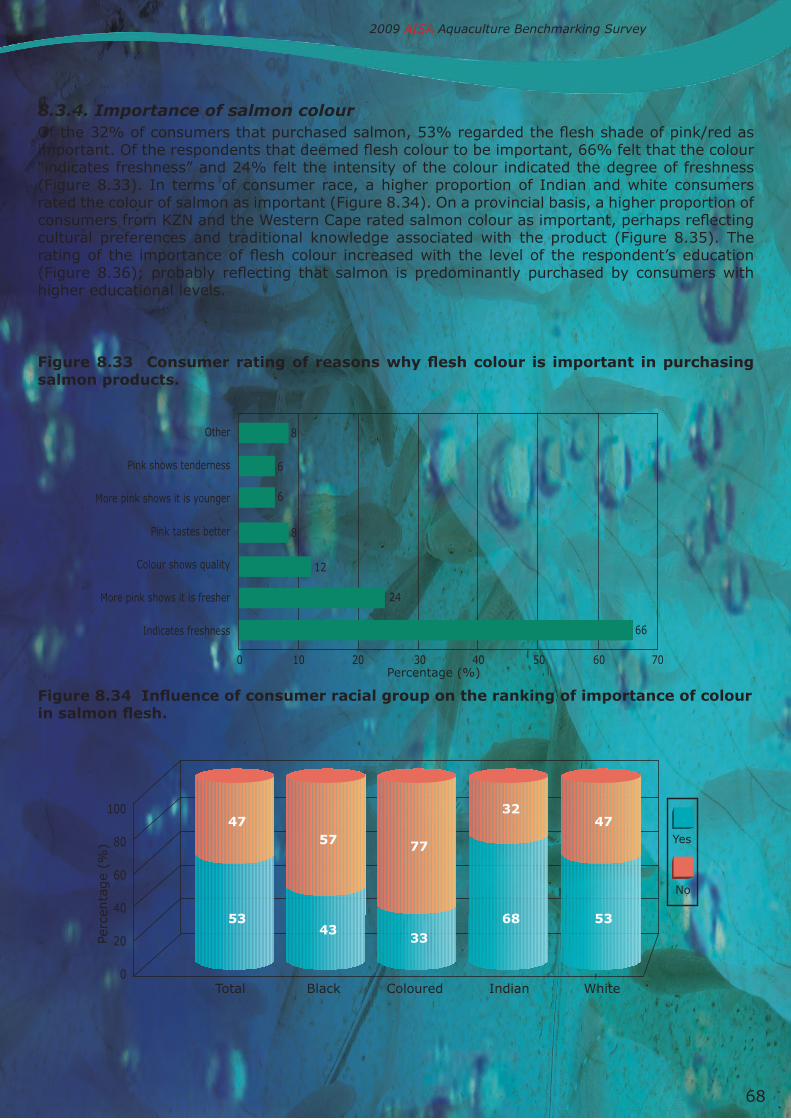
68
8.3.4. Importance of salmon colourOf the 32% of consumers that purchased salmon, 53% regarded the flesh shade of pink/red as important. Of the respondents that deemed flesh colour to be important, 66% felt that the colour “indicates freshness” and 24% felt the intensity of the colour indicated the degree of freshness (Figure 8.33). In terms of consumer race, a higher proportion of Indian and white consumers rated the colour of salmon as important (Figure 8.34). On a provincial basis, a higher proportion of consumers from KZN and the Western Cape rated salmon colour as important, perhaps reflecting cultural preferences and traditional knowledge associated with the product (Figure 8.35). The rating of the importance of flesh colour increased with the level of the respondent’s education (Figure 8.36); probably reflecting that salmon is predominantly purchased by consumers with higher educational levels.
Figure 8.33 Consumer rating of reasons why flesh colour is important in purchasing salmon products.
Figure 8.34 Influence of consumer racial group on the ranking of importance of colour in salmon flesh.
2009 AISA Aquaculture Benchmarking Survey

69
Figure 8.35 Influence consumer’s provincial location on the ranking of importance of colour in salmon flesh.
figure 8.36 effect of consumer educational level on the ranking of the importance of flesh colour in salmon products.
2009 AISA Aquaculture Benchmarking Survey

70
8.4 frequency of seafood Purchase
8.4.1 Fresh seafoodThe majority of respondents (60%) purchased fresh seafood once a month or more often (Figure 8.37). Sixty percent of interviewed consumers reported buying the same quantity fresh seafood compared to a year ago; 22% were buying more, and 19% buying less. A significantly higher proportion of black consumers reported that they buy more fresh fish than a year ago, perhaps reflecting a growing awareness of seafood products amongst black consumers (Figure 8.38).
3.4.2 Frozen SeafoodSeventy percent (70%) of respondents buy frozen seafood once a month or more often. The majority (67%) reported buying the same quantity of frozen seafood compared to a year ago, 18% more, and 16% less. The proportion of black and Indian consumers buying more frozen fish was higher than a year ago (Figure 8.39), again possibly reflecting a growing awareness of seafood products amongst black consumers.
figure 8.37 frequency of purchase of fresh seafood by south African consumers.
figure 8.38 Comparative purchase of fresh seafood compared to a year ago by consumer race group.
2009 AISA Aquaculture Benchmarking Survey
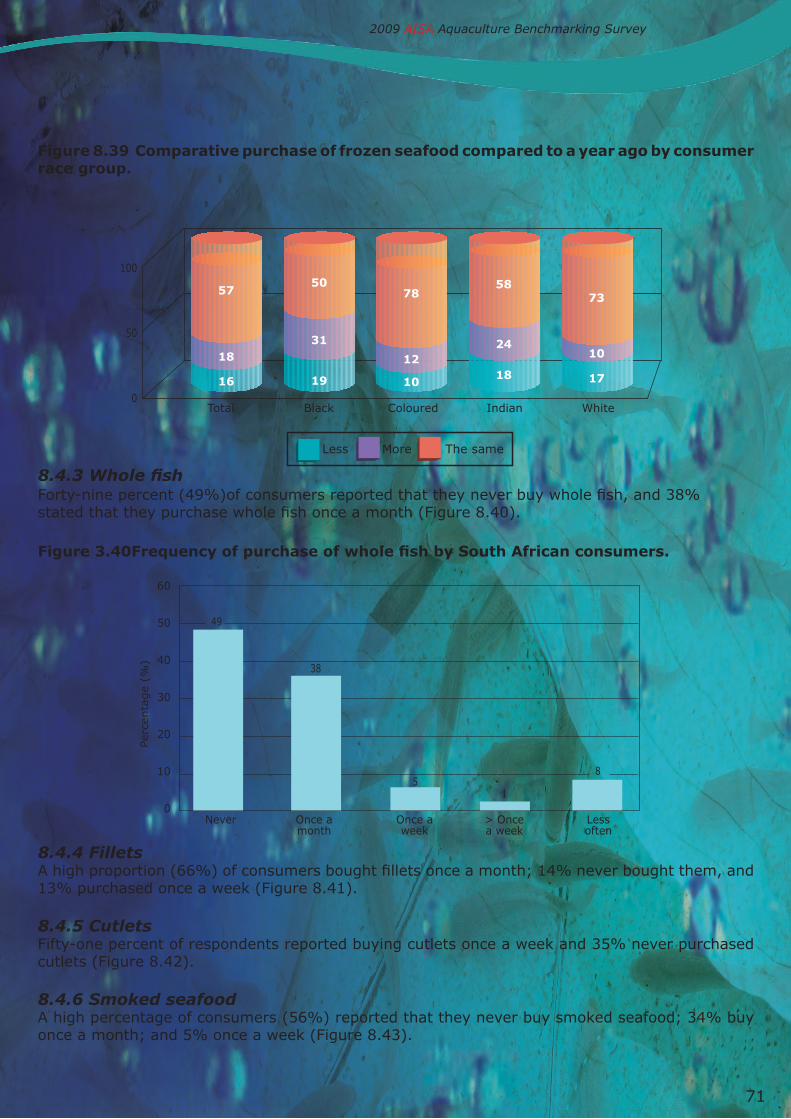
71
figure 8.39 Comparative purchase of frozen seafood compared to a year ago by consumer race group.
8.4.3 Whole fishForty-nine percent (49%)of consumers reported that they never buy whole fish, and 38% stated that they purchase whole fish once a month (Figure 8.40). Figure 3.40Frequency of purchase of whole fish by South African consumers.
8.4.4 FilletsA high proportion (66%) of consumers bought fillets once a month; 14% never bought them, and 13% purchased once a week (Figure 8.41).
8.4.5 CutletsFifty-one percent of respondents reported buying cutlets once a week and 35% never purchased cutlets (Figure 8.42).
8.4.6 Smoked seafoodA high percentage of consumers (56%) reported that they never buy smoked seafood; 34% buy once a month; and 5% once a week (Figure 8.43).
2009 AISA Aquaculture Benchmarking Survey

72
Figure 8.41 Frequency of purchase of fish fillets by South African consumers.
Figure 8.42 Frequency of purchase of fish cutlets by South African consumers.
figure 8.43 frequency of purchase of smoked seafood by south African consumers.
2009 AISA Aquaculture Benchmarking Survey

73
8.4.7 Tinned seafoodTinned seafood is a popular choice, with 63% of respondents reporting buying tinned seafood once a month; 18% once a week and 11% never buying (Figure 8.44).
8.4.8 Value added seafoodApproximately two-thirds of consumers (63%) never purchased “seafood with a sauce” (Figure 8.45). Ready to eat/value added seafood meals were a more popular seafood product, with 47% of consumers purchasing these products once a month of more frequently (Figure 8.46), and a further 26% purchasing “every few months”. The majority (63%) reported buying the same quantity compared to a year ago, 25% were buying less, and only 12% were buying more. Black consumers were an exception to this trend with 33% buying more “ready to eat/ precooked seafood” than a year ago, compared to 26% buying less (Figure 8.47). Sushi was never purchased by 78% of surveyed consumers. Only 12% purchased sushi once a month or more frequently (Figure 3.48). Thirty one percent of respondents reported buying sushi less frequently than a year ago, versus 24% who reported buying it more frequently.
figure 8.44 frequency of purchase of tinned seafood by south African consumers.
figure 8.45 frequency of purchase of value-added seafood with sauce by south African consumers.
2009 AISA Aquaculture Benchmarking Survey
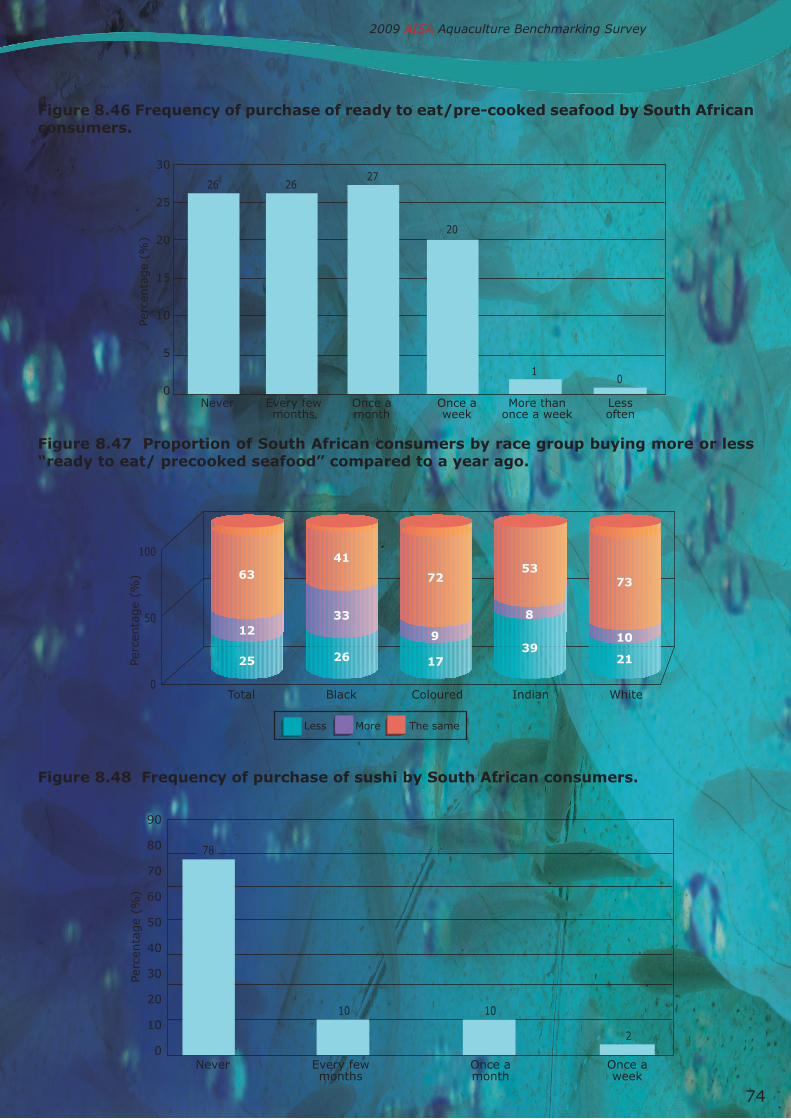
74
figure 8.46 frequency of purchase of ready to eat/pre-cooked seafood by south African consumers.
figure 8.47 Proportion of south African consumers by race group buying more or less “ready to eat/ precooked seafood” compared to a year ago.
figure 8.48 frequency of purchase of sushi by south African consumers.
2009 AISA Aquaculture Benchmarking Survey
75
9. seafood buyer survey
9.1 restaurant buyers
Of the five restaurant buyers that were contacted, three responses were received from restaurant buyers; - two from seafood franchise chains, and one from a “white table cloth” restaurant.
9.1.1 Aquaculture awarenessAll had a good general knowledge of seafood products and their characteristics. They were well aware of what aquaculture products were, the differences between aquaculture products and those originating from the wild. The responses of the buyers indicated an awareness of environmental issues associated with wild fisheries and aquaculture. One buyer felt that aquaculture products offered a sustainable alternative to wild seafood, while another commented that “unfortunately, aquaculture can suffer from similar problems that intensive agriculture has such as pollution, disease and toxic contamination, especially when antibiotics are fed to stocks”. Two buyers supported WWF’s South African Sustainable Seafood Initiative.
9.1.2 Aquaculture Product CharacteristicsTwo of the three buyers indicated an awareness of the positive aquaculture product attributes, citing “consistent product quality and sustainable supply”, and “control over product characteristics”. One buyer indicated that they were not aware of any positive characteristics associated with aquaculture products.
9.1.3 Demand for Seafood/FishAll three buyers were of the opinion that the demand for seafood/fish was growing.
9.1.4 Seafood availabilityTwo of the three buyers were of the opinion that the demand for fresh seafood/fish exceeds the available supply. The white table cloth restaurant buyer commented that “a variety of fresh fish is generally scarce:- sardines, mackerel, monkfish, anchovies, and all of the smaller, more sustainable species are never made available to restaurants. The two franchise buyers listed hake, kingklip, sole, and prawns as being in short supply.
9.1.5 Shift to Aquaculture ProductsTwo of the three buyers confirmed that there was a trend in the South African market towards buying more aquaculture products, compared to seafood products originating from the wild.
9.1.6 Farmed Versus Wild CaughtNone of the buyers discriminated between farmed and wild caught seafood in their buying decisions. The “white table cloth” restaurant buyer stated:
“Our priority/concern is not whether fish is farmed or wild caught but whether or not it is fresh. Our biggest problem is regular access to fresh fish. Norwegian salmon is hugely popular because it is always available (editors emphasis), and not because it is a superior product – the quality of local “salmon” trout is far superior and obviously fresher”
9.1.7 Aquaculture products purchasedAquaculture products featured prominently in the mix of products purchased by the restaurant buyers, and included: shrimp/prawns, mussels, oysters, salmon, trout, tilapia, and basa pangasins (Vietnamese catfish) (Table 9.1). Aquaculture products featured in the top three products sold by all restaurants (Table 9.2). For the seafood franchise buyers, cultured prawns were one of their top sellers. The “white table cloth” buyer required top quality fresh fish for sushi, and relied heavily on culture Norwegian salmon, as tuna, other wild fish, and trout were in short supply.
2009 AISA Aquaculture Benchmarking Survey
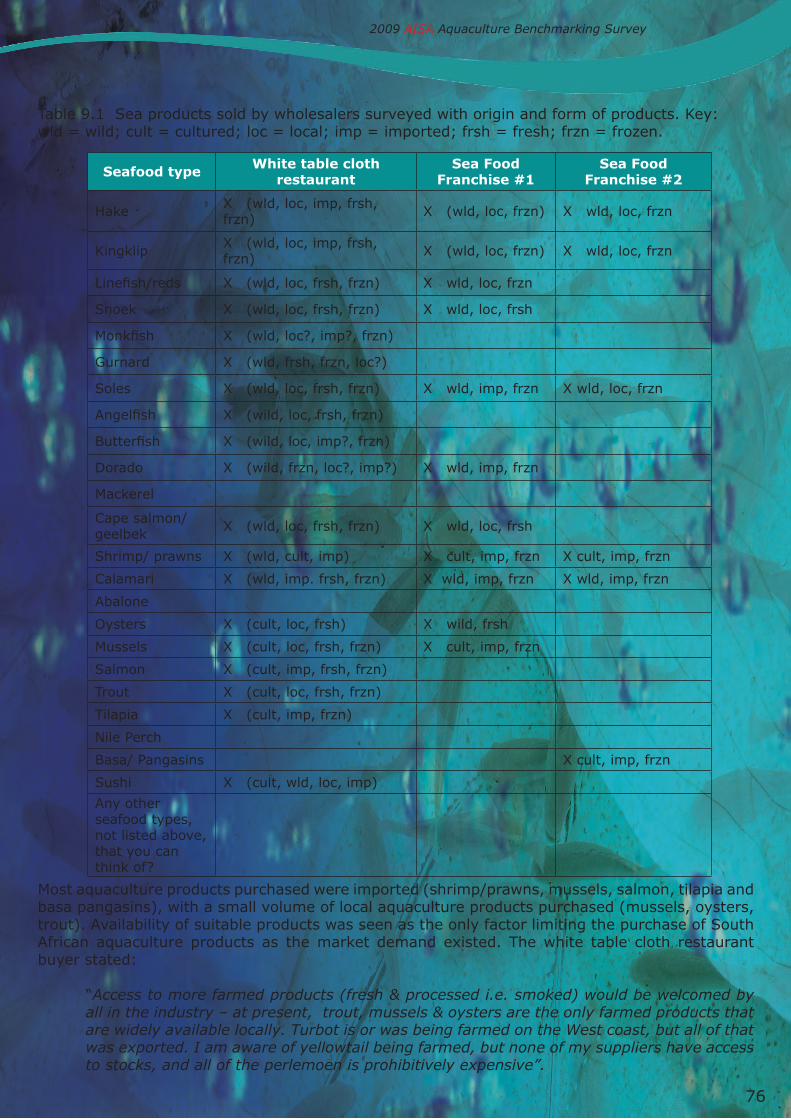
76
Table 9.1 Sea products sold by wholesalers surveyed with origin and form of products. Key: wld = wild; cult = cultured; loc = local; imp = imported; frsh = fresh; frzn = frozen.
Most aquaculture products purchased were imported (shrimp/prawns, mussels, salmon, tilapia and basa pangasins), with a small volume of local aquaculture products purchased (mussels, oysters, trout). Availability of suitable products was seen as the only factor limiting the purchase of South African aquaculture products as the market demand existed. The white table cloth restaurant buyer stated:
“Access to more farmed products (fresh & processed i.e. smoked) would be welcomed by all in the industry – at present, trout, mussels & oysters are the only farmed products that are widely available locally. Turbot is or was being farmed on the West coast, but all of that was exported. I am aware of yellowtail being farmed, but none of my suppliers have access to stocks, and all of the perlemoen is prohibitively expensive”.
seafood type white table cloth restaurant
sea food franchise #1
sea food franchise #2
Hake X (wld, loc, imp, frsh, frzn) X (wld, loc, frzn) X wld, loc, frzn
Kingklip X (wld, loc, imp, frsh, frzn) X (wld, loc, frzn) X wld, loc, frzn
Linefish/reds X (wld, loc, frsh, frzn) X wld, loc, frzn
Snoek X (wld, loc, frsh, frzn) X wld, loc, frsh
Monkfish X (wld, loc?, imp?, frzn)
Gurnard X (wld, frsh, frzn, loc?)
Soles X (wld, loc, frsh, frzn) X wld, imp, frzn X wld, loc, frzn
Angelfish X (wild, loc, frsh, frzn)
Butterfish X (wild, loc, imp?, frzn)
Dorado X (wild, frzn, loc?, imp?) X wld, imp, frzn
Mackerel
Cape salmon/ geelbek X (wld, loc, frsh, frzn) X wld, loc, frsh
Shrimp/ prawns X (wld, cult, imp) X cult, imp, frzn X cult, imp, frzn
Calamari X (wld, imp. frsh, frzn) X wld, imp, frzn X wld, imp, frzn
Abalone
Oysters X (cult, loc, frsh) X wild, frsh
Mussels X (cult, loc, frsh, frzn) X cult, imp, frzn
Salmon X (cult, imp, frsh, frzn)
Trout X (cult, loc, frsh, frzn)
Tilapia X (cult, imp, frzn)
Nile Perch
Basa/ Pangasins X cult, imp, frzn
Sushi X (cult, wld, loc, imp)
Any other seafood types, not listed above, that you can think of?
2009 AISA Aquaculture Benchmarking Survey
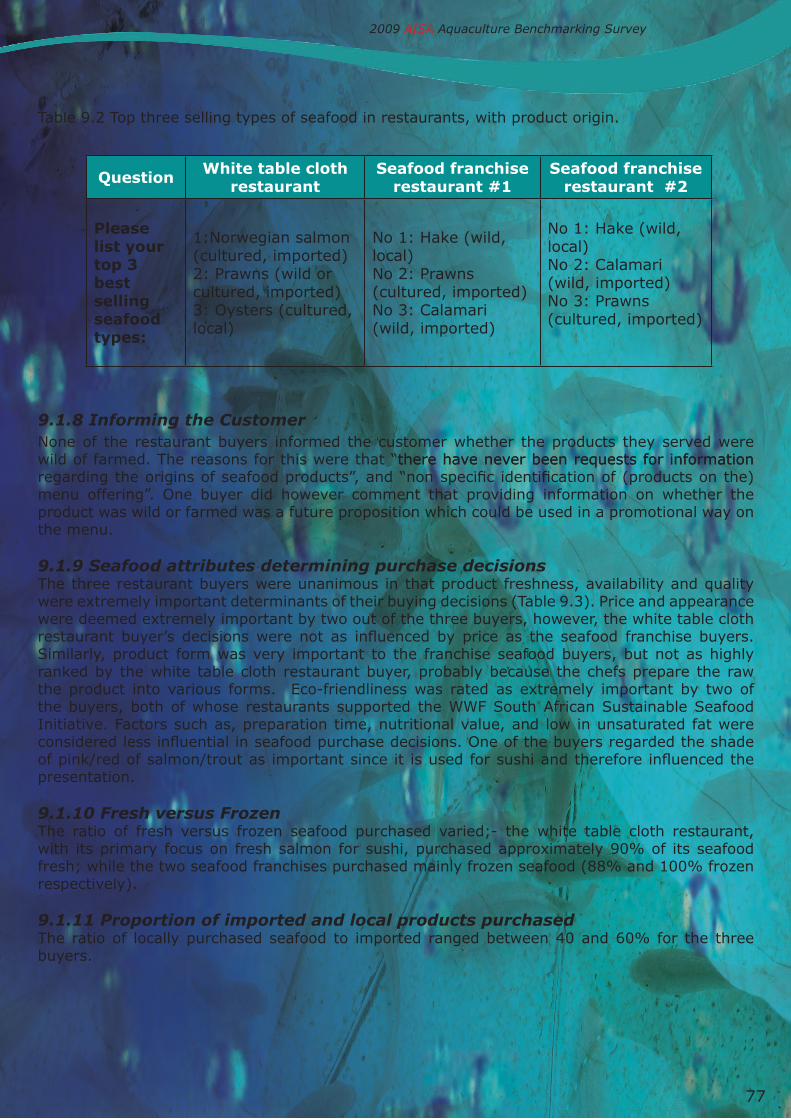
77
Table 9.2 Top three selling types of seafood in restaurants, with product origin.
9.1.8 Informing the CustomerNone of the restaurant buyers informed the customer whether the products they served were wild of farmed. The reasons for this were that “there have never been requests for informationthere have never been requests for information regarding the origins of seafood products”, and “non specific identification of (products on the) menu offering”. One buyer did however comment that providing information on whether the product was wild or farmed was a future proposition which could be used in a promotional way on the menu.
9.1.9 Seafood attributes determining purchase decisionsThe three restaurant buyers were unanimous in that product freshness, availability and quality were extremely important determinants of their buying decisions (Table 9.3). Price and appearance were deemed extremely important by two out of the three buyers, however, the white table cloth restaurant buyer’s decisions were not as influenced by price as the seafood franchise buyers. Similarly, product form was very important to the franchise seafood buyers, but not as highly ranked by the white table cloth restaurant buyer, probably because the chefs prepare the raw the product into various forms. Eco-friendliness was rated as extremely important by two of the buyers, both of whose restaurants supported the WWF South African Sustainable Seafood Initiative. Factors such as, preparation time, nutritional value, and low in unsaturated fat were considered less influential in seafood purchase decisions. One of the buyers regarded the shade of pink/red of salmon/trout as important since it is used for sushi and therefore influenced the presentation. 9.1.10 Fresh versus FrozenThe ratio of fresh versus frozen seafood purchased varied;- the white table cloth restaurant, with its primary focus on fresh salmon for sushi, purchased approximately 90% of its seafood fresh; while the two seafood franchises purchased mainly frozen seafood (88% and 100% frozen respectively).
9.1.11 Proportion of imported and local products purchasedThe ratio of locally purchased seafood to imported ranged between 40 and 60% for the three buyers.
question white table cloth restaurant
seafood franchise restaurant #1
seafood franchise restaurant #2
Please list your top 3 best selling seafood types:
1:Norwegian salmon (cultured, imported)2: Prawns (wild or cultured, imported)3: Oysters (cultured, local)
No 1: Hake (wild, local)No 2: Prawns (cultured, imported)No 3: Calamari (wild, imported)
No 1: Hake (wild, local)No 2: Calamari (wild, imported)No 3: Prawns (cultured, imported)
2009 AISA Aquaculture Benchmarking Survey

78
Table 9.3 Rating of factors determining seafood purchase decisions by restaurant buyers. Buyers were asked the question: “When buying fish/seafood products, how important are the following factors to you when making your decision?”. “Importance” was rated on a scale of 1-10 (1= not important; 10 = extremely important).
9.1.12 Smoked Seafood ProductsThe franchise restaurant buyers stated that there was no demand for smoked seafood products in their market, however, the white table cloth restaurant buyer observed that: “Smoked products have become increasingly popular, with high end restaurants doing a lot of the smoking themselves”.
9.1.13 Awareness of International Seafood TrendsThe buyer’s comments highlighted a growing awareness of sustainability issues, including;- the global overexploitation of wild stocks; the problem of the growing scarcity of seafood worldwide; and the growing trend towards eco-labels and organic food. When asked “which countries are setting the trends the buyers listed: “United Kingdom, Australia and Europe”.
9.1.14 South African Seafood TrendsTwo buyers commented that much of what is produced locally is exported and not made available to the local market. When asked if South Africa was setting any trends, the buyers commented that the country appears to be at the forefront of innovation with regards to sustainability initiatives, mentioning specifically the WWF’s S.A. Sustainable Seafood Initiative. 9.1.15 Colour of Trout and SalmonTwo restaurant buyers stated that the pink colour of trout and salmon was not important in their buying decisions; while the third sated that the pink colour was important for the presentation of sushi products.
Product attribute white table
cloth restaurant buyer
seafood franchise
restaurant #1
seafood franchise
restaurant #2
freshness 10 10 10
Availability 10 10 10
quality 10 10 10
Price 7 10 10
Appearance 10 10 5
eco-friendliness 10 9 5
Product form 1 8 10
nutritional value 5 8 5
low in saturated fat 1 8 5
Prep time 2 8 1
2009 AISA Aquaculture Benchmarking Survey

79
9.2 wholesale buyers
Of the four wholesale buyers, three responses were received.
9.2.1 Aquaculture awarenessAll three wholesale buyers were knowledgeable and aware of the difference between aquaculture products and products originating from the wild.
9.2.2 Aquaculture Product CharacteristicsThe wholesale buyers were well aware of the positive product attributes associated with aquaculture products, including: - Consistency of supply, availability, consistency of quality, logistical efficiencies, and sustainability.
9.2.3 Demand for Seafood/FishAll three buyers felt that the demand for seafood was growing in South Africa. However, two qualified their statements commenting that growth was slow and in line with population growth.
9.2.4 Seafood availabilityAll three buyers were of the opinion that availability of various seafood types was not an issue. One commented that the “price-driven” South African market restricted the local availability of certain seafood types, not the availability of the seafood products per se.
Responses were mixed on whether the demand for fresh seafood exceeded the supply. One buyer felt demand exceeded supply, another did not, and a third said it was a price linked issue.
When asked if there were any unavailable seafood types they would like to purchase, no products were listed by the buyers. Products in short supply in included kob and linefish in general, locally caught hake and sole.
9.2.5 Shift to Aquaculture ProductsTwo of the three buyers felt there was a shift to aquaculture products in certain categories, compared to wild products.
9.2.6 Farmed Versus Wild CaughtTwo buyers stated that their choice of seafood type was not influenced by whether the product originated from the wild or whether it is an aquaculture product, and one stated that it was.
9.2.7 Aquaculture products purchasedAquaculture products featured prominently in the mix of products purchased by the wholesale buyers, and included: shrimp/prawns, mussels, oysters, salmon, trout, tilapia, and basa pangasins (Vietnamese catfish) (Table 9.4). Aquaculture products dominated the top three products sold by the seafood wholesalers who responded to the survey (Table 9.5). Most aquaculture products purchased were imported (shrimp/prawns, mussels, salmon, tilapia and basa pangasins), with a small volume of local aquaculture products purchased (mussels, oysters, trout).
9.2.8 Informing the CustomerAll three wholesale seafood enterprises informed their customers whether the seafood products originated from aquaculture products or the wild.
2009 AISA Aquaculture Benchmarking Survey
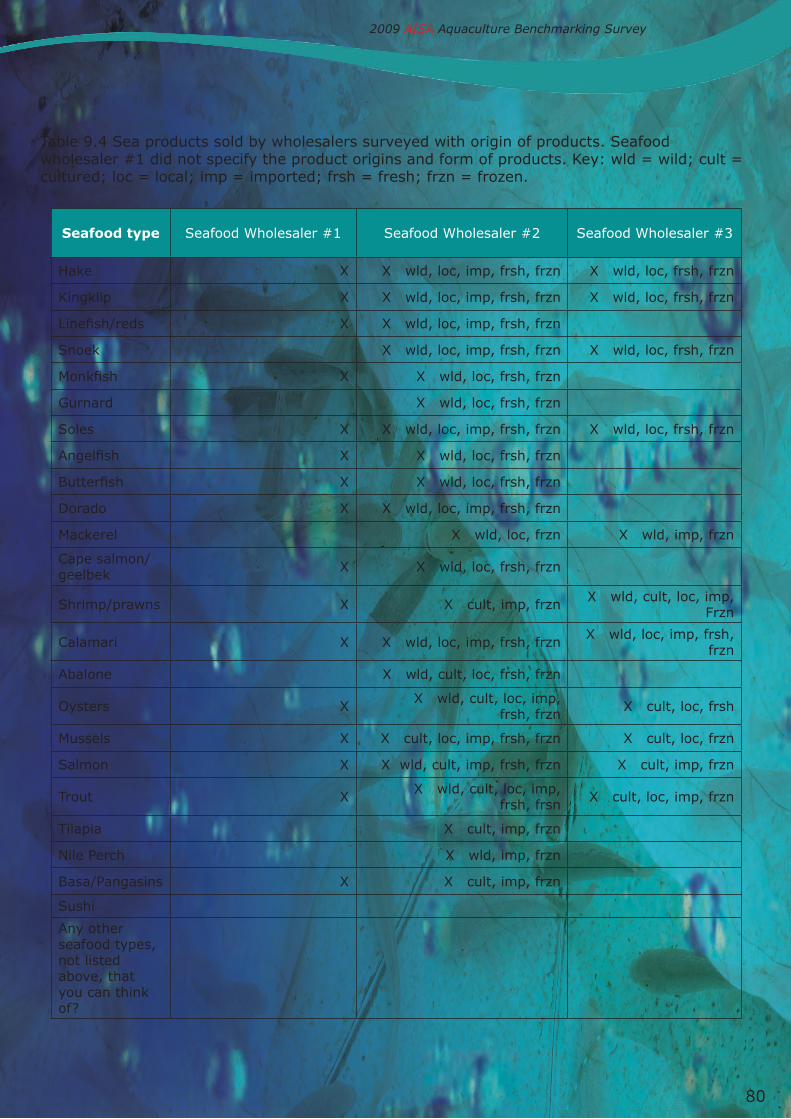
80
Table 9.4 Sea products sold by wholesalers surveyed with origin of products. Seafood wholesaler #1 did not specify the product origins and form of products. Key: wld = wild; cult = cultured; loc = local; imp = imported; frsh = fresh; frzn = frozen.
seafood type Seafood Wholesaler #1 Seafood Wholesaler #2 Seafood Wholesaler #3
Hake X X wld, loc, imp, frsh, frzn X wld, loc, frsh, frzn
Kingklip X X wld, loc, imp, frsh, frzn X wld, loc, frsh, frzn
Linefish/reds X X wld, loc, imp, frsh, frzn
Snoek X wld, loc, imp, frsh, frzn X wld, loc, frsh, frzn
Monkfish X X wld, loc, frsh, frzn
Gurnard X wld, loc, frsh, frzn
Soles X X wld, loc, imp, frsh, frzn X wld, loc, frsh, frzn
Angelfish X X wld, loc, frsh, frzn
Butterfish X X wld, loc, frsh, frzn
Dorado X X wld, loc, imp, frsh, frzn
Mackerel X wld, loc, frzn X wld, imp, frzn
Cape salmon/ geelbek X X wld, loc, frsh, frzn
Shrimp/prawns X X cult, imp, frzn X wld, cult, loc, imp, Frzn
Calamari X X wld, loc, imp, frsh, frzn X wld, loc, imp, frsh, frzn
Abalone X wld, cult, loc, frsh, frzn
Oysters X X wld, cult, loc, imp, frsh, frzn X cult, loc, frsh
Mussels X X cult, loc, imp, frsh, frzn X cult, loc, frzn
Salmon X X wld, cult, imp, frsh, frzn X cult, imp, frzn
Trout X X wld, cult, loc, imp, frsh, frsn X cult, loc, imp, frzn
Tilapia X cult, imp, frzn
Nile Perch X wld, imp, frzn
Basa/Pangasins X X cult, imp, frzn
Sushi
Any other seafood types, not listed above, that you can think of?
2009 AISA Aquaculture Benchmarking Survey

81
Table 9.5 Top three selling types of wholesale seafood, with product origin.
9.2.9 Seafood attributes determining purchase decisionsFreshness, quality, appearance and availability were ranked as extremely important determinants of the wholesale seafood suppliers buying decisions (Table 9.6). Eco-friendliness, price and product form were regarded as important product attributes. Nutritional value, preparation time and low-fat content were ranked to be less important.
9.2.10 Fresh versus FrozenThe ratio of fresh versus frozen seafood also varied greatly between seafood wholesalers. One only dealt in frozen seafood; a second sold 50% frozen and 50% fresh; while the third sold 80% fresh seafood and 20% frozen.
Table 9.6 Rating of factors determining seafood purchase decisions by wholesale buyers. Buyers were asked the question: “When buying fish/seafood products, how important are the following factors to you when making your decision?”. “Importance” was rated on a scale of 1-10 (1= not important; 10 = extremely important).
9.2.11 Proportion of imported and local products purchasedThe ratio of local to imported seafood purchased by wholesale buyers varied. One buyer reported 70% imported to 30% local, a second 2% imported to 98 local, and the third did not specify a proportion
9.2.12 Sushi All three buyers reported that sushi consumption was increasing. One ascribed the trend to a growing consumer awareness of healthy eating.
9.2.13 Smoked Seafood ProductsDemand for smoked products was reported to be steady, mainly for traditional smoked snoek products.
question seafood wholesaler #1
seafood wholesaler #2
seafood wholesaler #3
Please list your top 3 best selling seafood types:
1:Norwegian salmon (cultured, imported)2: Prawns (wild or cultured, imported)3: Oysters (cultured, local)
No 1: Oysters (cultured, local)No 2: Mussels (cultured, local?)No 3: Salmon trout (cultured, local?)
No 1: Hake (wild, local)No 2: Prawns (cultured, imported)No 3: Calamari (wild, imported)
Product attribute seafood wholesaler #1
seafood wholesaler #2
seafood wholesaler #3
freshness 10 10 10
quality 10 10 10
Appearance 10 10 10
Availability 8 10 10
eco-friendliness 8 10 8
Price 6 9 8
Product form 1 8 10
nutritional value 4 3 8
Prep time 4 2 5
low in saturated fat 1 1 8
2009 AISA Aquaculture Benchmarking Survey
82
9.2.14 Awareness of International Seafood TrendsTrends listed included healthier eating, sustainable eating, an increase in aquaculture innovation, more reliance on aquaculture, more competition, higher quality. Countries setting trends were listed as Europe and Asia.
9.2.15 South African Seafood TrendsThe same trends as listed above for international seafood trends were listed. When asked whether international trends were influencing South Africa, one buyer stated: “yes”: one “no”; and a third “don’t know – I suppose so”.
9.2.16 Colour of Trout and SalmonThe pink colour of trout and salmon was deemed an important product characteristic by all three wholesale seafood buyers. One stated that the colour was an indicator of quality as well as taste. One stated that it was because the customer associates the pink colour with quality and lacks product knowledge, and the third stated it was important for their sushi products.
9.3 supermarket buyers
Of the four supermarket buyers contacted, two responses were received.
9.3.1 Aquaculture awarenessThe supermarket buyers were knowledgeable and aware of the difference between aquaculture products and products originating from the wild. One buyer stated that her buying decisions were influenced by whether product was farmed or wild caught, while the others were not.
9.3.2 Aquaculture Product CharacteristicsThe supermarket buyers cited some of the positive product attributes associated with aquaculture products, including:- Consistency of supply, supplemental supply to wild fisheries, and “takes pressure off the sea”. Quality advantages associated with aquaculture products were not mentioned.
9.3.3 Demand for Seafood/FishOne buyer was of the opinion that the demand for seafood was “increasing” in South Africa, while the other commented that demand in his market was “stable”.
9.3.4 Seafood availabilityBoth buyers stated that the demand for fresh seafood exceeded the supply. Both buyers listed seafoods which were currently unavailable which they would like to purchase, including: tuna, smoked snoek, and fresh fish in general.
9.3.5 Shift to Aquaculture ProductsBoth buyers felt there was not a shift to aquaculture products compared to wild products in South Africa.
9.3.6 Farmed Versus Wild CaughtOne buyer stated that the choice of seafood type was not influenced by whether the product originated from the wild or whether it is an aquaculture product, and one stated that it was.
9.3.7 Aquaculture products purchasedFewer aquaculture products were sold in the supermarket surveyed compared to the restaurants and seafood wholesalers. Aquaculture products purchased by the supermarket buyers, and included: shrimp/prawns, mussels, oysters, salmon, and trout (Table 9.4). Salmon was the only aquaculture product in the top three seafood products sold by the supermarkets who responded to the survey (Table 9.5).
2009 AISA Aquaculture Benchmarking Survey
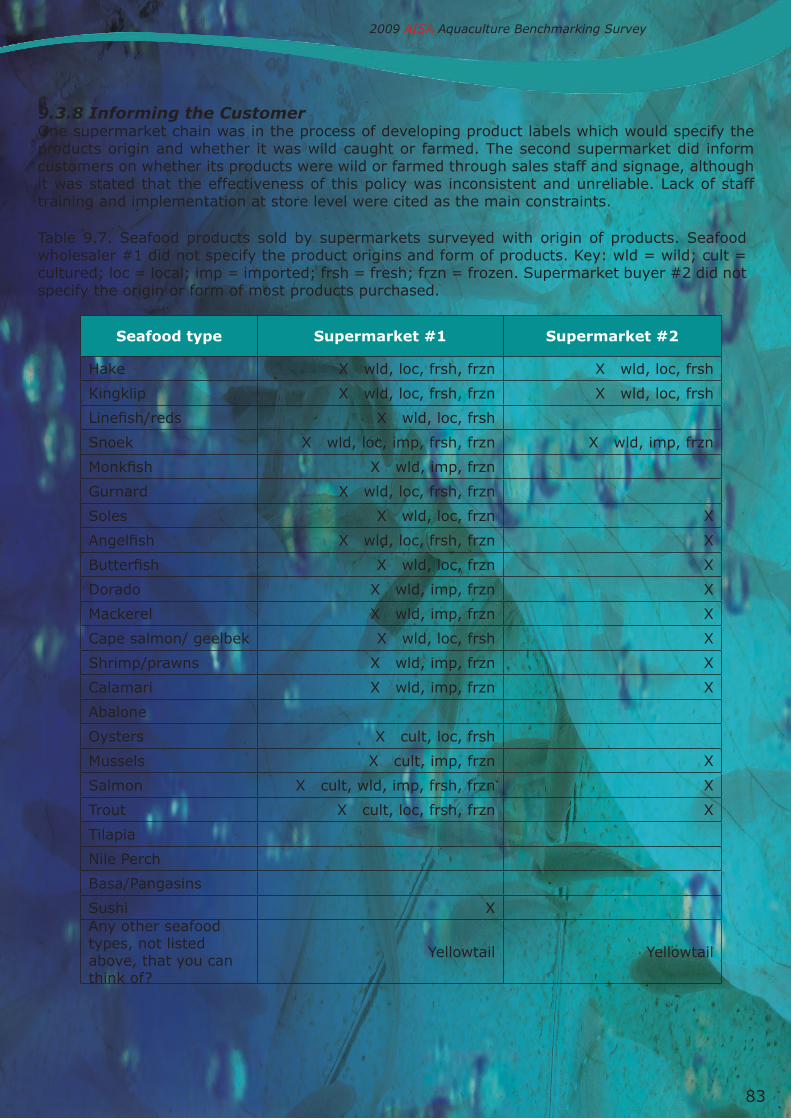
83
9.3.8 Informing the CustomerOne supermarket chain was in the process of developing product labels which would specify the products origin and whether it was wild caught or farmed. The second supermarket did inform customers on whether its products were wild or farmed through sales staff and signage, although it was stated that the effectiveness of this policy was inconsistent and unreliable. Lack of staff training and implementation at store level were cited as the main constraints.
Table 9.7. Seafood products sold by supermarkets surveyed with origin of products. Seafood wholesaler #1 did not specify the product origins and form of products. Key: wld = wild; cult = cultured; loc = local; imp = imported; frsh = fresh; frzn = frozen. Supermarket buyer #2 did not specify the origin or form of most products purchased.
seafood type supermarket #1 supermarket #2
Hake X wld, loc, frsh, frzn X wld, loc, frsh
Kingklip X wld, loc, frsh, frzn X wld, loc, frsh
Linefish/reds X wld, loc, frsh
Snoek X wld, loc, imp, frsh, frzn X wld, imp, frzn
Monkfish X wld, imp, frzn
Gurnard X wld, loc, frsh, frzn
Soles X wld, loc, frzn X
Angelfish X wld, loc, frsh, frzn X
Butterfish X wld, loc, frzn X
Dorado X wld, imp, frzn X
Mackerel X wld, imp, frzn X
Cape salmon/ geelbek X wld, loc, frsh X
Shrimp/prawns X wld, imp, frzn X
Calamari X wld, imp, frzn X
Abalone
Oysters X cult, loc, frsh
Mussels X cult, imp, frzn X
Salmon X cult, wld, imp, frsh, frzn X
Trout X cult, loc, frsh, frzn X
Tilapia
Nile Perch
Basa/Pangasins
Sushi XAny other seafood types, not listed above, that you can think of?
Yellowtail Yellowtail
2009 AISA Aquaculture Benchmarking Survey
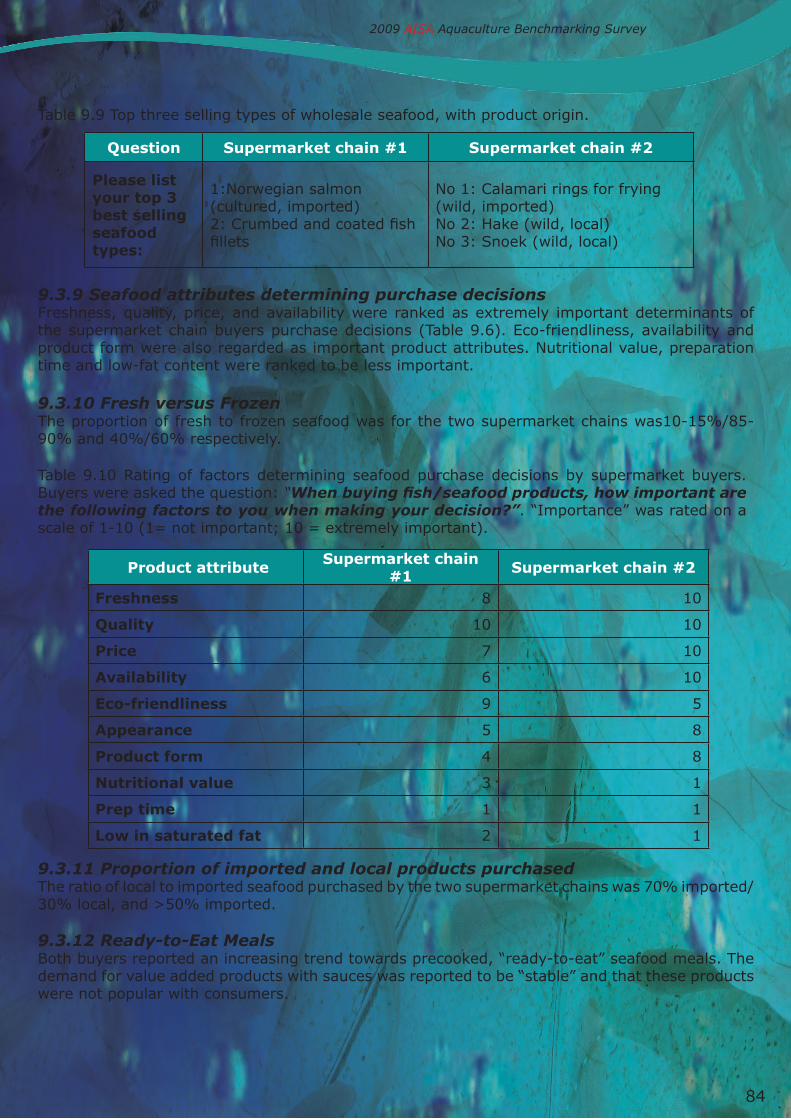
84
Table 9.9 Top three selling types of wholesale seafood, with product origin.
9.3.9 Seafood attributes determining purchase decisionsFreshness, quality, price, and availability were ranked as extremely important determinants of the supermarket chain buyers purchase decisions (Table 9.6). Eco-friendliness, availability and product form were also regarded as important product attributes. Nutritional value, preparation time and low-fat content were ranked to be less important.
9.3.10 Fresh versus FrozenThe proportion of fresh to frozen seafood was for the two supermarket chains was10-15%/85-90% and 40%/60% respectively.
Table 9.10 Rating of factors determining seafood purchase decisions by supermarket buyers. Buyers were asked the question: “When buying fish/seafood products, how important are the following factors to you when making your decision?”. “Importance” was rated on a scale of 1-10 (1= not important; 10 = extremely important).
9.3.11 Proportion of imported and local products purchasedThe ratio of local to imported seafood purchased by the two supermarket chains was 70% imported/ 30% local, and >50% imported.
9.3.12 Ready-to-Eat MealsBoth buyers reported an increasing trend towards precooked, “ready-to-eat” seafood meals. The demand for value added products with sauces was reported to be “stable” and that these products were not popular with consumers.
question supermarket chain #1 supermarket chain #2
Please list your top 3 best selling seafood types:
1:Norwegian salmon (cultured, imported)2: Crumbed and coated fish fillets
No 1: Calamari rings for frying (wild, imported)No 2: Hake (wild, local)No 3: Snoek (wild, local)
Product attribute supermarket chain #1 supermarket chain #2
freshness 8 10
quality 10 10
Price 7 10
Availability 6 10
eco-friendliness 9 5
Appearance 5 8
Product form 4 8
nutritional value 3 1
Prep time 1 1
low in saturated fat 2 1
2009 AISA Aquaculture Benchmarking Survey

85
9.3.12 Sushi One buyer reported that the demand for sushi products was increasing, but also stabilising in existing markets. The second did not express an opinion.
9.3.13 Smoked Seafood ProductsOne buyer responded that a demand existed for smoked products but supply was constrained by the lack of “high risk” suppliers. The second stated that it was important to get the recipes right.
9.3.14 Awareness of International Seafood TrendsTrends listed included an expected shift to aquaculture products and the establishment of sustainability certification schemes such as the MSC (Marine Stewardship Council). Europe was mentioned as an international seafood trend setter.
9.3.15 South African Seafood TrendsOne supermarket seafood buyer observed that seafood products for frying, particularly calamari, were outselling fresh and frozen. The other buyer commented on the trend to adopting the WWF South African Sustainable Seafood Initiative.
9.3.16 Colour of Trout and SalmonOne buyer commented that the colour of trout or salmon did not affect the quality or taste and hence his buying decisions. A second commented colour was an issue because they sell a variety of salmon products to provide the consumer with what they wanted.
10. market survey implications for Aquaculture development
Key findings from the consumer and seafood buyer marketing surveys, which have implications for aquaculture development, were:
Consumers:• Consumers lack awareness of aquaculture and the associated product characteristics. Eighty-
five percent (85%) of consumers have not heard of aquaculture, and do not distinguish wild from farmed seafood/aquaculture products. If offered a choice between wild and farmed seafood products, they would choose wild – due to perceived more “natural” product qualities. Consumers in the Western Cape displayed the greatest awareness of aquaculture.
• South African consumers are conservative in their seafood choices, sticking to what they know. Black consumers are the most conservative in their seafood product choices, but displayed a strong growth in seafood buying compared to other race groups.
• Better educated, and higher LSM group consumers were more aware of what aquaculture was, and purchased a greater variety of seafood including sushi.
• Consumers would like more information about whether their products were farmed or imported and indicated a preference for local seafood products.
• Fifty-four percent (54%) of consumers felt the “pink” colour of salmonid flesh was important, associating it with “freshness”. Among consumers with tertiary education, 64% felt colour was important.
Seafood buyers:• Seafood buyers for restaurants, wholesalers, and supermarkets, were familiar with
aquaculture products and their positive product characteristics. They expected a greater proportion of the market to be supplied by aquaculture products in the future.
• Buyers do not distinguish between aquaculture and wild products, but buy on the basis of required product characteristics. They generally do not inform the customer whether a product is of farmed or wild origin.
• Aquaculture products feature prominently in the mix of products purchased by restaurants and wholesale seafood outlets. Fewer aquaculture products are stocked by supermarkets,
2009 AISA Aquaculture Benchmarking Survey

86
which sell mainly frozen, wild seafood products. The highest selling aquaculture products are imported products, namely, salmon, prawns and mussels.
• The supply of certain wild seafood products was becoming increasing limited, particularly items such as fresh tuna and linefish.
• Restaurant and seafood wholesale buyers would purchase more aquaculture products, particularly fresh products, if they were available.
• Seafood buyers were aware of seafood sustainability issues, and generally supported awareness and labelling schemes such as SASSI, and the MSC certification in their purchase choices. Aquaculture products were perceived as a potentially sustainable supply of seafood.
The surveys confirmed that the seafood market is in a period of transition, with declining supplies of traditional local wild fish, and increasing market share by imported wild and cultured products. There is an opportunity for local cultured products to gain a greater market share in the fresh, high value product markets. It is unlikely that locally cultured products will be competitive in the frozen, commodity type product niches – with the possible exception of mussels. There is a trend to pre-cooked, ready to eat products in supermarkets, which aquaculture producers may be able to exploit.The conservatism of consumers in their seafood choices in general, probably constrains the diversity of seafood products sold, and the growth of the local sea food market. That said, there is a trend amongst better educated and higher LSM group consumers towards being more adventurous in their seafood choices, for example, with the purchase of sushi and fresh salmon products. The lack of awareness of aquaculture in particular, is a cause for concern, which may lead to misperceptions about aquaculture. Consumer education will assist in promoting awareness and acceptance of aquaculture products. The growth in seafood buying amongst more affluent black consumers, is an encouraging trend which can be encouraged through education and promotion of aquaculture products. The consumer preference for local seafood products is a further market characteristic that can be harnessed to the benefit of aquaculture.
The survey showed that South African seafood suppliers are buying into the concept of sustainable seafood, and sustainability is becoming important in purchase decisions. Aquaculture products were regarded as potentially sustainable products, although consumers and buyers were aware of some of the negative health and environmental associations with intensively farmed products. Therefore, if the aquaculture industry establishes itself as a credible source of sustainable seafood, this should help to secure market share in the future.
Based on the consumer and seafood buyer surveys, the following recommendations are suggested:
10.1 Initiate a consumer Aquaculture Awareness and Education Campaign (AAEC). As part of this Campaign, AISA should further its collaboration with the WWF to include Aquaculture products on the SASSI programme .
10.2 Promote a greater awareness of the positive attributes of aquaculture products amongst South African consumers.
10.3 Increase aquaculture production to supply market demand for fresh products such as linefish and trout.
10.4 Promote schemes which provide evidence of the sustainability of South African aquaculture, so that consumers can choose aquaculture products knowing that they are environmentally sustainable. 10.5 In general, when the market survey gets repeated it should have a greater sample size of buyers section and it should include face-to-face interviews. More provinces should also be serveyed
2009 AISA Aquaculture Benchmarking Survey

87
11. recommendations for Promoting growth of the Aquaculture sector
The AISA Aquaculture Benchmarking Survey of primary production and markets yielded data and opinions from producers, consumers and seafood buyers, which indicate critical interventions required to promote the growth of the aquaculture sector in South Africa. These are summarised under headings below.
11.1 A Comprehensive set of industrial support measures
Since the Aquaculture Sector is not a mature sector as yet, transaction costs and risk is higher than in other sectors. In order to kick start investment and develop a competitive Aquaculture Sector, the governments in many other countries provide support measures to pioneer farmers and innovative enterprises. While there have been some support measures for aquaculture development by the South African government, they have been largely uncoordinated and ad hoc. A more comprehensive set of support measures and industrial incentives will be required if aquaculture is to develop to its full potential (Britz, 2007). South Africa’s National Industrial Policy Framework provides principles for government to develop comprehensive sets of support measures for sectors with high growth potential. Previously, aquaculture enterprises found it very difficult to access incentive schemes such as the SMEDP. They were really aimed at medium size enterprises and specialist consultants were required to complete the applications. A customised set of incentives with a facilitated, user-friendly interface is required to deliver them to the aquaculture sector.
To this end it needs to recognise that due to the lack of an established services sector, aquaculture businesses often need to be vertically integrated - which requires an economy of scale precluding the entry of small enterprises. Transaction costs tend to be comparatively high;- reducing competitiveness. Australia and Chile have recognised this problem and provided support by means of a capital subsidy for “Joint Industry Actions”. i.e. if a group of companies jointly invest in the establishment of a service that promotes industry development (e.g. a company for health management, feed manufacture, marketing etc), a 50% capital subsidy is provided.
Further support measures are outlined below and by Britz (1997).
11.2 support for small Aquaculture enterprise development
A shock finding of the survey was that the aquaculture sector is not conducive to small business development due to the strict regulatory environment which is not aligned with sector development initiatives, lack of technical support, and skills development. There is no single intervention or quick fix to address this problem and further investigation and analysis should be undertaken to better understand the issues and to develop solutions.
Suggested interventions to create less disabling environment for small enterprise development include:
11.2.1 Partnerships with Established Aquaculture Ventures.This is a key intervention that has been successful in a number of instances. Established businesses are often seeking more product, have established market channels and technical expertise and are willing to partner with small producers. An incentive for promoting this form of partnership should be considered by the state, for example, in Australia a larger company mentoring a smaller one receives a lower tax rate on its profits from its share in the smaller company. While South African taxation policy might not favour such an intervention, other forms of incentive could be considered.
2009 AISA Aquaculture Benchmarking Survey

88
11.2.2. Aquaculture Development Nodes Many of the barriers to entry by small business, particularly the environmental planning aspects and technical support measures, can be overcome by the establishment of aquaculture development nodes where land is re-zoned for aquaculture farming activities. There is broad consensus both in industry and government that access to land and water for concentrated development within aquaculture development nodes is essential for stimulating investment into the aquaculture sector, and for opening up sufficient land and water for growing production. Development nodes, analogous to industrial parks are economically efficient, lend themselves to efficient service provision and are environmentally desirable as they promote concentrated development and discourage ad hoc, geographically dispersed operations which tend to conflict with other activities.
11.2.3. Small Farmer Development SchemesAlthough the concept of Community Public Private Partnership (CPPP) comes with its own set of problems, this model does provide a solution/option through which access into the Aquaculture Sector can be open to a broader audience. The case studies (Botes, et al., 2006) of Masiza Mussel farmers and the Hands On Cooperative are examples from which to learn.
It is recommended that the existing schemes be provided with ongoing support to overcome weaknesses, and that new opportunities be sought in partnership with established aquaculture enterprises.
11.2.4 Recognise and Support Ornamental Fish AquacultureThe survey revealed that ornamental fish production is a viable small business enterprise with a ready local market, but that producers were frustrated by a lack of government recognition and support as it was not recognised as a “farming” activity and a means to food security. Permitting was also an issue in terms of imports and NEMBA.
It is therefore recommended that Department of Agriculture support for aquaculture not be limited to food fish, but be extended to ornamental fish. Facilitated processes to streamline permitting by the new Department of Agriculture and Fisheries (DAFF) and Department of Water and Environmental Affairs (DWEA) are required. Ornamental fish farming is conducive to small farmer development schemes such as the Department of Trade and Industry’s Technology for Sustainable Livelihoods programme.
11.3 facilitated Compliance with environmental legislation
The survey confirmed the findings of Britz (1997) who stated: “Compliance with environmental legislation is now seen as the single most significant constraint to aquaculture development by industry. Industry representatives frequently express desperation at meetings with government regarding the increasingly onerous requirements of environmental legislation. Large and medium sized companies with outstanding human resources and good corporate governance find it difficult, and very costly, to comply with environmental legislation; and for many small and medium size enterprises it is simply too onerous and costly. The former DEAT and nature conservation agencies are aware of the problem, but since they lack an industry development orientation, they do little more than listen sympathetically and insist on compliance. Many environmental managers are against aquaculture in principle, are reactive, and will do nothing pro-actively to assist industry to meet environmental requirements. Clearly, this is a major issue that needs a more systematic approach and pro-active intervention by government if aquaculture sector growth is to occur on any scale.”
2009 AISA Aquaculture Benchmarking Survey

89
To overcome the problem, Britz (1997) stated: “There is no simple solution to the problem as environmental legislation affects all stages of development of an aquaculture operation. A range of pro-active interventions by government are possible to open the way for investment into aquaculture. These include:
• Strategic environmental assessments to evaluate where best to situate aquaculture development nodes which have the lowest environmental impact and minimal conflict with other activities.
• Self-regulation through best management practise (BMP) schemes such as the Quality and Health Management Programme (QHMP) for the Western Cape.
• Guidelines on the use of exotic species, which species are acceptable, where they can be farmed and under what circumstances. Risk assessments required by the National Environmental Management: Biodiversity Act for the use of exotic species are expensive and time consuming. Consideration should thus be given to a grant from government to undertake risk assessments in areas earmarked for strategic aquaculture development.
• Traceability and certification schemes to market indigenous species on the local market. Fishery managers within the former DEAT are in principle against the sale of cultured indigenous species on the local market as they maintain they can be used as a front for the sale of wild poached product. Government should be pro-active in developing traceability schemes to open local markets for producers.
• Environmental impact assessments (EIA’s). Even rudimentary EIA’s can easily cost several hundred thousand rands which is a significant deterrent to small and medium size enterprise development. An EIA grant for aquaculture development in preferred areas should be considered to stimulate investment and promote SME’s.
• Transport and sale permits. The movement of products governed by a need for permits. Industry frequently experiences frustration at the non-availability of officials when they require routine permits. A more efficient, service orientated permit system is required.
• Water quality and product monitoring. The SABS and government require frequent water quality and product testing. While the costs of this can be absorbed by large and medium size enterprises, the cost (typically over R100, 000 per year) is simply too high for small enterprises. Therefore, grant assistance from the state should be considered for small enterprises such as oyster, abalone and trout out growers.”
11.4 veterinary services
The survey revealed an urgent need for veterinary services to support aquaculture sector development similar to that available to the Agricultural sector. For example, farm health management programmes are essential for effective production, and disease and drug free certification is a Hazard Alert Critical Control Point (HACCP) requirement for the export of products to the European Union (EU). The SABS expects guarantees in this regard from the state veterinary services. Therefore, developing this capacity within veterinary services is a priority. The abalone industry funds its own water quality management programme and health management programme, but smaller aquaculture SME’s cannot afford this. Assistance should really be forthcoming from the state to promote industrial competitiveness in this regard. For example, in Chile if a group of companies approaches the state with a common goal such as this, grant assistance is available for setting up the required service.
11.5. support freshwater Aquaculture research
The survey revealed that while marine aquaculture enterprises were relatively well provided with research to develop technology, support for freshwater aquaculture R&D was almost non-existent. Producers were seeking innovative means to improve production systems such as recirculation. A lack of capacity to undertake research in the aquatic health field was a concern.
2009 AISA Aquaculture Benchmarking Survey

90
As aquaculture is technology driven and environment specific, it is therefore recommended that a fresh water aquaculture research programme be established under the auspices of the DAFF and the Department of Science and Technology (DST). Research programmes should be supported by technology transfer initiatives. Encouragingly, the Water Research Commission is supporting research into the more efficient utilisation of freshwater resources for aquaculture.
11.6 water Zoning, infrastructure and services for marine fish farming
The survey confirmed that marine fish aquaculture shows the greatest potential for growth in the short to medium term and has attracted significant investor interest. The main barriers to entry are the lack of zoned waters for cage culture and suitable shore based infrastructure.
Therefore it is recommended that:• Strategic environmental assessments be conducted to zone waters for marine
aquaculture.• Provide critical infrastructure. e.g. facilities at ports to service cages offshore.• Provide capital subsidies for critical services which will benefit more than one company e.g.
service vessels, feed manufacture, health services.• Environmental certification and biosecurity is becoming paramount for market access.
Government should facilitate certification schemes to meer European Union standards.• A Government hatchery would create opportunities for smaller Aquaculture entrepreneurs
to enter the industry.• Government veterinary capacity is essential for product certification.
Water quality monitoring and achieving EU accreditation were seen as important government led interventions which could assist the development of the oyster industry.
11.7 Access to finance
Access to finance was ranked highly by both marine and freshwater producers as a critical intervention promote aquaculture sector development. In particular a government supported aquaculture loan fund is required to encourage investment into the sector.
11.8 Promotion of aquaculture education, training and skills development
The shortage of aquaculture skills, particularly technical skills at the farm worker and middle management level remain a fundamental constraint to aquaculture enterprise development. A comprehensive support strategy for training, similar to the Western Cape Skills development and Training Programme (STP), is required both at national and provincial level.
11.9 Promotion of south African Aquaculture Products
The low awareness of aquaculture products by consumers in the local market, combined with the need to promote a distinct South African identity for aquaculture products in the export market, emphasises the need to promote consumer awareness South African aquaculture products generically. As previously suggested, a consumer Aquaculture Awareness and Education Campaign (AAEC) should be initiated by AISA and supported by means of a multi-stakeholder fashion.
11.10 Promote increased Aquaculture Production to supply market demand for fresh fish
The market survey showed that increasing amounts of fresh salmon were being imported into South Africa as the local demand for fresh fish could not be met from the South African fishery or aquaculture sector. Buyers confirmed there was scope for growth in cultured linefish and trout.
2009 AISA Aquaculture Benchmarking Survey
91
11.11 Promote Aquaculture sustainability schemes
The marketing survey revealed that the market is moving to products which are certified as sustainable. For South African aquaculture products to be competitive, evidence of the sustainability will increasingly be required. Support for initiatives which assist producers to demonstrate their environmental sustainability is thus recommended. An example of such initiatives is the Quality and Health Management Programme (QHMP) of the Western Cape where the WWF are part of the QHMP steering committee.
11.12 A national strategy and Coordinated government support
The survey revealed that uncoordinated government support (including regulations and permitting which are not coordinated between departments) was a source of great frustration to producers as it inhibited investment and development. In particular, there was a “disconnect” between departments responsible for the implementation of environmental legislation and those responsible for economic development. Further issues around mandates arose around the roles and responsibilities of the new DAFF and DWEA.
It is therefore recommended that:
1. A national policy/strategy for aquaculture development be drafted which defines the roles and responsibilities of national and provincial departments in promoting aquaculture development.
2. Particular attention be paid to overcoming the constraints to development posed by legislation. It is clear that compliance with environmental regulations is often beyond the means of the individual enterprise, and requires facilitated and coordinated action by both the economic development and environmental management clusters of government.
2009 AISA Aquaculture Benchmarking Survey

92
12. references
Botes, L, Thompson, G and Louw, R. 2006 Benchmarking Survey of the South African Aquaculture (Marine & Freshwater) Sector. AISA report. 95p. Available in pdf at www.ai-sa.org.za under “Publications: reports”
Botes, L Thompson, G and Louw, R. 2006 Transformation in the Aquaculture industry: Two case studies investigating empowerment and enterprise development. AISA report. Available in pdf at www.ai-sa.org.za under “Publications: reports”
Britz, P.J. 2007. A Study on the Status of Aquaculture Production and Trade in South Africa. Volume 2: Growth Potential of the South African Aquaculture Industry and Recommendations for Sector Development. A report for the Department of Trade and Industry produced by Enviro-Fish Africa (Pty.) Ltd. 24p.
2009 AISA Aquaculture Benchmarking Survey
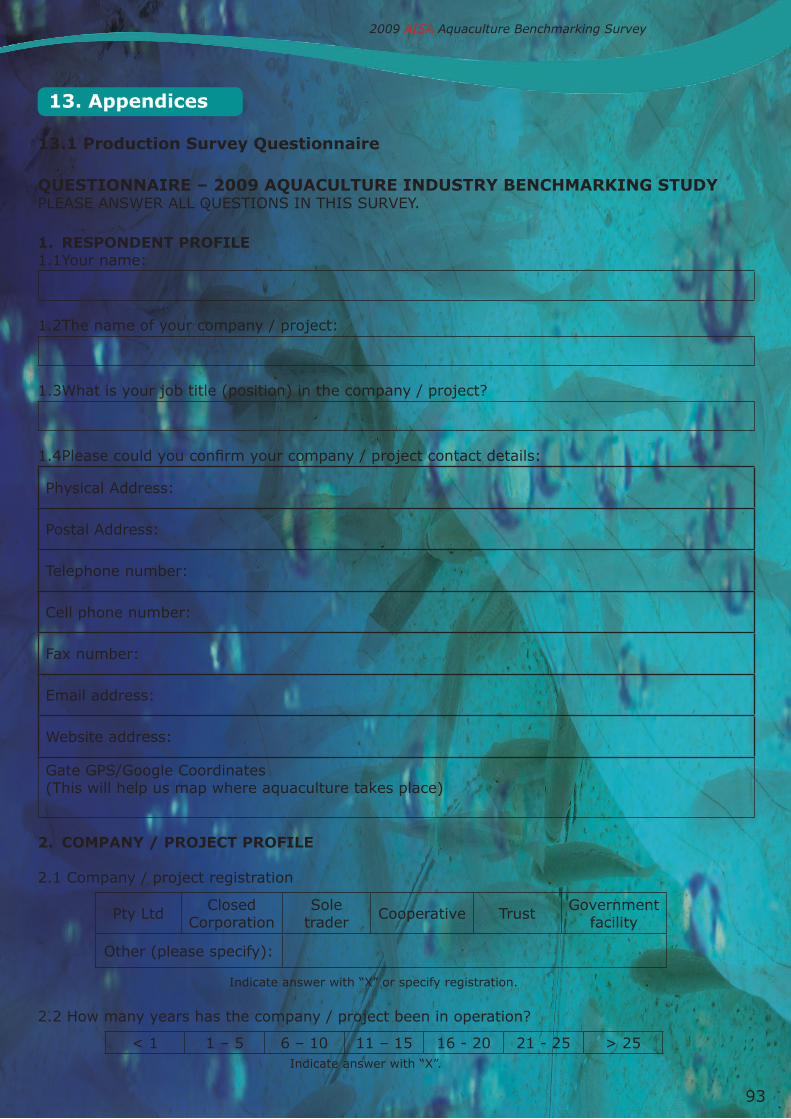
93
13. Appendices
13.1 Production survey questionnaire
quesTionnAire – 2009 AquACulTure indusTry benChmArking sTudyPLEASE ANSWER ALL QUESTIONS IN THIS SURVEY.
1. resPondenT Profile1.1 Your name:
1.2 The name of your company / project:
1.3 What is your job title (position) in the company / project?
1.4 Please could you confirm your company / project contact details:
Physical Address:
Postal Address:
Telephone number:
Cell phone number:
Fax number:
Email address:
Website address:
Gate GPS/Google Coordinates(This will help us map where aquaculture takes place)
2. ComPAny / ProJeCT Profile
2.1 Company / project registration
Indicate answer with “X” or specify registration.
2.2 How many years has the company / project been in operation?
Indicate answer with “X”.
Pty Ltd Closed Corporation
Sole trader Cooperative Trust Government
facility
Other (please specify):
< 1 1 – 5 6 – 10 11 – 15 16 - 20 21 - 25 > 25
2009 AISA Aquaculture Benchmarking Survey
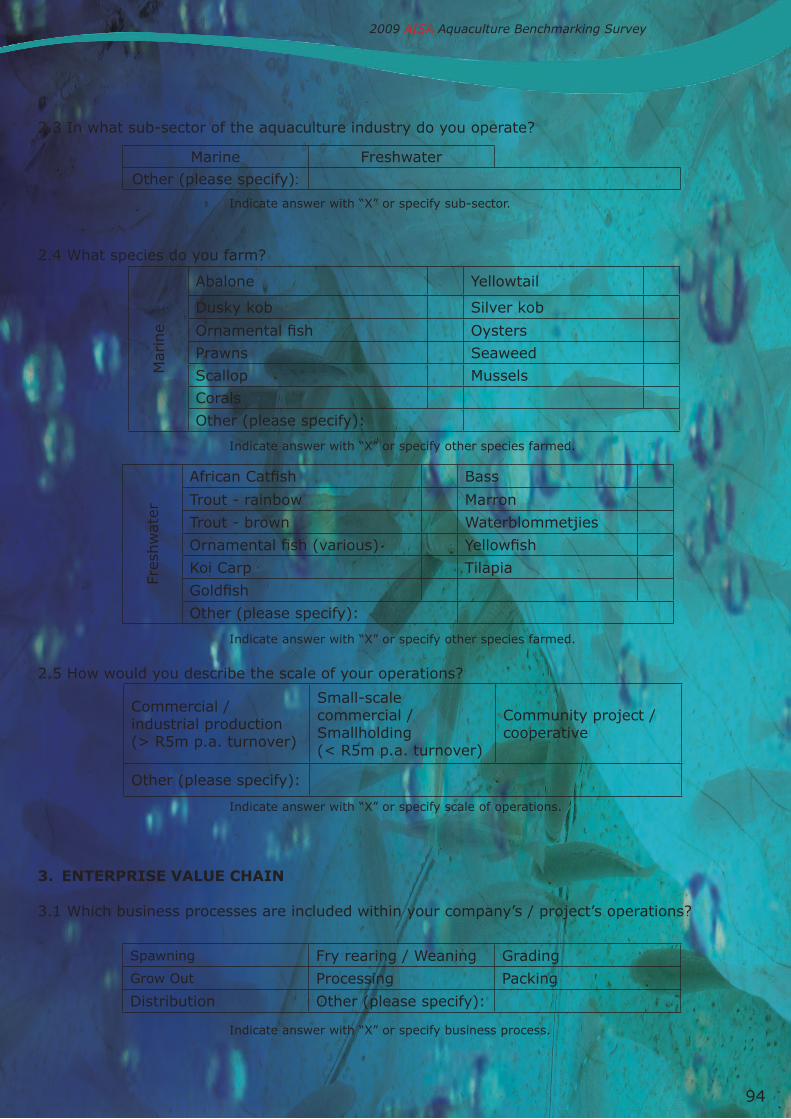
94
2.3 In what sub-sector of the aquaculture industry do you operate?
Indicate answer with “X” or specify sub-sector.
2.4 What species do you farm?
Indicate answer with “X” or specify other species farmed.
Indicate answer with “X” or specify other species farmed.
2.5 How would you describe the scale of your operations?
Indicate answer with “X” or specify scale of operations.
3. enTerPrise vAlue ChAin
3.1 Which business processes are included within your company’s / project’s operations?
Indicate answer with “X” or specify business process.
2009 AISA Aquaculture Benchmarking Survey
Marine Freshwater
Other (please specify):
Mar
ine
Abalone Yellowtail
Dusky kob Silver kob
Ornamental fish Oysters
Prawns Seaweed
Scallop Mussels
Corals
Other (please specify):
Fres
hw
ater
African Catfish Bass
Trout - rainbow Marron
Trout - brown Waterblommetjies
Ornamental fish (various) Yellowfish
Koi Carp Tilapia
Goldfish
Other (please specify):
Commercial /industrial production(> R5m p.a. turnover)
Small-scale commercial / Smallholding(< R5m p.a. turnover)
Community project / cooperative
Other (please specify):
Spawning Fry rearing / Weaning Grading
Grow Out Processing Packing
Distribution Other (please specify):

95
2009 AISA Aquaculture Benchmarking Survey
4. vAlue And volume of ProduCTion
4.1 What were the total volumes (in metric tonnes or units*) and the total values (annual turnover) of production of species for the years 2000 - 2005?
*In the case of ornamental fish, oysters and fingerlings, please indicate individuals produced.
4.2 Is your company / project operating at full capacity (100%)? If no, please indicate percentage capacity utilisation for production:
Indicate answer with “X”.
5. mArkeTs (domesTiC, eXPorT And imPorT)
5.1 Please indicated the percentage volume and value of production per species supplied to the domestic market:
*In the case of ornamental fish and oysters, please indicate units produced.
5.2 If you export, when did you begin exporting?
Year Species Volume(metric tonnes)*
Value(R’s)
Total (%)
2008
2007
2006
2005
>10% 20% 30% 40% 50% 60% 70% 80% 90% 100%
Market Species % Volume(metric tonnes)*
Eastern Cape
Free State
Gauteng
KwaZulu Natal
Limpopo Province
Mpumalanga
Northern Cape
North West
Western Cape
Species Year
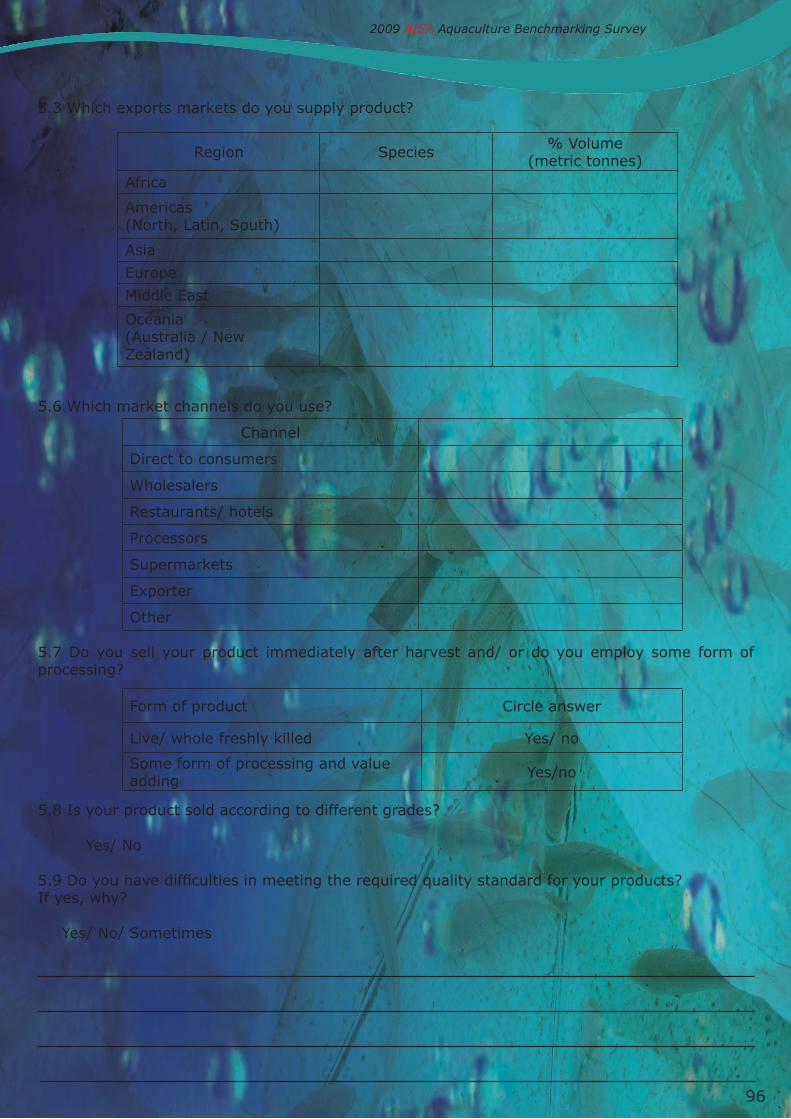
96
2009 AISA Aquaculture Benchmarking Survey
Channel
Direct to consumers
Wholesalers
Restaurants/ hotels
Processors
Supermarkets
Exporter
Other
5.3 Which exports markets do you supply product?
5.6 Which market channels do you use?
5.7 Do you sell your product immediately after harvest and/ or do you employ some form of processing?
5.8 Is your product sold according to different grades?
Yes/ No
5.9 Do you have difficulties in meeting the required quality standard for your products? If yes, why?
Yes/ No/ Sometimes
Form of product Circle answer
Live/ whole freshly killed Yes/ no
Some form of processing and value adding Yes/no
Region Species % Volume(metric tonnes)
Africa
Americas(North, Latin, South)
Asia
Europe
Middle East
Oceania(Australia / New Zealand)

97
2009 AISA Aquaculture Benchmarking Survey
Options:
Producer sets price
Auction
Bargain and negotiate with buyer
Other (specify)
YearProfessional Skilled Middle
Services Semi-skilled Unskilled Total
B C I W B C I W B C I W B C I W B C I W2008
2007
2006
2005
YearProfessional Skilled Middle
Services Semi-skilled Unskilled Total
B C I W B C I W B C I W B C I W B C I W2008200720062005
5.10 How is the price of your product determined?
5.11 Do you undertake any specific marketing activities to increase sales?
Yes/ No/ Sometimes
5.10 Does government/ public sector agencies play any role in linking you, or your sub-sector, to markets?
Yes/ No/ Don’t know
5.11 What are the biggest challenges in marketing your products?
6. emPloymenT
6.1 What are your past, current and future year-on-year permanent employment trends per skill level* and historical racial classification**? (A permanent employee works full-time for the company / project).
Please indicate number of employees per category per year.* Definitions: professional = upper management, scientist; Skilled = technicians, artisans; middle services = clerical, semi-skilled = secondary, some secondary education, unskilled = no formal training.
** As per Statistics South Africa categories: B = Black South Africans, C = Coloured, I = Indian, and W = White.
6.2 What are your past, current and future year-on-year temporary employment trends per skill level and historical racial classification? (A temporary employee works for the company / project on a part-time basis or as per seasonal requirements, e.g. harvesting).
Please indicate number of employees per category per year.

98
2009 AISA Aquaculture Benchmarking Survey
Jan Feb Mar Apr May Jun Jul Aug Sept Oct Nov Dec
Domestic Investment and Loans
Foreign investment
Foreign aid
Government Assistance
Private Capital
Barriers to entry 1 2 3 4 5
Environmental regulatory requirements (e.g. EIAs)
Site selection (zoning, leasing, discharge permits)
Processing (SABS approval, public health issues, bans on exports)
Tariffs for imports (protect domestic market)
Permitting (time takes to issue, farming and capture of fish)
Extension services
Access to finance
Access to skilled labour
Access to Research and Technology Development
6.3 Please indicated which months of the year you use part-time (temporary) employees:
Indicate answer with “X”.
7. blACk eConomiC emPowermenT Circle answer
7.1 Are you aware of the new BEE scorecard system and its accompanying criteria?
Yes/ No
7.2 Have you calculated a score for your enterprise?
Yes/ No/ Don’t need one – less than R5 million turnover
8. enTerPrise develoPmenT
8.1 Please indicate your current sources of financing:
Indicate answer with “X”.
8.2 Please rate the importance of the following constraints that your company / project currently faces in running an aquaculture operation:
Rating: 1 = not important, 2 = little importance, 3 = neutral, 4 = some importance, 5 = very important.
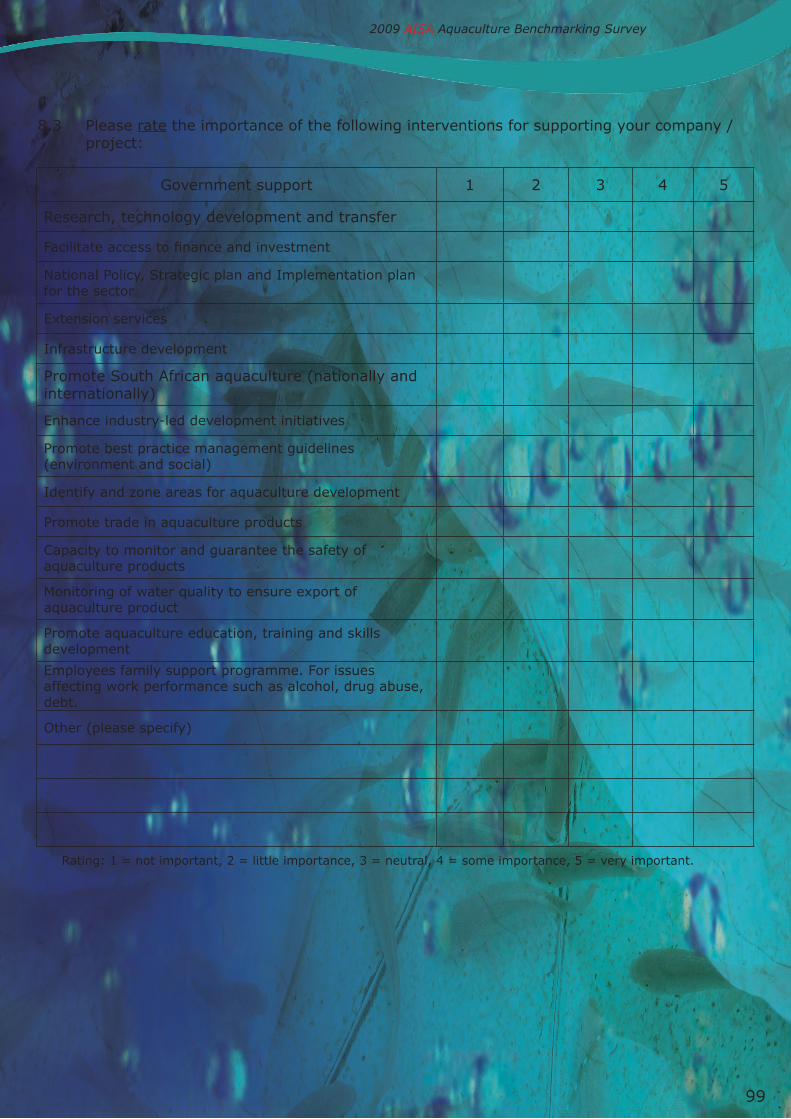
99
2009 AISA Aquaculture Benchmarking Survey
8.3 Please rate the importance of the following interventions for supporting your company / project:
Rating: 1 = not important, 2 = little importance, 3 = neutral, 4 = some importance, 5 = very important.
Government support 1 2 3 4 5
Research, technology development and transfer
Facilitate access to finance and investment
National Policy, Strategic plan and Implementation plan for the sector
Extension services
Infrastructure development
Promote South African aquaculture (nationally and internationally)
Enhance industry-led development initiatives
Promote best practice management guidelines (environment and social)
Identify and zone areas for aquaculture development
Promote trade in aquaculture products
Capacity to monitor and guarantee the safety of aquaculture products
Monitoring of water quality to ensure export of aquaculture product
Promote aquaculture education, training and skills development
Employees family support programme. For issues affecting work performance such as alcohol, drug abuse, debt.
Other (please specify)
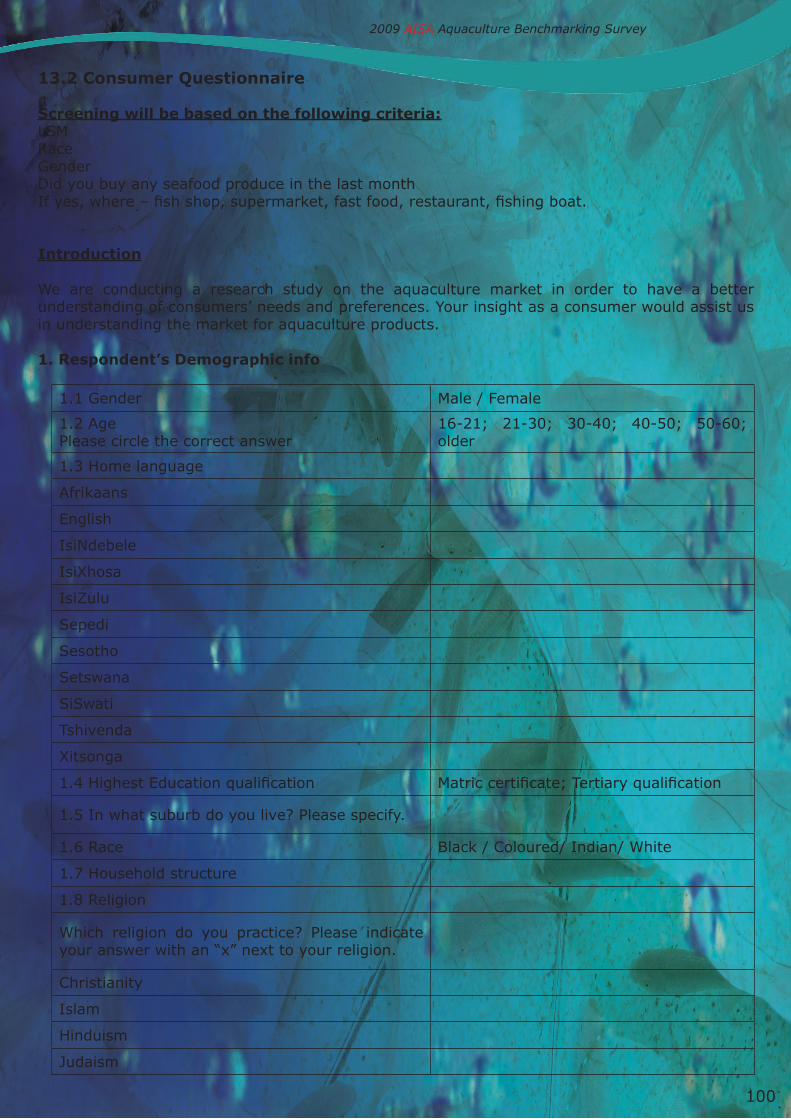
100
2009 AISA Aquaculture Benchmarking Survey
13.2 Consumer questionnaire
screening will be based on the following criteria:LSMRaceGenderDid you buy any seafood produce in the last monthIf yes, where – fish shop, supermarket, fast food, restaurant, fishing boat.
introduction
We are conducting a research study on the aquaculture market in order to have a better understanding of consumers’ needs and preferences. Your insight as a consumer would assist us in understanding the market for aquaculture products.
1. respondent’s demographic info
1.1 Gender Male / Female
1.2 AgePlease circle the correct answer
16-21; 21-30; 30-40; 40-50; 50-60; older
1.3 Home language
Afrikaans
English
IsiNdebele
IsiXhosa
IsiZulu
Sepedi
Sesotho
Setswana
SiSwati
Tshivenda
Xitsonga
1.4 Highest Education qualification Matric certificate; Tertiary qualification
1.5 In what suburb do you live? Please specify.
1.6 Race Black / Coloured/ Indian/ White
1.7 Household structure
1.8 Religion
Which religion do you practice? Please indicate your answer with an “x” next to your religion.
Christianity
Islam
Hinduism
Judaism

101
2009 AISA Aquaculture Benchmarking Survey
Buddhism
Other
None
1.8.2 Do you think that religion influence your purchasing seafood?
1.9 Average monthly household income? Please circle your preferred answer.
Per month:R5000- R15 000; R15 000 – R25000; R25 000- R50 000; more than R50 000
1.10 Are you responsible for doing most of the grocery shopping for your household? Please circle your correct answer. Yes / No
2. Purchasing behaviour
2.1 Please indicate what type of seafood you bought in during the
past month? Please mark correct answer with an
“x”.
when dining in? when eating out?
Hake
Kingklip
Linefish/reds
Snoek
Monkfish
Gurnard
Soles
Angelfish
Butterfish
Dorado
Mackerel
Cape salmon/geelbek
Shrimp/prawns
Calamari
Abalone
Oysters
Mussels
Salmon
Trout
What would you like to buy
Other, please specify.

102
2009 AISA Aquaculture Benchmarking Survey
2.2 Rank from 1 to 3 the importance of the following three products in your diet.
1= plays biggest part;2= plays 2nd biggest part3= plays 3rd biggest part
Poultry
Meat
Seafood
2.3.1 Have you heard of the word “aquaculture”? Please circle your correct answer. Yes / No
2.3.2 If yes, what is your understanding of the word “aquaculture”? If no. Let me give you a short definition of aquaculture also referred to as aquafarming. It is the farming of freshwater and seawater organisms.
2.4 On a scale from 1 to 10 please rate how important it is to you whether you buy wild or farmed seafood?
1= not at all important 10 = extremely important
2.5.1 Do you prefer wild, or farmed seafood, or no preference?
2.5.1 Please explain why you gave this answer
2.6 On a scale from 1 to 10 please rate how important it is to you to have information, on whether seafood originated from the wild or was farmed.
1= not at all important 10 = extremely important
2.7.1 On a scale from 1 to 10 please rate how important it is to you whether you buy local or imported seafood?
1= not at all important 10 = extremely important
2.7.2 On a scale from 1 to 10 please rate how important it is to you to have information on whether the seafood you buy is local or imported.
1= not at all important 10 = extremely important
2.8 If you are in a supermarket how important are the following factors to you when deciding on a seafood product? Please rate from 1 to 10 the importance of the below factors
1= not at all important; 10= extremely important
Freshness
Nutritional value
Appearance
Quality

103
2009 AISA Aquaculture Benchmarking Survey
Price
Eco-friendliness
Availability
Preparation time
low in saturated fat?
2.9.1 When you buy trout and salmon is it important to you what shade of colour the fish is? Yes / No
2.9.2 If yes, why do you say this?
2.10 When buying seafood products in the supermarket do you tend to stick to products that you are familiar with? Please circle your preferred answer. Yes / No
2.11 Please rank meat, poultry and seafood according to their affordability, from 1 to 3?
1= most affordable3= least affordable
3. Product form, packaging and processing The following questions only relate to consumers’ purchase behaviour within the supermarket context.
3. 1 do you buy fresh seafood? Yes / No
3.1.1 If yes, why?
3.1.2 If yes, how often? Sometimes, Most of the time, Always
3.1.3 If no, why?
3.2 do you buy frozen seafood Yes / No
3.2.1 If yes, why?
3.2.2 If yes, how often? Sometimes, Most of the time, Always
3.2.3 If no why?
3.3 Do you buy whole fish Yes / No
3.3.1 If yes, why?
3.3.2 If yes, how often? Sometimes, Most of the time, Always
3.3.3 If no, why?
3.4 do you buy cutlets? Yes / No
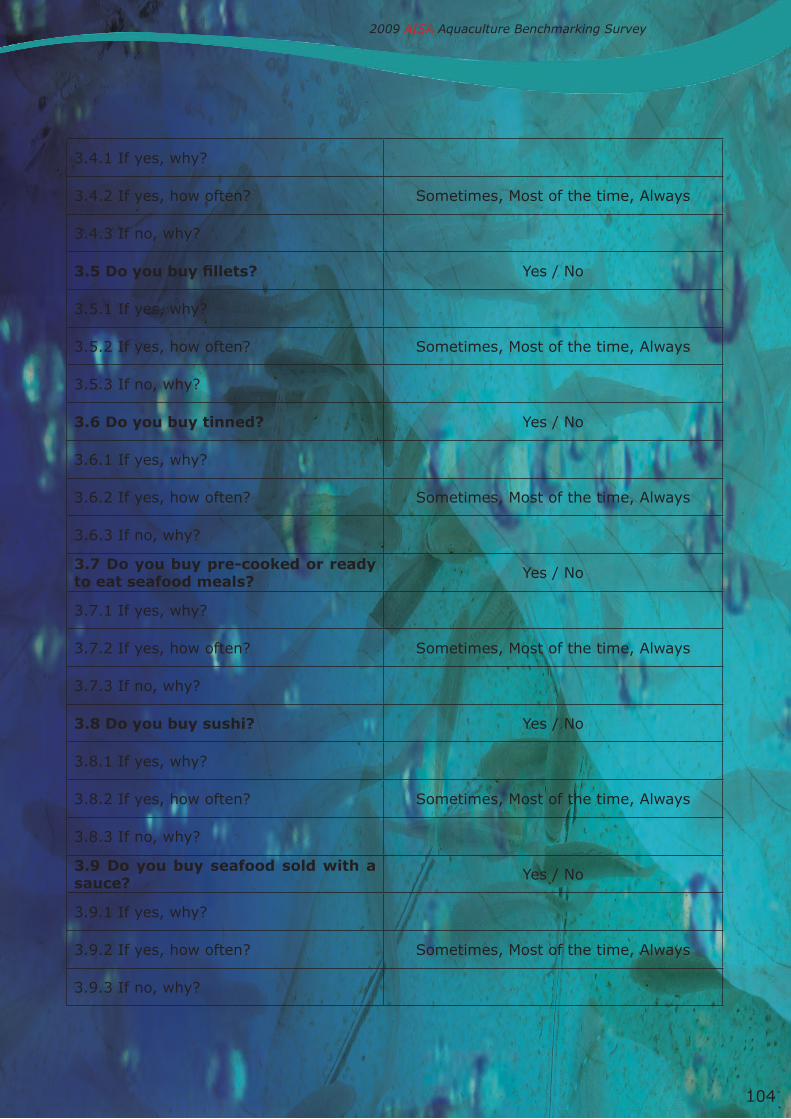
104
2009 AISA Aquaculture Benchmarking Survey
3.4.1 If yes, why?
3.4.2 If yes, how often? Sometimes, Most of the time, Always
3.4.3 If no, why?
3.5 Do you buy fillets? Yes / No
3.5.1 If yes, why?
3.5.2 If yes, how often? Sometimes, Most of the time, Always
3.5.3 If no, why?
3.6 do you buy tinned? Yes / No
3.6.1 If yes, why?
3.6.2 If yes, how often? Sometimes, Most of the time, Always
3.6.3 If no, why?
3.7 do you buy pre-cooked or ready to eat seafood meals? Yes / No
3.7.1 If yes, why?
3.7.2 If yes, how often? Sometimes, Most of the time, Always
3.7.3 If no, why?
3.8 do you buy sushi? Yes / No
3.8.1 If yes, why?
3.8.2 If yes, how often? Sometimes, Most of the time, Always
3.8.3 If no, why?
3.9 do you buy seafood sold with a sauce? Yes / No
3.9.1 If yes, why?
3.9.2 If yes, how often? Sometimes, Most of the time, Always
3.9.3 If no, why?

105
2009 AISA Aquaculture Benchmarking Survey
13.3 restaurant seafood buyers questionnaire
introduction
We are conducting a research study on the aquaculture market in order to have a better understanding of the demand and supply of aquaculture products. Your insights would assist us in understanding the aquaculture market.
1. respondent & Company information
2. seafood purchase-behaviour
1.1 Respondent’s Name & Surname
1.2 Email address
1.3 Name of Company
1.4 Job title
1.4 Company physical address
1. 5 Your company is located in which Province(s)
Western Cape, Northern Cape, Eastern Cape, Gauteng, Limpopo, KwaZulu-Natal, Mpumalanga, North West, Free State
1.6 Company contact no
1.7 Company website address
2.1.1 Are you familiar with the term “aquaculture”? Please circle your correct answer. Yes / No
2.1.2 If yes, briefly explain to me what your understanding of “aquaculture” is?
2.1.3 If, no. Let me give you a short definition of aquaculture. Aquaculture is also referred to as aquafarming and is the farming of freshwater and seawater organisms.

106
2009 AISA Aquaculture Benchmarking Survey
2.2 Answer the following questions in terms of the seafood products that you purchase for your restaurant
Aquaculture product
originating from the wild
fresh frozen local imported
Hake
Kingklip
Linefish/reds
Snoek
Monkfish
Gurnard
Soles
Angelfish
Butterfish
Dorado
Mackerel
Cape salmon/geelbek
Shrimp/prawns
Calamari
Abalone
Oysters
Mussels
Salmon
Trout
Other, please specify
2.3 Availability
2.3.1 Do you know of any seafood types that are currently unavailable in the market that you would like to buy?
2.3.2 If so, please give examples.
2.3.3 As a buyer of aquaculture products: would you be encouraged to buy more aquaculture products if it was more readily available? Yes / No
2.3.4 If so, why? If not, why?
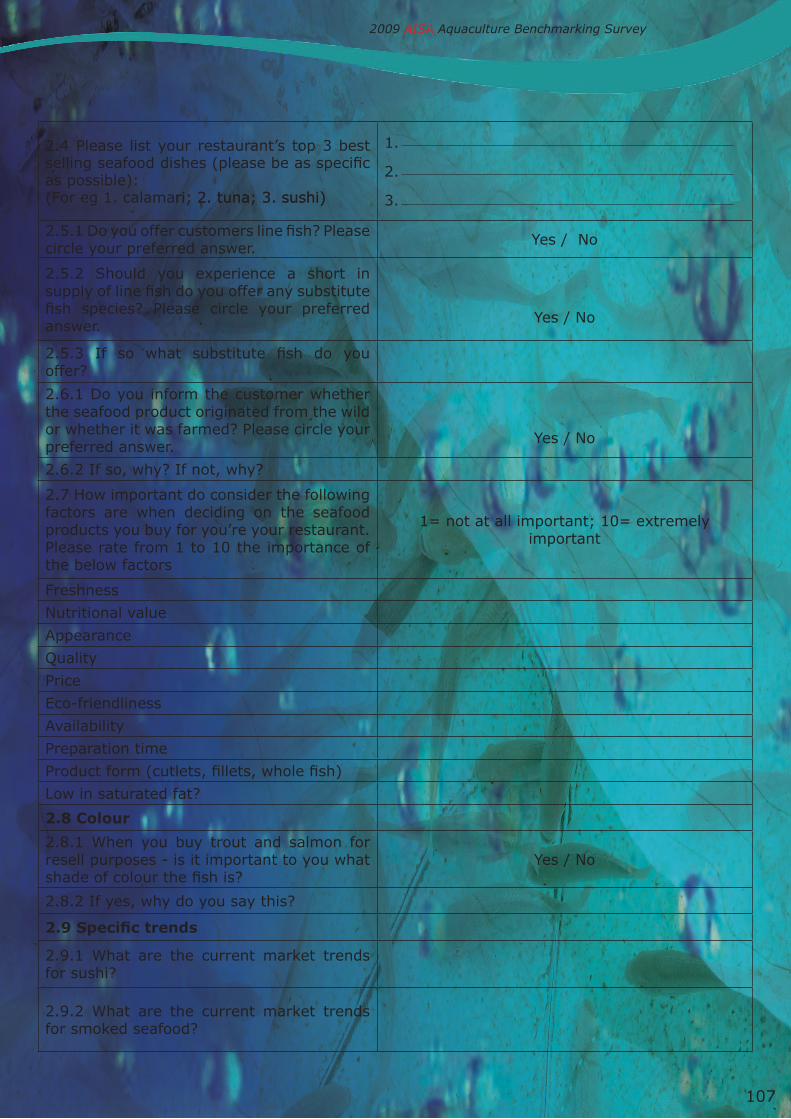
107
2009 AISA Aquaculture Benchmarking Survey
2.4 Please list your restaurant’s top 3 best selling seafood dishes (please be as specific as possible):(For eg 1. calamari; 2. tuna; 3. sushi)ri; 2. tuna; 3. sushi)
1.
2.
3.
2.5.1 Do you offer customers line fish? Please circle your preferred answer. Yes / No
2.5.2 Should you experience a short in supply of line fish do you offer any substitute fish species? Please circle your preferred answer. Yes / No
2.5.3 If so what substitute fish do you offer?
2.6.1 Do you inform the customer whether the seafood product originated from the wild or whether it was farmed? Please circle your preferred answer. Yes / No
2.6.2 If so, why? If not, why?
2.7 How important do consider the following factors are when deciding on the seafood products you buy for you’re your restaurant. Please rate from 1 to 10 the importance of the below factors
1= not at all important; 10= extremely important
Freshness
Nutritional value
Appearance
Quality
Price
Eco-friendliness
Availability
Preparation time
Product form (cutlets, fillets, whole fish)
Low in saturated fat?
2.8 Colour
2.8.1 When you buy trout and salmon for resell purposes - is it important to you what shade of colour the fish is?
Yes / No
2.8.2 If yes, why do you say this?
2.9 Specific trends
2.9.1 What are the current market trends for sushi?
2.9.2 What are the current market trends for smoked seafood?

108
2009 AISA Aquaculture Benchmarking Survey
4. Current seafood trends
Do you know what the latest trends in the seafood market are?Probing:
• What current seafood trends in the South African market are you aware of? • What seafood trends in international markets are you aware of?
• Do you think there is a greater tendency in South Africa towards aquaculture produce compared to seafood originating from the wild?
• In South Africa, are there any seafood species short in supply? If so, what species are scarce and are these wild or farmed species?

109
2009 AISA Aquaculture Benchmarking Survey
13.4 retail and supermarket buyers questionnaire
introduction
We are conducting a research study on the aquaculture market in order to have a better understanding of the demand and supply of aquaculture products. Your insights would assist us in understanding the aquaculture market.
1. respondent & Company information
2. seafood purchase-behaviour
1.1 Respondent’s Name & Surname
1.2 Email address
1.3 Name of Company
1.4 Job title
1.4 Company physical address
1. 5 Your company is located in which Province(s)
Western Cape, Northern Cape, Eastern Cape, Gauteng, Limpopo, KwaZulu-Natal, Mpumalanga, North West, Free State
1.6 Company contact no
1.7 Company website address
2.1.1 Are you familiar with the term “aquaculture”? Please circle your correct answer. Yes / No
2.1.2 If yes, briefly explain to me what your understanding of “aquaculture” is? If, no. Let me give you a short definition of aquaculture. Aquaculture is also referred to as aquafarming and is the farming of freshwater and seawater organisms.

110
2009 AISA Aquaculture Benchmarking Survey
2.2 Answer the following questions in terms of the seafood products that are currently available in your supermarket:
Aquaculture product
originating from the wild
fresh frozen local imported
Hake
Kingklip
Linefish/reds
Snoek
Monkfish
Gurnard
Soles
Angelfish
Butterfish
Dorado
Mackerel
Cape salmon/geelbek
Shrimp/prawns
Calamari
Abalone
Oysters
Mussels
Salmon
Trout
Other, please specify
2.3 Availability
Do you know of any seafood types that are currently unavailable in the market that you would like to buy?
If so, please give examples.

111
2009 AISA Aquaculture Benchmarking Survey
2.4 Please list your top 3 best selling seafood types.
1.
2.
3.
2.5 Do you think that the demand for fresh seafood exceeds the supply thereof? Yes / No
2.6 Are you aware of any positive attributes associated with aquaculture products? If so, please explain why you say so.
Open-ended
2.7.1 Do you inform the customer whether the seafood product originated from the wild or whether it was farmed? Please circle your preferred answer?
Yes / No
2.7.2 If yes, why and through what channels do you inform the customer? Probe- information on packaging.
2.7.3 If no, why?
2.8 How important do consider the following factors are when deciding on the seafood products you buy to resell in your supermarket? Please rate from 1 to 10 the importance of the below factors
1= not at all important; 10= extremely important
Freshness
Nutritional value
Appearance
Quality
Price
Eco-friendliness
Availability
Product form (cutlets, fillets, whole fish)
Preparation time
Low in saturated fat?
2.9 Colour
2.9.1 When you buy trout and salmon for resell purposes - is it important to you what shade of colour the fish is?
Yes / No
2.9.2 If yes, why do you say this?

112
2009 AISA Aquaculture Benchmarking Survey
3. Product form, packaging and processing
4. general seafood trends
3.1 Could you please give me an approximate percentage of the fresh compared to frozen seafood sold per month?
3.2 Could you please give me an approximate percentage of seafood do you sell that is
3.3 Specific trends
3.3.1 What are the current market trends for tinned seafood? Probe. Is it on the increase, decrease, or stable. Ask respondent to give a few examples.
3.3.2 What are the current market trends for pre-cooked and ready to eat meals?
3.3.3 What are the current market trends for sushi?
3.3.4 What are the current market trends for smoked seafood?
3.3.5 What are the current market trends for value added products (for e.g. separate sauces sold with seafood)
Do you know what the latest seafood trends are in South Africa and internationally?Probing:
• What current seafood trends in the South African market are you aware of?
• What seafood trends in international markets are you aware of?
• Do you think there is a greater tendency in South Africa towards aquaculture produce compared to seafood originating from the wild?
• In South Africa, are there any seafood species short in supply? If so, what species are scarce and are these wild or farmed species?
• Are international trends being adopted by South Africa?
• What countries are setting the trends?
• Is South Africa setting any trends?

113
2009 AISA Aquaculture Benchmarking Survey
13.5 wholesale seafood buyers questionnaire
introduction
We are conducting a research study on the aquaculture market in order to have a better understanding of the demand and supply of aquaculture products. Your insights would assist us in understanding the aquaculture market.
1. respondent & Company information
2. seafood purchase-behaviour
1.1 Respondent’s Name & Surname
1.2 Email address
1.3 Name of Company
1.4 Job title
1.4 Company physical address
1. 5 Your company is located in which Province(s)
Western Cape, Northern Cape, Eastern Cape, Gauteng, Limpopo, KwaZulu-Natal, Mpumalanga, North West, Free State
1.6 Company contact no
1.7 Company website address
2.1.1 Are you familiar with the term “aquaculture”? Please circle your correct answer.
Yes / No
2.1.2 If yes, briefly explain to me what your understanding of “aquaculture” is? If, no. Let me give you a short definition of aquaculture. Aquaculture is also referred to as aquafarming and is the farming of freshwater and seawater organisms.
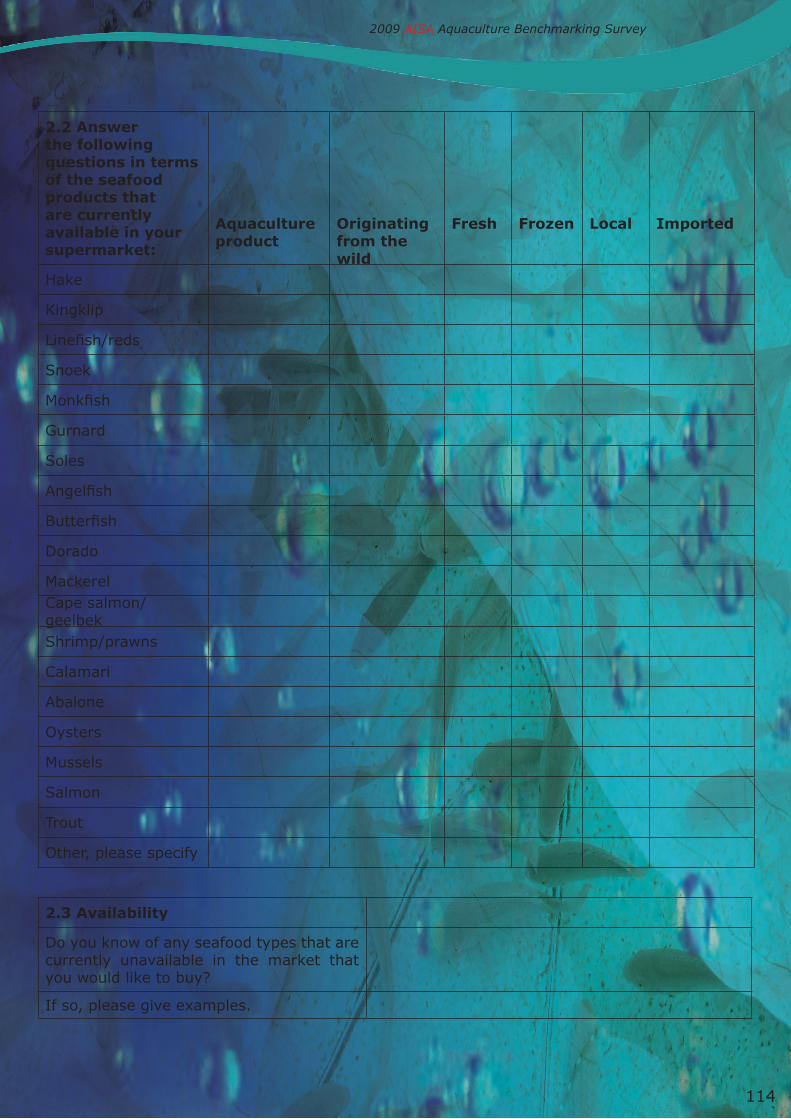
114
2009 AISA Aquaculture Benchmarking Survey
2.2 Answer the following questions in terms of the seafood products that are currently available in your supermarket:
Aquaculture product
originating from the wild
fresh frozen local imported
Hake
Kingklip
Linefish/reds
Snoek
Monkfish
Gurnard
Soles
Angelfish
Butterfish
Dorado
MackerelCape salmon/geelbekShrimp/prawns
Calamari
Abalone
Oysters
Mussels
Salmon
Trout
Other, please specify
2.3 Availability
Do you know of any seafood types that are currently unavailable in the market that you would like to buy?
If so, please give examples.

115
2009 AISA Aquaculture Benchmarking Survey
2.4 Please list your top 3 best selling seafood types.
1.
2.
3.
2.5 Do you think that the demand for fresh seafood exceeds the supply thereof? Yes / No
2.6 Are you aware of any positive attributes associated with aquaculture products? If so, please explain why you say so. Open-ended
2.7.1 Do you inform the customer whether the seafood product originated from the wild or whether it was farmed? Please circle your preferred answer? Yes / No
2.7.2 If yes, why and through what channels do you inform the customer? Probe- information on packaging.
2.7.3 If no, why?
2.8 How important do consider the following factors are when deciding on the seafood products you buy to resell in your supermarket? Please rate from 1 to 10 the importance of the below factors
1= not at all important; 10= extremely important
Freshness
Nutritional value
Appearance
Quality
Price
Eco-friendliness
Availability
Product form (cutlets, fillets, whole fish)
Preparation time
Low in saturated fat?
2.9 Colour
2.9.1 When you buy trout and salmon for resell purposes - is it important to you what shade of colour the fish is? Yes / No
2.9.2 If yes, why do you say this?

116
2009 AISA Aquaculture Benchmarking Survey
3. Product form, packaging and processing
4. general seafood trends
3.1 Could you please give me an approximate percentage of the fresh compared to frozen seafood sold per month?
3.2 Could you please give me an approximate percentage of seafood do you sell that is
3.3 Specific trends
3.3.1 What are the current market trends for tinned seafood? Probe. Is it on the increase, decrease, or stable. Ask respondent to give a few examples.
3.3.2 What are the current market trends for pre-cooked and ready to eat meals?
3.3.3 What are the current market trends for sushi?
3.3.4 What are the current market trends for smoked seafood?
3.3.5 What are the current market trends for value added products (for e.g. separate sauces sold with seafood)
Do you know what the latest seafood trends are in South Africa and internationally?Probing:
• What current seafood trends in the South African market are you aware of?
• What seafood trends in international markets are you aware of?
• Do you think there is a greater tendency in South Africa towards aquaculture produce compared to seafood originating from the wild?
• In South Africa, are there any seafood species short in supply? If so, what species are scarce and are these wild or farmed species?
• Are international trends being adopted by South Africa?
• What countries are setting the trends?
• Is South Africa setting any trends?

117
2009 AISA Aquaculture Benchmarking Survey
9 further Comments
Additional comments on industry issues that you would like to draw to our attention:
ThAnk you for your Time
For Office Use Only
* Code01 – Completed02 – Pending, additional data required03 – Incomplete04 – Rejected as not an aquaculture operation05 – Not completed as respondent not willing to participate in survey
Survey No. Researcher
Date surveyed Approval (survey status) *
Date captured Approval (capture status)

2009 AISA Aquaculture Benchmarking Survey
Aquaculture Institute of South Africa (AISA)
Postal Address: AISA, PO Box 51743, West Beach, Cape Town, South Africa, 7449Physical Address: AISA, The Avenues - Unit 3C1, Village Walk Rd, Parklands, Cape Town, South Africa
Tel: +27 (0)21 556 7339, Fax: +27 (0)21 556 4428, www.ai-sa.org.za
Vision:To be a globally competitive Aquaculture sector in the Western Cape
and in general in South Africa
Mission:To promote the integrated development of a sustainable and
equitable Aquaculture sector in the Western Cape and in general for all South Africans
Design and print: Loud Advertising


