2009 Alternative Investment Survey A closer look at the hedge fund industry March 2009 Global Markets March 2009 Hedge Fund Capital Group Marketing Material Deutsche Bank 2009 Alternative Investment Survey
Transcript
2009 Alternative Investment Survey
A closer look at the hedge fund industry
March 2009
Glo
bal
Mark
ets
Marc
h 2
009
Hed
ge F
un
d C
ap
ital
Gro
up
Mark
eti
ng
Mate
rialD
eu
tsch
e B
an
k 2
009 A
ltern
ativ
e In
vestm
en
t Su
rvey
Global Disclaimer:
This material is for discussion purposes only and is not an offer, or solicitation of an offer, to buy or sell any security or financial instrument or to participate in anytrading strategy. The information, contained herein is the Deutsche Bank’s Hedge Fund Capital Group’s summary, interpretation and analysis of the assumptions,estimates, views, predictions and opinions of the investors that participated in the 2009 Alternative Investment Survey as of the date of this publication. Norepresentation is made by Deutsche Bank that the information contained herein is accurate or complete. Any projections are based on a number of assumptions asto market conditions and there can be no guarantee that any projected results will be achieved. Past performance is not a guarantee of future results.
This material was not produced, reviewed or edited by Deutsche Bank’s Research Department. Any opinions expressed herein may differ from the opinionsexpressed by other Deutsche Bank departments including the Research Department.
The information contained in this material is provided on the basis that it is intended solely for your own internal use, and on the basis that you have such knowledgeand experience in financial and business matters to be capable of evaluating the merits and risks associated with such information.
An investment in a hedge fund or a managed account involves a significant degree of risk, which each prospective investor must carefully consider before subscribingto purchase an interest in such a fund or agreeing to establish a managed account. Returns generated from an investment in a hedge fund or a managed accountmay not adequately compensate investors for the business and financial risk assumed. Hedge funds and managed accounts are subject to those market riskscommon to other types of investments, including market volatility. Furthermore, there may be restrictions on transferring hedge fund interests. In addition, certaintrading techniques and strategies employed by hedge funds and managed accounts, such as the use of leverage, may increase the adverse impact to which aninvestment may be subject. Investors should invest in a hedge fund or open a managed account only if they are able and prepared to bear the risk of investmentlosses, including the potential loss of their entire investment.
Other risks associated with hedge funds investments include, but are not limited to, the fact that hedge funds: can be highly illiquid; are not required to provideperiodic pricing or valuation information to investors; may involve complex tax structures and delays in distributing important tax information; are not subject to thesame regulatory requirements as mutual funds; often charge higher fees and the high fees may offset the fund’s trading profits; may have a limited operating history;can have performance that is volatile; may have a fund manager who has total trading authority over the fund and the use of a single adviser applying generally similartrading programs could mean a lack of diversification, and consequentially, higher risk; may not have a secondary market for an investor’s interest in the fund andnone may be expected to develop; may have restrictions on transferring interests in the fund; and may trade a substantial portion of their trades on foreign exchanges.
“Deutsche Bank” means Deutsche Bank AG, its branches and affiliated companies as the context requires. Deutsche Bank AG, including its subsidiaries andaffiliates, does not provide legal, tax or accounting advice. This communication was prepared solely in connection with the promotion or marketing, to the extentpermitted by applicable law, of the matters addressed herein, and was not intended or written to be used, and cannot be used or relied upon, by any taxpayer forpurposes of avoiding any U.S. federal tax penalties. The recipient of this communication should seek advice from an independent tax advisor regarding any taxmatters addressed herein based on its particular circumstances. www.db.com
DEUTSCHE BANK SPECIFICALLY DISCLAIMS ALL LIABILITY FOR ANY DIRECT, INDIRECT, CONSEQUENTIAL OR OTHER LOSSES OR DAMAGES INCLUDINGLOSS OF PROFITS INCURRED BY YOU OR ANY THIRD PARTY THAT MAY ARISE FROM ANY RELIANCE ON THIS DOCUMENT OR FOR THE RELIABILITY,ACCURACY, COMPLETENESS OR TIMELINESS THEREOF.
Deutsche Bank is authorised under German Banking Law (competent authority: BaFin - Federal Financial Supervising Authority) and regulated by the FinancialServices Authority for the conduct of UK business.
115055 Global (Hedge Funds) Cover 24/3/09 10:45 am Page 1
Contents page
Key Findings 2009: Although smaller, the hedge fund industryremains resilient ................................................................. 2
Hedge Fund Managers: Evolution of terms and future pressures .......... 77
1
March 2009 2009 Alternative Investment Survey
Key Findings 2009: Although smaller, the hedgefund industry remains resilient
The hedge fund industry remains solid.
■ Hedge funds as diversifiers. For 72% of investors, diversification to otherasset classes remains the main benefit of investing in hedge funds.
■ Cash levels remain high. Respondents are sitting on $294bn of cash. In6 months’ time they expect to have reduced this to approximately $212bn. Thissuggests that $82bn of cash will be invested in the next 6 months.
■ 68% of respondents expect hedge fund assets to be down $168bn this year,taking the industry to $1.33tn.
Nevertheless, the landscape is changing.
■ Investors, like hedge funds, have de-levered. 72% of investors havereduced their exposure to leverage and 63% are not interested in applyingleverage to their own portfolios this year.
■ Continued consolidation and a premier league of hedge funds are
emerging. 50% of our respondents invest in hedge funds with an averageAUM of between $800mn - $4bn, ensuring the larger funds continue to grow,and hopefully thrive.
Recent events have made investors more attentive.
■ Risk management moves to being the second most important factor whenselecting a manager.
■ Transparency joins the top 5 manager selection criteria. Historically, investorshave indicated the “3Ps”: Performance, Philosophy and Pedigree to be themost important characteristics when selecting a manager. However, this year,Risk Management has displaced Philosophy as the second most importantcriteria and Transparency is now fourth, pushing Manager Pedigree to fifthplace.
■ Increased appetite for managed accounts. 43% of investors are nowconsidering making a proportion of their investments through managedaccounts presumably because of the additional transparency, liquidity andreporting benefits.
“Risk management isnow the second mostimportant factor forinvestors whenselecting a manager.”
“The industry is hurtbut not broken.”
2
2009 Alternative Investment Survey March 2009
Please note, the findings above are taken from investor responses to the survey.
Investment intentions.
■ Strategy preferences and predicted best performers in 2009 are: Macro,
CTA, L/S. Investors overwhelmingly predict global macro to be the bestperforming strategy, followed by CTAs and Equity L/S, perhaps pointing to theattraction of liquidity. However, these strategies were rivaled by Distressed andCredit L/S, among the least liquid.
■ The US is predicted to be best performing region this year. 46% ofinvestors think that the US will be best performing region in 2009. Eastern andCentral Europe and Russia are predicted to perform the worst.
■ Despite the fact that 71% of respondents think the markets (MSCI World) willbe down 0-<-20% this year, 92% think their own portfolios will deliver
positive performance. 40% even think they will conclude 2009 with +5 – 10%performance.
But there are still caveats.
■ Net outflows expected from the industry in 2009. Over 75% of investorsexpect there to be net outflows from the industry and 30% think theseoutflows will be over $200bn.
■ Biggest challenges facing managers in the next 12 months are primarilyredemptions.
■ How the markets behave, however, is also a huge component in how fast theindustry bounces back.
“Over 75% of investorsexpect there to be netoutflows from theindustry in 2009.”
“Investors overwhelminglypredict global macro to be the best performing strategy.”
3
March 2009 2009 Alternative Investment Survey
Acknowledgement
The Hedge Fund Capital Group would like to thank all investors that have participatedin the Deutsche Bank 2009 Alternative Investment Survey. This is now the seventhyear we have conducted the survey. The survey is one of the leading and largestglobal investor hedge fund surveys, however, it is only with the help of our investornetwork that we can accomplish this.
2008 was a difficult year for hedge funds and hedge fund investors alike. In a marketunder extreme duress, where banks and markets fail, hedge funds have of coursealso struggled. Most hedge fund strategies produced double digit losses in 2008,making it the worst year on record for hedge fund performance. Hedge funds alsosaw $155bn net outflows in 20081, as many investors headed for the sidelines orrebalanced their portfolios.
Many of the big managers that were at the forefront of the hedge fund scoreboard adecade ago are no longer there, but they have been replaced by other prominentmanagers. This is exactly the nature of the hedge fund industry: permanent self-reinvention.
The hedge fund industry is, however, going to survive. We firmly believe that theindustry size and complexion will change, and where once the industry was left muchon its own, the regulatory momentum is building. However, none of this is necessarilynegative. Market disruptions have historically always created great opportunities andit is surprising what a few months of positive performance can mean for the state ofany sector in the financial industry.
Deutsche Bank’s Hedge Fund Capital Group
Deutsche Bank’s Hedge Fund Capital Group is a global team of specialists based inLondon, New York, Hong Kong, Singapore, Tokyo and Sydney. The primary role of thegroup is to provide capital introduction services to our hedge fund clients andexpertise on investor sentiment gained through our global investor network. Thegroup also plays a strategic role, helping hedge funds and investors navigate theindustry and investor concerns.
If you would like further information on the survey, or to request a copy, pleasecontact Angharad Fitzwilliams, [email protected].
1 HFR Global Hedge Fund Industry Report – 4th Quarter, 2008
Methodology and Context
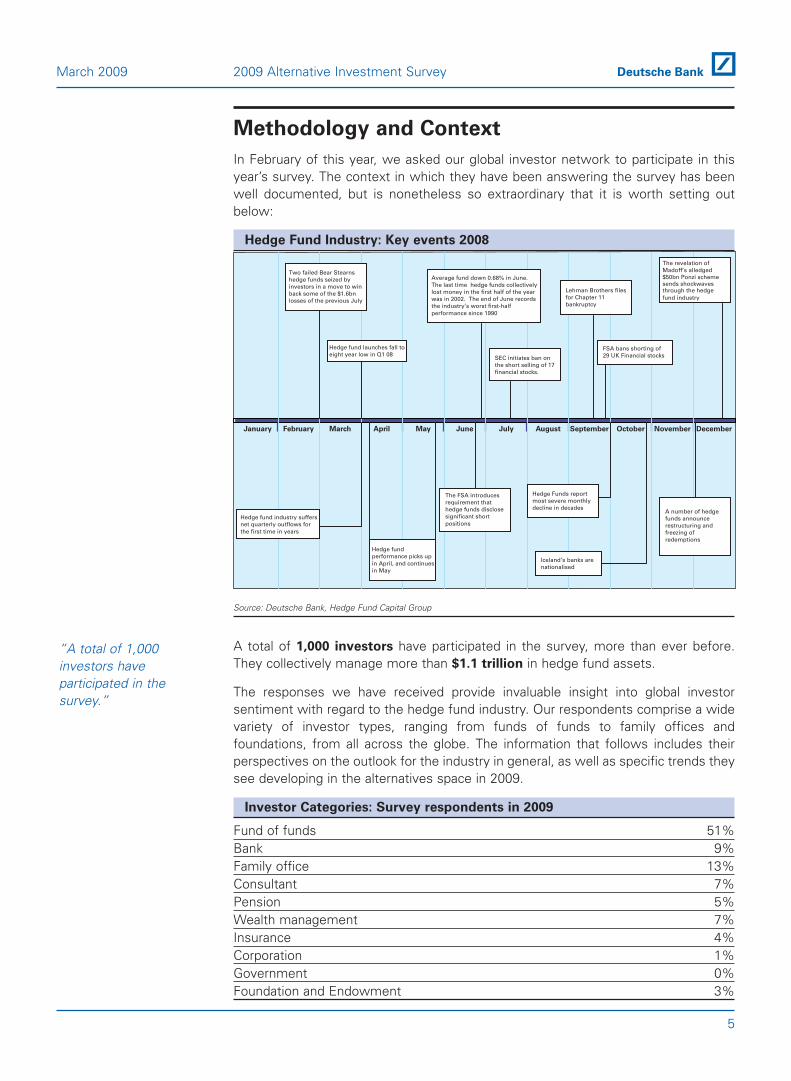
In February of this year, we asked our global investor network to participate in thisyear’s survey. The context in which they have been answering the survey has beenwell documented, but is nonetheless so extraordinary that it is worth setting outbelow:
Hedge Fund Industry: Key events 2008
Source: Deutsche Bank, Hedge Fund Capital Group
A total of 1,000 investors have participated in the survey, more than ever before.They collectively manage more than $1.1 trillion in hedge fund assets.
The responses we have received provide invaluable insight into global investorsentiment with regard to the hedge fund industry. Our respondents comprise a widevariety of investor types, ranging from funds of funds to family offices andfoundations, from all across the globe. The information that follows includes theirperspectives on the outlook for the industry in general, as well as specific trends theysee developing in the alternatives space in 2009.
Investor Categories: Survey respondents in 2009
Fund of funds 51%Bank 9%Family office 13%Consultant 7%Pension 5%Wealth management 7%Insurance 4%Corporation 1%Government 0%Foundation and Endowment 3%
“A total of 1,000investors haveparticipated in thesurvey.”
Two failed Bear Stearnshedge funds seized byinvestors in a move to winback some of the $1.6bnlosses of the previous July
Hedge fund launches fall toeight year low in Q1 08
SEC initiates ban onthe short selling of 17financial stocks.
Average fund down 0.68% in June.The last time hedge funds collectivelylost money in the first half of the yearwas in 2002. The end of June recordsthe industry’s worst first-halfperformance since 1990
Lehman Brothers filesfor Chapter 11bankruptcy
The revelation ofMadoff’s alledged$50bn Ponzi schemesends shockwavesthrough the hedgefund industry
FSA bans shorting of29 UK Financial stocks
A number of hedgefunds announcerestructuring andfreezing ofredemptions
Iceland’s banks arenationalised
Hedge Funds reportmost severe monthlydecline in decades
The FSA introducesrequirement thathedge funds disclosesignificant shortpositions
Hedge fundperformance picks upin April, and continuesin May
Hedge fund industry suffersnet quarterly outflows forthe first time in years
January February March April May June July August September October November December
5
March 2009 2009 Alternative Investment Survey
Direct Investments
Over 90% of the investors who completed the survey said they invested directly intohedge funds. In contrast, only 36% of the same group said they invested directly intofunds of funds, and 40% into private equity.
Furthermore, unlike in other areas, where investors are often looking to changestrategies or asset classes in the next 12 months, only a very small number ofrespondents were planning on changing their investment mandates. It seemsinvestors, in this more difficult environment, will be focusing on what they know andarguably do best: single strategy hedge funds and allocation to them.
Do you invest directly in the following
Source: 2009 Deutsche Bank Alternative Investment Survey
Type of organization
Source: 2009 Deutsche Bank Alternative Investment Survey
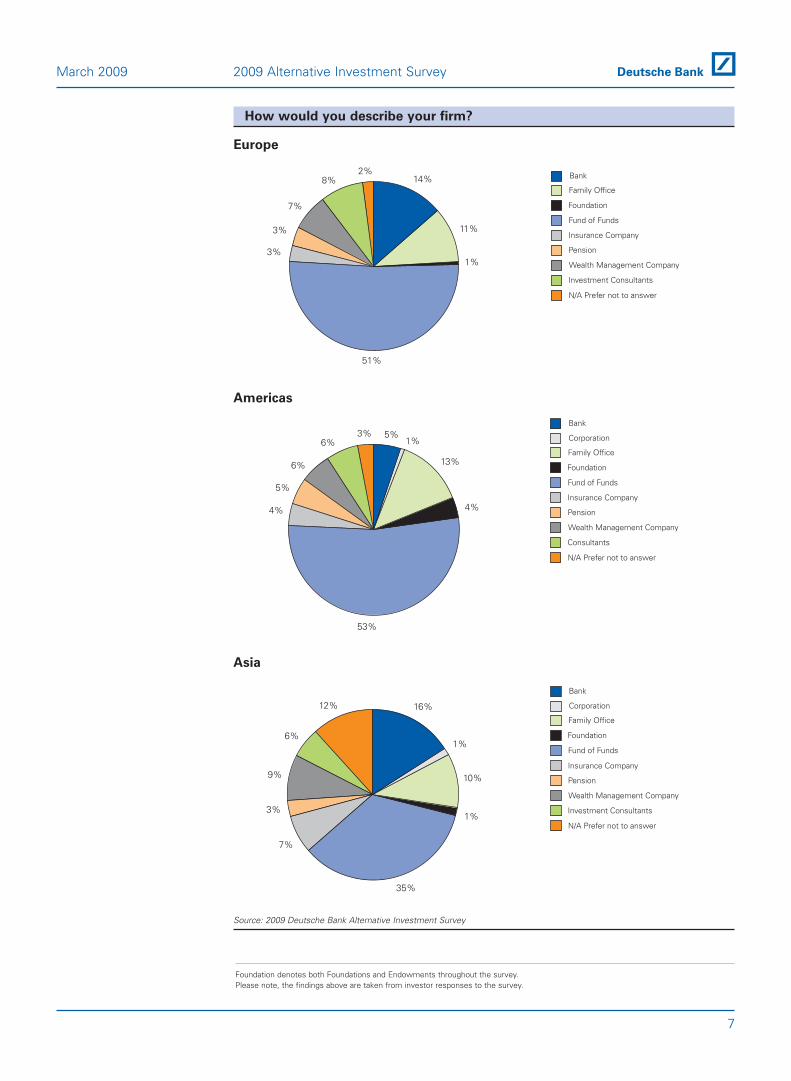
As the regional breakdown shows, the percentage of respondents made up byinvestment consultants is noticeably smaller in Asia, where banks and insurancecompanies are relatively more prevalent. The percentage of banks that completed thesurvey in the US, however, is significantly smaller than those of Europe and Asia. Thisis probably due to the higher percentage of private banks outside the US.
0
20
40
60
80
100 Government
Insurance Company
Corporation
Wealth Management Company
Fund of Funds
Foundation
Family Office/ High Net Worth
Consultant
Pension
Endowment
Bank
2002 2005 2008 2009
Year of survey
% o
f R
esp
on
den
ts
“Fund of fundscomprise almost 51%of total respondents.”
0%
20%
40%
60%
80%
100%
Private Equity
Funds of Funds
Hedge Funds
NoNot currently,but will within
the next 12 months
Yes
% o
f R
esp
on
den
ts
“Respondents will befocusing on allocatingto single strategyhedge funds.”
6
2009 Alternative Investment Survey March 2009
How would you describe your firm?
Europe
Americas
Asia
Source: 2009 Deutsche Bank Alternative Investment Survey
16%
10%
1%
1%
35%
7%
3%
9%
12%
6%
N/A Prefer not to answer
Investment Consultants
Wealth Management Company
Pension
Insurance Company
Fund of Funds
Foundation
Family Office
Corporation
Bank
5%1%
13%
4%
53%
4%
5%
6%
6%
3%
N/A Prefer not to answer
Consultants
Wealth Management Company
Pension
Insurance Company
Fund of Funds
Foundation
Family Office
Corporation
Bank
14%
11%
1%
51%
3%
3%
7%
8%2%
N/A Prefer not to answer
Investment Consultants
Wealth Management Company
Pension
Insurance Company
Fund of Funds
Foundation
Family Office
Bank
7
March 2009 2009 Alternative Investment Survey
Foundation denotes both Foundations and Endowments throughout the survey.Please note, the findings above are taken from investor responses to the survey.
8
2009 Alternative Investment Survey March 2009
9
Key Findings: In depth
10
2009 Alternative Investment Survey March 2009
Key Findings 2009: In depth
The hedge fund industry remains solid.
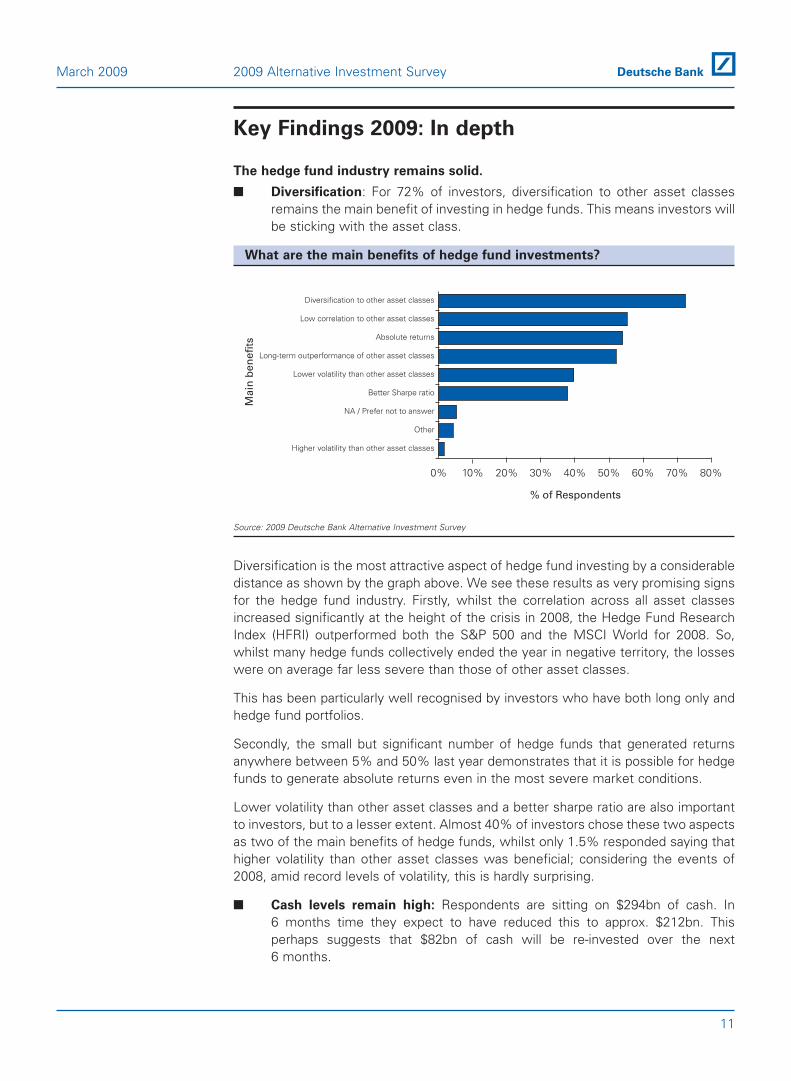
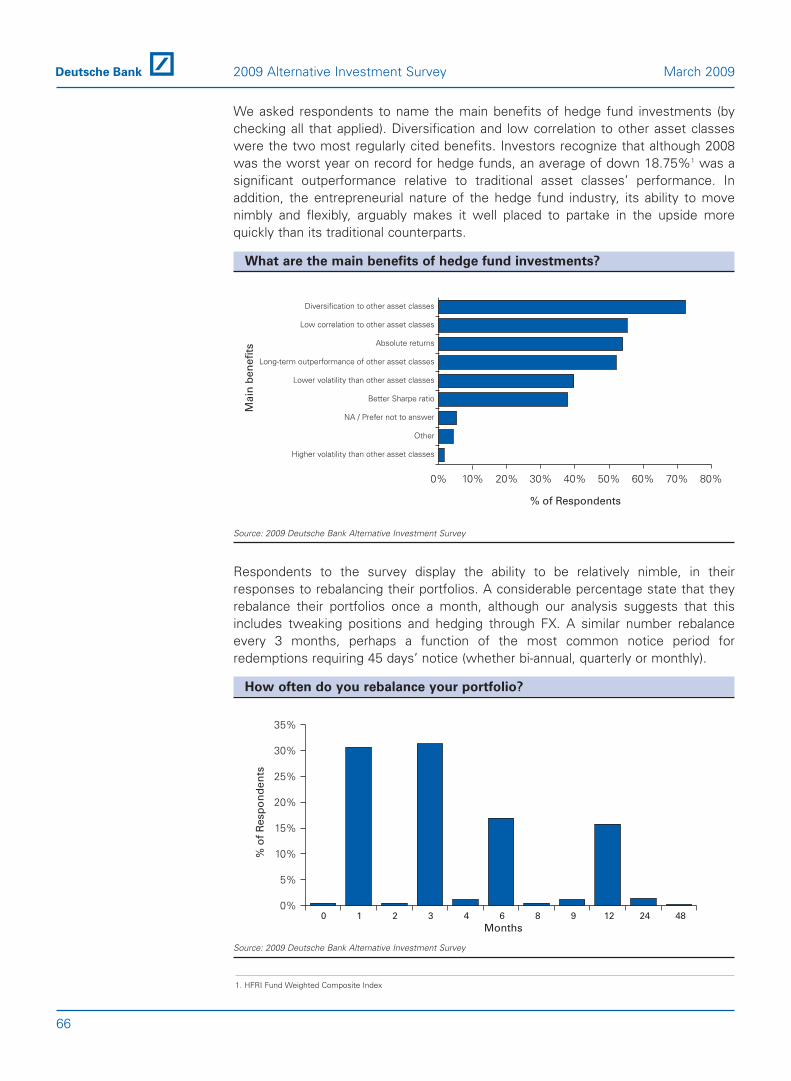
■ Diversification: For 72% of investors, diversification to other asset classesremains the main benefit of investing in hedge funds. This means investors willbe sticking with the asset class.
What are the main benefits of hedge fund investments?
Source: 2009 Deutsche Bank Alternative Investment Survey
Diversification is the most attractive aspect of hedge fund investing by a considerabledistance as shown by the graph above. We see these results as very promising signsfor the hedge fund industry. Firstly, whilst the correlation across all asset classesincreased significantly at the height of the crisis in 2008, the Hedge Fund ResearchIndex (HFRI) outperformed both the S&P 500 and the MSCI World for 2008. So,whilst many hedge funds collectively ended the year in negative territory, the losseswere on average far less severe than those of other asset classes.
This has been particularly well recognised by investors who have both long only andhedge fund portfolios.
Secondly, the small but significant number of hedge funds that generated returnsanywhere between 5% and 50% last year demonstrates that it is possible for hedgefunds to generate absolute returns even in the most severe market conditions.
Lower volatility than other asset classes and a better sharpe ratio are also importantto investors, but to a lesser extent. Almost 40% of investors chose these two aspectsas two of the main benefits of hedge funds, whilst only 1.5% responded saying thathigher volatility than other asset classes was beneficial; considering the events of2008, amid record levels of volatility, this is hardly surprising.
■ Cash levels remain high: Respondents are sitting on $294bn of cash. In6 months time they expect to have reduced this to approx. $212bn. Thisperhaps suggests that $82bn of cash will be re-invested over the next6 months.
% of Respondents
0% 10% 20% 30% 40% 50% 60% 70% 80%
Higher volatility than other asset classes
Other
NA / Prefer not to answer
Better Sharpe ratio
Lower volatility than other asset classes
Long-term outperformance of other asset classes
Absolute returns
Low correlation to other asset classes
Diversification to other asset classes
Main
ben
efi
ts
11
March 2009 2009 Alternative Investment Survey
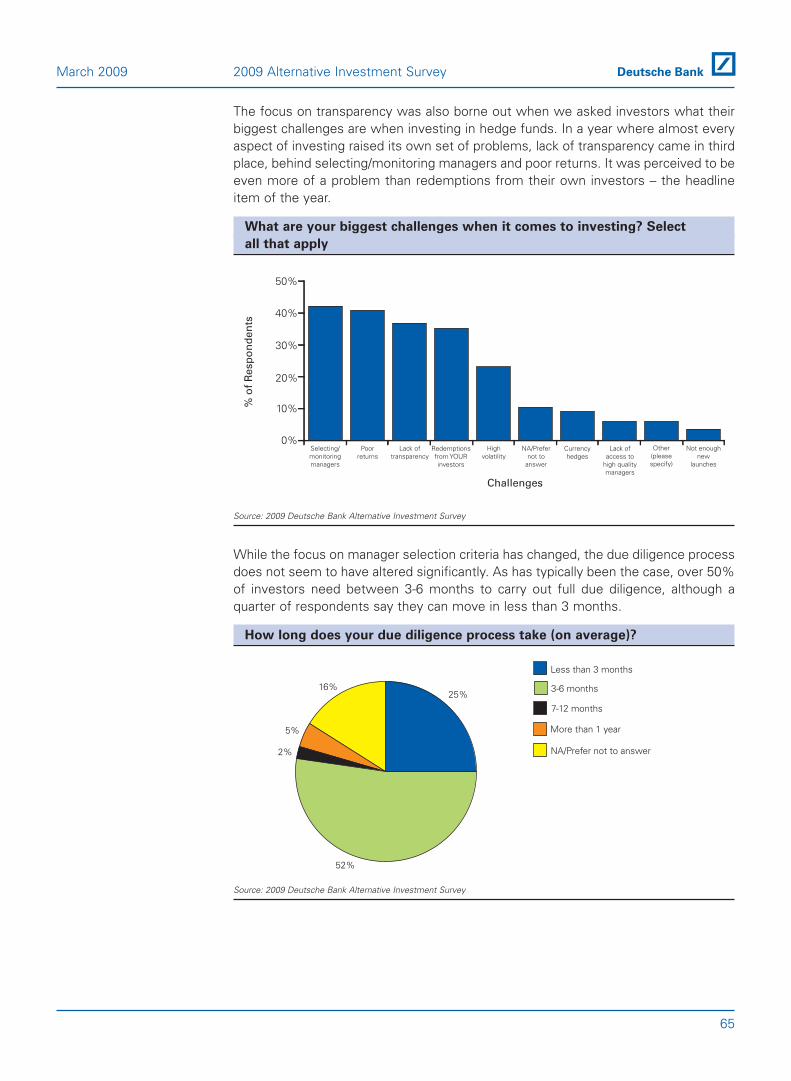
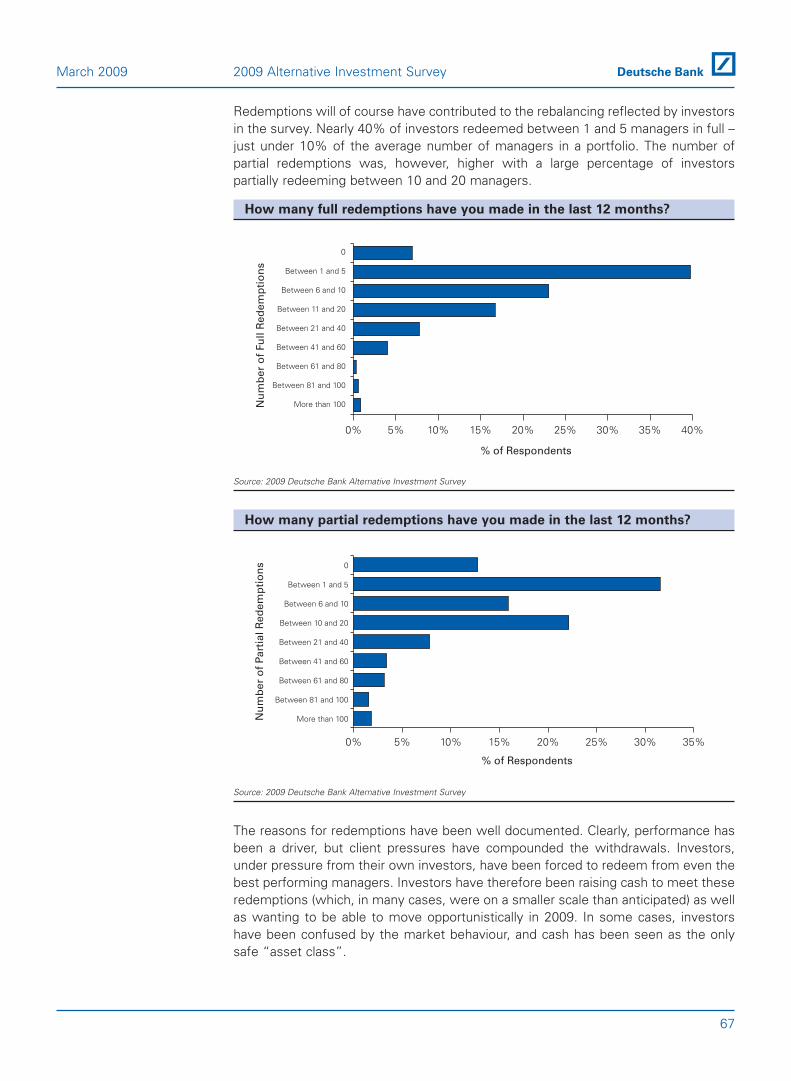
The reasons for redemptions have been well documented. Clearly, performance hasbeen a driver, but client pressures have compounded the withdrawals. Investors,under pressure from their own investors, have been forced to redeem from even thebest performing managers. Investors have therefore been raising cash to meet theseredemptions (which, in many cases, were on a smaller scale than anticipated) as wellas to be able to move opportunistically going forward. In some cases, investors havebeen confused by market behaviour, and in 2009 cash has been seen as the only safe“asset class”.
Nearly 50% of investors are currently holding between 5 and 30% cash, a significantholding and an increase from last year’s survey. It is interesting to note there was ahigh percentage of respondents for which this question was not relevant or thatpreferred not to answer – perhaps indicating the concerns about disclosing high cashlevels, while still charging fees.
We also asked investors what their average cash position was during the first6 months of 2008, when an overwhelming 50% of investors responded that theywere holding 10% cash. Only 11% were holding 20-30%; 35% still refused todisclose. However, by the second half of 2008, that 50% that were holding 10% cashhad reduced to 34%, with those investors holding between 20-30% and 30-40%increasing to 18% and 8% respectively. These changes reflect the deterioratingmarket outlook, then as investors moved to raise their cash levels and expected cashlevels to continue to remain high.
However, while levels are expected to remain high relative to cash levels seen priorto this crisis, investors expect to redeploy a substantial percentage by the end of thefirst half 2009. Respondents are currently sitting on $294bn of cash. Should thingsremain stable, in 6 months’ time, they expect to have reduced this to approximately$212bn, suggesting that $82bn of cash will be perhaps invested back into the industryover the next 6 months.
■ 66% of investors expect there to be outflows in 2009 of $168bn taking the
industry to $1.33trillion.
The hedge fund industry is at $1.5 trillion as of 31 December, 2008, how
much do you think will flow into hedge funds in 2009?
Source: 2009 Deutsche Bank Alternative Investment Survey
0%
5%
10%
15%
20%
25%
30%
Outflow ofmore
than $200bn
Outflow of$150-200bn
Outflow of$100-150bn
Outflow of$50-100bn
Outflow of$0-50bn
Inflow of$0-50bn
Inflow of$50-100bn
Inflow of$100-150bn
Inflow of$150-200bn
Inflow ofmore than
$200bn
% o
f R
esp
on
den
ts
12
2009 Alternative Investment Survey March 2009
Despite the compelling evidence that suggests investors will be putting cash backinto hedge funds over the next 6 months, it is clear that the majority still expect theindustry to experience net outflows for 2009 (67% overall). This is clearly bad newsfor the industry, but it is certainly not unexpected. Furthermore, a positive quarter forboth investors and managers and this trend could easily be reversed.
Nevertheless, the landscape is changing.
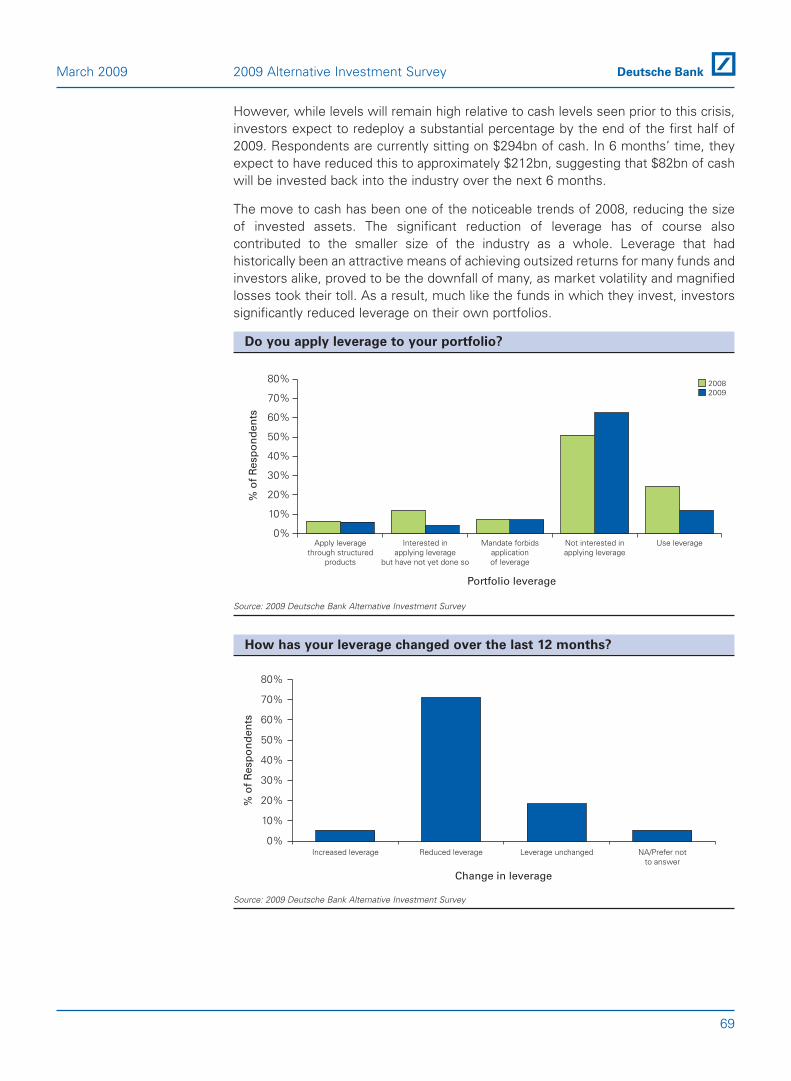
■ Investors, like hedge funds, have de-levered: 72% of investors havereduced their exposure to leverage and 63% are not interested in applyingleverage to their own portfolios this year.
Do you apply leverage to your portfolio?
Source: 2009 Deutsche Bank Alternative Investment Survey
How has your leverage changed over the last 12 months?
Source: 2009 Deutsche Bank Alternative Investment Survey
There has been a clear change in investors’ approach to leverage since the beginningof 2008. In last year’s survey, over 24% of investors said that they used leverage, anda further 12% implied that they were interested in doing so. However, these figureshave fallen significantly in the space of 12 months, to 12% and 4% respectively.
The significant reduction of leverage has of course also contributed to the smaller sizeof the industry as a whole. Leverage, that had historically been an attractive meansof achieving outsized returns for many funds and investors alike, proved to be thedownfall of many, as market volatility and magnified losses took their toll. As a result,much like the funds in which they invest, investors dramatically reduced leverage ontheir own portfolios. However, leverage is a function of manager confidence. Ifmarket stability returns it would be logical to expect hedge funds to re-lever.
■ Continued consolidation and a premier league of hedge funds are
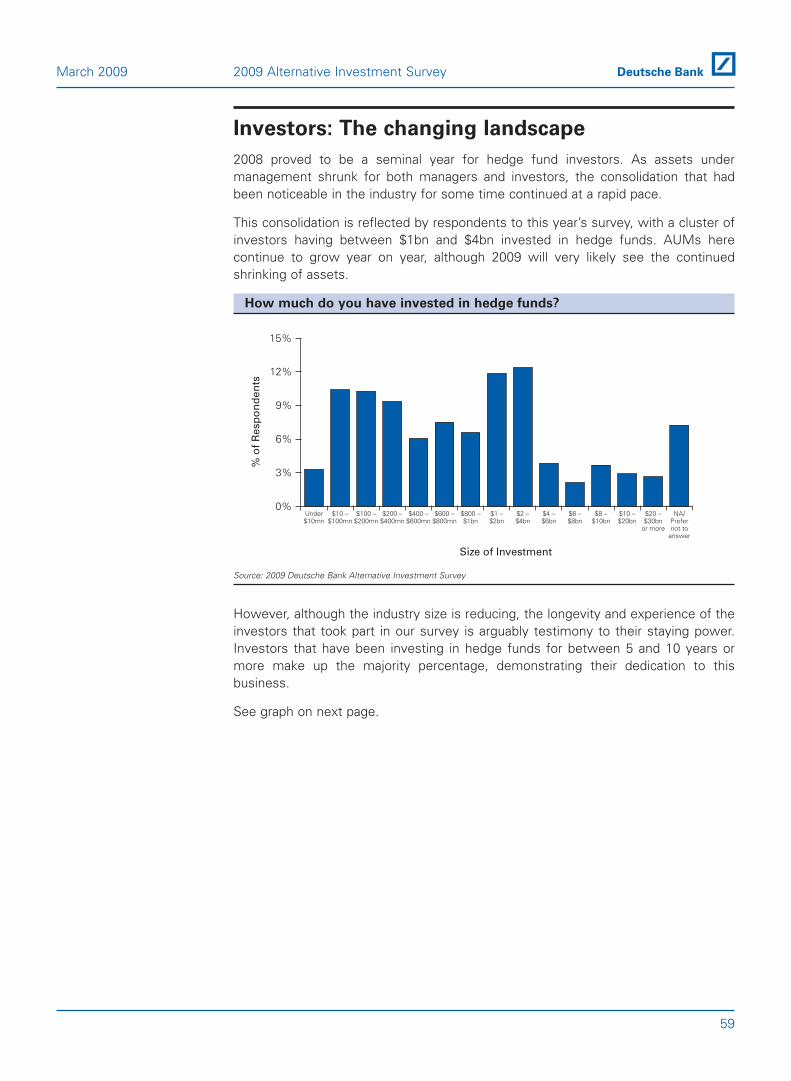
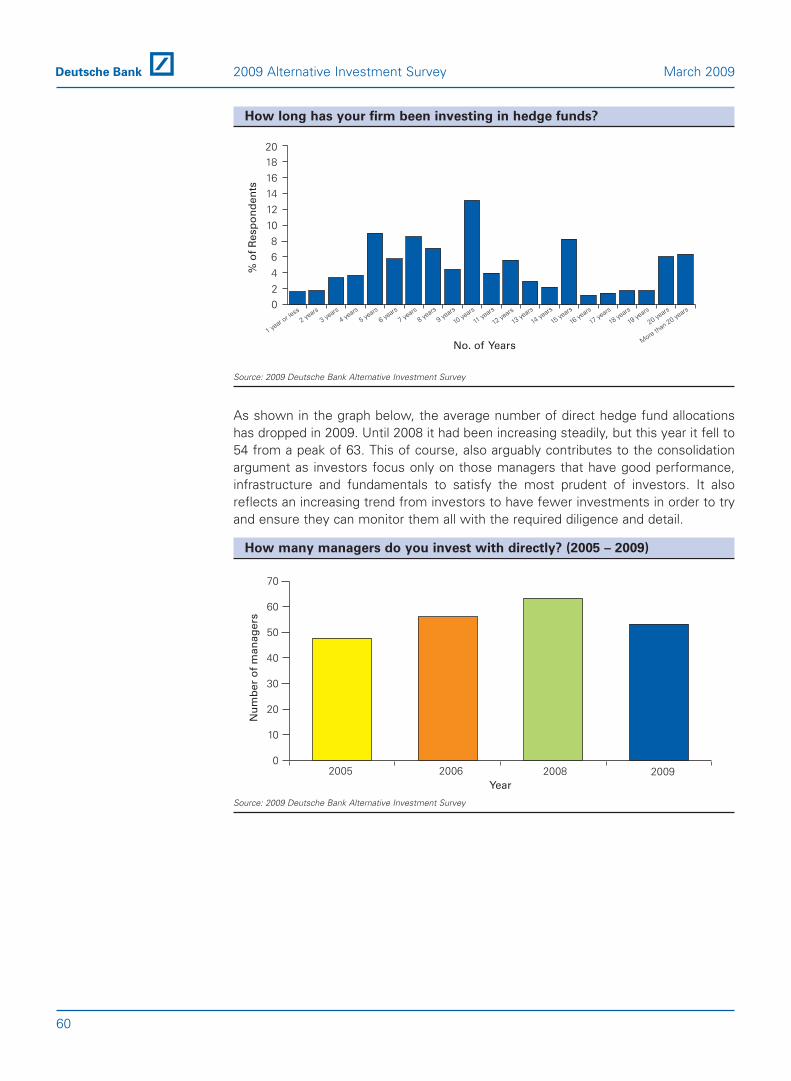
emerging. 50% of our respondents invest in hedge funds with an averageAUM of between $800mn - $4bn ensuring the larger funds continue to growand, hopefully, thrive.
What is the average size of the hedge funds you are invested in?
Source: 2009 Deutsche Bank Alternative Investment Survey
As a result of the current financial crisis, as well as calls for more intense scrutiny ofhedge funds from politicians and regulators alike, we expect the industry to changein such a way that leaves fewer funds, with higher quality managers, and moreeffective rules regarding transparency and risk management.
Size is becoming increasingly important for two main reasons: firstly, higher qualitymanagers with strong track-records will naturally attract more investors and largertickets. Secondly, as the banks continue to deleverage and shrink their balancesheets, smaller accounts, which generate less income for their prime brokers, will bethe first to suffer.
0%
5%
10%
15%
20%
25%
$20bnto $30bnor more
$10bnto under$20bn
$8bnto under$10bn
$6bnto under
$8bn
$4bnto under
$6bn
$2bnto under
$4bn
$1bnto under
$2bn
$800mnto under
$1bn
$600mnto under$800mn
$400mnto under$600mn
$200mnto under$400mn
$100mnto under$200mn
$10mnto under$100mn
Under$10mn
% o
f R
esp
on
den
ts
Hedge Fund AUM
30%
14
2009 Alternative Investment Survey March 2009
What is the average size of the hedge funds you invest with?
Source: 2009 Deutsche Bank Alternative Investment Survey
There is a marked reluctance on the part of investors compared to previous years toallocate to managers with a small AUM, as shown in the graph above.
Clearly substantial consolidation is expected within the industry this year and weanticipate that investors will be particularly keen to ensure that any new allocationsmade are to managers who will survive the current crisis.
Recent events have made investors more attentive.
Historically, investors have indicated the “3Ps”: Performance, Philosophy andPedigree to be the most important characteristics when selecting a manager.However this year, Risk Management has displaced Philosophy as the second mostimportant criteria and Transparency is now fourth, pushing Manager Pedigree to fifthplace.
0%
10%
20%
30%
40%
50%
60%
2005 2006 2008 2009
Over $1bn
$500m-$1bn
$100-$500mn
Under $100mn
Year
% o
f R
esp
on
den
ts
15
March 2009 2009 Alternative Investment Survey
16
2009 Alternative Investment Survey March 2009
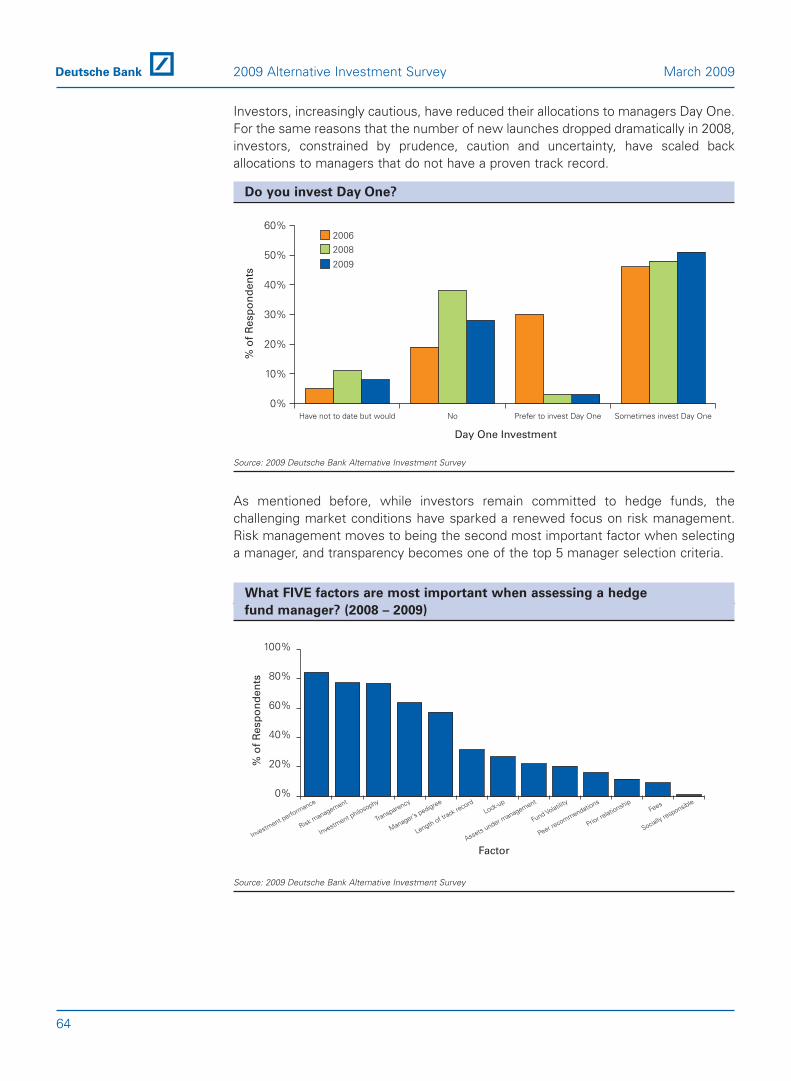
■ Risk Management moves to being the second most important factor whenselecting a manager.
What FIVE factors are most important when assessing a hedge
fund manager?
Source: 2009 Deutsche Bank Alternative Investment Survey
78% of investors specified risk management as the second most important factorwhen selecting a manager. Risk management has been gaining on the “3Ps” since2005 and in 2008 replaced manager pedigree. This year it displaced managerpedigree and philosophy.
In the post-Madoff era, this concentration on risk management is an expecteddevelopment. Furthermore, with the continued institutionalization of the industry,investors have become more risk aware, needing to meet higher institutionalstandards with regard to their risk management processes.
■ Transparency joins the top 5 manager selection criteria.
What FIVE factors are most important when assessing a hedge fund
manager?
Source: 2009 Deutsche Bank Alternative Investment Survey
Investm
ent
perform
ance Peer
recommendati
ons
Man
ager’s
pedigree
Lengthof
track
record
Assets
under
manag
ement Fund
Volatilit
yRisk
manag
ement Prior
relationsh
ipLock
-upFees
Transp
arency
Investm
ent
philoso
phy
% o
f Res
pond
ents
Factor
20082009
0%
10%
20%
30%
40%
50%
60%
70%
80%
90%
0%
20%
40%
60%
80%
100%
% o
f R
esp
on
den
ts
Factor
Transparency
Socially responsible
Risk management
Manager’s pedigree
Length of track record
Fund Volatility
Fees
Peer recommendations
Prior relationshipLock-up
Investment philosophy
Assets under management
Investment performance
The focus on transparency was also borne out when we asked investors what theirbiggest challenges when it comes to investing. In a year where almost every aspectof investing raised its own set of problems, lack of transparency came in third place,behind selecting/monitoring managers and poor returns. It was perceived to be evenmore of a problem than redemptions from their own investors – the headline item ofthe year.
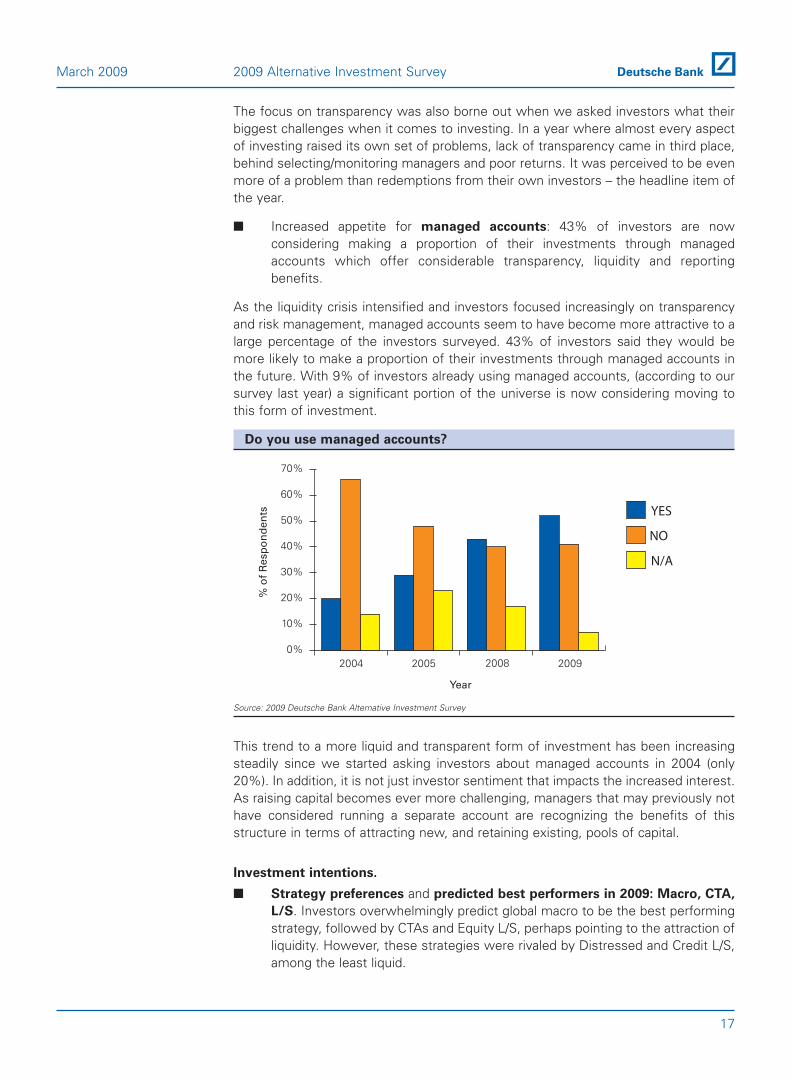
■ Increased appetite for managed accounts: 43% of investors are nowconsidering making a proportion of their investments through managedaccounts which offer considerable transparency, liquidity and reportingbenefits.
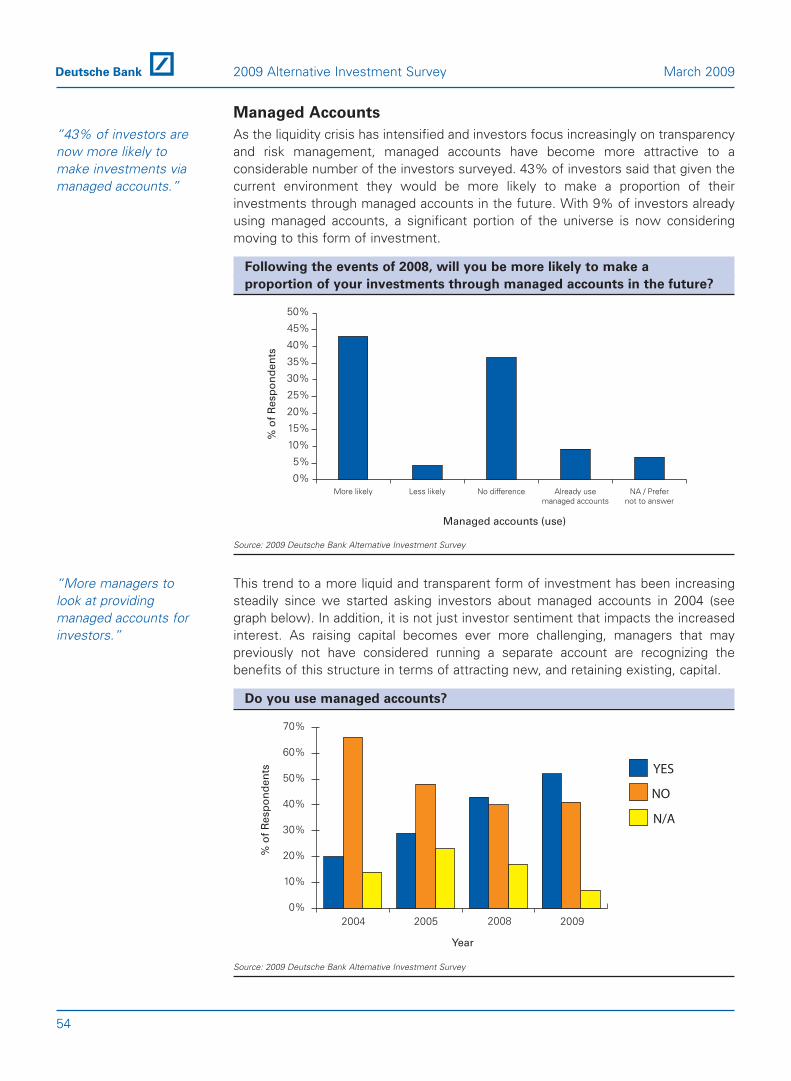
As the liquidity crisis intensified and investors focused increasingly on transparencyand risk management, managed accounts seem to have become more attractive to alarge percentage of the investors surveyed. 43% of investors said they would bemore likely to make a proportion of their investments through managed accounts inthe future. With 9% of investors already using managed accounts, (according to oursurvey last year) a significant portion of the universe is now considering moving tothis form of investment.
Do you use managed accounts?
Source: 2009 Deutsche Bank Alternative Investment Survey
This trend to a more liquid and transparent form of investment has been increasingsteadily since we started asking investors about managed accounts in 2004 (only20%). In addition, it is not just investor sentiment that impacts the increased interest.As raising capital becomes ever more challenging, managers that may previously nothave considered running a separate account are recognizing the benefits of thisstructure in terms of attracting new, and retaining existing, pools of capital.
Investment intentions.
■ Strategy preferences and predicted best performers in 2009: Macro, CTA,
L/S. Investors overwhelmingly predict global macro to be the best performingstrategy, followed by CTAs and Equity L/S, perhaps pointing to the attraction ofliquidity. However, these strategies were rivaled by Distressed and Credit L/S,among the least liquid.
0%
10%
20%
30%
40%
50%
60%
70%
2004 2005 2009
% o
f R
esp
on
den
ts
Year
NO
YES
N/A
2008
17
March 2009 2009 Alternative Investment Survey
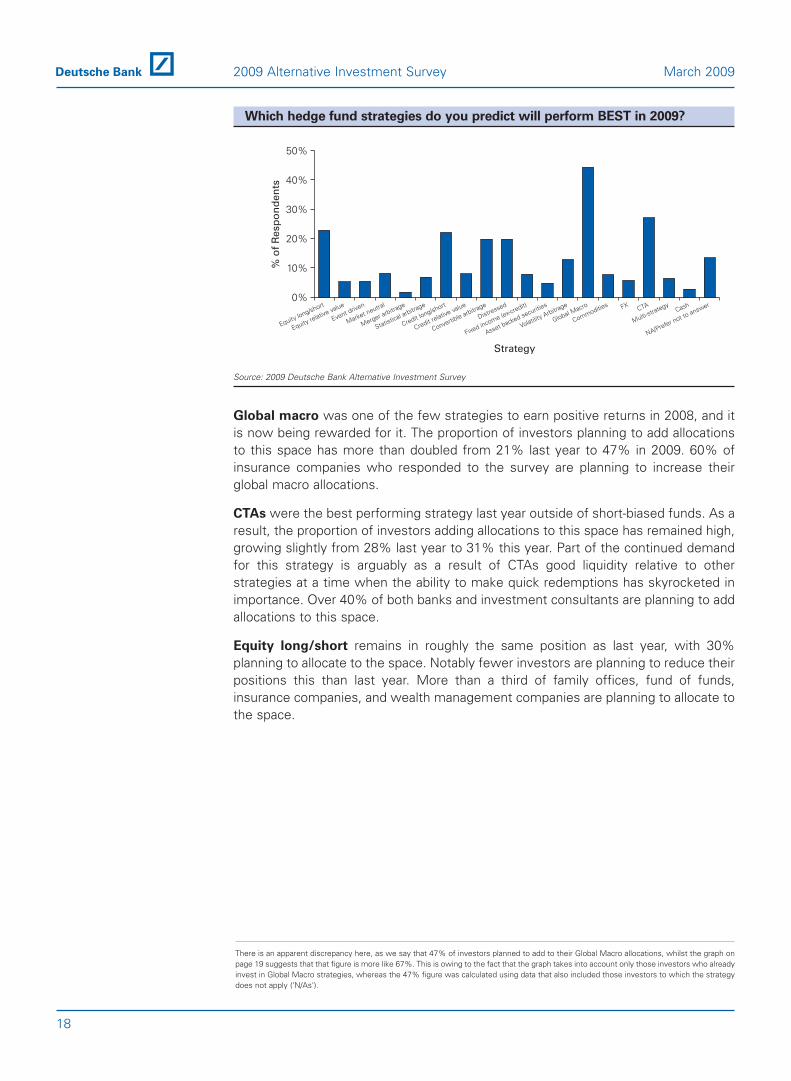
Which hedge fund strategies do you predict will perform BEST in 2009?
Source: 2009 Deutsche Bank Alternative Investment Survey
Global macro was one of the few strategies to earn positive returns in 2008, and itis now being rewarded for it. The proportion of investors planning to add allocationsto this space has more than doubled from 21% last year to 47% in 2009. 60% ofinsurance companies who responded to the survey are planning to increase theirglobal macro allocations.
CTAs were the best performing strategy last year outside of short-biased funds. As aresult, the proportion of investors adding allocations to this space has remained high,growing slightly from 28% last year to 31% this year. Part of the continued demandfor this strategy is arguably as a result of CTAs good liquidity relative to otherstrategies at a time when the ability to make quick redemptions has skyrocketed inimportance. Over 40% of both banks and investment consultants are planning to addallocations to this space.
Equity long/short remains in roughly the same position as last year, with 30%planning to allocate to the space. Notably fewer investors are planning to reduce theirpositions this than last year. More than a third of family offices, fund of funds,insurance companies, and wealth management companies are planning to allocate tothe space.
0%
10%
20%
30%
40%
50%
NA/Prefer not toanswer
Cash
Multi-strategyCTAFX
Commodities
Global Macro
Volatility Arbitrage
Asset backed securities
Fixed income (ex-credit)
Distressed
Convertible arbitrage
Credit relative value
Credit long/short
Statistical arbitrage
Merger arbitrage
Market neutral
Event driven
Equity relative value
Equity long/short
Strategy
% o
f R
esp
on
den
ts
18
2009 Alternative Investment Survey March 2009
There is an apparent discrepancy here, as we say that 47% of investors planned to add to their Global Macro allocations, whilst the graph onpage 19 suggests that that figure is more like 67%. This is owing to the fact that the graph takes into account only those investors who alreadyinvest in Global Macro strategies, whereas the 47% figure was calculated using data that also included those investors to which the strategydoes not apply ('N/As').
Percentage of respondents planning to increase allocations by strategy
Source: 2009 Deutsche Bank Alternative Investment Survey
While down from 37% planning allocations in our 2008 survey, credit long/short
remains a popular strategy going forward into 2009 with over 30% of respondentsplanning to allocate. The strategy is particularly popular with wealth managementcompanies and investment consultants, with over 25% of each group planning toallocate to this strategy.
The distressed space has by far the largest proportion of investors planning to addallocations this year. This is unsurprising given the record declines in nearly everyasset class in 2008. However, many investors have been burned by bad performancein the space in 2008. The fact that investors are planning to add versus reduceallocation by a four to one margin could be seen as a broadly bullish take on themarket overall. Nearly half of all banks, foundations, and wealth managementcompanies are planning to allocate to this strategy.
■ USA is predicted to be best performing region. 46% of investors think thatthe USA will be best performing region in 2009. Eastern and Central Europeand Russia are predicted to perform the worst by 41% of investors.
The majority of investors predict that the best performing regions for hedge fundinvestments in 2009 will be the United States and Canada. The percentage ofinvestors that predict this has doubled since last year, from 23% to 46%.
% of Respondents
0% 10% 20% 30% 40% 50% 60% 70% 80%
Global MacroDistressed
CTACredit Long/Short
Convertible ArbitrageFX
Equity Long/ShortCommodities
Volatility ArbitrageMarket Neutral
Credit Relative ValueFixed Income
Statistical ArbitrageAsset backed securities
Equity Relative ValueMulti-strategyEvent Driven
Merger ArbitrageCash
19
March 2009 2009 Alternative Investment Survey
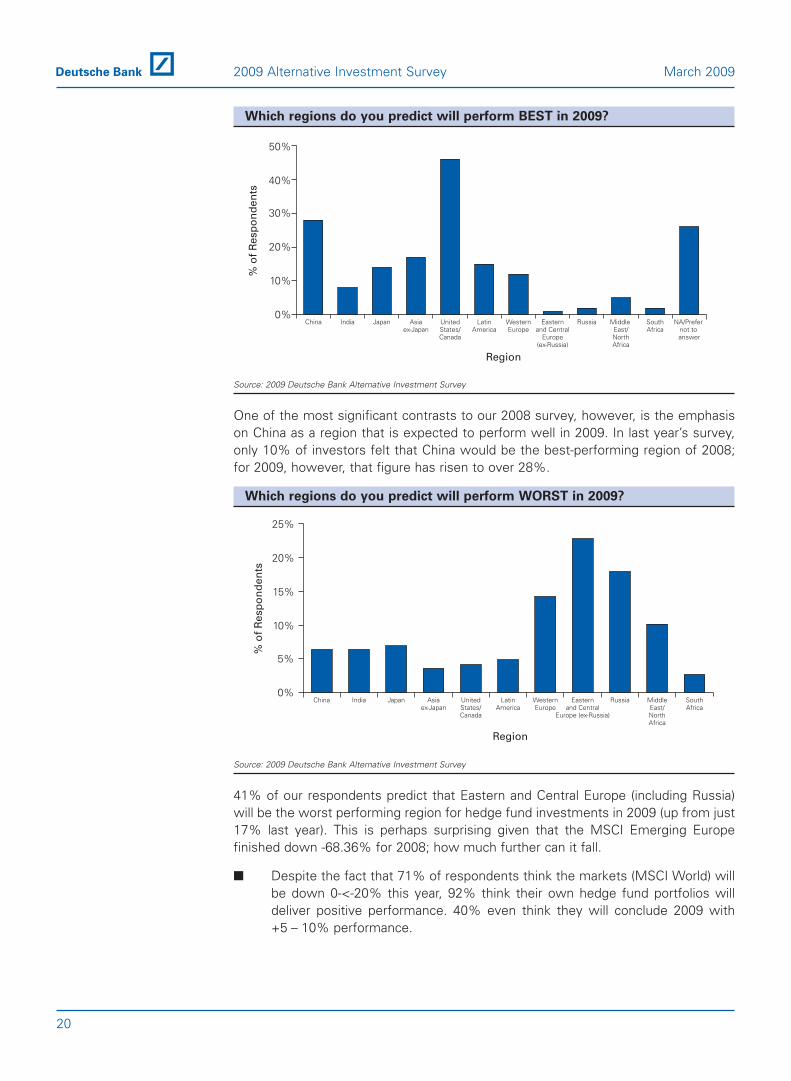
Which regions do you predict will perform BEST in 2009?
Source: 2009 Deutsche Bank Alternative Investment Survey
One of the most significant contrasts to our 2008 survey, however, is the emphasison China as a region that is expected to perform well in 2009. In last year’s survey,only 10% of investors felt that China would be the best-performing region of 2008;for 2009, however, that figure has risen to over 28%.
Which regions do you predict will perform WORST in 2009?
Source: 2009 Deutsche Bank Alternative Investment Survey
41% of our respondents predict that Eastern and Central Europe (including Russia)will be the worst performing region for hedge fund investments in 2009 (up from just17% last year). This is perhaps surprising given that the MSCI Emerging Europefinished down -68.36% for 2008; how much further can it fall.
■ Despite the fact that 71% of respondents think the markets (MSCI World) willbe down 0-<-20% this year, 92% think their own hedge fund portfolios willdeliver positive performance. 40% even think they will conclude 2009 with+5 – 10% performance.
% o
f R
esp
on
den
ts
0%
5%
10%
15%
20%
25%
SouthAfrica
MiddleEast/NorthAfrica
RussiaEasternand Central
Europe (ex-Russia)
WesternEurope
LatinAmerica
UnitedStates/Canada
Asiaex-Japan
JapanIndiaChina
Region
% o
f R
esp
on
den
ts
0%
10%
20%
30%
40%
50%
NA/Prefer not to answer
SouthAfrica
Middle East/NorthAfrica
RussiaEasternand Central
Europe(ex-Russia)
WesternEurope
LatinAmerica
UnitedStates/Canada
Asiaex-Japan
JapanIndiaChina
Region
20
2009 Alternative Investment Survey March 2009
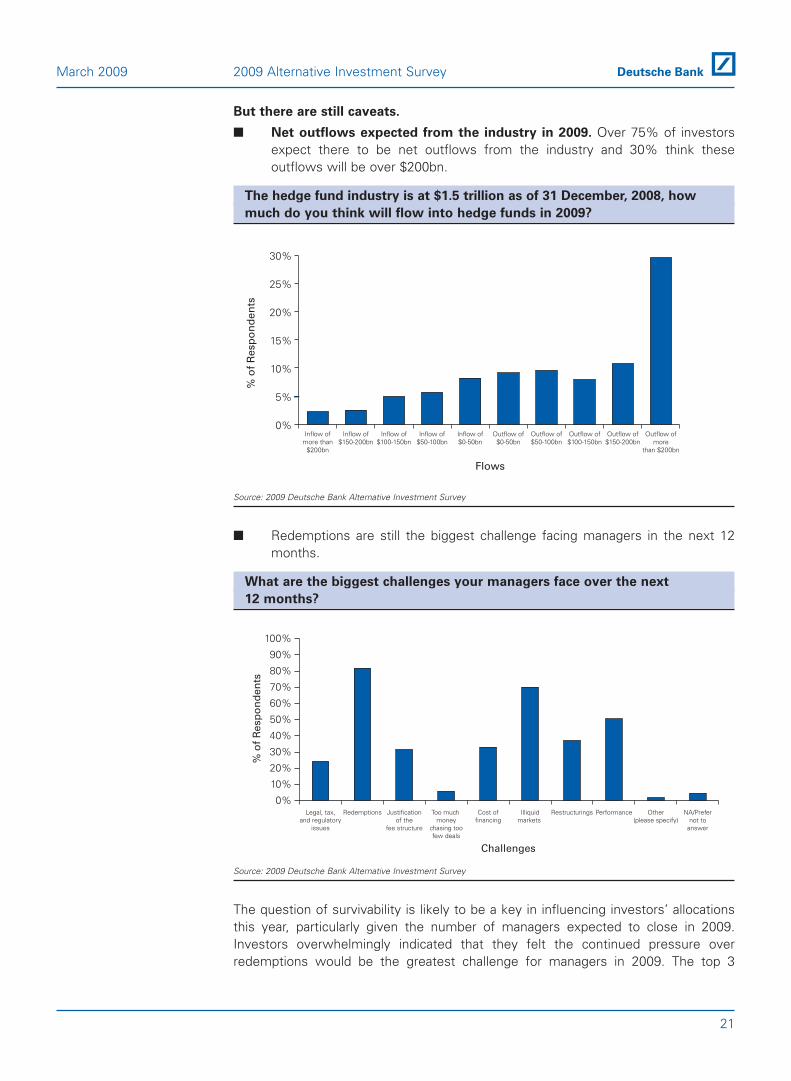
But there are still caveats.
■ Net outflows expected from the industry in 2009. Over 75% of investorsexpect there to be net outflows from the industry and 30% think theseoutflows will be over $200bn.
The hedge fund industry is at $1.5 trillion as of 31 December, 2008, how
much do you think will flow into hedge funds in 2009?
Source: 2009 Deutsche Bank Alternative Investment Survey
■ Redemptions are still the biggest challenge facing managers in the next 12months.
What are the biggest challenges your managers face over the next
12 months?
Source: 2009 Deutsche Bank Alternative Investment Survey
The question of survivability is likely to be a key in influencing investors’ allocationsthis year, particularly given the number of managers expected to close in 2009.Investors overwhelmingly indicated that they felt the continued pressure overredemptions would be the greatest challenge for managers in 2009. The top 3
0%
10%
20%
30%
40%
50%
60%
70%
80%
90%
100%
NA/Prefernot to
answer
Other(please specify)
PerformanceRestructuringsIlliquidmarkets
Cost offinancing
Too much money
chasing toofew deals
Justificationof the
fee structure
RedemptionsLegal, tax,and regulatory
issues
% o
f R
esp
on
de
nts
Challenges
0%
5%
10%
15%
20%
25%
30%
Outflow ofmore
than $200bn
Outflow of$150-200bn
Outflow of$100-150bn
Outflow of$50-100bn
Outflow of$0-50bn
Inflow of$0-50bn
Inflow of$50-100bn
Inflow of$100-150bn
Inflow of$150-200bn
Inflow ofmore than
$200bn
% o
f R
esp
on
den
ts
Flows
21
March 2009 2009 Alternative Investment Survey
challenges highlighted when our respondents were asked what the top challengeswere managers faces in the next 12 months were:
Many managers and investors are still experiencing redemptions. Although thesehave slowed down since 2008, managers and investors are still suffering. This isreflected by our responders, who predict outflows in 2009 of $168bn from theindustry. While markets remain volatile and performance elusive, redemptions willcontinue to be an ongoing concern for managers throughout 2009.
■ How the markets behave however is also a huge component in how fast theindustry bounces back.
January and February this year, relative to the second half of 2008, have proven to berelatively good months for many hedge funds. We also feel that although managersand investors are both still experiencing redemptions, in many cases these have nowslowed. A few good months performance for funds should have a calming effect onthe industry. A few good quarters should have a very positive effect on the industry.Whether this will happen, we have yet to see.
22
2009 Alternative Investment Survey March 2009
23
Strategy Appetite &Regional Focus
24
2009 Alternative Investment Survey March 2009
Strategy Appetite & Regional Focus
Flows & Returns
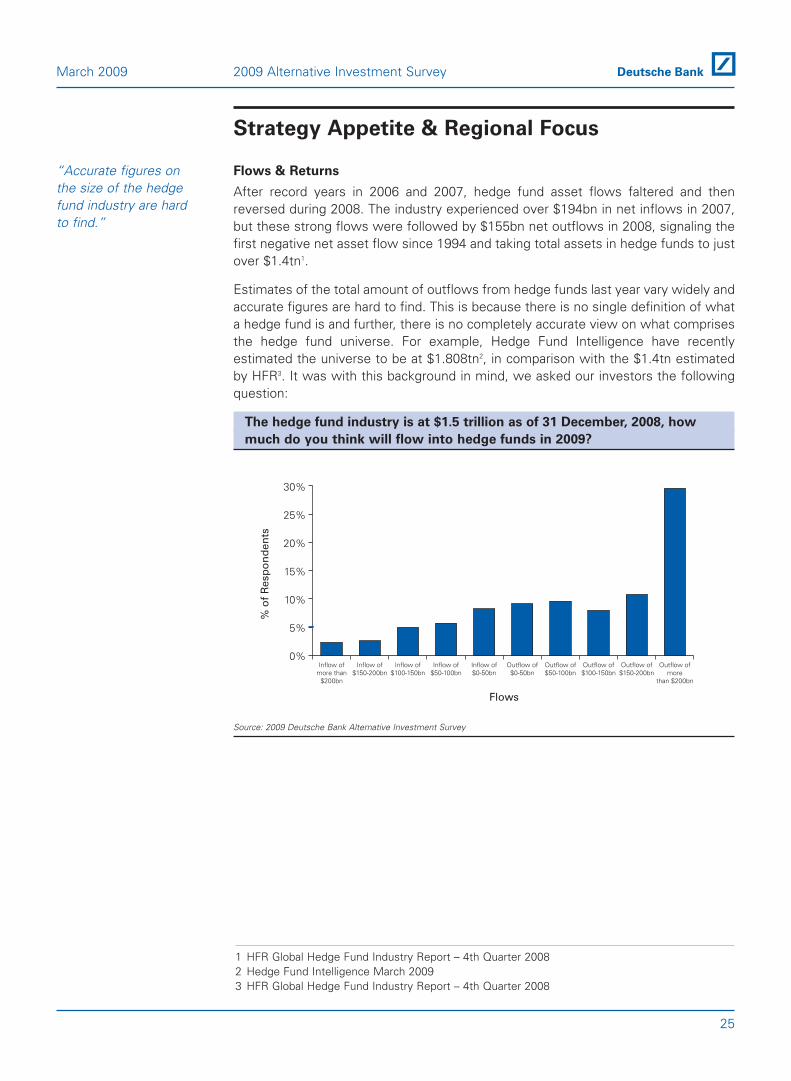
After record years in 2006 and 2007, hedge fund asset flows faltered and thenreversed during 2008. The industry experienced over $194bn in net inflows in 2007,but these strong flows were followed by $155bn net outflows in 2008, signaling thefirst negative net asset flow since 1994 and taking total assets in hedge funds to justover $1.4tn1.
Estimates of the total amount of outflows from hedge funds last year vary widely andaccurate figures are hard to find. This is because there is no single definition of whata hedge fund is and further, there is no completely accurate view on what comprisesthe hedge fund universe. For example, Hedge Fund Intelligence have recentlyestimated the universe to be at $1.808tn2, in comparison with the $1.4tn estimatedby HFR3. It was with this background in mind, we asked our investors the followingquestion:
The hedge fund industry is at $1.5 trillion as of 31 December, 2008, how
much do you think will flow into hedge funds in 2009?
Source: 2009 Deutsche Bank Alternative Investment Survey
0%
5%
10%
15%
20%
25%
30%
Outflow ofmore
than $200bn
Outflow of$150-200bn
Outflow of$100-150bn
Outflow of$50-100bn
Outflow of$0-50bn
Inflow of$0-50bn
Inflow of$50-100bn
Inflow of$100-150bn
Inflow of$150-200bn
Inflow ofmore than
$200bn
% o
f R
esp
on
den
ts
Flows
“Accurate figures onthe size of the hedgefund industry are hardto find.”
25
March 2009 2009 Alternative Investment Survey
1 HFR Global Hedge Fund Industry Report – 4th Quarter 20082 Hedge Fund Intelligence March 20093 HFR Global Hedge Fund Industry Report – 4th Quarter 2008
Over 75% of respondents expect there to be outflows from the industry in 2009.Furthermore, 30% think these outflows will stand at over $200bn.
Taking these industry figures into account, and in the context of our survey’sresponses, we estimate the hedge fund industry to end the year 2009 atapproximately $1.33tn1.
However, hedge fund strategies have not lost their appeal.
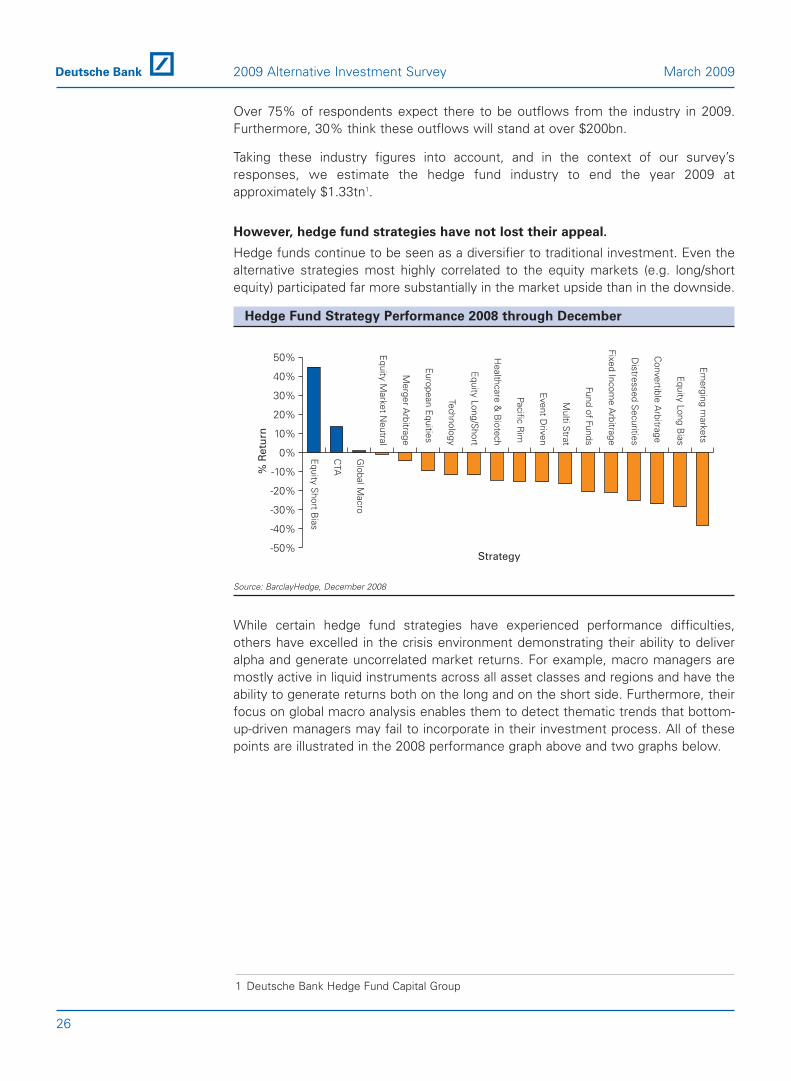
Hedge funds continue to be seen as a diversifier to traditional investment. Even thealternative strategies most highly correlated to the equity markets (e.g. long/shortequity) participated far more substantially in the market upside than in the downside.
Hedge Fund Strategy Performance 2008 through December
Source: BarclayHedge, December 2008
While certain hedge fund strategies have experienced performance difficulties,others have excelled in the crisis environment demonstrating their ability to deliveralpha and generate uncorrelated market returns. For example, macro managers aremostly active in liquid instruments across all asset classes and regions and have theability to generate returns both on the long and on the short side. Furthermore, theirfocus on global macro analysis enables them to detect thematic trends that bottom-up-driven managers may fail to incorporate in their investment process. All of thesepoints are illustrated in the 2008 performance graph above and two graphs below.
-50%
-40%
-30%
-20%
-10%
0%
10%
20%
30%
40%
50%
Em
erging markets
Equity Long B
ias
Convertible A
rbitrage
Distressed S
ecurities
Fixed Income A
rbitrage
Fund of Funds
Multi S
trat
Event D
riven
Pacific Rim
Healthcare &
Biotech
Equity Long/S
hort
Technology
European E
quities
Merger A
rbitrage
Equity M
arket Neutral
Global M
acro
CTA
Equity S
hort Bias
% R
etu
rn
Strategy
26
2009 Alternative Investment Survey March 2009
1 Deutsche Bank Hedge Fund Capital Group
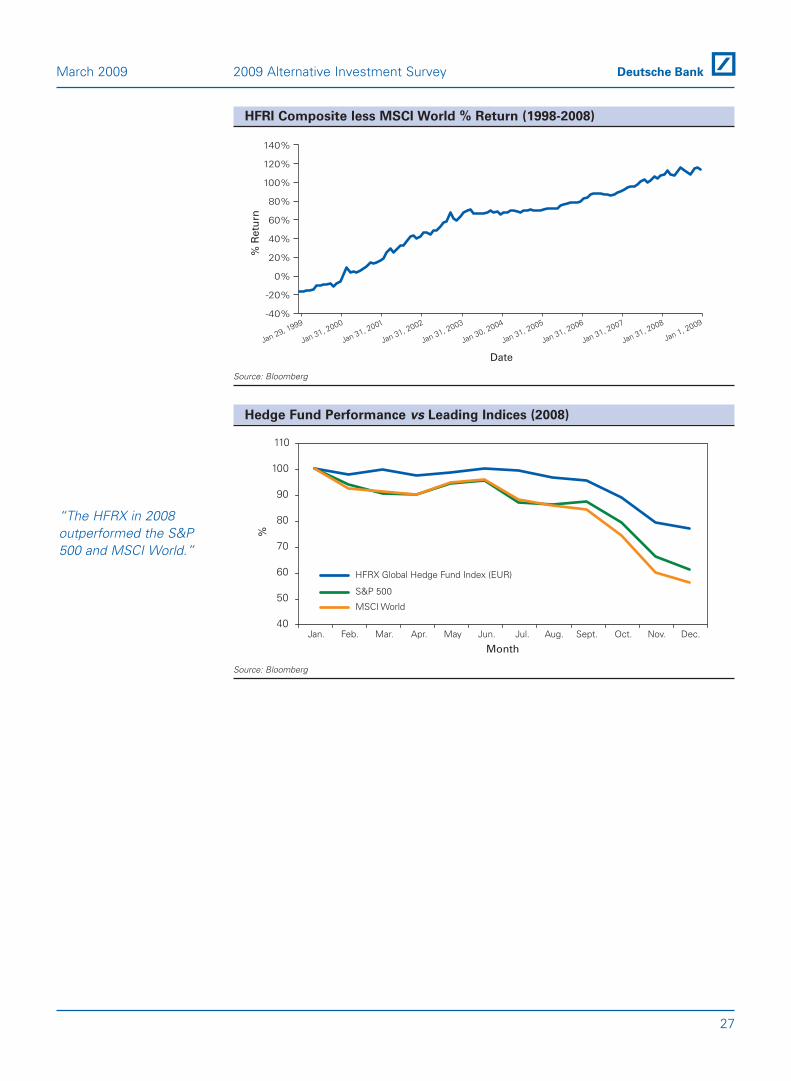
HFRI Composite less MSCI World % Return (1998-2008)
Source: Bloomberg
Hedge Fund Performance vs Leading Indices (2008)
Source: Bloomberg
40
50
60
70
80
90
100
110
Jan. Feb. Mar. Apr. May Jun. Jul. Aug. Sept. Oct. Nov. Dec.
Month
%
HFRX Global Hedge Fund Index (EUR)
S&P 500
MSCI World
“The HFRX in 2008outperformed the S&P500 and MSCI World.”
-40%
-20%
0%
20%
40%
60%
80%
100%
120%
140%
Jan 31, 2008
Jan 31, 2007
Jan 31, 2006
Jan 31, 2005
Jan 30, 2004
Jan 31, 2003
Jan 31, 2002
Jan 31, 2001
Jan 31, 2000
Jan 29, 1999
Jan 1, 2009
Date
% R
etu
rn
27
March 2009 2009 Alternative Investment Survey
Performance Predictions
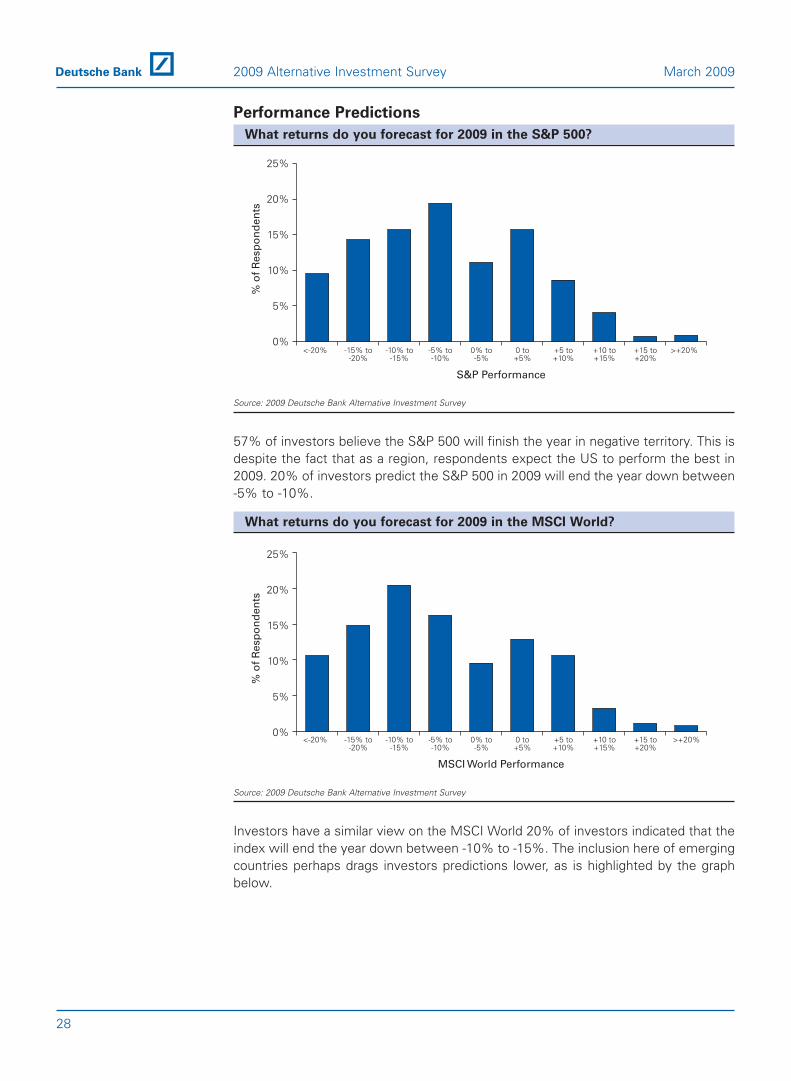
What returns do you forecast for 2009 in the S&P 500?
Source: 2009 Deutsche Bank Alternative Investment Survey
57% of investors believe the S&P 500 will finish the year in negative territory. This isdespite the fact that as a region, respondents expect the US to perform the best in2009. 20% of investors predict the S&P 500 in 2009 will end the year down between-5% to -10%.
What returns do you forecast for 2009 in the MSCI World?
Source: 2009 Deutsche Bank Alternative Investment Survey
Investors have a similar view on the MSCI World 20% of investors indicated that theindex will end the year down between -10% to -15%. The inclusion here of emergingcountries perhaps drags investors predictions lower, as is highlighted by the graphbelow.
% o
f R
esp
on
den
ts
0%
5%
10%
15%
20%
25%
>+20%+15 to+20%
+10 to+15%
+5 to+10%
0 to+5%
0% to-5%
-5% to-10%
-10% to-15%
-15% to-20%
<-20%
MSCI World Performance
% o
f R
esp
on
den
ts
0%
5%
10%
15%
20%
25%
>+20% +15 to+20%
+10 to+15%
+5 to+10%
0 to+5%
0% to-5%
-5% to-10%
-10% to-15%
-15% to-20%
<-20%
S&P Performance
28
2009 Alternative Investment Survey March 2009
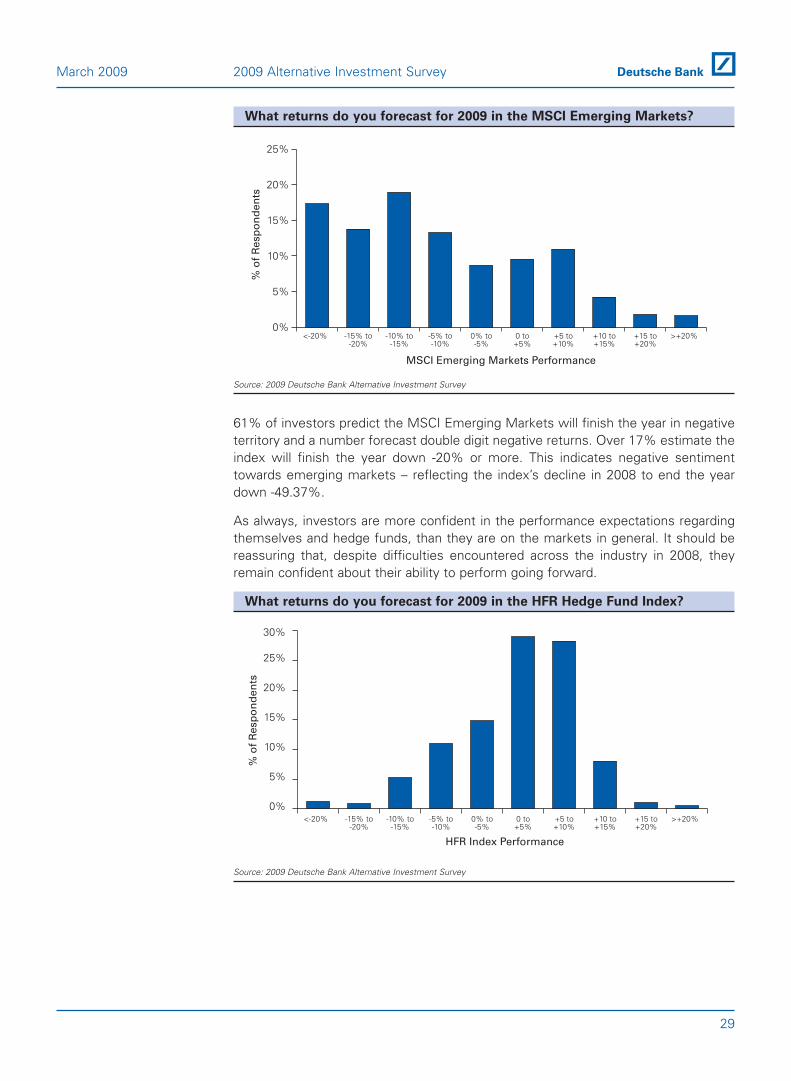
What returns do you forecast for 2009 in the MSCI Emerging Markets?
Source: 2009 Deutsche Bank Alternative Investment Survey
61% of investors predict the MSCI Emerging Markets will finish the year in negativeterritory and a number forecast double digit negative returns. Over 17% estimate theindex will finish the year down -20% or more. This indicates negative sentimenttowards emerging markets – reflecting the index’s decline in 2008 to end the yeardown -49.37%.
As always, investors are more confident in the performance expectations regardingthemselves and hedge funds, than they are on the markets in general. It should bereassuring that, despite difficulties encountered across the industry in 2008, theyremain confident about their ability to perform going forward.
What returns do you forecast for 2009 in the HFR Hedge Fund Index?
Source: 2009 Deutsche Bank Alternative Investment Survey
% o
f R
esp
on
den
ts
0%
5%
10%
15%
20%
25%
30%
>+20% +15 to+20%
+10 to+15%
+5 to+10%
0 to+5%
0% to-5%
-5% to-10%
-10% to-15%
-15% to-20%
<-20%
HFR Index Performance
% o
f R
esp
on
den
ts
0%
5%
10%
15%
20%
25%
>+20% +15 to+20%
+10 to+15%
+5 to+10%
0 to+5%
0% to-5%
-5% to-10%
-10% to-15%
-15% to-20%
<-20%
MSCI Emerging Markets Performance
29
March 2009 2009 Alternative Investment Survey
Over 50% of investors predict the HFR index will produce 0–10% performance thisyear. The HFR Index ended 2008 down -23.25%; arguably all the more reasoninvestors believe it will perform well in 2009, as managers take off leverage, becomeaccustomed to the volatile markets and learn from their mistakes.
What returns do you forecast for 2009 in your own hedge fund
investments?
Source: 2009 Deutsche Bank Alternative Investment Survey
Investors are slightly more bouyant again about their own portfolios with over 40%predicting they will conclude 2009 with +5–10% performance. It is, however, worthnoting that in 2008 investors predicted they would finish the year +10%.
Strategy Allocations
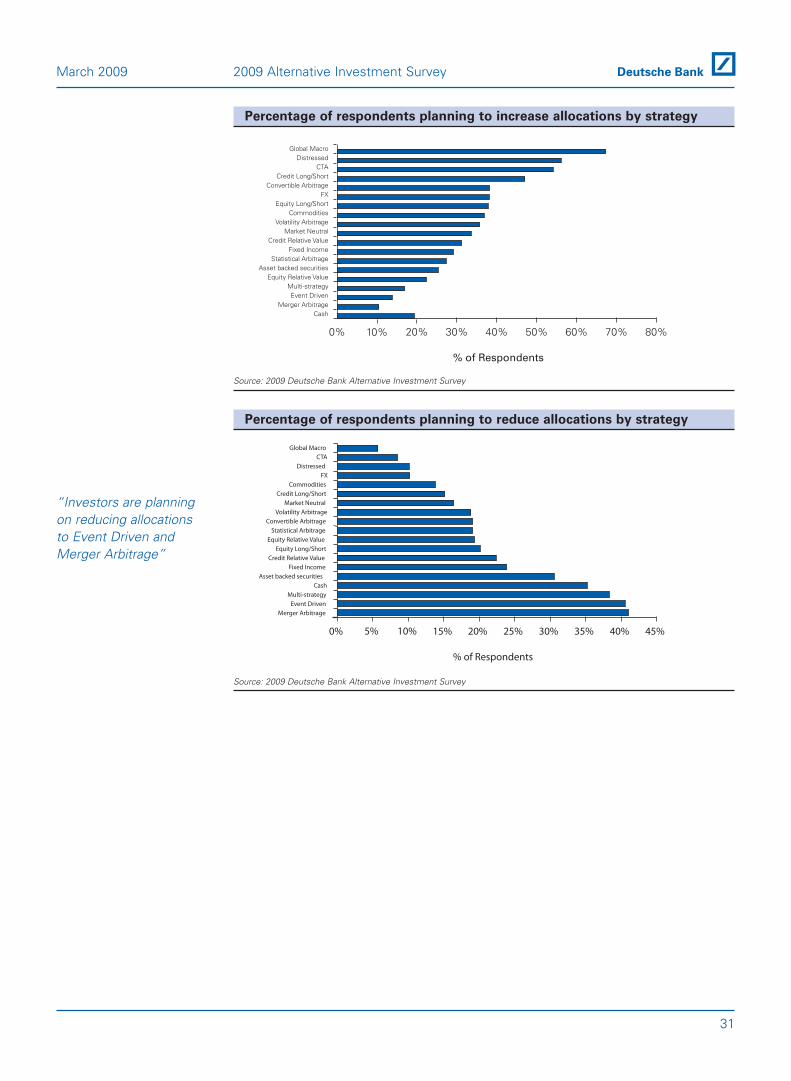
The graphs in this section show investor appetite for 19 different hedge fundstrategies. Global Macro, Distressed, CTA, Credit Long/Short, and ConvertibleArbitrage lead the pack in terms of additional allocations. Merger Arbitrage, EventDriven, Multi-strategy, Cash, and Asset-backed securities look to be the least popularstrategies with investors going into 2009.
Comparing intentions to add versus reduce allocations, we see that for 14 out of 19strategies, more investors plan to add allocations than reduce them. Furthermore,investors plan to reduce versus add cash by a two to one margin. Thus looking at thestrategies overall we might come away with a tentatively positive outlook for 2009.
% o
f R
esp
on
den
ts
0%
10%
20%
30%
40%
50%
>+20% +15 to+20%
+10 to+15%
+5 to+10%
0 to+5%
0% to-5%
-5% to-10%
-10% to-15%
-15% to-20%
<-20%
Returns from own hedge fund investments
30
2009 Alternative Investment Survey March 2009
Percentage of respondents planning to increase allocations by strategy
Source: 2009 Deutsche Bank Alternative Investment Survey
Percentage of respondents planning to reduce allocations by strategy
Source: 2009 Deutsche Bank Alternative Investment Survey
% of Respondents
0% 5% 10% 15% 20% 25% 30% 35% 40% 45%
Global MacroCTA
DistressedFX
CommoditiesCredit Long/Short
Market NeutralVolatility Arbitrage
Convertible ArbitrageStatistical Arbitrage
Equity Relative ValueEquity Long/Short
Credit Relative ValueFixed Income
Asset backed securitiesCash
Multi-strategyEvent Driven
Merger Arbitrage
“Investors are planningon reducing allocationsto Event Driven andMerger Arbitrage”
% of Respondents
0% 10% 20% 30% 40% 50% 60% 70% 80%
Global MacroDistressed
CTACredit Long/Short
Convertible ArbitrageFX
Equity Long/ShortCommodities
Volatility ArbitrageMarket Neutral
Credit Relative ValueFixed Income
Statistical ArbitrageAsset backed securities
Equity Relative ValueMulti-strategyEvent Driven
Merger ArbitrageCash
31
March 2009 2009 Alternative Investment Survey
Which hedge fund strategies do you predict will perform BEST in 2009?
Source: 2009 Deutsche Bank Alternative Investment Survey
Which hedge fund strategies do you predict will perform WORST
in 2009?
Source: 2009 Deutsche Bank Alternative Investment Survey
0%
5%
10%
15%
20%
25%
30%
NA/Prefer not toanswer
Cash
Multi-strategyCTAFX
Commodities
Global Macro
VolatilityArbitrage
Asset backed securities
Fixed income (ex-credit)
Distressed
Convertible arbitrage
Credit relative value
Credit long/short
Statistical arbitrage
Merger arbitrage
Market neutral
Event driven
Equity relative value
Equity long/short
Strategy
% o
f R
esp
on
den
ts
0%
10%
20%
30%
40%
50%
NA/Prefer not toanswer
Cash
Multi-strategyCTAFX
Commodities
Global Macro
Volatility Arbitrage
Asset backed securities
Fixed income (ex-credit)
Distressed
Convertible arbitrage
Credit relative value
Credit long/short
Statistical arbitrage
Merger arbitrage
Market neutral
Event driven
Equity relative value
Equity long/short
Strategy
% o
f R
esp
on
den
ts
“Global Macro ispredicted to be thebest performer in2009.”
32
2009 Alternative Investment Survey March 2009
Allocation Plans
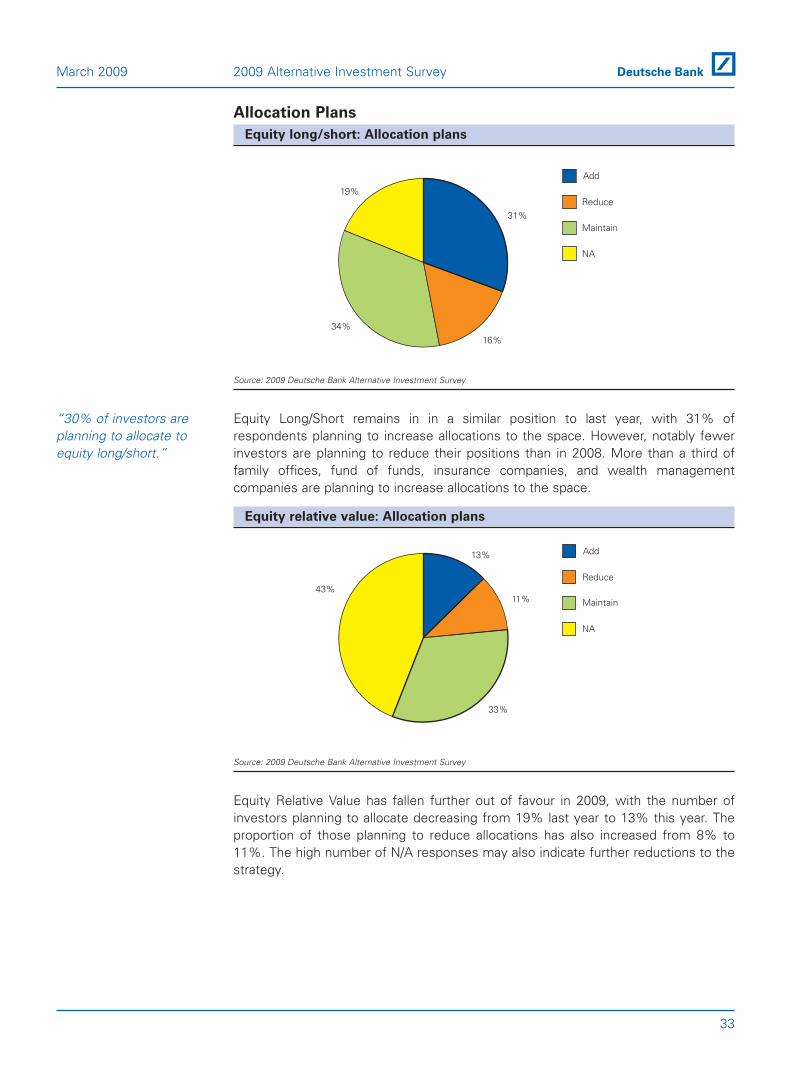
Equity long/short: Allocation plans
Source: 2009 Deutsche Bank Alternative Investment Survey
Equity Long/Short remains in in a similar position to last year, with 31% ofrespondents planning to increase allocations to the space. However, notably fewerinvestors are planning to reduce their positions than in 2008. More than a third offamily offices, fund of funds, insurance companies, and wealth managementcompanies are planning to increase allocations to the space.
Equity relative value: Allocation plans
Source: 2009 Deutsche Bank Alternative Investment Survey
Equity Relative Value has fallen further out of favour in 2009, with the number ofinvestors planning to allocate decreasing from 19% last year to 13% this year. Theproportion of those planning to reduce allocations has also increased from 8% to11%. The high number of N/A responses may also indicate further reductions to thestrategy.
13%
11%
33%
43%
NA
Maintain
Reduce
Add
“30% of investors areplanning to allocate toequity long/short.”
31%
16%34%
19%
NA
Maintain
Reduce
Add
33
March 2009 2009 Alternative Investment Survey
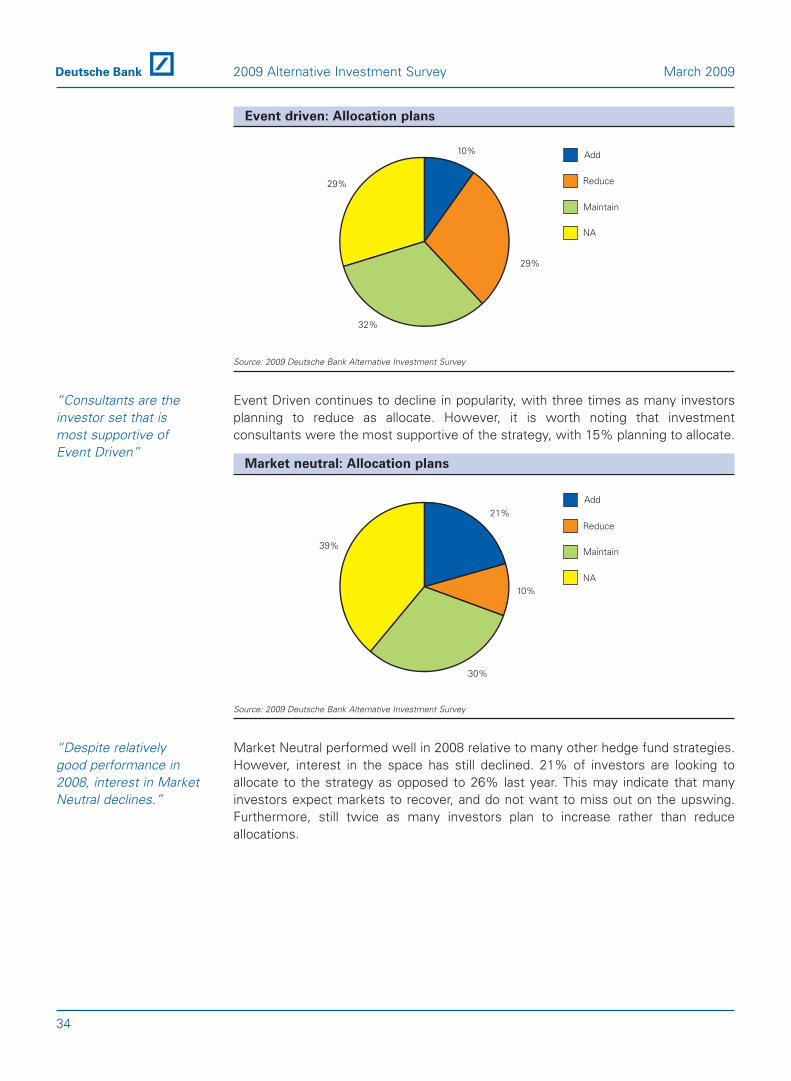
Event driven: Allocation plans
Source: 2009 Deutsche Bank Alternative Investment Survey
Event Driven continues to decline in popularity, with three times as many investorsplanning to reduce as allocate. However, it is worth noting that investmentconsultants were the most supportive of the strategy, with 15% planning to allocate.
Market neutral: Allocation plans
Source: 2009 Deutsche Bank Alternative Investment Survey
Market Neutral performed well in 2008 relative to many other hedge fund strategies.However, interest in the space has still declined. 21% of investors are looking toallocate to the strategy as opposed to 26% last year. This may indicate that manyinvestors expect markets to recover, and do not want to miss out on the upswing.Furthermore, still twice as many investors plan to increase rather than reduceallocations.
“Despite relativelygood performance in2008, interest in MarketNeutral declines.”
21%
10%
30%
39%
NA
Maintain
Reduce
Add
“Consultants are theinvestor set that ismost supportive ofEvent Driven”
10%
29%
32%
29%
NA
Maintain
Reduce
Add
34
2009 Alternative Investment Survey March 2009
Merger arbitrage: Allocation plans
Source: 2009 Deutsche Bank Alternative Investment Survey
For the second year in a row, Merger Arbitrage is the strategy with the highest levelof planned reductions. Clearly this reflects the global slowdown in M&A transactions.
Statistical arbitrage: Allocation plans
Source: 2009 Deutsche Bank Alternative Investment Survey
The number of investors planning to allocate to Statistical Arbitrage has halved thisyear from 26% to 13%. However, the proportion of investors reducing their exposureto this strategy has remained the same at roughly 9% year over year.
13%
9%
25%
53%NA
Maintain
Reduce
Add
“Merger arbitrage isthe strategy with thehighest level of plannedreductions.”
6%
23%
27%
44%
NA
Maintain
Reduce
Add
35
March 2009 2009 Alternative Investment Survey
Credit long/short: Allocation plans
Source: 2009 Deutsche Bank Alternative Investment Survey
While down from 37% planning allocations last year, Credit Long/Short remains apopular strategy going into 2009 with 32% of investors planning to allocate. Thestrategy is particularly popular among wealth management companies andinvestment consultants, with over 35% of each group planning to allocate to thisstrategy.
Credit relative value: Allocation plans
Source: 2009 Deutsche Bank Alternative Investment Survey
Credit Relative Value has seen planned reductions increase from 8% last year, to 13%in 2009. This might be considered surprising given the large numbers of companiesthat are in distress. However, uncertainty regarding the value and liquidity of theunderlying credit may be one reason investors are increasingly averse to this strategy.
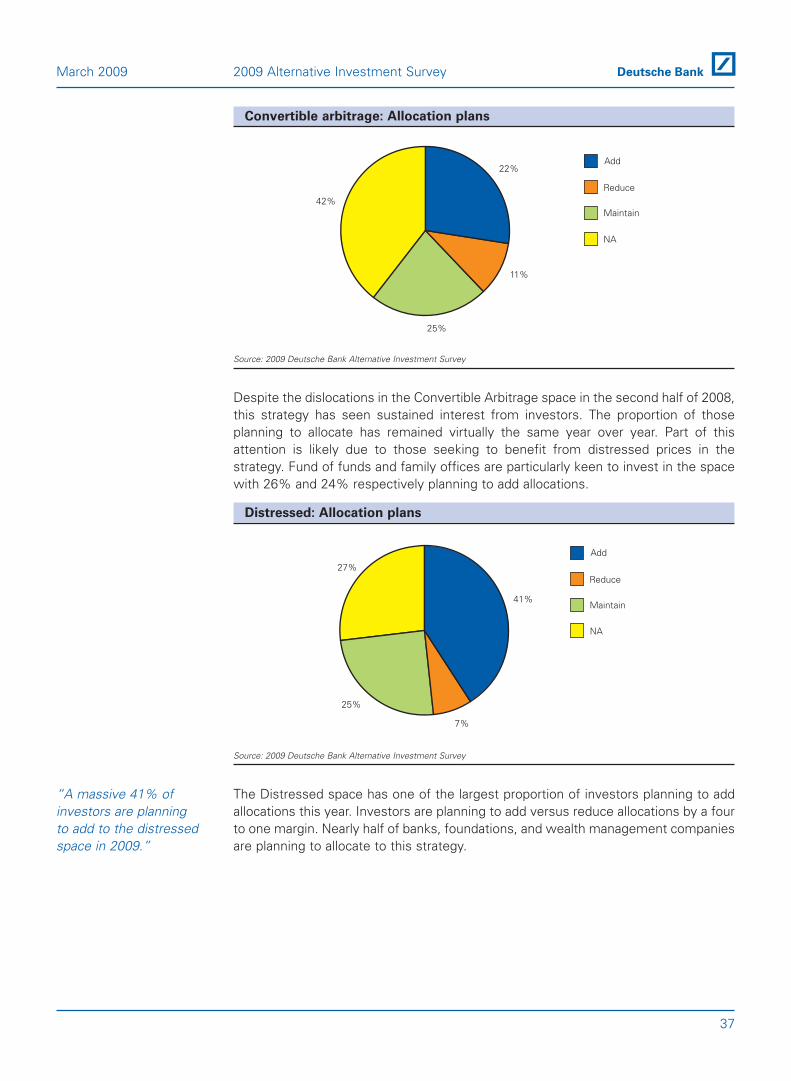
Source: 2009 Deutsche Bank Alternative Investment Survey
Despite the dislocations in the Convertible Arbitrage space in the second half of 2008,this strategy has seen sustained interest from investors. The proportion of thoseplanning to allocate has remained virtually the same year over year. Part of thisattention is likely due to those seeking to benefit from distressed prices in thestrategy. Fund of funds and family offices are particularly keen to invest in the spacewith 26% and 24% respectively planning to add allocations.
Distressed: Allocation plans
Source: 2009 Deutsche Bank Alternative Investment Survey
The Distressed space has one of the largest proportion of investors planning to addallocations this year. Investors are planning to add versus reduce allocations by a fourto one margin. Nearly half of banks, foundations, and wealth management companiesare planning to allocate to this strategy.
“A massive 41% ofinvestors are planningto add to the distressedspace in 2009.”
41%
7%
25%
27%
NA
Maintain
Reduce
Add
22%
11%
25%
42%
NA
Maintain
Reduce
Add
37
March 2009 2009 Alternative Investment Survey
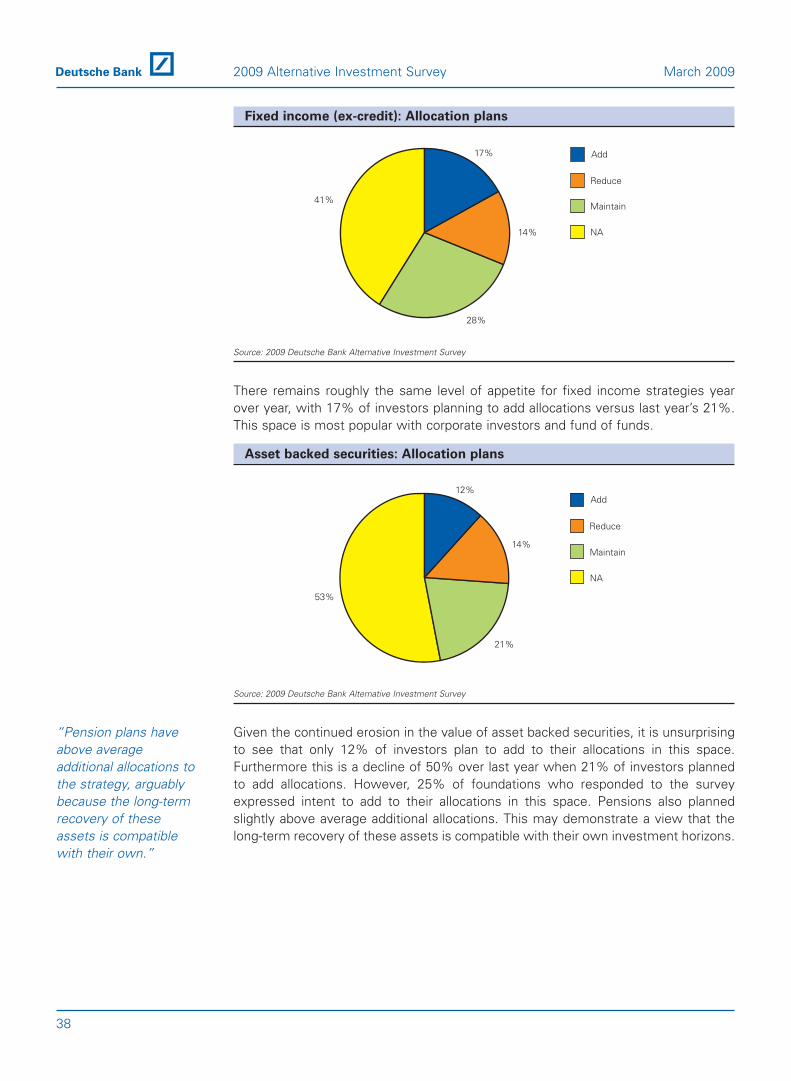
Fixed income (ex-credit): Allocation plans
Source: 2009 Deutsche Bank Alternative Investment Survey
There remains roughly the same level of appetite for fixed income strategies yearover year, with 17% of investors planning to add allocations versus last year’s 21%.This space is most popular with corporate investors and fund of funds.
Asset backed securities: Allocation plans
Source: 2009 Deutsche Bank Alternative Investment Survey
Given the continued erosion in the value of asset backed securities, it is unsurprisingto see that only 12% of investors plan to add to their allocations in this space.Furthermore this is a decline of 50% over last year when 21% of investors plannedto add allocations. However, 25% of foundations who responded to the surveyexpressed intent to add to their allocations in this space. Pensions also plannedslightly above average additional allocations. This may demonstrate a view that thelong-term recovery of these assets is compatible with their own investment horizons.
“Pension plans haveabove averageadditional allocations tothe strategy, arguablybecause the long-termrecovery of theseassets is compatiblewith their own.”
12%
14%
21%
53%
NA
Maintain
Reduce
Add
17%
14%
28%
41%
NA
Maintain
Reduce
Add
38
2009 Alternative Investment Survey March 2009
Volatility arbitrage: Allocation plans
Source: 2009 Deutsche Bank Alternative Investment Survey
Investors plan to add versus reduce allocations by a two to one margin. This isperhaps surprising given the difficult time many volatility funds faced last year. Bothbanks and fund of funds are planning to add allocations to this space at an aboveaverage level, both near 25%.
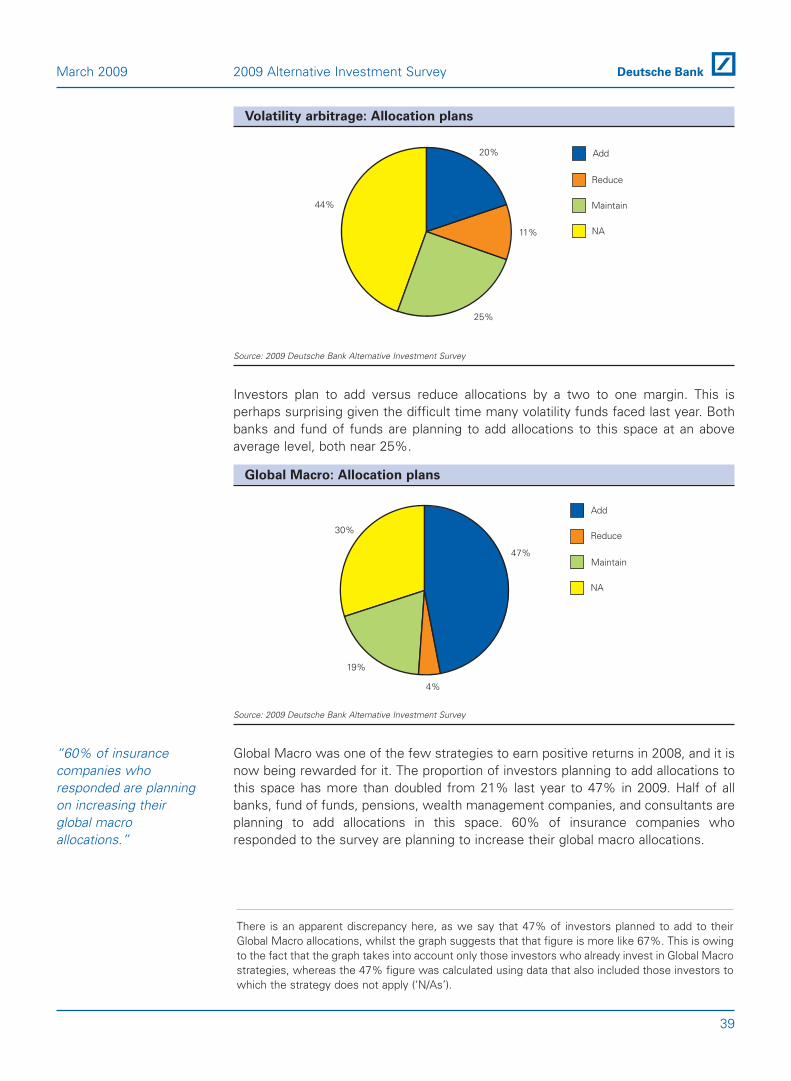
Global Macro: Allocation plans
Source: 2009 Deutsche Bank Alternative Investment Survey
Global Macro was one of the few strategies to earn positive returns in 2008, and it isnow being rewarded for it. The proportion of investors planning to add allocations tothis space has more than doubled from 21% last year to 47% in 2009. Half of allbanks, fund of funds, pensions, wealth management companies, and consultants areplanning to add allocations in this space. 60% of insurance companies whoresponded to the survey are planning to increase their global macro allocations.
“60% of insurancecompanies whoresponded are planningon increasing theirglobal macroallocations.”
47%
4%
19%
30%
NA
Maintain
Reduce
Add
20%
11%
25%
44%
NA
Maintain
Reduce
Add
39
March 2009 2009 Alternative Investment Survey
There is an apparent discrepancy here, as we say that 47% of investors planned to add to theirGlobal Macro allocations, whilst the graph suggests that that figure is more like 67%. This is owingto the fact that the graph takes into account only those investors who already invest in Global Macrostrategies, whereas the 47% figure was calculated using data that also included those investors towhich the strategy does not apply (‘N/As’).
Commodities: Allocation plans
Source: 2009 Deutsche Bank Alternative Investment Survey
While those planning to add allocations to the commodities space have declined from36% in 2008 to 21% this year, the proportion planning to add is still double thatplanning to reduce allocations. Nearly a third of all family offices and a quarter ofwealth management companies are planning to add allocations to this strategy.
FX: Allocation plans
Source: 2009 Deutsche Bank Alternative Investment Survey
17% of investors plan to increase allocations to FX. While this is a decline over lastyear’s 21%, the proportion of those decreasing allocations has also fallen from 11%to 5%. This may reflect a desire to retain exposure and hedging in a space that hasbecome increasingly volatile in the midst of the credit crunch.
“There is a desire toretain exposure andhedging in a space thathas becomeincreasingly volatile.”
17%
23%
55%
5%
NA
Maintain
Reduce
Add
21%
28%
43%
8% NA
Maintain
Reduce
Add
40
2009 Alternative Investment Survey March 2009
CTA: Allocation plans
Source: 2009 Deutsche Bank Alternative Investment Survey
CTAs were the best performing strategy last year outside of short-biased funds1. Asa result the proportion of investors adding allocations to his space has remainedstrong, growing slightly from 28% last year to 32% this year. Part of the continueddemand in this strategy is likely due to CTAs having better liquidity relative to otherstrategies, at a time when the ability to make quick redemptions has increased inimportance. Over 40% of both banks and investment consultants are planning to addallocations to this space.
Multi-strategy: Allocation plans
Source: 2009 Deutsche Bank Alternative Investment Survey
Down on average 17% in 2008, multi-strategy funds have lost some of their previouspopularity going into 2009. The proportion of investors planning to allocate to thisspace has fallen from 31% last year to 11% this year. Many investors felt that multi-strategy funds suffered from their disproportionate coverable arbitrage exposure in2008.
“Multi-strategyallocation plans havehalved since 2008.”
11%
29%
35%
25%NA
Maintain
Reduce
Add
“CTAs often havebetter liquidity thanother strategies.”
32%
22%
41%
5%
NA
Maintain
Reduce
Add
41
March 2009 2009 Alternative Investment Survey
1 Past perfomance is not an indication of future results.
Cash: Allocation plans
Source: 2009 Deutsche Bank Alternative Investment Survey
In the last quarter of 2008 investors rapidly increased their cash positions, sometimesby three or four times. This increase could amount to as much as $300bn of cashsitting on the sidelines, waiting to be reinvested. Going into 2009, investors expect toreduce their cash allocations by a two to one margin. Asia, the Middle East, andEurope are the regions where investors expect to reduce cash allocations the most.Wealth management companies and insurance companies both plan to reduce theircash allocations by over 30%.
Regional Focus
Where will investors put their money in 2009?
The majority of investors predict that the best performing region for hedge fundinvestments in 2009 will be the United States and Canada. The percentage ofinvestors that predict this has doubled since last year, from 23% to 46%. One of themost significant contrasts to last year’s survey, though, is the emphasis on China asa region that is expected to perform well in 2009. In last year’s survey, only 10% ofinvestors felt that China would be the best-performing region of 2008; for 2009,however, that figure has risen to over 28%.
Which regions do you predict will perform BEST in 2009?
Source: 2009 Deutsche Bank Alternative Investment Survey
% o
f R
esp
on
den
ts
0%
10%
20%
30%
40%
50%
NA/Prefer not to answer
SouthAfrica
Middle East/NorthAfrica
RussiaEasternand Central
Europe(ex-Russia)
WesternEurope
LatinAmerica
UnitedStates/Canada
Asiaex-Japan
JapanIndiaChina
Region
“The US and Canadaare predicted byinvestors to be the bestperforming regions in2009.”
13%
31%
32%
24% NA
Maintain
Reduce
Add
42
2009 Alternative Investment Survey March 2009
Which regions do you predict will perform WORST in 2009?
Source: 2009 Deutsche Bank Alternative Investment Survey
It is worth noting that, despite the number of reductions in allocations across theboard, the percentage of investors looking to maintain their allocations at the samelevels ranges between 20% and 35% across all markets, including Eastern Europeand Russia. This shows that, whilst redemptions are clear for all to see, dedication toa variety of different regional focuses remains amongst investors in the hedge fundspace.
41% of the respondents predict that Eastern and Central Europe (including Russia)will be the worst performing region for hedge fund investments in 2009 (up from just17% last year). Accordingly, it seems that the most significant reduction in allocationsin 2009 will be in these regions.
Do you intend to add to, reduce, or maintain your allocations to
Eastern and Central Europe (ex-Russia)?
Source: 2009 Deutsche Bank Alternative Investment Survey
The percentage of investors planning to allocate to Eastern and Central Europe(excluding Russia) has fallen from 18% in 2008 to just 2% this year. The percentageof investors who plan to reduce their allocations has jumped from 4% to 22%.
2%
22%
23%
53%
NA
Maintain
Reduce
Add
“Dedication to a varietyof different regionsremains”
% o
f R
esp
on
den
ts
0%
5%
10%
15%
20%
25%
SouthAfrica
MiddleEast/NorthAfrica
RussiaEasternand Central
Europe (ex-Russia)
WesternEurope
LatinAmerica
UnitedStates/Canada
Asiaex-Japan
JapanIndiaChina
Region
43
March 2009 2009 Alternative Investment Survey
Do you intend to add to, reduce, or maintain your allocations to Russia?
Source: 2009 Deutsche Bank Alternative Investment Survey
Only a tiny percentage of investors this year (3%) are planning on adding to theirRussian allocations and 19% are planning on reducing them.
Do you intend to add to, reduce, or maintain your allocations to the
United States/Canada?
Source: 2009 Deutsche Bank Alternative Investment Survey
Taking the regional graphs into consideration, it is not surprising that over 36% of theinvestors surveyed said that they would add to their allocations in North American-focused funds this year, and a further 27% would maintain the allocations theyalready have. Only 6% said that they would be reducing their allocations to thisregion.
36%
6%
27%
31%
NA
Maintain
Reduce
Add
3%
19%
21%
57%
NA
Maintain
Reduce
Add
44
2009 Alternative Investment Survey March 2009
Do you intend to add to, reduce, or maintain your allocations to
Western Europe?
Source: 2009 Deutsche Bank Alternative Investment Survey
More investors plan to reduce their allocations to Western Europe than increasethem. Last year’s survey suggested that, despite Western Europe being predicted tobe one of the worst performing regions going into 2008, 21% of investors stillintended to add to their allocations in the region, whilst a further 36% planned tomaintain their allocations there. For 2009, though, these figures have fallen to 14%and 33% respectively.
Do you intend to add to, reduce, or maintain your allocations to China?
Source: 2009 Deutsche Bank Alternative Investment Survey
Nearly 18% of investors said that they would add to their allocations to China in 2009,compared to only 8% who plan to reduce their allocations (in the 2008 survey, thisfigure was 10%). This emphasises the relatively positive focus on China going into2009.
“18% of investors saidthey would add to theirallocations to China.”
18%
8%
26%
48%
NA
Maintain
Reduce
Add
“Most investors plan toreduce their allocationto Western Europe.”
14%
18%
33%
35%
NA
Maintain
Reduce
Add
45
March 2009 2009 Alternative Investment Survey
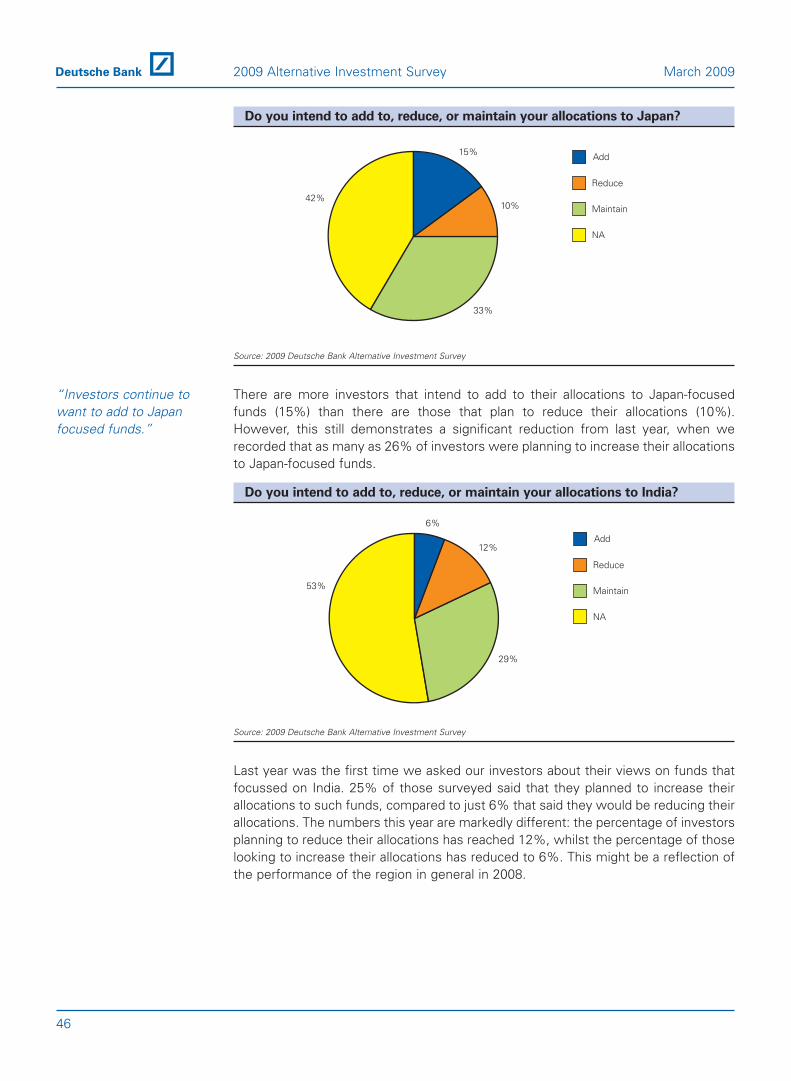
Do you intend to add to, reduce, or maintain your allocations to Japan?
Source: 2009 Deutsche Bank Alternative Investment Survey
There are more investors that intend to add to their allocations to Japan-focusedfunds (15%) than there are those that plan to reduce their allocations (10%).However, this still demonstrates a significant reduction from last year, when werecorded that as many as 26% of investors were planning to increase their allocationsto Japan-focused funds.
Do you intend to add to, reduce, or maintain your allocations to India?
Source: 2009 Deutsche Bank Alternative Investment Survey
Last year was the first time we asked our investors about their views on funds thatfocussed on India. 25% of those surveyed said that they planned to increase theirallocations to such funds, compared to just 6% that said they would be reducing theirallocations. The numbers this year are markedly different: the percentage of investorsplanning to reduce their allocations has reached 12%, whilst the percentage of thoselooking to increase their allocations has reduced to 6%. This might be a reflection ofthe performance of the region in general in 2008.
6%
12%
29%
53%
NA
Maintain
Reduce
Add
“Investors continue towant to add to Japanfocused funds.”
15%
10%
33%
42%
NA
Maintain
Reduce
Add
46
2009 Alternative Investment Survey March 2009
Do you intend to add to, reduce, or maintain your allocations to Asia
(ex-Japan)?
Source: 2009 Deutsche Bank Alternative Investment Survey
Funds that focussed on Asia (ex-Japan) last year were also popular with investors:32% of those surveyed indicated that they would increase their allocations to theregion. The figure this year has fallen to 18%, whilst the percentage of those lookingto reduce their allocations has more than doubled, from 4% in 2008 to over 9% in2009.
Do you intend to add to, reduce, or maintain your allocations to
Latin America?
Source: 2009 Deutsche Bank Alternative Investment Survey
Nearly 12% of investors surveyed said that they would be increasing their allocationsto funds that focused on Latin America, compared to as many as 30% of investors in2008. However, the relatively strong performance of Latin American hedge funds in2008 (compared to other emerging markets funds) is perhaps reflected in the fact thatthe percentage of investors looking to reduce their allocations has only risen by 2%,from 5% to 7%.
12%
7%
28%
53%
NA
Maintain
Reduce
Add
“Investors are stillincreasing theirallocations to LatinAmerica.”
18%
9%
35%
38%
NA
Maintain
Reduce
Add
47
March 2009 2009 Alternative Investment Survey
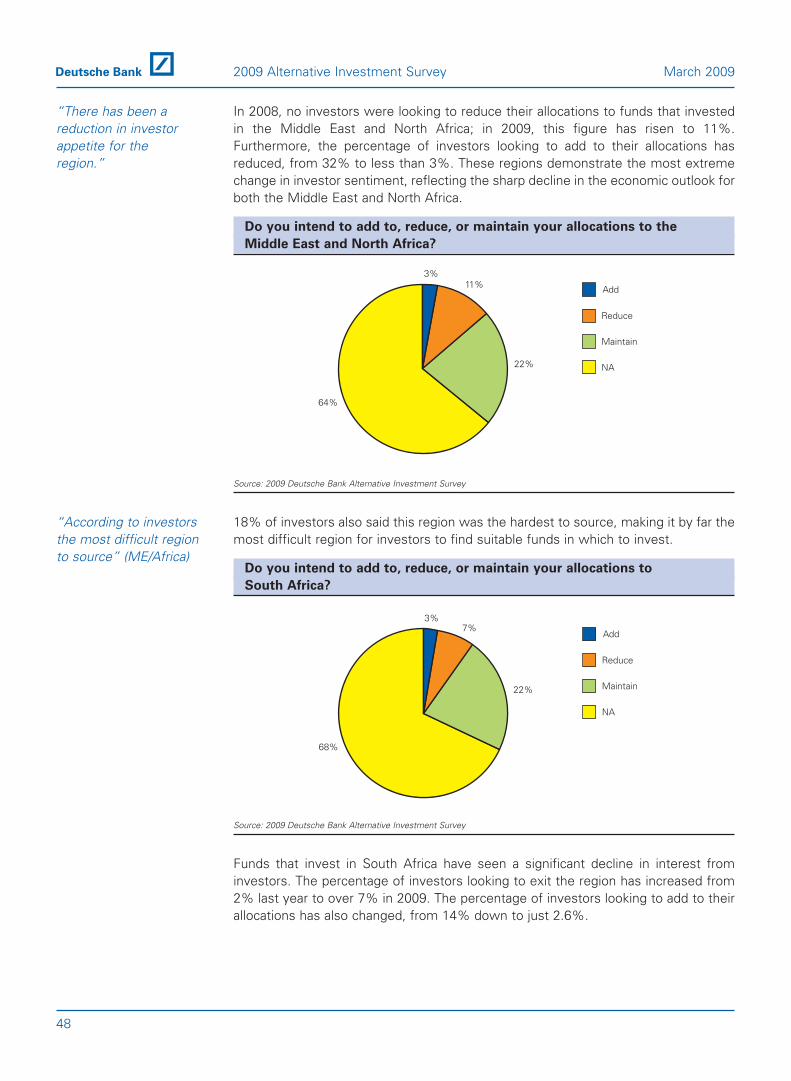
In 2008, no investors were looking to reduce their allocations to funds that investedin the Middle East and North Africa; in 2009, this figure has risen to 11%.Furthermore, the percentage of investors looking to add to their allocations hasreduced, from 32% to less than 3%. These regions demonstrate the most extremechange in investor sentiment, reflecting the sharp decline in the economic outlook forboth the Middle East and North Africa.
Do you intend to add to, reduce, or maintain your allocations to the
Middle East and North Africa?
Source: 2009 Deutsche Bank Alternative Investment Survey
18% of investors also said this region was the hardest to source, making it by far themost difficult region for investors to find suitable funds in which to invest.
Do you intend to add to, reduce, or maintain your allocations to
South Africa?
Source: 2009 Deutsche Bank Alternative Investment Survey
Funds that invest in South Africa have seen a significant decline in interest frominvestors. The percentage of investors looking to exit the region has increased from2% last year to over 7% in 2009. The percentage of investors looking to add to theirallocations has also changed, from 14% down to just 2.6%.
3%7%
22%
68%
NA
Maintain
Reduce
Add
“According to investorsthe most difficult regionto source” (ME/Africa)
3%11%
22%
64%
NA
Maintain
Reduce
Add
“There has been areduction in investorappetite for theregion.”
48
2009 Alternative Investment Survey March 2009
130/30
Confusion over terminology: 130/30 and UCITS III
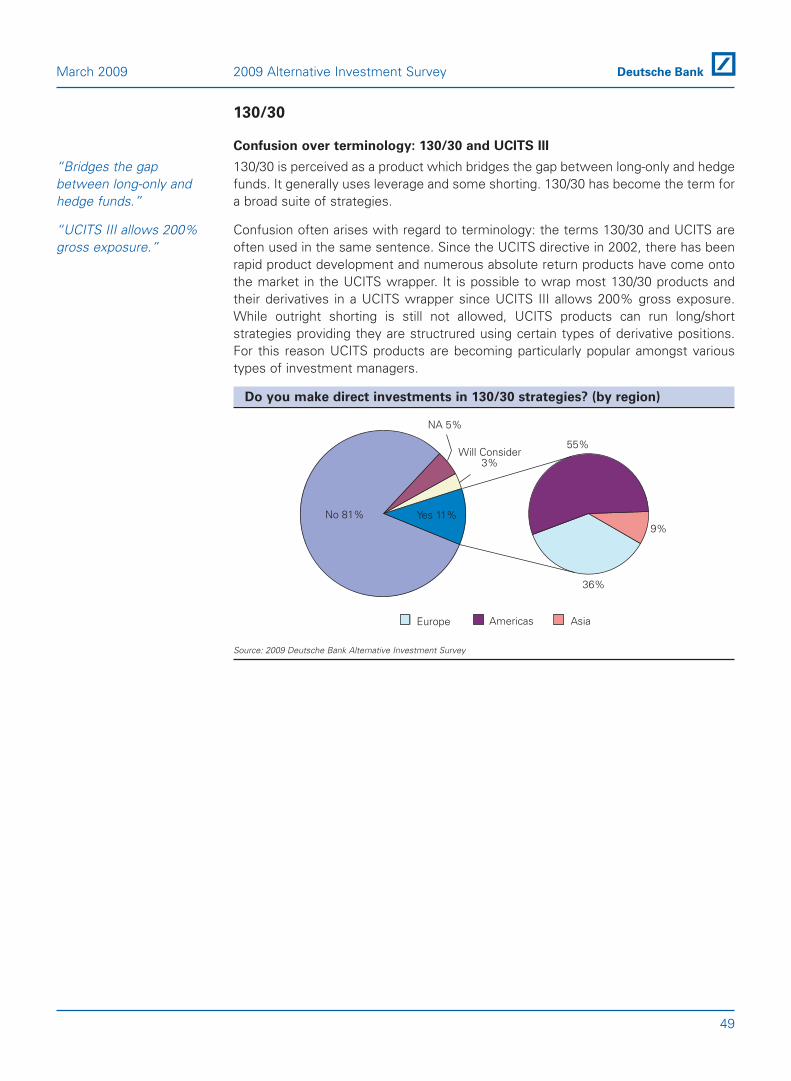
130/30 is perceived as a product which bridges the gap between long-only and hedgefunds. It generally uses leverage and some shorting. 130/30 has become the term fora broad suite of strategies.
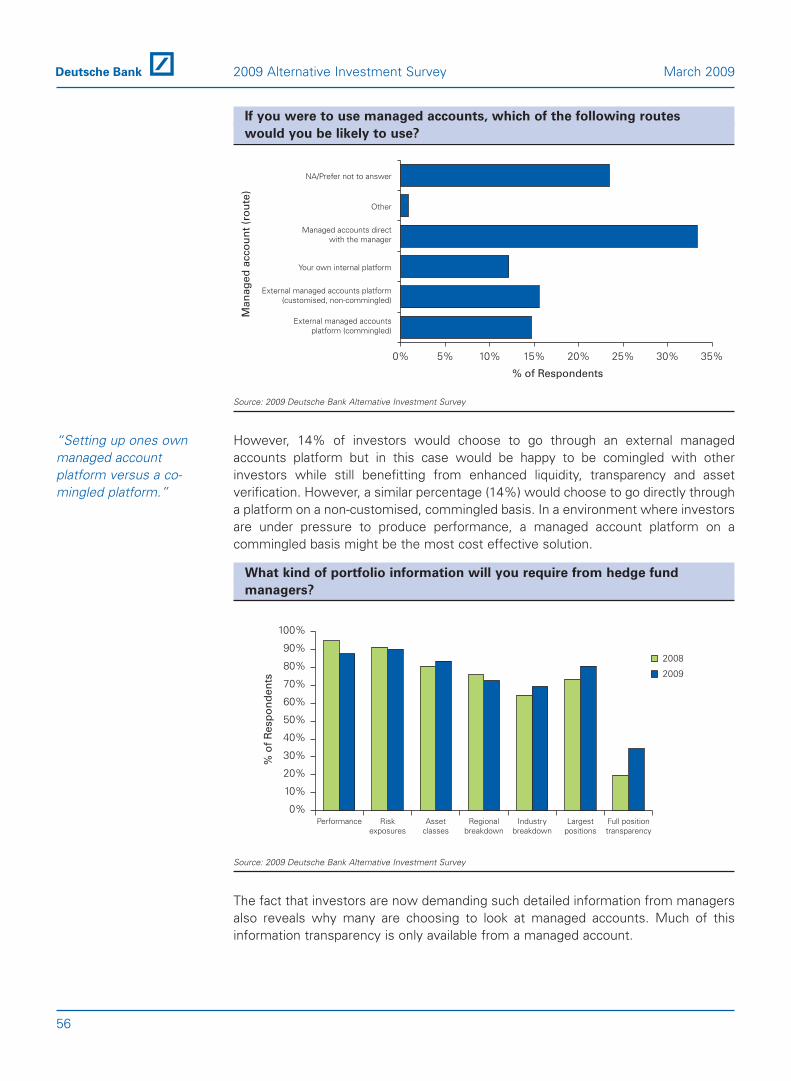
Confusion often arises with regard to terminology: the terms 130/30 and UCITS areoften used in the same sentence. Since the UCITS directive in 2002, there has beenrapid product development and numerous absolute return products have come ontothe market in the UCITS wrapper. It is possible to wrap most 130/30 products andtheir derivatives in a UCITS wrapper since UCITS III allows 200% gross exposure.While outright shorting is still not allowed, UCITS products can run long/shortstrategies providing they are structrured using certain types of derivative positions.For this reason UCITS products are becoming particularly popular amongst varioustypes of investment managers.
Do you make direct investments in 130/30 strategies? (by region)
Source: 2009 Deutsche Bank Alternative Investment Survey
No 81%
AmericasEurope Asia
NA 5%
Will Consider3%
Yes 11%
55%
9%
36%
“UCITS III allows 200%gross exposure.”
“Bridges the gapbetween long-only andhedge funds.”
49
March 2009 2009 Alternative Investment Survey
Leverage and performance are currently perceived to be the main issues with 130/30strategies. The reputation of leverage is so devalued amongst investors that it isdetrimental to 130/30.
Do you make direct investments in 130/30 strategies? (by investor type)
Source: 2009 Deutsche Bank Alternative Investment Survey
Bank Corporation Family Office Foundation Fund of FundsGovernmentOrganization
InsuranceCompany
InvestmentConsultants
Pensions Wealth ManagementCompany
No 81%
NA 6%
WillConsider
3%
Yes 10%27%
4%
8%
1%
19%
7%
9%
22%2%
1%
50
2009 Alternative Investment Survey March 2009
UCITS III
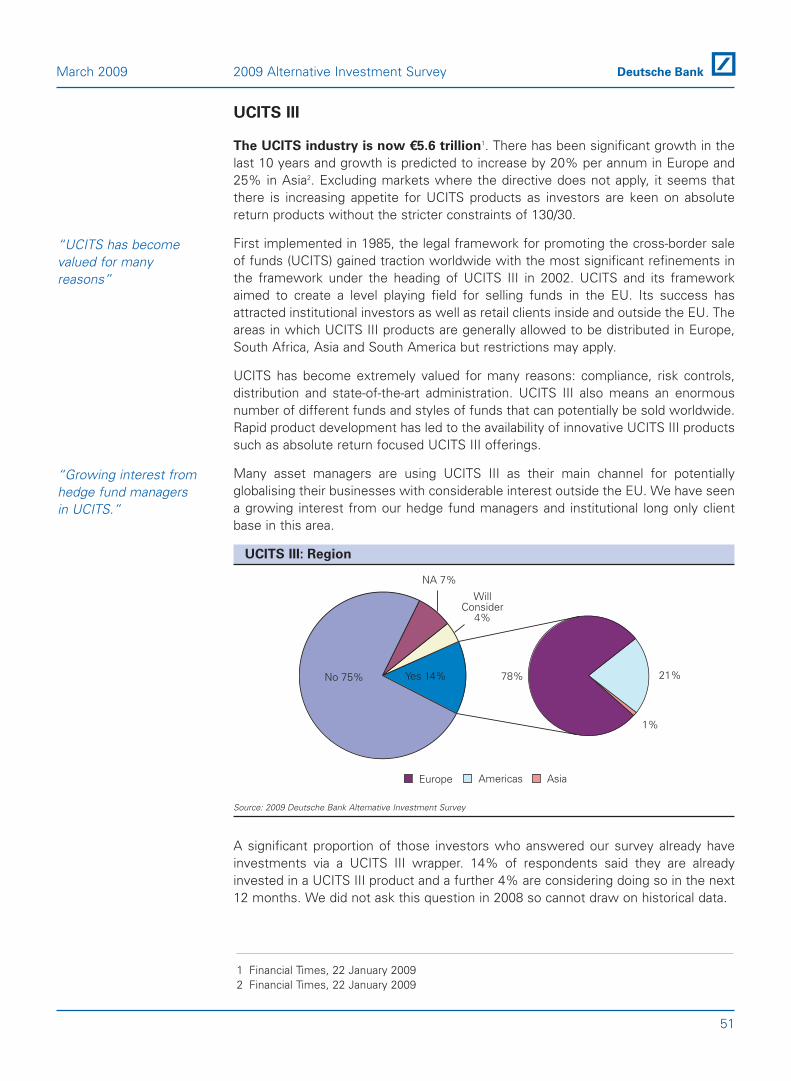
The UCITS industry is now €5.6 trillion1. There has been significant growth in thelast 10 years and growth is predicted to increase by 20% per annum in Europe and25% in Asia2. Excluding markets where the directive does not apply, it seems thatthere is increasing appetite for UCITS products as investors are keen on absolutereturn products without the stricter constraints of 130/30.
First implemented in 1985, the legal framework for promoting the cross-border saleof funds (UCITS) gained traction worldwide with the most significant refinements inthe framework under the heading of UCITS III in 2002. UCITS and its frameworkaimed to create a level playing field for selling funds in the EU. Its success hasattracted institutional investors as well as retail clients inside and outside the EU. Theareas in which UCITS III products are generally allowed to be distributed in Europe,South Africa, Asia and South America but restrictions may apply.
UCITS has become extremely valued for many reasons: compliance, risk controls,distribution and state-of-the-art administration. UCITS III also means an enormousnumber of different funds and styles of funds that can potentially be sold worldwide.Rapid product development has led to the availability of innovative UCITS III productssuch as absolute return focused UCITS III offerings.
Many asset managers are using UCITS III as their main channel for potentiallyglobalising their businesses with considerable interest outside the EU. We have seena growing interest from our hedge fund managers and institutional long only clientbase in this area.
UCITS III: Region
Source: 2009 Deutsche Bank Alternative Investment Survey
A significant proportion of those investors who answered our survey already haveinvestments via a UCITS III wrapper. 14% of respondents said they are alreadyinvested in a UCITS III product and a further 4% are considering doing so in the next12 months. We did not ask this question in 2008 so cannot draw on historical data.
Europe Americas Asia
WillConsider
4%
78% 21%
1%
NA 7%
No 75% Yes 14%
“Growing interest fromhedge fund managersin UCITS.”
“UCITS has becomevalued for manyreasons”
51
March 2009 2009 Alternative Investment Survey
1 Financial Times, 22 January 20092 Financial Times, 22 January 2009
Deutsche Bank was relatively surprised when looking at the regional breakdown ofwhere existing investors are based that 21% were based in America. This is morethan one would imagine given that UCITS products cannot be distributed in theregion. We suspect this figure comes from global entities answering for theirEuropean or Asian counterparts.
UCITS III: Investor type
Source: 2009 Deutsche Bank Alternative Investment Survey
Secondary Market
There has been a secondary market for hedge funds in existence for several years.Historically this had always been to allow investors to allocate to closed or difficult toaccess hedge funds at a premium to NAV in small size. 2008 saw a different type ofopportunity opening up, with a number of managers who had suspendedredemptions or invoked gates being offered at significant discounts (upwards of 20 –25%) by investors who sought liquidity.
The market still remains relatively small but is expected to grow substantially this yearas buyers and sellers move closer to a mutually acceptable price. Only 16% ofinvestors surveyed had already participated in the secondary market, however afurther 21% indicated that they expected to do so in 2009.
Have you participated in the secondary market for hedge fund stakes
in 2008?
Source: 2009 Deutsche Bank Alternative Investment Survey
5%5%
6%
77%
7%
NA/Prefer not to answer
No
Yes, I’ve been a buyer and a seller
Yes, I’ve been a seller
Yes, I’ve been a buyer
“Investors expect thesecondary market togrow”
Bank Family Office Fund of Funds InsuranceConsultants Pensions Wealth Management Company
WillConsider
4%
32% 14%
7%20%
7% 13%
7%
NA 7%
No 75% Yes 14%
52
2009 Alternative Investment Survey March 2009
While the numbers of buyers and sellers was relatively evenly balanced from thosethat had already engaged in transactions, over 18% of those expecting to participatein the market were looking to buy with only 4% stating that they were sellers and afurther 15% expected to buy and sell. In January and February at Deutsche Bank, wehave actually seen far more indications of interest from sellers, however these resultsmay suggest that should these sellers be forced to reduce their price out of necessityto raise cash, there will be a price at which a good number of buyers come into themarket.
Do you expect to participate in the secondary market for hedge fund
stakes in 2009?
Source: 2009 Deutsche Bank Alternative Investment Survey
Fund of funds comprised over 50% of those expecting to participate and there wasalso strong interest from consultants and the end institutions (pensions and insurancecompanies).
Those expecting to participate in the secondary market by firm type
Source: 2009 Deutsche Bank Alternative Investment Survey
6% 0%
13%
1%
55%
5%
8%
1%4%
7%
Wealth Management Company
Pension
NA/Prefer not to answer
Invsetment Consultants
Insurance Company
Fund of Funds
Foundation
Family Office
Corporation
Bank
18%
4%
15%
50%
13%
NA/Prefer not to answer
No
Yes, expected to buy and sell
Yes, expect to sell
Yes, expect to buy
“37% of investorsexpect to participate insecondary market in2009”
53
March 2009 2009 Alternative Investment Survey
Managed Accounts
As the liquidity crisis has intensified and investors focus increasingly on transparencyand risk management, managed accounts have become more attractive to aconsiderable number of the investors surveyed. 43% of investors said that given thecurrent environment they would be more likely to make a proportion of theirinvestments through managed accounts in the future. With 9% of investors alreadyusing managed accounts, a significant portion of the universe is now consideringmoving to this form of investment.
Following the events of 2008, will you be more likely to make a
proportion of your investments through managed accounts in the future?
Source: 2009 Deutsche Bank Alternative Investment Survey
This trend to a more liquid and transparent form of investment has been increasingsteadily since we started asking investors about managed accounts in 2004 (seegraph below). In addition, it is not just investor sentiment that impacts the increasedinterest. As raising capital becomes ever more challenging, managers that maypreviously not have considered running a separate account are recognizing thebenefits of this structure in terms of attracting new, and retaining existing, capital.
Do you use managed accounts?
Source: 2009 Deutsche Bank Alternative Investment Survey
0%
10%
20%
30%
40%
50%
60%
70%
2004 2005 2009
% o
f R
esp
on
den
ts
Year
NO
YES
N/A
2008
“More managers tolook at providingmanaged accounts forinvestors.”
0%
5%
10%
15%
20%
25%
30%
35%
40%
45%
50%
NA / Prefernot to answer
Already usemanaged accounts
No differenceLess likelyMore likely
% o
f R
esp
on
den
ts
Managed accounts (use)
“43% of investors arenow more likely tomake investments viamanaged accounts.”
54
2009 Alternative Investment Survey March 2009
Although liquidity is clearly an important driver for the growing interest in investing viaa managed account, in this environment of heightened vigilence, respondents namedimproved transparency/reporting as the most attractive feature of managed accounts,making it the most attractive feature for the highest number of investors (96%). Thiswas closely followed by improved liquidity and validation of assets, indicating thechallenges faced by investors subject to managers gating or freezing redemptions.
Furthermore, in the post Madoff era, investors seem to be understandably keen tohave a mechanism to validate the existence of a manager’s assets, either through anindependent third party or by owning the assets in their own managed account.
What do you consider to be the most attractive features of managed
accounts?1
Source: 2009 Deutsche Bank Alternative Investment Survey
However, the risks presented by being co-mingled with other investors, that becameobvious in the redemption cycle of the last year, are arguably still important to manyinvestors, as 45% would be most likely to use an account directly with the manageror their own platform. This reflects the increasing interest we see from institutionalinvestors looking to set up their own managed account platforms where they are thesole investor – taking advantage of increased liquidity and transparency, butcountering co-investor risk. Of course, the cost (financial and administrative) ofestablishing such platforms is onerous for both manager and investor, so ticket sizeneeds to justify the expenditure of significant resource. As a result, we see that 16%of investors would opt for an established external managed account platform butwould still wish to be the sole investor (non-comingled accounts).
“Concerns about thequality of fellowinvestors”
0
1
2
3
4
5
6
7
Ability tobe the sole
investor(not commingled)
Ability toimpose
guidelines/restrictions
Morefrequent
valuation/NAV
Independentvaluation/NAV
No gatingImprovedtransparency/
reporting
Improvedliquidity
Validation ofassets
Avera
ge s
core
Features of managed accounts
“Transparency andReporting are the mostattractive feature ofmanaged accounts.”
55
March 2009 2009 Alternative Investment Survey
1 Weighted average graphs: Investors were asked to value each category in order of importance. Ifa category was ranked first, the score was weighted accordingly, in order to accurately reflectrespondent sentiment.
If you were to use managed accounts, which of the following routes
would you be likely to use?
Source: 2009 Deutsche Bank Alternative Investment Survey
However, 14% of investors would choose to go through an external managedaccounts platform but in this case would be happy to be comingled with otherinvestors while still benefitting from enhanced liquidity, transparency and assetverification. However, a similar percentage (14%) would choose to go directly througha platform on a non-customised, commingled basis. In a environment where investorsare under pressure to produce performance, a managed account platform on acommingled basis might be the most cost effective solution.
What kind of portfolio information will you require from hedge fund
managers?
Source: 2009 Deutsche Bank Alternative Investment Survey
The fact that investors are now demanding such detailed information from managersalso reveals why many are choosing to look at managed accounts. Much of thisinformation transparency is only available from a managed account.
2008
2009
0%
10%
20%
30%
40%
50%
60%
70%
80%
90%
100%
Full positiontransparency
Largestpositions
Industrybreakdown
Regionalbreakdown
Assetclasses
Riskexposures
Performance
% o
f R
esp
on
den
ts
“Setting up ones ownmanaged accountplatform versus a co-mingled platform.”
2008 proved to be a seminal year for hedge fund investors. As assets undermanagement shrunk for both managers and investors, the consolidation that hadbeen noticeable in the industry for some time continued at a rapid pace.
This consolidation is reflected by respondents to this year’s survey, with a cluster ofinvestors having between $1bn and $4bn invested in hedge funds. AUMs herecontinue to grow year on year, although 2009 will very likely see the continuedshrinking of assets.
How much do you have invested in hedge funds?
Source: 2009 Deutsche Bank Alternative Investment Survey
However, although the industry size is reducing, the longevity and experience of theinvestors that took part in our survey is arguably testimony to their staying power.Investors that have been investing in hedge funds for between 5 and 10 years ormore make up the majority percentage, demonstrating their dedication to thisbusiness.
See graph on next page.
0%
3%
6%
9%
12%
15%
NA/Prefernot to
answer
$20 –$30bn
or more
$10 –$20bn
$8 –$10bn
$6 –$8bn
$4 –$6bn
$2 –$4bn
$1 –$2bn
$800 –$1bn
$600 –$800mn
$400 –$600mn
$200 –$400mn
$100 –$200mn
$10 –$100mn
Under$10mn
% o
f R
esp
on
den
ts
Size of Investment
59
March 2009 2009 Alternative Investment Survey
How long has your firm been investing in hedge funds?
Source: 2009 Deutsche Bank Alternative Investment Survey
As shown in the graph below, the average number of direct hedge fund allocationshas dropped in 2009. Until 2008 it had been increasing steadily, but this year it fell to54 from a peak of 63. This of course, also arguably contributes to the consolidationargument as investors focus only on those managers that have good performance,infrastructure and fundamentals to satisfy the most prudent of investors. It alsoreflects an increasing trend from investors to have fewer investments in order to tryand ensure they can monitor them all with the required diligence and detail.
How many managers do you invest with directly? (2005 – 2009)
Source: 2009 Deutsche Bank Alternative Investment Survey
0
10
20
30
40
50
60
70
2005 2006 2008 2009Year
Nu
mb
er
of
man
ag
ers
024
68
101214161820
More than
20 years
20 years
19years
18 years
17 years
16years
15 ye
ars
14 ye
ars
13years
12years
11 years
10 years
9 years
8 years
7 years
6 years
5 years
4 years
3 years
2 years
1 year
or less
% o
f R
esp
on
den
ts
No. of Years
60
2009 Alternative Investment Survey March 2009
A similar trend, reflecting the heavy redemptions seen across the industry, isnoticeable in the decline in average size of hedge funds with whom respondents areinvested. Although funds with AUMs of $1bn or more make up the largest proportionof most investors’ portfolios, the percentage allocation has declined from 52% to40%.
What is the average size of the hedge funds you are invested in?
Source: 2009 Deutsche Bank Alternative Investment Survey
The average ticket size has also dropped this year, perhaps reflecting investors’increased cautiousness – even managers that are high conviction have to be sized inusing a prudent approach. The average size of a single hedge fund allocation, whichgrew steadily until 2006, dropped off slightly in 2008, only to almost halve in 2009.However, this decline cannot be blamed on the market conditions of 2008 or 2009. Itshows that the consolidation of the industry has now been slowly happening forsometime.
Average hedge fund allocations since 2002
Source: 2009 Deutsche Bank Alternative Investment Survey
0
5
10
15
20
25
30
35
200920082006200520042002
Allo
cati
on
siz
e (
$m
n)
0%
10%
20%
30%
40%
50%
60%
2005 2006 2008 2009
Over $1bn
$500m-$1bn
$100-$500mn
Under $100mn
Year
% o
f R
esp
on
den
ts
61
March 2009 2009 Alternative Investment Survey
Over 60% of investors responded that their initial ticket sizes are between $1mn-$5mn, with follow-on allocations not significantly larger.
How large were your initial allocations to hedge funds last year?
Source: 2009 Deutsche Bank Alternative Investment Survey
How large were your follow-on allocations to hedge funds last year?
Source: 2009 Deutsche Bank Alternative Investment Survey
0%
5%
10%
15%
20%
25%
30%
35%
% o
f R
esp
on
den
ts
Morethan $50mn
$41mn –$50mn
$31mn –$40mn
$21mn –$30mn
$11mn –$20mn
$6mn –$10mn
$3mn –$5mn
$1mn –$2mn
Follow-on allocations
0%
10%
20%
30%
40%
50%
Morethan $50mn
$41mn –$50mn
$31mn –$40mn
$21mn –$30mn
$11mn –$20mn
$6mn –$10mn
$3mn –$5mn
$1mn –$2mn
Initial Allocations
% o
f R
esp
on
den
ts
62
2009 Alternative Investment Survey March 2009
Unsurprisingly, nearly 60% of respondents have no limitations on the percentage ofassets they can allocate to hedge funds. Of the 20% that do have restrictions, themajority can invest between 10-30% of their assets under management into hedgefunds.
Does your mandate limit your hedge fund allocation to a certain
percentage?
Source: 2009 Deutsche Bank Alternative Investment Survey
The number of investors looking to invest in hedge funds replicators is set to increasein 2009, as the graph below shows.
Do you make direct investments in hedge fund replicators?
Source: 2009 Deutsche Bank Alternative Investment Survey
NA/Prefer not to answer
No
Not currently – but will within the next 12 months
Yes7%
82%
6%
5%
20%
59%
21%
NA/Prefer not to answer
No limitations
Yes
63
March 2009 2009 Alternative Investment Survey
Investors, increasingly cautious, have reduced their allocations to managers Day One.For the same reasons that the number of new launches dropped dramatically in 2008,investors, constrained by prudence, caution and uncertainty, have scaled backallocations to managers that do not have a proven track record.
Do you invest Day One?
Source: 2009 Deutsche Bank Alternative Investment Survey
As mentioned before, while investors remain committed to hedge funds, thechallenging market conditions have sparked a renewed focus on risk management.Risk management moves to being the second most important factor when selectinga manager, and transparency becomes one of the top 5 manager selection criteria.
What FIVE factors are most important when assessing a hedge
fund manager? (2008 – 2009)
Source: 2009 Deutsche Bank Alternative Investment Survey
0%
20%
40%
60%
80%
100%
% o
f R
esp
on
den
ts
Factor
Transparency
Socially responsible
Risk management
Manager’s pedigree
Length of track record
Fund Volatility
Fees
Peer recommendations
Prior relationshipLock-up
Investment philosophy
Assets under management
Investment performance
0%
10%
20%
30%
40%
50%
60%
2009
2008
2006
Sometimes invest Day OnePrefer to invest Day OneNoHave not to date but would
% o
f R
esp
on
den
ts
Day One Investment
64
2009 Alternative Investment Survey March 2009
The focus on transparency was also borne out when we asked investors what theirbiggest challenges are when investing in hedge funds. In a year where almost everyaspect of investing raised its own set of problems, lack of transparency came in thirdplace, behind selecting/monitoring managers and poor returns. It was perceived to beeven more of a problem than redemptions from their own investors – the headlineitem of the year.
What are your biggest challenges when it comes to investing? Select
all that apply
Source: 2009 Deutsche Bank Alternative Investment Survey
While the focus on manager selection criteria has changed, the due diligence processdoes not seem to have altered significantly. As has typically been the case, over 50%of investors need between 3-6 months to carry out full due diligence, although aquarter of respondents say they can move in less than 3 months.
How long does your due diligence process take (on average)?
Source: 2009 Deutsche Bank Alternative Investment Survey
25%
52%
2%
5%
16%
NA/Prefer not to answer
More than 1 year
7-12 months
3-6 months
Less than 3 months
0%
10%
20%
30%
40%
50%
Not enoughnew
launches
Other(pleasespecify)
Lack ofaccess to
high qualitymanagers
Currencyhedges
NA/Prefernot to
answer
Highvolatility
Redemptionsfrom YOURinvestors
Lack oftransparency
Poorreturns
Selecting/monitoringmanagers
% o
f R
esp
on
den
ts
Challenges
65
March 2009 2009 Alternative Investment Survey
We asked respondents to name the main benefits of hedge fund investments (bychecking all that applied). Diversification and low correlation to other asset classeswere the two most regularly cited benefits. Investors recognize that although 2008was the worst year on record for hedge funds, an average of down 18.75%1 was asignificant outperformance relative to traditional asset classes’ performance. Inaddition, the entrepreneurial nature of the hedge fund industry, its ability to movenimbly and flexibly, arguably makes it well placed to partake in the upside morequickly than its traditional counterparts.
What are the main benefits of hedge fund investments?
Source: 2009 Deutsche Bank Alternative Investment Survey
Respondents to the survey display the ability to be relatively nimble, in theirresponses to rebalancing their portfolios. A considerable percentage state that theyrebalance their portfolios once a month, although our analysis suggests that thisincludes tweaking positions and hedging through FX. A similar number rebalanceevery 3 months, perhaps a function of the most common notice period forredemptions requiring 45 days’ notice (whether bi-annual, quarterly or monthly).
How often do you rebalance your portfolio?
Source: 2009 Deutsche Bank Alternative Investment Survey
0%
5%
10%
15%
20%
25%
30%
35%
% o
f R
esp
on
den
ts
Months0 1 2 3 4 6 8 9 12 24 48
% of Respondents
0% 10% 20% 30% 40% 50% 60% 70% 80%
Higher volatility than other asset classes
Other
NA / Prefer not to answer
Better Sharpe ratio
Lower volatility than other asset classes
Long-term outperformance of other asset classes
Absolute returns
Low correlation to other asset classes
Diversification to other asset classes
Ma
in b
en
efi
ts
66
2009 Alternative Investment Survey March 2009
1. HFRI Fund Weighted Composite Index
Redemptions will of course have contributed to the rebalancing reflected by investorsin the survey. Nearly 40% of investors redeemed between 1 and 5 managers in full –just under 10% of the average number of managers in a portfolio. The number ofpartial redemptions was, however, higher with a large percentage of investorspartially redeeming between 10 and 20 managers.
How many full redemptions have you made in the last 12 months?
Source: 2009 Deutsche Bank Alternative Investment Survey
How many partial redemptions have you made in the last 12 months?
Source: 2009 Deutsche Bank Alternative Investment Survey
The reasons for redemptions have been well documented. Clearly, performance hasbeen a driver, but client pressures have compounded the withdrawals. Investors,under pressure from their own investors, have been forced to redeem from even thebest performing managers. Investors have therefore been raising cash to meet theseredemptions (which, in many cases, were on a smaller scale than anticipated) as wellas wanting to be able to move opportunistically in 2009. In some cases, investorshave been confused by the market behaviour, and cash has been seen as the onlysafe “asset class”.
0% 5% 10% 15% 20% 25% 30% 35%
More than 100
Between 81 and 100
Between 61 and 80
Between 41 and 60
Between 21 and 40
Between 10 and 20
Between 6 and 10
Between 1 and 5
0
Nu
mb
er
of
Part
ial R
ed
em
pti
on
s
% of Respondents
0% 5% 10% 15% 20% 25% 30% 35% 40%
More than 100
Between 81 and 100
Between 61 and 80
Between 41 and 60
Between 21 and 40
Between 11 and 20
Between 6 and 10
Between 1 and 5
0N
um
ber
of
Full R
ed
em
pti
on
s
% of Respondents
67
March 2009 2009 Alternative Investment Survey
Nearly 50% of investors are currently holding between 5 and 30% cash, a significantholding and an increase from last year’s survey. It is interesting to note the highpercentage of respondents for which this question was not relevant or that preferrednot to answer – perhaps indicating the concerns about disclosing high cash levels,while still charging fees.
How much cash are you currently holding?
Source: 2009 Deutsche Bank Alternative Investment Survey
We also asked investors what their average cash position was during the first 6months of 2008, when an overwhelming 50% of investors responded that they wereholding 10% cash. Only 11% were holding 20-30% and 35% still refused to disclose.However, by the second half of 2008, that 50% that were holding 10% cash hadreduced to 34%, with those investors holding between 20 -30% and 30-40%increasing to 18% and 8% respectively. These changes reflect the deterioratingmarket outlook, as investors moved to raise their cash levels and investors expectcash levels to continue to remain high.
What will your cash position be in 6 months’ time?
Source: 2009 Deutsche Bank Alternative Investment Survey
However, while levels will remain high relative to cash levels seen prior to this crisis,investors expect to redeploy a substantial percentage by the end of the first half of2009. Respondents are currently sitting on $294bn of cash. In 6 months’ time, theyexpect to have reduced this to approximately $212bn, suggesting that $82bn of cashwill be invested back into the industry over the next 6 months.
The move to cash has been one of the noticeable trends of 2008, reducing the sizeof invested assets. The significant reduction of leverage has of course alsocontributed to the smaller size of the industry as a whole. Leverage that hadhistorically been an attractive means of achieving outsized returns for many funds andinvestors alike, proved to be the downfall of many, as market volatility and magnifiedlosses took their toll. As a result, much like the funds in which they invest, investorssignificantly reduced leverage on their own portfolios.
Do you apply leverage to your portfolio?
Source: 2009 Deutsche Bank Alternative Investment Survey
How has your leverage changed over the last 12 months?
Source: 2009 Deutsche Bank Alternative Investment Survey
The institutionalisation of hedge fund investing, coupled with the continueddeterioration of financial markets, have made it increasingly hard to raise money fornew launches. Previously, hedge funds that started with small sums of capital couldfind investors to commit to invest once the critical level of assets was reached(approx. $50mn). However, we believe that the institutionalisation of the hedge fundinvesting community is pushing this critical level to a minimum $100mn.
Seeding, therefore, has become a very popular route for new and emerging managersto overcome the hurdle of reaching the critical size, in order to gain visibility andprofitability from Day One. There have also been a number of investors moving intothis space, looking to benefit from the upside of seeding a successful manager. Bothseed investors and hedge fund platforms have found, in the seeding business, asolution for diversifying risk and smoothing returns while securing capacity rights.
The current environment continues to provide a large pool of talent looking forseeding deals. Seeders have an increasing ability to secure talented individuals onterms that are favourable to the seed investor.
In our survey, we looked to see how many of our respondents seeded managers. Wewere surprised to find that a significant 20% of investors seed managers in order toget discounted fees, participation in economics or equity stakes.
Do your seed managers get discounted fees, participation in
economics, or equity stakes?
Source: 2009 Deutsche Bank Alternative Investment Survey
It seems that whilst the number of Day One investors is falling, the number of thoseinvestors willing to seed for some form of shared economics is increasing. Investorsare no longer willing to take the risk of a Day One allocation without something extrasuch as shared economics.
0%
10%
20%
30%
40%
50%
NA/Prefer not to answerNoYes
% o
f R
esp
on
den
ts
70
2009 Alternative Investment Survey March 2009
The average seeding tickets from this investor set is also increasing. 31% of investorsseed with tickets of $10mn or less; however, 51% give managers a ticket between$10mn – $100mn. The increase in ticket sizes is no doubt due to the fact that seedersrealize managers have to reach a much greater critical mass before other investorscan participate in the fund.
Do you require a fee for seeding?
Source: 2009 Deutsche Bank Alternative Investment Survey
Consultants
Investment consultants form the bridge between investment managers and pensionfunds. In the U.K., they are used by more than 80-95%1 of pension funds to provideoverall advice on investment matters. In the US, this percentage stands at more like70-80%2. The use of consultants by other institutional investors is much lower. Thesehigh percentages highlight the importance of this investor set and furthermore theimpact they can have on allocations to the hedge fund industry.
Do you use consultants?
Source: 2009 Deutsche Bank Alternative Investment Survey
No80%
NA11%
Yes9%
Asia/Australia15%
Europe/Middle East
25%
Americas60%
NA/Prefer not to answer
No
Yes
33%
44%
23%
71
March 2009 2009 Alternative Investment Survey
1 Deutsche Bank Hedge Fund Capital Group research2 Preqin 2009 Global Hedge Fund Investor survey
When we asked investors if they used a consultant, over 9% of respondents saidthey employ the skills of a consultant. Since 2002, this percentage of respondentshas remained relatively flat.
Percentage of respondents using consultants (2002 – 2009)
Source: 2009 Deutsche Bank Alternative Investment Survey
Furthermore, all varieties of investors claim they use consultants.
Consultant clients by region
0%
5%
10%
15%
20%
25%
30%
Americas
Europe/Middle East
Asia/Australia/NZ
NA/Prefernot to
answer
WealthManagement
Company
PensionInsuranceCompany
GovernmentOrganization
Fund ofFunds
FoundationsFamily OfficeCorporationsBank
% o
f R
esp
on
den
ts
Investor type
0%
2%
4%
6%
8%
10%
12%
14%
16%
18%
2002 2003 2005 2006 2008 2009Year
% o
f R
esp
on
den
ts
72
2009 Alternative Investment Survey March 2009
Interestingly, when we asked consultants who their client base were, they did notmention funds of funds, but they did cite the more institutional types of investor, asyou can see in the graph below.
Consultants: Client breakdown
Source: 2009 Deutsche Bank Alternative Investment Survey
Average consultant: Client base
Source: 2009 Deutsche Bank Alternative Investment Survey
It seems that the number of clients consultants are advising on hedge funds andfunds of funds has shrunk considerably since last year. This is no surprise. In the lastcouple of years the amount channelled into the alternatives space has beenconsiderable and therefore a slow down in allocations from consultants and theirclients is to be expected.
We believe, however, hedge fund investing will remain on the consultant agenda.Hedge funds will face more detailed due diligence in the future, as will the rest of theindustry. Qualitative due diligence will become more important and rigorous thansimply checking off a list of due diligence questions. Many plans are also seekinggreater transparency and are debating whether separately managed accounts are thebest vehicle given the additional resources required to analyze the data.
0
20
40
60
80
100
2008 2009
# o
f C
lien
ts
Year
Other
Corporation
Bank
Government Fund
Insurance Company
Foundation
Endowment
Private Pension
Public Pension
Family Office/High Net Worths17%
9%
19%
12%
10%
10%
2%
7%
3%
11%
73
March 2009 2009 Alternative Investment Survey
74
2009 Alternative Investment Survey March 2009
Hedge Fund Managers:Evolution of terms and
future pressures
76
2009 Alternative Investment Survey March 2009
Hedge Fund Managers: Evolution of terms andfuture pressures
2008 proved to be a highly unprecedented year for hedge funds and their investors inthe most challenging of market circumstances. Performance notwithstanding, neverbefore had we seen such a raft of managers invoking gates, suspending redemptionsand increasing side pockets along with numerous other means to dissuade andprevent investors from redeeming. Investors were forced to employ a number ofthese measures themselves as they too were impacted by sizeable redemptionsfrom their underlying clients. The liquidity mismatch that had long been recognised inthe industry as potentially damaging finally came to the fore as both managers andinvestors were caught out in a rapidly deteriorating AUM environment.
With this in mind, we felt it was particularly important in this year’s survey to ascertaininvestors’ current appetite for allocating capital to managers with lock-ups and longnotice periods as well as their views on the various measures taken by managers tolimit redemptions.
What is the longest lock-up that you will accept on new hedge fund
investments?
Source: 2009 Deutsche Bank Alternative Investment Survey
We noticed this year less willingness on the part of investors to have their capitallocked up by comparison with 2008. The majority of investors, irrespective of investortype, said that they could not accept a lock up of greater than 1 year. As we wouldexpect, the appetite amongst more institutional investors, including insurancecompanies, foundations, pensions and investment consultants was greater for 2 –3 year locked up product.
“Less willingness toaccept lock-ups”
0%
10%
20%
30%
40%
50%
60%
70%
80%
NA/Prefer not to answer
No lock-up is acceptable
3 or more years
2 years
1 year
Less than 1 year
N/A/Prefernot to
answer
InvestmentConsultants
WealthManagement
Company
PensionInsuranceCompany
Fund ofFunds
FoundationFamily OfficeCorporationBank
Investor type
% o
f R
esp
on
den
ts
77
March 2009 2009 Alternative Investment Survey
Maximum Lock-up You are Willing to Accept (2009)
Source: 2009 Deutsche Bank Alternative Investment Survey
Maximum Lock-up You are Willing to Accept (2008)
Source: 2008 Deutsche Bank Alternative Investment Survey
8%
32%
31%
24%
5%
3 or more years
2 years
No lock-up is acceptable
1 year
Less than 1 year
14%
34%
30%
14%
8%
3 or more years
2 years
No lock-up is acceptable
1 year
Less than 1 year
78
2009 Alternative Investment Survey March 2009
On a regional basis, European investors continue to be the most opposed to long lock-ups, with 10% stating that no lock-up was acceptable and only 25% able to acceptlock-ups of 2 years or more, compared with 34% and 45 % from their Asian and UScounterparts respectively. US investors continue to be the least resistant to locks,with only 8% indicating that a lock-up of 1 year or less would be required.
What is the longest lock-up that you will accept on new hedge fund
investments?
Source: 2009 Deutsche Bank Alternative Investment Survey
When asked if they would accept longer lock-ups in exchange for lower managementfees, 30% of investors said that they would consider so doing. We have historicallyseen managers launch share classes with lower fees to compensate investors forilliquidity and it would appear that investors increasingly find this a palatable option.
Would you accept longer lock-ups in exchange for lower
management fees?
Source: 2009 Deutsche Bank Alternative Investment Survey
Another way that managers have found to soften the blow of longer lock-ups is tostructure Hedge Fund / Private Equity hybrid products. This would include funds setup with an investment period of two to three years where the capital is called andreinvested, followed by a liquidation period where any realizations are distributed tothe partners. Over 40% of investors said that they would consider investing in such
NA/Prefer not to answer
No
Yes30%
61%
9%
0%
5%
10%
15%
20%
25%
30%
35%
40%
NA/Prefer not to answer
No lock-up is acceptable
3 or more years
2 years
1 year
Less than 1 year
AmericasEurope/Middle EastAsia/Australia/NZ
Region
% o
f R
esp
on
den
ts
“European investorscontinue to be themost opposed to lock-ups”
79
March 2009 2009 Alternative Investment Survey
a vehicle suggesting that investors will be prepared to lock up capital for illiquidstrategies, but will look to be compensated for this risk and would not expect to payperformance fees until such point as the profits are realised.
Would you consider a hedge fund with a private equity-style structure
for less liquid assets?
Source: 2009 Deutsche Bank Alternative Investment Survey
After the initial lock-up, investors’ overwhelming preference is for quarterly liquidity,with almost 50% of investors stating that this was required. A smaller number ofinvestors, predominantly end institutions and consultants, would continue to acceptsemi-annual/annual liquidity. These numbers have not changed significantly since wefirst asked the question in 2005.
What liquidity do you require, even in the case of a lock-up?
Source: 2009 Deutsche Bank Alternative Investment Survey
The maximum notice period acceptable for most investors, irrespective of type, is90 days or fewer.
“90 days’ noticemaximum acceptabilityfor the majority ofinvestors”
0%
10%
20%
30%
40%
50%
60%
No Preference
Annually
Semi Annually
Quarterly
Monthly
2005 2006 2008 2009Year
% o
f R
esp
on
den
ts
“Quarterly liquiditycontinues to be thepreferred option”
43%50%
7%
NA/Prefer not to answer
No
Yes
80
2009 Alternative Investment Survey March 2009
What is the maximum notice period acceptable?
Source: 2009 Deutsche Bank Alternative Investment Survey
In the light of 2008’s challenging environment, we surveyed investors as to whetherthey were willing to accept longer lock-ups and less favourable liquidity terms than in2008. Understandably the majority response was negative, however, it wasinteresting to note that a select group of investors were prepared to accept bothconditions and these again tended to be predominantly institutional investors.
The issue of sidepockets rose to the fore last year as several managers moved illiquidpositions in their portfolios into sidepockets. When asked if they were able to investinto managers with sidepockets most investors expressed that this would depend onthe underlying strategy, however 32% of investors indicated that they could not orwould not invest into a manager with with a sidepocket.
Would you consider investing in a hedge fund with a side-pocket?
Source: 2009 Deutsche Bank Alternative Investment Survey
2008 proved to be a very difficult year for new start-ups looking to raise capital, withfar fewer launches raising assets of > $50mn by comparison with other years. Wenoticed a marked reluctance on the part of investors compared to previous years toallocate to managers with a small AUM. When we first asked the question back in2002 as to whether investors required a minimum AUM before investing, almost two
“Over half of investorsonly allocate to fundsabove $100 million”
0%
10%
20%
30%
40%
50%
60%
70%
80%
90%
100%
N/A
Depends on the Strategy
Mandate Forbids thistype of investment
No
4%5%5%
32%
63%
25%
70%
40%
2%
32%
22%
Yes
2006 2008 2009
% o
f R
esp
on
den
ts
Year
0%
10%
20%
30%
40%
50%
60%
More than 90 daysUp to 90 daysUp to 60 daysUp to 45 daysUp to 30 days
thirds of investors said that they had no minimum requirement. In 2009, this haddropped dramatically to only 20% of investors who had no such restriction. Indeed,this year, over half of investors indicated that they would not allocate to a managerwith less than $100mn AUM.
Do you require a minimum AUM before investing? (2009)
Source: 2009 Deutsche Bank Alternative Investment Survey
Do you require a minimum fund AUM before investing? (2002)
Source: 2002 Deutsche Bank Alternative Investment Survey
$500mn +
$100mn +
$50mn +
None1%8%
27%
64%
$1,000mn +
$500mn +
$200mn +
$100mn +
$50mn +
None
20%
27%
24%
16%
10%3%
82
2009 Alternative Investment Survey March 2009
The question of survivability is likely to play a key role in influencing investors’allocations this year, particularly given the number of managers expected to close in2009. 25% of investors predicted that more than 30% of managers would go out ofbusiness, with a further 40% assuming that between 20 – 30% would not survive.Clearly a significant amount of consolidation is expected within the industry this yearand we would therefore anticipate that investors will be particularly keen to ensurethat any new allocations made are to managers who will survive the current crisis.
What percentage of hedge fund managers will go out of business
in 2009?
Source: 2009 Deutsche Bank Alternative Investment Survey
Investors’ appetite for new launches had also decreased from last year, with only20% saying that they would be able to allocate to a manager with no track record,compared with 30% in 2008. Indeed, about 20% of investors in this year’s surveyexpressed a preference for a track record of >2 years, illustrating the increasedcaution with which they are approaching their investment decisions. However, it isworth noting that as in 2008, over 30% of investors can consider a new launchprovided that the manager has a verifiable track record from a former entity.
Do you require hedge funds to have a track record before you invest?
Source: 2009 Deutsche Bank Alternative Investment Survey
2008
2009
0%
10%
20%
30%
40%
50%
Verifiable trackrecord fromformer entity
More than2 years
1-2 yearsLess than1 year
No trackrecord required
Track Record Requirements
% o
f R
esp
on
den
ts
0% 5% 10% 15% 20% 25% 30% 35% 40%
0-5%
5-10%
10-20%
20-30%
30-40%
40-50%
More than 50%
NA/Prefer not to answer
% o
f M
an
ag
ers
% of Respondents
“Question ofsurvivability is key”
83
March 2009 2009 Alternative Investment Survey
In spite of their requirement for longer track records, we did note that investors willbe quite flexible about investing in a manager who has experienced a significantdrawdown. In what should prove to be heartening reading for the many hedge fundswho experienced a challenging 2008, a third of investors would consider investing ina fund with a drawdown of 10 – 20%, with a further 25% of those surveyedexpressing a willingness to allocate to managers with drawdowns greater than 20%.
Would you consider investing in a fund which experienced a
maximum drawdown of …?
Source: 2009 Deutsche Bank Alternative Investment Survey
We have noticed therefore that investors are seemingly willing at the start of 2009 tobe forgiving of poor performance given then challenging market circumstances facedby funds in the last year, but how would they react to the various measures put inplace by managers to restrict their redemptions and how likely would they be toallocate new/further capital to these managers?
The response to this question varied significantly depending on which particular routemanagers had chosen to go down. Almost 40% of those surveyed said that theywould invest with a fund which had changed its liquidity terms and a third said thatthey would also consider allocating to a manager who had invoked their gate. Therewas far less appetite for managers who had increased sidepockets or modified highwatermarks with only 21% and 16% respectively of investors willing to look at suchmanagers. There was even less appetite for managers who had frozen their assetswith a mere 8% of respondents who would consider an investment. It should also benoted that over a third of investors said that they would not allocate to a manager whohad put any of these measures in place.
“Only 8% of investorswould allocate to amanager that hadfrozen assets”
0%
5%
10%
15%
20%
25%
30%
35%
NA/Prefernot to
answer
Morethan 50%
30-50%20-30%10-20%5-10%Up to5%
None
% Drawdown
% o
f R
esp
on
den
ts
“Investors will allocateto managers withsignificant drawdowns”
84
2009 Alternative Investment Survey March 2009
Would you invest in a hedge fund which has experienced the
following? Please check all that apply.
Source: 2009 Deutsche Bank Alternative Investment Survey
We also asked investors to rank which of these actions they perceived to be the mostdamaging to a funds’ reputation and, as expected, given that over 90% of investorsindicated that they would not consider allocating to a fund that had frozen its assets,this had far the highest score. There was not a marked difference between the resultsfor the other measures outlined.
Rank in order which of the following is perceived as most damaging
to a funds’ reputation1.
Source: 2009 Deutsche Bank Alternative Investment Survey
In addition, we asked investors what their view was with respect to receivingsecurities upon submission of a redemption notice. Two-thirds of investors statedthat they would rather wait for the manager to liquidate the securities and thenreceive cash. 12% said that they would rather receive the securities than wait for themanager to liquidate with 10% indifferent to receiving cash provided that thesecurities were sufficiently liquid.
0
1
2
3
4
5
Modifiedhigh watermark
Increasedside-pockets
Changedliquidity terms
Invoked theirgate
Frozen assets
Avera
ge s
core
0%
5%
10%
15%
20%
25%
30%
35%
40%
NA/Prefernot to answer
None ofthese
Modifiedhigh watermark
Increasedside-pockets
Changedliquidityterms
Invokedtheir gate
Frozenassets
% o
f R
esp
on
den
ts
85
March 2009 2009 Alternative Investment Survey
1 Weighted average graphs: Investors were asked to value each category in order of importance. Ifa category was ranked first, the score was weighted accordingly, in order to accurately reflectrespondent sentiment.
What is your view with respect to in-kind distributions from hedge
funds (i.e. receiving securities upon submission of a redemption notice)?
Source: 2009 Deutsche Bank Alternative Investment Survey
Finally, we asked investors what they considered to be the biggest challenges thattheir managers were likely to face over the next 12 months.
115055 Global (Hedge Funds) Cover 24/3/09 10:45 am Page 2
2009 Alternative Investment Survey
A closer look at the hedge fund industry
March 2009
Glo
bal
Mark
ets
Marc
h 2
009
Hed
ge F
un
d C
ap
ital
Gro
up
Mark
eti
ng
Mate
rialD
eu
tsch
e B
an
k 2
009 A
ltern
ativ
e In
vestm
en
t Su
rvey
Global Disclaimer:
This material is for discussion purposes only and is not an offer, or solicitation of an offer, to buy or sell any security or financial instrument or to participate in anytrading strategy. The information, contained herein is the Deutsche Bank’s Hedge Fund Capital Group’s summary, interpretation and analysis of the assumptions,estimates, views, predictions and opinions of the investors that participated in the 2009 Alternative Investment Survey as of the date of this publication. Norepresentation is made by Deutsche Bank that the information contained herein is accurate or complete. Any projections are based on a number of assumptions asto market conditions and there can be no guarantee that any projected results will be achieved. Past performance is not a guarantee of future results.
This material was not produced, reviewed or edited by Deutsche Bank’s Research Department. Any opinions expressed herein may differ from the opinionsexpressed by other Deutsche Bank departments including the Research Department.
The information contained in this material is provided on the basis that it is intended solely for your own internal use, and on the basis that you have such knowledgeand experience in financial and business matters to be capable of evaluating the merits and risks associated with such information.
An investment in a hedge fund or a managed account involves a significant degree of risk, which each prospective investor must carefully consider before subscribingto purchase an interest in such a fund or agreeing to establish a managed account. Returns generated from an investment in a hedge fund or a managed accountmay not adequately compensate investors for the business and financial risk assumed. Hedge funds and managed accounts are subject to those market riskscommon to other types of investments, including market volatility. Furthermore, there may be restrictions on transferring hedge fund interests. In addition, certaintrading techniques and strategies employed by hedge funds and managed accounts, such as the use of leverage, may increase the adverse impact to which aninvestment may be subject. Investors should invest in a hedge fund or open a managed account only if they are able and prepared to bear the risk of investmentlosses, including the potential loss of their entire investment.
Other risks associated with hedge funds investments include, but are not limited to, the fact that hedge funds: can be highly illiquid; are not required to provideperiodic pricing or valuation information to investors; may involve complex tax structures and delays in distributing important tax information; are not subject to thesame regulatory requirements as mutual funds; often charge higher fees and the high fees may offset the fund’s trading profits; may have a limited operating history;can have performance that is volatile; may have a fund manager who has total trading authority over the fund and the use of a single adviser applying generally similartrading programs could mean a lack of diversification, and consequentially, higher risk; may not have a secondary market for an investor’s interest in the fund andnone may be expected to develop; may have restrictions on transferring interests in the fund; and may trade a substantial portion of their trades on foreign exchanges.
“Deutsche Bank” means Deutsche Bank AG, its branches and affiliated companies as the context requires. Deutsche Bank AG, including its subsidiaries andaffiliates, does not provide legal, tax or accounting advice. This communication was prepared solely in connection with the promotion or marketing, to the extentpermitted by applicable law, of the matters addressed herein, and was not intended or written to be used, and cannot be used or relied upon, by any taxpayer forpurposes of avoiding any U.S. federal tax penalties. The recipient of this communication should seek advice from an independent tax advisor regarding any taxmatters addressed herein based on its particular circumstances. www.db.com
DEUTSCHE BANK SPECIFICALLY DISCLAIMS ALL LIABILITY FOR ANY DIRECT, INDIRECT, CONSEQUENTIAL OR OTHER LOSSES OR DAMAGES INCLUDINGLOSS OF PROFITS INCURRED BY YOU OR ANY THIRD PARTY THAT MAY ARISE FROM ANY RELIANCE ON THIS DOCUMENT OR FOR THE RELIABILITY,ACCURACY, COMPLETENESS OR TIMELINESS THEREOF.
Deutsche Bank is authorised under German Banking Law (competent authority: BaFin - Federal Financial Supervising Authority) and regulated by the FinancialServices Authority for the conduct of UK business.
115055 Global (Hedge Funds) Cover 24/3/09 10:45 am Page 1