FALL 2009 Volume 21, Number 2 In This Issue • LTTPP Data Shows that RAP Mixes Perform As Well As Virgin Mixes —page 1 • Paving the Way to a More Sustainable Future —page 2 • Fourth Cycle Begins at NCAT Teast Track —page 3 • Primer on Dynamic Modulus —page 5 • Asphalt Forum —page 7 • Asphalt Forum Responses —page 8 • Specification Corner —page 9 • Research Roundup —page 11 • Training Opportunities —page 15 NCAT recently completed a study comparing virgin and recycled asphalt pavements using data from the Long Term Pavement Performance (LTPP) program. The LTPP SPS-5 study was designed to compare the performance of various approaches to overlay rehabilitation over a period of approxi- mately 20 years. Eighteen projects within the United States and Canada were constructed for the SPS-5 study. Most were built prior to the implementation of the Superpave mix design specification. Each in- cluded nine sections, 152 m in length, including one control section and eight rehabilitated sections used to compare the following: • overlay type – virgin asphalt mix vs. recycled as- phalt mix containing approximately 30 percent recycled asphalt pavement (RAP) • overlay thickness – 50 mm vs.125 mm • surface preparation – milled vs. not milled The primary purpose of this study was to com- pare pavement performance data between RAP mixes and virgin mixes based on the differences be- tween distresses observed in the two mix types. The study also examined the impacts of several other important factors (location, age, overlay thickness and milling of the existing pavement). Seven pave- ment performance measurements were analyzed: International Roughness Index (IRI), rutting, fatigue cracking, longitudinal cracking, transverse cracking, block cracking and raveling. Methodology An analysis of variance (ANOVA) was performed to assess the impact of the following factors on each distress measurement category: • location (i.e. state or province) • age of pavement • milled vs. not milled • overlay thickness • overlay mix type For this statistical evaluation, a significance level of 0.10 was used. Statistical comparisons were also conducted between the RAP mixes and the virgin mixes using paired t-tests. In order to isolate mix type from the other factors, each virgin section was compared directly to the RAP section with the same corre- sponding surface preparation and overlay thickness: • RAP vs. virgin, 50-mm overlay, non-milled surface • RAP vs. virgin, 125-mm overlay, non-milled surface • RAP vs. virgin, 50-mm overlay, milled surface • RAP vs. virgin, 125-mm overlay, milled surface A significance level of 0.10 was used in order to include some of the practical differences. If the p-value was less than 0.10 and the t-value was a negative number, then the RAP sections performed significantly better than the corresponding virgin sections. If the p-value was less than 0.10 and the t- value was a positive number, then the virgin sections performed significantly better than the correspond- ing RAP sections. Results and Conclusions Project location (i.e. state or province) and the age of the pavement had a great impact on all distresses evaluated. Overlay thickness also had a significant effect on pavement distress, with the exception of longitudinal cracking and raveling. The Asphalt Technology News Laboratory Refinement and Field Validation of 4.75 mm Superpave Designed Asphalt Mixtures Evaluation of the Effect of Reclaimed Asphalt Pavement Aggregate Bulk Specific Gravity on Voids in Mineral Aggregate LTPP Data Shows RAP Mixes Perform As Well As Virgin Mixes Alabama’s SPS-5 test section is located on Highway 84 in Houston County.
Transcript
1Fall 2009 • Vol. 21 • No. 2
FALL 2009 Volume 21, Number 2
In This Issue
• LTTPP Data Shows that RAP Mixes Perform As Well As Virgin Mixes
—page 1
• Paving the Way to a More Sustainable Future —page 2
• Fourth Cycle Begins at NCAT Teast Track
—page 3
• Primer on Dynamic Modulus
—page 5
• Asphalt Forum —page 7
• Asphalt Forum Responses —page 8
• Specification Corner —page 9
• Research Roundup —page 11
• Training Opportunities —page 15
NCAT recently completed a study comparing virgin and recycled asphalt pavements using data from the Long Term Pavement Performance (LTPP) program. The LTPP SPS-5 study was designed to compare the performance of various approaches to overlay rehabilitation over a period of approxi-mately 20 years. Eighteen projects within the United States and Canada were constructed for the SPS-5 study. Most were built prior to the implementation of the Superpave mix design specification. Each in-cluded nine sections, 152 m in length, including one control section and eight rehabilitated sections used to compare the following:
• overlay type – virgin asphalt mix vs. recycled as-phalt mix containing approximately 30 percent recycled asphalt pavement (RAP)
• overlay thickness – 50 mm vs.125 mm• surface preparation – milled vs. not milled
The primary purpose of this study was to com-pare pavement performance data between RAP mixes and virgin mixes based on the differences be-tween distresses observed in the two mix types. The study also examined the impacts of several other important factors (location, age, overlay thickness and milling of the existing pavement). Seven pave-ment performance measurements were analyzed: International Roughness Index (IRI), rutting, fatigue cracking, longitudinal cracking, transverse cracking, block cracking and raveling.
Methodology An analysis of variance (ANOVA) was performed to assess the impact of the following factors on each distress measurement category:
• location (i.e. state or province)• age of pavement• milled vs. not milled• overlay thickness • overlay mix type
For this statistical evaluation, a significance level of 0.10 was used.
Statistical comparisons were also conducted between the RAP mixes and the virgin mixes using paired t-tests. In order to isolate mix type from the other factors, each virgin section was compared directly to the RAP section with the same corre-
sponding surface preparation and overlay thickness:
• RAP vs. virgin, 50-mm overlay, non-milled surface• RAP vs. virgin, 125-mm overlay, non-milled surface• RAP vs. virgin, 50-mm overlay, milled surface• RAP vs. virgin, 125-mm overlay, milled surface
A significance level of 0.10 was used in order to include some of the practical differences. If the p-value was less than 0.10 and the t-value was a negative number, then the RAP sections performed significantly better than the corresponding virgin sections. If the p-value was less than 0.10 and the t-value was a positive number, then the virgin sections performed significantly better than the correspond-ing RAP sections.
Results and Conclusions Project location (i.e. state or province) and the age of the pavement had a great impact on all distresses evaluated. Overlay thickness also had a significant effect on pavement distress, with the exception of longitudinal cracking and raveling. The
Asphalt Technology News
Laboratory Refinement and Field Validation of 4.75 mm Superpave Designed Asphalt Mixtures
Evaluation of the Effect of Reclaimed Asphalt Pavement Aggregate Bulk Specific Gravity on Voids in Mineral Aggregate
LTPP Data Shows RAP Mixes Perform As Well As Virgin Mixes
Alabama’s SPS-5 test section is located on Highway 84 in Houston County.
2Asphalt Technology News
125 mm overlays performed better than the thinner overlays for all distress types except rutting. Milling prior to rehabilitation sig-nificantly decreased IRI, fatigue cracking and transverse cracking but significantly increased rut depths. From a practical standpoint, however, the average difference in rutting for the milled and non-
systems have an open-graded asphalt surface course that al-lows stormwater to flow into an underlying stone recharge bed. Storm water is stored within the recharge bed until it infiltrates into the ground. Porous pavement systems have been used successfully for more than 30 years, primarily in parking lots.
• Perpetual pavements: Perpetual pavements are designed to last indefinitely. Distresses are confined to the surface layer, which can be removed, recycled and replaced as necessary. Perpetual pavements conserve natural resources while also reducing life-cycle costs.
Awareness of sustainability issues is being raised by efforts such as the Green Highways Partnership (www.greenhighways.org), a public and private initiative that seeks to incorporate environmen-tal stewardship in highway planning, design and construction. The AASHTO Center for Environmental Excellence (www.environment.transportation.org) also promotes environmental awareness and provides technical resources for transportation professionals. An-other resource is Greenroads (www.greenroads.us), a performance metric that provides a quantifiable means of assessing sustainabil-ity goals on a project-by-project basis.
As stated by Mike Acott, President of the National Asphalt Pavement Association (NAPA), “The asphalt industry is committed to providing the best possible transportation facilities for America, with the least possible impact on the environment.” Sustainability is more than just a driving force in the asphalt pavement industry; asphalt is the sustainable pavement.
The asphalt pavement industry is a leader in the area of sus-tainable design. Sustainability encompasses a wide range of in-terconnected concepts, including environmental stewardship and resource conservation.
Consider these facts:• Asphalt pavement is America’s most recycled material, saving
taxpayers more than $300 million per year.• Total emissions from hot mix asphalt plants decreased by 97
percent from 1970 to 1999. During that time, production in-creased by 250 percent.
• Producing and constructing asphalt pavements consumes approximately 20 percent less energy than other pavement types.
Building upon its proven track record, the asphalt industry contin-ues to provide sustainable solutions, including:
• Warm mix asphalt (WMA): WMA technologies significantly reduce the temperatures at which asphalt mixes are produced and placed, thus reducing energy consumption by an average of 20 percent and further reducing emissions. WMA trials have been so successful that a number of states have adopted per-missive specifications allowing WMA use at the contractor’s option.
• Increased use of recycled asphalt pavement (RAP): State agencies typically allow mixes containing 15-20 percent RAP in surface mixes. Results from the NCAT Test Track have shown that mixes with higher percentages of RAP (up to 45 percent) can perform successfully. Increasing recycling not only conserves natural resources but is also economically sus-tainable.
• Porous pavement: This innovative storm water management tool can dramatically improve water quality. Porous pavement
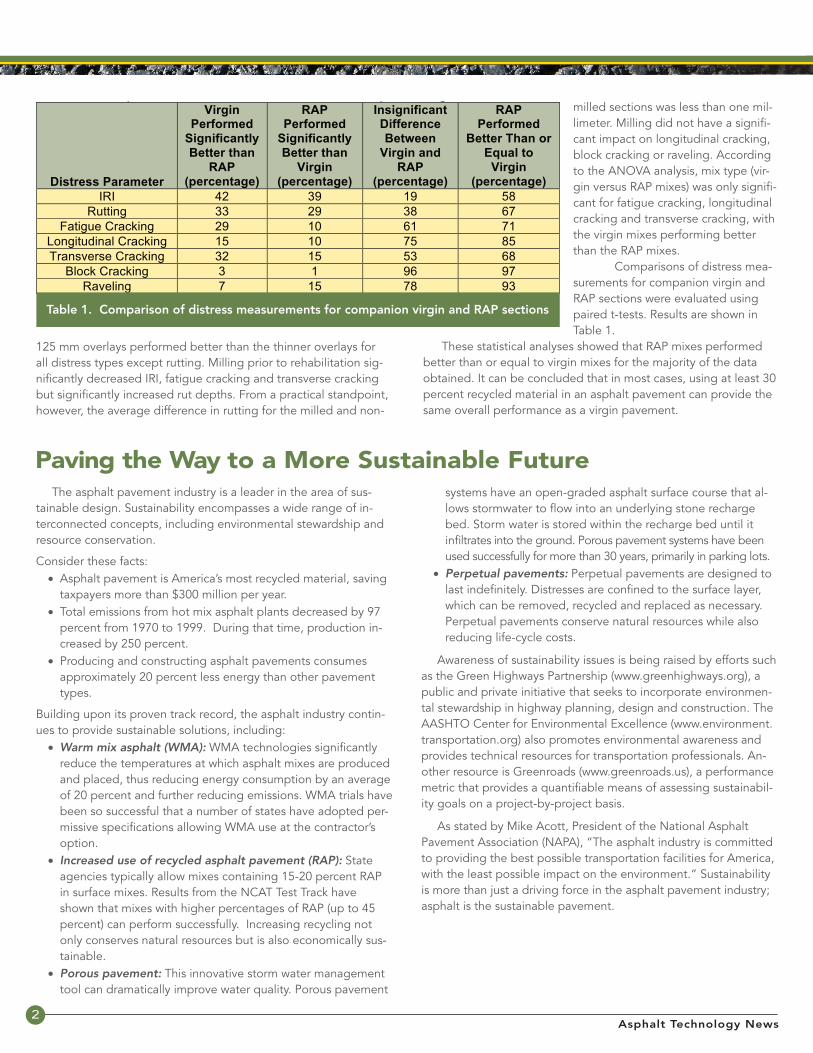
Comparisons of distress measurements for companion virgin and RAP sections were evaluated using paired
t-tests. Results are shown in Table 1.
Table 1. Comparison of distress measurements for companion virgin and RAP sections
Distress Parameter
Virgin Performed
Significantly Better than
RAP (percentage)
RAP Performed
Significantly Better than
Virgin (percentage)
Insignificant Difference Between
Virgin and RAP
(percentage)
RAP Performed
Better Than or Equal to
Virgin (percentage)
IRI 42 39 19 58
Rutting 33 29 38 67
Fatigue Cracking 29 10 61 71
Longitudinal Cracking 15 10 75 85
Transverse Cracking 32 15 53 68
Block Cracking 3 1 96 97
Raveling 7 15 78 93
These statistical analyses showed that RAP mixes performed better than or equal to virgin mixes for the
majority of the data obtained. It can be concluded that in most cases, using at least 30 percent recycled
material in an asphalt pavement can provide the same overall performance as a virgin pavement.
Jerry Chris Jones 9/3/09 10:57 AM
Deleted: one-sample
milled sections was less than one mil-limeter. Milling did not have a signifi-cant impact on longitudinal cracking, block cracking or raveling. According to the ANOVA analysis, mix type (vir-gin versus RAP mixes) was only signifi-cant for fatigue cracking, longitudinal cracking and transverse cracking, with the virgin mixes performing better than the RAP mixes. Comparisons of distress mea-surements for companion virgin and RAP sections were evaluated using paired t-tests. Results are shown in Table 1.
These statistical analyses showed that RAP mixes performed better than or equal to virgin mixes for the majority of the data obtained. It can be concluded that in most cases, using at least 30 percent recycled material in an asphalt pavement can provide the same overall performance as a virgin pavement.
Paving the Way to a More Sustainable Future
3Fall 2009 • Vol. 21 • No. 2
Construction of 18 new and rehabilitated test sections at the NCAT Pavement Test Track was completed in August and the fourth cycle of trafficking is now underway. Originally constructed in 2000, the 1.7-mile track is divided into 200-foot test sections and is circled by a fleet of heavily loaded trucks 16 hours a day, five days a week, resulting in 10 million equivalent single axle loads (ESALs) applied over a two-year period. The 2009 research cycle consists of nine surface performance sections (4 new mill/inlay, one new surface treatment and four traffic continuation sections) and 16 thinner structural performance sections (10 new structures, three rehabilitated sections from the 2006 cycle and three traffic continuation sections). All surface per-formance sections are built on perpetual foundations to ensure that surface distresses are materials-related. The structural perfor-mance sections, however, have much thinner asphalt pavement cross sections and some also have different bases and subgrades. All sections (both structural and surface performance) contain tem-perature probes at three depths in the asphalt pavement. Struc-tural sections are also instrumented with stress and strain gauges to measure pavement responses to loads and changing environ-mental conditions.
Structural Sections The six-section Group Experiment (GE) forms the core of the structural research effort. All GE sections have a total asphalt thick-ness of seven inches, with six inches of dense-graded aggregate base and a stiff subgrade underneath. Several sustainable tech-nologies are being evaluated within the Group Experiment:
Warm Mix Asphalt (WMA): Two full-depth WMA sections were constructed to compare the performance of WMA technologies to conventional HMA in the control section. One of the WMA sections used MeadWestvaco’s Evotherm DAT technology; the other used the Double-Barrel Green foaming process by Astec, Inc.
High RAP Contents: Previous cycles of the track have proven that surface mixes with moderate to high RAP contents can perform very well with regard to rutting and short-term dura-bility. This experiment includes two sections with 50 percent RAP in each asphalt lift to compare performance to the all-virgin control HMA section in a thin asphalt cross-section to better assess fatigue performance. One of the 50 percent RAP sections also used the foaming warm mix process to see if the WMA-RAP combination affects pavement performance and structural responses under traffic.
Porous Friction Course (PFC): PFCs, also known as open-graded-friction courses (OGFC), have proven their value by dramatically improving safety and reducing tire-pavement noise. This experiment will determine how PFCs contribute to the structural response of the pavement. The PFC replaces the top 1.25 inches of dense-graded HMA surface layer. The rest of the asphalt cross-section is equivalent to the control HMA test section. As an interesting bonus experiment, the PFC was designed and built with 15 percent coarse fractionated RAP.
Based on previous seven-inch structural sections on the test track, some bottom-up fatigue cracking is expected to occur dur-ing the two-year trafficking cycle. It will be interesting to see which sections have the most cracking when the cycle is completed. Sponsors of the GE are Alabama, FHWA, Florida, North Carolina, Oklahoma, South Carolina, and Tennessee.
Four, privately sponsored sections complement the Group Ex-periment. Those sections are:
Shell Thiopave: Two sections built with mixtures containing a sulfur replacement technology. One of the Thiopave sections is seven inches thick like the GE sections; the other is nine inches thick. The Thiopave base mixtures contain 30 percent sulfur by weight of asphalt and the intermediate layers contain 40 percent sulfur. The Thiopave mixtures also contain a warm mix additive to allow for lower mixing temperatures. The surface layers for both Thiopave sections are a regular HMA mix.
Kraton: This test section was built with HMA containing a high-ly polymer modified binder in all three lifts. The binder used in the mixes contains 7.5 percent styrene-butadiene-styrene (SBS) polymer. Theoretical pavement modeling indicates that mixes with this level of modification will provide much greater resis-tance to rutting and fatigue, so the total asphalt thickness for this test section is 5.75 inches.
Trinidad Lake Asphalt (TLA): TLA is a natural asphalt that was used in the first asphalt pavements built in the U.S. more than 100 years ago. TLA is still used today in high-stress applica-tions around the world. TLA is now produced in a pellet form to facilitate shipping and introduction into modern asphalt
Fourth Cycle Begins at NCAT Test Track
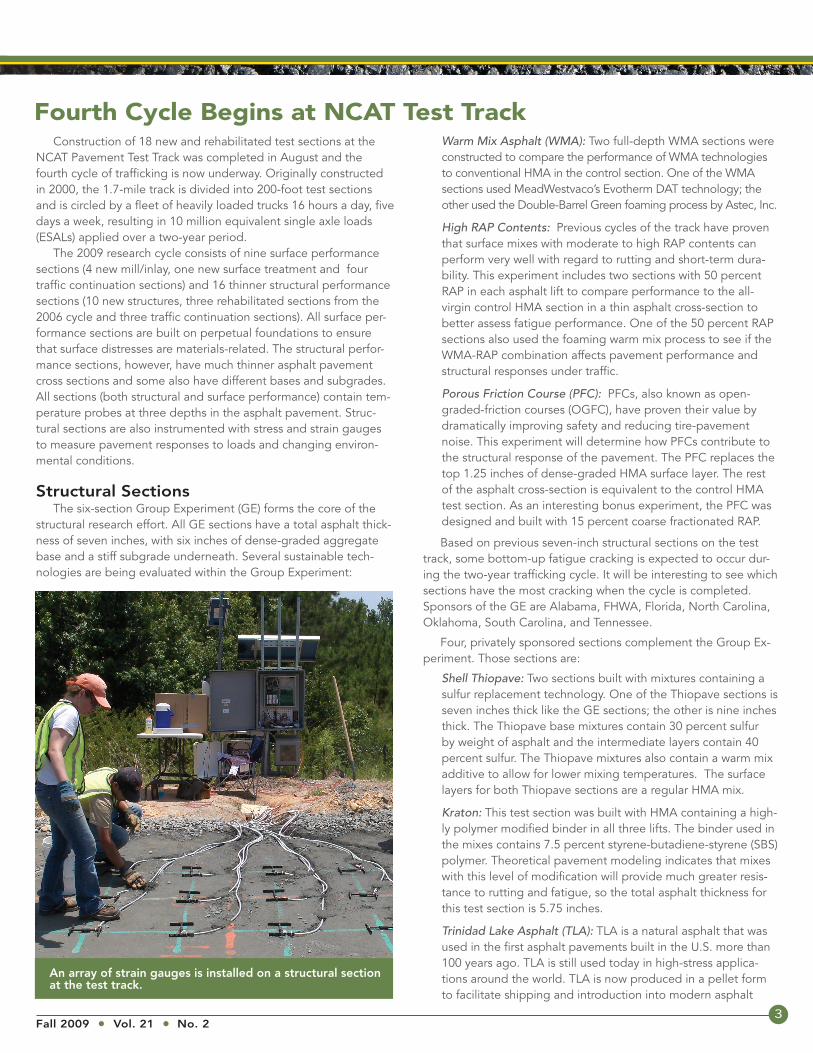
An array of strain gauges is installed on a structural section at the test track.
4Asphalt Technology News
plants. TLA pellets account for 25 percent of the total binder in the TLA test section mixtures. The rest of the binder is a PG 67-28 asphalt. The thickness of the TLA section is seven inches – similar to the GE sections.
Along with the GE and complimentary sections, there are six additional structural sections:
Florida DOT is sponsoring two sections to assess the effective-ness of OGFC surfaces at reducing surface cracking. One of the OGFC mixes was placed on a conventional tack coat in accordance with FDOT specifications; the second OGFC was placed on a polymer modified tack coat applied with a spray paver. Underlying the OGFC layers is an HMA mix that was proven susceptible to top down cracking in the previous cycle. The total asphalt thickness of these sections is seven inches. A 10-inch limerock base is below the asphalt pavement.
Oklahoma DOT is also sponsoring two additional structural sections. Both sections were constructed in 2006. One section was designed to be a perpetual pavement with 14 inches of OKDOT designed asphalt mixes on top of a simulated stabi-lized sub-base over a soft subgrade. Since there were no dis-tresses evident for this section at the end of the last cycle, OK-DOT wanted to traffic it more to validate the perpetual design theory. The second OKDOT section was built with 10 inches of asphalt and had minor fatigue cracking at the end of the last track cycle. This provided an opportunity to evaluate a rehabili-tation strategy. The top four inches of the section were milled and two lifts of HMA were put back. Two geotextile interlayers designed to retard reflection cracking were placed between the new HMA lifts in separate portions of the section.
Alabama DOT is sponsoring the continued evaluation of two other structural sections that were constructed in 2003. These two sections, designed in accordance with the 1993 AASHTO pavement design guide, should have reached terminal ser-viceability and required rehabilitation in 2005. However, since these sections are performing very well after carrying twice the designed traffic, they will continue to be trafficked and moni-tored for analysis that will be helpful in establishing fatigue thresholds for perpetual pavements.
All structural sections are assessed on a weekly basis for both surface performance (e.g., cracking, roughness, rutting, etc.) and high-speed structural response (stress and strain) in order to vali-date and/or calibrate mechanistic-empirical (M-E) pavement de-sign methodologies.
Surface Performance Sections Of the nine sponsored surface performance sections, four are traffic continuation sections:
FHWA is supporting the continued evaluation of three high-RAP content surface mixes constructed in 2006. These sections contain 45 percent RAP and varying grades of virgin binder. The focus of research in these sections is longer-term durability. Mississippi DOT continued sponsorship of an all-gravel porous friction course that provided good performance throughout the 2006 research cycle. The test section will be evaluated for
longer-term friction, permeability and durability. They also are sponsoring a surface performance evaluation of a new dense-graded Superpave mix with gravel and 45 percent RAP.
Missouri DOT is sponsoring two new test sections to compare two types of binder modification. Both sections use the same surface mix design except that one contains an SBS modified PG 76-22 binder while the other uses a ground tire rubber (GTR) modified PG 76-22. The virtually identical construction quality control (QC) results for these sections provides an as-surance that any observed performance differences will be the result of the effect of the binder modifier.
Georgia DOT has sponsored a new surface mix performance section to evaluate stone matrix asphalt produced with a coarse aggregate that has a slightly higher percentage of flat and elon-gated particles than currently allowed by their specifications. In the previous cycle, GDOT successfully conducted a similar evaluation of aggregate shape on the performance of porous friction courses. The cost of SMA and OGFC mixes in Georgia could drop considerably based on this research.
Cargill is sponsoring a proprietary surface treatment called SafeLane to evaluate its durability and friction performance. As is the case with all the private sector sponsors, the surface treatment test section on the track is actually the field phase of a testing program that began in the NCAT laboratory. In each case, results from phase- one laboratory testing were used to define the scope and nature of research on the test track.
Oldcastle Materials Group is also supporting the test track re-search through funding of advanced materials characterization testing that may be used for direct correlation of lab-to-field performance and for establishing materials properties for inputs into mechanistic-empirical pavement analysis programs.
At the request of the sponsor oversight group, construction was timed to allow trafficking to begin during the heat of summer. After completing shoulder work, striping, rumble strips and other miscellaneous clean up items, baseline measurements on the test sections were collected. Trafficking operations began on Friday, August 28, 2009. Each Monday, trucking operations are suspend-ed to provide for pavement performance measurements as well as vehicle maintenance.
During test section construction, mix is collected prior to laboratory testing.
5Fall 2009 • Vol. 21 • No. 2
visco-elastic materials such as asphalt concrete, it is necessary to use a cyclic loading test to characterize how its properties are de-pendent on the rate of loading.
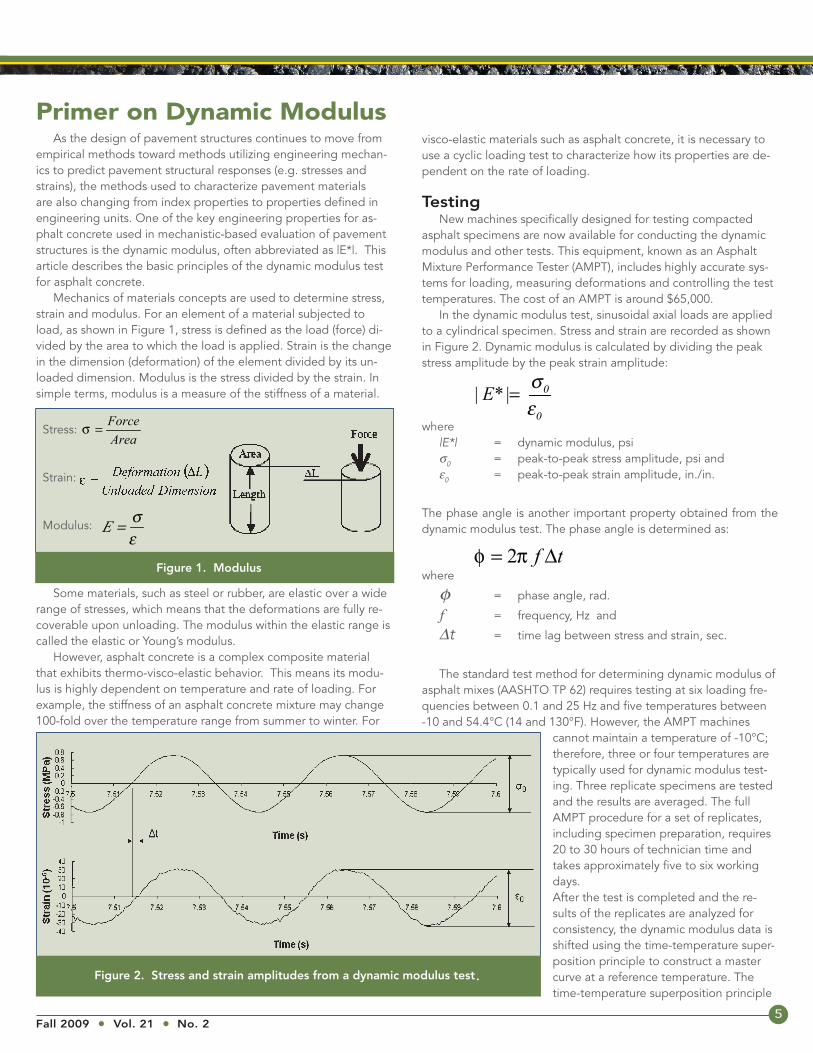
Testing New machines specifically designed for testing compacted asphalt specimens are now available for conducting the dynamic modulus and other tests. This equipment, known as an Asphalt Mixture Performance Tester (AMPT), includes highly accurate sys-tems for loading, measuring deformations and controlling the test temperatures. The cost of an AMPT is around $65,000. In the dynamic modulus test, sinusoidal axial loads are applied to a cylindrical specimen. Stress and strain are recorded as shown in Figure 2. Dynamic modulus is calculated by dividing the peak stress amplitude by the peak strain amplitude:
where |E*| = dynamic modulus, psi σ0 = peak-to-peak stress amplitude, psi and ε0 = peak-to-peak strain amplitude, in./in.
The phase angle is another important property obtained from the dynamic modulus test. The phase angle is determined as:
where
φ = phase angle, rad.
f = frequency, Hz and
Δt = time lag between stress and strain, sec.
The standard test method for determining dynamic modulus of asphalt mixes (AASHTO TP 62) requires testing at six loading fre-quencies between 0.1 and 25 Hz and five temperatures between -10 and 54.4°C (14 and 130°F). However, the AMPT machines
cannot maintain a temperature of -10°C; therefore, three or four temperatures are typically used for dynamic modulus test-ing. Three replicate specimens are tested and the results are averaged. The full AMPT procedure for a set of replicates, including specimen preparation, requires 20 to 30 hours of technician time and takes approximately five to six working days. After the test is completed and the re-sults of the replicates are analyzed for consistency, the dynamic modulus data is shifted using the time-temperature super-position principle to construct a master curve at a reference temperature. The time-temperature superposition principle
Primer on Dynamic Modulus As the design of pavement structures continues to move from empirical methods toward methods utilizing engineering mechan-ics to predict pavement structural responses (e.g. stresses and strains), the methods used to characterize pavement materials are also changing from index properties to properties defined in engineering units. One of the key engineering properties for as-phalt concrete used in mechanistic-based evaluation of pavement structures is the dynamic modulus, often abbreviated as |E*|. This article describes the basic principles of the dynamic modulus test for asphalt concrete. Mechanics of materials concepts are used to determine stress, strain and modulus. For an element of a material subjected to load, as shown in Figure 1, stress is defined as the load (force) di-vided by the area to which the load is applied. Strain is the change in the dimension (deformation) of the element divided by its un-loaded dimension. Modulus is the stress divided by the strain. In simple terms, modulus is a measure of the stiffness of a material.
Stress: AreaForce=σ
Strain:
Modulus: εσ=E
Figure 1. Modulus
Some materials, such as steel or rubber, are elastic over a wide range of stresses, which means that the deformations are fully re-coverable upon unloading. The modulus within the elastic range is called the elastic or Young’s modulus. However, asphalt concrete is a complex composite material that exhibits thermo-visco-elastic behavior. This means its modu-lus is highly dependent on temperature and rate of loading. For example, the stiffness of an asphalt concrete mixture may change 100-fold over the temperature range from summer to winter. For
0
0
| * |E σε
=
2 f tφ π= Δ
0
0
| * |E σε
=
6Asphalt Technology News
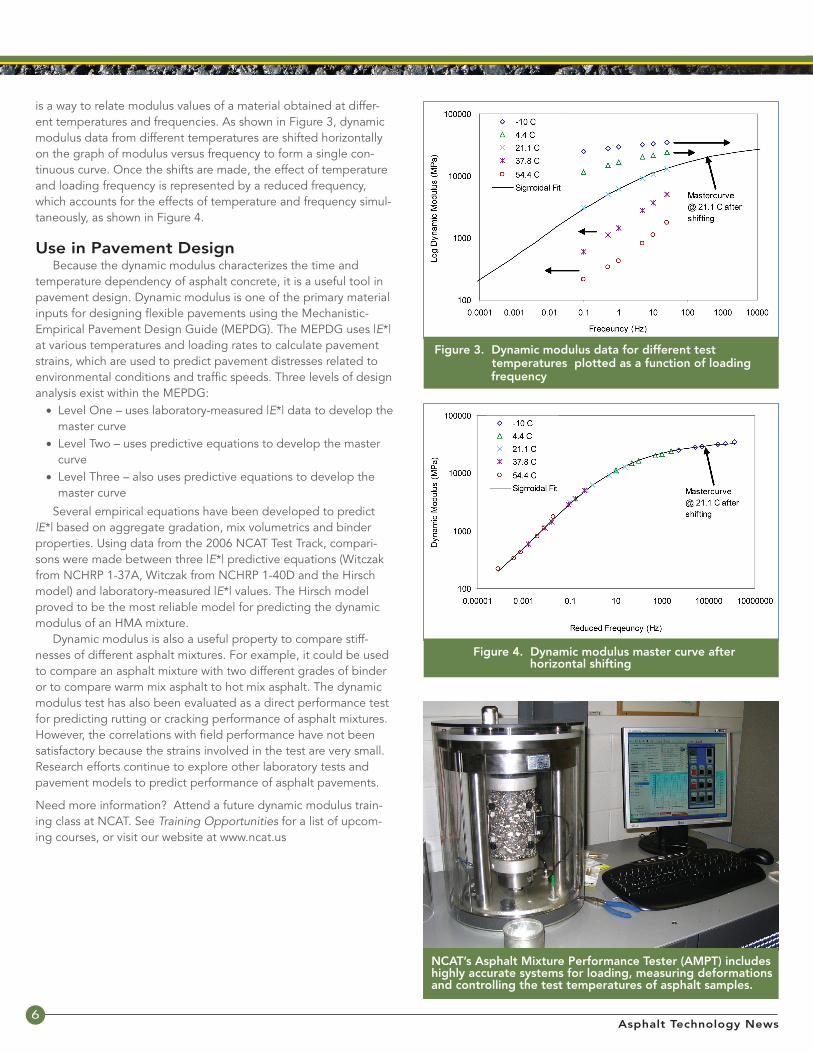
Figure 3. Dynamic modulus data for different test temperatures plotted as a function of loading frequency
Figure 4. Dynamic modulus master curve after horizontal shifting
is a way to relate modulus values of a material obtained at differ-ent temperatures and frequencies. As shown in Figure 3, dynamic modulus data from different temperatures are shifted horizontally on the graph of modulus versus frequency to form a single con-tinuous curve. Once the shifts are made, the effect of temperature and loading frequency is represented by a reduced frequency, which accounts for the effects of temperature and frequency simul-taneously, as shown in Figure 4.
Use in Pavement Design Because the dynamic modulus characterizes the time and temperature dependency of asphalt concrete, it is a useful tool in pavement design. Dynamic modulus is one of the primary material inputs for designing flexible pavements using the Mechanistic-Empirical Pavement Design Guide (MEPDG). The MEPDG uses |E*| at various temperatures and loading rates to calculate pavement strains, which are used to predict pavement distresses related to environmental conditions and traffic speeds. Three levels of design analysis exist within the MEPDG:
• Level One – uses laboratory-measured |E*| data to develop the master curve
• Level Two – uses predictive equations to develop the master curve
• Level Three – also uses predictive equations to develop the master curve
Several empirical equations have been developed to predict |E*| based on aggregate gradation, mix volumetrics and binder properties. Using data from the 2006 NCAT Test Track, compari-sons were made between three |E*| predictive equations (Witczak from NCHRP 1-37A, Witczak from NCHRP 1-40D and the Hirsch model) and laboratory-measured |E*| values. The Hirsch model proved to be the most reliable model for predicting the dynamic modulus of an HMA mixture. Dynamic modulus is also a useful property to compare stiff-nesses of different asphalt mixtures. For example, it could be used to compare an asphalt mixture with two different grades of binder or to compare warm mix asphalt to hot mix asphalt. The dynamic modulus test has also been evaluated as a direct performance test for predicting rutting or cracking performance of asphalt mixtures. However, the correlations with field performance have not been satisfactory because the strains involved in the test are very small. Research efforts continue to explore other laboratory tests and pavement models to predict performance of asphalt pavements.
Need more information? Attend a future dynamic modulus train-ing class at NCAT. See Training Opportunities for a list of upcom-ing courses, or visit our website at www.ncat.us
NCAT’s Asphalt Mixture Performance Tester (AMPT) includes highly accurate systems for loading, measuring deformations and controlling the test temperatures of asphalt samples.
7Fall 2009 • Vol. 21 • No. 2
Dave Powers, Ohio Department of Transportation
Have any states had experiences with poor adhesion or placement of thermoplastic striping on surface courses containing polymer-modified binder?
Mark Woods, Tennessee Department of Transportation
TDOT is slowly implementing the use of open-graded friction courses (OGFCs) to reduce wet weather accidents, but we have been receiving reports from district maintenance crews that these pavements are difficult to maintain during cold weather (de-icing, salting, plowing, etc). Do any states have protocol for or maintenance issues with porous pavements?
NCAT invites your comments and questions. Questions and responses are published in each issue of Asphalt Technology News with editing for consistency and space limitations.
Also, due to the cost of these mixes, we’ve typically only paved open-graded mixes just beyond the edge stripe but have experienced some safety issues with over-correcting drivers who veer over the edge of these surfaces. How far beyond the edge stripe do most states place porous mixes?
Asphalt Forum
Prior to paving a structural section at the Test Track, hand-sifted mix is placed over strain gauges.
8Asphalt Technology News
The following responses have been received to questions raised in the Spring 2009 Asphalt Forum.
1. Has any other state encountered tenderness issues with warm-mix asphalt (WMA)? In some cases, Kentucky has noted that the WMA mat is tender during compaction, resulting in poor density and smoothness of the finished pavement. Also, the WMA pavement may remain tender for several days after placement. (Allen Myers, Kentucky Transportation Cabinet)
Florida Department of Transportation, Greg Sholar FDOT has not experienced this.
Missouri Department of Transportation, Joe Schroer Missouri has experienced two instances of WMA tenderness occurring with the Evotherm package. When the mixture was overheated to the typical HMA mixing temperature, it shoved and pushed. Also, at cool ambient temperatures, the mixture appeared spongy, as if it would spring back after a roller pass. Eventually for both situations, compaction was achieved after continued cooling of the mat. It has been noted that when the HMA mix has a tem-perature range with tenderness, the WMA will be spongy in the same temperature range. At temperatures below that tenderness zone, the WMA compacts normally. Overalll, the WMA seems to set better on the roadway, with less crawling than HMA. One trial project had an HMA section with profilograph readings indicating a 32 percent improvement in ride, while the WMA section showed a 51 percent improvement in ride.
Ohio Department of Transportation, Dave Powers We have placed more than 15 different WMA mixes without tenderness. We do, however, think it is a possibility. We restrict wa-ter to 1.8 percent of binder.
Oklahoma Department of Transportation, Kenneth Ray Hobson We have no such experience to date. Perhaps the type of WMA technology used might be a factor.
Ontario Ministry of Transportation,Kai Tam We are not aware of any cases of tenderness on the WMA trials constructed in Ontario. WMA technologies used on a trial basis on provincial highways in Ontario to date include Evotherm ET and Lafarge’s Hypertherm. We also observed paving of Sasobit and Evotherm DAT on municipal roads.
Virginia Transportation Research Council, Bill Maupin Virginia has not noticed a tenderness problem with WMA.
2. Which states are planning to implement the Multiple Stress Creep Recovery (MSCR) test in lieu of their cur-rent method of determining modification of binders?
Are binder suppliers in favor of this? Missouri would like to see implementation by agencies and suppliers to avoid the questions following a failing test, only to find out the supplier followed another state’s testing
Asphalt Forum Responses
protocol. (Joe Schroer, Missouri Department of Trans-portation)
Alabama Department of Transportation,Randy Mountcastle Alabama is not using the MSCR test at this time.
Florida Department of Transportation, Greg Sholar FDOT will eventually adopt the MSCR test but will not do so this year.
Kentucky Transportation Cabinet, Allen Myers The Kentucky Transportation Cabinet has performed some in-formational MSCR testing on typical asphalt binders, but we have no immediate plans to implement this technology. Any future ef-forts to implement the MSCR specification will certainly include coordination with the liquid asphalt industry.
Nevada Department of Transportation, Darin Tedford While we have run the MSCR test for research purposes, we do not plan to implement it in our specifications.
New Hampshire Department of Transportation, Denis Boisvert New Hampshire is interested in the MSCR test and is participat-ing in the Pooled Fund Project.
Ohio Department of Transportation, Dave Powers Ohio is researching the MSCR test. Suppliers are pushing it, although some do not have equipment that can easily perform the test. We have advised them to replace equipment within the year. In general, our elastic recovery (ER) test has worked well for us, so we are not in a hurry.
Oklahoma Department of Transportation, Kenneth Ray Hobson We have no plans to implement the MSCR test, nor do we have experience using it to date. However, it is something that we would like to investigate. The main PG+ specification that we use for polymer-like characteristics is the elastic recovery test, ASTM D6084. Our limits for PG 64-22 OK, PG 70-28 OK and PG 76-28 OK, respectively, are none, ≥ 65 and ≥ 75.
Ontario Ministry of Transportation, Kai Tam We are currently looking into applications of the MSCR test. We have not yet made a decision regarding the adoption of this test, nor have we yet consulted with the industry.
Tennessee Department of Transportation, Mark Woods TDOT has recently acquired the equipment to perform the MSCR test for the purpose of evaluating it in-house, but TDOT does not intend to implement it as a specification anytime in the near future.
Virginia Transportation Research Council, Bill Maupin Virginia has only used the MSCR test in experimental testing and limited monitoring. There are no plans to implement it at this time.
9Fall 2009 • Vol. 21 • No. 2
Specification Corner
Alabama Alabama is allowing warm mix asphalt (WMA) at the contrac-tor’s option, with the exception of high volume roads and stone matrix asphalt (SMA) mixes. When WMA is used, the mix may contain a maximum of 35 percent recycled material. The recycled material may consist entirely of recycled asphalt pavement (RAP); alternatively, a combination of RAP and recycled asphalt shingles (RAS) may be used. Up to 5 percent factory waste shingles or 3 percent used roof shingles are allowed. Alabama is also allowing 12 percent ground tire rubber (GTR) to be used as an alternative to traditional PG 76-22 for high volume roadways with Superpave mixes. GTR will not be allowed in SMA mixes. We have not had any contractors try this yet.
Florida Florida is implementing the use of WMA at the choice of the contractor. This is proceeding well, with no issues to date. Florida will allow 20 percent RAP in mixtures containing PG 76-22 binder as well as 20 percent RAP in dense-graded friction course mixtures. The required method of calibration for the gyratory compactor is changing from external angle to internal angle. This implemen-tation is proceeding with minimal issues.
KentuckyAs reported in the Spring 2009 issue, the Kentucky Transportation Cabinet has revised its specifications to permit WMA produced by the water-injection/foaming process at the contractor’s option. In conjunction with local FHWA personnel, we have recently devel-oped a policy for evaluating other WMA technologies. The new policy provides instructions for manufacturers or suppliers of WMA processes or products to follow when requesting evaluation of a particular WMA technology. The policy also specifies the informa-tion to be collected and testing to be performed on the associat-ed WMA trial projects, as well as the WMA pavement performance characteristics that will be monitored in the future.
New Hampshire This spring, we overhauled our entire Division 400 specifications for bituminous materials. The major impacts of those changes are:
Return control of the asphalt plants to the HMA producers for •method specification work. DOT staff had been in control of the plant changes for many years. This change reduces the need for DOT inspectors to cover these operations and makes the specification more like its QC/QA counterpart.Control the RAP content by measuring total reused binder •(TRB). This gives us better control of the used binder in our mixes, since the asphalt content in RAP sources in our state can vary from 3 to 6 percent.Increase the allowed RAP usage in HMA before requiring a •bump in virgin binder grade or pre-production testing. As-suming a 4 percent asphalt content in the RAP source, we now allow up to 20 percent RAP in both wearing and base courses before PG grade verification is required. That is equiv-alent to 1.0 percent TRB under our new specification.Allow a maximum of 1.5 percent TRB (37.5 percent RAP) in •
base and binder courses with testing requirements.Introduction of RAS product• . Previously silent on this mate-rial, our specification now allows it in quantities of up to 0.6 percent of the mix. The RAS product binder is inclusive in the TRB, meaning a mix with 1.0 percent TRB and 0.6 percent RAS product could only contain 0.4 percent RAP binder. RAS products are to be qualified under DOT criteria.
Ohio We are allowing WMA in all base courses, as well as all intermediate and low-traffic surface courses.
Oklahoma Our new Standard Specifications will be published this year. One of the changes is a reduction in the maximum limit for flash point, AASHTO T 48, from 550°F to 500°F. Our current PG+ Speci-fications increased the flash point to eliminate poorly performing binders, but those problem binders are no longer in production. WMA mix designs may be used as an alternative to our stan-dard HMA mix designs. We have added Hamburg Rut Testing to replace the Asphalt Pavement Analyzer (APA) testing for new asphalt mix designs. For Hamburg testing at 122°F, the minimum number of passes required to reach a rut depth of 0.5 inch are 10,000 for PG 64-22 OK, 15,000 for PG 70-28 OK and 20,000 for PG 76-28 OK. We have added a new Special Provision to crush and screen RAP into coarse and fine stockpiles. One pile or both may be used in the mix. For binder courses with PG 64-22 OK, up to 25 percent RAP may be used. For binder courses with PG 70-28 OK and PG 76-28 OK, up to 15 percent RAP may be used. For temporary con-struction, up to 35 percent RAP may be used.
Ontario The Ontario Ministry of Transportation is making the following specification changes:
Special Provision 103F31Modified – Smoothness by Inertial •Profilers. An MTO/Industry task group was set up in 2007 to investigate how MTO can begin the transition from QC accep-tance based on PI measurements by California Profilograph to QA acceptance based on IRI and localized roughness mea-surements by inertial profiler. A Non-Standard Special Provi-sion, a new Laboratory Standard for calibrating, correlating and taking measurements with inertial profilers, and a list of equipment requirements for inertial profilers have been cre-ated. During the 2009 construction season, MTO is planning to implement these new specifications in selected contracts.Special Provision – Increased RAP Usage• . We have revised our specifications to permit greater percentages of RAP in our mixes. RAP and roof shingle tabs (RST) are now permitted in all hot mix asphalt courses, including premium surfaces cours-es with the exception of SMA mixes. Up to 20 percent RAP is permitted in all surface courses excluding SMA. For binder courses within 150 mm of the pavement surface for facilities carrying more than 3 million ESALs over the 20-year design life, up to 20 percent RAP is permitted. For all other binder courses, up to 40 percent RAP is permitted. Up to 3 percent
10Asphalt Technology News
RST are permitted in SMA and 1 percent RST may be substi-tuted for each 10 percent of RAP that is permitted in a mix.Special Provision 103S38 – Segregation Severity in Hot Mix •Pavements. A texture depth test has been developed to quan-tify the segregation severity in hot mix asphalt. The testing method, described in LS-317, is based on the Macrotexture Ratio (the average macrotexture depth for a disputed segre-gated area divided by the average macrotexture depth for adjacent non-segregated area). The test can be used to re-solve the dispute between the contractor and the owner with regards to the owner’s visual assessment of the segregation severity. A new Special Provision has been developed and im-plemented to include this new dispute settlement mechanism in all new hot mix contracts.Special Provision – WMA• . Two special provisions have been developed related to WMA. The optional specification allows the contractor to use WMA as an option to HMA. This speci-fication is mostly applicable to remote bridge replacement projects involving long hauling distances. The other special provision, which is close to finalization, is used to specify WMA trial sections. WMA trial sections are to be constructed in conjunction with the hot mix control sections for annual per-formance evaluation. Contractors can choose from 9 different WMA technologies. Additional information pertaining to WMA trials is as follows: TSR on production samples, emissions in the asphalt plant, workers’ exposure to asphalt fume emissions and WMA temperature.Payment by m• 2 for surface course and multi-lifts. Based on the positive feedback from the payment by square metre of HMA surface course trials constructed over the last couple of years, we will be using this method of payment more regularly, where appropriate. Based on this success, payment by square metres is currently being reviewed for multi-lift trial contracts. Payment for HMA is based on average thickness for the whole contract, with the maximum being the design thickness. Overall, comparing payment by m2 with payment by tonnage resulted in no quantity overruns, better control over the thick-ness of asphalt placed, better smoothness results, fewer ad-ministrative complexities and lower costs.
Tennessee Tennessee now allows the use of WMA on state routes with less than 10,000 average daily traffic (ADT). Contractors have been given the option to request use of technologies or additives listed on a Qualified Products List (QPL). The maximum allowable tem-perature is 275°F, and a hot mix section must be placed on these projects for comparison. Tennessee has increased its allowable percentages of RAP. To utilize these increased percentages, the contractor is required to fractionate stockpiles.
Virginia Virginia has the following major initiatives underway:
Increased use of RAP in HMA• . This specification change oc-curred in 2007 for limited projects and since then all main-tenance projects have been allowed to use higher RAP
percentages (20 to 30 percent). For the contractor to use a higher percentage of RAP, the final mix must meet standard mix properties – asphalt content, gradation and volumetric requirements. Additionally, the contractor can use RAP to bump the final mix binder grade. For example, if the final mix binder grade for a contract is PG 70-16, then the contractor may meet that requirement by combining a virgin binder (PG 64-22) and a percentage of RAP. Based on extensive testing performed by VDOT, the properties of the virgin binder play a large role in whether or not a mix with 20 to 30 percent RAP can meet the PG 70-16 requirement. Once the contractor has proven that they can meet the PG 70-16 requirement and produce an acceptable mix, then production has gone very smoothly.Allowing use of warm mix technologies at the contractor’s •discretion. Trial projects were completed in 2006 and have been evaluated for the last three years. In 2009, contractors were allowed to produce and place WMA in lieu of traditional HMA. The contractor can use an additive, a material blended in the binder or a foaming process. The contractor must dem-onstrate that they can produce and place the mix, and the mix must meet standard mix properties as well as meet the minimum field density requirement. On VDOT projects, the implementation of WMA has been slow. Most WMA has been placed on private projects as contractors continue to learn. For 2010, VDOT plans only small changes to the WMA speci-fications until more projects can be completed and evaluated.Evaluation of bond strength for overlay applications• . VDOT has been investigating the bond strength developed at both milled surface and smooth surface interfaces. VDOT has been evaluating various tacking materials in the field and in the lab. In the near future, VDOT may be specifying better perform-ing materials or may be specifying minimum tensile and shear strengths at interfaces.
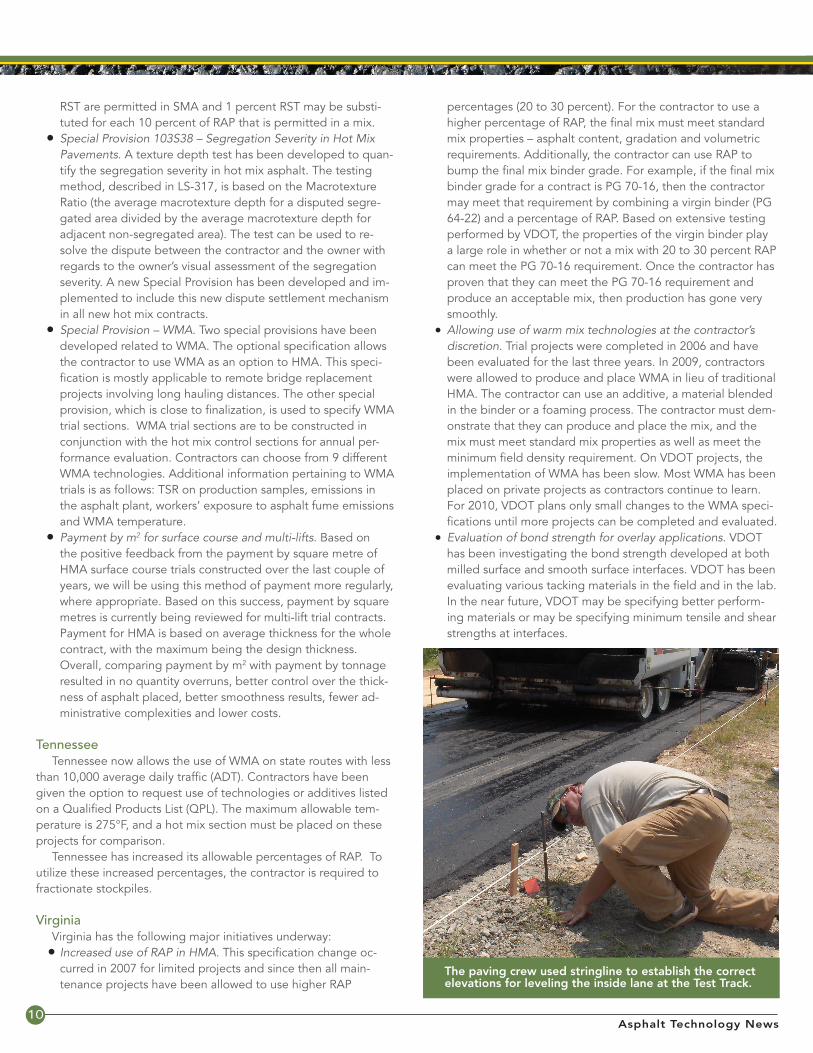
The paving crew used stringline to establish the correct elevations for leveling the inside lane at the Test Track.
11Fall 2009 • Vol. 21 • No. 2
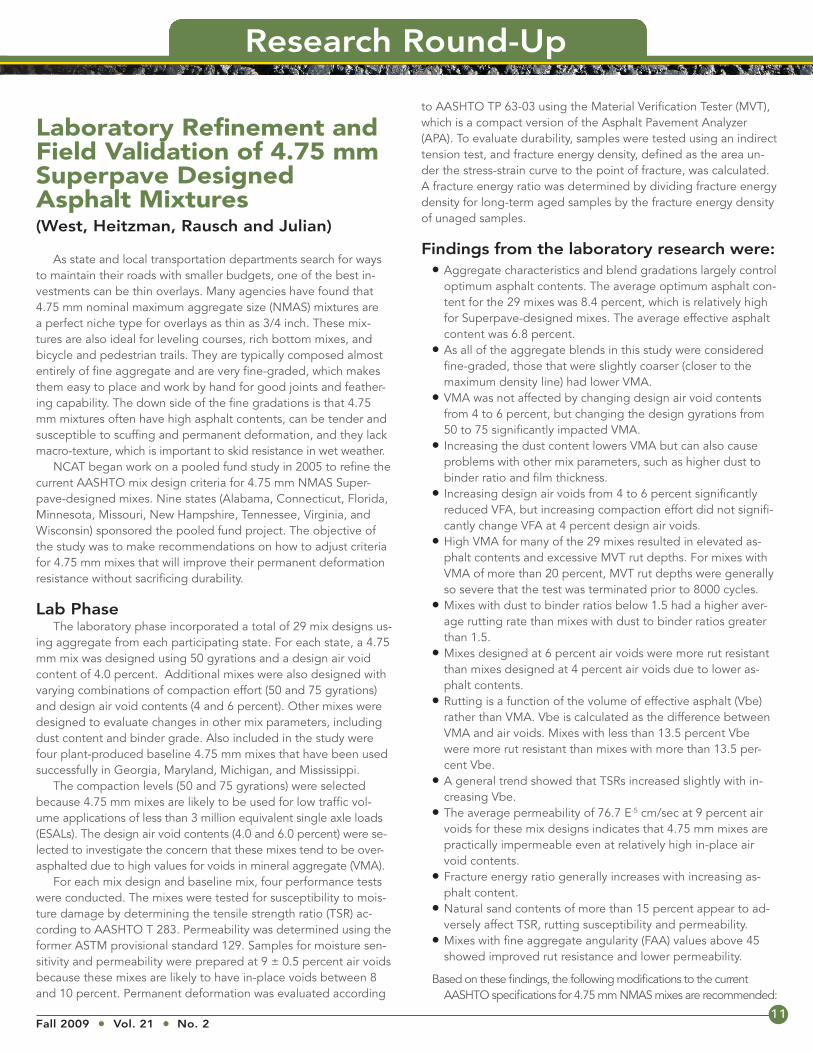
Laboratory Refinement and Field Validation of 4.75 mm Superpave Designed Asphalt Mixtures
(West, Heitzman, Rausch and Julian)
As state and local transportation departments search for ways to maintain their roads with smaller budgets, one of the best in-vestments can be thin overlays. Many agencies have found that 4.75 mm nominal maximum aggregate size (NMAS) mixtures are a perfect niche type for overlays as thin as 3/4 inch. These mix-tures are also ideal for leveling courses, rich bottom mixes, and bicycle and pedestrian trails. They are typically composed almost entirely of fine aggregate and are very fine-graded, which makes them easy to place and work by hand for good joints and feather-ing capability. The down side of the fine gradations is that 4.75 mm mixtures often have high asphalt contents, can be tender and susceptible to scuffing and permanent deformation, and they lack macro-texture, which is important to skid resistance in wet weather. NCAT began work on a pooled fund study in 2005 to refine the current AASHTO mix design criteria for 4.75 mm NMAS Super-pave-designed mixes. Nine states (Alabama, Connecticut, Florida, Minnesota, Missouri, New Hampshire, Tennessee, Virginia, and Wisconsin) sponsored the pooled fund project. The objective of the study was to make recommendations on how to adjust criteria for 4.75 mm mixes that will improve their permanent deformation resistance without sacrificing durability.
Lab Phase The laboratory phase incorporated a total of 29 mix designs us-ing aggregate from each participating state. For each state, a 4.75 mm mix was designed using 50 gyrations and a design air void content of 4.0 percent. Additional mixes were also designed with varying combinations of compaction effort (50 and 75 gyrations) and design air void contents (4 and 6 percent). Other mixes were designed to evaluate changes in other mix parameters, including dust content and binder grade. Also included in the study were four plant-produced baseline 4.75 mm mixes that have been used successfully in Georgia, Maryland, Michigan, and Mississippi. The compaction levels (50 and 75 gyrations) were selected because 4.75 mm mixes are likely to be used for low traffic vol-ume applications of less than 3 million equivalent single axle loads (ESALs). The design air void contents (4.0 and 6.0 percent) were se-lected to investigate the concern that these mixes tend to be over-asphalted due to high values for voids in mineral aggregate (VMA). For each mix design and baseline mix, four performance tests were conducted. The mixes were tested for susceptibility to mois-ture damage by determining the tensile strength ratio (TSR) ac-cording to AASHTO T 283. Permeability was determined using the former ASTM provisional standard 129. Samples for moisture sen-sitivity and permeability were prepared at 9 ± 0.5 percent air voids because these mixes are likely to have in-place voids between 8 and 10 percent. Permanent deformation was evaluated according
to AASHTO TP 63-03 using the Material Verification Tester (MVT), which is a compact version of the Asphalt Pavement Analyzer (APA). To evaluate durability, samples were tested using an indirect tension test, and fracture energy density, defined as the area un-der the stress-strain curve to the point of fracture, was calculated. A fracture energy ratio was determined by dividing fracture energy density for long-term aged samples by the fracture energy density of unaged samples.
Findings from the laboratory research were:Aggregate characteristics and blend gradations largely control •optimum asphalt contents. The average optimum asphalt con-tent for the 29 mixes was 8.4 percent, which is relatively high for Superpave-designed mixes. The average effective asphalt content was 6.8 percent.As all of the aggregate blends in this study were considered •fine-graded, those that were slightly coarser (closer to the maximum density line) had lower VMA.VMA was not affected by changing design air void contents •from 4 to 6 percent, but changing the design gyrations from 50 to 75 significantly impacted VMA. Increasing the dust content lowers VMA but can also cause •problems with other mix parameters, such as higher dust to binder ratio and film thickness.Increasing design air voids from 4 to 6 percent significantly •reduced VFA, but increasing compaction effort did not signifi-cantly change VFA at 4 percent design air voids.High VMA for many of the 29 mixes resulted in elevated as-•phalt contents and excessive MVT rut depths. For mixes with VMA of more than 20 percent, MVT rut depths were generally so severe that the test was terminated prior to 8000 cycles.Mixes with dust to binder ratios below 1.5 had a higher aver-•age rutting rate than mixes with dust to binder ratios greater than 1.5.Mixes designed at 6 percent air voids were more rut resistant •than mixes designed at 4 percent air voids due to lower as-phalt contents.Rutting is a function of the volume of effective asphalt (Vbe) •rather than VMA. Vbe is calculated as the difference between VMA and air voids. Mixes with less than 13.5 percent Vbe were more rut resistant than mixes with more than 13.5 per-cent Vbe.A general trend showed that TSRs increased slightly with in-•creasing Vbe.The average permeability of 76.7 E• -5 cm/sec at 9 percent air voids for these mix designs indicates that 4.75 mm mixes are practically impermeable even at relatively high in-place air void contents.Fracture energy ratio generally increases with increasing as-•phalt content. Natural sand contents of more than 15 percent appear to ad-•versely affect TSR, rutting susceptibility and permeability.Mixes with fine aggregate angularity (FAA) values above 45 •showed improved rut resistance and lower permeability.
Based on these findings, the following modifications to the current AASHTO specifications for 4.75 mm NMAS mixes are recommended:
Research Round-Up
12Asphalt Technology News
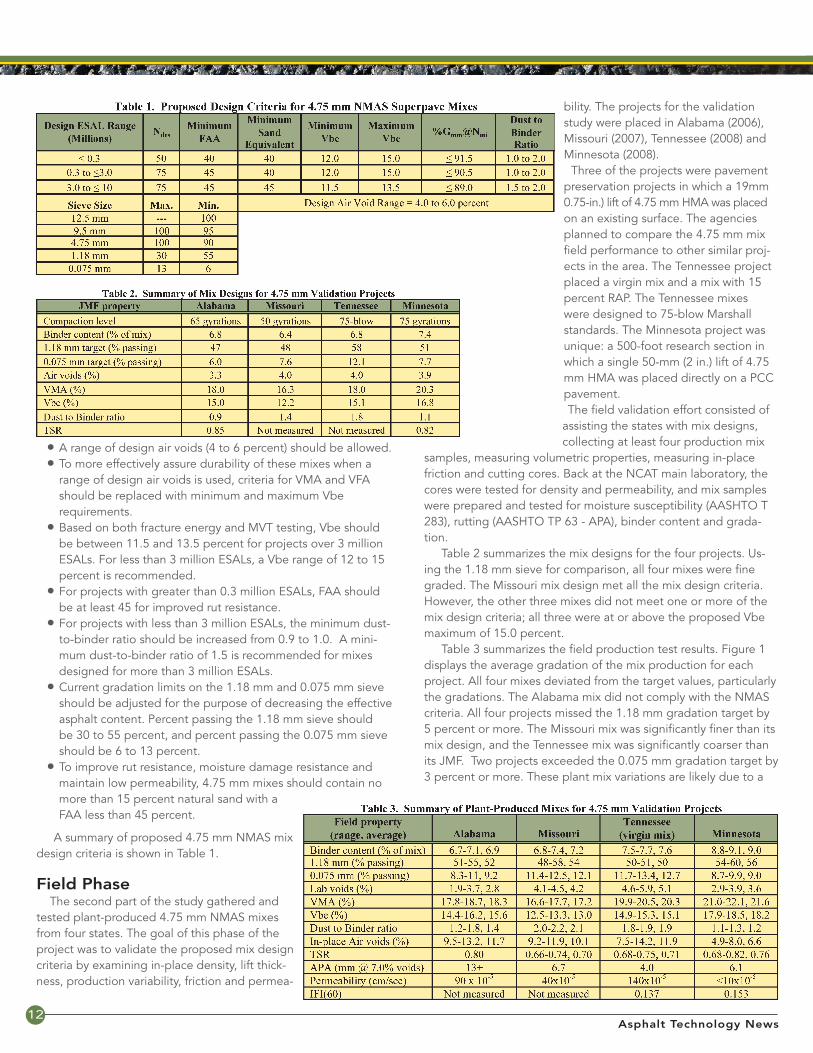
bility. The projects for the validation study were placed in Alabama (2006), Missouri (2007), Tennessee (2008) and Minnesota (2008). Three of the projects were pavement preservation projects in which a 19mm 0.75-in.) lift of 4.75 mm HMA was placed on an existing surface. The agencies planned to compare the 4.75 mm mix field performance to other similar proj-ects in the area. The Tennessee project placed a virgin mix and a mix with 15 percent RAP. The Tennessee mixes were designed to 75-blow Marshall standards. The Minnesota project was unique: a 500-foot research section in which a single 50-mm (2 in.) lift of 4.75 mm HMA was placed directly on a PCC pavement.
The field validation effort consisted of assisting the states with mix designs, collecting at least four production mix
samples, measuring volumetric properties, measuring in-place friction and cutting cores. Back at the NCAT main laboratory, the cores were tested for density and permeability, and mix samples were prepared and tested for moisture susceptibility (AASHTO T 283), rutting (AASHTO TP 63 - APA), binder content and grada-tion. Table 2 summarizes the mix designs for the four projects. Us-ing the 1.18 mm sieve for comparison, all four mixes were fine graded. The Missouri mix design met all the mix design criteria. However, the other three mixes did not meet one or more of the mix design criteria; all three were at or above the proposed Vbe maximum of 15.0 percent. Table 3 summarizes the field production test results. Figure 1 displays the average gradation of the mix production for each project. All four mixes deviated from the target values, particularly the gradations. The Alabama mix did not comply with the NMAS criteria. All four projects missed the 1.18 mm gradation target by 5 percent or more. The Missouri mix was significantly finer than its mix design, and the Tennessee mix was significantly coarser than its JMF. Two projects exceeded the 0.075 mm gradation target by 3 percent or more. These plant mix variations are likely due to a
• A range of design air voids (4 to 6 percent) should be allowed.• To more effectively assure durability of these mixes when a
range of design air voids is used, criteria for VMA and VFA should be replaced with minimum and maximum Vbe
requirements.• Based on both fracture energy and MVT testing, Vbe should
be between 11.5 and 13.5 percent for projects over 3 million ESALs. For less than 3 million ESALs, a Vbe range of 12 to 15 percent is recommended.
• For projects with greater than 0.3 million ESALs, FAA should be at least 45 for improved rut resistance.
• For projects with less than 3 million ESALs, the minimum dust- to-binder ratio should be increased from 0.9 to 1.0. A mini-mum dust-to-binder ratio of 1.5 is recommended for mixes designed for more than 3 million ESALs.
• Current gradation limits on the 1.18 mm and 0.075 mm sieve should be adjusted for the purpose of decreasing the effective asphalt content. Percent passing the 1.18 mm sieve should be 30 to 55 percent, and percent passing the 0.075 mm sieve should be 6 to 13 percent.
• To improve rut resistance, moisture damage resistance and maintain low permeability, 4.75 mm mixes should contain no more than 15 percent natural sand with a FAA less than 45 percent.
A summary of proposed 4.75 mm NMAS mix design criteria is shown in Table 1.
Field Phase The second part of the study gathered and tested plant-produced 4.75 mm NMAS mixes from four states. The goal of this phase of the project was to validate the proposed mix design criteria by examining in-place density, lift thick-ness, production variability, friction and permea-
13Fall 2009 • Vol. 21 • No. 2
lack of consistency in gradations of the fine aggregate stockpiles. Only the Alabama mix had asphalt content results that were close to its mix design target. Although monitoring the field performance of the test pave-ments was not included in the study, some performance tests were conducted on the 4.75 mm plant produced mixes. APA results indicate that the Alabama mix would be susceptible to rutting. Since this mix was placed near Auburn, Ala., a recent project drive through by one of the researchers found that the pavement was performing very well after 3 years of service, with no signs of rut-ting. Despite the very high Vbe for the Minnesota mix, APA results were very good for this mix type. The rut resistance of the Min-nesota mix can be attributed to the excellent texture and shape of the taconite fine aggregate used exclusively in this mix design. The lab permeability tests on cores from the projects showed that they were all very low except for the Tennessee mix, which was just above the preliminary criterion of 125×10-5 cm/sec. The Ten-nessee mix had the highest in-place air void content and was the coarsest of the four mixes on the 1.18 mm sieve. Moisture damage susceptibility of the Alabama mix barely passed the AASHTO mix design criterion of 80 percent, and the other mixes had TSR results just below the limit. International Friction Index (IFI) results were only available for the Tennessee and Missouri mixes. These values are low since the tests were conducted on the untrafficked pave-ments before the asphalt surface film was worn off and the surface textures were at their lowest values.
Evaluation of the Effect of Reclaimed Asphalt Pavement Aggregate Bulk Specific Gravity on Voids in Mineral AggregateKvasnak, West, Michael, Loria, Hajj and Tran
Voids in Mineral Aggregate (VMA) is the mix design criteria used to ensure an adequate volume of asphalt binder is contained in a mix for durability. One of the inputs for calculating VMA is the bulk specific gravity (Gsb) of the combined aggregates. When reclaimed asphalt pavement (RAP) is used in a mix design, the Gsb of the RAP aggregate must be determined as well. To directly measure the Gsb of RAP aggregate, the aggregate must be recovered, either through solvent extraction or by the ignition oven method. Alternatively, the RAP aggregate Gsb may be estimated based on the theoretical maximum specific gravity (Gmm), asphalt content and an assumed asphalt absorption value. This method is recommended in NCHRP Report 452, Recommended Use of Reclaimed Asphalt Pavement in the Superpave Mix Design Method: Technician’s Manual. Each method has inherent disadvantages:
• Solvent extraction may leave asphalt residue on the aggregate
• The ignition oven method may cause aggregate degradation• Estimating Gsb by the Gmm method requires an asphalt
absorption value, which is based on typical values for a location and may not accurately reflect the actual absorption
14Asphalt Technology News
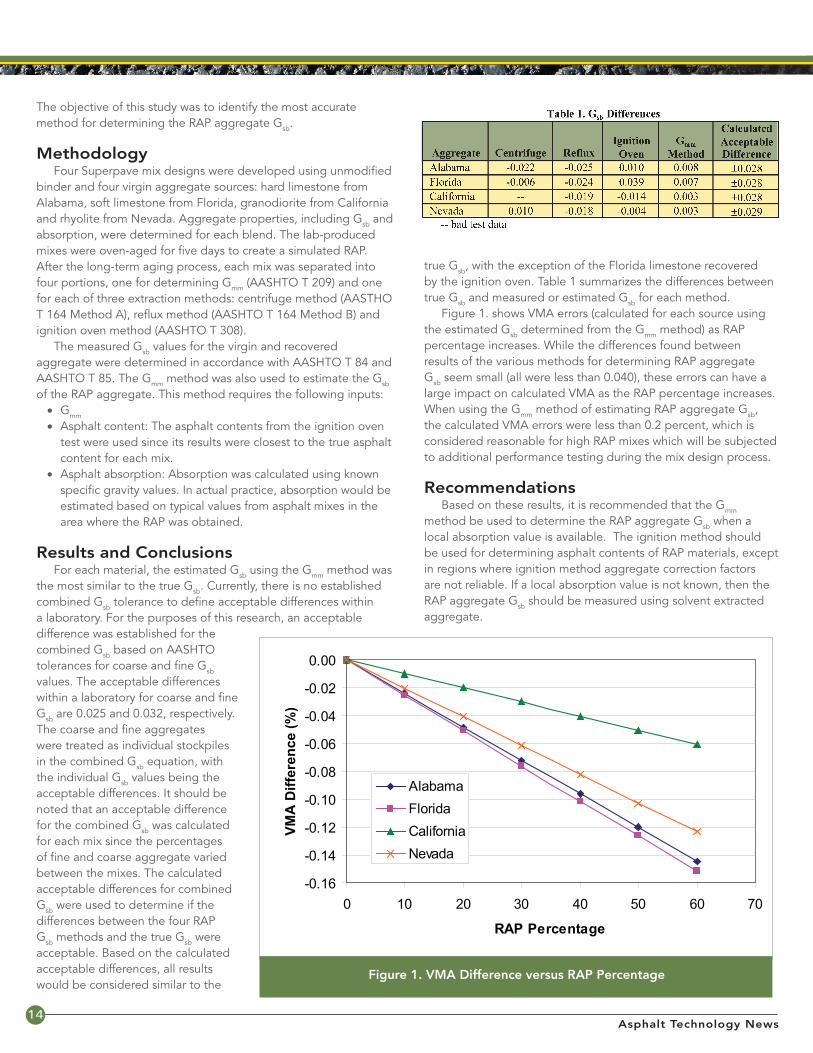
The objective of this study was to identify the most accurate method for determining the RAP aggregate Gsb.
Methodology Four Superpave mix designs were developed using unmodified binder and four virgin aggregate sources: hard limestone from Alabama, soft limestone from Florida, granodiorite from California and rhyolite from Nevada. Aggregate properties, including Gsb and absorption, were determined for each blend. The lab-produced mixes were oven-aged for five days to create a simulated RAP. After the long-term aging process, each mix was separated into four portions, one for determining Gmm (AASHTO T 209) and one for each of three extraction methods: centrifuge method (AASTHO T 164 Method A), reflux method (AASHTO T 164 Method B) and ignition oven method (AASHTO T 308). The measured Gsb values for the virgin and recovered aggregate were determined in accordance with AASHTO T 84 and AASHTO T 85. The Gmm method was also used to estimate the Gsb of the RAP aggregate. This method requires the following inputs:
• Gmm • Asphalt content: The asphalt contents from the ignition oven
test were used since its results were closest to the true asphalt content for each mix.
• Asphalt absorption: Absorption was calculated using known specific gravity values. In actual practice, absorption would be estimated based on typical values from asphalt mixes in the area where the RAP was obtained.
Results and Conclusions For each material, the estimated Gsb using the Gmm method was the most similar to the true Gsb. Currently, there is no established combined Gsb tolerance to define acceptable differences within a laboratory. For the purposes of this research, an acceptable difference was established for the combined Gsb based on AASHTO tolerances for coarse and fine Gsb values. The acceptable differences within a laboratory for coarse and fine Gsb are 0.025 and 0.032, respectively. The coarse and fine aggregates were treated as individual stockpiles in the combined Gsb equation, with the individual Gsb values being the acceptable differences. It should be noted that an acceptable difference for the combined Gsb was calculated for each mix since the percentages of fine and coarse aggregate varied between the mixes. The calculated acceptable differences for combined Gsb were used to determine if the differences between the four RAP Gsb methods and the true Gsb were acceptable. Based on the calculated acceptable differences, all results would be considered similar to the
true Gsb, with the exception of the Florida limestone recovered by the ignition oven. Table 1 summarizes the differences between true Gsb and measured or estimated Gsb for each method. Figure 1. shows VMA errors (calculated for each source using the estimated Gsb determined from the Gmm method) as RAP percentage increases. While the differences found between results of the various methods for determining RAP aggregate Gsb seem small (all were less than 0.040), these errors can have a large impact on calculated VMA as the RAP percentage increases. When using the Gmm method of estimating RAP aggregate Gsb, the calculated VMA errors were less than 0.2 percent, which is considered reasonable for high RAP mixes which will be subjected to additional performance testing during the mix design process.
Recommendations Based on these results, it is recommended that the Gmm method be used to determine the RAP aggregate Gsb when a local absorption value is available. The ignition method should be used for determining asphalt contents of RAP materials, except in regions where ignition method aggregate correction factors are not reliable. If a local absorption value is not known, then the RAP aggregate Gsb should be measured using solvent extracted aggregate.
-0.16
-0.14
-0.12
-0.10
-0.08
-0.06
-0.04
-0.02
0.00
0 10 20 30 40 50 60 70
RAP Percentage
VMA
Diff
eren
ce (%
)
AlabamaFloridaCaliforniaNevada
15Fall 2009 • Vol. 21 • No. 2
ASPHALT TECHNOLOGYThe Asphalt Technology course is a one-week training program designed to provide a basic understanding of asphalt technology for technicians, engineers and employees from all sectors of the asphalt industry. If you are looking for a general overview of HMA technology and how all aspects of design, production, construction and maintenance come together, then this is the course for you. Participants will be better able to communicate effectively with asphalt specialists and understand customer needs. This course provides 3.2 Continuing Education Units (CEUs), equivalent to 32 Professional Development Hours, and will be held at NCAT facilities in Auburn, Alabama.
Dates: January 25-29, 2010 (Registration and payment deadline: January 15, 2010)
February 22-26, 2010 (Registration and payment deadline: February 12, 2010)
SUPERPAVE MIX DESIGNThis workshop provides a more technical understanding of materials specifications, test procedures, mixture performance tests and general mix design requirements. The objective is to provide technicians, engineers, testing personnel and inspectors with an understanding of the development of a Superpave volumetric mix design. Upon completion of the workshop, participants will be able to develop a Superpave volumetric mix design in their laboratories. This course provides 2.8 CEUs (28 Professional Development Hours) and will be held at NCAT facilities in Auburn, Ala.
Date: March 22-25, 2010 (Registration and payment deadline: March 12, 2010)
CUSTOMIZED TRAINING
NCAT can also provide customized training to meet your individual training needs. Workshops can be conducted at our facilities or yours, at a time convenient for you. On-site workshops allow agencies and contractors to make the most efficient use of their training budgets while complying with imposed travel restrictions. Workshops can also be tailored to fit the technical needs of your personnel.
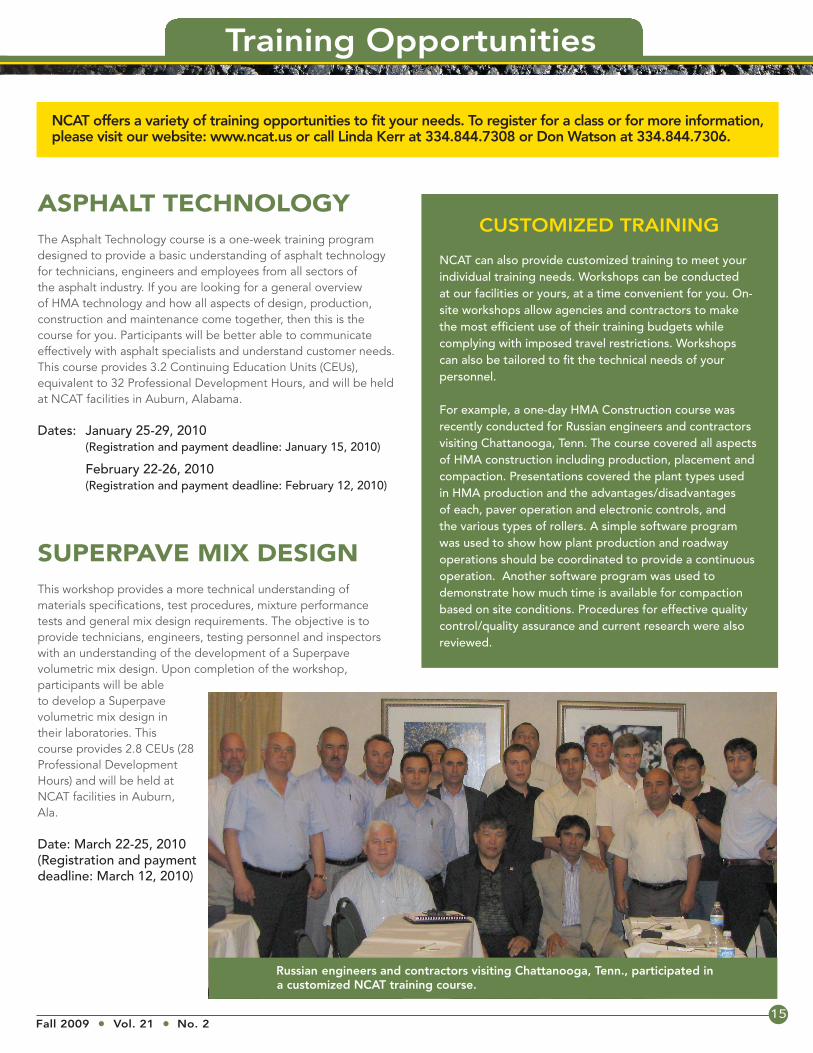
For example, a one-day HMA Construction course was recently conducted for Russian engineers and contractors visiting Chattanooga, Tenn. The course covered all aspects of HMA construction including production, placement and compaction. Presentations covered the plant types used in HMA production and the advantages/disadvantages of each, paver operation and electronic controls, and the various types of rollers. A simple software program was used to show how plant production and roadway operations should be coordinated to provide a continuous operation. Another software program was used to demonstrate how much time is available for compaction based on site conditions. Procedures for effective quality control/quality assurance and current research were also reviewed.
Training Opportunities
NCAT offers a variety of training opportunities to fit your needs. To register for a class or for more information, please visit our website: www.ncat.us or call Linda Kerr at 334.844.7308 or Don Watson at 334.844.7306.
16Asphalt Technology News
National Center for Asphalt Technology, 277 Technology Parkway, Auburn, Alabama 36830Phone: 334•844•NCAT (6228) Fax: 334•844•6248
ASPHALT TECHNOLOGY NEWS (Library of Congress Catalog No. ISSN 1083-687X) is published by the National Center for Asphalt Technology (NCAT) of Auburn University. Its purpose is to facilitate the exchange and dissemination of information about hot mix asphalt technology, trends, developments and concerns. Opinions expressed in this publi-cation by contributors and editors, the mention of brand names, the inclusion of research results, and the interpretation of those results do not imply endorsement or reflect the official positions or policies of NCAT or Auburn University.
Randy West, Director, NCATCourtney Jones, Editor, NCATCheryl Cobb, Associate Editor, College of Engineering
www.ncat.edu Auburn University is an equal opportunity educational institution/employer.
ENN0910NT2
Nonprofit Org.U.S. Postage
PAIDPermit #9
Auburn, AL 36849
277 Technology Parkway • Auburn, AL 36830
2009 Professor Training course – attendees and instructors.