Page 1
2009 FOREIGN PRIVATE CAPITAL AND INVESTOR PERCEPTIONS SURVEY REPORT
MALAWI
NATIONAL STATISTICAL OFFICE
RESERVE BANK OF MALAWI
MALAWI INVESTMENT PROMOTION AGENCY
MINISTRY OF FINANCE
MINISTRY OF DEVELOPMENT PLANNING AND COOPERATION
MINISTRY OF INDUSTRY AND TRADE
May 2011
Page 2
i
TABLE OF CONTENTS LIST OF TABLES ................................................................................................. iv
LIST OF FIGURES ............................................................................................... v
PREFACE ............................................................................................................ vi
ACKNOWLEDGEMENTS ................................................................................... viii
LIST OF ACRONYMS .......................................................................................... ix
EXECUTIVE SUMMARY ..................................................................................... xi
CHAPTER 1 .......................................................................................................... 1
Introduction ........................................................................................................... 1
1.1 Global and Regional Perspective ................................................................ 1
1.2 Global Trends in Foreign Direct Investment (FDI) ....................................... 2
1.3 Malawi’s Macroeconomic Performance ....................................................... 4
CHAPTER 2 .......................................................................................................... 8
Methodology ......................................................................................................... 8
2.1 Introduction.................................................................................................. 8
2.2 Institutional Set Up ...................................................................................... 8
2.3 Pre-Survey Activities ................................................................................... 8
2.3.1 Pre-Survey Training .............................................................................. 8
2.3.2 Sensitisation and Awareness Campaign............................................... 9
2.4 Technical Assistance ................................................................................... 9
2.5 Survey Methods and Techniques .............................................................. 10
2.5.1 Compilation of Enterprise Register ..................................................... 10
2.5.2 Scope and Coverage of the Survey .................................................... 10
2.5.3 Questionnaire Design ......................................................................... 10
2.5.4 Survey Implementation ....................................................................... 11
2.5.5 Data Collection ................................................................................... 11
2.5.6 Response Rates ................................................................................. 11
2.5.7 Data Coverage, Checking and Verification ......................................... 12
2.5.8 Generation of Time Series Data ......................................................... 13
2.5.9 Adherence to International Standards................................................. 15
2.5.10 Timeliness ......................................................................................... 15
CHAPTER 3 ........................................................................................................ 16
Analysis of Foreign Private Capital ..................................................................... 16
3.1 Stock of Foreign Liabilities......................................................................... 16
3.2 Composition of Stock of Foreign Liabilities 2007-2008 .............................. 16
Page 3
ii
3.3 Foreign Liabilities by Sector ...................................................................... 17
3.4 Foreign Liabilities by Source Country ........................................................ 18
3.5 Foreign Liabilities by Region ..................................................................... 19
3.6 Foreign Direct Investment ......................................................................... 20
3.6.1 FDI Stock by Type .............................................................................. 20
3.6.2 FDI Stock by Source Country and Region .......................................... 21
3.7 Foreign Portfolio Investment (FPI) ............................................................. 23
3.7.1 FPI by Source Country and Region .................................................... 24
3.8 Other Investment ....................................................................................... 25
3.8.1 Stock of Other Investment .................................................................. 25
3.8.2 Other Investment by Source Country and Region .............................. 26
3.9 Flows of Foreign Direct Investment ........................................................... 27
3.9.1 Flows of FDI by Sector........................................................................ 27
3.10 Private Sector External Debt (PSED) ...................................................... 28
3.11 Profitability, Retained Earnings and Dividends Paid ................................ 29
3.11.1 Profitability ........................................................................................ 29
3.11.2 Dividends Paid .................................................................................. 30
3.12 Foreign Assets ........................................................................................ 31
CHAPTER 4 ........................................................................................................ 33
Investor Perceptions ........................................................................................... 33
4.1 Introduction................................................................................................ 33
4.2 Main Factors Covered and Rating Structure of Responses....................... 33
4.3 Detailed Findings ....................................................................................... 35
4.3.1 Initial Investment Factors .................................................................... 35
4.3.2 The Global Economic and Financial Crisis ......................................... 36
4.3.3 Business Outlook during 2009 – 2011 and Onwards .......................... 37
4.3.4 Future Likely Direction of Investment .................................................. 38
4.3.5 Economic and Financial Factors ......................................................... 39
4.3.6 Political and Governance Factors ....................................................... 41
4.3.7 Operations of Government Agencies .................................................. 42
4.3.8 Infrastructure and Service Factors ...................................................... 44
4.3.9 Labour Factors .................................................................................... 46
4.3.10 Environmental and Health Factors .................................................... 47
4.3.11 Information Sources .......................................................................... 48
Page 4
iii
4.3.12 Corporate Social Responsibility (CSR) ............................................ 49
CHAPTER 5 ........................................................................................................ 51
Conclusion and Policy Implications ..................................................................... 51
APPENDICES ..................................................................................................... 54
APPENDIX A: Supplementary Tables ............................................................. 54
APPENDIX B: 2009 Survey of FPC and IPs Team ......................................... 59
APPENDIX C: Summary Budget for the 2009 FPC and IPs Survey ................ 61
Page 5
iv
LIST OF TABLES
Table 1: Selected Economic Indicators ................................................................. 5
Table 2: Response Rates for the 2009 Survey Cycle by Region ........................ 12
Table 3: Stock of Foreign Liabilities (US$ Millions) ............................................. 16
Table 4: Stock of Foreign Liabilities (US$ Million) ............................................... 17
Table 5: Foreign Liabilities by Sector in US$ Million ........................................... 18
Table 6: Stock of FDI by Top Five Source Countries (US$ Millions) ................... 22
Table 7: Stock of FPI by Top Five Source Countries (US$ Millions) ................... 24
Table 8: Private Sector External Debt (US$ Million), 2007-2008 ........................ 29
Table 9: Stock of Foreign Assets (US$ Millions), 2007 – 2008 ........................... 32
Table 10: Scale of Business Outlook Assessment .............................................. 34
Table 11: Scale of Assessment of Future Likely Direction of Investment ............ 34
Table 12: Scale of Assessment of Several Factors Covered .............................. 34
Table 13: Scale of Assessment of the Importance of Information Sources ......... 35
Table 14: Expenditure on CSR by Sector ........................................................... 50
Page 6
v
LIST OF FIGURES
Figure 1: Composition of Stock of Foreign Liabilities, 2008 . Error! Bookmark not
defined.
Figure 2: Foreign Liabilities by Country (US$ Million), 2008 ............................... 19
Figure 3: Foreign Liabilities by Region (US$ Million) .......................................... 20
Figure 4: FDI Stock by Mode of Financing (US$ Million) .................................... 21
Figure 5: Distribution of FDI Stock by Region ..................................................... 23
Figure 6: Stock of Foreign Portfolio Investment (US$ Millions) ........................... 24
Figure 7: Stock of Other Investment during 2007-2008 (US$ Millions) ............... 25
Figure 8: Stock of Other Investments by Top Five Source Countries, 2008 ....... 26
Figure 9: Net Flows of FDI, 2007-2008 ............................................................... 27
Figure 10: Flows of FDI by Sector (US$ Million), 2007 – 2008 ........................... 28
Figure 11: Return on Equity by Sector in 2008 (Percentage) .............................. 30
Figure 12: Dividends Paid by Sector in 2008 (US$ Million) ................................. 31
Figure 13: Initial Investment Factors ................................................................... 36
Figure 14: Effects of the Global Economic and Financial Crisis .......................... 37
Figure 15: Business Outlook during 2009 - 2011 and onwards .......................... 38
Figure 16: Direction of Business Activities .......................................................... 39
Figure 17: Economic and Financial Factors ........................................................ 40
Figure 18: Political and Governance Factors ...................................................... 42
Figure 19: Operations of Agencies...................................................................... 43
Figure 20: Operations of Agencies...................................................................... 44
Figure 21: Infrastructure and Service Factors ..................................................... 45
Figure 22: Labour Factors ................................................................................... 46
Figure 23: Environmental and Health Factors ..................................................... 48
Figure 24: Information Sources ........................................................................... 49
Page 7
vi
PREFACE
The 2009 Foreign Private Capital (FPC) and Investor Perceptions (IPs) Survey
was conducted between June and August 2009 and collected data for the years
2007 and 2008.
The National Statistical Office (NSO) collaborated with the following institutions in
administering the survey: Reserve Bank of Malawi (RBM), Malawi Investment
Promotion Agency (MIPA), Ministry of Finance (MoF), Ministry of Development
Planning and Cooperation (MDPC) and Ministry of Industry and Trade (MoIT).
The report shows that Malawi registered persistent increase in the stock of
foreign liabilities since 2003. The largest share of foreign liabilities has been in
form of FDI which is long-term in nature. This suggests investors’ confidence in
the economy.
The economy recorded a robust performance in 2008 with total stocks of foreign
liabilities more than doubling to US$2,887.0 million compared to US$1,319.5
million in 2007, implying that the economy was not affected by the first round of
the Global Financial Crisis. The largest component of these liability stocks as at
end of 2008 was in form of Foreign Direct Investment (FDI) which accounted for
89.5 percent.
Regarding the assessment of Investors Perceptions (IPs), which were based on
a number of factors that affected their operations, the main objective was to
evaluate the investment environment. This is instrumental in government’s
strategy of reducing poverty and increasing economic growth.
The report therefore offers some useful insights into how government policies
and institutions that affect the investment environment were perceived at the time
of the survey. International investors as well as other development partners are
Page 8
vii
also provided with insights into the investment environment, potential mediums of
investment as well as profitability levels on all forms of Foreign Assets and
Liabilities (FAL).
Charles Machinjili
Commissioner of Statistics
Page 9
viii
ACKNOWLEDGEMENTS
On behalf of stakeholder institutions, NSO is highly appreciative of the dedication
of staff comprising the Balance of Payments Committee (BOPC) for successfully
carrying out the survey and producing this report. Their contribution was
immeasurable and is duly recognized.
NSO also wishes to record gratitude to the Government of Malawi and Macro-
Economic and Financial Management Institute of Eastern and Southern Africa
(MEFMI) for providing funds for the survey. The technical advice provided by
MEFMI, Development Finance International (DFI), and staff from other Statistical
Institutions and Central Banks in other countries is acknowledged.
Most importantly, special thanks are extended to the respondents who had a
commitment to duty through provision of the requested data but also suggested
some areas of improvement for the next cycle. Without their input, the economy
would not have been able to make an assessment of not only the magnitude of
FPC and their perceptions regarding the domestic investment climate but also
trends in foreign investment in Malawi as well as domestic investment abroad.
Our hope is that, on the basis of the same understanding, we will continue to
cooperate in similar activities in future.
Lizzie Chikoti
Survey Coordinator
Page 10
ix
LIST OF ACRONYMS
AIDS Acquired Immune Deficiency Syndrome
BOP Balance of Payments
BOPC Balance of Payments Committee
BPM5 Balance of Payments Manual, 5th Edition
COMESA Common Market for Eastern and Southern Africa
CPI Consumer Price Index
CSR Corporate Social Responsibility
DFI Development Finance International
FAL Foreign Assets and/or Liabilities
FDEA Foreign Direct Equity Assets
FDEI Foreign Direct Equity Investment
FDI Foreign Direct Investment
FPC Foreign Private Capital
FPEI Foreign Portfolio Equity Investment
FPI Foreign Portfolio Investment
GDDS General Data Dissemination System
GDP Gross Domestic Product
GFC Global Economic and Financial Crisis
HIV Human Immuno-Deficiency Virus
IIP International Investment Position
IMF International Monetary Fund
IPs Investor Perceptions
ISIC International Standard for Industrial Classification
IT Information Technology
LDCs Least Developed Countries
M&A Mergers and Acquisitions
MEFMI Macro-Economic and Financial Management Institute of
Eastern and Southern Africa
MDPC Ministry of Development Planning and Cooperation
MEPC Malawi Export Promotion Council
MIPA Malawi Investment Promotion Agency
MITC Malawi Investment and Trade Centre
MOF Ministry of Finance
MoIT Ministry of Industry and Trade
MRA Malawi Revenue Authority
MV Market Value
NA National Accounts
NSO National Statistical Office
Page 11
x
OECD Organization for Economic Co-operation and Development
OI Other Investment
PCMS Private Capital Monitoring System
PI Portfolio Investment
PSED Private Sector External Debt
RBM Reserve Bank of Malawi
ROE Return on Equity
SADC Southern Africa Development Community
TNCs Transnational Corporations
TV Television
USA United States of America
US$ United States Dollar
Page 12
xi
EXECUTIVE SUMMARY
This report presents findings of the 2009 Survey of Foreign Private Capital (FPC)
and Investor Perceptions (IPs) conducted between 8th June and 28th August
2009. It was a fourth cycle covering stock data for 2007 and 2008 and
transaction data for 2008. The survey was jointly conducted by National
Statistical Office (NSO), Reserve Bank of Malawi (RBM), Malawi Investment
Promotion Agency (MIPA), Ministry of Finance (MoF), Ministry of Development
Planning and Cooperation (MDPC), and the Ministry of Industry and Trade
(MoIT).
Survey Findings:
This survey recorded a highest response rate of 91.3 percent compared to any of
the previous three cycles, mainly attributable to a more simplified questionnaire
and increased cooperation from respondents. The response rate originates from
149 enterprises to which questionnaires were administered.
It is pertinent to note that whereas the majority of resident enterprises contracted
both long- and short-term liabilities with the rest of the world during the period
under review, some of them also extended similar investments to non-resident
enterprises.
Malawi recorded a robust performance in 2008 with total stocks of liabilities
doubling to US$2,887.0 million compared to US$1,319.5 million in 2007, implying
that that the economy was not affected by the first round of the Global Financial
Crisis. As at end 2008, the largest proportion of foreign liabilities was in form of
Foreign Direct Investment (FDI) accounting for 89.5 percent. The remaining
components which are other investment and portfolio investment accounted for
10.4 percent and 0.2 percent, respectively.
Page 13
xii
Manufacturing accounted for the largest share over the two years with an
average of 47.9 percent of the total in 2008, followed by construction and
agriculture with averages of 13.5 percent and 12.9 percent, respectively.
The survey findings showed that Southern Africa Development Community
(SADC) was the leading source of foreign private investments in Malawi with
60.6 percent (US$893.0 million) of the total stock in 2007 followed by the
Organization for Economic Co-operation and Development (OECD) with 23.5
percent (US$310.5). On a country basis, the largest stock of these investments
were from Mauritius, South Africa and United Kingdom, each on average
accounting for 35.2 percent, 18.0 percent and 16.8 percent, respectively during
the period under review. Within the MEFMI region, Kenya, Zimbabwe and
Tanzania also made considerable investment in the country.
The southern region continued to be the largest recipient of foreign investment
stocks during 2007 and 2008, with an average of 82.2 percent of the total stock.
The net flows of FDI during 2008 surged to US$8.7 million compared to US$0.2
million in 2007, mainly driven by equity liabilities. During the same period, the
non-equity liabilities posted a negative net inflow of US$95.7 million compared to
US$0.2 million on account of short-terms loans. In 2008, these were
concentrated in the construction, information and communication, and wholesale
and retail trade sectors.
The total stock of Private Sector External Debt (PSED) as at end 2008 stood at
US$607.5 million, having increased from US$1.8 million in 2007, mainly driven
by short-term loans in form of trade/suppliers credits.
On the whole, return on equity (ROE) for 2008 was 30.5 percent with information
and communication, and financial and insurance services sectors registering the
Page 14
xiii
highest return on equity of 55.3 percent and 44.8 percent, respectively. The
survey further revealed that total dividends paid during 2008 amounted to
US$43.5 million. Manufacturing, wholesale and retail trade, and agriculture
accounted for 64.8 percent, 13.3 percent and 10.5 percent, respectively.
Malawi’s claims on the rest of the world stood at US$0.24 million at end 2007,
which increased substantially to US$28.9 million at end 2008. In 2007, most of
the assets were in form of FDI which accounted for 54.2 percent followed by
portfolio investment at 30.1 percent. Net flows amounting to US$26.4 million
were recorded in 2008 and were largely constituted by supplier credits to
affiliated enterprises in the rest of the world accounting for about 95.0 percent.
While the total stock of foreign assets were concentrated in the manufacturing
and professional, scientific and technical services in 2007, it was predominated
by construction and wholesale and retail trade services in 2008. The major
investment destinations of Malawian private investors were South Africa and
Tanzania accounting for about 50.0 percent of the total stock of Malawi’s foreign
assets in 2008.
Results from investor perceptions revealed that the majority of companies
indicated the domestic environment as a key determining factor that initially led
them to invest in Malawi. In particular, the stability of the domestic political and
economic environment as well as the domestic market size were the main
factors. About 75.0 percent of the respondents indicated that the negative effects
of the Global Economic and Financial Crisis (GFC) that started affecting the
Global Economy from 2007 also affected the domestic economy.
Respondents expressed intentions to expand their investments in turnover
accounted for (85.0 percent), staff training (75.0 percent), technology (72.0
percent) and diversification of products and services (60.0 percent). In terms of
investment and trade factors (assessed by considering investment policy and
incentives, trade policy, informal trade and import competition), it was observed
Page 15
xiv
that business operations were negatively affected by informal trade and import
competition. Effects of economic and fiscal factors presented a general negative
picture with the availability of foreign exchange having a very strong negative
effect on business operations. The fluctuation of the exchange rate, exchange
controls and the corporate tax burden also had negative effects.
The analysis revealed that the Regional and domestic political environment had a
positive effect on business operations. On the other hand, the level of corruption
and bureaucracy/regulatory framework/state intervention were seen to have a
negative effect on business operations.
With regard to cost, telecommunications was rated as having a relatively high
negative effect on business operations, followed by road transport, air transport,
electricity supply, banking and insurance, and water supply. The inefficiency of
electricity and water supply highly negatively affected business operations as
well as railway transport, telecommunications, air and road transport.
Investors revealed a positive effect on business operations with respect to
availability of labour in all categories (i.e. management, technical, semi-skilled
and casual). A similar positive effect was evident with respect to cost and
productivity. However, labour turnover, legislation and restrictions regarding
bringing in expatriates had a negative effect.
Respondents identified HIV/AIDS and malaria as the most significant
environmental and health factors negatively affecting their business operations.
However, environmental legislation and controls, and availability of health care
services depicted some positive effect on business operations. Concerning
usefulness of information sources, investors relied mostly on internet, actions of
competitors, business partners and the national media as key sources of
information for investment decision making.
Page 16
xv
The total amount spent by investors on Corporate Social Responsibility (CSR) in
2008 was US$14.6 million up from US$12.0 million recorded in 2007 of which
about 70.0 percent went into health, education and infrastructure sectors.
Policy Implications and Recommendations:
Historically, high concentration of FDI has been in the Southern region compared
to the Central and Northern regions, largely attributable to resource endowments
as well as better developed infrastructure. This calls for government to formulate
deliberate policies to attract more investment in the other regions particularly the
northern region.
Like in the previous surveys, findings from this survey showed that the source of
FDI in Malawi continues to be highly concentrated from only three countries
namely Mauritius, South Africa and United Kingdom accounting for about 58.4
percent of FDI in 2008. This is not healthy for the economy as it is exposed to
risks should any of these countries face economic crisis. There is, therefore, a
need for the government in collaboration with the investment promotion authority
to intensify its promotional efforts to more countries in a more diversified manner
in order to minimize such risks.
During the period under review, the stock of other investment posted a
remarkable increase from US$1.2 million in 2007 to US$298.9 million in 2008,
mainly dominated by trade credits. This pattern of other investment is partly due
to scarcity of foreign currency amid increasing investment activities since debtors
were not able to pay upfront. Government should create a conducive
environment for private enterprises to diversify into sectors that generate more
foreign exchange.
The effects of market size indicated that business operations were positively
affected. This could be attributed to the various Regional and international trade
Page 17
xvi
arrangements that Malawi has with Common Market for Eastern and Southern
Africa (COMESA), SADC and other countries in Europe, Asia, and the Americas.
In terms of investment and trade, it was observed that business operations were
negatively affected by informal trade and import competition. There is therefore
need for strengthening the country’s borders to combat illegal cross-border trade
and improve the quality of local products to make them competitive with imported
products. Government efforts with respect to investment policy and incentives
and the trade policy are also seen to be impacting positively on business
operations in the country. This is a clear signal of the need for Government to
continue efforts aimed at improving the investment and trade environment.
Effects of economic and fiscal factors presented a general negative outlook with
the availability of foreign exchange having a very strong negative effect on
business operations. The fluctuation of the exchange rate, exchange controls
and the corporate tax burden also had negative effects. While interest rates,
inflation, and availability of international credit were seen not to have a significant
effect on business operations, there is need to effect policies in the banking
system that would increase availability of capital to businesses.
Surveys on FPC in Malawi have shown that foreign private investment in Malawi
is much more profitable than Malawi’s private investment into the rest of the
world. This is in tandem with low magnitudes of foreign private assets as this
survey has revealed. The results suggest that investment incentives may be
more favourable to foreign investors compared to domestic investors. There is
therefore need to promote domestic investment abroad alongside foreign
investment in Malawi.
In conclusion, the huge increase in PSED most of which is short-term in nature
calls for a need to carry out another survey for 2011 with a view to capture the
current position.
Page 18
1
CHAPTER 1
Introduction
1.1 Global and Regional Perspective
The global economy expanded successively for four years up to 2007 as Gross
Domestic Product (GDP) rose to an average of 5.0 percent, owing to a broad-
based surge in the emerging and developing economies (World Economic
Reports). However, the global economy slowed down markedly to 0.2 percent in
2008 following shocks in the mature financial markets. During 2009, the global
economy entered into a severe recession owing to massive financial crisis and
acute loss of confidence. Hence, output contracted by 0.6 percent in 2009.
Advanced economies were the hardest hit, with output growth declining to 1.5
percent in 2008 before contracting by 3.2 percent in 2009. The world’s largest
economy, the United States of America (USA), failed to register growth in 2008
and contracted by 2.6 percent in 2009 compared to a solid growth of 2.0 percent
in 2007. In the Euro area, economic output declined to 0.5 percent in 2008 and
shrunk by 4.1 percent in 2009 in contrast to an expansion of 2.6 percent in 2007.
Though growth momentum in China and India eased, GDP output remained
robust at 9.6 percent and 6.4 percent in 2008 and 9.1 percent and 5.7 percent in
2009, respectively.
Recent developments indicate that economic recovery is underway and broad
based though sluggish in most advanced economies and a few emerging
economies. As such, global activity was forecasted to expand by 4.8 percent in
2010. Respective output growth for emerging and developing economies was
projected at 7.1 percent and 6.4 percent, respectively, in 2010.
Economic growth in the Sub-Saharan region moderated to 5.5 percent in 2008
from 6.9 percent in 2007, as many of these countries were less affected by the
Page 19
2
first round effects of the financial crisis. Despite a weakening external
environment, economic expansion in oil-exporting countries softened moderately
with GDP growth declining to about 7.4 percent from nearly 7.9 percent in 2007,
owing to a substantial improvement in the terms of trade in 2008. For oil
importers, output growth marginally slowed down to 5.0 percent in 2008 from 5.3
percent in 2007. Notwithstanding this, other oil importers that did not benefit
from the higher commodity prices experienced a deteriorating terms of trade,
averaging 15–20 percent in 2008. In 2009, however, the second round effects
had affected the region such that output grew by 2.6 percent in 2009.
Nevertheless, the impact was contained by rapid implementation of
countercyclical policies made possible by the policy room that many of these
economies had built prior to the downturn. In the Sub-Saharan region, output
growth was estimated to accelerate to 5.0 percent in 2010.
1.2 Global Trends in Foreign Direct Investment (FDI)
The global FDI grew for four consecutive years in tandem with global economic
performance and reached a record high of US$1,979 billion in 2007 (World
Investment reports). The growth was broad based as the advanced, emerging
and the Sub-Saharan Africa economies experienced continued growth in FDI.
The sustained rise in FDI in 2007 was driven by relatively high economic growth
in many parts of the world coupled with expansion in cross-border mergers and
acquisitions (M&A) across countries and sectors. After uninterrupted growths in
FDI in the period 2003–2007, global FDI inflows fell by 16.0 percent to US$1,662
billion in 2008. This decline was, in general, a reflection of the turmoil in the
financial markets and the accompanied worldwide economic downturn.
Regionally, FDI inflows into developing countries rose by 21.0 percent in 2007 to
reach a new record level of US$500 billion. Inflows to Least Developed Countries
(LDCs) alone reached US$13 billion, a 4.0 percent increase over the previous
year. Meanwhile in Africa, FDI inflows rose to a historic high of US$53 billion in
Page 20
3
2007. The inflows were supported by a boom in global commodity markets as
well as by increased cross-border M&As in the extraction industries and related
services, and the banking industry. These cases might illustrate a trend towards
greater diversification of inflows in some of the LDCs, away from traditional
sectors like oil and gas. Nigeria, Egypt, South Africa and Morocco were the
largest recipients.
In 2008, however, the regional pattern of FDI flows varied by groups of
economies. In developed countries, both FDI inflows and outflows plunged, with
inflows declining by 41.8 percent to US$1,018 billion, and outflows by 17.5
percent to US$1,572 billion during 2008. The declines were registered in all three
components of FDI inflows (equity, reinvested earnings and other capital flows
mainly intra-company loans). In contrast, developing economies saw FDI inflows
rising by 11.5 percent to record levels of US$630 billion, with their shares in
global FDI inflows growing to 37.0 percent and 7.0 percent in developed and
developing economies, respectively in 2008, from 27.0 percent and 5.0 percent
in the previous year. It should be noted that the downturn in FDI inflows into
developing and transition economies began almost one year after it had started
in developed countries, reflecting the time lag associated with the initial economic
downturn and consequent slump in demand in developed-country markets, which
are important destinations for goods produced by developing countries.
There were declines in FDI inflows in late 2008 and early 2009, particularly in
developed countries. In Africa, inflows rose to a record level of US$72.2 billion,
with the fastest increase of 63.0 percent over 2007 recorded in West Africa.
Sectoral analysis had shown that globally, the agriculture and extractive
industries weathered the crisis relatively well, compared with business-cycle-
sensitive industries such as metal manufacturing. In addition, FDI in industries
such as agribusiness, services and pharmaceuticals were somewhat resilient.
Overall, policy trends during 2008 were mostly favourable to FDI, both nationally
Page 21
4
and internationally. However, in some countries a more restrictive FDI approach
had emerged as there was growing evidence of undisclosed protectionism.
Recent trends indicate that global FDI inflows drastically fell further by 37.0
percent to US$1,114 billion in 2009 while outflows fell some 43.0 percent to
US$1,101 billion in 2009. FDI flows contracted in almost all major economies,
except for a few FDI recipients such as Denmark, Germany and Luxembourg,
and investment sources such as Mexico, Norway and Sweden. Both M&As and
Greenfield investments declined due to reduced ability of Transnational
Corporations (TNCs) to raise capital either through financial institutions, stock
markets or internal resources. Nevertheless, most of the drop in FDI was due to
a substantial decrease in M&As deals rather than Greenfield operations. Whilst
some sectors were resilient in 2008, FDI inflows and outflows slumped in the
primary, manufacturing and service sectors in 2009. FDI was, however, showing
signs of recovery in 2010, sustained by a resumption of equity investment as well
as increases in intra-company loans and reinvested earnings.
1.3 Malawi’s Macroeconomic Performance
Malawi’s economic performance had been so impressive in the past years with
economic activity registering significant growths of 6.8 percent between 2005 and
2008 compared to that of 4.6 percent during the period of 2002 to 2004.
Consequently, nominal per capita GDP rose from US$213.2 in 2005 to US$
298.3 in 2008. This growth was mostly anchored by agriculture which saw
tremendous growth owing to the implementation of the input subsidy program
and improved macroeconomic environment. The macroeconomic fundamentals
were very stable during this period as evidenced by the benign inflationary
environment much owed to favourable supply side factors as well as prudent
monetary policy, declining interest rates, declining domestic debt ratios and also
stable external environment.
Page 22
5
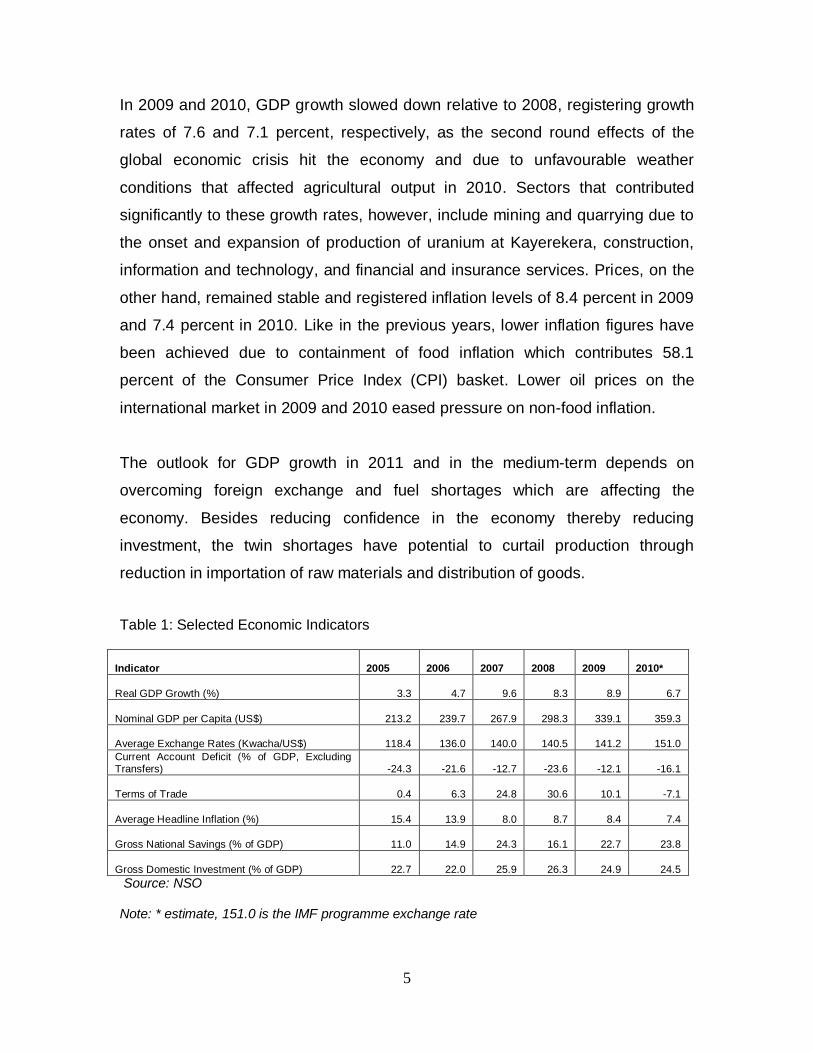
In 2009 and 2010, GDP growth slowed down relative to 2008, registering growth
rates of 7.6 and 7.1 percent, respectively, as the second round effects of the
global economic crisis hit the economy and due to unfavourable weather
conditions that affected agricultural output in 2010. Sectors that contributed
significantly to these growth rates, however, include mining and quarrying due to
the onset and expansion of production of uranium at Kayerekera, construction,
information and technology, and financial and insurance services. Prices, on the
other hand, remained stable and registered inflation levels of 8.4 percent in 2009
and 7.4 percent in 2010. Like in the previous years, lower inflation figures have
been achieved due to containment of food inflation which contributes 58.1
percent of the Consumer Price Index (CPI) basket. Lower oil prices on the
international market in 2009 and 2010 eased pressure on non-food inflation.
The outlook for GDP growth in 2011 and in the medium-term depends on
overcoming foreign exchange and fuel shortages which are affecting the
economy. Besides reducing confidence in the economy thereby reducing
investment, the twin shortages have potential to curtail production through
reduction in importation of raw materials and distribution of goods.
Table 1: Selected Economic Indicators
Indicator 2005 2006 2007 2008 2009
2010*
Real GDP Growth (%) 3.3 4.7 9.6 8.3
8.9
6.7
Nominal GDP per Capita (US$) 213.2 239.7 267.9 298.3
339.1
359.3
Average Exchange Rates (Kwacha/US$) 118.4 136.0 140.0 140.5
141.2
151.0
Current Account Deficit (% of GDP, Excluding Transfers) -24.3 -21.6 -12.7 -23.6
-12.1
-16.1
Terms of Trade 0.4 6.3 24.8 30.6
10.1
-7.1
Average Headline Inflation (%) 15.4 13.9 8.0 8.7
8.4
7.4
Gross National Savings (% of GDP) 11.0 14.9 24.3 16.1
22.7
23.8
Gross Domestic Investment (% of GDP) 22.7 22.0 25.9 26.3
24.9
24.5
Source: NSO Note: * estimate, 151.0 is the IMF programme exchange rate
Page 23
6
Stable macroeconomic environment underpinned increases in savings and
investment in the country between 2005 and 2010. In line with growth in GDP,
gross national savings grew from 11.0 percent of GDP in 2005 to 23.8 percent of
GDP in 2010. It reached a high of 24.5 percent in 2007 before declining in 2008.
On the other hand, gross domestic investment increased marginally from 22.7
percent of GDP in 2005 to 24.5 percent of GDP in 2010. The faster growth in
gross national savings reduced the saving investment balance from -11.7 percent
of GDP in 2005 to -0.7 percent of GDP in 2010. The current account deficit
remained volatile during 2005 to 2010. This was largely due to the substantial
growth in imports that supported the growth in economic activity. In 2007, it
registered a significant improvement to 12.7 percent of GDP from a deficit of 21.6
percent of GDP in 2006 owing to improving terms of trade. However, worsening
terms of trade in 2010 to -7.1 percent from 10.1 percent in 2009 explains the
widening current account deficit from 12.1 percent of GDP in 2009 to a deficit of
16.1 percent of GDP in 2010. Pressure on the current account triggered a
depreciation of the Kwacha against the US dollar from K141.2 in 2009 to K151.0
in 2010.
Government policy on promoting foreign investment is focusing on improving the
efficiency of all government agencies that facilitate the investment process as
well as those that work towards establishing a conducive business operating
environment. Of particular attention is the proposed establishment of a new
institution, the Malawi Investment and Trade Centre (MITC), which will combine
the functions of the national investment and export promotion institutions.
Government is also undertaking targeted foreign trade and investment promotion
missions to select developed and developing countries in a bid to establish
international business partnerships and promote trade and investment.
The country’s overriding economic policy challenge remains establishing
conditions for sustained growth and significant poverty reduction. Over the
Page 24
7
medium-term, government should endeavour to further improve the
macroeconomic environment by implementing policies that enhance production
of goods and services for domestic consumption and exports. Government
should therefore seek to reduce the cost of doing business to foster private
sector participation, ensuring enhanced and sustained supply of utilities like
electricity and water, ensuring prudent fiscal and monetary policies, reforming
key institutions and investing in basic infrastructure.
The rest of the report develops as follows: Chapter 2 provides the methodology
used during survey implementation. Chapter 3 gives an account of main findings
from the quantitative part of the survey (FAL). Chapter 4 details survey findings
on the qualitative part of the survey (IPs). Chapter 5 concludes by proposing a
catalogue of policy issues that arose from both the quantitative and the
qualitative parts.
Page 25
8
CHAPTER 2
Methodology
2.1 Introduction
This chapter covers the methodology used in conducting the survey of
enterprises with foreign assets and liabilities in Malawi during 2007 and 2008.
The main issues discussed include institutional setup, pre-survey activities,
technical assistance, survey funding, and survey methods and techniques.
2.2 Institutional Set Up
This survey of enterprises with foreign assets and liabilities in Malawi was jointly
conducted by six institutions namely National Statistical Office (NSO) – the lead
institution, Reserve Bank of Malawi (RBM), Malawi Investment Promotion
Agency (MIPA), Ministry of Finance (MoF), Ministry of Development Planning
and Cooperation (MDPC), and the Ministry of Industry and Trade (MoIT). In
terms of funding, the Malawi Government and the Macroeconomic and Financial
Management Institute of Eastern and Southern Africa (MEFMI) contributed to the
overall budget estimated at US$134,532. However, regarding human resource,
all institutions contributed staff for undertaking survey activities which included
review of survey documentation, pre-survey training, survey implementation and
report writing.
2.3 Pre-Survey Activities
2.3.1 Pre-Survey Training
Before the survey commenced, a pre-survey training was organized for a week. It
took place between 27th – 30th May 2009 at the Reserve Bank of Malawi Club
Page 26
9
House in Lilongwe. The training involved representatives from all collaborating
institutions, MEFMI and Development Finance International (DFI). The main
objective of the training was to orient the researchers on the questionnaire to
help them understand foreign private capital (FPC) concepts, learn fieldwork
techniques and strategize on how to attain high response rates.
2.3.2 Sensitisation and Awareness Campaign
An awareness campaign was conducted before the launch of the survey through
the print media. The main objective of the campaign was to make the public,
particularly the respondents, aware of the exercise, its usefulness to the
economy and requested for their cooperation. It is expected that respondents will
be provided with copies of the final report during the administration of the next
cycle to be conducted during 2011. This will be done as one of the feedback
mechanisms.
2.4 Technical Assistance
The country received technical assistance from MEFMI in the form of a mission.
The mission, conducted at the NSO offices in Lilongwe, involved technical staff
from the NSO and the RBM. The technical staff are those that are involved in
data input, Information Technology (IT) management, Balance of Payments
(BOP) and National Accounts (NA) compilation. During the mission, discussions
were held regarding the errors that had been observed after data entry and those
resulting from the system. Recommendations were provided on how best to
address them. The mission was also involved in data coverage, checking and
verification with details provided in the subsequent sections.
Page 27
10
2.5 Survey Methods and Techniques
2.5.1 Compilation of Enterprise Register
A comprehensive and reliable enterprise register is essential not only for
facilitating sampling but also saving time and resources wasted in visiting
companies that do not have foreign assets and/or liabilities. A reliable register
should involve a continuous update of new and rehabilitated or expanded
enterprises. It is also important to adjust for enterprises that have been closed,
liquidated, under receivership, merged and/or changed business names.
In the case of Malawi, the enterprise register is usually updated during survey
implementation in which case new companies are added to the initial list and
closed ones removed. Updating is also done for those enterprises that have
changed names, locations, line of business, mergers and/or acquisitions. There
is a need, however, to ensure that the register is updated on a continuous basis.
2.5.2 Scope and Coverage of the Survey
Malawi has, at no time since the introduction of these surveys, sampled
enterprises. Consequently, the survey targeted all enterprises known to have
foreign assets and/or liabilities across all sectors and regions. Questionnaires
were administered to a total of 149 enterprises most of which were located in the
southern region (75.2%) followed by the central (21.5%) and northern (3.4%)
regions. Classification of the sectors covered was based on the UN International
Standards for Industrial Classifications of all economic activities (ISIC rev.3).
2.5.3 Questionnaire Design
The questionnaire consisted of four main parts namely: general information about
the company, information on Malawi’s foreign liabilities, Malawi’s assets abroad
Page 28
11
and investor perceptions. Slight changes were made from the previous
questionnaire particularly on equity to provide more details on its components at
book value like paid-up share capital, capital and revaluation reserves, and
retained earnings. Another notable change was made on the layout of tables not
only to make the questionnaire user-friendly but also to reduce its bulkiness.
2.5.4 Survey Implementation
This survey was a fourth cycle and collected data for 2007 and 2008. It was
implemented in two phases beginning with the central and northern regions
followed by the southern region. A total of 17 researchers were involved in the
survey. These were divided into 4 teams, each comprising a supervisor and
research assistants. The role of a supervisor was to ensure that questionnaires
were properly administered to respondents but also do other logistical issues.
2.5.5 Data Collection
The data collection exercise involved staff from all the collaborating institutions.
Administration of the questionnaires was conducted between 8th June and 28th
August 2009 and involved distribution of questionnaires (8th June - 3rd July 2009),
first follow-up (13th – 31st July) and second follow-up (24th – 28th August) visits.
The follow-up visits were undertaken to complete and collect questionnaires.
Face-to-face interviews were used on administration of the questionnaires.
These facilitated understanding on the part of respondents about the objectives
of the survey as well as how the questionnaires were supposed to be completed.
2.5.6 Response Rates
The summary of the enterprises that were surveyed and their response rates is
provided in Table 2. The table reveals that questionnaires were administered to
Page 29
12
149 enterprises. Of these 136 responded, representing a response rate of 91.3
percent. This is an encouraging performance compared to the previous survey
which had a response rate of 63.5 percent. This improvement is attributable to a
more simplified questionnaire coupled with increased cooperation from
respondents mainly due to more understanding of the importance of the survey.
Table 2: Response Rates for the 2009 Survey Cycle by Region
Region
Questionnaires administered
Questionnaires returned
Response rate (%)
North 5 3 60.0
Central 32 26 81.3
South 112 107 95.5
Total 149 136 91.3
2.5.7 Data Coverage, Checking and Verification
Data checking and verification involved reviewing all questionnaires. Those
submitted with financial statements that had been captured in the system were
checked to establish whether all foreign assets and liabilities had been correctly
reported. In this exercise, a total of 67 returned questionnaires which had been
submitted with financial statements out of a total of 136 returned were reviewed.
Checks on data coverage involved studying the financial statements to identify
gaps in the responses provided to the questionnaires on FDI liabilities (equity
and debt) and assets. With respect to equity, omissions of some components
such as share premium and other reserves that were observed were rectified.
A number of enterprises did not report related party transactions and the
corresponding amounts receivable and payable where such related parties were
non-residents. These omissions were rectified and contributed towards a
substantial increase in the stocks and flows of equity and other capital
components of FDI.
Coverage checks were also made on account of enterprises whose financial
statements provided both group and company accounts. Changes were made to
Page 30
13
questionnaires whose responses were provided for group as opposed to the
company. For such enterprises, responses were replaced with information based
on enterprise accounts to ensure accurate reflection of industrial sectors as
group accounts in most of the cases included various enterprises engaged in
different industrial sectors.
Data checking and verification was conducted to ensure accuracy of the
responses provided as well as consistency among the different related parts of
the survey form. Some of the company financial statements had figures in
thousands and millions of kwacha and checks were made to ensure that the
survey responses reflected the correct units. Checks were also made on financial
statements reported in dollars to ensure that figures recorded on the
questionnaire in Malawi Kwacha had been converted using appropriate end of
period exchange rates for stocks and period average exchange rates for flows.
On consistency, responses were checked to ensure that data reported on
accumulated retained earning under stock of FDI equity were reconcilable with
data reported in the table on profits, dividends and retained earnings for the year.
In addition, many of the responses did not accurately classify changes in
reserves on account of volume adjustments and revaluations as other changes
but rather as transactions. Responses on the questionnaire were also revised to
ensure correct classification of reserves and revaluations. Consistency checks
between flows and stocks for debt liabilities and assets were also conducted.
2.5.8 Generation of Time Series Data
The process of generating data time series missing for flows (2005, 2006 and
2007) and stocks (2005 and 2006) was based on the estimates from the 2005
survey which covered data for the years 2001 to 2004 and the 2009 survey which
covered data for the years 2007 and 2008. The net flows were obtained by taking
the difference between the stocks of FDI, foreign portfolio investment and other
Page 31
14
foreign investment for 2007 and 2004 classified by sectors. A detailed account of
the methodology that was used in generating the time series is summarized in
Box 1.
It may be noted, however, that better results could be obtained if individual
components of FDI such as reinvested earnings, reserves, paid-up share capital
and intercompany debt were used as this would have taken care of any coverage
Box 1: Estimation of the missing data (flows for 2005 – 2007 and stocks for 2005 – 2006)
Let the stock of FDI for all enterprises within sector 1 at end 2007 and 2004 be denoted
by F2007 and by F2004 respectively. Also let the output of sector 1 at current market prices
for 2005, 2006 and 2007 be denoted by Y2005, Y2006 and Y2007 respectively.
Change in FDI stock for sector 1 denoted by DF = F2007 – F2004
Sum of sector output for 2005, 2006 and 2007 SY = Y2005 + Y2006 + Y2007
(DF)/(SY) = (F2007 – F2004)/(Y2005 + Y2006 +Y2007)
Assuming that the annual share of change in FDI stocks to output at sector level is about
the same for the years 2005, 2006 and 2007, then
DF/SY ≈ F2007 – F2006)/(Y2007) ≈ (F2006 – F2005)/Y2006 ≈ (F2005-F2004)/Y2005
Subsequently, if information for Y2007, Y2006 and Y2005 is available then the respective flows
can be obtained as
(F2007 – F2006) = DF/SY * Y2007
(F2006 – F2005) = DF/SY * Y2006 and
(F2005 - F2004) = DF/SY * Y2005
Similarly, since F2004 and F2007 values are available then stocks for 2005 and 2006 can be
obtained as
F2005 = DF/SY * Y2005 + F2004 or
F2005 = F2006 – DF/SY * Y2006
F2006 = DF/SY * Y2006 + F2005 or
F2006 = F2007 – DF/SY * Y2007
Using this approach, the estimates for the 2005 and 2006 stocks and 2005, 2006 and
2007 net flows were derived.
Page 32
15
revisions to the questionnaire for the 2009 survey. Company by company
estimation was difficult not only because it is a tedious exercise but also because
it was not possible to retrieve individual company information from the previous
surveys for reconciliation with the current one due to the coding system that was
used then.
It was deemed not necessary to gross up data for non response as well as for
non surveyed companies on account of mainly two reasons. Firstly, the survey
covered all enterprises known to be having foreign assets and liabilities.
Secondly, given the high response rate obtained, the enterprises that did not
respond form a negligible share of the value of total foreign assets and liabilities.
2.5.9 Adherence to International Standards
Compilation of the FPC statistics was in line with the acceptable international
best practices. Classification of sectors was based on ISIC revision 3. However,
in some cases, minor modifications were made to meet country specific needs.
Data compilation procedures as captured in the questionnaire followed
recommendations contained in the International Monetary Fund (IMF) Balance of
Payments Manual, 5th Edition (BPM5).
2.5.10 Timeliness
The IMF’s General Data Dissemination System (GDDS) requires that data be
disseminated between six to nine months after fieldwork. This standard was
however not met partly because of system/software challenges. However, with
MEFMI Private Capital Monitoring System (PCMS) now in place, future reports
are expected to be disseminated in a timely manner.
Page 33
16
CHAPTER 3
Analysis of Foreign Private Capital
3.1 Stock of Foreign Liabilities
The stock of foreign liabilities constitutes FDI, Portfolio Investment (PI) and Other
Investment (OI). Malawi registered persistent increase in the stock of foreign
liabilities since 2003. The largest share of foreign liabilities has been in form of
FDI which is long-term in nature. This suggests investors’ confidence in the
economy.
The robust performance was recorded in 2008 with total stocks of liabilities
doubling to US$2,887.0 million compared to US$1,319.5 million in 2007 (Table
3). This implies that the economy was not affected by the first round of the Global
Financial Crisis.
Table 3: Stock of Foreign Liabilities (US$ Millions)
2001 2002 2003 2004 2005 2006 2007 2008 Share 2008
FDI 419.2 390.4 409.7 562.2 767.2 1017.3 1315.4 2583.5 89.5
FPI 14.0 12.4 12.4 12.0 9.8 6.8 2.9 4.6 0.2
OI 47.3 24.7 19.3 31.2 23.3 13.4 1.2 298.9 10.4
Total 480.5 427.5 441.4 605.4 800.4 1037.4 1319.5 2887.0 100.0
% Change -11.0 3.2 37.2 32.2 29.6 27.2 118.8
Source: 2003, 2005 and 2009 Surveys
3.2 Composition of Stock of Foreign Liabilities 2007-2008
As at end 2008, the largest proportion of foreign liabilities in Malawi was in form
of FDI accounting for 89.5 percent. The remaining components which are other
investment and portfolio investment accounted for 10.4 percent and 0.2 percent,
respectively (Table3).
Page 34
17
Table 4: Stock of Foreign Liabilities (US$ Million)
Composition 2007 2008
1. Foreign Direct Investment (FDI) 1,315.4 2,583.5
A. Foreign Direct Equity Investment (FDEI) 1,314.8 2,278.1
Foreign Direct Equity Capital 1,233.8 2,001.3
Accumulated Reinvested Earnings 81.1 276.8
B. Foreign Direct Non-Equity Investment 0.6 305.4
Long-Term - 12.2
Short-term 0.6 293.2
2. Foreign Portfolio Investment 2.9 4.6
Foreign Portfolio Equity Investment (FPEI) 2.9 1.4
Bonds 0.04 3.2
3. Other Non-Equity Investment (Non-Affiliates) 1.2 298.9
Long-term (Non-Affiliates) 0.4 82.8
Short-term (Non-Affiliates) 0.8 216.1
Total Stock of Foreign Liabilities/Investment 1,319.5 2,887.0
3.3 Foreign Liabilities by Sector
In terms of distribution of total foreign liabilities by sector, manufacturing
accounted for the largest share over the two years with an average of 47.9
percent of the total. The sector registered US$776.9 million and US$1,065.5
million for 2007 and 2008, respectively. About 90.0 percent of the liabilities were
in form of equity investments. Construction and agriculture followed with
averages of 13.5 percent and 12.9 percent, respectively. Wholesale and retail
trade sector received about 10.1 percent of the total stock of liabilities worth
US$407.3 million in 2008. About 40.0 percent of the investment in this sector was
financed through non-affiliated loans. Financial and insurance, and information
and communication sectors, on average, accounted for 10.2 percent and 6.1
percent, respectively while the remaining sectors accounted for less than 1
percent each (Table 5).
Page 35
18
Table 5: Foreign Liabilities by Sector in US$ Million
Stock Share Stock Share AverageManufacturing 776.9 58.9 1,065.5 36.9 47.9 Construction 108.9 8.3 540.2 18.7 13.5 Wholesale and retail trade 80.1 6.1 407.3 14.1 10.1 Agriculture 180.9 13.7 351.3 12.2 12.9 Financial and insurance activities 151.2 11.5 256.9 8.9 10.2 Information and Communication 66.3 5.0 205.0 7.1 6.1 Transportation - - 32.7 1.1 0.6 Accomodation and food service activities 4.3 0.3 15.2 0.5 0.4 Activities of households as employees 10.3 0.8 12.1 0.4 0.6 Other 0.7 0.1 0.9 0.0 0.0 Grand Total 1,319.5 100.0 2,887.0 100.0 100.0
Sectors2007 2008
3.4 Foreign Liabilities by Source Country
On the basis of regional economic blocks, the survey findings show that
Southern Africa Development Community (SADC) was the leading source of
foreign private investments in Malawi with 60.6 percent (US$893.0 million) of the
total stock in 2007 followed by the Organization for Economic Co-operation and
Development (OECD) with 23.5 percent (US$310.5). Although SADC maintained
the lead in 2008, its share fell by about 16.0 percent to US$1,287.5 million while
that of OECD improved by 19.6 percent to US$1,245.3 million.
On a country basis, the largest stock of these investments were Mauritius, South
Africa, United Kingdom and Portugal, each on average accounting for 35.2
percent, 18.0 percent, 16.8 percent and 10.0 percent, respectively during the
period under review. All of these accounted for about 80.0 percent of total
investments. Within the MEFMI region, Kenya, Zimbabwe and Tanzania also
made some considerable investment in the country. The total stock of private
investments from the three countries increased from US$65.3 million (5.0
percent) recorded in 2007 to US$133.7 million (4.6 percent) in 2008 (Figure1).
Page 36
19
Figure 1: Foreign Liabilities by Country (US$ Million), 2008
- 100.0 200.0 300.0 400.0 500.0 600.0 700.0
Mauritius South Africa
United Kingdom Portugal
Kuwait Switzerland
FranceKenya
BahamasTanzania
ZimbabweOther
649.3 552.8
499.9 289.5
171.2 145.4
114.5 53.2
44.5 43.7
36.8 286.1
3.5 Foreign Liabilities by Region
The southern region continued to be the largest recipient of foreign investment
stocks during 2007 and 2008, with an average of 82.2 percent of the total stock
(Figure2). This could largely be due to “the agglomeration effect” and availability
of infrastructure and services. The central and northern regions accounted for
15.5 percent and 2.0 percent, respectively.
Page 37
20
Figure 2: Foreign Liabilities by Region (US$ Million)
-
500.0
1,000.0
1,500.0
2,000.0
2,500.0
Central Region Nothern Region Southern Region
14.3 48.9
1,256.3
790.9
84.2
2,011.8
2007 2008
3.6 Foreign Direct Investment
3.6.1 FDI Stock by Type
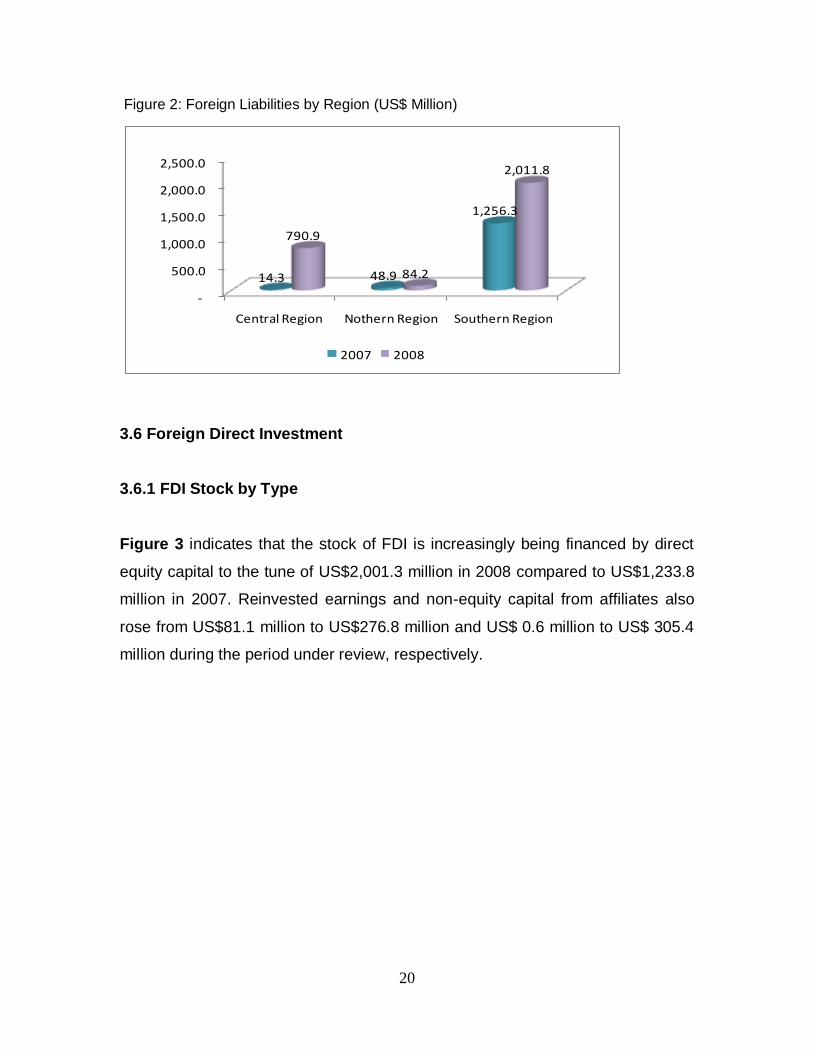
Figure 3 indicates that the stock of FDI is increasingly being financed by direct
equity capital to the tune of US$2,001.3 million in 2008 compared to US$1,233.8
million in 2007. Reinvested earnings and non-equity capital from affiliates also
rose from US$81.1 million to US$276.8 million and US$ 0.6 million to US$ 305.4
million during the period under review, respectively.
Page 38
21
Figure 3: FDI Stock by Mode of Financing (US$ Million)
3.6.2 FDI Stock by Source Country and Region
The sources of FDI in Malawi are highly concentrated from a few countries. In
2007 for instance, three countries namely Mauritius (45.5 percent), South Africa
(19.5 percent) and United Kingdom (16.9 percent) accounted for about 81.9
percent of the total stock of FDI. Table 6 shows that in 2008 the three countries
continued to be the dominant source of FDI although their aggregate share fell to
58.4 percent. In the same year, France and the Netherlands were overtaken by
Portugal and Kuwait in the list of top five source countries of FDI respectively. In
terms of inflows, about 77.4 percent of the total FDI inflows recorded in 2008
Page 39
22
came from four countries namely Switzerland (42.0 percent), South Africa (19.1
percent), Mauritius (8.3 percent) and Kuwait (8.0 percent). This kind of
concentration is however not healthy as it exposes the country into risks should
any of these countries face economic crisis. It is therefore necessary to diversify
promotional efforts to more countries in order to minimize such risks.
Table 6: Stock of FDI by Top Five Source Countries (US$ Millions)
2007 2008
Country Value Percentage Country Value Percentage
1 Mauritius 598.7 45.5 Mauritius 644.8 25.0
2 South Africa 256.9 19.5 United Kingdom 495.5 19.2
3 United Kingdom 221.6 16.9 South Africa 369.4 14.3
4 France 80.3 6.1 Portugal 289.6 11.2
5 Netherlands 58.1 4.4 Kuwait 171.3 6.6
Regional distribution of the stock of FDI shows high concentration in the
Southern region which recorded a total stock of US$1,252.2 million in 2007 and
US$1,755.2 million in 2008 representing 95.2 percent and 67.9 percent,
respectively. In 2008, there was a significant improvement in the Central region
as its share increased by about 28.0 percent of the total stock of FDI to
US$744.1 million compared to US$14.27 recorded in 2007 (Figure4). In the
same period, the region attracted highest inflows of FDI worth US$186.72 million
which is equivalent to 56.4 percent of the total FDI inflows. The Northern region
attracted the lowest share of both stocks and flows of FDI during the period
under review. High concentration of FDI in the Southern region is largely
attributable to resource endowments as well as better developed infrastructure.
Page 40
23
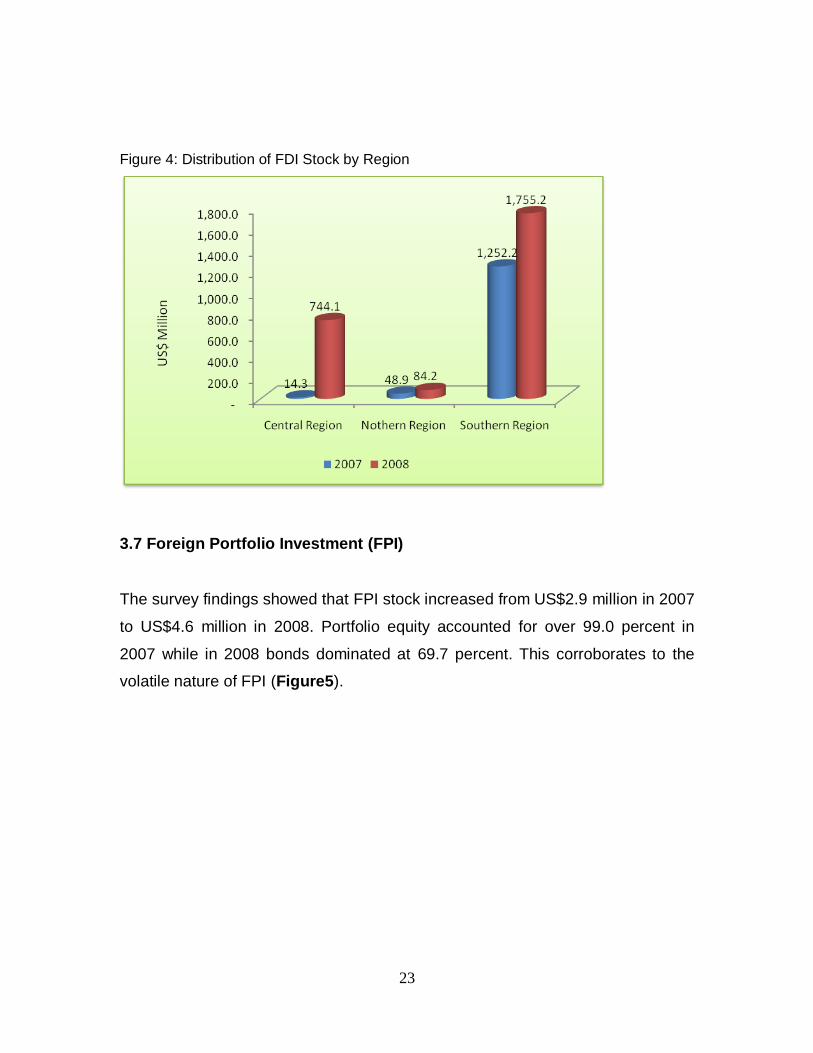
Figure 4: Distribution of FDI Stock by Region
3.7 Foreign Portfolio Investment (FPI)
The survey findings showed that FPI stock increased from US$2.9 million in 2007
to US$4.6 million in 2008. Portfolio equity accounted for over 99.0 percent in
2007 while in 2008 bonds dominated at 69.7 percent. This corroborates to the
volatile nature of FPI (Figure5).
Page 41
24
Figure 5: Stock of Foreign Portfolio Investment (US$ Millions)
3.7.1 FPI by Source Country and Region
It is indicated in Table 7 that more than 93.0 percent of the total stock of FPI
liabilities were due to five countries in 2007 and 2008. The United Kingdom,
which also featured in the list of top five source countries of FDI, accounted for
more than 60.0 percent of the total stock of FPI.
Table 7: Stock of FPI by Top Five Source Countries (US$ Millions)
2007 2008
Country Value Percentage Country Value Percentage
1 United Kingdom 2.0 67.1 Switzerland 2.8 60.9
2 Ghana 0.5 15.4 Ghana 0.7 14.2
3 Kenya 0.2 5.5 Zimbabwe 0.5 10.5
4 Switzerland 0.1 3.2 Mauritius 0.2 5.0
5 Tanzania 0.1 2.6 Tanzania 0.1 2.3
Page 42
25
The largest share of FPI inflows however, originated from South Africa (US$0.4
million) and India (US$0.1 million) in 2008. In terms of regional distribution, the
Southern region accounted for about 99.0 percent of the total for both stocks and
flows of FPI in 2007 and 2008.
3.8 Other Investment
3.8.1 Stock of Other Investment
The stock of other investment constitutes short and long term borrowing from non
affiliates. During the period under review, the stock of other investment posted a
remarkable increase from US$1.2 million in 2007 to US$298.9 million in 2008,
mainly dominated by trade credits (Figure6). This pattern of other investment is
partly due to scarcity of foreign currency amid increasing investment activities.
Figure 6: Stock of Other Investment during 2007-2008 (US$ Millions)
Page 43
26
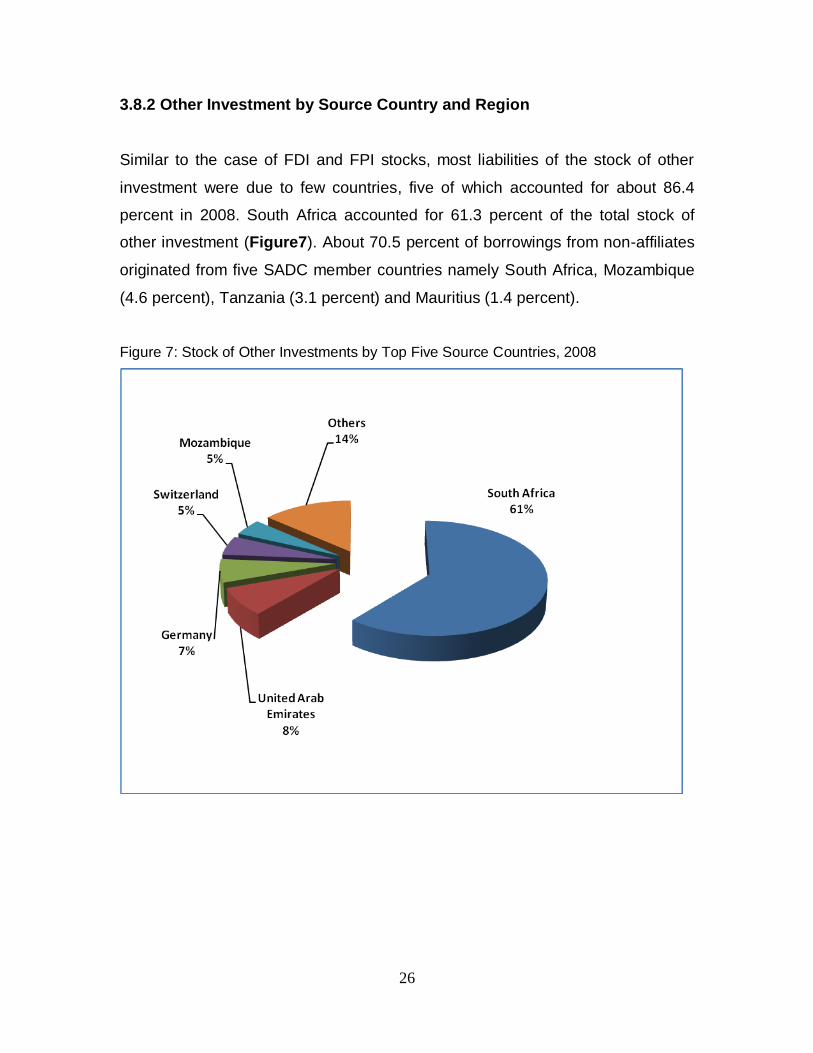
3.8.2 Other Investment by Source Country and Region
Similar to the case of FDI and FPI stocks, most liabilities of the stock of other
investment were due to few countries, five of which accounted for about 86.4
percent in 2008. South Africa accounted for 61.3 percent of the total stock of
other investment (Figure7). About 70.5 percent of borrowings from non-affiliates
originated from five SADC member countries namely South Africa, Mozambique
(4.6 percent), Tanzania (3.1 percent) and Mauritius (1.4 percent).
Figure 7: Stock of Other Investments by Top Five Source Countries, 2008
Page 44
27
3.9 Flows of Foreign Direct Investment
The net flows of FDI during 2008 amounted to US$8.7 million mainly driven by
equity liabilities. During the same period, the non-equity liabilities posted a
negative net inflow of US$95.7 million on account of short-terms loans (Figure8).
Figure 8: Net Liability Flows of FDI, 2008
(100.00)
(80.00)
(60.00)
(40.00)
(20.00)
-
20.00
40.00
60.00
80.00
100.00
120.00
140.00
Foreign Direct Equity Foreign Direct Non-Equity
Foreign Direct Investment
104.36
(95.68)8.68
US$
Mill
ion
s
3.9.1 Flows of FDI by Sector
A sectoral analysis shows that FDI inflows in Malawi in 2008 were concentrated
in the construction, information and communication, and wholesale and retail
trade sectors. As shown in Figure9, the three sectors attracted net FDI inflows
worth US$56.8 million in 2008. Other sectors that received positive net inflows
were financial and insurance, activities of households and accommodation. The
remaining sectors registered net outflows and insignificant net inflows.
Page 45
28
Figure 9: Flows of FDI by Sector (US$ Million), 2007 – 2008
-30.2
20.1
5.3
-20.4
20.1
0.6
0.1
-3.6
0.0
16.6
0.0
(40.0) (30.0) (20.0) (10.0) - 10.0 20.0 30.0
Manufacturing
Construction
Financial and insurance activities
Agriculture, forestry and fishing
Information and Communication
Activities of households as employees
Accomodation and food service activities
Transport and storage
Real estate activities
Wholesale and retail trade
Administrative and support service activities
3.10 Private Sector External Debt (PSED)
The total stock of PSED as at end 2008 stood at US$607.5 million, having
increased from US$1.8 million in 2007, mainly driven by short-term loans in form
of trade/suppliers credits (Table 8).
Page 46
29
Table 8: Private Sector External Debt (US$ Million), 2007-2008
2007 2008
Affiliates 0.6 305.4
Long-term loans - 12.2
Short-term loans 0.6 293.2
- -
Non-Affiliates 1.2 298.9
Long-term loans 0.4 82.8
Short-term loans 0.8 216.1
- -
Other Claims (Bonds) 0.0 3.2
Total PSED 1.8 607.5
3.11 Profitability, Retained Earnings and Dividends Paid
3.11.1 Profitability
Overall net profits earned during 2008 amounted to US$163.0 million. The
manufacturing sector accounted for 37.0 percent of total profits earned, followed
by information and communication, and financial and insurance sectors which
constituted 16.2 percent and 15.9 percent, respectively. Transportation and
storage posted a net loss of US$ 3.3 million (Figure10).
On the whole, return on equity (ROE) for 2008 was 30.5 percent. Information and
communication, and financial and insurance services sectors registered the
highest return on equity of 55.3 percent and 44.8 percent, respectively.
Page 47
30
Figure10: Return on Equity by Sector in 2008 (Percentage)
3.11.2 Dividends Paid
The survey revealed that total dividends paid during 2008 amounted to US$43.5
million. Manufacturing, wholesale and retail trade, and agriculture accounted for
64.8 percent, 13.3 percent and 10.5 percent, respectively (Figure11). Financial
and insurance, and information and communication sectors paid least dividends
although they registered highest returns on equity. This suggests that most
profits generated by these sectors were reinvested.
Page 48
31
Figure11: Dividends Paid by Sector in 2008 (US$ Million)
3.12 Foreign Assets
Table 9 reveals that the total stock of Malawi’s foreign assets was US$0.24
million at end 2007, which increased substantially to US$28.9 million at end
2008. In 2007, most of the assets were in form of FDI which accounted for 54.2
percent followed by portfolio investment and other investment at 30.1 percent
and 15.6 percent, respectively. This composition changed dramatically in 2008
particularly for other investment which accounted for 49.6 percent. Net flows
amounting to US$26.4 million were recorded in 2008 and were largely
constituted by supplier credits to affiliated enterprises in the rest of the world
accounting for about 95.0 percent. It is worth noting that the stocks of foreign
assets reported were much lower than what was reported under foreign liabilities.
Page 49
32
Table 9: Stock of Foreign Assets (US$ Millions), 2007 – 2008
Direct Investment 0.13 (19.49) 14.19
Foreign Direct Equity Assets (FDEA) at MV - 2.48 5.21
Other Capital from Affiliates 0.13 (21.97) 8.98
Long-Term - 3.79 10.95
Short-term 0.13 (25.76) (1.97)
Portfolio Investment 0.07 (0.10) 0.36
Other Investment 0.04 (6.79) 14.33
Loans 0.02 0.05 7.22
Trade Credits 0.02 (6.84) 7.10
Total Foreign Assets 0.24 (26.39) 28.87
Net FlowsComponents Stock 2007 Stock 2008
Malawi’s total stock of foreign assets were concentrated only in the
manufacturing and professional, scientific and technical services in 2007
whereas in 2008, it was predominated by construction and wholesale and retail
trade services representing almost 84.0 percent. The major investment
destinations of Malawian enterprises were South Africa and Tanzania that
accounted for about 50.0 percent of the total stock of Malawi’s foreign assets in
2008.
Page 50
33
CHAPTER 4
Investor Perceptions
4.1 Introduction
Investor Perceptions (IPs) aim to deliver an independent insight into how
investors view the country’s business operating environment and how it affects
their business operations. Analysis of IPs essentially measure how satisfied
existing investors are with the country’s investment offerings and service
delivery. The outcomes emanating from the analysis guide Government and
policy makers in identifying areas of concern hampering business operations in
the country, and therefore identify areas and means of intervention to improve
the business operating environment.
4.2 Main Factors Covered and Rating Structure of Responses
The survey covered thirteen main categories as follows:
i. Initial investment factors;
ii. Global economic and financial
crisis;
iii. Effects of the global economic and
financial crisis;
iv. Business outlook during 2009 –
2011 and onwards;
v. Future likely direction of
investment;
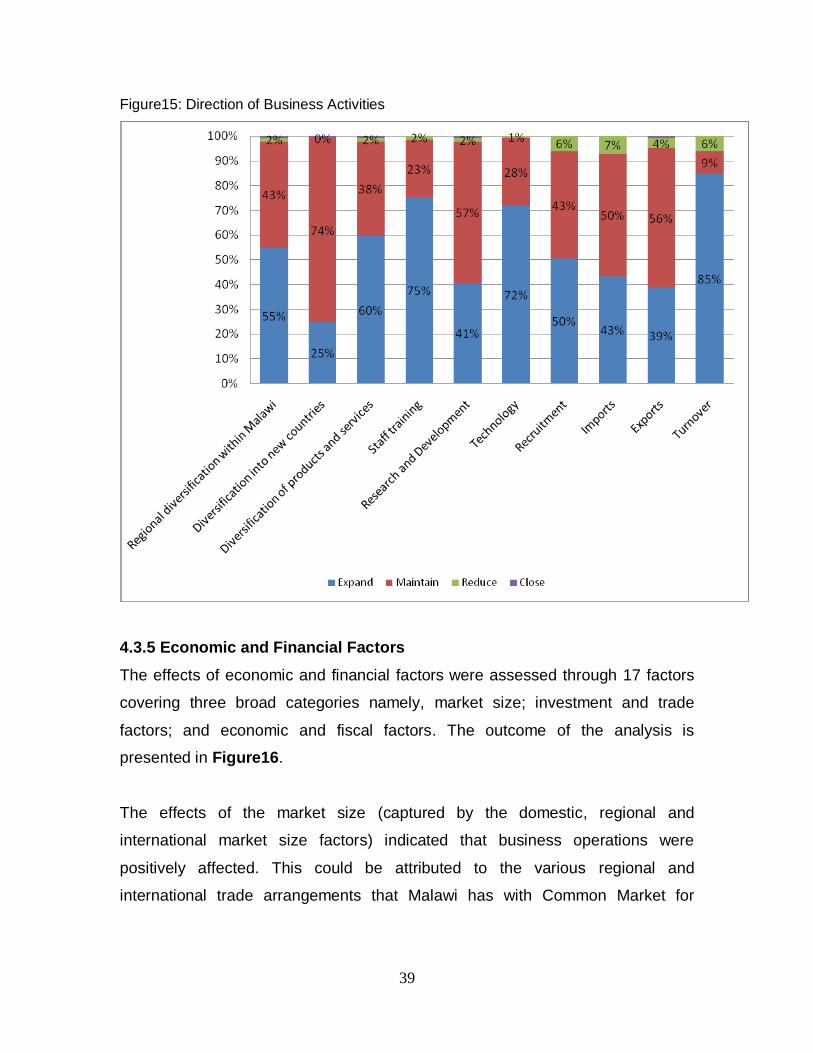
vi. Economic and financial factors;
vii. Political and governance factors;
viii. Operations of government agencies;
ix. Infrastructure and service factors;
x. Labour factors;
xi. Environmental and health factors;
xii. Information sources; and
xiii. Corporate social responsibility.
In order to identify initial investment factors and the effects of the global
economic and financial crisis, investors were requested to select from among a
number of factors that relate to each theme.
Page 51
34
To determine the business outlook during 2009 – 2011 and onwards,
respondents were expected to indicate their business outlook on a scale of 1 to 5
as presented in Table 10.
Table 10: Scale of Business Outlook Assessment
Rank 1 2 3 4 5
Definition Very
favourable
Slightly
favourable
Neutral Slightly
unfavourable
Very
unfavourable
To determine the future likely direction of investment, investors were requested
to rank against each factor from a scale of 1 to 4 as presented in Table 11.
Table 11: Scale of Assessment of Future Likely Direction of Investment
Rank 1 2 3 4
Definition Expand Maintain
(No Change)
Reduce Close
In order to identify the effect of economic and financial factors, political and
governance factors, operations of government agencies, infrastructure and
service factors, labour factors, and environmental and health factors,
respondents were requested to rank the various factors under each theme from a
scale of 1 to 5 as presented in Table 12.
Table 12: Scale of Assessment of Several Factors Covered
Rank 1 2 3 4 5
Definition Very
positive
Quite
positive
No effect Quite
negative
Very negative
To determine the importance of various sources of information, respondents
were required to rate the various factors under the theme from a scale of 1 to 4
as presented in Table 13.
Page 52
35
Table 13: Scale of Assessment of the Importance of Information Sources
Rank 1 2 3 4
Definition Very Useful Quite Useful Not Useful Not Consulted
Results for the analysis for the thirteen areas of study are presented in the
subsequent sections.
4.3 Detailed Findings
4.3.1 Initial Investment Factors
The questionnaire presented to the investors twelve factors that were expected
to have influenced their initial decision to invest in Malawi. Figure 12 provides a
summary of the outcome.
The majority of companies (45.0 – 60.0 percent) indicated the domestic
environment as a key determining factor that initially led them to invest in Malawi.
In particular, the stability of the domestic political and economic environment as
well as the domestic market size were the main factors. The Regional
environment, investment incentives and policy were also rated as determining
factors by a relatively large proportion of respondents.
Page 53
36
Figure12: Initial Investment Factors
4.3.2 The Global Economic and Financial Crisis
The negative effects of the Global Economic and Financial Crisis (GFC) that
started affecting the Global Economy from 2007 also affected the domestic
economy. This is evident as 75.0 percent of respondents indicated to have been
affected by the crisis. The specific effects of GFC were assessed against six
factors and the outcome is presented in Figure 13 which shows percentages of
respondents affected.
Reduced income, less access to trade credit, and reduced domestic demand for
goods and services were rated as the main factors through which the GFC
affected business operations. About 85.0 percent of respondents indicated
reduced income as the effect of the crisis, less access to trade credit (72.0
Page 54
37
percent), reduced domestic demand for goods and services (71.0 percent),
reduced international demand for goods and services (62.0 percent) and less
access to international credit (56.0 percent).
Figure13: Effects of the Global Economic and Financial Crisis
4.3.3 Business Outlook during 2009 – 2011 and Onwards
The survey also assessed the outlook of business operations during 2009 – 2011
and onwards. About 71.0 percent of respondents rated the business outlook
during the period 2009 – 2010 as generally favourable. Only 14.0 percent of
respondents rated the 2009 – 2010 environment as unfavourable. Respondents
anticipated improved business outlook for 2011 and onwards with 77.0 percent
indicating a favourable rating and 5.0 percent unfavourable (Figure14).
Page 55
38
Figure14: Business Outlook during 2009 - 2011 and onwards
4.3.4 Future Likely Direction of Investment
Respondents were quite optimistic about the future and expressed strong
business confidence with intentions to expand operations in almost all aspects of
their operations in the next 3 – 4 years. As shown in Figure15, respondents
expressed intentions to expand their investments in turnover (85.0 percent), staff
training (75.0 percent), technology (72.0 percent) and diversification of products
and services (60.0 percent). Such business confidence is also reflected in the
results of the previous survey where investors also expressed similar plans.
Page 56
39
Figure15: Direction of Business Activities
4.3.5 Economic and Financial Factors
The effects of economic and financial factors were assessed through 17 factors
covering three broad categories namely, market size; investment and trade
factors; and economic and fiscal factors. The outcome of the analysis is
presented in Figure16.
The effects of the market size (captured by the domestic, regional and
international market size factors) indicated that business operations were
positively affected. This could be attributed to the various regional and
international trade arrangements that Malawi has with Common Market for
Page 57
40
Eastern and Southern Africa (COMESA), SADC and other countries in Europe,
Asia, and the Americas.
Figure16: Economic and Financial Factors
In terms of investment and trade factors (assessed by considering investment
policy and incentives, trade policy, informal trade and import competition), it was
observed that business operations were negatively affected by informal trade and
import competition. There is therefore need to strengthen our borders to combat
illegal cross-border trade and improve the quality of local products to make them
competitive with imported products. Investment policy and incentives, and the
trade policy were also impacting positively on business operations in the country.
Page 58
41
Effects of economic and fiscal factors presented a general negative picture with
the availability of foreign exchange having a very strong negative effect on
business operations. The fluctuation of the exchange rate, exchange controls
and the corporate tax burden also had negative effects. While interest rates,
inflation, and availability of international credit were seen not to have a significant
effect on business operations, there is need to effect policies in the banking
system in order to increase availability of capital to businesses. However,
government spending and the fiscal policy were seen to have a positive effect on
business operations.
4.3.6 Political and Governance Factors
The effects of political and governance factors are presented in Figure17. The
analysis revealed that the Regional and domestic political environment had a
positive effect on business operations. This is consistent with findings in section
4.3.1 under initial investment decisions. On the other hand, the level of corruption
and bureaucracy/regulatory framework/state intervention were seen to have a
negative effect on business operations. The effects of land law administration
and level of security/crime were however insignificant.
Page 59
42
Figure17: Political and Governance Factors
4.3.7 Operations of Government Agencies
The majority of respondents reported not to have had any effect with regard to
the operations of the agencies on their business operations. Top on list is Trade
and Investment Representation abroad, the Ministry of Foreign Affairs and
Malawi Export Promotion Council (MEPC) (Figure18). A few respondents
indicated to have been positively affected by the Malawi Revenue Authority
(MRA), Ministry of Finance, Ministry of Industry and Trade the Reserve Bank of
Malawi.
Page 60
43
Figure18: Operations of Agencies
As indicated in Figure19, although all the agencies were rated to have some
positive effect on business operations, the effect was quite dismal. The Ministry
of Finance, Reserve Bank of Malawi, Ministry of Industry and Trade, and Malawi
Investment Promotion Agency had a relatively high level of positive effect on
business operations while Trade and Investment representation overseas, the
legal system, Ministry of Foreign Affairs, and Malawi Export Promotion Council
scored a relatively low level of positive effect.
Page 61
44
Figure19: Operations of Agencies
4.3.8 Infrastructure and Service Factors
Assessment of the effect of infrastructure and service factors was conducted
from an efficiency and cost perspective. The factors were categories in three
main groups namely utilities, transport and services. Most of the factors were
rated as having a negative effect on business operations (Figure20).
With respect to cost, telecommunications was rated as having a relatively high
negative effect on business operations. This was followed by road transport, air
transport, electricity supply, banking and insurance, and water supply. The
negative effect of the cost was however relatively lower in railway transport,
water transport and postal services. The negative effect of the cost of
Page 62
45
telecommunications, banking services and transport were also evident in the
previous survey signifiying that there has not been an improvement in the costing
of the factors in the economy.
Figure20: Infrastructure and Service Factors
The efficiency of electricity and water supply highly negatively affected business
operations as well as railway transport, telecommunications, air and road
transport. While the negative effects of the efficiency of water transport and
postal service were dismal, banking and insurance services was seen to have a
positive effect.
Page 63
46
4.3.9 Labour Factors
The labour factors were evaluated in terms of availability, turnover, cost and
productivity (Figure21).
Figure21: Labour Factors
Investors revealed a positive effect on business operations with respect to
availability of labour in all categories (i.e. management, technical, semi-skilled
Page 64
47
and casual). A similar positive effect was evident with respect to cost and
productivity. However, labour turnover, legislation and restrictions regarding
bringing in expatriates had a negative effect.
4.3.10 Environmental and Health Factors
Respondents identified HIV/AIDS and malaria as the most significant
environmental and health factors negatively affecting their business operations.
Other factors with significant negative effects on business operations include
tuberculosis, drought and floods. Environmental legislation and controls, and
availability of health care services however depict some positive though dismal
effect on business operations (Figure22).
Page 65
48
Figure22: Environmental and Health Factors
4.3.11 Information Sources
The usefulness of information sources available in the country to investors’
business operations is presented in Figure23. It is apparent from the figure that
investors relied mostly on internet, actions of competitors, business partners, and
the national media as key sources of information for investment decision making.
Reserve Bank of Malawi and National Statistical Office publications also featured
as key sources of information although to a lesser degree.
Page 66
49
Figure23: Information Sources
4.3.12 Corporate Social Responsibility (CSR)
The total amount spent as part of CSR in 2008 was US$14.6 million compared to
US$12.0 million in 2007. In terms of resource allocation, about 70.0 percent went
into health, education and infrastructure sectors (Table 14).
Page 67
50
Table 14: Expenditure on CSR by Sector
2007 2008
Total Resources (%) Total Resources (%)
Education 22 28
Health 20 19
Safety and Security 11 11
Other 13 9
Sports Development 6 6
Local Infrastructure (e.g. roads, water, electricity)
24 22
Environment (e.g. conservation / preservation
5 5
Arts and Culture 0 1
Page 68
51
CHAPTER 5
Conclusion and Policy Implications
Historically, high concentration of FDI has been in the Southern region compared
to the Central and Northern regions, largely attributable to resource endowments
as well as better developed infrastructure. This calls for government to formulate
deliberate policies to attract more investment in the other regions particularly the
northern region by designing special investment incentive packages.
Government should endeavour to continue streamlining the national budget
towards development expenditure so as to invest more in infrastructure
development in the underinvested regions.
Like in the previous surveys, findings from this survey showed that the source of
FDI in Malawi continues to be predominated by only three countries namely
Mauritius, South Africa and United Kingdom which collectively accounted for
about 81.9 percent and 58.4 percent of the total stock of FDI in 2007 and 2008,
respectively. This is not healthy for the economy as it is exposed to risks should
an economic crisis hit any of these countries. There is, therefore, a need for
government in collaboration with the investment promotion authority to intensify
its promotional efforts to more countries in a more diversified manner in order to
minimize such risks.
During the period under review, the stock of other investment posted a
remarkable increase from US$1.2 million in 2007 to US$298.9 million in 2008,
mainly dominated by trade credits. Domination of trade credits in loans from non-
affiliates is partly a result of scarcity of foreign currency amid increasing
investment activities. Given the nature of operations of foreign related
enterprises, availability of foreign currency is crucial for their daily operations and
its scarcity is likely to scare away investors from investing in Malawi. This calls
for immediate efforts to rectify the scarcity as foreign investments provide
Page 69
52
important stimuli for the growth of the domestic economy. Government should
create a conducive environment for private enterprises to diversify into sectors
that generate more foreign exchange.
The effects of market size indicated that business operations were positively
affected. This could be attributed to the various Regional and international trade
arrangements that Malawi sustains with Common Market for Eastern and
Southern Africa (COMESA), SADC and other countries in Europe, Asia, and the
Americas. In this regard, it is important that initiatives are put in place to ensure
that the country takes advantage of investment benefits accruing from Regional
integration arrangements.
In terms of investment and trade factors, it was observed that business
operations were negatively affected by informal trade and import competition.
There is, therefore, a need for strengthening the country’s borders to combat
illegal cross-border trade and improve the quality of local products to make them
competitive with imported products. Government efforts with respect to
investment policy and incentives and the trade policy were also seen to be
impacting positively on business operations in the country. This is a clear signal
of the need for Government to continue efforts aimed at improving the investment
and trade environment.
Effects of economic and fiscal factors presented a general negative outlook with
the availability of foreign exchange having a very strong negative effect on
business operations. The fluctuation of the exchange rate, exchange controls
and the corporate tax burden also had negative effects. While interest rates,
inflation, and availability of international credit were seen not to have a significant
effect on business operations, there is need to effect policies in the banking
system in order to increase availability of capital to businesses.
Page 70
53
Surveys on FPC in Malawi have shown that foreign private investment is much
more profitable than Malawi’s private investment into the rest of the world. This is
in tandem with low magnitudes of foreign private assets as this survey has
revealed. The results suggest that investment incentives may be more favourable
to foreign investors compared to domestic investors. There is, thus, a need for
government to promote domestic investment abroad alongside foreign
investment in Malawi.
In conclusion, the huge increase in PSED, most of which is short-term in nature,
calls for a need to carry out another survey for 2011 with a view to capture the
current position. These surveys on FPC have always provided a rich source of
information for the development and updating of not only balance of payments
statistics but also international investment position (IIP), which constitutes
Malawi’s stock composition of assets and liabilities.
Page 71
54
APPENDICES
APPENDIX A: Supplementary Tables
Total Foreign Liabilities (US$ Million)
Direct Investment 1,315.4 8.7 2,583.5
Foreign Direct Equity Capital at MV 1,233.8 - 2,001.3
Reinvested Earnings MV 81.1 104.4 276.8
Other Capital
Long-Term Inter-company loans - 5.2 12.2
Short-term Inter-company loans - 2.2 71.3
Supplier credits from related companies 0.6 (103.0) 222.0
Portfolio Investment 2.9 (0.8) 4.6
FPEI 2.9 - 1.4
Bonds 0.0 (0.8) 3.2
Other Investment 1.2 (51.5) 298.9
Loans 0.6 (34.5) 176.3
Long-term 0.4 (34.5) 82.8
Short-term 0.2 (0.0) 93.5
Trade Credits 0.6 (17.0) 122.6
Total Foreign Liability 1,319.5 (43.7) 2,887.0
ComponentsStock 2007 Stock 2008Net Flows
Total Foreign Liabilities by Sector (US$ Million)
Manufacturing 776.9 (30.7) 1,065.5
Construction 108.9 20.8 540.2
Wholesale and retail trade 80.1 (4.5) 407.3
Agriculture 180.9 (21.0) 351.3
Financial and Insurance 151.2 3.2 256.9
Information and Communication 66.3 (10.1) 205.0
Transportation (60.1) (3.9) 32.7
Accommodation 4.3 1.9 15.2
Activities of Households 10.3 0.6 12.1
Other sectors 0.7 (0.0) 0.9
Grand Total 1,319.5 (43.7) 2,887.0
SectorsStock 2007 Stock 2008Net Flows
Page 72
55
Total Foreign Liabilities by Country (US$ Million)
Mauritius 598.7 28.0 649.3
South Africa 258.0 (59.1) 552.8
United Kingdom 223.6 (52.5) 499.9
Portugal 21.0 14.8 289.5
Kuwait 54.8 20.3 171.2
Switzerland (173.2) (29.9) 145.4
France 80.3 3.3 114.5
Kenya 24.0 8.5 53.2
Bahamas 13.6 5.0 44.5
Tanzania 14.9 3.2 43.7
Netherlands 58.1 (1.8) 42.5
Italy and Vatican City 40.9 0.1 41.0
USA 28.8 6.8 40.1
Zimbabwe 26.4 4.0 36.8
Denmark 19.6 3.3 32.7
Other countries 30.0 2.4 129.8
Grand Total 1,319.5 (43.7) 2,887.0
CountriesStock 2007 Stock 2008Net Flows
Total Foreign Liabilities by Region (US$ Million)
Central Region 14.3 (91.0) 790.9
Northern Region 48.9 6.9 84.2
Southern Region 1,256.3 40.4 2,011.8
Grand Total 1,319.5 (43.7) 2,887.0
Regions Stock 2007 Stock 2008Net Flows
FDI Liabilities by Sector (US$ Million)
Manufacturing 776.8 (30.2) 977.5
Construction 108.9 20.1 535.3
Agriculture 180.8 (20.4) 350.0
Financial and Insurance 150.4 5.3 252.5
Wholesale and Retail Trade 79.9 16.6 245.3
Information and Communication 65.6 20.1 174.1
Transportation (60.6) (3.6) 25.3
Activities of Households 10.3 0.6 12.1
Accommodation 2.5 0.1 10.6
Real Estate Activities 0.4 (0.0) 0.4
Administrative 0.2 0.0 0.4
Grand Total 1,315.4 8.7 2,583.5
Sectors Stock 2007 Stock 2008Net Flows
Page 73
56
FDI Liabilities by Country (US$ Million)
Mauritius 598.7 27.6 644.8
United Kingdom 221.6 (53.5) 495.5
South Africa 256.9 0.1 369.4
Portugal 21.0 14.6 289.5
Kuwait 54.8 20.3 171.2
Switzerland (173.2) (35.4) 126.1
France 80.3 3.1 114.0
Kenya 23.8 8.2 52.2
Bahamas 13.6 5.0 44.5
Netherlands 58.1 (1.8) 42.5
Italy and Vatican City 40.9 0.1 41.0
USA 28.7 6.8 40.0
Zimbabwe 26.4 4.5 35.5
Tanzania 14.9 4.5 34.3
Denmark 19.6 3.3 32.6
Other 29.4 1.4 50.3
Grand Total 1,315.4 8.7 2,583.5
Countries Stock 2007 Stock 2008
Net
Flows
Other Foreign Liabilities by Sector (US$ Million)
Wholesale and Retail Trade - (21.2) 161.8
Manufacturing - 0.4 84.7
Information and Communication 0.6 (30.2) 30.9
Transportation 0.4 (0.3) 7.3
Construction - 0.7 4.9
Accommodation - 1.8 4.5
Financial and Insurance - (2.1) 3.2
Agriculture - (0.6) 1.3
Professional, Scientific and Technical 0.0 - 0.1
Activities of Households 0.1 0.0 0.0
Grand Total 1.2 (51.5) 298.9
Sectors Stock 2007 Stock 2008Net Flows
Page 74
57
Other Foreign Liabilities by Country (US$ Million)
South Africa 1.1 (59.3) 183.3
United Arab Emirates - 1.6 24.6
Germany - (4.3) 20.1
Switzerland - 6.0 16.4
Mozambique - 8.8 13.7
British Virgin Island - (6.7) 13.4
Tanzania - (1.3) 9.3
United Kingdom - 1.0 4.3
Mauritius - 0.4 4.3
Japan - - 4.1
Other 0.0 2.4 5.3
Grand Total 1.2 (51.5) 298.9
Countries Stock 2007 Stock 2008Net Flows
Total Foreign Investment Assets (US$ Million)
Direct Investment 0.1 (19.5) 14.2
Foreign Direct Equity Capital at MV - 2.2 5.2
Reinvested Earnings MV - 0.3 -
Other Capital 0.1 (22.0) 9.0
Long-Term Inter-company loans - 3.8 10.9
Short-term Inter-company loans - (0.7) -
Supplier credits from related companies 0.1 (25.0) (2.0)
Portfolio Investment 0.1 (0.1) 0.4
FPEI - (0.1) 0.1
Bonds 0.1 - -
Financial derivatives - - 0.3
Other Investment 0.0 (6.8) 14.3
Loans
Long-term - - 1.7
Short-term 0.0 0.1 5.6
Trade Credits 0.0 (6.8) 7.1
Total Foreign Investment Assets 0.2 (26.4) 28.9
ComponentsStock 2007 Stock 2008Transaction
Page 75
58
Income on Equity Liabilities by Sector (US$ Million)
Dividends
declared
Dividends
paid
Net
Profit/Loss
Reinvested
Earnings
Manufacturing 3.9 28.2 60.2 28.0
Information and Communication 0.1 - 26.4 26.2
Financial and Insurance 11.4 1.3 25.9 17.2
Construction - - 16.1 15.7
Agriculture 1.1 4.6 17.1 11.7
Other Sectors 1.2 8.4 13.6 5.7
Total 17.8 42.5 159.2 104.6
Sector
Income on Equity - 2008
Income on Equity Liabilities by Country (US$ Million)
Dividends
declared
Dividends
paid
Net
Profit/Loss
Reinvested
Earnings
Mauritius 0.8 24.1 41.4 16.4
Portugal - (0.0) 14.9 14.6
South Africa 5.6 5.5 19.3 12.9
United Kingdom 4.0 10.4 19.1 9.4
USA 0.8 0.2 11.2 6.9
France 1.2 1.0 7.4 5.2
Zimbabwe 4.2 0.1 9.0 4.7
Tanzania 0.0 - 3.9 3.9
Denmark - - 3.3 3.3
Other countries 1.2 1.1 29.8 27.4
Total 17.8 42.5 159.2 104.6
Country
Income on Equity - 2008
Page 76
59
APPENDIX B: 2009 Survey of FPC and IPs Team EXECUTIVES
NAME INSTITUTION
Mr. C. Machinjili Commissioner, National Statistical Office
Dr. P. Ligoya Governor, Reserve Bank of Malawi
Mr. V. Mbewe Governor, Reserve Bank of Malawi
Mr. J. Kaphwereza Banda Acting General Manager, MIPA COORDINATORS
NAME INSTITUTION
Mrs. M. Kanyuka National Statistical Office
Mr. J. Ndawala National Statistical Office
Mrs. L. Chikoti National Statistical Office
Mr. E. Goneka Reserve Bank of Malawi
SUPERVISORS
NAME INSTITUTION
Mr. P. Siwinda National Statistical Office
Mr. R. Tseka Reserve Bank of Malawi
Mrs. O. Nkuna Reserve Bank of Malawi
Mrs. M. Palamuleni Malawi Investment Promotion Agency RESEARCH ASSISTANTS
NAME INSTITUTION
Mr. T. Nkhoma National Statistical Office
Mr. T. M’manga National Statistical Office
Mr. J. Kadam’manja National Statistical Office
Mr. W. Mangwaya National Statistical Office
Mr. C. Kaiwe National Statistical Office
Mr. S. Kwalingana Reserve Bank of Malawi
Mrs. A. Mjojo Reserve Bank of Malawi
Mr. G. Phiri Reserve Bank of Malawi
Ms. M. Ngalande Reserve Bank of Malawi
Mr. A. Nyirenda Ministry of Development Planning & Cooperation
Mr. P. Mwanza Ministry of Development Planning & Cooperation
Mr. M. Salika Ministry of Finance
Mr. M. Mzuzi Ministry of Industry & Trade
Page 77
60
TRAINING PARTICIPANTS
NAME INSTITUTION
Mr. E. Goneka Reserve Bank of Malawi
Mr. R. Mzonde Ministry of Development Planning & Cooperation
Mr. J. Ndawala National Statistical Office
Mrs. L. Chikoti National Statistical Office
Mr. R. Tseka Reserve Bank of Malawi
Mr. P. Siwinda National Statistical Office
Mrs. O. Nkuna Reserve Bank of Malawi
Mrs. A. Mjojo Reserve Bank of Malawi
Mr. S. Kwalingana Reserve Bank of Malawi
Mr. G. Phiri Reserve Bank of Malawi
Ms. M. Ngalande Reserve Bank of Malawi
Mr. A. Nyirenda Ministry of Development Planning & Cooperation
Mr. P. Mwanza Ministry of Development Planning & Cooperation
Mr. T. Nkhoma National Statistical Office
Mr. J. Kadam'manja National Statistical Office
Mr. T. M'manga National Statistical Office
Mr. W. Mangwaya National Statistical Office
Mr. M. Salika Ministry of Finance
Mrs. M. Palamuleni Malawi Investment Promotion Agency
Mr. C. Kaiwe National Statistical Office
Mr. M. Mzuzi Ministry of Industry & Trade
ANALYSIS AND REPORT WRITING TEAM
NAME INSTITUTION
Mrs. L. Chikoti National Statistical Office
Mrs. O. Nkuna Reserve Bank of Malawi
Mr. H. Kankuwe National Statistical Office
Mrs. M. Palamuleni Malawi Investment Promotion Agency
Mr. T. Nkhoma National Statistical Office
Mr. D. Jenya Ministry of Finance
Mr. P. Mboya MEFMI, Consultant
Mr. E. Mgangaluma MEFMI, Programme Officer
Page 78
61
APPENDIX C: Summary Budget for the 2009 FPC and IPs Survey
Item Amount (US$)
1.Printing of questionnaires, manuals & reports
5, 688
2. Training workshop for research assistants 4, 922
3. Publicity campaign 2, 270
4. Survey implementation (First visit) 44, 333
5. First survey follow-up 35, 837
6. Second survey follow-up 18, 589
7. Data processing, analysis & report writing 16, 546
8. Final report dissemination (hand delivery) 6, 348
GRAND TOTAL 134,533