PRESENTED BY: The Georgia Center of Innovation for Logistics IN CONSULTATION WITH: GrowthEconomics inc. INDUSTRY COLLABORATION: Metro Atlanta Chamber Logistics Council Georgia Motor Trucking Association Georgia Railroad Association Atlanta Air Cargo Association Atlanta Chapter of the Council of Supply Chain Management Professionals Savannah Chapter of the Council of Supply Chain Management Professionals Georgia Economic Developers Association International Warehouse and Logistics Association International Freight Forwarders and Customs House Brokers Association of Atlanta Savannah Maritime Association Atlanta Maritime Association 2009 Georgia Annual Logistics Report A FOCUS ON PROVIDERS
Transcript
PRESENTED BY:
The Georgia Center of Innovation for Logistics
IN CONSULTATION WITH:GrowthEconomics inc.
INDUSTRY COLLABORATION:Metro Atlanta Chamber Logistics CouncilGeorgia Motor Trucking AssociationGeorgia Railroad AssociationAtlanta Air Cargo AssociationAtlanta Chapter of the Council of Supply Chain Management ProfessionalsSavannah Chapter of the Council of Supply Chain Management ProfessionalsGeorgia Economic Developers AssociationInternational Warehouse and Logistics AssociationInternational Freight Forwarders and Customs House Brokers Association of AtlantaSavannah Maritime AssociationAtlanta Maritime Association
2009 Georgia Annual Logistics ReportA FOCUS ON PROVIDERS
Greetings,
I am honored to present the first release of Georgia’s Annual Logistics Report: A Focus on Providers. Georgia is known for many things: from Tybee’s beaches to the Blue Ridge Mountains, from peaches to p , and from Coca-Cola and Delta Airlines to The Home Depot. Every place we go, product we buy or successful company we can think of, it involves and likely relies upon logis-tics. Georgia is indeed the “State of logistics”.
First, Georgia is the “State of logistics” because of our impressive inventory of assets…
This report will bring to light important details surrounding those assets. A few highlights include: 21,200 miles of highways used by over 1M trucks per week and 5,000 miles of railroad track to deliver cargo valued at $200 billion all over the country. Addition-ally, our State has a distinctive geographical “corner store” advantage, including being home to the 3rd largest, fastest growing and one of the most efficient seaport container terminals in the Nation, and the World’s busiest airport.
Second, Georgia is the “State of logistics” because of our innovative focus and bright future…
We all know that research, technology and partnerships can help drive competitiveness in any industry and Georgia’s Centers of In-novation program provides focused expertise and resources to uniquely assist the State in attracting and growing businesses in our strategic industries. The established supply-chain-technology community in metro Atlanta complements our statewide university and technical college system, which offers over 100 programs with logistics-related classes, certificates and degrees. This is making Georgia better positioned every day to handle the forecasted volumes of cargo coming our way.
This report represents a new information platform, which will spark conversations and hopefully some new ideas. From here, backed with the data, facts and figures, we can work towards realistic and actionable solutions. I also hope you will identify areas of the report you want to explore in more detail. If so, please don’t hesitate to contact us or visit our website logistics.georgiainnova-tion.org to share your thoughts.
This inaugural year, we have a great opportunity to create the clear, common voice needed to keep this industry moving forward. Your ideas, insight, experience and leadership are both the map and the fuel to deliver us where we want to go. There is a saying that “without a destination, anywhere is fine” and without your collaboration we could indeed end up anywhere.
I look forward to working with each of you as we strengthen our position as the premier “State of logistics”.
Sincerely,
Page SiplonExecutive Director,
Center of Innovation for Logistics
Sinccccccccccccccccccerely,
PaPPPPPPPPPPPPPPPPPPPP ge SiplonExExExExExExExExExExExExxExExxExExxExecutive Director,
The Logistics Industry : An Ecosystem ................................................................................ 2Categorizing The Ecosystem .........................................................................................................3
A. The Logistics Providers ...................................................................................................3
B. The Logistics Users ..........................................................................................................4
Selection Of Industries: Filtering A National System Of Codes ........................................4
Integrating The Data ........................................................................................................................5
Comparing Apples To Apples? .....................................................................................................5
2 Structure And Dynamics Of The Sector . . . . . . . . . . . . . . . . . . . . . . . .7Georgia’s Logistics Providers: The Base Numbers .......................................................... 7
Georgia’s Logistics Providers: Location Of The Industry .............................................. 8
Air .........................................................................................................................................................54
Logistics Technology Report: North America .................................................................84Rating The Logistics Technologies ...........................................................................................84
The line between disorder and order lies in logistics...
Sun Tzu
Logistics is the stuff that if you don’t have enough of, the war will not be won as soon as.
General Nathaniel Green, Quartermaster, American Revolutionary Army
LOGISTICS: MANY DEFINITIONS, MANY APPLICATIONSTHE WORD LOGISTICS originates from the ancient Greek logos which means “ratio, word, calculation, reason, speech, oration.” Logistics as a concept is widely considered to have evolved from the military’s need to supply troops as they moved from their base to a forward position; in an-cient Greece as well as the Roman and Byzantine empires, there were mili-����������� �����������������Logistikas������������������ ��������������matters and supply distribution.
������ ���� ����� ���������� ���� ���������������� ���� ���� ����� ���������� �������������������� ���� ������������� ���������� ���������!���"#$$$��� -sites, each with multiple suggestions and ideas. There are also many other words and phrases that accompany or are interchanged for the term logis-tics such as supply chain, demand chain, transportation management, just-in-time, reverse logistics, material handling and planning.
The Council of Supply Chain Management Professionals (CSCMP) has de-���������������%
“… that part of Supply Chain Management that plans, ����������#�����������������������#�������!����������������!�����&�����������������������#����!��������related information between the point of origin and the point of consumption in order to meet customers’ re-quirements.”
Note that the “point of consumption” refers only to businesses. While the ������������������������ ����������������������#����������!���������-�������� ���������������������'�#��������������#�������������������������“goods, services and related information between the point of origin and the last point of value addition.1 ”
1 Logistics Costs and U.S. Gross Domestic Product - FHWA�*�������+��������������/���������#�0$$"
1 An Introduction to Logistics
2 AN INTRODUCTION TO LOGISTICS
One might say that in its simplest form, logistics is the movement of items ����� ������ �� ��� ������ 3�� 3��� �������� ������ ������ ���� ������� ��� �������#������������������������������456�������� ������������&��6����������-visions, there are many more dots to connect to move those items from ����������������������������7��������������������#�������������������#�security systems, physical infrastructure and specialized third-party ser-!��������������������������������#� ������������!���������������������������process.
THE LOGISTICS INDUSTRY :: AN ECOSYSTEMTHE LOGISTICS INDUSTRY is essentially the sum of its trucking, rail, air cargo, warehousing and services industries. Like an ecosystem, which is formed by the interaction of a community of organisms with their physi-cal environment, the elements of this “industry of industries” interact with each other and so depend on each other directly or indirectly.
�89�7+��9�39:/<�depicts how the users of logistics (in� ���=���������with those industry partners that provide the desired prod���������services (along the arrow).
AN INTRODUCTION TO LOGISTICS 3
Categorizing the Ecosystem
Equally as complex as the activities in logistics are the businesses that per-form them. The Center of Innovation for Logitics has created a set of cat-egories and subcategories by which to classify these businesses.
����������������!������������!������������������ 6���������%�CORE, RELATED
and SUPPORT. These categories are used multiple times throughout this re-port, so the table below is provided to better illustrate the industries repre-sented in each category.
LOGISTICS PROVIDER DEFINITIONS
CORE INDUSTRIESOrganizations involved with the direct movement of cargo and freight and whose primary business creates and/or connects major nodes in the global supply chain. Core industries are broken into two sub-groups:
� Facilities (warehouses, ports...)
� Transportation (truck, rail, air...)
RELATED INDUSTRIESConsists of two categories: enabling, which helps move goods faster and more efficiently through the supply chain typically through tech-nology improvements or offerings; and traditional, which provides goods and services directly to the infrastructure (core industry) of the supply chain.
� Enabling (logistic software, engineers...)
� Traditional (cargo container manufacturers, third-party providers...)
SUPPORT INDUSTRIESThis group of companies provides services to both the core and relat-ed industries but does not physically touch the cargo. Support indus-tries include labor organizations such as associations and unions, as well as professional services such as accounting, legal and consulting.
����� ������� ������� ��� ��������� ���!�����#� ����� ����� ���� �����������to the Georgia economy. The most prominent part of the logistics provider ������������������������������������?�����������������������?����*����-����#����������������������@"�����������������������!�������������������������������������������������������������������� ����0$���������������than the national average.
4 AN INTRODUCTION TO LOGISTICS
B. THE LOGISTICS USERS
The logistics users are the customers of the logistics providers. This group �����!������������������ 6���������%�RAW MATERIALS PRODUCTION, MANUFAC-TURING and WHOLESALE DISTRIBUTION.
LOGISTICS USER DEFINITIONS
RAW MATERIALS PRODUCTIONEstablishments engaged in producing unprocessed natural products that will be used in manufacturing. These include both durable and non-durable materials.
MANUFACTURINGEstablishments engaged in the mechanical or chemical transforma-tion of materials or substances into new products, which may be fin-ished in the sense that they are ready for utilization or consumption, or may be semi-finished to become a raw material for an establish-ment engaged in further manufacturing
WHOLESALE DISTRIBUTIONEstablishments engaged in selling merchandise to retailers; to indus-trial, commercial, institutional, farm, construction contractors; to pro-fessional business users or to other wholesalers.
Selection of Industries: Filtering a National System of Codes
9F�����!������ �����������������������������������������������������������make up the logistics provider and user sectors in the state of Georgia. The �����������������������������������������������������������������#���������-agement to facilities.
Note that we are using establishment-based data. ������� ��������������private enterprise with a distinctive line of business operating at a single �������#� ��� �������� ��� ��6��!��� ����� ����� �������� ��������� ���� ����-ments.
������ ���� ���� ��������� �������� ����� ��� �������J�� ��������%� ���� ��F6������'��������7����������?�����������KSIC=��������������Q�������������7����������?�����������'������KNAICS). These systems include thousands of possible choices for companies to describe their services, products or activities. They are adequate for very general information gathering and broad statistics but can create a false impression of a particular industry unless examined in greater detail.
Establishment A private enterprise with a distinctive line of busi-ness operating at a single address, as opposed to
firm-level data that includes multiple establishments.
AN INTRODUCTION TO LOGISTICS����"
*����F�����#��!���V#@$$����� �������������������6��F�����������SIC codes are �����������������������������������!�����������8���!��#��������������codes, truck and trailer rental companies, household movers and limousine services also are returned. These types of companies, while still important ����������#�������������������������������������������������� �!��
To capture details about the warehousing segment of the logistics industry, one would look to the SIC industry group “Public Warehousing and Stor-age.” This group contains twenty-three SIC codes and indicates there are 2,127 warehousing and storage companies in Georgia. While true at face value, the results also include self-storage and mini-warehouses which, by �������������������������������#���������������������!���������������������be counted as such.
Integrating the Data
Much thought and attention was devoted to creating an accurate list of in-dustry codes and a detailed set of rules that direct the inclusion or removal of establishments from Georgia’s master list. Working directly with the au-thors of business databases, academic experts and others, these rules and code lists were developed to serve as the common thread linking the mul-tiple data sources utilized to create this report.
It is important to note that much of the data contained herein is founded on �� ������������ ������������������������������0$$@Z����������������������been supplemented with additional resources that contain near-time data. ������������ ������ ������������������� ����������������� ���������������������� ������������������� ��������� ����������������������.
������������������������!
The calculated employment values were evaluated for general accuracy of ���������������!�������������� �������������������������������������� �-low, differing data sets and categorization yield different results; however, ���������������������������������������������������������������������more general national projections. This report weighs all measurements and calculations to the conservative (low) side.
6 AN INTRODUCTION TO LOGISTICS
COMPARISON OF EMPLOYMENT ESTIMATESTRANSPORTATION AND WAREHOUSING, 2006
Source DefinitionEmployment Number
NETS Full- and part-time employment of all types of establishments
199,537
Bureau of Economic Analysis
All full- and part-time employment, including all self-employed
208,027
Quarterly Census of Em-ployment and Wages (ES202), BLS
Only employment subject to state unemployment insurance laws and un-employment compensation for federal employees program
186,200
Current Employment Survey (CES), BLS
Nonfarm survey data based primarily on establishments selected from the QCEW administrative records
164,600
County Business Pat-terns, Bureau of the Census
Business register records, supplement-ed with records from census collections and administrative records; excludes most government workers
164,058
Non-Employer Statistics, Bureau of the Census
Firms with no payroll employment in the reference week
33,427
Economic Census, Bureau of the Census (2002)
Census survey; excludes most govern-ment-owned establishments, non-employer establishments and several industries, among them, rail transporta-tion
117,182
Logistics Employment in Georgia, 2009
Providers: 121,000 Users: 884,000
Total: 1,005,000
Logistics providers comprise approximately 12 percent of all logistics employment in Georgia.
GEORGIA’S LOGISTICS PROVIDERS: THE BASE NUMBERS�89� \]9^7/_'� ?8�\�9]� provided an overview of the sub-categories �������������������������!���������������� �������������������������������� ������ �� 6���������� ������ ������ �����%� ESTABLISHMENTS, EMPLOYMENT
and SALES.
GEORGIA LOGISTICS PROVIDER VALUESESTIMATES, 2009
Establishments Employment Sales
Core Facilities5%517
9%10,690
5%$788,409,943
Core Transportation62%6,830
46%55,361
36%$5,610,216,284
Related Enabling2%175
10%12,468
9%$1,425,049,807
Related Traditional27%2,992
30%35,990
43%$6,800,551,074
Support4%6,333
5%6,333
7%$1,015,290,969
Total 10,912 120,842 $15,639,518,077
Source: NETS, InfoUSA, CorpTech
If we place the percentage shares of the three measurements side by side, interesting facts begin to emerge. For example, Core Transportation has the largest portion of establishments, but only half as much of the overall sales share. In contrast, both the Related categories have a greater employ-ment and sales percentage compared to their share of the overall provider industry.
2 Structure and Dynamics of the Sector
Logistics Provider Sales 2009 Estimate
Logistics Provider Establishments 2009 Estimate
Logistics Provider Employment 2009 Estimate
8 STRUCTURE AND DYNAMICS OF THE SECTOR
GEORGIA’S LOGISTICS PROVIDERS: LOCATION OF THE INDUSTRYCORE, RELATED AND SUPPORT INDUSTRIES BY COUNTY
Core industries Related Industries Support Industries
LEGEND
Establishment Count
0
1 ‒ 10
11 ‒ 25
26 ‒ 50
51 ‒ 100
101 ‒ 393
STRUCTURE AND DYNAMICS OF THE SECTOR 9
LEGEND
Establishment Count
Large > 250
Medium 20 ‒ 249
Small 10 ‒ 19
Micro 1 ‒ 9
CORE, RELATED AND SUPPORT INDUSTRIES BY EMPLOYMENT SIZE
Core industries Related Industries Support Industries
4$����STRUCTURE AND DYNAMICS OF THE SECTOR
LOGISTICS PROVIDER TRENDS & ACTIVITY (1990-2009)
"��������#���� ���$������������
The charts below illustrate the breakdown of logistics provider establish-�����������������������������4}}$��3�����#������!����������������������-nated by Core Transportation and Related Traditional establishments. These serve as the foundation for many different industries throughout Georgia.
LOGISTICS PROVIDER ESTABLISHMENTS, 1990-2009
0
2000
4000
6000
8000
10000
12000
1990
1991
1992
1993
1994
1995
1996
1997
1998
1999
2000
2001
2002
2003
2004
2005
2006
2009
Core Facilities Core Transportation Related Enabling Related Traditional Support
Source: NETS, InfoUSA, CorpTech
By examining the growth and concentration of establishments over three periods, one can see how the different sectors have weathered the different business cycles. Core Facilities were hardest-hit in the previous recession and have since rebounded; however, the growth in the number of new fa-cilities has not regained the momentum of the previous decade. The num-ber of Related Enabling and Support establishments continued to grow throughout the last recession, but that growth rate has since decreased. It is interesting to note that Related Enabling establishments grew at a rate ����������"�������������������������������������!��������������������������establishments was lower nationwide. This indicates a potential period of high technology adoption for the logistics industry despite the recession.
Reminder
Data and results for 2009 are carefully calculated projections based on ac-tual companies and the historical trends observed from 1990 through 2008.
Core Facilities Core Transportation Related Enabling Related Traditional Support
LOGISTICS ESTABLISHMENTS BY EMPLOYMENT SIZEGEORGIA ESTIMATES, 2009
Establishments 1-9 10-19 20-99 100-249
250-500
501+ Total
Core Facilities 60% 18% 17% 3% 2% 0% 5%
Core Transportation 86% 7% 6% 1% <1% <1% 63%
Related Enabling 34% 20% 24% 15% 4% 3% 2%
Related Traditional 76% 13% 10% 1% <1% 1% 27%
Support 80% 6% 11% 1% 2% <1% 4%
Total 81% 9% 8% 1% 0.4% 0.3% 100%
Source: NETS, InfoUSA, CorpTech
�����F��������54��������������� �����������������������������!�����������employ 1–9 workers. This is especially representative of the Core Trans-portation and Support categories. Related Enabling industries stand out as ����������������������� ����� ��������������������������6��6���������J��categories and have almost double the share of large establishments rela-tive to other sectors. In general, logistics, like nearly all industries, is fueled by small business.
Approximately 81 percent of establishments in the logistics provider sector employ 1‒9 workers.
In general, logistics, like nearly all industries, is fu-eled by small business.
Employment
Core Facilities9%
10,690
Core Transportation46%
55,361
Related Enabling10%
12,468
Related Traditional30%
35,990
Support5%
6,333
Total 120,842
12 STRUCTURE AND DYNAMICS OF THE SECTOR
Looking forward, employment in the Core industry category is still expect-���������������!���4��������������������������� ������������������0$4@����������������������������~���������������������� ������������������-cupations and their annual projected growth rate follows.
GROWTH PROJECTIONS FOR SELECTED OCCUPATIONS, 2006-2016
2.23%
2.20%
1.53%
1.30%
1.30%
1.20%
1.00%
0.90%
0.70%
0.62%
0.50%
0.35%
0.33%
Customer Service Representatives
Cargo and Freight Agents
Truck Drivers, Heavy and Tractor-Trailer
Truck Drivers, Light or Delivery Services
First-Line Supervisors/Managers of …
First-Line Supervisors/Managers of …
Helpers--Production Workers
Aircraft Mechanics and Service Technicians
Shipping, Receiving, and Traffic Clerks
Laborers and Freight, Stock, and Material …
Bus and Truck Mechanics and Diesel …
Dispatchers, Except Police, Fire, and …
General and Operations Managers
This chart is in line with expected total growth for Georgia’s transportation and warehousing sector and the state’s projections for nonfarm employ-��������������������������� ��������������������������������#�����������������~�����������0$4@�����������������������������!�����~� ����������������_������'����������������������������������������������������������the national average, an estimated 1 percent annual job growth rate for the Core industries can be expected.
While there are many economic factors and industry conditions that con-tribute to employment activity, it is important to consider that some of the employment reductions – particularly in the Core Facilities and Transpor-������������������������������������ ��� ����������������!�������������!����improvements and technology integration into existing processes. Tech-nology is discussed further in Chapter 9.
STRUCTURE AND DYNAMICS OF THE SECTOR 13
Sales
Core Facilities
5%$788,409,943
Core Trans-portation
36%$5,610,216,284
Related Enabling
9%$1,425,049,807
Related Traditional
43%$6,800,551,074
Support 7%$1,015,290,969
Total $15,639,518,077
"���������#���� ���&���
����������������������!�����������F����������������������������������4"�@V� ������� �������� 0$$5�� K*��� ��������������� ���� �������� ������ ����� ����sales and employment have on the overall economy, see Chapter Seven.)
/������������������4"�@V� ���������������#���������������"���������������� ��-ed to the Core Transportation industries and over 43 percent is attributed �������]�������������������������������'����0$$V#���������!�����������0"�������#� �������� ��� �� �������� ������� ����� ��� ������� "� �������� <�����Core Facilities and Core Transportation industries decreased in sales be-������0$$V�����0$$}� ���������������}���������������!���#������������������������������������������������������������!��������
LOGISTICS PROVIDER SALES, 1990-2009
-
2,000,000,000
4,000,000,000
6,000,000,000
8,000,000,000
10,000,000,000
12,000,000,000
14,000,000,000
16,000,000,000
1990
1991
1992
1993
1994
1995
1996
1997
1998
1999
2000
2001
2002
2003
2004
2005
2006
2009
Core Facilities Core Transportation Related Enabling Related Traditional Support
Source: NETS, InfoUSA, CorpTech
Despite decreases in the Core industries, median sales in the logistics pro-vider sector remained nearly 14 percent higher than the overall private sector. In fact, every logistics provider category had median sales values higher than that of aggregate private sector businesses.
14 STRUCTURE AND DYNAMICS OF THE SECTOR
MEDIAN SALES, 2006
Core Facilities 325,000
Core Transportation 150,000
Related Enabling 1,176,100
Related Traditional 500,000
Support 185,000
All Logistics Providers 160,000
Private Sector 140,000
Source: NETS
<��������������!���� �����������������������������������#������������������������������������������������������������������������������� �������-�������������������!��Z�����!��#�������������~�����������0$$@�0$4@��F������&�����6��~������GDP in the Core and Related Traditional industry catego-ries to grow approximately 3.4 percent annually in the U.S. while overall output is expected to grow only 3 percent. With the recent downturn, out-put growth projections are likely to be adjusted downward.
Summary
The broad reach of the logistics ecosystem and the many industries which depend on it make logistics closely tied to the overall economy. This chapter begins with a review of the Georgia annual economic outlook provided by the University of Georgia and is followed by a look at a few national indicators and Georgia’s position, strengths and rankings compared to the U.S. through a wide variety of perspectives.
THE 2009 GEORGIA ECONOMIC OUTLOOKProvided by Terry College of Business, University of Georgia
�9/]�7��'�7Q*:��7/Q6���_'�9��GDP is forecast to increase by 1.2 percent, which is nearly a full percentage point lower than the 2.1 percent advance in state GDP���������������0$$5������0$$}����������������������GDP������ ��!����������������4����������������F������������������������-though the annual percentage gains in the state’s GDP� ���� ����0$$5�����0$$}������ ��������!�#�����������GDP������������������������������������������0$$5������������������������0$$}#������������������������ ����������� ����������������#� �������� ��� ���������������������������#� ������������recession and the deepening recession in nonresidential construction.
On an annual average basis, the state’s nonagricultural employment will ������� ��$�4�����������0$$}#���������� ��������������������$�0��������loss expected in nationwide employment. The annual averages, however, � �������������������������������������~� ������������� �����������60$$5�����������F��������������������������������0$$}��/����������������������job losses – in some sectors – will be a dramatic rise in the unemployment ����������V�V�����������0$$�#����@�����������0$$5#������"�����������0$$}������������������������������������������������5������������������������������0$$}�
�� ������������������!��������������� �����������������������#�������-������#���������#�����������!���#������������#���������������!������������������������������������ ����������������� �������������������������������state government, but the local government headcount also will drop due ��������������������������������������������F��#�����������������&�����-ing of property tax digests and reduced transfers from state government.
<�����������������������������60$$}#�~� ����������������������� ��!������- ����������������������������������~� ������������� ������������������������������������#�������������������������3�����60$$}#�������������������#����������#������������#�������������������������������������������-ment industry will be adding to their staffs. Shortly thereafter, the hospital-ity industry will be on the upswing. Heavy job losses will continue in both construction and manufacturing, however.
3 Benchmarking Competitiveness and Cost
By mid-2009, transporta-tion firms, retailers, whole-salers, financial institutions and the arts/entertain-ment industry will be adding to their staffs.
16 BENCHMARKING COMPETITIVENESS AND COST
Despite continuing job losses in several important sectors, Georgia’s nomi-�������������������������F����� ��V�0�����������0$$}#�������������4�������������������������&�����6��~������ ���������������������������������growth will not begin until after the upturn in the labor market begins in the second quarter, however. One positive development is that much of the job growth will occur in metropolitan areas of the state where prevailing ���������!��������������!��������������#������!������������������������������hourly wages should increase slightly. One negative factor is that capital gains will not help income growth very much.
Many of the positive forces underlying the forecast for the second quarter upturn in both the Georgia and U.S. economies are the same. Housing will have bottomed out in both sales and starts, and home price depreciation will be less of a factor. Businesses will begin to hire and will continue to spend for equipment. The global economy will expand slowly. The dollar will strengthen, but not enough to diminish prospects for export-oriented �����������?���������������&�������������������/��������������������� �������#� ���������������!���������*������#������������������������������� ���������������������
But there are some very powerful negative forces, too. The recession in nonresidential construction will intensify, and job losses in manufacturing �������������'������������������������������������������������������������-nancial markets will restrain growth in business spending as well as sales of consumer items typically bought on credit. Nonetheless, the tumult in the ������������������������������������������������������������
��������������
Slower growth of cargo into and out of Georgia’s ports, smaller increases in �������������������#��������������������������������������������������-sumers mean anemic growth in total cargo volumes. Containerized cargo shipments will be the main force contributing to the growth of Georgia’s transportation sector, and will insure that cargo volumes grow slightly fast-er than state GDP. The biggest challenge will be declines in U.S. GDP in the ���������������0$$5������������������������0$$}#�������������!������������declines will be focused on transportation-intensive sectors of the economy such as housing and durable goods manufacturing. Slow GDP growth in sub-���������������������� ������� ���� �������������������� ����0$$}��Q������-less, bigger shipments of many nondurable consumer and manufactured goods, capital equipment, coal, agricultural products and processed foods are expected to more than offset smaller shipments of home building ma-terials and home-related consumer durables and cars. Consequently, rate competition in even the strongest sectors will intensify.
Containerized cargo ship-ments will be the main force contributing to the growth of Georgia’s trans-portation sector, and will insure that cargo volumes grow slightly faster than
state GDP.
Rate competition in even the strongest sectors will
intensify.
BENCHMARKING COMPETITIVENESS AND COST 17
RAILROADS
����������V#�$$6����������������������������������������'��������#����������rail service is provided by Norfolk-Southern and CSX. Despite the poor pros-pects for U.S. GDP growth, business conditions favor the railroads. Demand growth will exceed capacity growth, but the growth rates will be lower and they will converge. These growth dynamics will keep rates high, but prob-ably will prevent them from going any higher unless fuel prices spike. Over-����������������������������������������0$$}�
The continued success of Georgia’s ports will be a big plus for the railroads. Inter-modal shipping of consumer goods and light industrial products will grow, and there also will be more shipments of industrial and communica-���������������������#������������������������!��������� �����������������������������������#������������������F������������6����������������������mode. High trucking costs, increased highway congestion and more con-cern about air quality are some additional factors that favor the railroads.
Shipments of agricultural products, processed food, electrical equipment, machinery and coal will increase slightly. Shipments of consumer goods ��� � ��� ����� ������� ��������� ��� ���� ���� ����� ��� ���� ����#� ��� ������� ��- ��������������������?��������!��������� � �������� ��&����������������slightly. The outlook anticipates lower shipments of building materials, however. Coal is the rail industry’s largest source of shipments and a major ����� �����������������#����������������������������������������#����-tric utilities are expected to use more coal. High natural gas prices will be a ��������������� ���������������������������������������
TRUCKING
������� ��������0$$560$$}���������������������������!�������������� �����������������������������0$$}#����� ����������������������!�������������!���truckers. But slower growth in truck freight coupled with more competi-�������������������������� ���������������������������������������������rates enough to fully offset higher costs. Truckers’ net margins therefore will erode. Despite the slowdown in volume growth, the recent string of !��������� �����������������������������������������������0$$}#� �������pace of expansion will be quite modest.
Meanwhile, several factors will push trucking companies to get bigger. First, more outsourcing of products from overseas, especially China, favors carriers that can manage distribution both domestically and globally. Sec-���#������������������������������������������������������������������������the broadest range of services. Third, large trucking companies can achieve economies of scale in distribution, especially when it comes to managing ��� �����������������*������#�������������������� � ���������������������to cope with the driver shortage than will smaller companies.
Despite the poor pros-pects for U.S. GDP growth, business conditions favor the railroads. Demand growth will exceed capac-ity growth
Inter-modal shipping of consumer goods and light industrial products will grow, and there also will be more shipments of industrial and communica-tions equipment.
Despite the slowdown in volume growth, the recent string of very profitable years will encourage carri-ers to add trucks in 2009, but the pace of expansion will be quite modest.
18 BENCHMARKING COMPETITIVENESS AND COST
In the wake of new fuel emissions standards, equipment costs are expected to rise. Meanwhile, high insurance costs and high deductibles constitute an ����������� ���#������������������������������������J������������������Ever-increasing and volatile fuel prices are the biggest wild card in the fore-cast, but barring more political instability in major oil producing countries ����������������������������������������������������������������������0$$}�
AIRLINES
Vigorous competition within the industry will continue to limit pricing power, curbing ticket prices even when costs rise. The competition among the airlines also has trained customers to be more price-sensitive. Mean-while, airlines’ costs for fuel, security, debt service and federal tax burdens continue to rise. Since many of these problems are structural rather than cyclical, it takes more than just a long period of sustained economic growth to heal the large network airlines. Barring government intervention, major carriers that are unable to lower costs to more closely match those of the low-fare carriers are unlikely to survive the restructuring.
For most airlines, fuel and labor are the largest components of costs. There ������������������������������������������������������#� ��������}�44#�4�$#0$$��������������������~� ����!�� ��������������������������������to a 21 percent drop in employment. Despite Delta’s ongoing restructur-���#� ����� V#}$$� ���� ��������������� ~� �� ��!�� ���� ����� ��� �������#� �����amounts to a drop of only 11 percent. This substantially smaller percentage ���������&�������������������������������������������� ����������������
PORTS
Georgia’s deepwater ports industry will thrive by tapping directly into the growth that is taking place overseas, by diversifying its services and by tak-�����������������������������_�'���������7��0$$}#����������������������������������������������������������������������������!�������������!�������appear to be ahead long-term projections. For example, the latest cargo ���������������'�!��������������������������������������0$$5#����������experienced a 14.9 percent increase in the number of TEU’s (Twenty-foot Equivalent Units), establishing itself as the nation’s fourth busiest and fast-est growing container facility. The Port of Brunswick is seeing gains, too, especially in the shipping of agricultural products. The recently completed harbor deepening project helped the Colonel’s Island Terminal in Bruns-wick to post a 29.4 percent year-over-year increase in tons handled; and its ����6 ������������������������5"�@���������������� ��������������!�����
��������� �������������������������������������!�������������������&����strong comparative advantages that allow them to expand their share of ��������������������������� ������������������������������!����!��-tages are the result of a series of strategic expansions over many years. The ��������\���������������������������� ����������\�������'�!��������������
Despite Delta’s ongoing restructuring, only 4,900 air transportation jobs
have been lost in Georgia, which amounts to a drop of only 11 percent. This substantially smaller per-centage decline reflects the fundamental strength of the customer base in
Atlanta.
BENCHMARKING COMPETITIVENESS AND COST 19
Coincident Economic Activity Index
Georgia currently ranks not only in the top 10 states in the country, but also ranks #1 in the Southeast with regards to this activity index and referenced states.
container volume faster than any other state, harbor deepening is a top ��������������������������������������������~������ ��������?�����3���-way” that must be completed to keep cargo moving along the last miles to and from the waterfront. When these projects are completed, trucks will be � ���������������\�������'�!������������������� ����764@�����}"#���������������������������������������������������!����������������������!����
The deepwater ports create substantial economic impacts, too. Together, ���������������"5� ������� ��������������0"� ������� ���������������������#�������������05@#$$$�����6���������6�����~� �������������������� ��������job out of fourteen depends on them in some way. Ports operations also help to preserve Georgia’s manufacturing base and foster growth of the state’s massive logistics, distribution and warehousing industries.
The coincident economic activity index is a single summary statistic that tracks the current state of the economy. The index is computed from a number of data series that move systematically with overall economic con-���������������������������F��������������F���������������������!��������a decline in the index indicates a contraction in economic activity. Each of the regional indexes is computed using data on employment, real earnings, the unemployment rate and average weekly hours worked in manufactur-ing. Each index is then retrended so its long-term growth rate matches the corresponding growth rate of real earnings.
Coincident Economic Activity IndexSoutheast United States
Jan. 1990 - Dec. 2008
GA
FL
SC
US
AL
KY
LA
TN
NC
MS
Compared to its 1992 index of coincident indicators, Georgia has shown much stronger improvement than the U.S. average or any of its neighbor-�������������� �������� �������4}}$�����0$$@����������F������� ����@V������������������������_�'���!������K3���������9��������������=�� �7��the charts above you can see Georgia currently is not only in the top ten ��������������������#� ����������������������������'����������������������to this activity index.
����)�����*�%�'� �(+����"�� ����'� ������
The Baltic Dry Index is owned and operated by the member buyers and sellers. The exchange maintains prices on several routes for different car-goes and then publishes its own index, the BDI, as a summary of the entire dry bulk shipping market. This index can be used as an overall economic indicator as it shows where end prices are heading for items that use the raw materials that are shipped in dry bulk.
The BDI offers a real time glimpse at global raw material and infrastructure demand. The trading is limited only to the member companies, and the only relevant parties securing contracts are those who have actual cargo to move and those who have the ships to move it. 1
Job growth between 1990 and 2006 was for example about 64 percent higher than the U.S. average (Bureau of Economic
Analysis).
BENCHMARKING COMPETITIVENESS AND COST 21
Because dry bulk primarily consists of materials that function as raw mate-������������������������������������������������������������#����������-crete, electricity, steel and food, the BDI����������������������������������indicator of future economic growth and production. The BDI is termed a leading economic indicator because it predicts future economic activity.
Unlike stock and bond markets, the BDI “is totally devoid of speculative content,” says Howard Simons, an economist and columnist at TheStreet.com. “People don’t book freighters unless they have cargo to move.”
��������������3���������7���F����� �!�����#��������������#���������F���� ��������!�������������������������0$$"���������������0$$����������������due to Chinese demand for industrial precursors to production and its shift from coal exporter to importer. There was also a shortage of supply for dry bulk cargo ships and a large backlog at shipyards. The combination of ��������������������������������0$$������������������������F���������������6�������������44#V"}����+���4@��#�0$$5��*�����������������/�� ���0$$5#���������F������5"���������������!��������������������������������-meted. This is due to a simultaneous convergence of several factors. Chief among these is the rapid slowdown in the “global growth” phenomenon. In addition to this, credit has been nearly impossible to get for the purchase of goods and the payment of time charters on the vessels.2
marking studies that com-pare states or regions on their overall attractiveness for businesses and eco-nomic competitiveness.
Regional & National Benchmarking
���������������������!���������J��#�������������!��������������!�����-mand – it depends to a large extent on the health and demand growth of the overall economy.
SELECTED LOGISTICS RANKINGS/PERFORMANCE � In terms of revenue, over 90 percent of the global top twenty-five third party logistics providers have operations in Georgia (Global Logistics and Supply Chain, 2008)
� The 2007 Logistics Quotient ranked the Atlanta metro area among the top one percentile of the most logistics-friendly cities in the United States. Savannah ranked in the top ten percentile.
� Twenty of the top one hundred IT logistics companies are located in Georgia (Inbound Logistics, 2006)
Bureau of Business Research, Ball State University (2008)7 Best States for Manufacturing and Logistics
Site Selector, Expansion Management and Logistics Today (2006)Top Logistics Friendly Cities
6 Atlanta
7 Savannah
DOING BUSINESS IN GEORGIA2009
� There are 640,000 incorporated businesses in Georgia; 97.5 percent employ fewer than 500 people (the national average is 99.7 percent). Of these busi-nesses, 95 percent employ fewer than fifty people; 50 percent employ fewer than five people (State of the State, 2/09)
� Georgia ranks in the top three nationally for number of franchisors ( >100) headquartered in the state (IFA, 1/09)
Chief Executive MagazineBest and Worst States for Businesses
4 Overall Best State
14 Access to Capital
15 Transportation
16 Technology and Innovation
16 Cost of Business
BENCHMARKING COMPETITIVENESS AND COST 23
2008
� Georgia’s Stage One business growth rate was 2.8 times the national average; Stage Two business growth was 2.4 times the national average (Lowe Foundation, 11/08)
� For five years, Georgia has ranked seventh in the top ten pro-business states (Pollina Corporate Real Estate, 5/08)
� Six Georgia companies made the list of the 50 fastest growing, women-owned companies in the U.S. (Entrepreneur.com, 11/08)
CNBCTop States for Businesses
8 Overall
2 Workforce
3 Transportation
9 Cost of Living
14 Access to Capital
16 Technology and Innovation
ForbesBest States for Business
5 Overall
5 Regulatory Environment
6 Labor
6 Growth Prospects
10 Economic Climate
2007
� 98,514 incorporated businesses were started in Georgia; 90,456 were domestic and 8,058 were foreign (State of the State, 2/08)
Expansion ManagementTop Areas for Business Attraction
12 Top 20 Small Counties: Jackson County
13 Top 20 Large Counties: Fulton County
Small Business Survivor Index12 Friendliest Policy Environment for Entrepreneurs
U.S. Census Bureau4 “Lone Wolves” (Non-Employer Businesses)
24 BENCHMARKING COMPETITIVENESS AND COST
OVERALL STATE ECONOMIC COMPETITIVENESS2009
ALEC-Laffer State Competitiveness Index8 Economic Outlook
2008
Pew Trust and Governing MagazineBest Managed States
5 Overall Performance (B+)
13 Infrastructure Management (B)
Forbes3 Alternative Energy from Biomass
AeA Cyberstates12 High Technology Industry
2007
Kauffman Foundation3 Rate of Entrepreneurial Activity
CNBC Best States to Do Business
4 Overall Best State
4 Non-Employer Busienss Growth
4 Entrepreneurship
Corporation for Enterprise Development Development Report Card of the Unites States
C Economic Development
C Business Vitality
C Development Capacity
BENCHMARKING COMPETITIVENESS AND COST����0"
The 19th annual State of Logistics Report by the Council of Supply Chain Management Professionals estimated total U.S. logis-tics costs in 2007 grew to nearly $1.4 trillion, an equivalent of 10.1 percent of U.S. GDP.
Truck transportation costs, warehousing costs and taxes, depreciation, obsolescence, insurance and interest represent the biggest cost components.
LOGISTICS & BUSINESS COSTS 7Q�]9?9Q���9�]'#�wholesale inventories have started to increase as re-tailers have tightened their inventories. This puts warehousing costs in the forefront of logistics costs. The number of commercial warehouses in ����_�'������������������5#$$$������4��� ����������������������������+��������������������������������0$$������������������������������������-tutes one-third of total U.S. warehousing.3
Data Source: CSCMP 19th Annual National State of Logistics Report
According to the Georgia World Trade Numbers compiled by WorldCity, the state’s international trade figures totalled an impressive $93.8 billion in 2008: $33.6 billion in exports and $60.2 billion in imports.
Although 2008 volumes were lower across the country (the Ports of Los Angeles and Long Beach reported a 40 percent de-crease in February 2009), Georgia is still poised to top many categories and lead the country in efficiency, reliability and growth of its logistics industry and international trade.
Georgia’s top ten trad-ing partners also position Georgia in the top ten nationally. Seven of these partner-ships demonstrated double digit positive growth.
Please note that these figures are for all modes of transport, including air and sea.
Top Export Commodities by Value, 2007
Georgia’s U.S. Ranking1 Chemical wood pulp
2 Cotton
3 Regional jet parts
GEORGIA’S TOP TEN
TOP INTERNATIONAL TRADING PARTNERS, 2007
2007Ranking Country
GA’s US Ranking Total Trade 2007
Change from 2006
1 China 6 $18,353,596,629 17.15
2 Germany 4 $8,052,051,332 14.29
3 Japan 9 $7,739,599,996 -6.22
4 South Korea 6 $4,677,087,001 7.41
5 United Kingdom 7 $4,636,599,403 10.50
6 Ireland 3 $3,484,443,215 4.67
7 Australia 2 $3,108,564,338 18.15
8 Italy 4 $3,001,079,441 23.42
9 Malaysia 6 $2,788,381,841 16.89
10 France 9 $2,530,175,497 32.29
Source: 2008 Georgia Trade Numbers by WorldCity
TOP EXPORT COMMODITIES BY VALUE, 2007
Ranking Top ExportGA’s US Ranking Total Trade
Change from 2006
1 Regional jet parts 3 $2,561,541,998 32.71
2 Motor vehicles for trans. people 10 $1,585,236,669 20.58
3 Chemical wood pulp, not dis-solving grade
1 $1,277,907,249 32.14
4 Aircraft 7 $1,139,055,665 47.59
5 Aircraft parts 8 $941,827,773 3.76
6 Medical instruments 6 $929,385,295 17.42
7 Cotton, not carded or combed 2 $853,287,466 30.33
8 Electrical equipment for line telephony
11 $817,191,242 -1.91
9 Motor vehicles for trans. goods 5 $691,035,909 -16.18
10 Computers 12 $663,180,819 -10.47
Source: 2008 Georgia Trade Numbers by WorldCity
4 International Trade and Activity
28 INTERNATIONAL TRADE AND ACTIVITY
TOP IMPORT COMMODITIES BY VALUE, 2007
Ranking Top ImportGA’s US Ranking Total Trade
Change from 2006
1 Motor vehicles for transporting people
11 $4,558,593,206 -2.54
2 Medicine 5 $4,343,715,086 25.42
3 Computers 6 $3,568,728,165 48.1
4 Oil, not crude 14 $1,360,026,099 5.71
5 Motor vehicle parts 9 $1,359,289,483 24.01
6 Electric equipment for line telephony
10 $1,277,381,122 64.02
7 Furniture, parts 4 $1,188,595,134 17.07
8 Petroleum gases, other gaseous hydrocarbons
9 $1,146,856,044 8.17
9 Self-propelled heavy construction equip-ment
1 $896,231,609 -35.51
10 Regional jet parts 4 $830,069,791 -8.15
Source: 2008 Georgia Trade Numbers by WorldCity
SEA CARGO TRADE PROFILE
TEU GROWTH CHART, 1991-2008GEORGIA PORTS AUTHORITY
PDK Atlanta DeKalb Peachtree 21,960 - AGS Augusta Bush Field 2,704 16,117
MCN Macon Lewis B Wilson Int. 1,822 1,282
QQT Peachtree City Peachtree City-Falcon Field 1,252 -
Total 788,447,304 549,516,711
IN COMING AIR CARGO (DEPLANEMENT) , 2007‒2008*
Airport
2007 Total Freight (LBS)
2008* Freight (LBS)
ATL Atlanta Hartsfield-Jackson 918,985,148 621,309,328
ABY Albany Albany Dougherty County 35,200,425 24,939,956
SAV Savannah Savannah / Hilton Head 9,664,801 6,473,511
CSG Columbus Columbus Metropolitan 289,507 60,513
VAD Valdosta Moody Air Force Base 101,200 -
AGS Augusta Bush Field 68,195 39,581
RMG Rome Richard B Russell 26,984 -
AHN Athens Athens Municipal 18,911 7,199
LZU Lawrenceville Gwinnett County 12,928 16,244
GVL Gainesville Gainesville Municipal 10,880 -
PDK Atlanta Dekalb Peachtree 950 1,925
VLD Valdosta Valdosta Regional 662 34
MCN Macon Lewis B Wilson 348 23,714
SVN Savannah Hunter Army Air Field 0 195,704
WRB Macon Robins Air Force Base 0 147,141
Total 964,380,951 653,214,850
* 2008 data consists of January‒September only | Source: www.transtats.bts.gov
Note
Because comparison data is only available through 2005, the following infor-mation is not a current snapshot; rather, it is a look at the historical concentra-tion levels. As we continue to collect data and report on the industry in years to come, we will have more data to identify trends and changes in the state’s industry concentrations.
LEGEND
Region
Coastal
Southeast
Southwest
Central
East
Northeast
Atlanta Area
Northwest
�Q/�89]�<����/�evaluate the economic importance of Georgia’s logis-tics provider industries is to compare the employment and sales share of these industries with that of the nation. The result of this comparison is re-ferred to as a CONCENTRATION INDEX. If the concentration index is >1, it tells us that industry is more concentrated in Georgia than is typical nationally. 7�� ����� ������� ��� ����� ������� ����� �� ��������� ����������� ��� ��#� ����index can be a indication of future industry strength and job growth. The reverse is true for an index value of <1.
*��������������#�������������������������������F�����!�� ������������into relative levels ranging from ���2���������to ���%�����. For analysis purposes, Georgia counties were grouped into regions, as seen below.
GEORGIA LOGISTICS CONCENTRATION - REGIONS
5 Logistics Concentration
34 LOGISTICS CONCENTRATION
LOGISTICS CONCENTRATION INDEX
0�����������������
When this process is applied to three large employment segments of the logistics provider industry, two of the three – Core Transportation and Re-����������������������!�������������������������������������������������In contrast, Core Facilities industries do not present as strong a relative concentration in the state in terms of either employment or sales.
GEORGIA LOGISTICS CONCENTRATION INDEXNATIONAL BY INDUSTRY GROUP, 2005
Employment SalesCore Facilities Average Below Average
Core Transportation Above Average Average
Related Traditional High Above AverageSource: NETS
3�����������������
Regions within Georgia have diverse patterns of concentration for logistics provider activity. The concentration index is not a measure of the overall logistics employment in a region nor logistics employment in a region rela-tive to the state as a whole. Rather, it shows the amount of logistics provid-ers in a region relative to that region’s overall employment.
*����F�����#��������������!��������������������� ����� ���������������������and providers, but when one looks at logistics providers relative to its over-all employment, the concentration is not as great as in some other areas of Georgia.
������������������������������������������������������'���������������#�yet Core and Related Traditional employment is only 1.4 times that of the Southwest. To look at it another way, the Southwest’s Core and Related Traditional providers are almost 3 percent of the region’s total employ-����#�����������������������������������0����������������!�����������������
The South and the Coastal areas are particularly concentrated with Core Transportation and Related Traditional industries. Indeed the Coastal em-phasis on Related Traditional businesses (where the industry also has the highest employment count among the regions) is mostly responsible for the high statewide concentration index for this category. The Northeast also has some concentration in Related Traditional industries. None of the areas have a strong employment or sales focus in Core Facilities, which is particularly underrepresented in the East.
Atlanta was ranked the fifth largest logistics
employer in the United States by Harvard Busi-ness School in 2001.
Cluster Mapping Project, Institute for Strategy and
GEORGIA LOGISTICS CONCENTRATION INDEXBY REGION AND INDUSTRY GROUP, 2005
Employment Sales
0 ‒ Atlanta Area
Core Facilities Average Average
Core Transportation Average Average
Related Traditional Average Average
1 ‒ Northwest
Core Facilities Average Below Average
Core Transportation Above Average Above Average
Related Traditional Below Average Below Average
2 ‒ Northeast
Core Facilities Below Average Below Average
Core Transportation Average Average
Related Traditional High High
3 ‒ East
Core Facilities Below Average Below Average
Core Transportation Above Average Average
Related Traditional Below Average Below Average
4 ‒ Central
Core Facilities Average Average
Core Transportation High High
Related Traditional Average Average
5 ‒ Southwest
Core Facilities Below Average Below Average
Core Transportation High Average
Related Traditional Above Average Average
6 ‒ Southeast
Core Facilities Below Average Below Average
Core Transportation High High
Related Traditional Above Average Average
7 ‒ Coastal
Core Facilities Below Average Below Average
Core Transportation Above Average Average
Related Traditional Very High Very HighSource: NETS
The high concentration observed in the Core Transportation and Related �������������������������������������� �!�������&�����!�����������#�������� ��� � �!�� �!������ ����� ������� ���� ������ ����������� K�������� �������������������� �������������������=���������������������!���� ��!����K���������������������������������������� �������=������F��������������-ther, we will look at what is known as a SHIFT-SHARE GROWTH ANALYSIS in the next section which will illustrate the growth in these logistics provider industries.
LOGISTICS CONCENTRATION 37
Core Facilities, Core Trans-portation and Related Traditional categories constitute 94 percent of the establishments and 86 percent of both sales and employment in the logis-tics provider industry.
SHIFT-SHARE GROWTH ANALYSIS'87*�6'8�]9� �Q�:�'7'� is a common economic tool that decomposes ������������������K������!�����������!�=�����������������%�
NATIONAL GROWTHChange expected due to growth in the overall national economy, not specific to the industry or local economy. Its standardized measures serve as benchmarks.
INDUSTRY GROWTHChange expected due to growth in the industry at the national level, not specific to the local economy. If this growth rate is higher than the national growth rate it implies that the industry in the state is growing faster because of the industry mix (i.e., there is a higher share of faster growing industries in the state).
REGIONAL GROWTHChange that is due to the dynamics of the local economy. Positive val-ues in the Regional Growth indicate where the local economy is com-petitive relative to the national overall economy and industry.
Because of the limitation of available and compatible datasets, this level ���������������������!���� ������0$$"��������������� ��������������������-�����%�?����*��������#�?�����������������������]��������������������������categories constitute 94 percent of the establishments and 86 percent of both sales and employment in the logistics provider industry, however, and should therefore provide valuable data. For clarity, the calculated numeri-cal results were categorized as “‒ ‒�� K������������ ����������������=� ���“++” (indicating more positive growth).
0����������%���
The concentration index for Core Facilities showed low employment and sales concentration. Similar negative growth in Core Transportation was ��&������ �����������������F#������������ �������������������
In contrast to the other two key industries, Related Traditional showed a strong regional growth and its industry mix improved overall performance. ��������������������������������������������������������������F#���������������� �� ������� ������� ������ ����� ��� ������ ������� ������ �����and current needs and not be limited by productivity concerns.
3����������%����
���������������������������������� ��������������������������������������������� ����F� ���� ����?������� ������%���������� ��� ����������������-cialization in Related Traditional establishments, but also a growing base. (The South stands out as a generally growing area.) The data also shows that even though the concentration index and overall growth analysis in this chapter does not cite Core Facilities as regionally growing, there are some areas in the state – particularly the Southeast and the Coastal regions – where it is.
REGIONAL SHIFT-SHARE GROWTH ANALYSIS, 2001-2005
Core Facilities Core Transportation
Related Traditional
LEGEND
Shift-Share Growth
‒ ‒ Decrease
‒ Decrease
+ Increase
++ Increase
+++ Increase
LOGISTICS CONCENTRATION 39
REGIONAL SHIFT-SHARE GROWTH ANALYSIS, 2001-2005
Growth Values
0 ‒ Atlanta Area
Core Facilities ‒Core Transportation ‒Related Traditional +
1 ‒ Northwest
Core Facilities ‒Core Transportation ‒ ‒Related Traditional +
2 ‒ Northeast
Core Facilities ‒Core Transportation ++Related Traditional ++
3 ‒ East
Core Facilities ‒ ‒Core Transportation ++Related Traditional ‒
4 ‒ Central
Core Facilities ‒Core Transportation ++Related Traditional ‒
5 ‒ Southwest
Core Facilities ‒ ‒Core Transportation ++Related Traditional ++
6 ‒ Southeast
Core Facilities +++Core Transportation ++Related Traditional +
7 ‒ Coastal
Core Facilities +Core Transportation ++Related Traditional +++
Source: NETS
THE LOGISTICS INDUSTRY has undergone remarkable improvements �������������������������!�����������������#��������������������������that is smaller in size with higher output per worker – doing things better, faster, cheaper, greener.
GLOBALIZATION AND CAPACITYWHILE PRODUCTIVITY IMPROVEMENTS have generally reduced the ��J����� ���� ��������#��� ��!��� �������������� ���������������&���#� ��� ��������������������������������������!�����7���������������F�����������&�-tuations, general globalization has stimulated a revolution in transporta-tion systems and practices. In many respects, the logistics sector itself has ���� �� ��������� ��������� ���� ��� ���J������� ��� ���J������ ���� �������costs and exposed industries and companies previously protected by trade barriers to higher levels of competition and opportunities for trade. Growth in international trade has fueled logistics growth and will continue to do so, while advances in logistics accelerate global trade. Trade volumes are expanding at more than twice the rate of industrial production (global GDP
Dealing with technological advances and growing organizational complexi-ties demands an adequate supply of skilled workers for the logistics sector. While the share of traditional logistics jobs has decreased nationally as a result of these productivity improvements and the outsourcing of typical in-house activities, jobs have become more challenging, demanding higher wages and more creativity and initiative. The increasing complexity of the global supply chain continues to add new challenges to supply chain man-agement. However, the negative perception of these industries as low-pay ���������������������������������������������������������������������-ers.
6 Productivity Factors The cost of freight logistics in the U.S. was $1.4 tril-lion in 2007; equivalent to 10.1 percent of GDP, according to CSCMP’s 19th Annual State of Logistics Report. Even though this is an improvement from its decade-low 8.6 percent in 2003, it remains below the 17.9 percent of GDP reached in 1980. According to the report, fuel prices “are the largest single factor affecting the transportation segment.”
Air cargo growth is expected to expand at an average annual rate of 5.8 percent during the next two decades, with a three-fold increase in worldwide air freight, according to The Boeing Company’s World Air Cargo Forecast 2008/2009.
Taking into account only confirmed terminal expansion projects, the Annual Review of Global Container Terminal Opera-tors 2008 (Dewry Shipping Consultants), estimates that by 2013 container throughput will exceed available capacity.
42 PRODUCTIVITY FACTORS
Deregulation and Cost Pressures
The deregulation of the aviation, rail, motor carrier and maritime shipping ����������� �!��� ���� ����� ������6!�� ������ ������� ���� ����� ��� ����������of new competitors, creating an environment that spawned innovative, ef-���������������� ���������������������!������������������������������������������������ ���J�����������������������������������&��������������-tion.
Concerns for the environment and energy conservation have further affect-�����������������������������������������������6����������������������!�� ����� ����� ��� �� ����� ����� �� ��������!�� ���������� ��� �� ���������#�railroads have experienced a comeback. Class I freight railroads have aver-���������"������������������������������!�������#���������0���������������4}�$���������������������������������������]����������
Increasing supply chain management complexities, rapid advances in technology and cost pressures have further fueled growth in the area of third-party logistics (3PL) providers. Outsourcing or off-shoring the man-agement of logistics services beyond transportation allows companies to �������������������������������������������������������#�����������������-ing them wider access to expertise and the latest logistics and information technology products (IT=��������!��������������F�������������������������activity is the continued emergence of more non-asset based fourth-party logistics providers that are managing multiple 3PLs and even more complex IT needs.
“Outsourced logistics partnerships are taking companies to places they’ve never been before – both in terms of emerging logistics markets as well as the level of supply chain complexity and strategy necessary to meet ever-�������� ��� ��� ��������� ��� ���������� ����� �����inclined to partner with multiple niche logistics provid-�������������������F����������������!�������#�����������regions, or service capabilities – their supply chains are �!��!��������������6���������������#���������� �������-ous transportation and logistics contracts from raw mate-rials procurement to domestic point of consumption.”
logistics companies have optimized the use of cur-rent resources, primarily truck-oriented, and in or-der to gain the next level of savings for customers, must seek to incorporate
multi-modalism.
John W. McCurry ”Global Sourcing Casts
Logistics In A New Light.” Site Selection Magazine,
September 2004
PRODUCTIVITY FACTORS 43
Even with these changes, the provision of logistics services remains in es-��������������������������!����!��������������#����!���������������-tion to ensure the creation of the maximum value added in the economic system. In turn, this spurs even more demand for additional logistics activ-ities and services. The overall logistics activity of a state is therefore more than just trucking or rail companies and similar providers of logistics ser-vices, but also encompasses the users of logistics services. The DERIVED DE-MAND characteristic of logistics services implies that the health and future of the sector is integrally linked with the performance of the overall economy. /�����������������������������������������������������!�������!���������in a state or nation’s GPD%�������������!�����������#���������������������circulation due to producer and consumer demands. Consequently, as state and national economies go, so goes the logistics sector.
EDUCATION AND TRAINING: A FOUNDATION FOR PRODUCTIVITYThe map and summary table below show the quantity and location of the many education and training resources available in Georgia. These include �}��������������������������������������������#�4}��������������~�����������������������������#�4"�������������!���������������������� �������a major and 27 offerings of classes with logistics-related topics, but no ma-~���������������������������������� ����������������������~�������������others do not have a physical presence in Georgia but instead are offered virtually.
As State and National economies go, so goes the logistics sector...
44 PRODUCTIVITY FACTORS
LOGISTICS CERTIFICATEAlliance Tractor Trailer Training Center Altamaha Technical CollegeAthens Technical CollegeAtlanta Technical CollegeAugusta Technical CollegeBainbridge CollegeColumbus Technical CollegeCoosa Valley Technical CollegeDarton CollegeDeKalb Technical CollegeEast Central Technical CollegeFlint River Technical CollegeAlbany Technical CollegeCentral Georgia Technical CollegeDevry University GeorgiaEmbry-Riddle Aeronautical Univ Georgia Virtual Technical CollegeGriffin Technical CollegeHeart of Georgia Technical CollegeLanier Technical College
Macon State CollegeMiddle Georgia Technical CollegeMoultrie Technical CollegeNorth Georgia Technical CollegeNorth Metro Technical CollegeNorthwestern Technical CollegeOgeechee Technical CollegeOkefenokee Technical CollegeSandersville Technical CollegeSavannah Technical CollegeSouth Georgia CollegeSouth Georgia Technical CollegeSoutheastern Technical CollegeSouthern Polytechnic State UniversitySouthwest Georgia Technical CollegeUniversity of PhoenixValdosta Technical CollegeWest Central Technical CollegeWest Georgia Technical College
LOGISTICS MAJOR OR CONCENTRATIONAlbany State University American InterContinental University - Buckhead American InterContinental University - Dun-woody Clayton State UniversityCoastal Georgia Community CollegeGeorgia College & State UniversityGeorgia Military College - Robins AFBGeorgia Southern UniversityAlbany Technical College
Central Georgia Technical CollegeClark Atlanta UniversityEmbry-Riddle Aeronautical UnivGeorgia Institute of TechnologyGeorgia Institute of TechnologyGeorgia Virtual Technical CollegeMacon State CollegeMercer University Southern Polytechnic State UniversityUniversity of Phoenix
LOGISTICS CLASSES, NO MAJORArgosy University-Atlanta Campus Columbus State UniversityDalton State CollegeDevry University - GeorgiaEmory University Georgia State UniversityKennesaw State UniversityPaine College
Reinhardt College Savannah State UniversitySouth UniversityTroy UniversityUniversity of GeorgiaUniversity of West GeorgiaWesleyan College
A few of these programs offer both a certificate and a major and three others do not have a physical presence in Georgia but instead are offered virtu-
ally.
PRODUCTIVITY FACTORS����V"
CLASSES WITH LOGISTICS-RELATED TOPICS, NO MAJORAbraham Baldwin Agricultural CollegeAgnes Scott College Armstrong Atlantic State UniversityAshworth UniversityAtlanta Christian College Atlanta Metropolitan CollegeAugusta State UniversityBauder College Berry College Brenau University Brewton-parker College Brown Mackie College - Atlanta East Georgia CollegeEmmanuel College Fort Valley State UniversityGainesville State CollegeGeorgia Gwinnett CollegeGeorgia Highlands CollegeGeorgia Perimeter CollegeGeorgia Southwestern State UniversityGordon College
Gwinnett College Herzing College - Atlanta ITT Technical Institute Lagrange College Life University Mercer University In Atlanta Middle Georgia CollegeMorehouse College North Georgia College & State UniversityOglethorpe University Piedmont College Savannah River College Shorter College Thomas University Toccoa Falls College Truett-mcconnell College Valdosta State UniversityWaycross CollegeWestwood College Young Harris College
SALES PRODUCTIVITY: SMALL ESTABLISHMENTS��*�7]:��'7+\:9�method to gauge productivity is to compare the total sales generated by an industry sector with its level of employment, return-ing a ratio of sales per employee. Reviewing this sales productivity ratio for small to mid-size businesses is often used to forecast industry growth; these businesses contribute to the dynamism of an industry by creating higher-paying jobs, providing opportunities for career employment and exporting and investing in the future through research and development.
In the private economy overall, high productivity is usually concentrated with mid- to large size companies. However, there are several logistics pro-vider categories that show a higher level of productivity in the very small establishments, such as Core Facilities and especially the Related Tradi-tional sectors. Overall, Related Traditional industries appear to be the most productive businesses in the sector and are above the overall private indus-try average as well.
46 PRODUCTIVITY FACTORS
SALES PRODUCTIVITY BY INDUSTRY CATEGORY, 2006THREE-YEAR AVERAGE OF SALES PER EMPLOYEE
Related Enabling $110,540 $186,393 $115,095 $160,102
Related Traditional $188,228 $128,880 $101,934 $106,620
Support $123,005 $101,596 $162,304 $136,189
All Logistics Providers $113,679 $115,712 $111,979 $113,762
All Private Industries $94,288 $136,418 $151,798 $138,840Source: NETS
LABOR PRODUCTIVITY: TRANSPORTATION & WAREHOUSING
SOUTHEASTERN UNITED STATES, 2006
S.E. Ranking State GDP Per Job U.S. Ranking1 Tennessee $70,474 16
2 Kentucky $69,012 17
3 Georgia $66,839 214 Virginia $64,041 27
5 Alabama $61,865 35
6 Florida $61,360 36
7 Mississippi $58,993 39
8 North Carolina $56,721 42
9 South Carolina $54,791 43
50-State Average $66,855
Source: Bureau of Economic Analysis
UNITED STATES, 2006
Ranking State GDP Per Job1 Alaska (trucking) $170,963
2 Wyoming (rail) $129,402
3 Nebraska $97,139
4 Montana $81,896
5 North Dakota $77,768Source: Bureau of Economic Analysis
Georgia ranks third in the Southeast and twenty-first in the nation for private
GDP per full- and part-time jobs in transportation and warehousing, with a GDP per job level almost ex-
actly the national average.
LEGEND
Region
North Central
East Central
Inland Coastal
Coastal
South East
West Georgia
Mountain
�89�Q_+39]'��Q�:��9��in this report have been direct establishment, employment and sales data solely for the logistics industry. However, it is also important to know what impact the logistics industry has on other segments of the economy, as well as the state as a whole. This is known as economic impact and generally describes the quantity and type of jobs and dollars dependent on the industry. This economic impact calculation and the process used to obtain it is widely recognized and has been performed on practically every industry and sub-industry nationwide.
NOTE: Data required to perform this impact mod-eling is available only up to 2006, thus the results in this chapter are represen-tative of that year.
48 ECONOMIC IMPACT OF LOGISTICS PROVIDERS
STATE AND REGIONAL IMPACT_�7:7�7Q���89�?�:?_:��9��number of direct logistics provider jobs in the logistics industry, the total economic impact of these enterprises was calculated for the state and for seven sub-regions of Georgia. This econom-ic impact determination and modeling was accomplished using a widely respected and nationally recognized tool called IMPLAN�K7������������������Planning). It was created at the University of Minnesota in 1989 and has been a standard tool for impact modeling ever since.
The IMPLAN������6����������������������!��������������������������-������������������������������!�������������%
� Impact of employment on that of other industry sectors
� Economic impact of gross regional output (GDP by state)
� Total value of labor income and total jobs
� Total value of proprietor’s income
� Economic impact of value-added
STATE AND REGIONAL IMPACT OVERVIEW, 2006
RegionEmploy-ment
GDP by State
Labor Income
Proprietor’s Income
Value Added
Mountain 13,199 $1,706 $532 $67 $765
North Central 85,432 $11,438 $4,369 $489 $6,221
West 11,573 $1,308 $432 $96 $667
East Central 4,049 $484 $163 $18 $240
Inland Coastal 3,860 $427 $129 $25 $184
Southeast 9,540 $1,457 $448 $102 $652
Coastal 11,651 $1,581 $539 $40 $779
Total 139,304 $18,400 $6,642 $836 $9,507
* All dollar amounts are in millions of 2007 dollars
EMPLOYMENT IMPACT
The IMPLAN model estimated direct logistics provider employment at about 5$#$$$����������������!�������������������!�������������������������� �����������������������������������������������������������"}#$$$�~� �#��������� ������!��� 4�}#$$$� ~� ������������������������ ��������������upon logistics providers statewide. That is a job multiplier of 1.74, or for ev-����4$$$�����~� ��������� ��������������!�����#����������������V$�~� ���������������������������������������������������������������������������multiplier in tourism is about 1.3, the contribution of logistics providers to ��������������������������������������
STATE AND REGIONAL IMPACT OF LOGISTICS PROVIDERS
Employment ImpactAdditional 740 jobs per 1000
GDP by State ImpactAdditional $640,000 per $1 million
Statewide Labor ImpactAdditional $590,000 per $1 million
Proprietor’s Income Impact$836 million
Value Added Impact$9.51 billion
ECONOMIC IMPACT OF LOGISTICS PROVIDERS 49
GDP BY STATE IMPACT
The direct GDP by state, or the direct total value of all output of logistics ���!�����#������44�0� ������� ���0$$������������������0�5����������� ������state GDP�K��}@�"� ����������0$$�=�����������������������������������������sectors of the economy for a total impact of $18.4 billion. The total output of logistics providers and those dependent on logistics providers accounted ����"�����������GDP by state. In the case of the output impact of logistics providers, the output multiplier was 1.64, or for every $1 million in new services produced by logistics providers, the other sectors in the state’s ������������ �����������������@V$#$$$�����������������������������������Z�for example, the retail services multiplier is only about 1.4.
STATEWIDE LABOR INCOME IMPACT
Statewide, direct labor income from logistics providers was $4.2 billion in 0$$��������������������� �� ��� ����������������� ����� ������ �� ��� ����������������@�@� ���������������������������� �����������������������4�"}����#�����!�����4�$����������������������������!�������� ��������#��������� ������������������������ �����������������"}$#$$$�
PROPRIETOR’S INCOME IMPACT
The IMPLAN proprietor’s income measurement simply shows the income of business owners. This is not a measure of the return to the investors in capital, but the income of the owners of business enterprises. Statewide, lo-����������!������������������������������������ �����"4@������������0$$��dollars. With a multiplier of 1.62, the total economic impact equaled $836 million.
VALUE-ADDED IMPACT
The other measures of economic activity reported from the IMPLAN analysis are essential sub-components of the estimated GDP by state. Value added is simply a calculation of the difference between the cost of material and ���!��������������������������������������������������������������������'��������#�����������!����������� ��������������!�����������"��� ����������0$$���������#����������������������!����}�"4� �������
REGIONAL EMPLOYMENT MULTIPLIERSEMPLOYMENT MULTIPLIERS DIFFER between regions and for regions compared to the state. For example, statewide the employment multiplier was 1.74. The large employment multiplier in the Southeast region, 1.82, explains why the region, which is smaller in terms of direct employment, is larger in the percent share of logistics provider employment.
����F�����#���!�������������������F�����������������#�����Q�����?��-tral region had the second largest employment multiplier at nearly 1.78.
"$����ECONOMIC IMPACT OF LOGISTICS PROVIDERS
The Coastal region’s employment multiplier was closest to the state aver-age of 1.74, suggesting that it, like the North Central economy, contains logistics service specialists that also serve other regions.
EMPLOYMENT MULTIPLIER BY REGION
1.35 1.4 1.45 1.5 1.55 1.6 1.65 1.7 1.75 1.8 1.85
Mountain
North Central
West Georgia
East Central
Inland Coastal
Southeast
Coastal
CROSS-INDUSTRY IMPACT�89�+_:�7\:79]'�+9�'_]9�the linkages of the logistics providers to the dependent sectors of the economy. Because of these linkages, a variety of jobs are created across diverse sectors within each regional economy. The table below compares the three impact measures of employment, GDP
by state and labor income side by side.
CROSS-INDUSTRY IMPACT OVERVIEW, 2006
Industry Employ-ment
GDP by State
Labor Income
Logistics 52% 51% 57%
Agriculture, Mining and Utiliities 1% 1% 1%
Manufacturing and Construction 5% 13% 7%
Retail Trade 6% 3% 4%
IT and Professional Services 22% 22% 23%
Educational, Health and Other Services 10% 5% 7%
Government and Non-Profit 4% 5% 2%
ECONOMIC IMPACT OF LOGISTICS PROVIDERS����"4
IMPACT BY SECTOR
EmploymentOutside the logistics indus-try, the highest employ-ment impact was found in the it and Professional Services sector with 22 percent of dependent jobs created
LaborOnly 43 percent of the total labor income impact spilled over into non-logis-tics industries.
GDP by StateThe logistics-dependent manufacturing and con-struction sector contribut-ed 13 percent of total GDP by state. This is a potential indicator of higher than average productivity for logistics dependent manu-facturing and construction establishments.
$���%�����'�������%�&�����
The high percentage of information technology (IT)–related logistics de-��������~� �����!��������������������IT-related services industry is among the economy’s largest and fastest sources of employment growth, increas-���� ��@4@#$$$��������_�'�������4}}V60$$V�K���5����������������������rate). The chart below also provides a snapshot of the types of high salary ranges associated with this industry.
This section illustrates that only 43 percent of the total labor income im-pact spilled over into non-logistics industries. This reveals a larger relative labor income percentage when compared with employment for logistics ���!������K��������������"0���������#���������"������������ ��������=�
STATEWIDE TOTAL LABOR INCOME BY INDUSTRY SECTOR
2%
7%
23%
4%
57%
7%
1%
Government and Non-Profit
Educational, Health and Other Services
Information Technology and Professional Services
Retail Trade
Logistics Industry
Manufacturing and Construction
Agriculture, Mining, Utilities
6*#��%�&�����'�������%�&�����
The GDP� �����������0$$��������}@�"� �������K���� �����!�������������=����������#�����������������!���������������������������������������������������������� ����"��������������������������������������������� ����#�V}�percent of this output spilled over to non-logistics sectors.
STATEWIDE TOTAL GDP BY STATE BY INDUSTRY SECTOR
0% 10% 20% 30% 40% 50% 60%
Government and Non-Profit
Educational, Health and Other Services
Information Technology and Professional Services
Retail Trade
Logistics Industry
Manufacturing and Construction
Agriculture, Mining, Utilities
While the logistics-dependent manufacturing and construction sector rep-���������"���������������������������#��������� �����4������������������GDP by state. This is a potential indicator of higher than average productivi-ty for logistics dependent manufacturing and construction establishments.
Note
The information found in this chapter covers mainly the truck and rail move-ment of freight.
While air and sea move-ments are critical to the overall freight picture, they serve as the end points for sending or receiving cargo and as such are covered separately in Chapter Four
8 Georgia’s Freight Flow Profile
THIS REPORT HAS provided an in-depth look at many different aspects of Georgia’s logistics industry. One area that connects all the components and companies in logistics is the freight being moved, stored and/or processed. ����� ������� �����J��� ��������� ����� ��������� ����� IHS-Global Insight’s Transearch database and combines them with a variety of other sources. ��������#�����!��#����~��������������������%�������������������������������part is asking the right questions of the data to create information. This chapter is a summary of Georgia freight movements and presents only a small sample of the possibilities of this data platform.
FREIGHT FLOW DEFINITIONS
IMPORTCargo flowing into a destination in Georgia
EXPORTCargo originating in Georgia and flowing out
INTRACargo that both originates and has a destination in Georgia
THROUGHCargo that neither originates nor terminates in Georgia but passes through using Georgia’s infrastructure
INFRASTRUCTURE HIGHLIGHTS
RoadEach week a combined 12 million tons moves on Georgia’s 1,200 miles of interstate highways and 20,000 miles of federal and state highways. Geor-�����������������F����������������������������#�������������������������-ber one carrier, UPS. Ranked ninth nationally with nearly 450,000 com-mercially licensed Georgia truck drivers, cargo is within two or fewer days from 80 percent of the U.S. industrial and commercial markets.
Georgia is home to six of the top fifty cargo carri-ers, including the world’s number one carrier, UPS.
Cargo is within two or fewer days from 80 per-cent of the U.S. industrial and commercial markets.
54 GEORGIA’S FREIGHT FLOW PROFILE
RailWith nearly 5,000 miles of railroad track and the largest intermodal facil-ity on the east coast, Georgia originates 24 million and terminates over 75 million rail-tons of cargo every year. Georgia has the seventh most total rail �����#������������������������������������������#��������������������������for the number of railroads in a state.
Air������������ ������������������������#�����������8�������6�������7����-national is also the eleventh largest based on cargo, has more than 1.5 mil-lion square feet of cargo handling space and is just one of Georgia’s 144 public and private airports. The airport also allows businesspersons to �����5$���������������_�'�����������������������������&������������������major North American city within four.
SeaThe third largest container port in the nation, the Georgia Ports Author-ity terminal in Savannah handled more than 2.6 million TEUs in 2008 and expects to handle over 4.4 million TEUs by 2018. The Brunswick facility, where automobiles volumes have quadrupled, is the sixth largest auto port in the nation.
GEORGIA LOGISTICS INFRASTRUCTURE, 2009
LEGEND
Logistics Infrastructure
Ports
Airports with Cargo
Railroads
Interstates
Georgia has the seventh most total rail miles, fifth most rail tons terminating in a state, and is ranked
thirteenth for the number of railroads in a state.
GEORGIA’S FREIGHT FLOW PROFILE 55
These projections suggest a nearly 18.2 percent drop in tonnage between 2007 and 2009, when the vol-umes will begin to slowly rebound.
Overall, between 2010 and 2027 these current projec-tions also show a growth of close to 50 percent or a 260 million ton increase, yielding the flow of nearly 800 million tons per year by 2027.
DOMESTIC TRUCK FREIGHT FLOWTHIS SECTION EXPLORES the movement of freight throughout the na-tion via truck. Note that the data discussed does not include movements from Canada nor Mexico, and begins with 2007.
2007 Truck Tons Cargo Value Truck LoadsImport 106,380,868 $385,193,742,854 8,851,234
Export 118,071,185 $336,804,786,682 9,348,563
Intra-GA 226,021,926 $349,311,341,291 23,563,784
Through 190,325,118 $790,803,808,072 10,734,611
Total 640,799,096 $1,862,113,678,898 52,498,193
SOURCE: IHS-GLOBAL INSIGHT INC.
As seen above, there were nearly twice as many movements from origins and destination pairs inside Georgia than any other scenario, followed ������� ����������������&�����������������������������������������������another location. It is also interesting to note the almost double value dif-������� ������������������&������������&����������������������������������primarily due to commodity type and their declared values.
Projected 2007-2027 Truck Freight Flow
SOURCE: IHS-GLOBAL INSIGHT INC.
These projections suggest a nearly 18.2 percent drop in tonnage between 2007 and 2009, when the volumes will begin to slowly rebound. Overall, between 2010 and 2027 these current projections also show a growth of ��������"$�������������0@$��������������������#��������������&�������������800 million tons per year by 2027.
56 GEORGIA’S FREIGHT FLOW PROFILE
County Level Flow Distribution
�������������������������������������������������������!������&���������that Fulton County contributes about 25 percent of the total import ton-nage and Chatham County contributes roughly the same for exports. In total, there are nineteen counties contributing over 1 million tons each to yearly import tonnage, thirteen of which are over 2 million tons. Likewise, ����������������6!��������������� �������!���4�������������������������-ly export tonnage, eleven of which are over 2 million tons.
<����� ������ ��� �� ����� ������#� ���������� �������� &��� �� �������� ������������������������J����������&������!�����7������������������������������������������������������������������������������#�!���������������moves do not coincide. This is due to multiple factors, primarily including
GEORGIA’S FREIGHT FLOW PROFILE 57
LEGEND
Tons
0 ‒ 250,000
250,001 ‒ 1,000,000
1,000,001 ‒ 2,500,000
2,500,001 ‒ 5,000,000
5,000,001 ‒ 24,747,960
SOURCE:
IHS-GLOBAL INSIGHT INC.
the commodity type being moved.
Total Tonnage Distribution, Truck
U.S. CARGO FLOW IN TRUCKLOAD TONS... Originating in the State of Georgia (Export)
Within the State of Georgia (Intra)
Into the State of Georgia (Import)
58 GEORGIA’S FREIGHT FLOW PROFILE
Total Value Distribution, Truck
U.S. CARGO FLOW IN TRUCKLOAD VALUES (US DOLLARS)... Originating in the State of Georgia (Export)
Within the State of Georgia (Intra)
Into the State of Georgia (Import)
SOURCE: IHS-GLOBAL INSIGHT INC.
LEGEND
U.S. Dollars
0 ‒ 500,000,000
500,000,001 ‒ 5,000,000,000
5,000,000,001 ‒ 10,000,000,000
10,000,000,001 ‒ 20,000,000,000
20,000,000,001 ‒ 50,898,579,279
SOURCE:
IHS-GLOBAL INSIGHT INC.
GEORGIA’S FREIGHT FLOW PROFILE 59
LEGEND
Number of Moves
99 ‒ 25,000
25,001 ‒ 50,000
50,001 ‒ 100,000
100,001 ‒ 500,000
500,001 ‒ 1,355,402
SOURCE:
IHS-GLOBAL INSIGHT INC.
Total Movement Distribution, Truck
U.S. CARGO FLOW IN NUMBER OF MOVEMENTS... Originating in the State of Georgia (Export)
Within the State of Georgia (Intra)
Into the State of Georgia (Import)
SOURCE: IHS-GLOBAL INSIGHT INC.
60 GEORGIA’S FREIGHT FLOW PROFILE
Top Truck-Hauled CommoditiesThe tables below show the top commodity types that contributed more �����4�����������������0$$�#������������ ����������������!���������
The top commodity label of Warehouse & Distribution Center is more ac-curately a grouping of commodities, or a category that describes the many ������������������������������������������������������ ��������������This can essentially be thought of as a secondary movement, and thus it is no surprise this grouping is top in both the import and export sides, con-tributing roughly 13 percent and 25 percent respectively.
Million-Ton IMPORT CommoditiesCommodity Truck TonsWarehouse & Distribution Center 12,231,757
Primary Forest Materials 8,663,136
Potassium Or Sodium Compound 5,304,654
Broken Stone Or Riprap 4,812,130
Misc Plastic Products 3,390,530
Liquefied Gases, Coal Or Petroleum 3,270,379
Clay Ceramic Or Refrac Minerals 2,958,089
Nonmetal Minerals, Processed 2,943,060
Metallic Ores 2,569,260
Gypsum Products 2,171,327
Plywood Or Veneer 2,098,626
Petroleum Refining Products 2,092,845
Dressed Poultry, Frozen 1,936,923
Woven Carpets, Mats Or Rugs 1,717,635
Asphalt Paving Blocks Or Mix 1,609,806
Plastic Mater Or Synthetic Fibers 1,534,388
Misc Agricultural Chemicals 1,522,700
Concrete Products 1,505,644
Sugar, Refined, Cane Or Beet 1,475,691
Motor Vehicles 1,381,841
Dressed Poultry, Fresh 1,293,387
Tufted Carpets, Rugs Or Mats 1,282,842
Misc Indus Inorganic Chemicals 1,217,627
Processed Poultry Or Eggs 1,193,238
Motor Vehicle Parts Or Accessories 1,184,618
Cut Stone Or Stone Products 1,123,459
Misc Food Preparations 1,105,126
Misc Fresh Vegetables 1,012,479
SOURCE: IHS-GLOBAL INSIGHT INC.
Note
As mentioned previously, the commodities types
being moved are of great importance. Not only does this data element help
explain tonnage and value differences, but with fur-ther analysis it also allows a better understanding of these commodity-specific
supply chains.
GEORGIA’S FREIGHT FLOW PROFILE 61
Georgia’s ten top trading partner states contribute on average 73 percent of tonnage, dollar value and total movement of cargo flowing both into and out of Georgia.
Million-Ton EXPORT CommoditiesCommodity Truck TonsWarehouse & Distribution Center 22,953,918
Broken Stone Or Riprap 7,890,853
Gravel Or Sand 7,433,254
Primary Forest Materials 5,252,335
Misc. Field Crops 4,830,057
Petroleum Refining Products 3,631,798
Primary Iron Or Steel Products 2,597,768
Chem or Fertilizer Mineri Crude 1,994,207
Misc Plastic Products 1,844,712
Misc Wood Products 1,759,335
Concrete Products 1,674,352
Liquefied Gases, Coal Or Petroleum 1,656,651
Electrometallurgical Products 1,540,291
Soft Drinks Or Mineral Water 1,162,505
Metallic Ores 1,114,347
Misc Nonmetallic Minerals 1,049,007
Prepared Or Canned Feed 1,015,674
SOURCE: IHS-GLOBAL INSIGHT INC.
Top Trading Partner StatesGeorgia sends and receives cargo from nearly every state in the nation. The ������������������������������������������������������������#��������������-cant roles in Georgia’s overall trade by contributing on average, 73 percent ����������#��������!�����������������!��������������&������ �������������out of Georgia.
LA 4,039,827 $10,777,657,567 229,514 3.42 3.20 2.46
CA 3,904,694 $16,120,357,145 209,284 3.31 4.79 2.24
TOP 10 TOTAL 81,624,890 $207,728,967,215 7,370,808
69.13 61.68 78.8450 STATE TOTAL
118,071,185 $336,804,786,682 9,348,563
SOURCE: IHS-GLOBAL INSIGHT INC.
GEORGIA’S FREIGHT FLOW PROFILE 63
LEGEND
Tons
0 ‒ 5,000,000
5,000,001 ‒ 10,000,000
10,000,001 ‒ 20,000,000
20,000,001 ‒ 40,000,000
40,000,001 ‒ 113,555,930
SOURCE:
IHS-GLOBAL INSIGHT INC.
The Roads Most Travelled����������!����������������������&����������������F������������������������routes from point A to point B. The maps below provide this detail and demonstrate the accumulation of cargo tonnage along roads that feed to-gether and then its dispersion as it is siphoned off in multiple directions. ��������� ���������������������������������������������&�����������������then drill-down to show the multiple contributing factors.
TRUCK TONNAGE FLOW, 2007
Total Tonnage Flow
Import Tonnage Flow Export Tonnage Flow
64 GEORGIA’S FREIGHT FLOW PROFILE
Intra Tonnage Flow Through Tonnage Flow
Top Five Import/Export State Truck Flows ��������!��������������������������������������������������������������������� ������������@$������������"$�����������������������������&����������������������!�����������Q�������������������������������������&��������scaled the same.
CALIFORNIAImport From Export To
LEGEND
Tons
0 ‒ 5,000,000
5,000,001 ‒ 10,000,000
10,000,001 ‒ 20,000,000
20,000,001 ‒ 40,000,000
40,000,001 ‒ 113,555,930
SOURCE:
IHS-GLOBAL INSIGHT INC.
LEGEND
Tons
0 ‒ 500,000
500,001 ‒ 1,500,000
1,500,001 ‒ 3,00,000
3,000,001 ‒ 6,000,000
6,000,001 ‒ 12,613,309
SOURCE:
IHS-GLOBAL INSIGHT INC.
GEORGIA’S FREIGHT FLOW PROFILE 65
The top five tonnage origin (import) states are: Florida, Alabama, South Carolina, California and Tennessee.
The top five tonnage destination (export) states are: Florida, North Carolina, South Carolina, Tennessee and Alabama.
LEGEND
Tons
0 ‒ 500,000
500,001 ‒ 1,500,000
1,500,001 ‒ 3,00,000
3,000,001 ‒ 6,000,000
6,000,001 ‒ 12,613,309
SOURCE:
IHS-GLOBAL INSIGHT INC.
FLORIDAImport From Export To
TENNESSEEImport From Export To
ALABAMAImport From Export To
66 GEORGIA’S FREIGHT FLOW PROFILE
SOUTH CAROLINAImport From Export To
NORTH CAROLINAExport To
LEGEND
Tons
0 ‒ 500,000
500,001 ‒ 1,500,000
1,500,001 ‒ 3,000,000
3,000,001 ‒ 6,000,000
6,000,001 ‒ 12,613,309
SOURCE:
IHS-GLOBAL INSIGHT INC.
GEORGIA’S FREIGHT FLOW PROFILE 67
Tonnage is projected to decline roughly 11 percent from 2007 through 2009, and then begin a slight re-covery in 2010. From that point, the current projec-tions are for a 30 percent growth through 2027.
DOMESTIC RAIL FREIGHT FLOWThis section explores the movement of cargo via rail. Many of the details and explanations on the data structure are applicable here as well.
2007 Total Tons Total Value Total UnitsImport 75,476,799 $50,120,112,527 1,207,260
Export 24,346,137 $26,736,299,258 619,019
Intra 13,820,339 $6,358,407,280 244,161
Through 91,161,909 $125,810,308,452 1,702,449
Total 204,805,184 $209,025,127,518 3,772,889SOURCE: IHS-GLOBAL INSIGHT INC.
'���������������&��#������� �����������������������F�����&������������������������������������������������&������������������'������7����������apparent that only approximately 7 percent of the rail tonnage is solely an internal Georgia move, and thus, a majority of the tonnage is either com-ing, going or passing through our State.
�����������&��������������������������������������������������������transport and other sectors of the nation’s economy. Tonnage is projected to decline roughly 11 percent from 2007 through 2009, and then begin a slight recovery in 2010. Following the recovery, tonnage is projected to grow by 30 percent through 2027.
68 GEORGIA’S FREIGHT FLOW PROFILE
County Level Flow Distribution���������������������������������������������������������!������&���������Monroe and Bartow Counties contributing approximately 22 percent and 13 percent, respectively, of the total import tonnage. For exported rail ton-����#�����������!����������������!���������������!���"4���������������tonnage and is roughly distributed at 10 percent per county.
With a closer look at the breakdown of the 7 percent or roughly fourteen-���������������������&�����������������������#������� ������������?�������County is included in all three types of moves. The Counties below repre-sent the top contributors for the various movement types for 2007.
Intra-State Destinations Intra-State Origins Intra-County MovesCounty Tons County Tons County TonsJones 1,833,612 Chatham 5,405,704 Chatham 81,740
Warren 1,771,806 Glynn 1,287,812 Richmond 72,160
Monroe 1,366,076 Richmond 805,732 Wilkinson 9,880
Chatham 1,137,480 Wayne 743,124
Jefferson 1,034,221 Lowndes 506,836
SOURCE: IHS-GLOBAL INSIGHT INC.
Note: The data in this table was uniquely extracted to provide a greater level of clarity and can-not be combined as it would cause double counting of the tonnage
GEORGIA’S FREIGHT FLOW PROFILE 69
LEGEND
Tons
0
1 ‒ 500,000
500,001 ‒ 1,000,000
1,000,001 ‒ 3,000,000
3,000,001 ‒ 16,582,406
SOURCE:
IHS-GLOBAL INSIGHT INC.
Total Tonnage Distribution, Rail
U.S. RAIL FLOW IN TONS... Originating in the State of Georgia (Export)
Within the State of Georgia (Intra)
Into the State of Georgia (Import)
70 GEORGIA’S FREIGHT FLOW PROFILE
Total Value Distribution, Rail
U.S. RAIL FLOW IN VALUE (U.S. DOLLARS)... Originating in the State of Georgia (Export)
Within the State of Georgia (Intra)
Into the State of Georgia (Import)
LEGEND
U.S. Dollars
0
1 ‒ 500,000,000
500,000,001 ‒ 1,000,000,000
1,000,000,001 ‒ 2,000,000,000
2,000,000,001 ‒ 16,034,834,760
SOURCE:
IHS-GLOBAL INSIGHT INC.
GEORGIA’S FREIGHT FLOW PROFILE 71
LEGEND
Number of Moves
0
1 ‒ 15,000
15,001 ‒ 30,000
30,001 ‒ 60,000
60,001 ‒ 294,812
SOURCE:
IHS-GLOBAL INSIGHT INC.
Total Movement Distribution, Rail
U.S. RAIL FLOW IN NUMBER OF MOVEMENTS... Originating in the State of Georgia (Export)
Within the State of Georgia (Intra)
Into the State of Georgia (Import)
72 GEORGIA’S FREIGHT FLOW PROFILE
Top Rail-Hauled Commodities���������������������������&������!����������!������������������"V��������of the import tonnage is coal and another 7 percent are grain products. On the export side, the data shows a combined 34 percent is involved with bulk stone and processed mineral type materials.
2007 Half-Million Ton Georgia Commodities
Coming Into Georgia (IMPORT) Leaving Georgia (EXPORT)Commodity Rail Tons Commodity Rail TonsBituminous Coal 40,921,481 Broken Stone Or Riprap 4,579,455
The third listed commod-ity for both imports and exports is FAK shipments, which stands for Freight All Kinds and is primarily attributed to intermodal
AL 2,673,984 $2,408,255,555 78,752 10.98 9.01 12.72
SC 1,562,700 $1,617,597,142 41,432 6.42 6.05 6.69
TN 1,355,624 $2,225,768,323 52,184 5.57 8.32 8.43
IL 1,173,410 $3,126,211,922 66,448 4.82 11.69 10.73
LA 1,168,132 $2,089,900,243 46,453 4.80 7.82 7.50
NC 1,093,852 $821,696,647 20,436 4.49 3.07 3.30
TX 906,368 $1,425,108,534 30,124 3.72 5.33 4.87
VA 761,692 $432,725,230 10,172 3.13 1.62 1.64
PA 752,148 $1,061,817,659 29,556 3.09 3.97 4.77
TOP 10 TOTAL 17,717,486 $18,785,864,735 482,032
72.77% 70.26% 77.87%50 STATE TOTAL
24,346,137 $26,736,299,258 619,019
SOURCE: IHS-GLOBAL INSIGHT INC.
74 GEORGIA’S FREIGHT FLOW PROFILE
The Tracks Most Travelled����������!������������������������������&����������������F��������������������cargo routes from point A to point B. The maps below provide this detail and demonstrate the accumulation of cargo tonnage along routes that feed together and then its dispersion as it is siphoned off in multilple directions. ��������� ���������������������������������������������&�����������������then drill-down to show the multiple contributing factors.
RAIL TONNAGE FLOW, 2007
Total Tonnage Flow
Through Tonnage Flow
NOTE: The maps shown here for the total and through tonnage are on a different scale than that used for import, export, and intra-Georgia rail freight flow.
This situation was avoided whenever possible, but proved necessary here in order to show a better representation of the distribution of rail cargo flow.
LEGEND
Tons
2,120 ‒ 5,000,000
5,000,001 ‒ 10,000,000
10,000,001 ‒ 15,000,000
15,000,001 ‒ 20,000,000
20,000,001 ‒ 51,511,722
SOURCE:
IHS-GLOBAL INSIGHT INC.
GEORGIA’S FREIGHT FLOW PROFILE 75
Import Tonnage Flow Export Tonnage Flow
Intra Tonnage Flow Intra Tonnage Flow Magnified
Top Five Import/Export State Rail Flows��������!�������������������������������������������������������������� -�������������$������������"$�����������������������������&���������������respective category.
LEGEND
Tons
2,120 ‒ 250,000
250,001 ‒ 500,000
500,001 ‒ 1,500,000
1,500,001 ‒ 3,000,000
3,000,001 ‒ 34,074,563
SOURCE:
IHS-GLOBAL INSIGHT INC.
76 GEORGIA’S FREIGHT FLOW PROFILE
ALABAMAImport From Export To
TENNESSEEImport From Export To
KENTUCKY FLORIDAImport From Export To
The top five origin states (in order of tonnage) are: TN, KY, VA, AL and IN.
The top five destination states for Georgia rail cargo are (in order of ton-nage): FL, AL, SC, TN, IL.
LEGEND
Tons
0 ‒ 250,000
250,001 ‒ 500,000
500,001 ‒ 1,000,000
1,000,001 ‒ 5,000,000
5,000,001 ‒ 18,510,627
SOURCE:
IHS-GLOBAL INSIGHT INC.
GEORGIA’S FREIGHT FLOW PROFILE 77
LEGEND
Tons
0 ‒ 250,000
250,001 ‒ 500,000
500,001 ‒ 1,000,000
1,000,001 ‒ 5,000,000
5,000,001 ‒ 18,510,627
SOURCE:
IHS-GLOBAL INSIGHT INC.
VIRGINIA SOUTH CAROLINAImport From Export To
INDIANA ILLINOISImport From Export To
FREIGHT OPPORTUNITIES - APPLYING THE DATA
International Cargo Connections: Georgia’s Import OpportunityThe following displays cargo destined for Georgia that entered the U.S. from ports outside of the state. This primarily includes water borne cargo, but may also include potential air cargo. While the total amount of cargo falling into this category in relatively small (less than 1 percent of overall tonnage and value), this still presents an opportunity for growth.
78 GEORGIA’S FREIGHT FLOW PROFILE
INTERNATIONAL CARGO FLOW ROUTES IN TRUCK TONSIMPORT TONNAGE FLOW
Top Origins (approx.) TonsBiloxi, MS 567,368
Charleston, SC 409,687
Los Angeles, CA 321,001
Mobile, AL 319,479
Houston, TX 276,192
Jacksonville, FL 237,054
Wilmington, NC 205,633
Fort Lauderdale, FL 153,801
Miami, FL 106,244
New Orleans, LA 97,065
Philadelphia, PA 80,140
San Francisco, CA 54,145
International Cargo Connections: Georgia’s Export OpportunityVery similar to the import opportunity above, Georgia has freight originat-ing here but then leaving the U.S. from elsewhere. This primarily includes water borne cargo, but also may include some air cargo. The grand total of all cargo falling into this category constitutes less than 1 percent of both �������!��������������K$��"�������=�����!�����K$��}�������=�&����������four percent of exported cargo.
LEGEND
Tons
500 ‒ 250,000
250,001 ‒ 500,000
500,001 ‒ 1,000,000
1,000,001 ‒ 2,000,000
2,000,001 ‒ 4,196,471
SOURCE:
IHS-GLOBAL INSIGHT INC.
GEORGIA’S FREIGHT FLOW PROFILE 79
INTERNATIONAL CARGO FLOW ROUTES IN TRUCK TONSEXPORT TONNAGE FLOW
Top Destinations (approx.) TonsNew York, NY 287,644
Jacksonville, FL 194,937
Miami, FL 190,975
Charlotte, NC 147,206
Los Angeles, CA 132,546
Charleston, SC 124,715
Memphis, TN 122,647
Birmingham, AL 121,818
Cleveland, OH 101,891
New Orleans, LA 99,919
San Francisco, CA 89,929
Dallas, TX 83,179
Georgia’s “Corner-Store” Location������������ ������������������������&����������������!�������������-graphic position: much international cargo with an origination and desti-nation outside of Georgia passes through the state en route. The total cargo in this category constitutes a little more than 1 percent of total overall ton-���������V����������������&������������������������
LEGEND
Tons
500 ‒ 250,000
250,001 ‒ 500,000
500,001 ‒ 1,000,000
1,000,001 ‒ 2,000,000
2,000,001 ‒ 4,196,471
SOURCE:
IHS-GLOBAL INSIGHT INC.
80 GEORGIA’S FREIGHT FLOW PROFILE
INTERNATIONAL CARGO FLOW ROUTES IN TRUCK TONSTHROUGH TONNAGE FLOW
Top Origins (approx.) Top Destination States TonsHouston, TX NJ, MD, NH, DE, NY, MA 1,526,805
Charleston, SC CA, TX, FL, AL 820,097
Miami, FL PA, NC, SC, MA, NJ 691,530
Tampa, FL NY, MD, NJ, MA, VA 671,866
Fort Lauderdale, FL NY, NJ, SC 656,814
New Orleans, LA NY, NJ, CT, MD 561,507
New Jersey TX, FL, LA, AL, MS 437,546
Baton Rouge, LA NJ. NY, CT, MD 407,523
Manatee County, FL NY, IL, MA, NJ, OH 218,932
Biloxi, MS NY. CT, MA, NJ, MD 217,586
Mobile, AL CT, MD, NJ, NC, TN 207,247
Los Angeles, CA SC, TN 175,550
Wilmington, NC TX, CA, FL 118,780
Baltimore, MD TX, FL, LA, AL 105,000
Norfolk, VA TX, FL, AL 104,777
Air: The Most Expensive Item to ShipIt is said that air is the most expensive item to ship, as empty movements ������������������������7�����������������������!���������������40�@�million in 2007, or approximately 51 percent of all intrastate truck move-ments. The majority of empty movements are localized within a few coun-ties’ radius of the origin.
#6 #7 #8 #9 #10Origin Cherokee Hall Bibb Carroll Tift
Top Des
tinations
#1 Pickens Fulton Bibb Fulton Tift
#2 Fulton Hall Fulton Cobb Dougherty
#3 Cobb Elbert Chatham Carroll Chatham
#4 Forsyth Forsyth Houston DeKalb Colquitt
#5 Bartow Gwinnett Washington Gwinnett Turner
Total 388,063 289,749 222,682 207,913 206,982
GROWTH OF THE LOGISTICS TECHNOLOGY INDUSTRY�89�\]/�9?�9��?/+\/_Q�9��annual growth rate for supply chain management (SCM=����������������������������0$$����������0$40� �����on a current AMR Research report. The market for SCM technology will grow ������@�"� ����������0$$�������������}�0� ����������0$40�������������������������������� �����!��� �������������������������������������������������will offer opportunities for SCM technology to be adopted. These econom-�� ���������� ������%� ����� ��&�����#� ������� ��������� �����#� �������� ���brand security, and cash preservation.
PROJECTED INDUSTRY GROWTH, 2007-2012
In a recent survey by Logistics Management,� �������� @$� ������� ��� ����participants acknowledged that their investments in SCM technology would remain at current levels, with 21 percent saying that they would increase. The major reasons given for increases were the need for improved visibility to customers, increased delivery speeds, and more updated tools and pro-cesses. The survey also notes that the three most appealing areas of SCM are inventory optimization with 48 percent, warehouse management systems �����V0�������#��������������������������V$��������1
The market for scm tech-nology will grow from $6.5 billion in 2007 to nearly $9.2 billion in 2012.
84 INNOVATION IN LOGISTICS
LOGISTICS TECHNOLOGY REPORT: NORTH AMERICAThe following was extracted from the 2008 EyeForTransport Logistics Technology Report: http://events.eyefortransport.com/logisticstechusa/report.shtml
�87'� ]9\/]�#� ]9:9�'9�� Q�!�� ��� 0$��#� 0$$5#� �������J��� ���� ��-�����������!����$$������������������������������������F����!����������-������������������������:�������#�IBM#�*��9F#������#�\����������+������Logistics. Their responses provide an interesting perspective on the use of IT and technology for supply chains in the current climate and provide in-sight into potential future trends.
Executives agreed almost unanimously (97 percent) that the economic cri-sis was having a negative effect on their business. Despite this, 83 percent �������������������������������������������������������!������������-dent that their business will see growth next year. Executives’ predictions about business growth are closely tied to their plans for technology invest-�������F������%�@�����������������������������F��������������������F��year also plan to increase their investment in technology services and solu-tions, compared with only 23 percent of companies who do not expect to see growth.
Rating the Logistics Technologies
Q���%�]��������������������������������������
MOST USED TECHNOLOGIES
Shippers Providers
50%
56%
72%
Upgrading IT Systems
ERP/MRP
WMS
47%
52%
57%
59%
Visibility Technology
Upgrading IT Systems
WMS
TMS
For Reference
WMSWarehouse Management
Systems
TMSTraffic Management
Systems
YMSYard Management
Systems
ERPEnterprise Resource
Planning
MRPMaterial Requirement
Planning
ITInformation Technology
RFIDRadio Frequency Identification
INNOVATION IN LOGISTICS����5"
BEST ROI TECHNOLOGIES
Shippers Providers
35%
35%
41%
Upgrading IT Systems
ERP/MRP
WMS
33%
37%
WMS
TMS
�������������� ����������������� ����]/7����� �������������������������#�the combined winners for best return on investment were WMS and TMS with Enhancing & Upgrading IT Solutions also gaining a strong portion of the vote.
BEST ROI RESULTS COMBINED
3%
5%
5%
10%
11%
12%
14%
16%
17%
19%
22%
34%
34%
Cargo Security Technology
YMS
RFID
Voice Technology
Forecasting/Event Management
Enhancing and Upgrading Portal
Fuel Efficiency
Wireless and Mobile
ERP/MRP
Visibility Technology
Enhancing and Upgrading IT
TMS
WMS
86 INNOVATION IN LOGISTICS
TECHNOLOGIES MOST IN NEED OF IMPROVEMENT
Shippers Providers
50%
56%
72%
Upgrading IT Systems
ERP/MRP
WMS
47%
52%
57%
59%
Visibility Technology
Upgrading IT Systems
WMS
TMS
The combined votes for technologies needing the most improvement are �������������������������#��F����!���������*������������9!����+�����-ment technologies need the most improvement, with Visibility Technology gaining the next highest amount of combined votes.
TECHNOLOGIES MOST IN NEED OF IMPROVEMENT COMBINED
INNOVATION IN LOGISTICS 87
8������������������%�*��������
���������ROI is a quick and easy measure of a technology product’s effec-tiveness, it is by no means the primary deciding factor for executives mak-ing technology and IT investments. When asked which factors matter most, executives responded as follows
DECISION MAKING FACTORS
GEORGIA CENTER OF INNOVATION FOR LOGISTICS LOGISTICS.GEORGIAINNOVATION.ORG
The Center of Innovation for Logistics is Georgia’s leading resource for ac-celerating logistics growth and competitiveness in the state. The innovation center team connects and works directly with all logistics sectors to identify common problems and innovative solutions. The result is a competitive edge for Georgia companies gained through access to applied university research, product commercialization and matching grant funds. Enhanced ���������� ������������������������������������#��������������!�����connections and resources to address the constant challenges of “The 3 V’s ���:�������%�^�����#�^�����������^��� �������
ATLANTA AIR CARGO ASSOCIATION (AACA)ATLANTAAIRCARGO.COM
METRO ATLANTA CHAMBER LOGISTICS COUNCILLOGISTICSATLANTA.COM
7�� 0$$�#� ���� +����� �������� ?��� ��� ���� ������� �� ��������� ������� ��-�������!�����������������!������������������:��������7���!������?���-cil to attract, grow and retain high value logistics industry companies and ~� ���'����0$$�#�����?��� �������������������������������������������@#$$$����������~� ����������������� �����������������������!��������?��-���� �������������:��������7���!������?��������������������������� ���6practice award from the International Economic Development Council K79�?=����0$$@���������������������������������������*��������������������!���������:������������������
10 Industry Collaboration
}$����INDUSTRY COLLABORATION
GEORGIA MOTOR TRUCKING ASSOCIATION (GMTA)GMTA.ORG
���� �������� +����� �������� ����������� ��� ���� ����� ������J������ ��� ����state that provides full-time service and representation for the trucking in-�������� ���� ����������� ���!��� ��� ���� �!����� ��� ���� �������� ��������� ����������������������������������������+�����������������������������������to make Georgia the best state in the nation in which to base and operate a trucking company.
GEORGIA RAILROAD ASSOCIATION (GRA)GEORGIARAILROAD.ORG
������������]������������������������!���������������J����������������������!����������������������������������������� ���������#�����������������in public debate of public policy issues affecting the industry and to provid-������������������������������� �����������GRA supports safe transporta-tion, economic development and private enterprises. GRA provides a forum for Georgia railroads to share information and to promote knowledge and ��������������������������������������������������#�������������������freight transportation of goods.
INTERNATIONAL FREIGHT FORWARDERS AND CUSTOMS HOUSE BROKERS ASSOCIATION OF ATLANTA (IFFCHBA) 7�����������*�������*��������������?�������8�����3����������������������������������IFFCHBA������������������ ����������NCBFAA. The IFFCHBA
meets monthly to address the current issues faced by the international transportation industry.
INDUSTRY COLLABORATION 91
SAVANNAH MARITIME ASSOCIATION (SMA)SAVANNAHMARITIME.COM
����'�!������+�����������������������������������������������6��������companies dedicated to the development and safety of our port. The SMA
strives to foster cooperation and the exchange of information in order to achieve common goals. The SMA��������������������� ���������������-ticipants in Georgia’s Ports, Federal, State, City, Commercial and Commu-nity organizations. SMA� �����������������!�������������������� ~�-tives for the Maritime Community.
ATLANTA MARITIME ASSOCIATION (AMA)ATLMARITIME.ORG
��������������� ������������+���������������������� ������!��������������-gional international ocean cargo community by offering industry-specif-ic educational events, networking opportunities, and discussion forums which foster growth and excellence. The AMA���������6�����������J������with volunteer leadership. AMA���� ������������������������4$$�����and organizations - containerized, bulk, and break-bulk ocean cargo car-riers, customs house brokers, freight forwarders, motor carriers, NVOCCs,port authorities, warehousing operations, consultants, and other allied ser-vices.
ATLANTA CHAPTER OF THE COUNCIL OF SUPPLY CHAIN MANAGE-MENT PROFESSIONALS (CSCMP) ATLANTACSCMP.ORG
SAVANNAH CHAPTER OF THE COUNCIL OF SUPPLY CHAIN MAN-AGEMENT PROFESSIONALS (CSCMP)The Council of Supply Chain Management Professionals is the preeminent worldwide professional association of supply chain management profes-������������������������ ��������������������'�!������?�����������CSCMP is to provide educational, career development, and networking opportunities to individuals involved in supply chain management.
92 INDUSTRY COLLABORATION
GEORGIA ECONOMIC DEVELOPER ASSOCIATION (GEDA)GEDA.ORG
������������9��������!���������������������������6����������������of professionals and volunteers who are involved with the economic devel-opment of the cities and counties of Georgia. GEDA was organized to in-crease the effectiveness of individuals involved in the practice of economic development in Georgia by encouraging cooperation, exchange of informa-tion, and upgrading of professional skills.
INTERNATIONAL WAREHOUSE AND LOGISTICS ASSOCIATION (IWLA) IWLA.COM
IWLA is a trade association of warehouse logistics providers that helps mem- ������������6�������#������ ��� �����������IWLA focuses on the warehouse logistics business, providing ideas and information that make it easier for member companies to succeed.

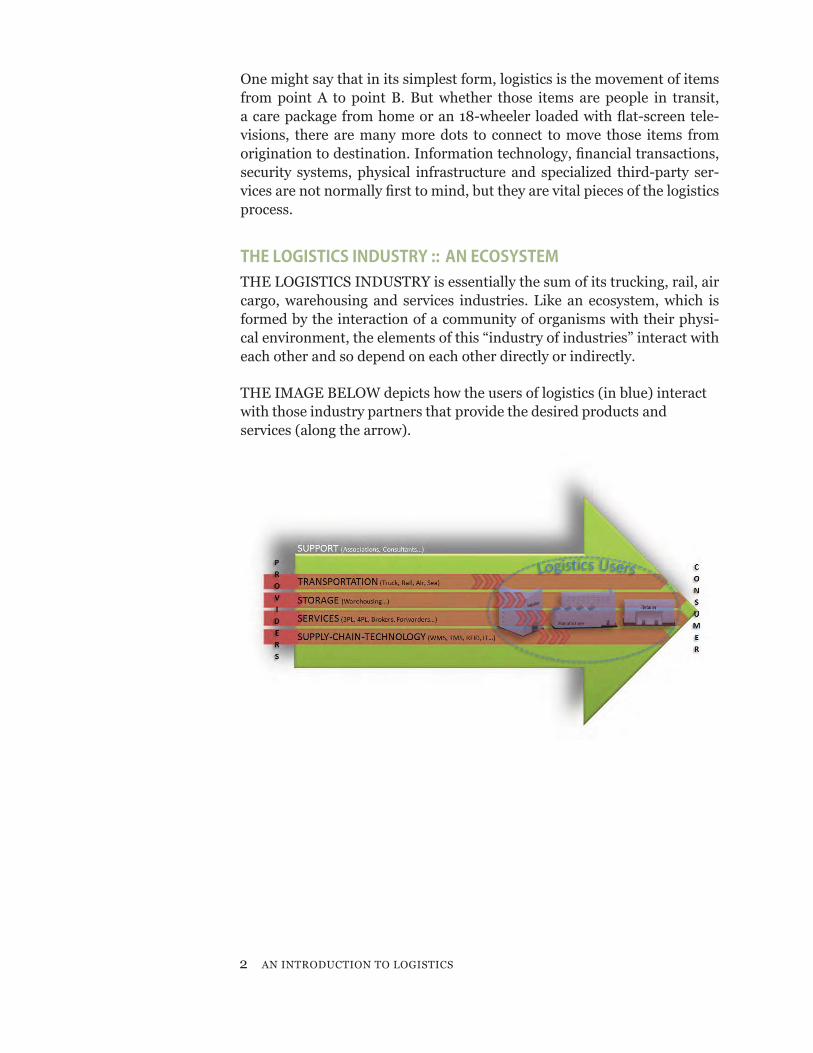


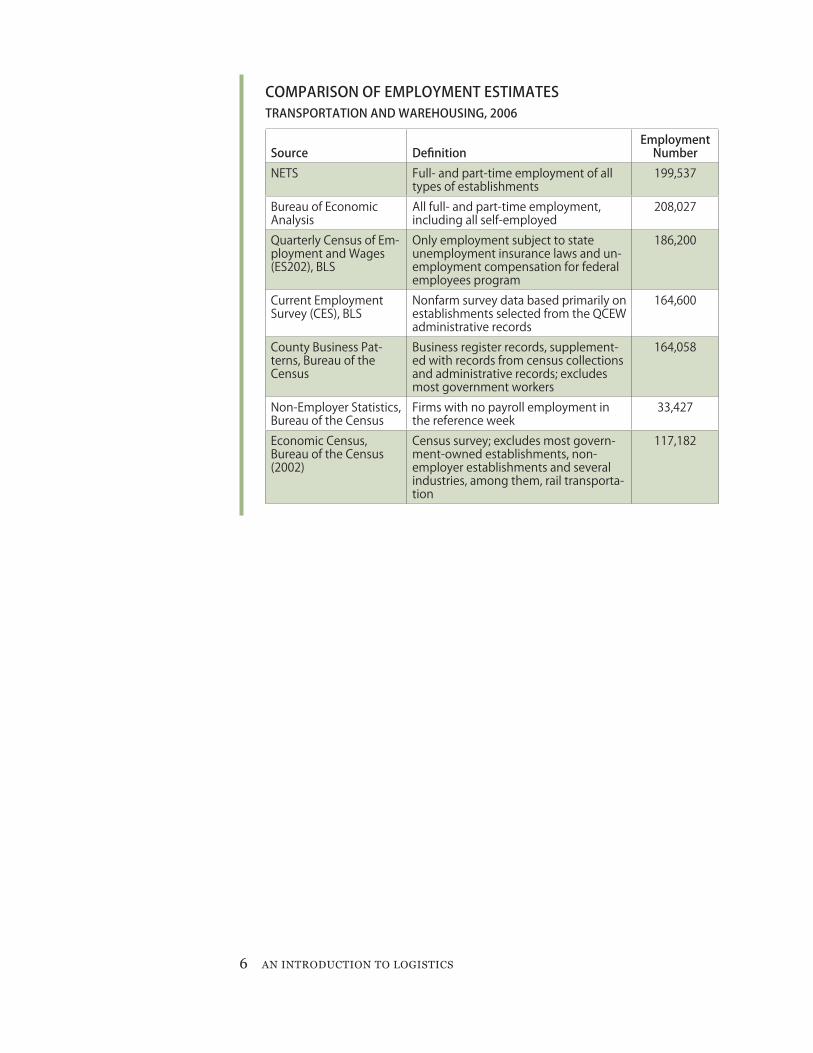


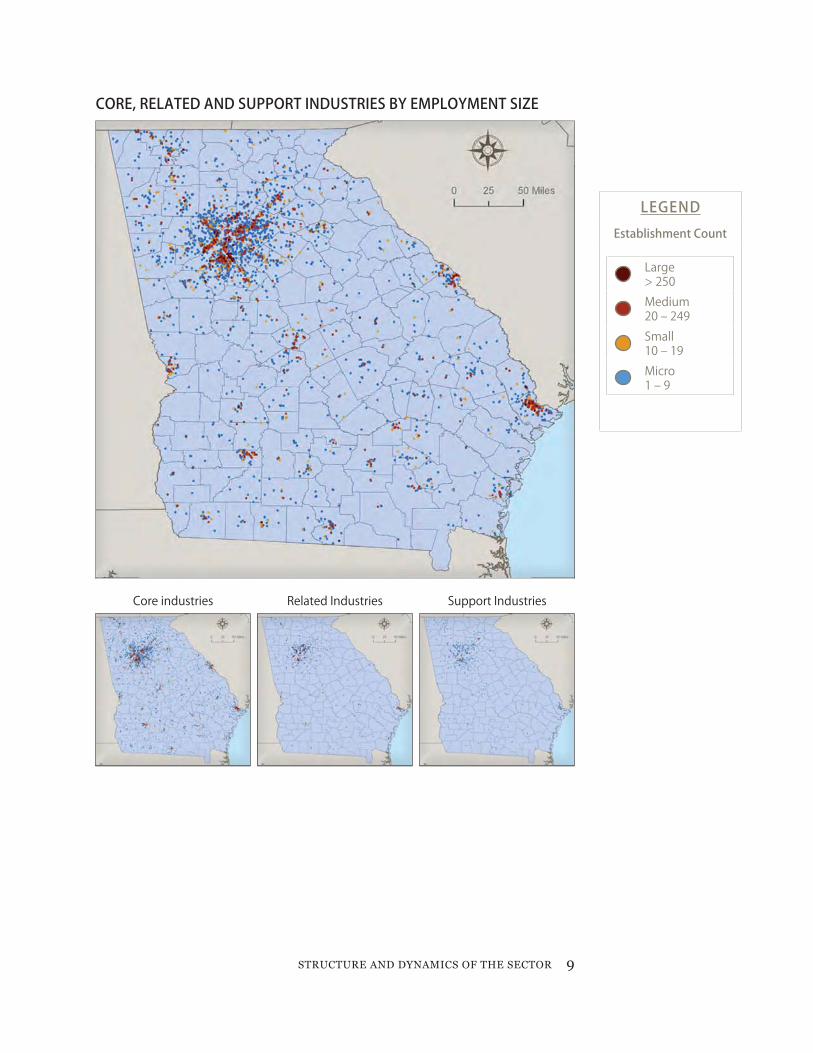
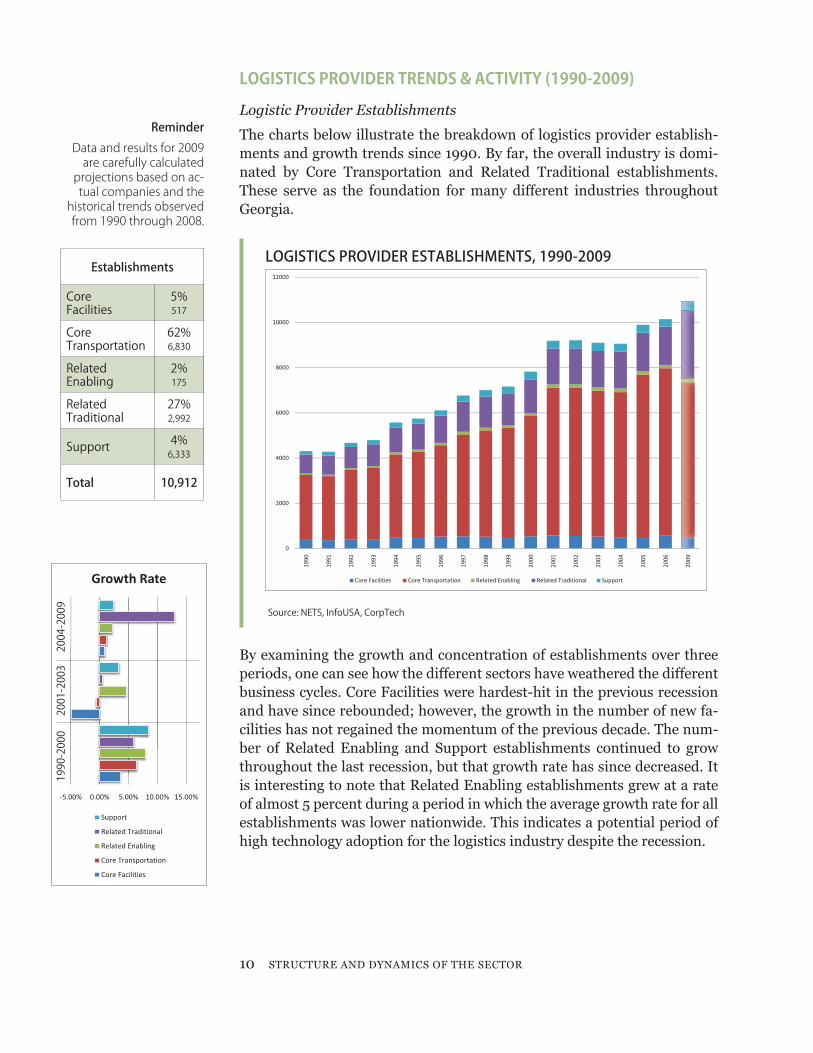


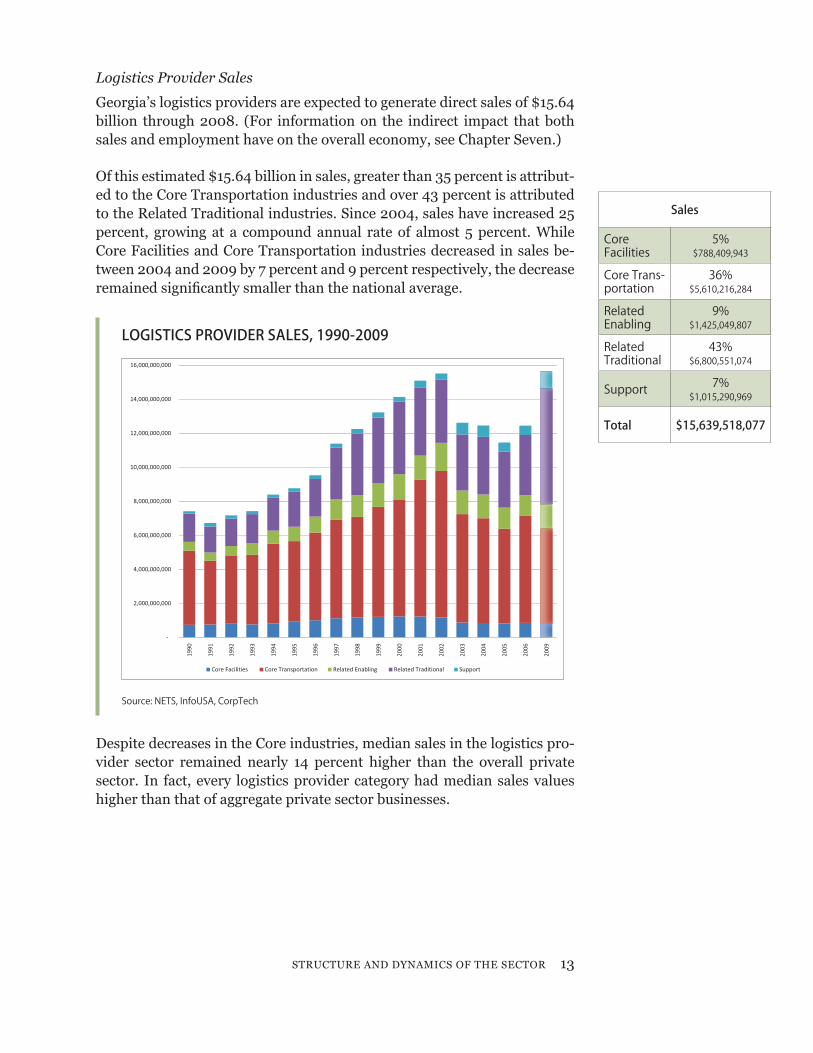
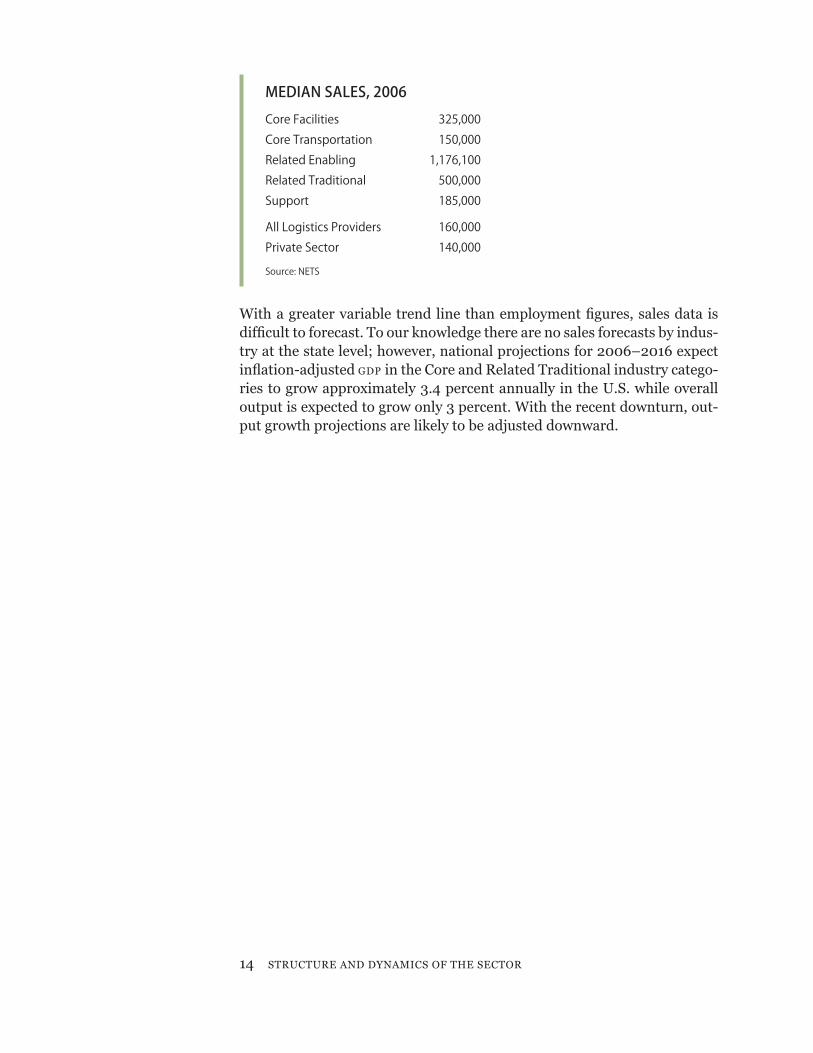


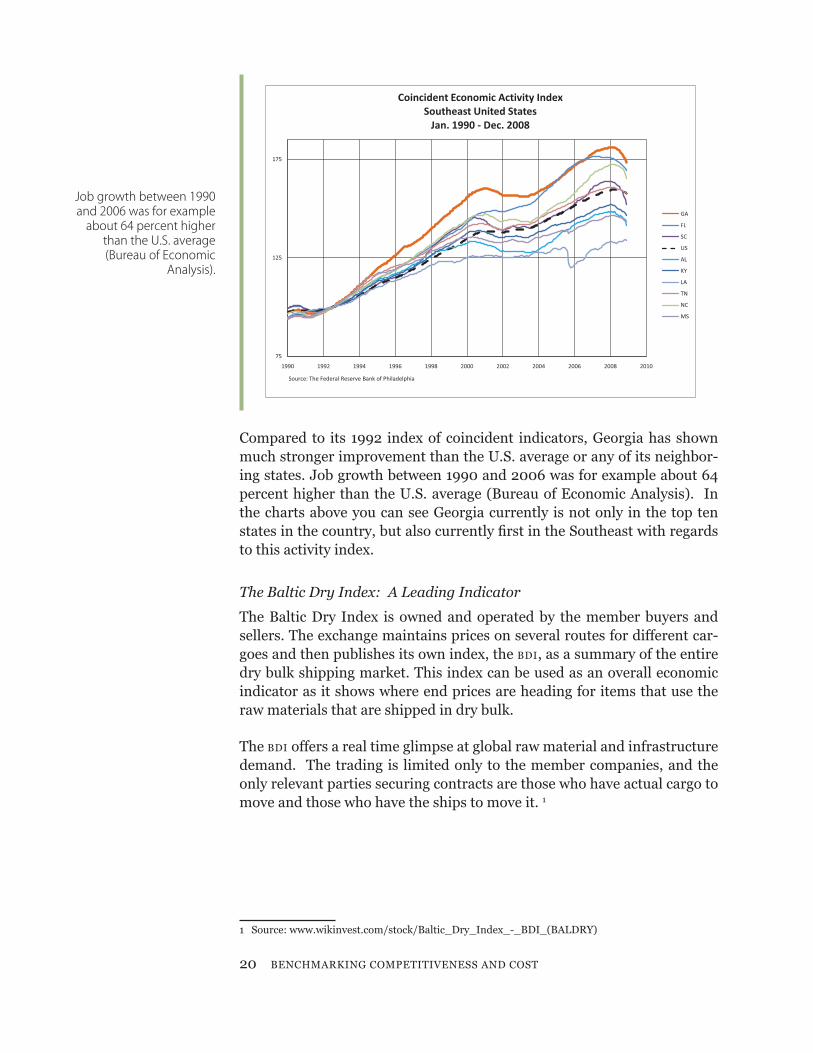
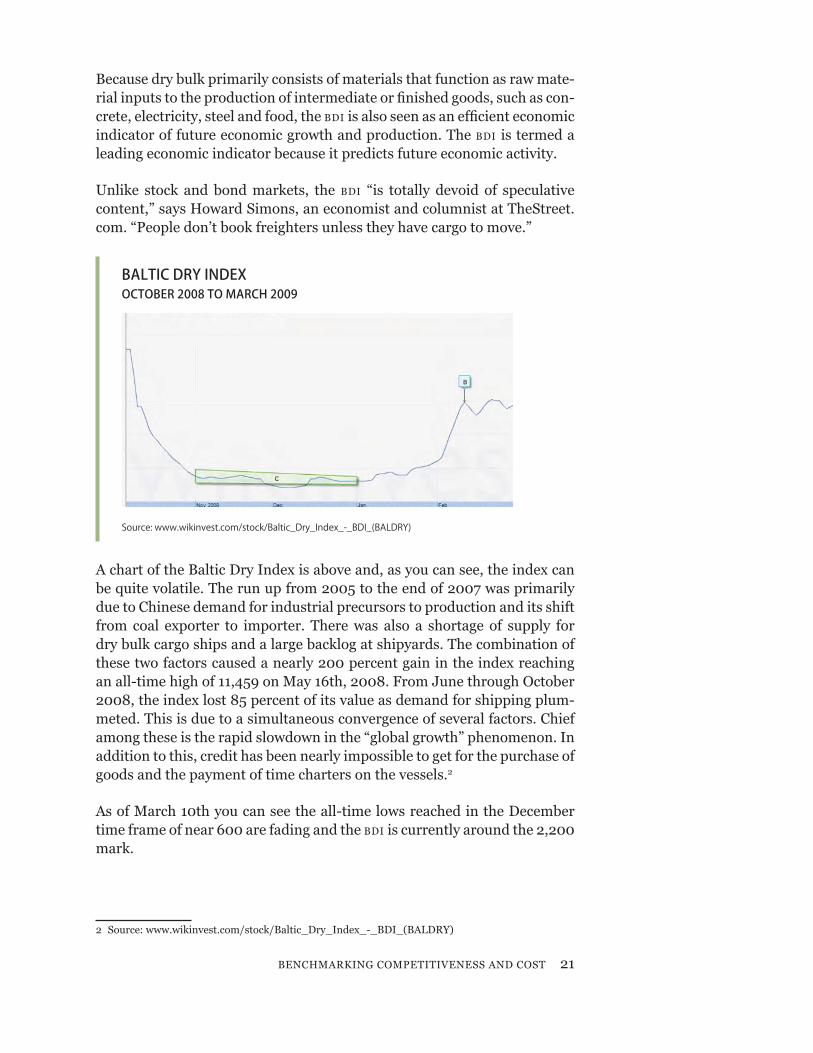
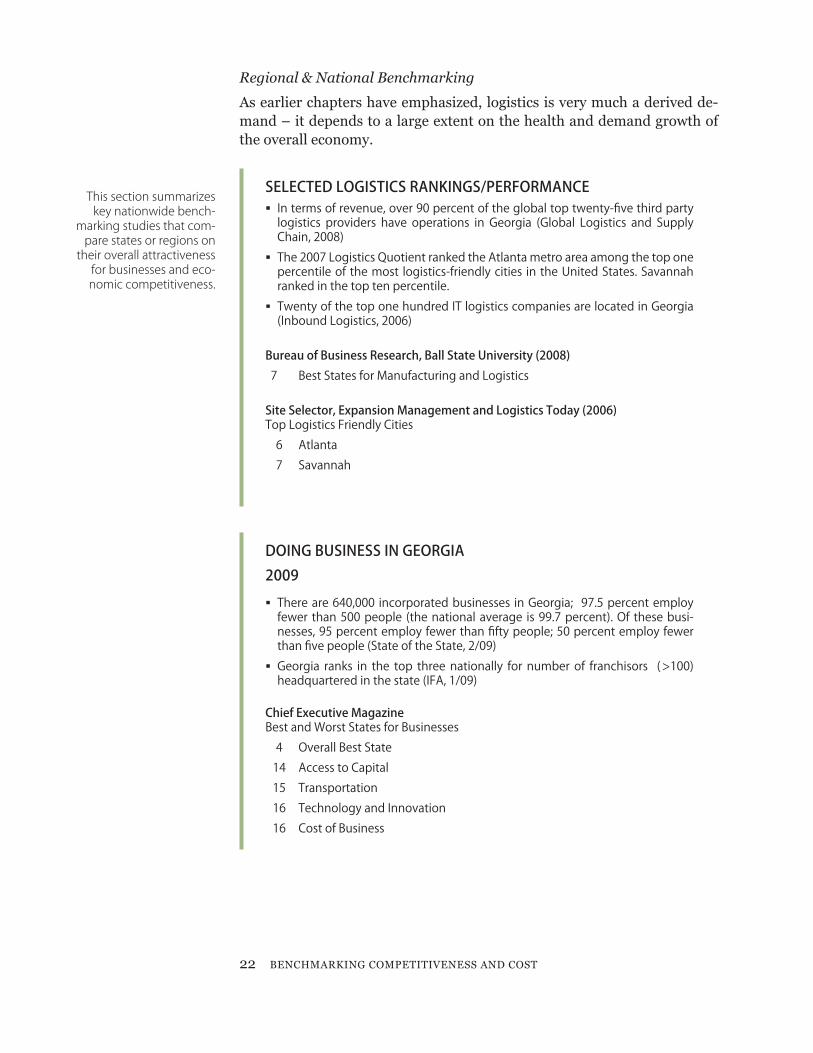
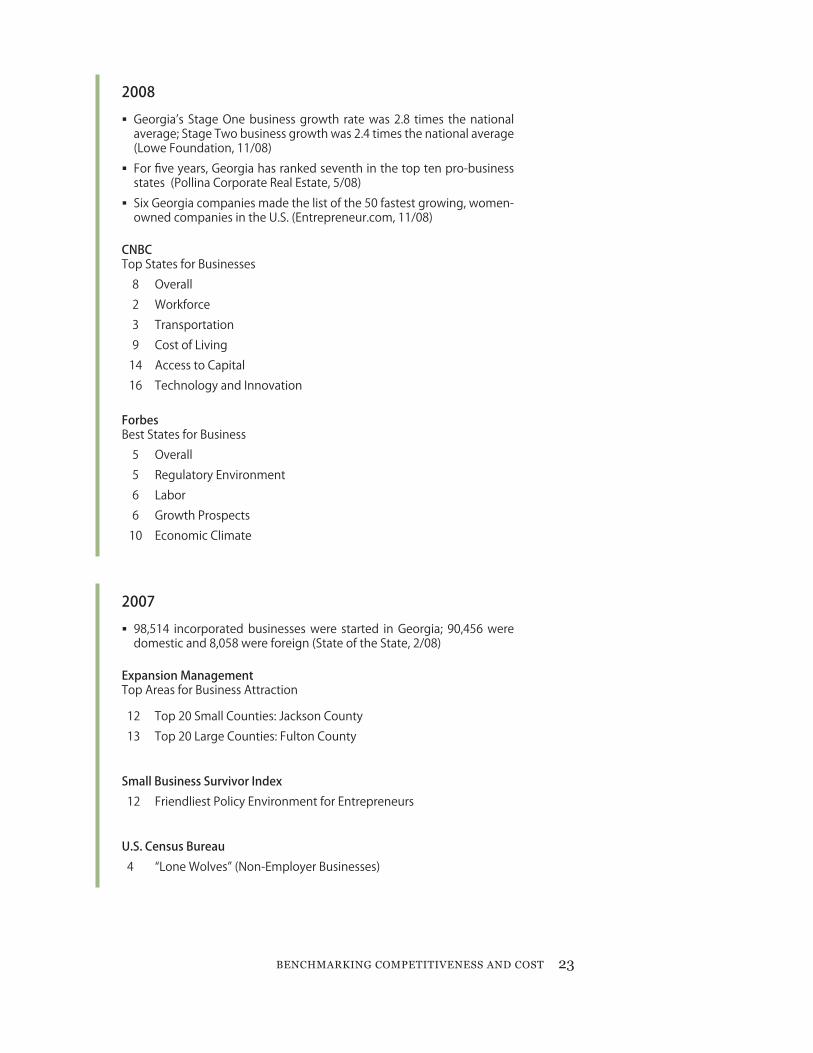
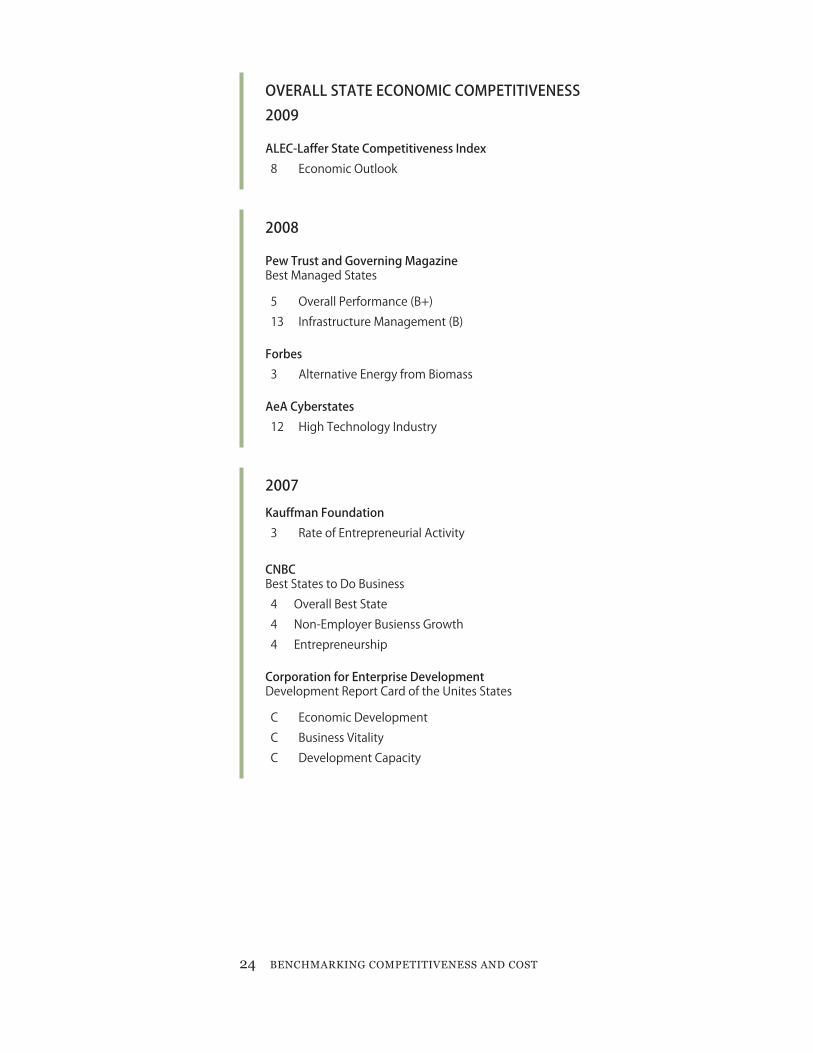
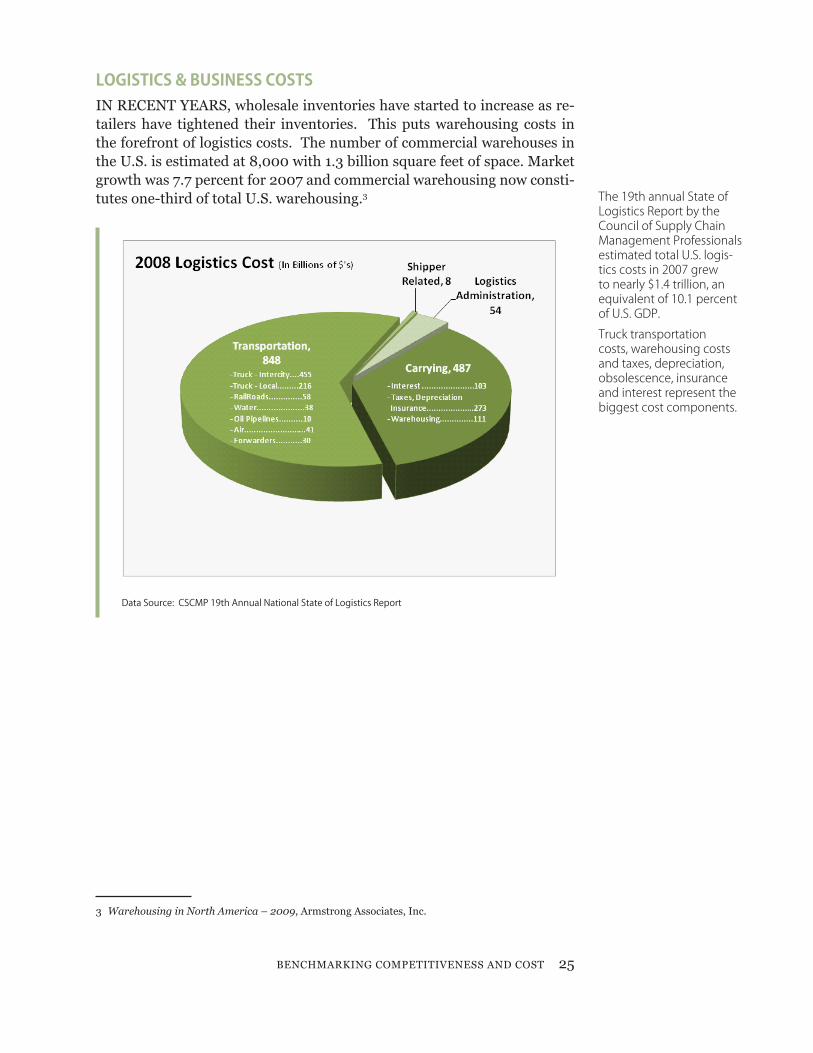

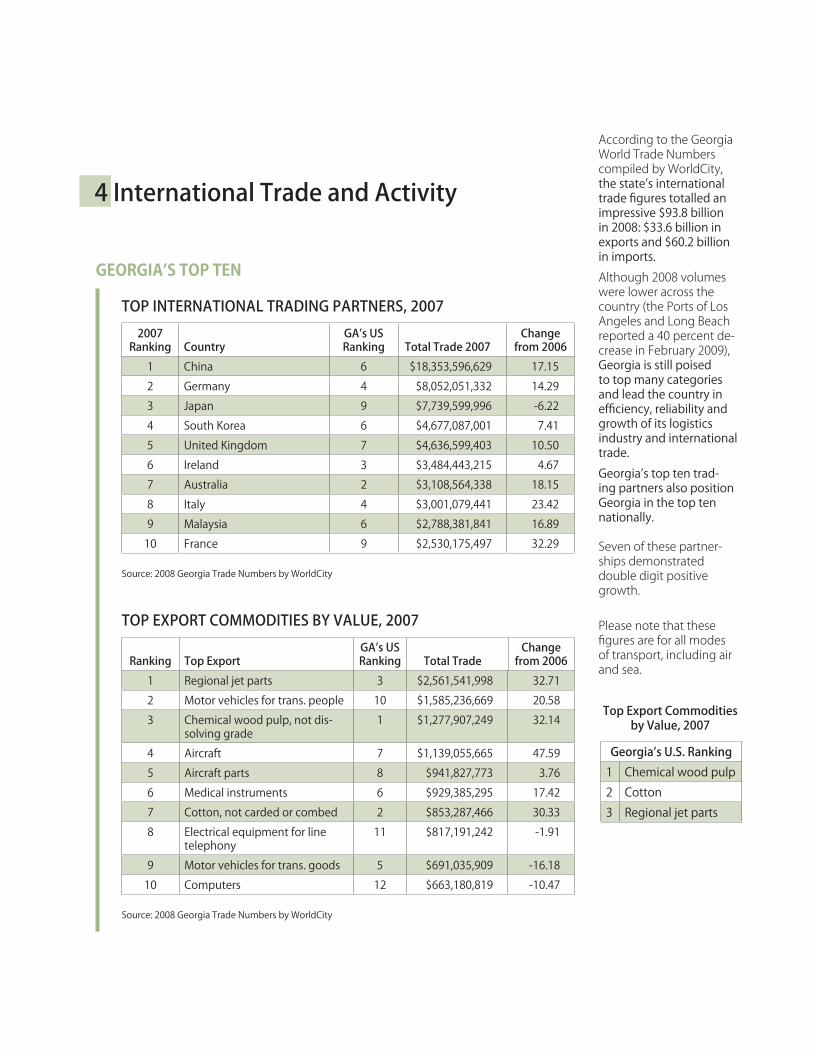
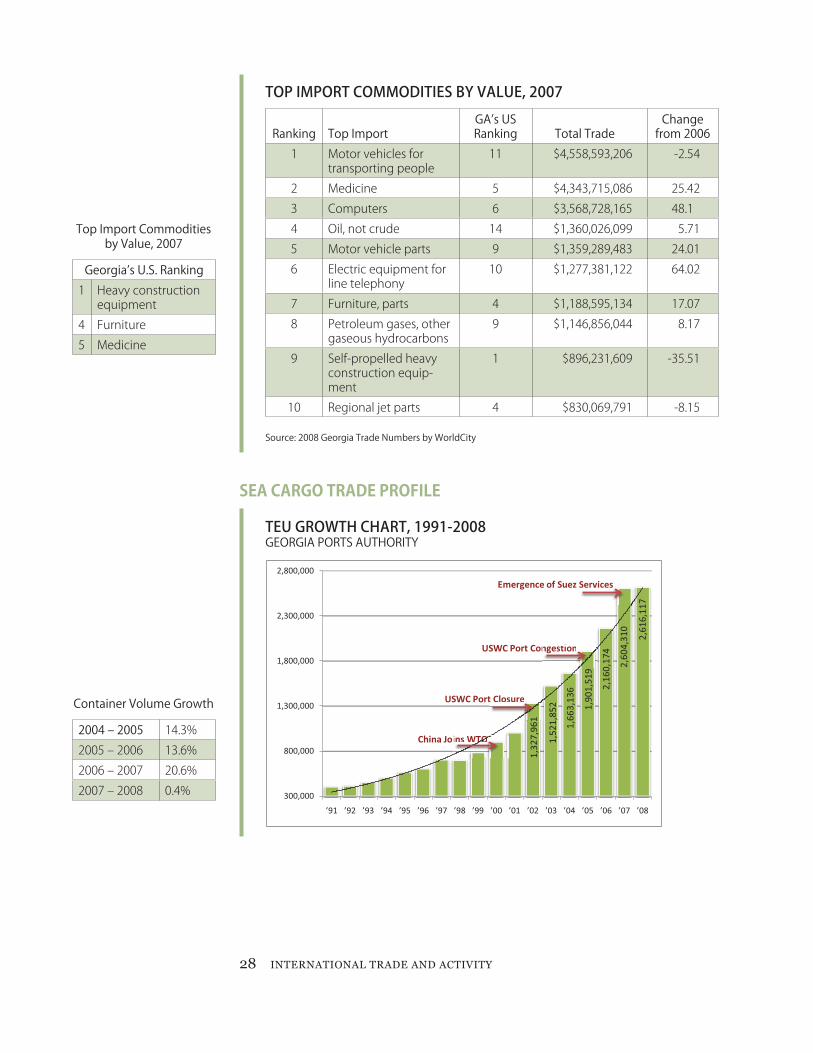
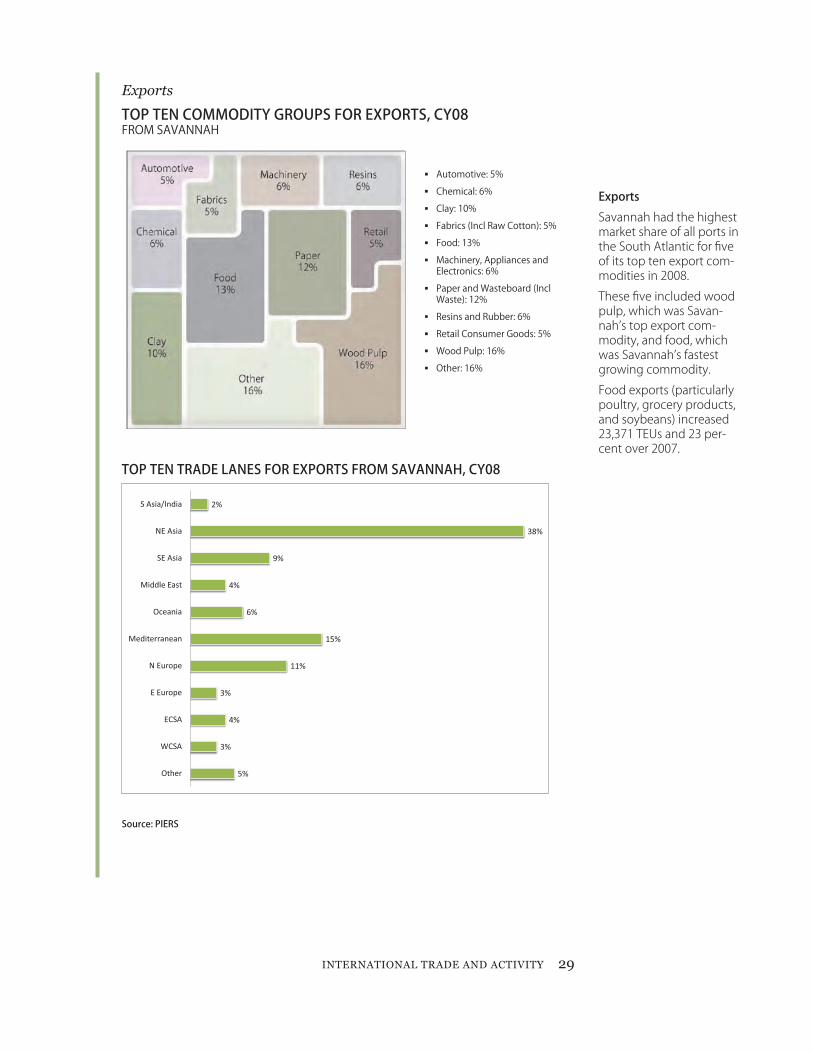

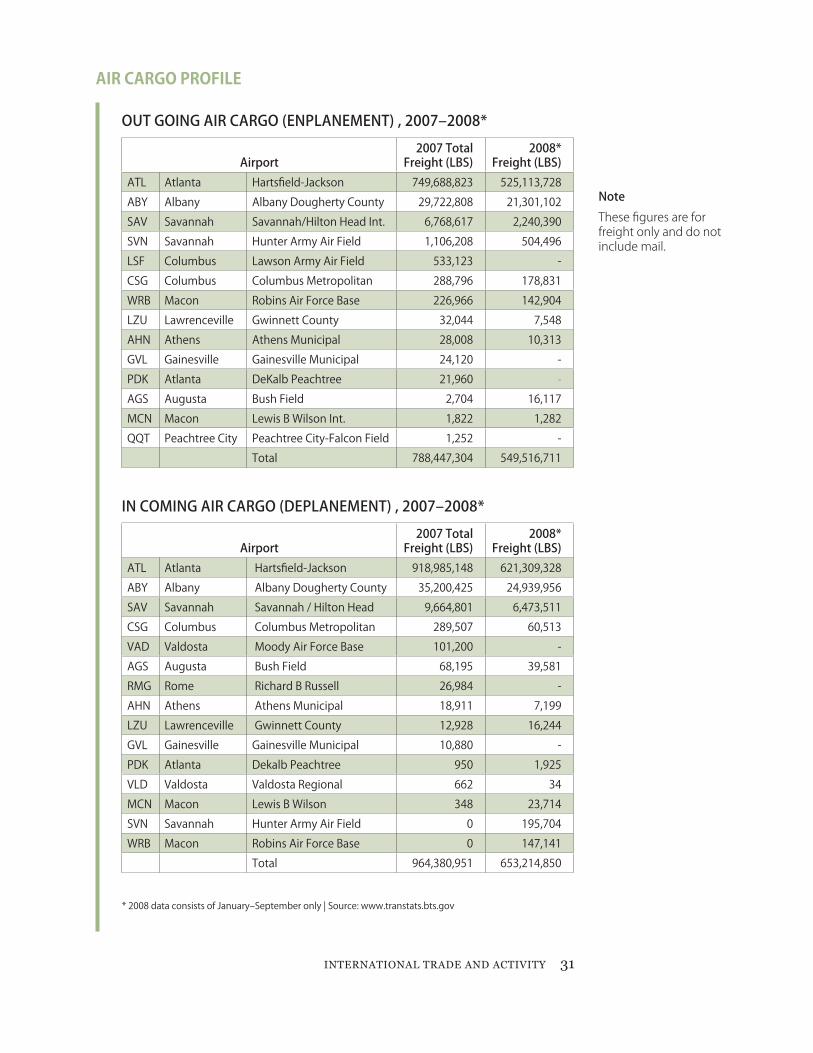


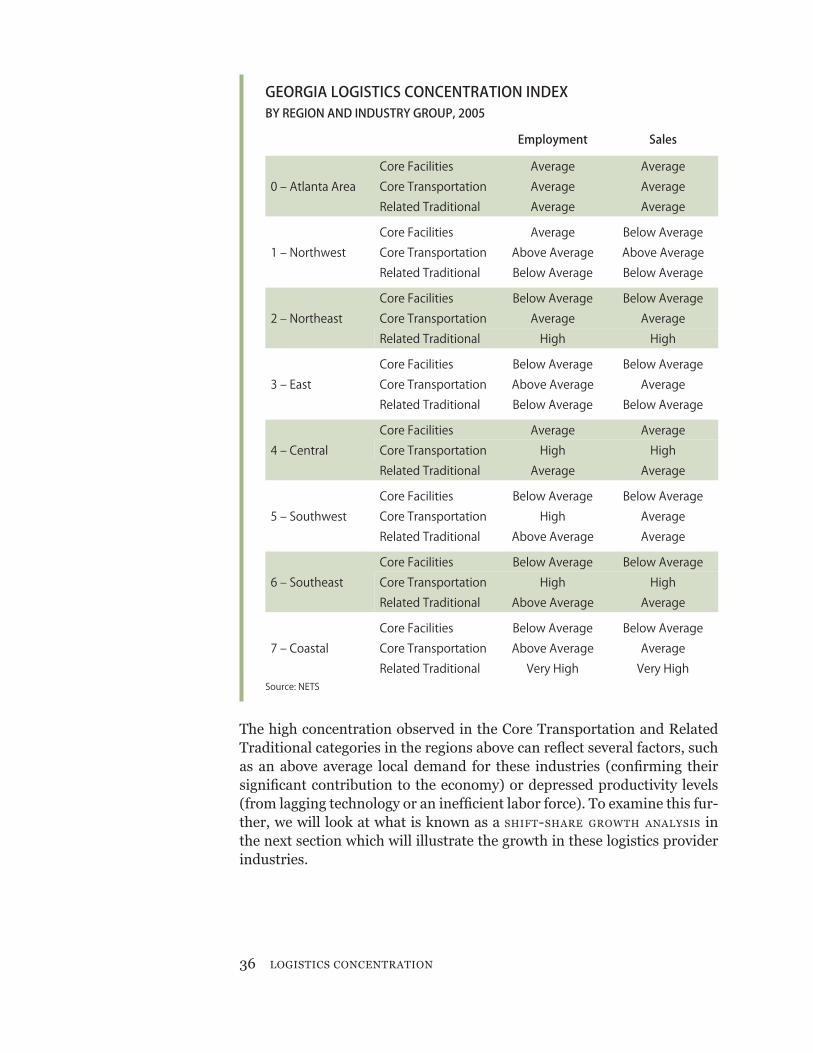

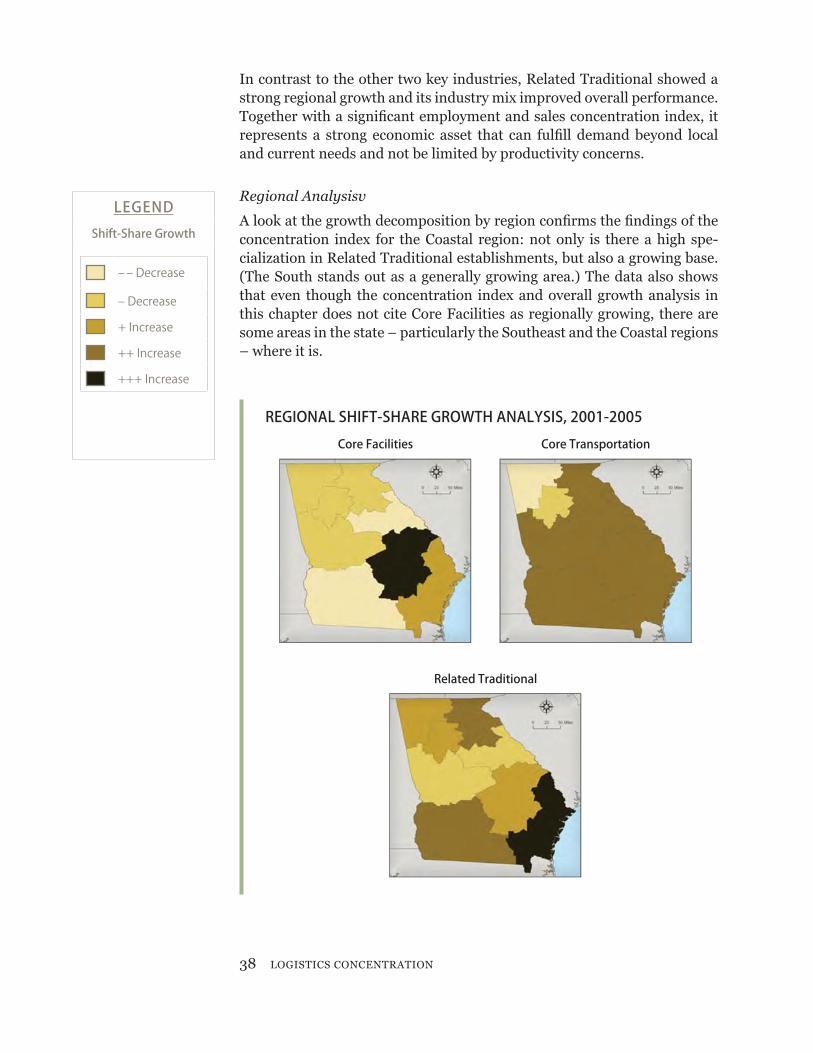
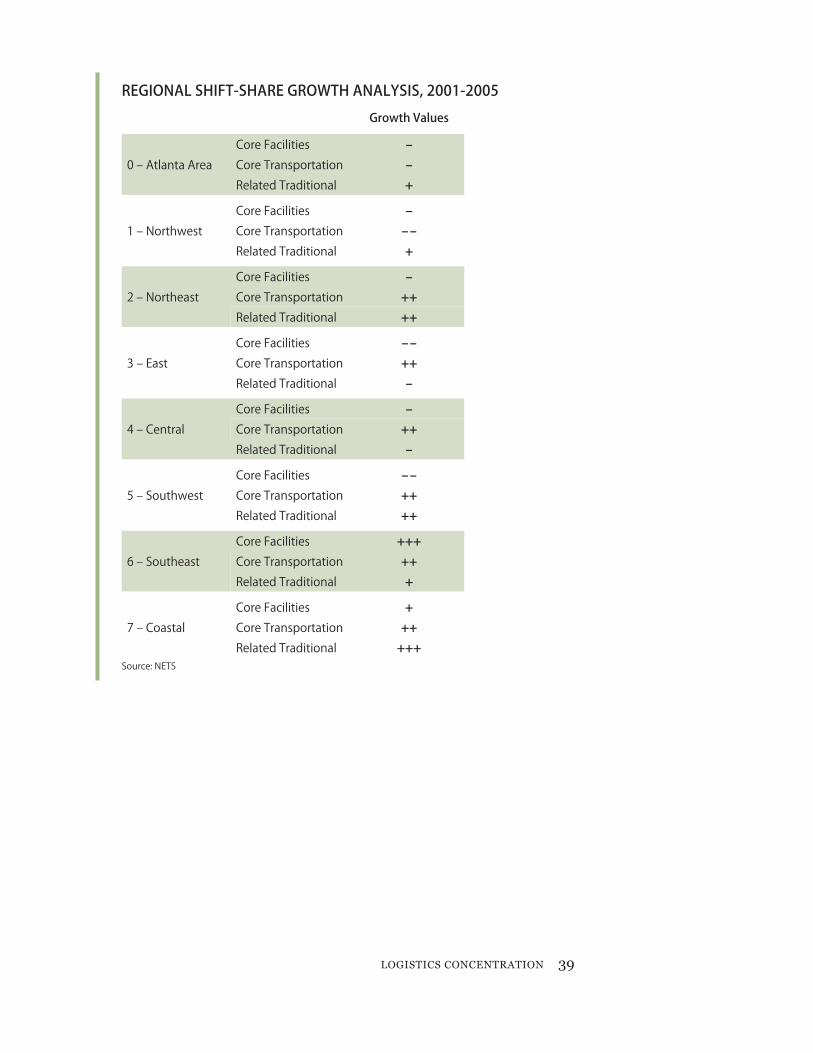


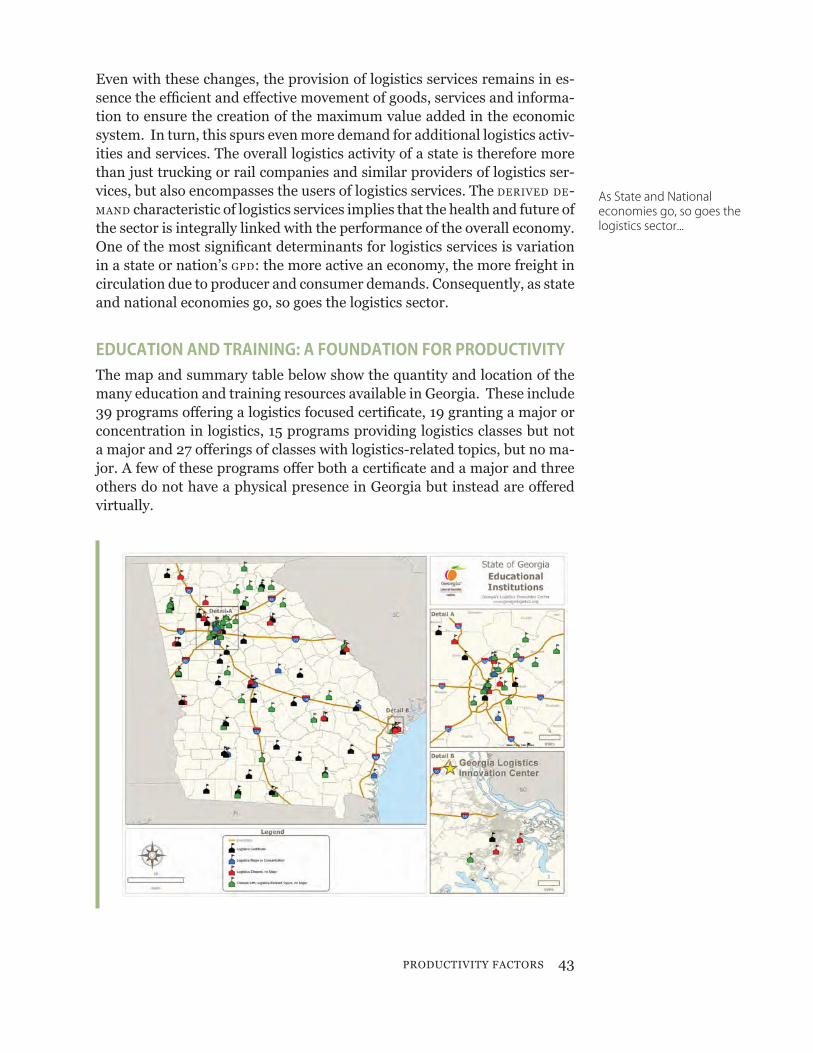


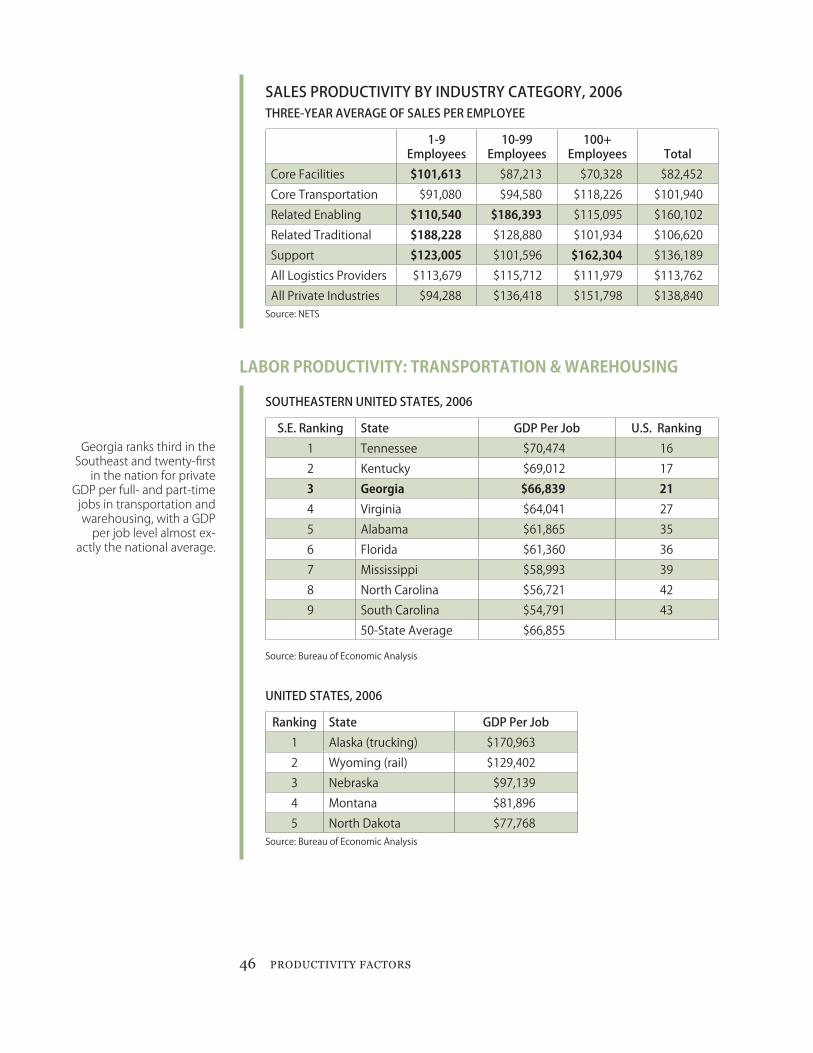


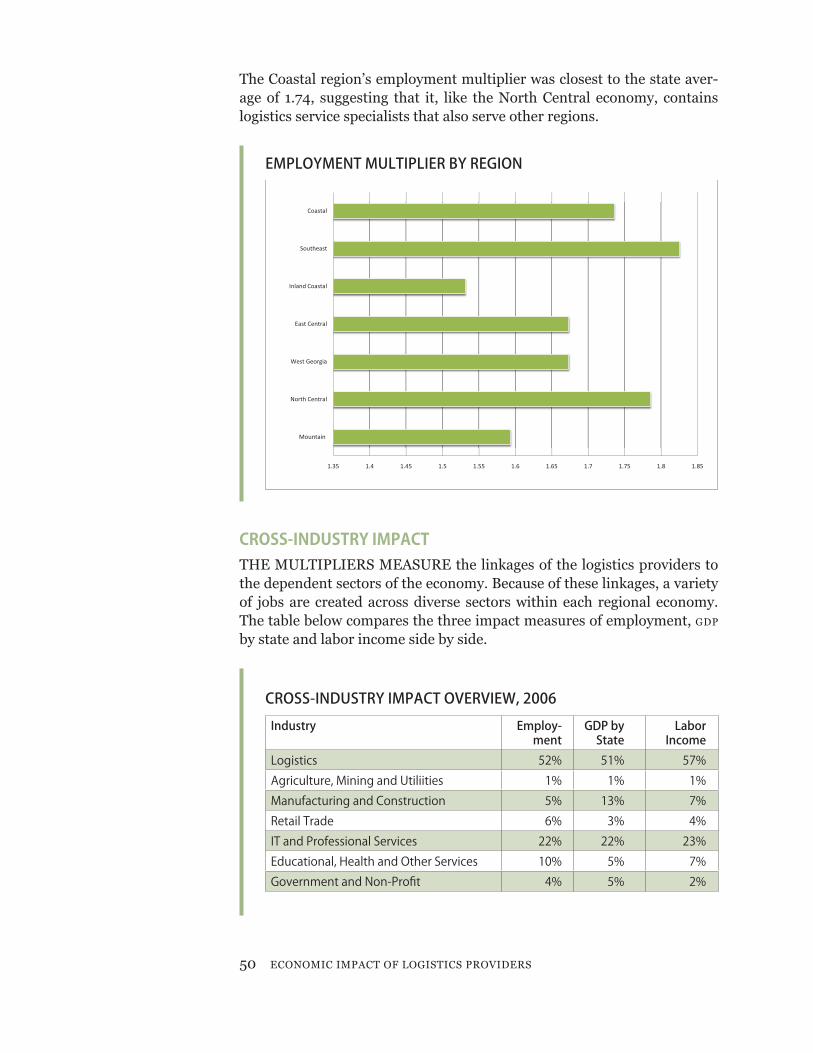


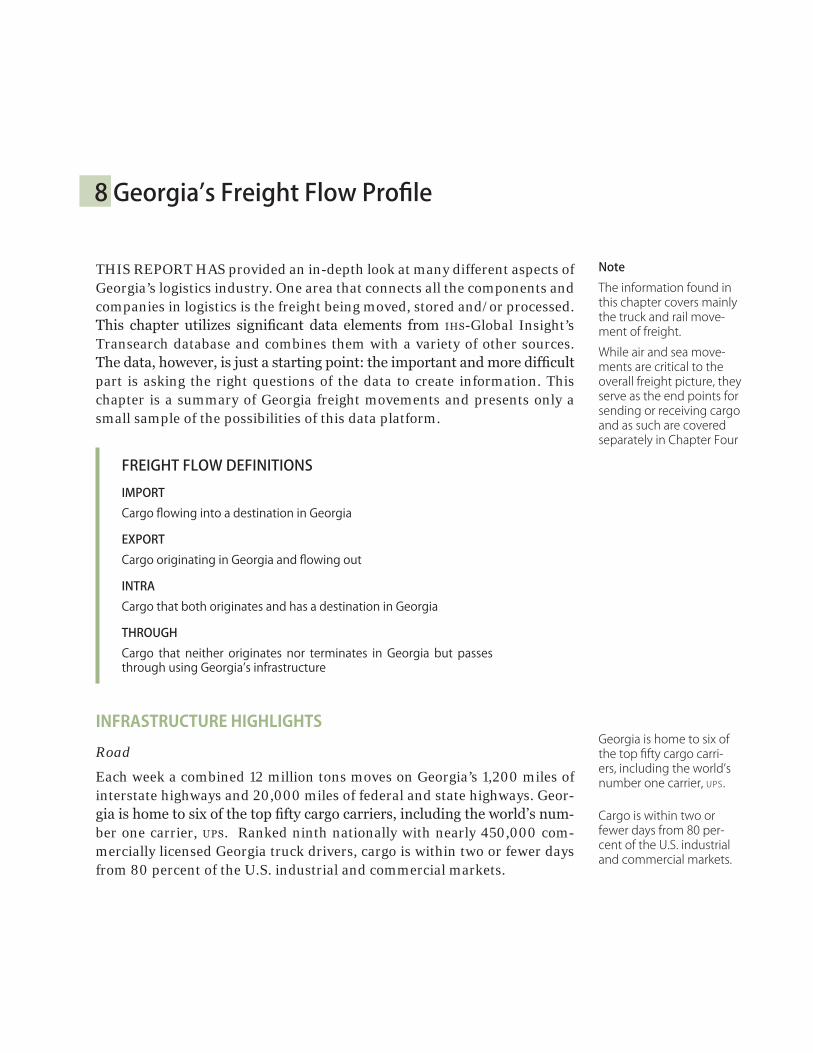
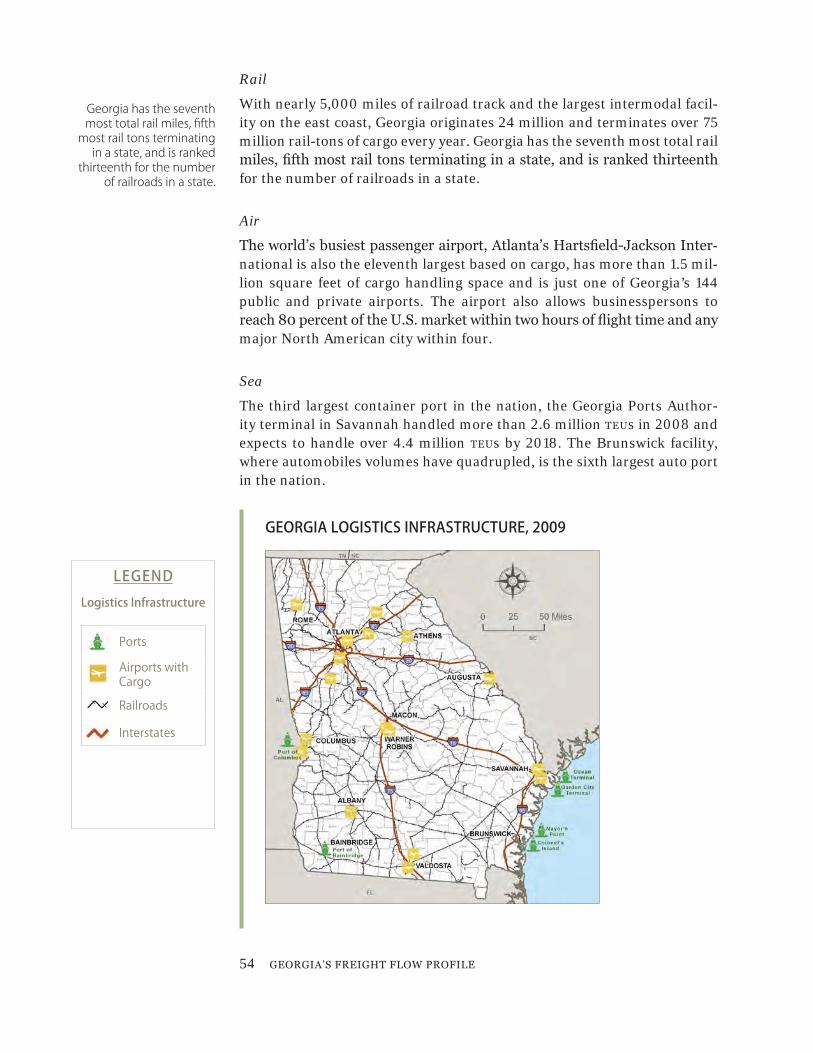
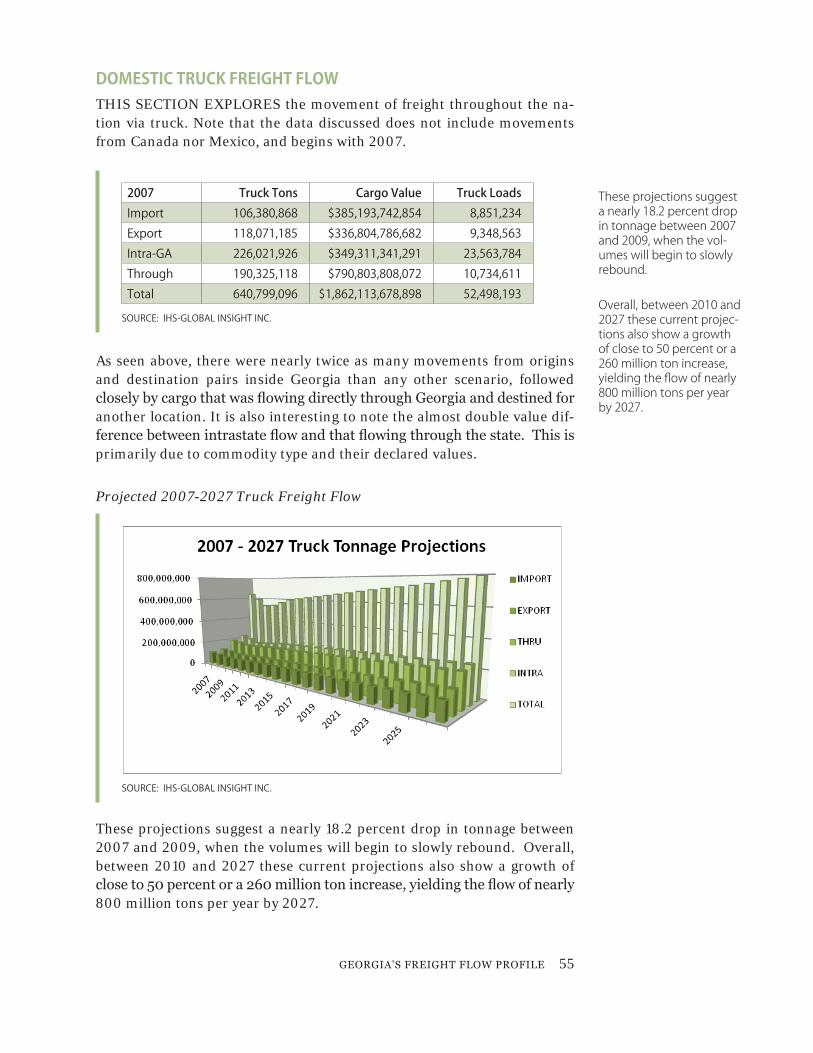
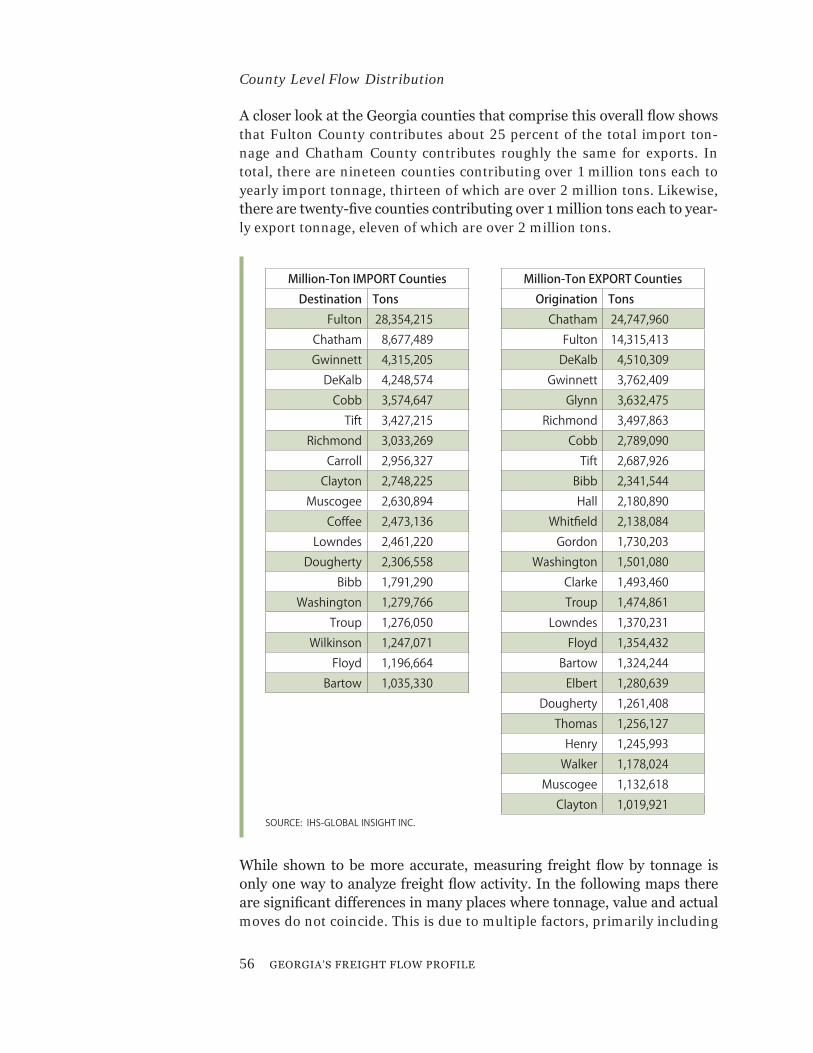
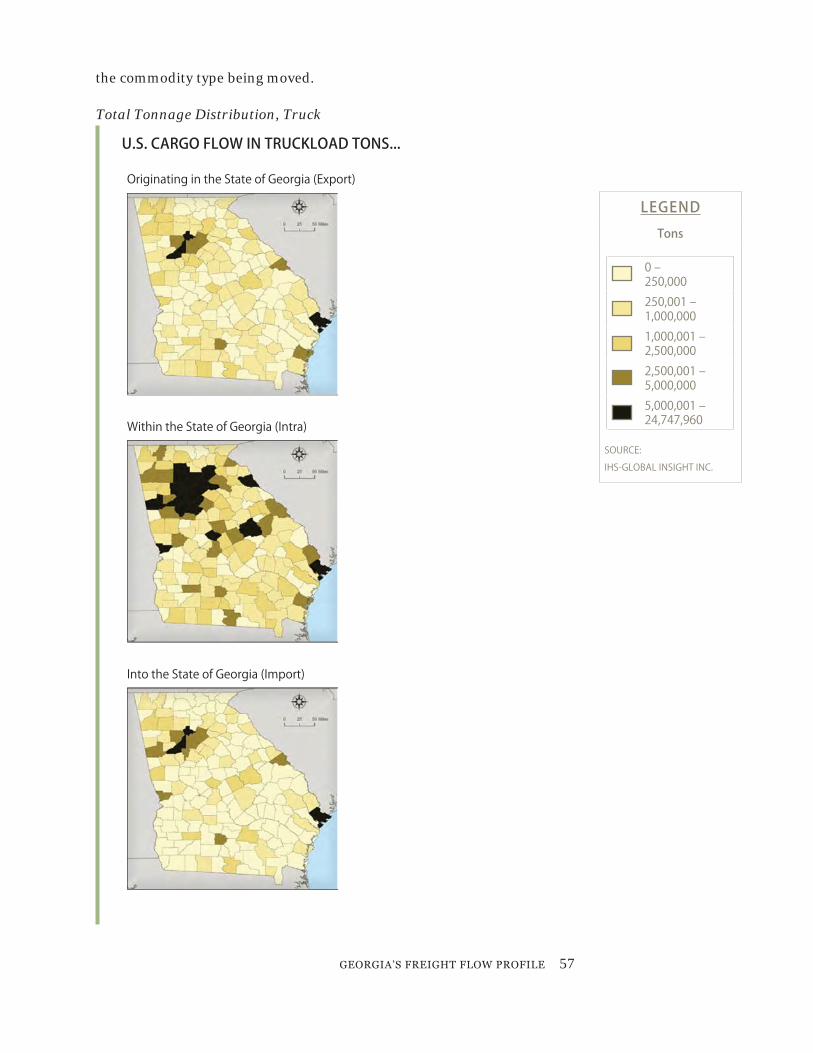
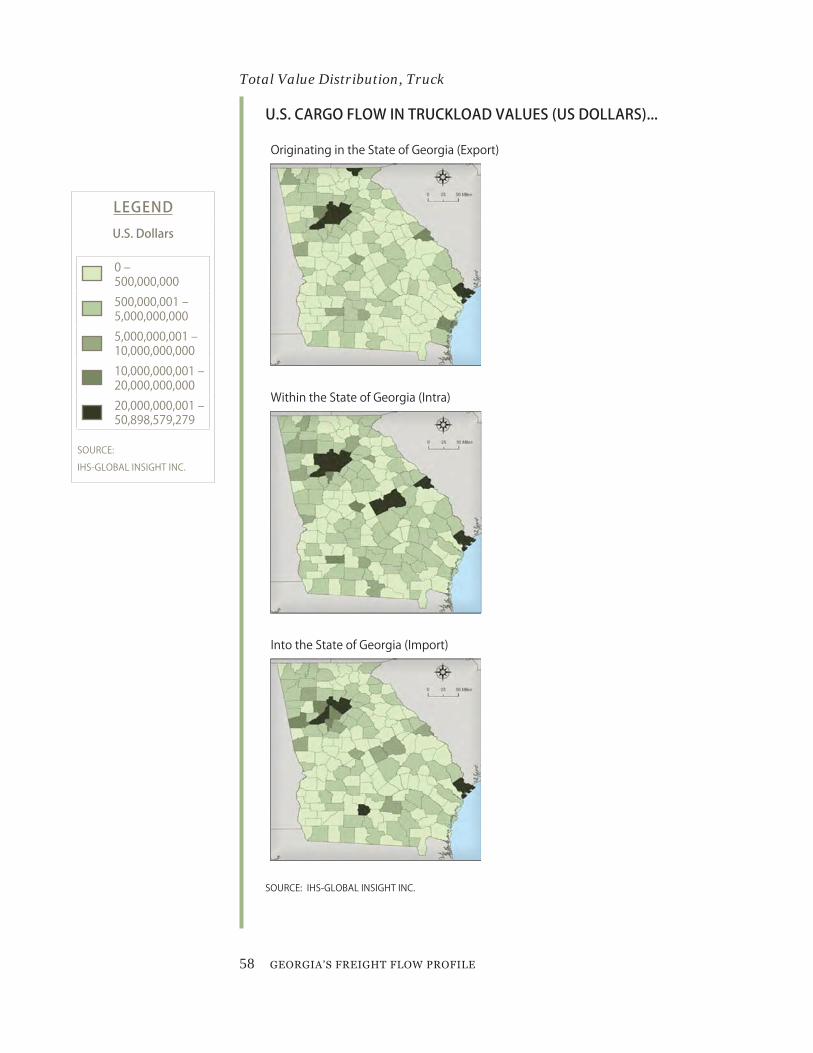
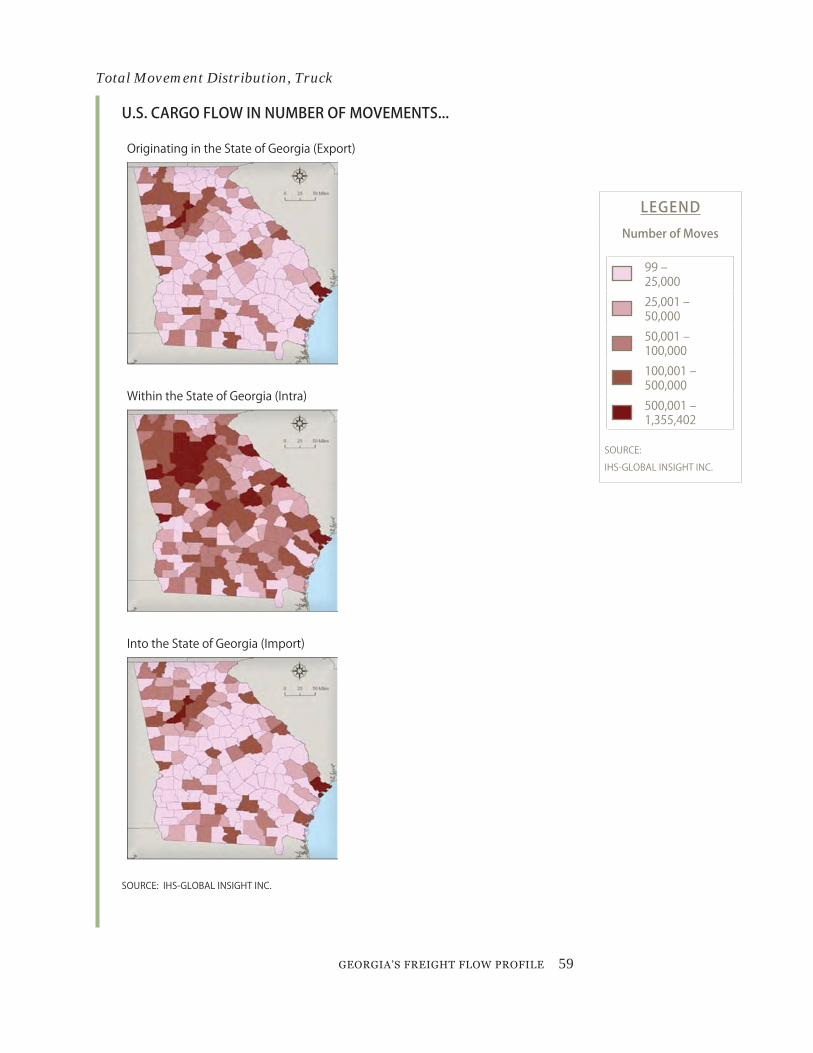


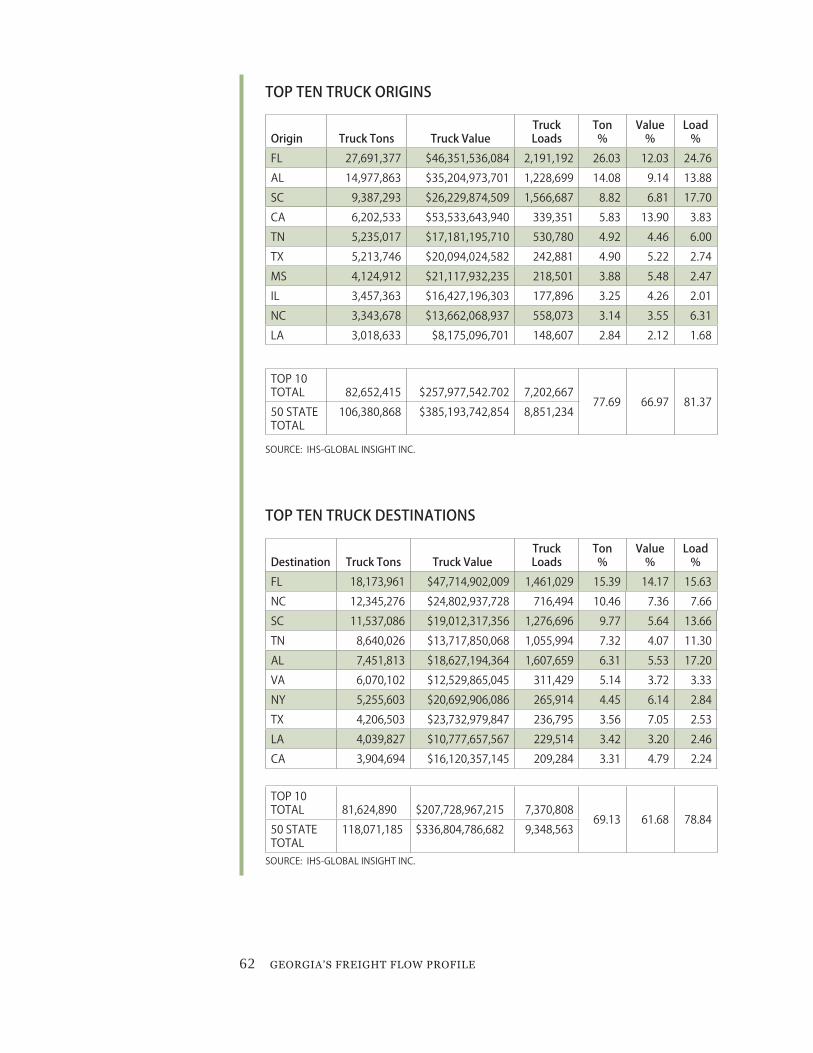

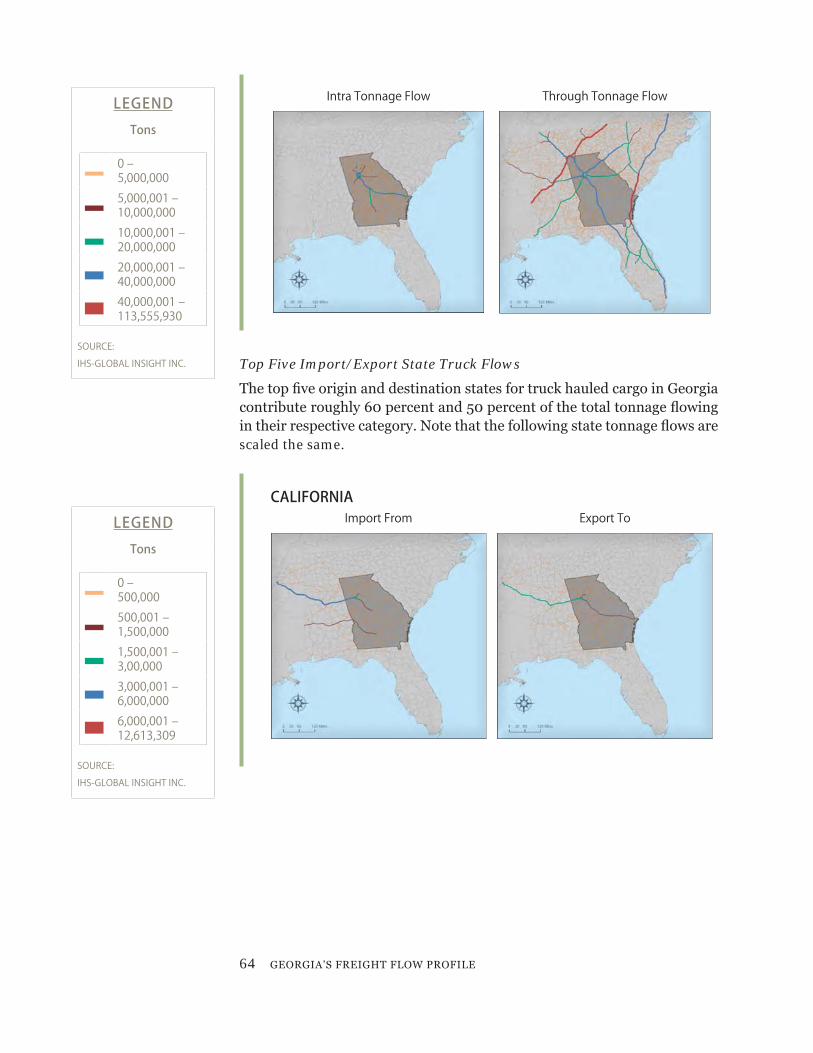
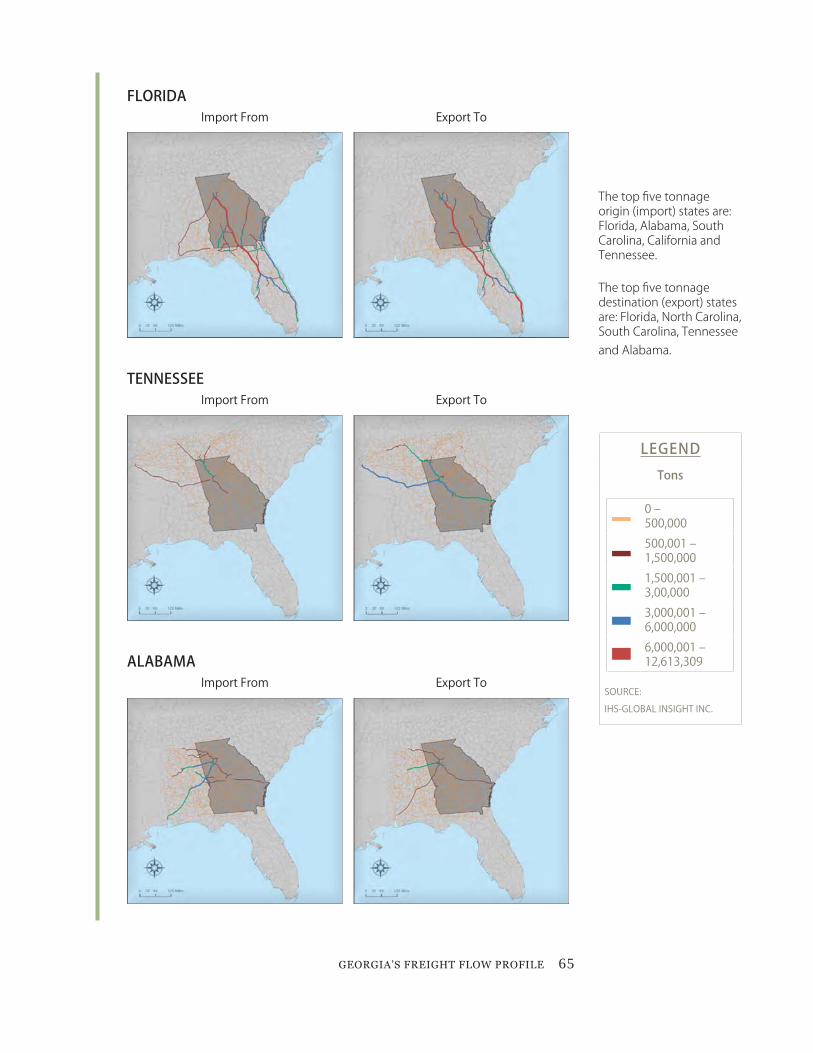


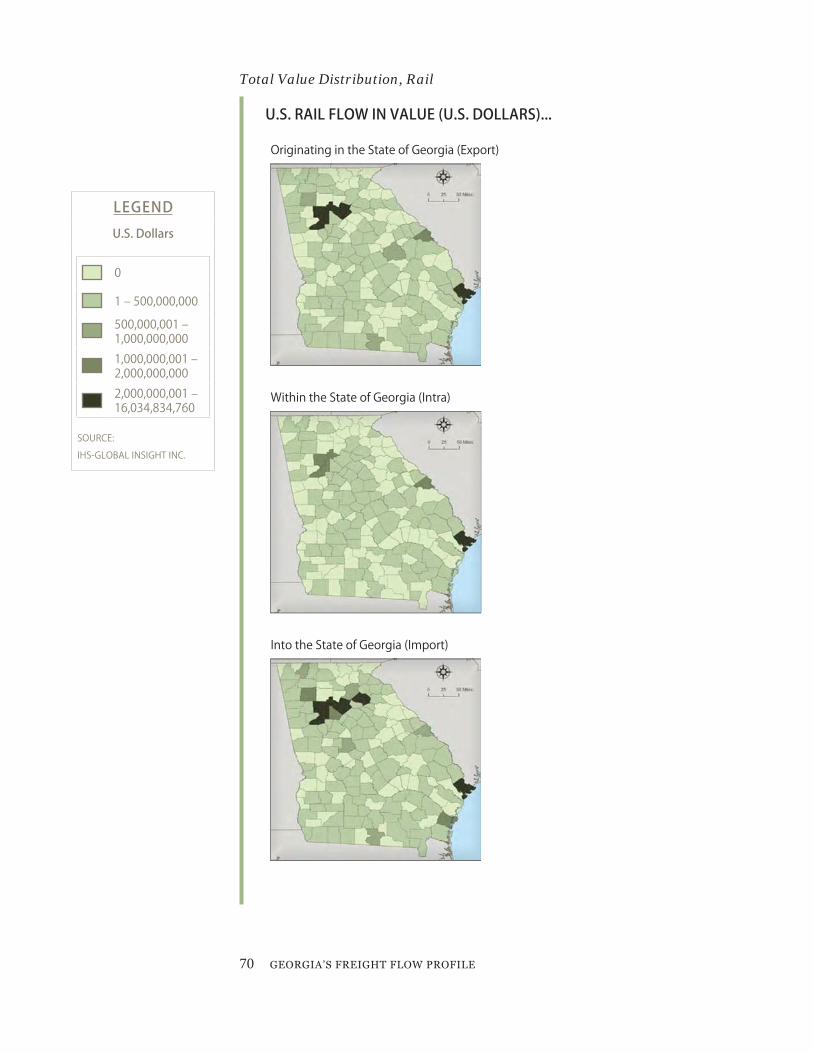
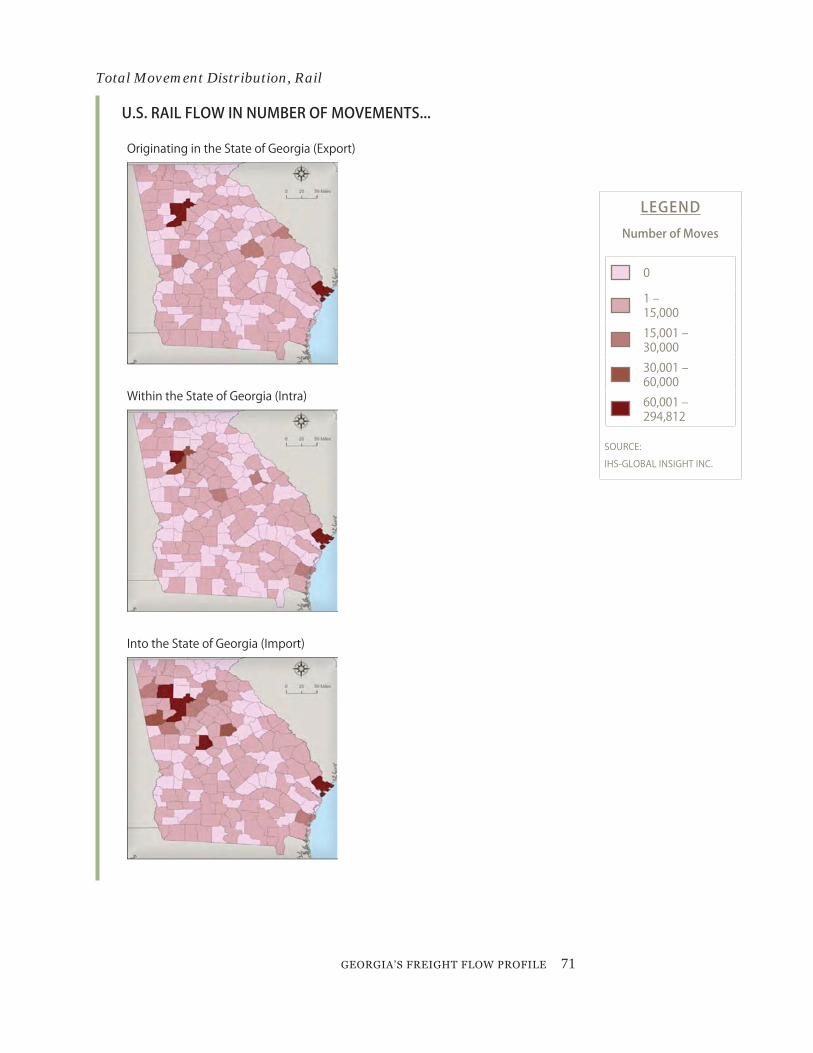
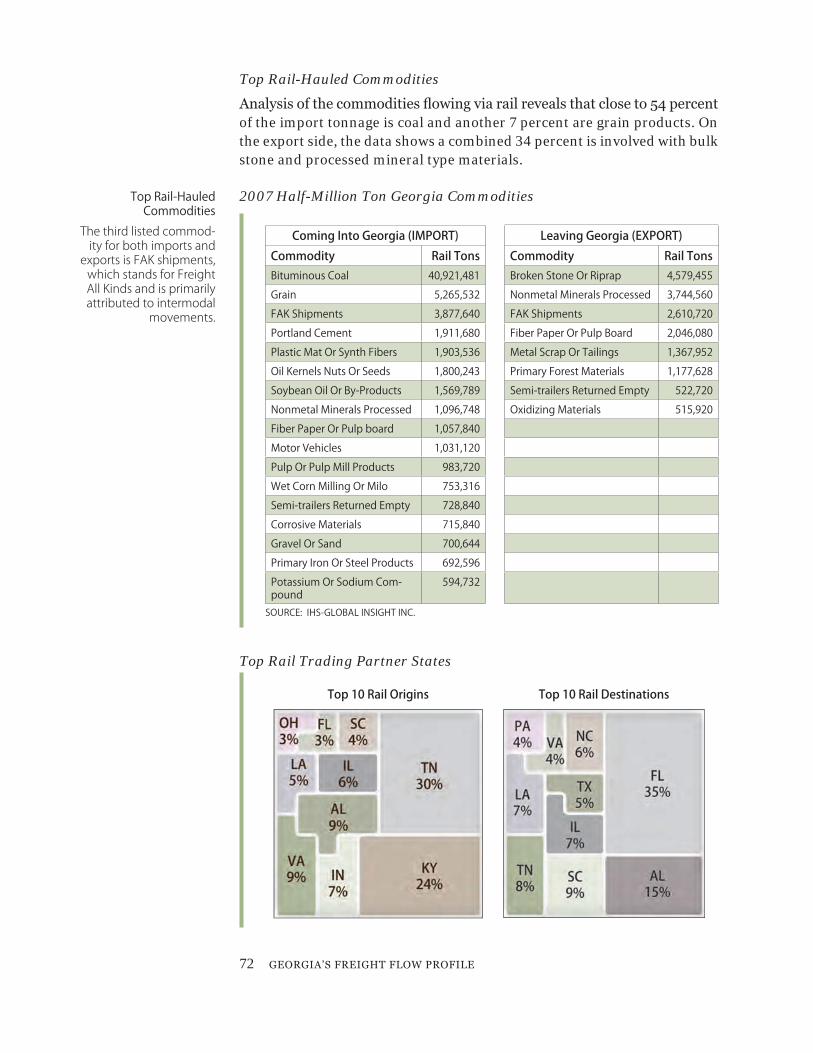
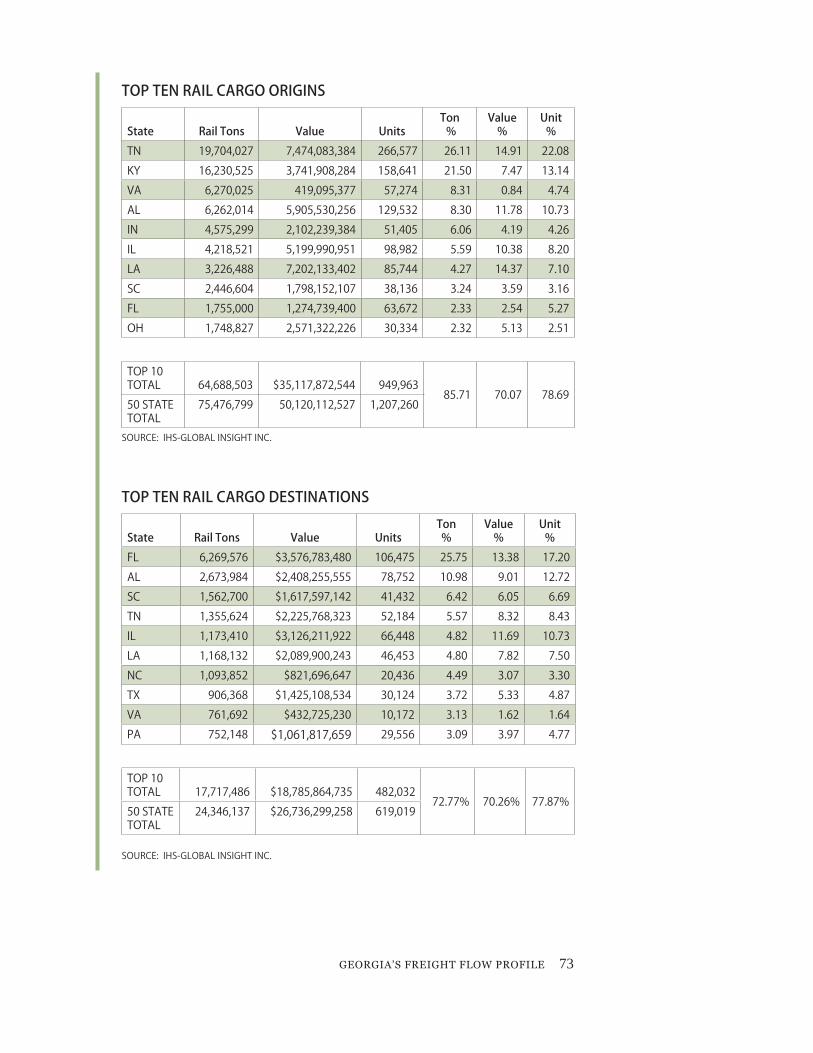

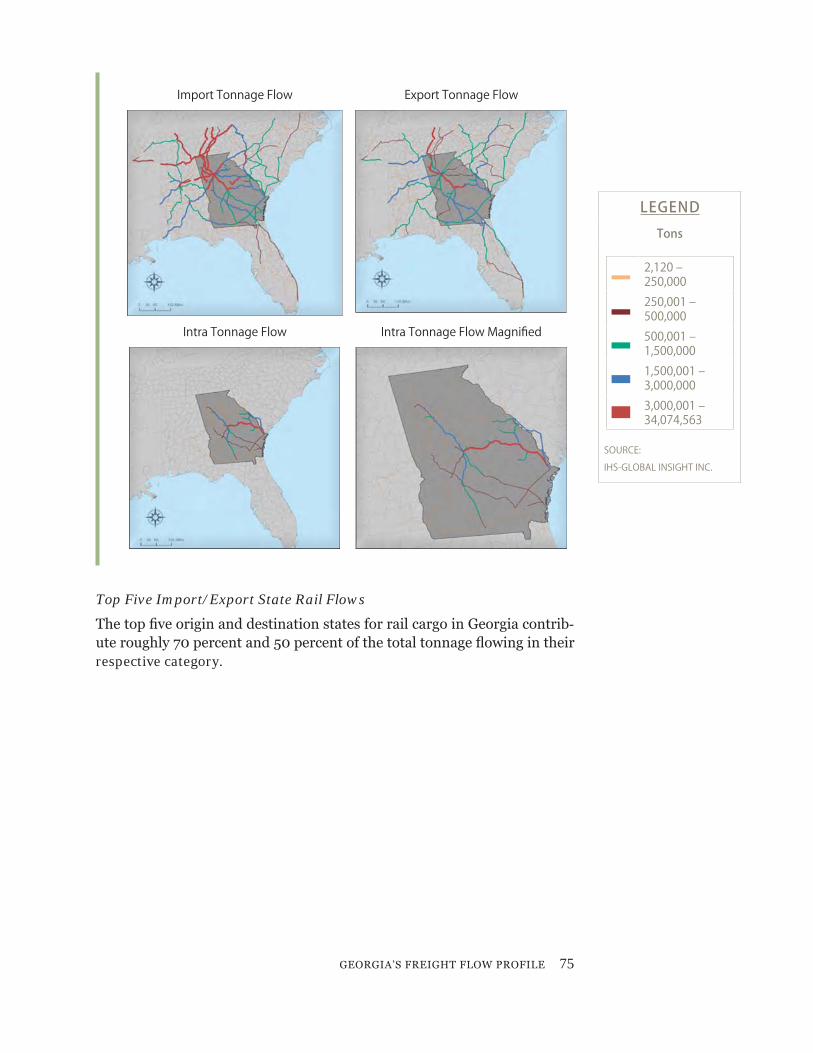

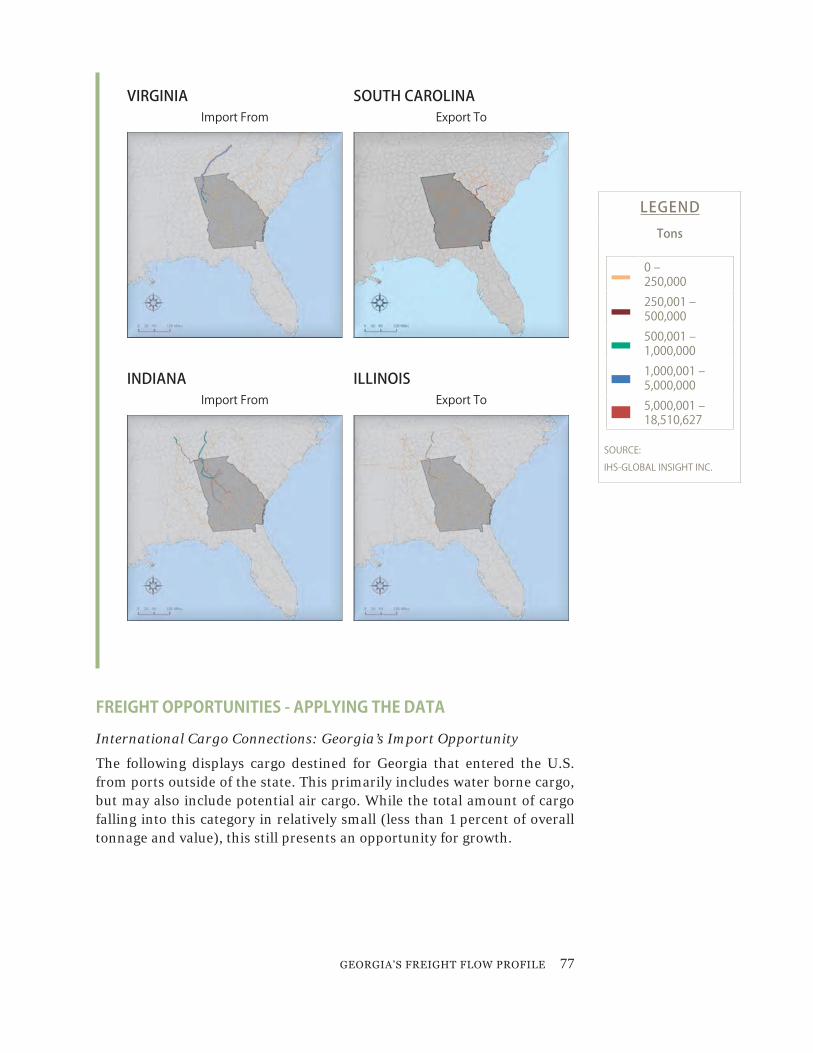
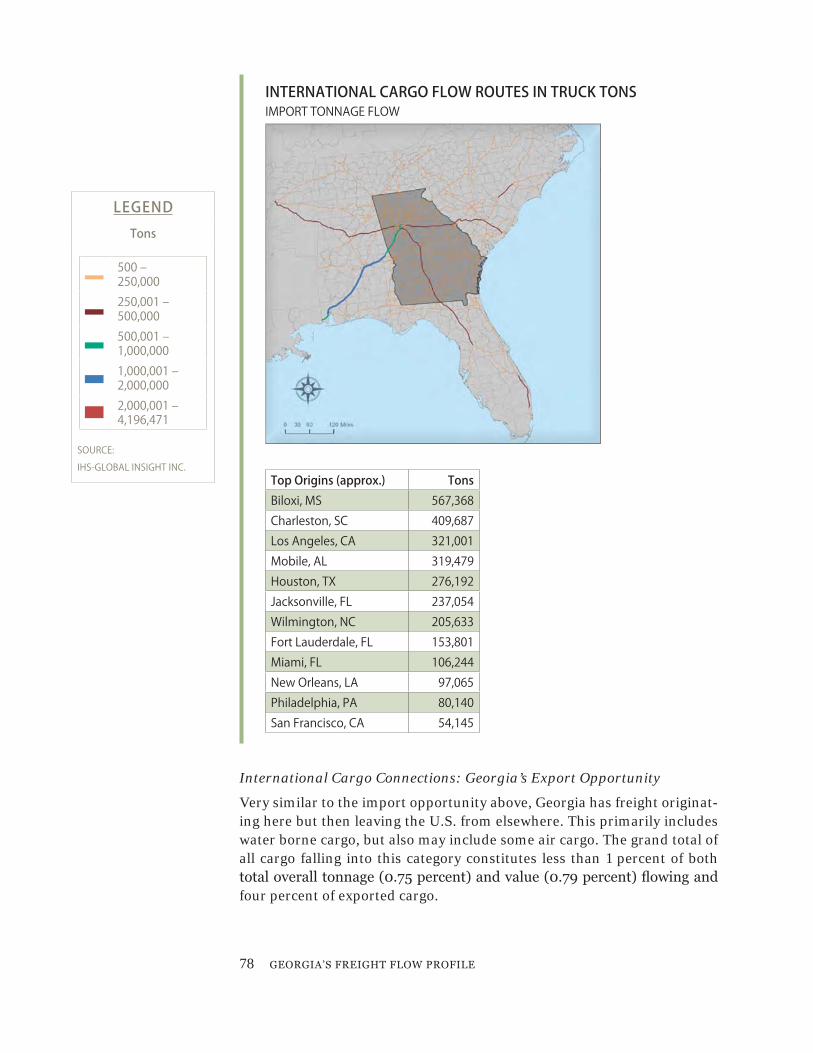
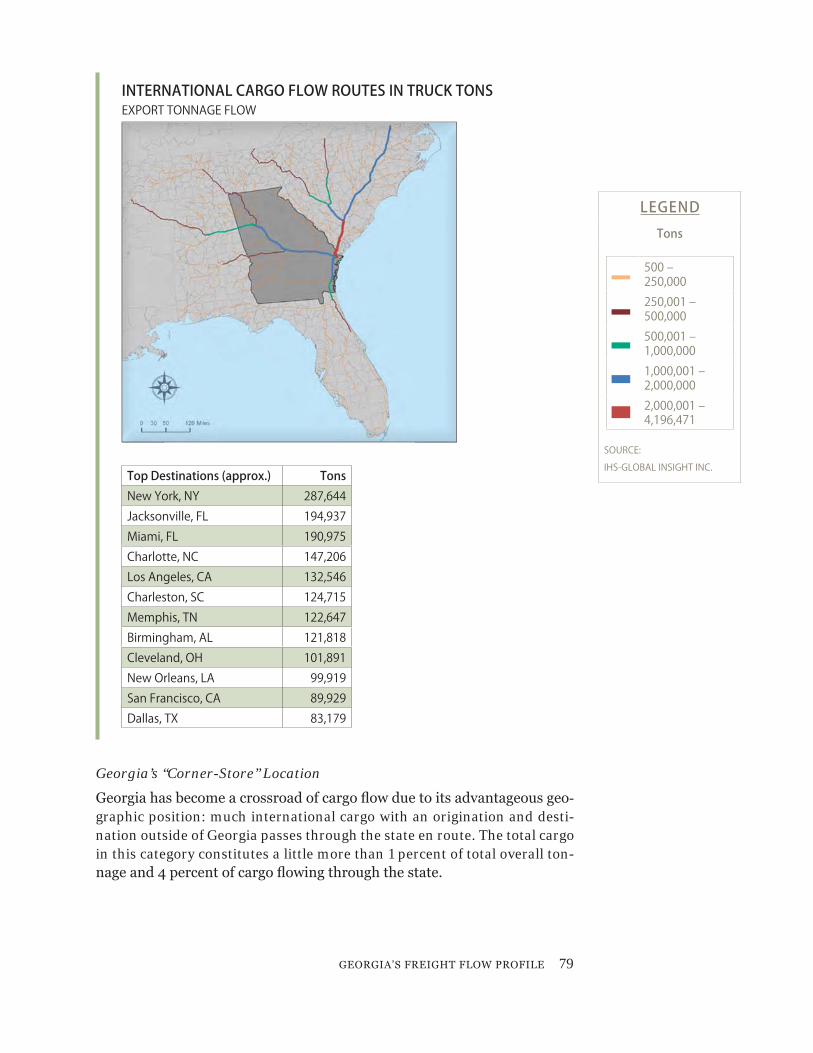
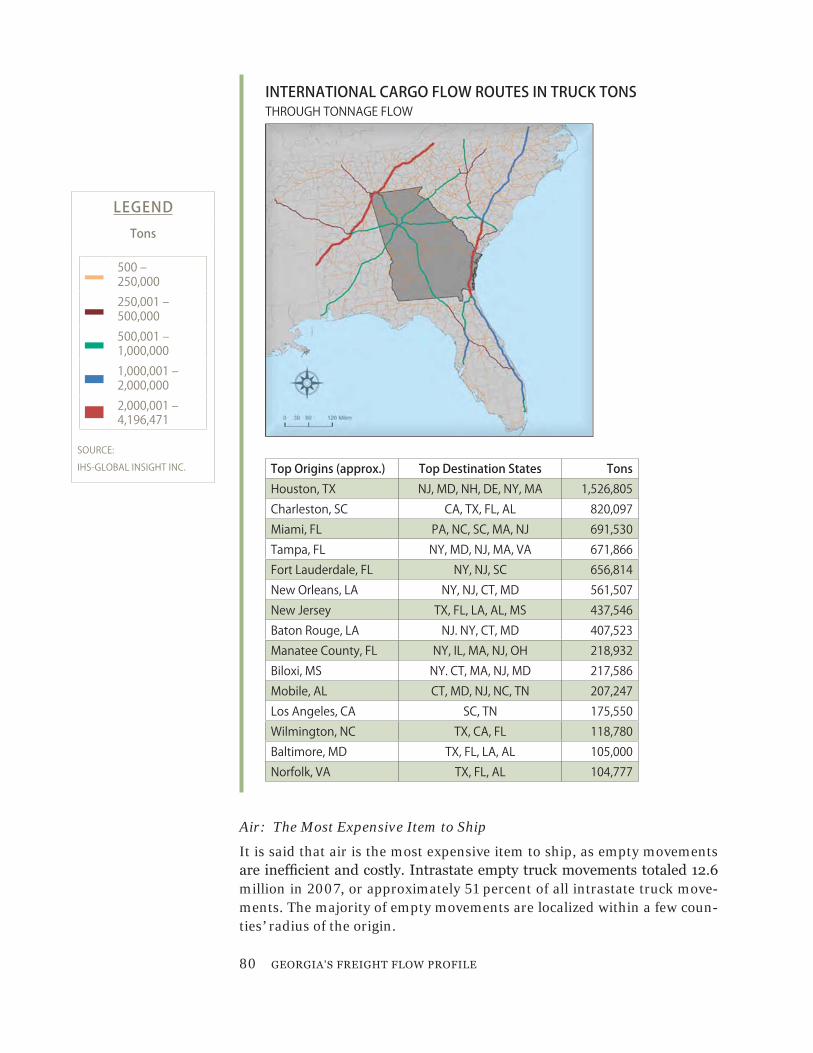
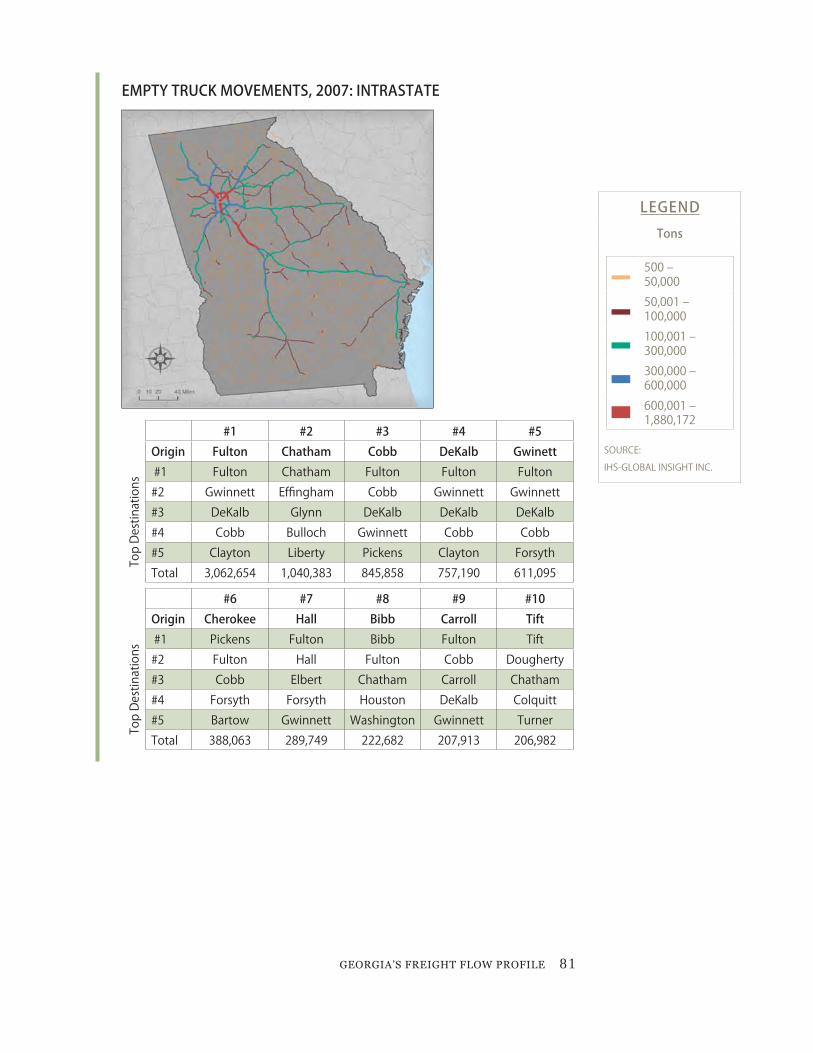


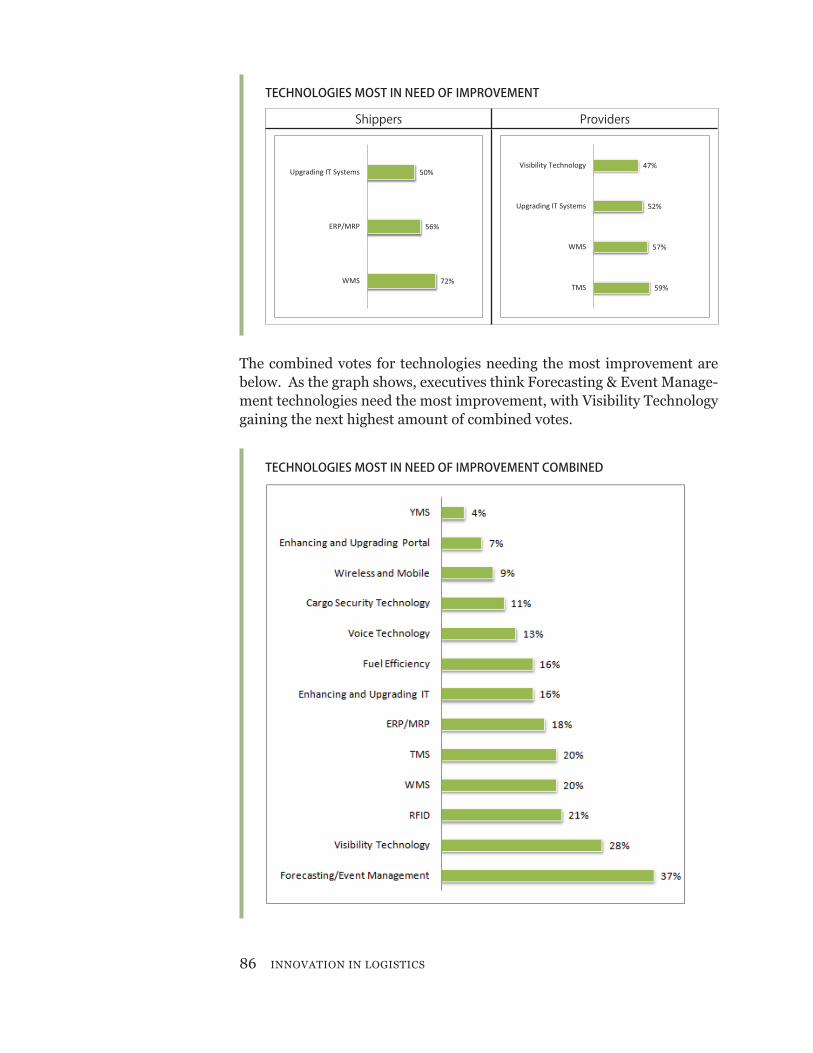
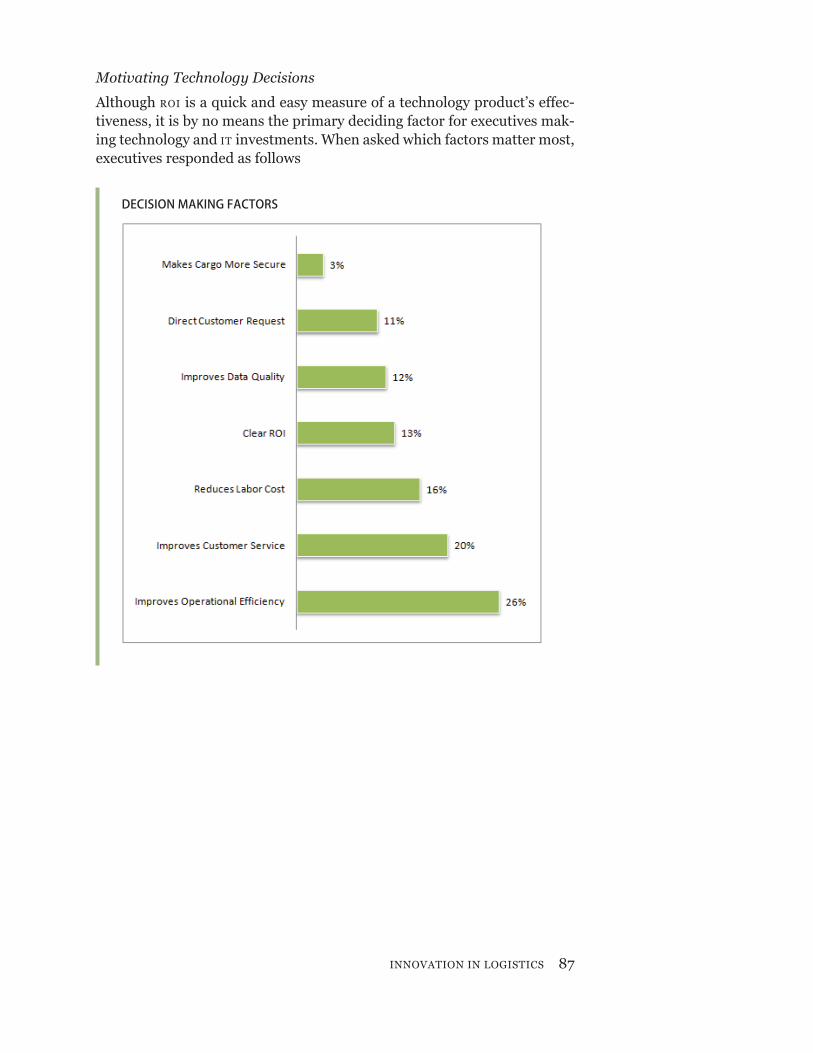


![Logistics Outsourcing - TLIAP...2019/04/06 · CII Logistics 2003 Theme Paper [6]. "2005 Third-Party Logistics: Results and Findings of the 10 th Annual Study," Capgemini, Georgia](https://static.documents.pub/doc/80x56/5edfe910ad6a402d666b3133/logistics-outsourcing-tliap-20190406-cii-logistics-2003-theme-paper-6.jpg)


