12
2009 GRA Annual Policy Conference July 27, 2009 Marcia Howard [email protected] ARRA, the Federal Budget and the States Federal Funds Information for States www.ffis.org
| Date post: | 30-Dec-2015 |
| Category: |
Documents |
| Upload: | joan-kelly-whitehead |
| View: | 215 times |
| Download: | 2 times |
2009 GRA Annual Policy Conference
July 27, 2009
Marcia Howard
ARRA, the Federal Budget and the States
Federal Funds Information for States www.ffis.org
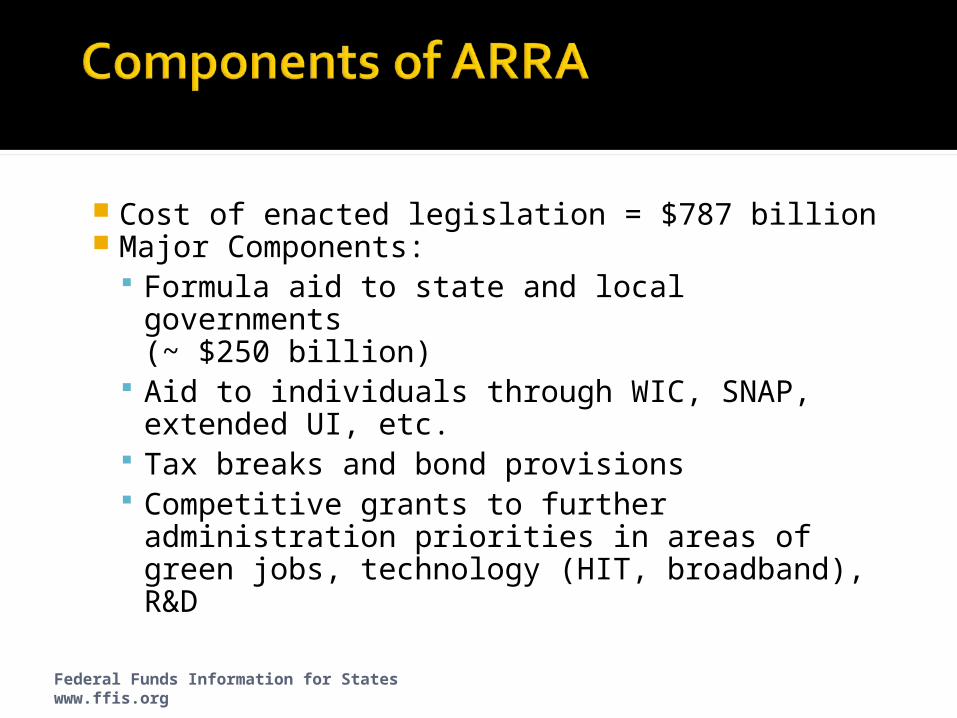
Cost of enacted legislation = $787 billion Major Components:
Formula aid to state and local governments (~ $250 billion)
Aid to individuals through WIC, SNAP, extended UI, etc.
Tax breaks and bond provisions Competitive grants to further
administration priorities in areas of green jobs, technology (HIT, broadband), R&D
Federal Funds Information for States www.ffis.org
Federal Funds Information for States www.ffis.org
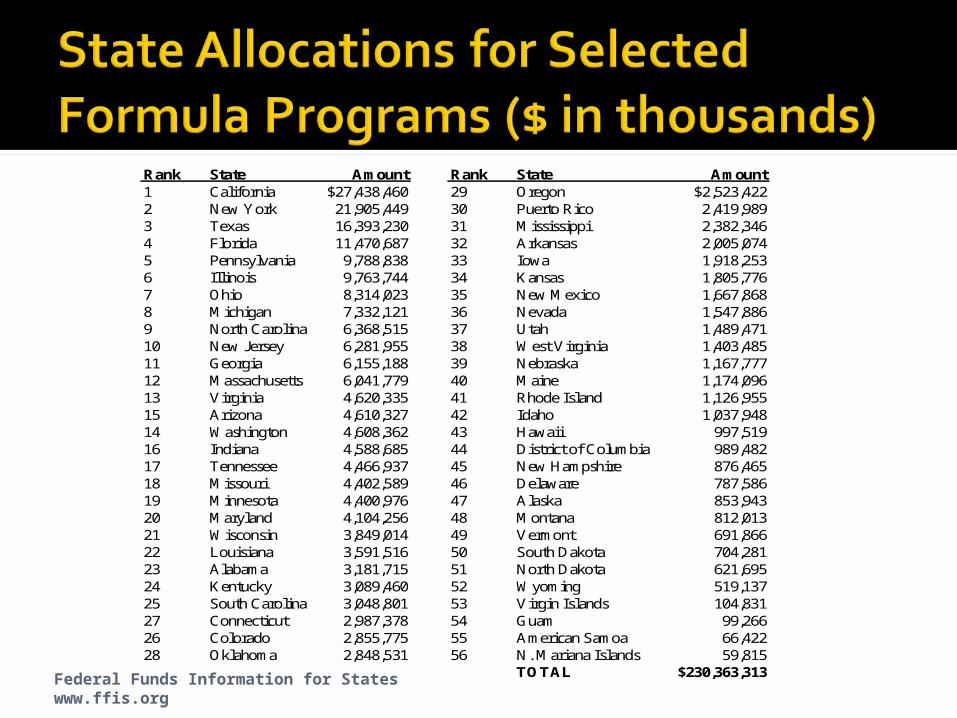
Rank State Amount Rank State Amount1 California $27,438,460 29 Oregon $2,523,4222 New York 21,905,449 30 Puerto Rico 2,419,9893 Texas 16,393,230 31 Mississippi 2,382,3464 Florida 11,470,687 32 Arkansas 2,005,0745 Pennsylvania 9,788,838 33 Iowa 1,918,2536 Illinois 9,763,744 34 Kansas 1,805,7767 Ohio 8,314,023 35 New Mexico 1,667,8688 Michigan 7,332,121 36 Nevada 1,547,8869 North Carolina 6,368,515 37 Utah 1,489,47110 New Jersey 6,281,955 38 West Virginia 1,403,48511 Georgia 6,155,188 39 Nebraska 1,167,77712 Massachusetts 6,041,779 40 Maine 1,174,09613 Virginia 4,620,335 41 Rhode Island 1,126,95515 Arizona 4,610,327 42 Idaho 1,037,94814 Washington 4,608,362 43 Hawaii 997,51916 Indiana 4,588,685 44 District of Columbia 989,48217 Tennessee 4,466,937 45 New Hampshire 876,46518 Missouri 4,402,589 46 Delaware 787,58619 Minnesota 4,400,976 47 Alaska 853,94320 Maryland 4,104,256 48 Montana 812,01321 Wisconsin 3,849,014 49 Vermont 691,86622 Louisiana 3,591,516 50 South Dakota 704,28123 Alabama 3,181,715 51 North Dakota 621,69524 Kentucky 3,089,460 52 Wyoming 519,13725 South Carolina 3,048,801 53 Virgin Islands 104,83127 Connecticut 2,987,378 54 Guam 99,26626 Colorado 2,855,775 55 American Samoa 66,42228 Oklahoma 2,848,531 56 N. Mariana Islands 59,815
TOTAL $230,363,313

Federal Funds Information for States www.ffis.org
Rank State Percent Rank State Percent1 Michigan 25.2% 27 Rhode Island 11.3%2 South Dakota 19.2 28 Nebraska 11.23 Vermont 19.0 29 Kentucky 11.04 New Hampshire 18.8 U.S. Average 10.85 Texas 17.6 30 West Virginia 10.66 Missouri 16.6 31 Iowa 10.57 North Dakota 16.5 32 Washington 10.18 Arizona 15.5 33 North Carolina 9.99 Mississippi 15.4 34 Ohio 9.910 Oklahoma 15.2 35 Wyoming 9.911 Arkansas 15.2 36 Georgia 9.612 South Carolina 14.9 37 Kansas 9.413 Florida 14.8 38 Maryland 9.314 Montana 13.7 39 Wisconsin 9.115 Nevada 13.5 40 Virginia 9.116 Tennessee 13.1 41 New Mexico 9.017 New York 13.0 42 Utah 8.918 Maine 12.7 43 California 8.819 Alabama 12.6 44 Minnesota 8.420 Oregon 12.5 45 Delaware 7.421 Louisiana 12.3 46 New Jersey 6.522 Illinois 12.2 47 Massachusetts 6.323 Colorado 12.2 48 Hawaii 6.024 Idaho 11.7 49 Connecticut 5.825 Indiana 11.6 50 Alaska 4.826 Pennsylvania 11.5
Federal Funds Information for States www.ffis.org
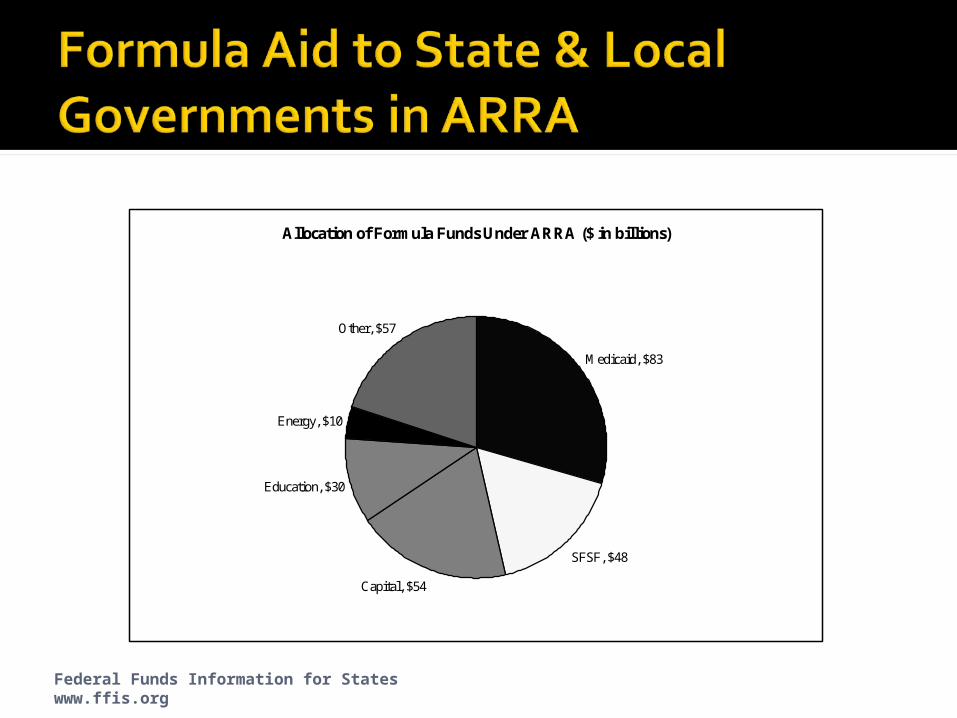
Allocation of Formula Funds Under ARRA ($ in billions)
Medicaid, $83
SFSF, $48
Capital, $54
Education, $30
Energy, $10
Other, $57

Increase in Medicaid matching rate (FMAP) ~ $82 billion All states are held harmless at their FY 2008
FMAP levels for FYs 2009, 2010 and the first quarter of 2011.
All states receive a 6.2 percentage-point increase in their FMAPs.
States receive a bonus FMAP addition depending on how much their unemployment rates have increased over a base level.
Medicaid MOE eligibility provisions apply. First two provisions apply to Foster Care and
Adoption.Federal Funds Information for States www.ffis.org
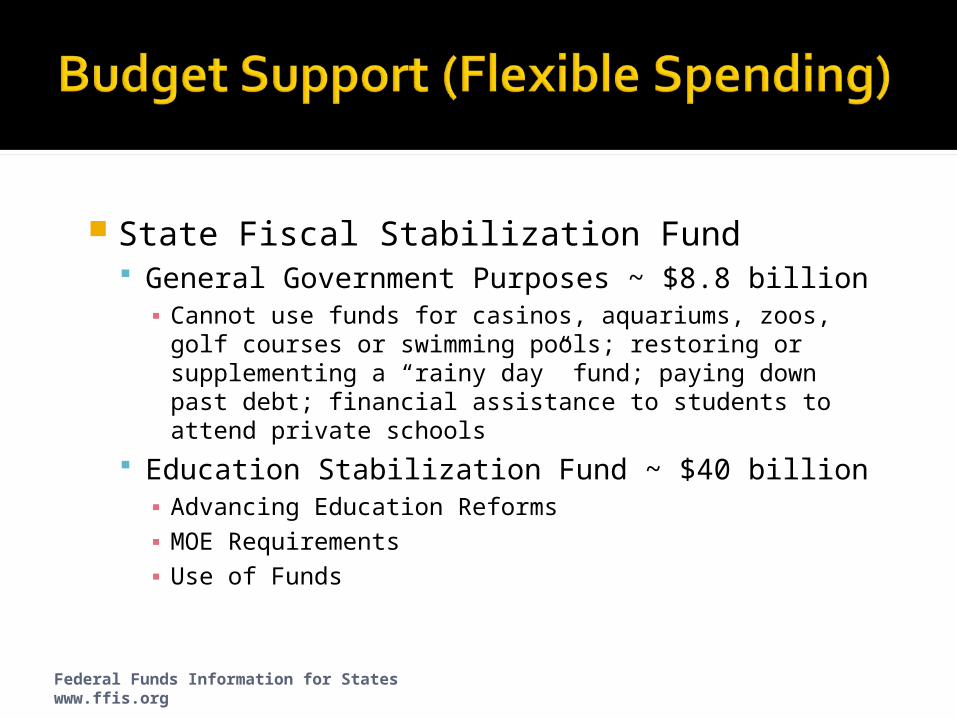
State Fiscal Stabilization Fund General Government Purposes ~ $8.8 billion▪ Cannot use funds for casinos, aquariums, zoos, golf
courses or swimming pools; restoring or supplementing a “rainy day” fund; paying down past debt; financial assistance to students to attend private schools
Education Stabilization Fund ~ $40 billion▪ Advancing Education Reforms▪ MOE Requirements▪ Use of Funds
Federal Funds Information for States www.ffis.org

Capital Funding – Smaller share than anticipated
Transportation ~ $47 billion State Certifications Highways – 50% of funds obligated by 6/30/2009 Transit – 50% of funds obligated by 9/1/2009
Education School construction; modernization, renovation or
repair
Federal Funds Information for States www.ffis.org
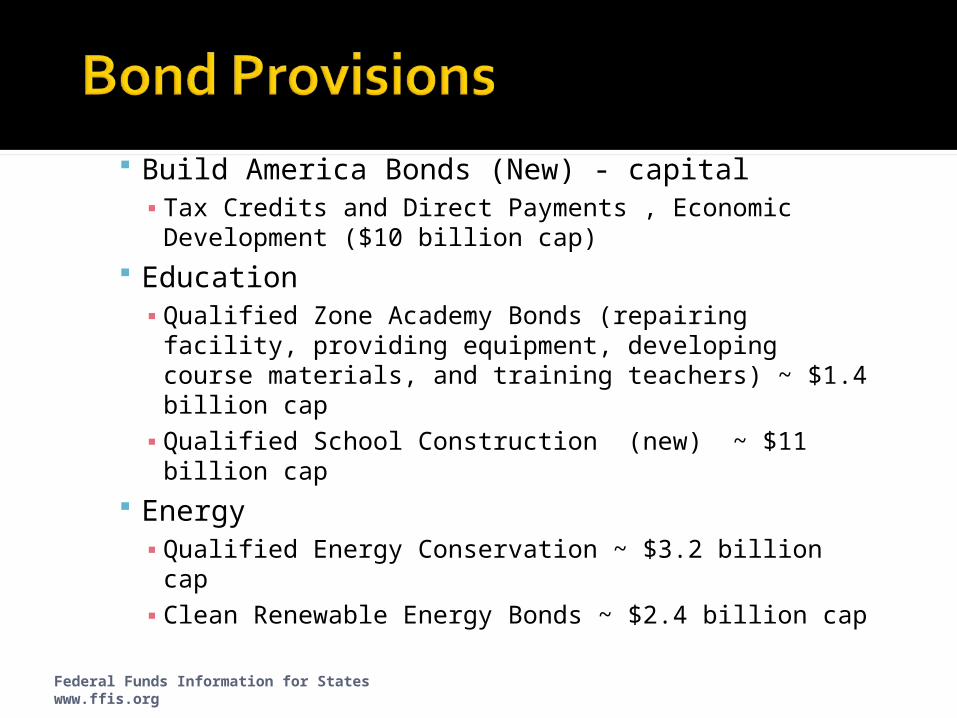
Build America Bonds (New) - capital ▪ Tax Credits and Direct Payments , Economic
Development ($10 billion cap) Education▪ Qualified Zone Academy Bonds (repairing facility,
providing equipment, developing course materials, and training teachers) ~ $1.4 billion cap
▪ Qualified School Construction (new) ~ $11 billion cap
Energy▪ Qualified Energy Conservation ~ $3.2 billion cap▪ Clean Renewable Energy Bonds ~ $2.4 billion cap
Federal Funds Information for States www.ffis.org

Can states spend this much money quickly?
Are targeted programs staffing up?
Does capacity exist to make rapid capital investments of this magnitude?
Can local school districts manage the infusion of federal funding?
Federal Funds Information for States www.ffis.org

What happens in FY 2011 and beyond? Balancing the state budget Downsizing an upsized staff Aid to local governments, schools
Federal Funds Information for States www.ffis.org

ARRA Reporting Requirements
Administrative Costs
Matching/MOE Requirements
Information Management
Measuring Success
Increased Federal OversightFederal Funds Information for States www.ffis.org


