2009 Labo r S urve y Results City o f Ma ricopa, Arizona P r ep ar ed for: City of Ma ric op a January 2010 P rep ared b y: Elliott D. Pollack & Com p a ny 7505 E as t 6 th Avenue, Suite 100 S cotts d a le, Ariz ona 85251
The following summarize the results of the 2009 City of Maricopa Survey as they relate toMaricopa’s economic competitiveness:
• Income and years of education are prime proxies to gauge skill level. Maricopa hasrelatively fewer employees earning less than $35,000 but significantly more of itspopulation earning between $50,000 and $100,000 compared to the broader economicregion. This proxy for skill set indicates Maricopa has a very skilled and abundantworkforce.
• Maricopa similarly has a smaller percentage of its residents with less than a bachelor’sdegree but a relatively abundant concentration of residents with either a bachelor’s orgraduate level degree.
• Most residents own homes which facilitates workforce stability.
• Maricopa residents currently work in a variety of industries, but when compared to theGreater Phoenix region relatively more work within higher value added (i.e. higher wage)industries such as manufacturing, finance and insurance, and medical professions. Thecommunity also has a relatively high concentration of engineers.
• Age distribution is slightly skewed towards older groups. This partly indicates moreretirees than the regional average. But, 45% of the respondents are between 25-54 yearsof age compared to only 41% in Pinal County. The additional people of retirement ageare more than offset by a smaller number of people under 18 years of age. Despite theretirement concentration, Maricopa’s workforce (i.e. working age residents) is actually
larger than average.
• The average household size is smaller than the county average which is consistent with aworkforce community.
• The above average workforce also commutes a long way to work. Many would prefer tobe closer to home as new business development occurs. Two thirds would take a similar job closer to home. Half would change careers.
• 98% favor employer recruitment.
The labor study identifies that the City of Maricopa has an outstanding workforce, both in terms
of quantity and quality. This beneficial attribute will prove to be a major economic development
asset. When combined with proper marketing and branding efforts, and possibly City specific
financial incentives, the development potential of the community will only improve. It is
recommended that the City consider the provision of “no opportunity cost” incentives in the
short term to induce industry expansion in key areas. These would be industries that the City
identifies to be both desirable and also has the potential to thrive based on the City’s attributes.
Elliott D. Pollac k & Comp any i www.arizonaeconomy.com
The following report outlines the results of a multi-platform resident survey conducted by ElliottD. Pollack & Company that analyzes the quality and demographic characteristics of the localpopulation. The City’s goals in the area of economic development are to create more local jobs
by marketing this workforce to new and expanding businesses. These surveys provide the Citywith detailed information about the education and skills of the workforce and serve as tools intheir marketing efforts.
The survey was available to residents online or by mail during November and December of 2009. Copies of the surveys are included in Appendix A. A long form survey identical to theonline survey was mailed out to residents. In addition, a shorter, more focused survey wasconducted via telephone during the same time period to obtain a statistically significant set of responses.
The results of this year’s survey have been compared to the 2008 Labor Survey administered by
the City of Maricopa where possible. The 2008 study included mail-in and online responses, butdid not include telephone interviews. Additionally, portions of the mail-in survey were alteredfrom last year. This required further explanation for those questions in order to compare yearover year results.
In order to obtain the highest response rate and measure of certainty, three different types of surveys were conducted. The first was a two page paper survey that was mailed to a randomsample of City residents. The same survey was also available online for residents who wished to
take it in that manner. A shorter, more focused survey was conducted via telephone. A brief description of these surveys is included below. In addition, examples of the survey instrumentsused are provided in an appendix following this report.
Mail/Online SurveyA list of resident addresses was obtained from Global Water Company, the primary waterprovider within Maricopa city limits. The addresses from Global Water Company wereconsidered to be occupied homes due to the fact that they had active accounts with the watercompany. No personal information for any resident or property owner was received. Of theapproximately 14,000 anonymous addresses, 5,000 were randomly chosen to receive a mailsurvey.
The mail survey included 29 questions that explored primarily employment, education, andsalary issues. Within the survey were questions targeted toward residents who were currentlyemployed and their spouse/partner as well as questions targeted towards the unemployed.Residents that received the mail survey were given a business reply envelope in which to returnthe completed survey. It was thought that by not requiring a stamp, the response rate would behigher.
Also on the paper survey was a link to a website that offered the same survey online. Residentswho had access to the internet could take the survey on the computer in lieu of filling out thepaper survey. The link to the online survey was also advertised by the City’s economic
development department in order to increase awareness and the response rate. The online surveywill initially be tabulated separately from the paper survey to see if there was any noticeabledifference in respondents.
Phone SurveyA phone survey was also conducted with the intention of getting statistically significant data fora more narrow set of questions. This survey asked about household size, employment status,educational attainment, and income. To get phone numbers for residents in Maricopa, severalsources were contacted. These sources claimed to have comprehensive listings for the MaricopaZIP codes. When asked about the number of telephone listings that they had available for theCity, each offered somewhere between 4,000 and 4,500. Though this represented less than a
third of households, it was determined that this was the largest accurate sample that we couldobtain. With a reasonable response rate, this sample size would yield statistically significantresults. The list was reported to include only land line numbers. Cell phone records for residentswere not available. The potential effect on survey results will be discussed below.
All of the phone surveys were completed between 4:00 pm and 8:00 pm on weekdays. Therewere a large number of disconnected numbers as well as no-answers. Nonetheless, the responserate has been high enough that a significant number of surveys were completed.
The mail and online survey was concluded on November 23, 2009 with over 600 combinedresponses. The first section included questions for the head of household regarding whether heor she was currently employed. The second section asked if the head of household was currently
unemployed. The third section asked about the employment status of the survey taker’s spouseor partner. The final section asked some general demographic questions about the household.Below, the summary will include responses from each question, but may not necessarily followthe order the questions were asked.
3.1 Demographics
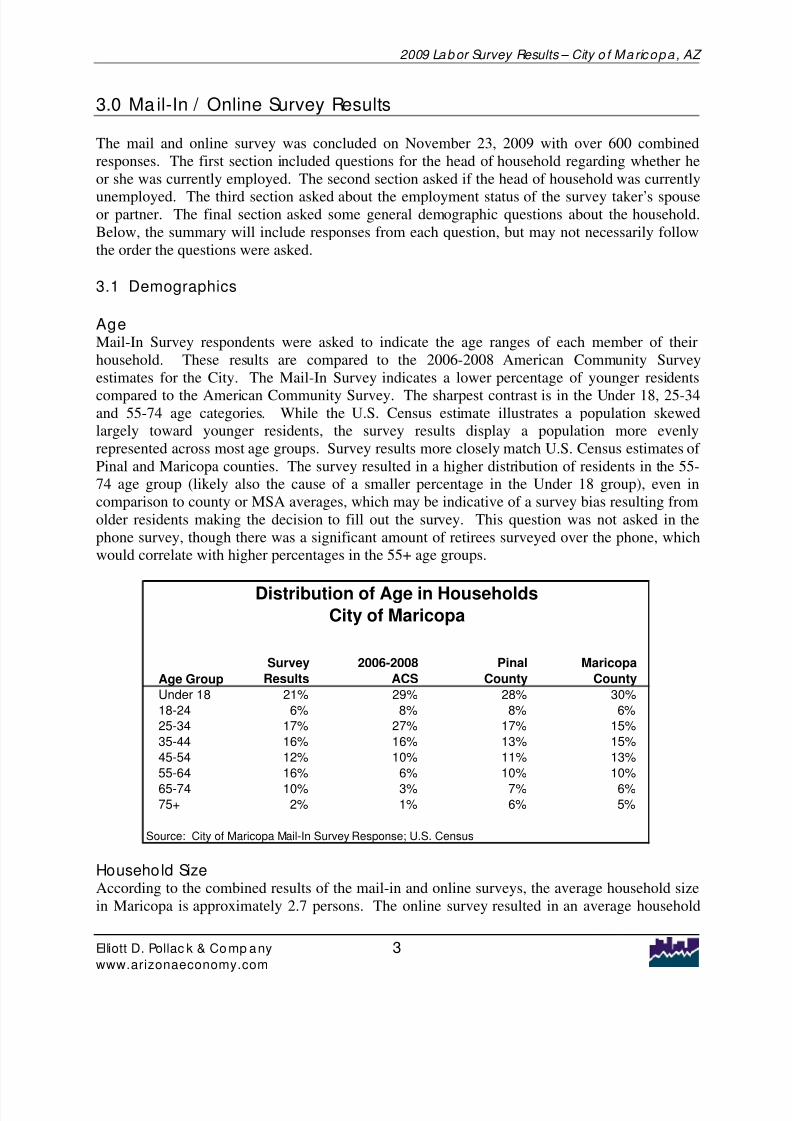
AgeMail-In Survey respondents were asked to indicate the age ranges of each member of theirhousehold. These results are compared to the 2006-2008 American Community Surveyestimates for the City. The Mail-In Survey indicates a lower percentage of younger residents
compared to the American Community Survey. The sharpest contrast is in the Under 18, 25-34and 55-74 age categories. While the U.S. Census estimate illustrates a population skewedlargely toward younger residents, the survey results display a population more evenlyrepresented across most age groups. Survey results more closely match U.S. Census estimates of Pinal and Maricopa counties. The survey resulted in a higher distribution of residents in the 55-74 age group (likely also the cause of a smaller percentage in the Under 18 group), even incomparison to county or MSA averages, which may be indicative of a survey bias resulting fromolder residents making the decision to fill out the survey. This question was not asked in thephone survey, though there was a significant amount of retirees surveyed over the phone, whichwould correlate with higher percentages in the 55+ age groups.
Age Group
Survey
Results
2006-2008
ACS
Pinal
County
Maricopa
County
Under 18 21% 29% 28% 30%
18-24 6% 8% 8% 625-34 17% 27% 17% 15%
35-44 16% 16% 13% 15%
45-54 12% 10% 11% 13%
55-64 16% 6% 10% 10%
65-74 10% 3% 7% 6%75+ 2% 1% 6% 5
Source: City of Maricopa Mail-In Survey Response; U.S. Census
City of MaricopaDistribution of Age in Households
%
%
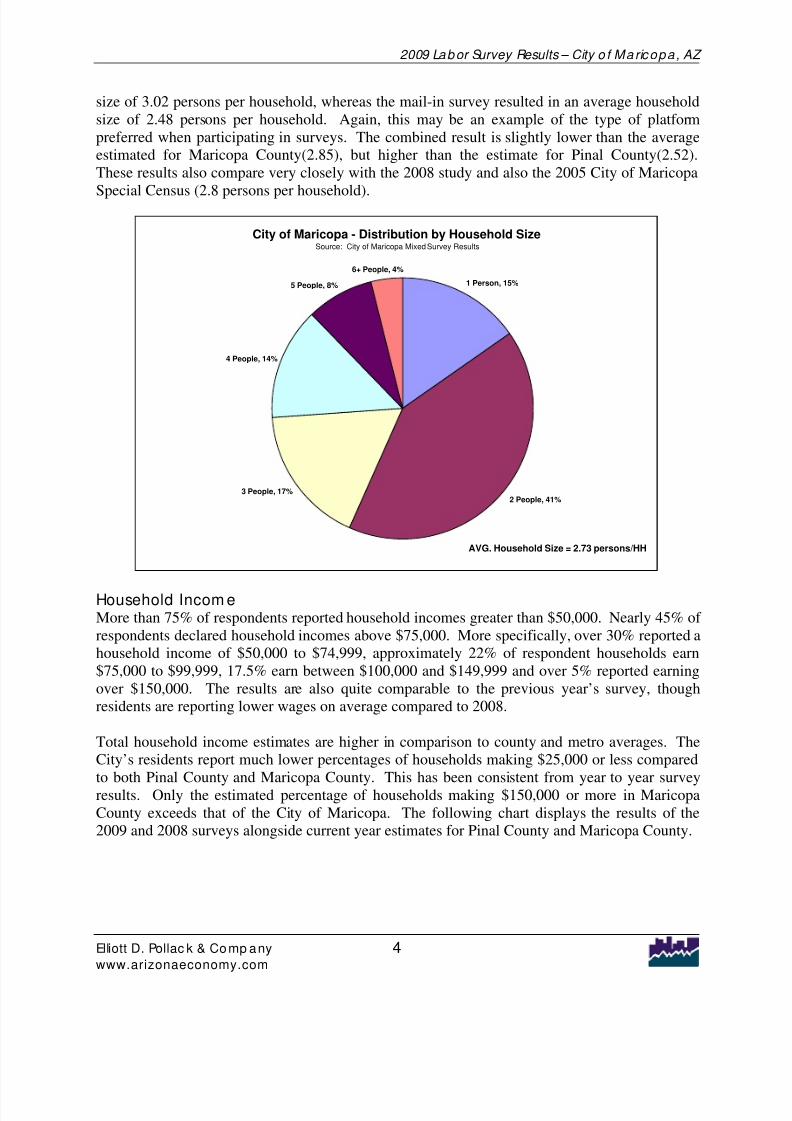
Household SizeAccording to the combined results of the mail-in and online surveys, the average household sizein Maricopa is approximately 2.7 persons. The online survey resulted in an average household
size of 3.02 persons per household, whereas the mail-in survey resulted in an average householdsize of 2.48 persons per household. Again, this may be an example of the type of platformpreferred when participating in surveys. The combined result is slightly lower than the averageestimated for Maricopa County(2.85), but higher than the estimate for Pinal County(2.52).These results also compare very closely with the 2008 study and also the 2005 City of Maricopa
Special Census (2.8 persons per household).
City of Maricopa - Distribution by Household SizeSource: City of Maricopa Mixed Survey Results
1 Person, 15%
2 People, 41%3 People, 17%
4 People, 14%
5 People, 8%
6+ People, 4%
AVG. Household Size = 2.73 persons/HH
Household Incom eMore than 75% of respondents reported household incomes greater than $50,000. Nearly 45% of respondents declared household incomes above $75,000. More specifically, over 30% reported ahousehold income of $50,000 to $74,999, approximately 22% of respondent households earn$75,000 to $99,999, 17.5% earn between $100,000 and $149,999 and over 5% reported earningover $150,000. The results are also quite comparable to the previous year’s survey, thoughresidents are reporting lower wages on average compared to 2008.
Total household income estimates are higher in comparison to county and metro averages. TheCity’s residents report much lower percentages of households making $25,000 or less comparedto both Pinal County and Maricopa County. This has been consistent from year to year surveyresults. Only the estimated percentage of households making $150,000 or more in MaricopaCounty exceeds that of the City of Maricopa. The following chart displays the results of the2009 and 2008 surveys alongside current year estimates for Pinal County and Maricopa County.
Range of Salary - Total HouseholdSource: City of Maricopa 2009 Mail-In/Online Survey Results; City of Maricopa 2008 Mail-In/Online Survey Results; ESRI
0.0%
5.0%
10.0%
15.0%
20.0%
25.0%
30.0%
35.0%
less than$15,000
$15,000 -$24,999
$25,000 -$34,999
$35,000 -$49,999
$50,000 -$74,999
$75,000 -$99,999
$100,000 -$149,999
Over $150,000
2009 Survey 2008 Survey Pinal County Maricopa County
EducationA large majority of respondents reported that they had had at least some college education.Nearly 89% of respondents reported at least some college education with 48.7% percent having abachelor’s or graduate degree. These results are quite comparable to the survey performed in2008, lending credibility to the data above other sources.
City of Maricopa - Highest Educational Attainment (Head of Household)Source: City of Maricopa Mail-In/Online Survey Results
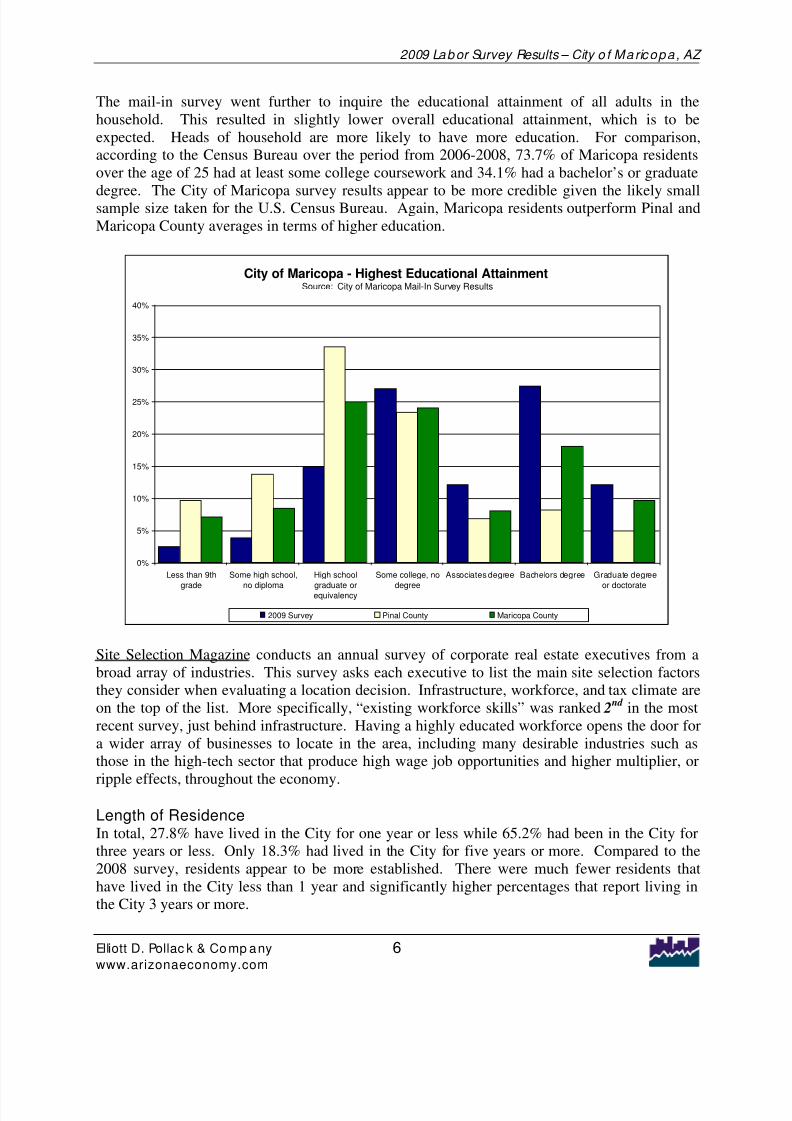
The mail-in survey went further to inquire the educational attainment of all adults in thehousehold. This resulted in slightly lower overall educational attainment, which is to beexpected. Heads of household are more likely to have more education. For comparison,according to the Census Bureau over the period from 2006-2008, 73.7% of Maricopa residentsover the age of 25 had at least some college coursework and 34.1% had a bachelor’s or graduate
degree. The City of Maricopa survey results appear to be more credible given the likely smallsample size taken for the U.S. Census Bureau. Again, Maricopa residents outperform Pinal andMaricopa County averages in terms of higher education.
City of Maricopa - Highest Educational AttainmentSource: City of Maricopa Mail-In Survey Results
Site Selection Magazine conducts an annual survey of corporate real estate executives from abroad array of industries. This survey asks each executive to list the main site selection factorsthey consider when evaluating a location decision. Infrastructure, workforce, and tax climate areon the top of the list. More specifically, “existing workforce skills” was ranked 2
nd in the mostrecent survey, just behind infrastructure. Having a highly educated workforce opens the door fora wider array of businesses to locate in the area, including many desirable industries such asthose in the high-tech sector that produce high wage job opportunities and higher multiplier, or
ripple effects, throughout the economy.
Length of ResidenceIn total, 27.8% have lived in the City for one year or less while 65.2% had been in the City forthree years or less. Only 18.3% had lived in the City for five years or more. Compared to the2008 survey, residents appear to be more established. There were much fewer residents thathave lived in the City less than 1 year and significantly higher percentages that report living inthe City 3 years or more.
City of Maricopa - Length of ResidencySource: City of Maricopa Mixed Survey Results
16.9%17.2%
20.2%
16.4%
8.9%8.6%
0.8%
10.9%
0.0%
5.0%
10.0%
15.0%
20.0%
25.0%
Under 1 year 1 year 2 years 3 years 4 years 5 years 6 to 9 years 10+ years
Prior Residenc eThe survey inquired where the household had lived prior to moving to Maricopa. Nearly 60% of the respondents had moved from a city in Maricopa County, with Phoenix and Chandler beingthe most frequently cited. Another 31.3% came from out of state. Over a quarter of residentsfrom out-of-state came from California, followed by Michigan (5%) and Colorado (4.5%).
City of Maricopa - Distribution by Previous ResidenceSource: City of Maricopa Mail-In/Online Survey Results
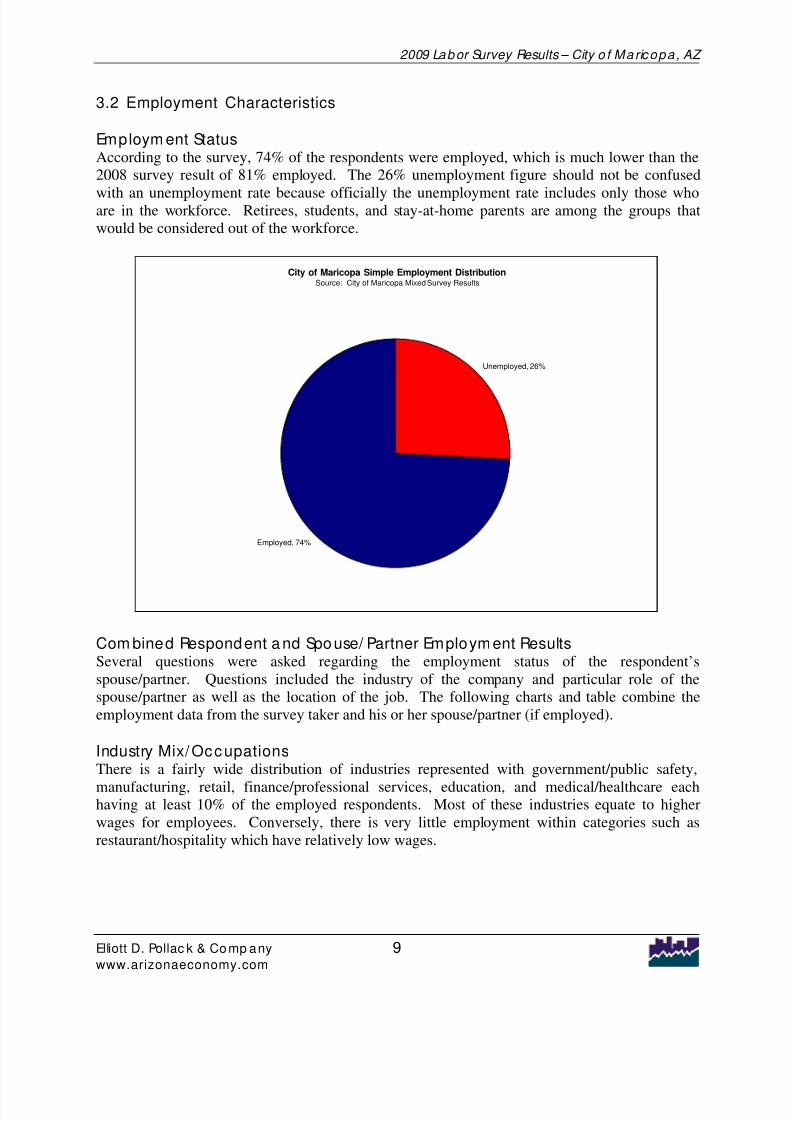
Employm ent StatusAccording to the survey, 74% of the respondents were employed, which is much lower than the2008 survey result of 81% employed. The 26% unemployment figure should not be confused
with an unemployment rate because officially the unemployment rate includes only those whoare in the workforce. Retirees, students, and stay-at-home parents are among the groups thatwould be considered out of the workforce.
City of Maricopa Simple Employment DistributionSource: City of Maricopa Mixed Survey Results
Unemployed, 26%
Employed, 74%
Com bined Respondent a nd Spouse/ Partner Employm ent ResultsSeveral questions were asked regarding the employment status of the respondent’sspouse/partner. Questions included the industry of the company and particular role of thespouse/partner as well as the location of the job. The following charts and table combine theemployment data from the survey taker and his or her spouse/partner (if employed).
Industry Mix/OccupationsThere is a fairly wide distribution of industries represented with government/public safety,
manufacturing, retail, finance/professional services, education, and medical/healthcare eachhaving at least 10% of the employed respondents. Most of these industries equate to higherwages for employees. Conversely, there is very little employment within categories such asrestaurant/hospitality which have relatively low wages.
Distribution of Occupational CategoriesSource: City of Maricopa Mail-In/Online Survey Results
Manufacturing, 11.1%
Retail, 11.9%
Restaurant / Hospitality,3.4%
Transportation /
Warehousing, 6.6%
Finance / Insurance / Professional Services,
16.0%
Real Estate, 2.5%
Education, 12.9%
Medical / Healthcare,11.5%
Arts / Entertainment / Recreation, 3.2%
Government / PublicSafety, 10.6%
Construction, 6.7%
Utilities, 2.0%Agriculture, 1.7%
Compared to the metro area as a whole, Maricopa has a much larger proportion of education andmanufacturing employees and a much smaller proportion of retail and finance/professionalservices employees.
Specific companies reported by respondents include Intel, General Dynamics, APS, Bank of America, Maricopa Unified School District, Wells Fargo, Avnet, Arizona State University,Southwest Airlines, City of Maricopa, State of Arizona, Countrywide Home Loans and Bashas’.This listing offers insight as to what areas within the broader industry categories these employeeshave experience in. Possibly the best example of this is within the manufacturing sector. Most
of the companies that were reported are within high value added manufacturing and hightechnology companies. These companies hire engineers, scientists and other knowledge workersto produce goods. Additionally, the broad range of companies within each industry illustratesthat there is not one major employer that the local population is dependent on.
Industry
% of
Total Key Employers
Agriculture 1.7% USDA
Utilities 2.0%
APS, Arizona Investment Council, Global Crossing Telecommunications, MHS, SaltRiver Project
Construction 6.7%
AZ Dept of Transportation, DMM Management/AT&T, RSC Equipment Rental, Wilson
Electric
Manufacturing 11.1%
Freescale Semiconductor, G.M. Corp, General Dynamics, Honeywell, Intel,
Microchip, Orbital Sciences
Retail 11.9% Bashas, Fry's, Home Depot, Power Toyota, Target, US Food Services, Walmart
Avnet, American Express Travel, Flying J, FedEx, Northwest/Delta Airlines,Southwest Airlines, US Airways
Finance / Insurance / ProfessionalServices 16.0%
Bank of America, CitiGroup, Countrywide, H&R Block, Liberty Mutual, Progressive,State Farm, Toyota Financial Services, TSYS Acquiring Solutions, Wells Fargo
Real Estate 2.5% Prudential
Education 12.9%
Apollo Group, Arizona State University, AZ Dept of Ed., Casa Grande Elem. SchoolDist., Chandler USD, Maricopa USD, Maricopa Community College, University of
Phoenix
Medical / Healthcare 11.5%
Chandler Regional Medical Center, Express Sripts, Scottsdale Healthcare, St.Joseph's Hospital, Tgen
Arts / Entertainment / Recreation 3.2% Casino Arizona, Harrah's
Government / Public Safety 10.6%
Ak-Chin Indian Community, City of Chandler, City of Maricopa, City of Mesa, City ofScottsdale, Maricopa County, Pinal County, State of Arizona, USPS
Respondents were also asked to describe the role he or she (and his or her spouse/partner) has intheir company. This question was intended to hone in on the job skills of the respondents. Inthis manner it can be determined whether the actual day to day job of someone in the“government” sector is administrative or more technical.
The chart below shows that the largest categories of job roles are professional services, technicalservices and administrative. Another 18.7% said that their role was “other”. Upon review, amajority of the “other” responses could be classified as professional services with descriptionssuch as manager, supervisor, or owner.
City of Maricopa - Total Employed Population
Distribution of Job Description CategoriesSource: City of Maricopa Mixed Survey Results
Plac e o f Emp loymentA third question that was asked of employed respondents and their spouses/partners was thelocation of their places of employment. Less than a quarter reported working in Maricopa while57.2% reported working in Chandler, Phoenix, or Tempe. The rest had jobs scattered primarilythroughout Maricopa County, with a small portion working in Casa Grande and others workingout of state.
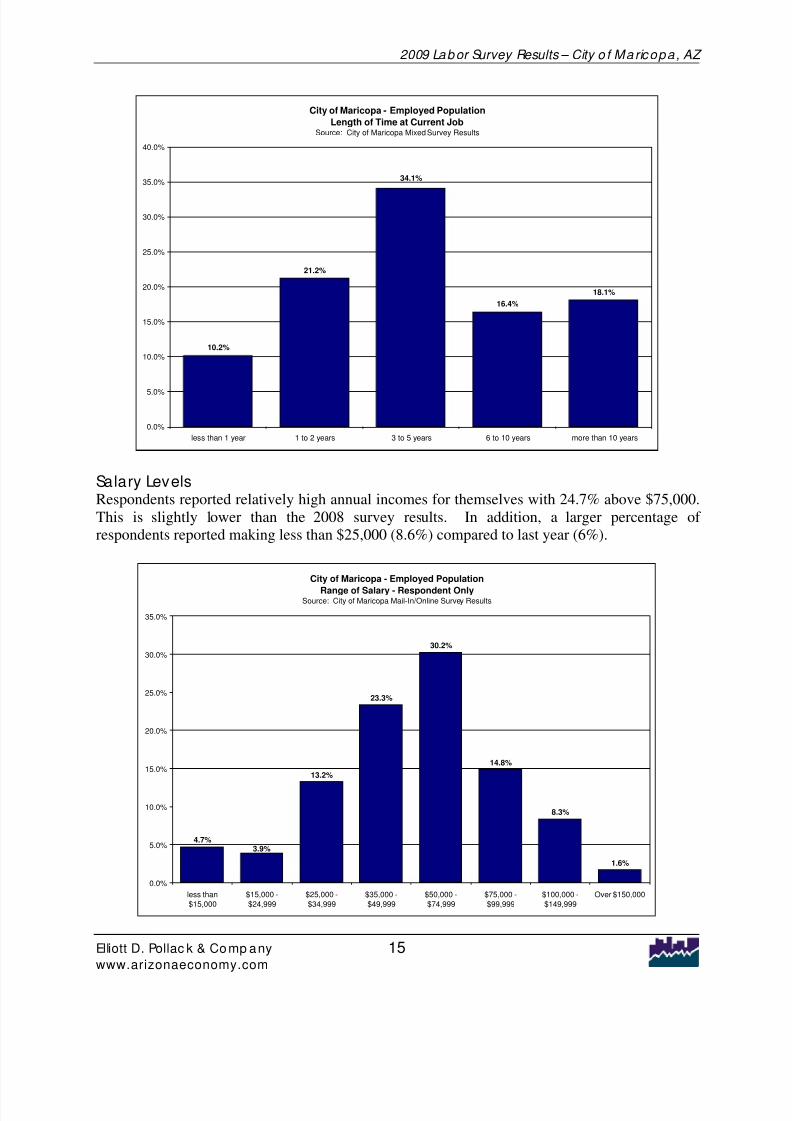
Leng th of Employm ent a t Current JobThere was a fairly even distribution regarding the length of time respondents had been at theircurrent job. The most frequent responses were between 3 to 5 years. Over 34% had been at theircurrent job for more than five years while 10.2% had been there for less than a year. Comparedto the 2008 survey, residents have become more established at their places of work, with lessresponding “less than 1 year” in the latest survey and many more responding that they hadworked 3 years or more at their current place of employment. The results are expected due to thecurrent state of the economy. Those that lost jobs and have not been able to secure a new one arenot represented in this data, nor have there been many hirings throughout the metro region. Inaddition, those that were able to retain their jobs during the recession have likely stayed at theircurrent place of employment due to a lack of alternatives.
Length of Time at Current JobSource: City of Maricopa Mixed Survey Results
10.2%
21.2%
16.4%
18.1%
34.1%
0.0%
5.0%
10.0%
15.0%
20.0%
25.0%
30.0%
35.0%
40.0%
less than 1 year 1 to 2 years 3 to 5 years 6 to 10 years more than 10 years
Salary LevelsRespondents reported relatively high annual incomes for themselves with 24.7% above $75,000.This is slightly lower than the 2008 survey results. In addition, a larger percentage of respondents reported making less than $25,000 (8.6%) compared to last year (6%).
City of Maricopa - Employed Population
Range of Salary - Respondent OnlySource: City of Maricopa Mail-In/Online Survey Results
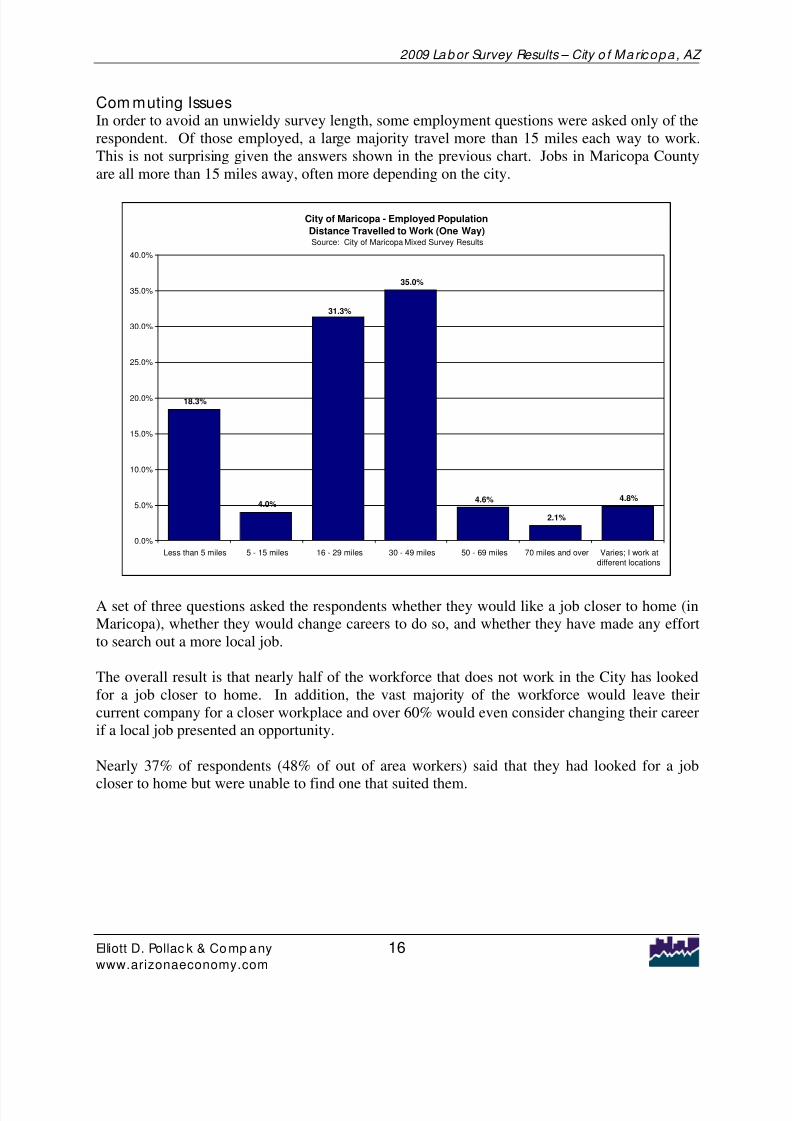
Com muting IssuesIn order to avoid an unwieldy survey length, some employment questions were asked only of therespondent. Of those employed, a large majority travel more than 15 miles each way to work.This is not surprising given the answers shown in the previous chart. Jobs in Maricopa Countyare all more than 15 miles away, often more depending on the city.
City of Maricopa - Employed Population
Distance Travelled to Work (One Way)Source: City of Maricopa Mixed Survey Results
18.3%
4.0%
35.0%
4.6%
2.1%
4.8%
31.3%
0.0%
5.0%
10.0%
15.0%
20.0%
25.0%
30.0%
35.0%
40.0%
Less than 5 miles 5 - 15 miles 16 - 29 miles 30 - 49 miles 50 - 69 miles 70 miles and over Varies; I work atdifferent locations
A set of three questions asked the respondents whether they would like a job closer to home (inMaricopa), whether they would change careers to do so, and whether they have made any effortto search out a more local job.
The overall result is that nearly half of the workforce that does not work in the City has lookedfor a job closer to home. In addition, the vast majority of the workforce would leave theircurrent company for a closer workplace and over 60% would even consider changing their careerif a local job presented an opportunity.
Nearly 37% of respondents (48% of out of area workers) said that they had looked for a job
closer to home but were unable to find one that suited them.
As further indication that respondents would like to see more jobs in the City, more than 61% of those that did not already work in the City would be willing to change careers to work closer tohome.
Would you consider changing careers to work closer to home?Source: City of Maricopa Mail-In/Online Survey Results
Yes, 47.1%
No, 29.7%
Not applicable / Alreadywork in Maricopa, 23.2%
As shown previously, the education and qualifications of the local workforce couldaccommodate a variety of industries. Additionally, the desires expressed by the active workforce
illustrates that there is an opportunity for potential employers to capture local employees if theylocate within the City and present comparable alternatives to their current employment.
3.3 Unemployment Charac teristic s
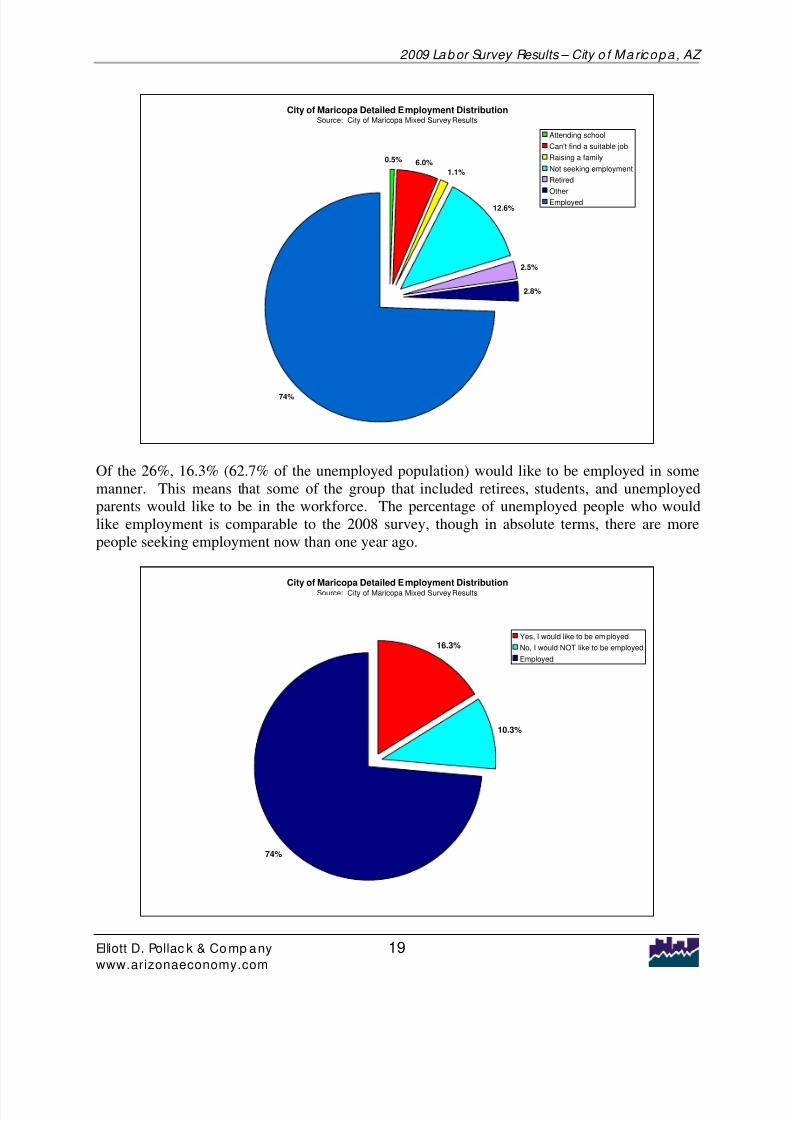
Respondents who were unemployed were asked the reasons for their unemployment.Comprising the 26% of those heads of household that noted that they were unemployed, 4.1%were retired, students, or raising a family. Another 2.8% listed “other” as their reason forunemployment and 12.6% were not actively seeking employment at the time. In total, 6.0%(making up 24% of the unemployed population) said that they were unemployed because they
City of Maricopa Detailed Employment DistributionSource: City of Maricopa Mixed Survey Results
0.5% 6.0%
1.1%
12.6%
2.5%
2.8%
74%
Attending school
Can't find a suitable job
Raising a family
Not seeking employment
Retired
Other
Employed
Of the 26%, 16.3% (62.7% of the unemployed population) would like to be employed in somemanner. This means that some of the group that included retirees, students, and unemployedparents would like to be in the workforce. The percentage of unemployed people who wouldlike employment is comparable to the 2008 survey, though in absolute terms, there are morepeople seeking employment now than one year ago.
City of Maricopa Detailed Employment DistributionSource: City of Maricopa Mixed Survey Results
A slight majority of those who would like to be employed are looking for full-time employment.
City of Maricopa Detailed Employment DistributionSource: City of Maricopa Mixed Survey Results
10.3%
9.5%
8.4%
74%
No, I would NOT like to be employed
I would like Full-time employment
I would like Part-time employment
Employed
Of the unemployed who were looking for a job, 65.1% reported they would travel at least 16miles each for their job. Curiously, 31.7% said they were only willing to travel 15 miles or less.This rather large subset appears only willing to look for jobs in Maricopa or nearby Casa Grande.
Currently Unemployed Seeking Employment
Maximum Allowable Travel Distance One Way to WorkSource: City of Maricopa Mixed Survey Results
31.7%
25.4%
2.4%
5.6%
30.2%
7.1%
0.0%
5.0%
10.0%
15.0%
20.0%
25.0%
30.0%
35.0%
Less than 5 miles 5 - 15 miles 16 - 29 miles 30 - 49 miles 50 - 69 miles 70 miles and over
When asked what the minimum salary range they would accept for a new job, 55.9% respondedwith ranges under $35,000. The reported salaries of currently employed residents were muchhigher. Over 78% of employed respondents had a salary above $35,000. The fact that theunemployed would accept so much less may indicate desperation for jobs and any sort of income. With such a lengthy recession, many actively seeking work may already be unemployed
for an extended period of time and are willing to work under their skill level or in a differentfield of work at least temporarily for a source of income. This scenario can be found incommunities across the state and nation.
Currently Unemployed Seeking Employment
Minimum Acceptable Salary RangeSource: City of Maricopa Mixed Survey Results
14.2%
11.0%
16.5%
21.3%
6.3%
0.8%
2.4%
30.7%
0.0%
5.0%
10.0%
15.0%
20.0%
25.0%
30.0%
35.0%
less than
$15,000
$15,000 -
$24,999
$25,000 -
$34,999
$35,000 -
$49,999
$50,000 -
$74,999
$75,000 -
$99,999
$100,000 -
$149,999
Over $150,000
3.4 Econom ic Deve lopm ent
The following chart details the answers to the question of whether it is important for the City toactively work to recruit new employers. The 98.1% that said yes underscores the desire of residents to bring new employment opportunities into the City. Granted, it would be expectedthat this response would be overwhelmingly “yes” in any City.
Do you think it is important for the City of Maricopa to actively work to
recruit new employers?
Don't care, 1.1%
No, 0.8%
Yes, 98.1%
What is notable is that almost a quarter of respondents felt the need to include a comment at theend of this question, many stressing their desire for more jobs and offering advice as to whichsectors to pursue. That sort of passion is not a foregone conclusion in other communities.
More specifically, many respondents expressed the desire/need for additional community
amenities. A hospital or medical center within the City was mentioned most often. There werealso many who wanted to see additional entertainment/recreational options developed locallysuch as a movie theater, bowling alley, additional retail stores, and other recreational facilities.There were a few comments expressing opposition to developing a municipal airport, insteadhoping to direct efforts towards the aforementioned community amenities.
In terms of business development, comments were directed mainly toward the cost of doingbusiness in Maricopa. There were many complaints directed toward office lease rates within theCity being overly burdensome and a barrier to starting a business. Many would like to see theCity provide incentives to land potential desirable businesses (health care, technology related,and green industries were specifically mentioned). Also, an overall decrease in regulatory
hurdles or bureaucracy was suggested.
Overall, many comments reinforced the purpose of the survey, which is to bring more businessesto the City of Maricopa to allow the local economy to thrive.
The purpose of completing a phone survey in addition to the paper survey was to add a degree of statistical significance to the results. It is thought that there may be some bias as to who answerspaper surveys and that a phone survey would be truly random. There were 400 phone interviews
completed and analyzed, which qualifies as a statistically significant survey. The results offer areliable alternative and double-check to the paper/online survey. Many of the questions askedover the phone were also asked in the paper/online survey. The phone survey results aresummarized below. Throughout this section is a discussion of the results of both surveys andhow they compare to one another.
4.1 Demographics
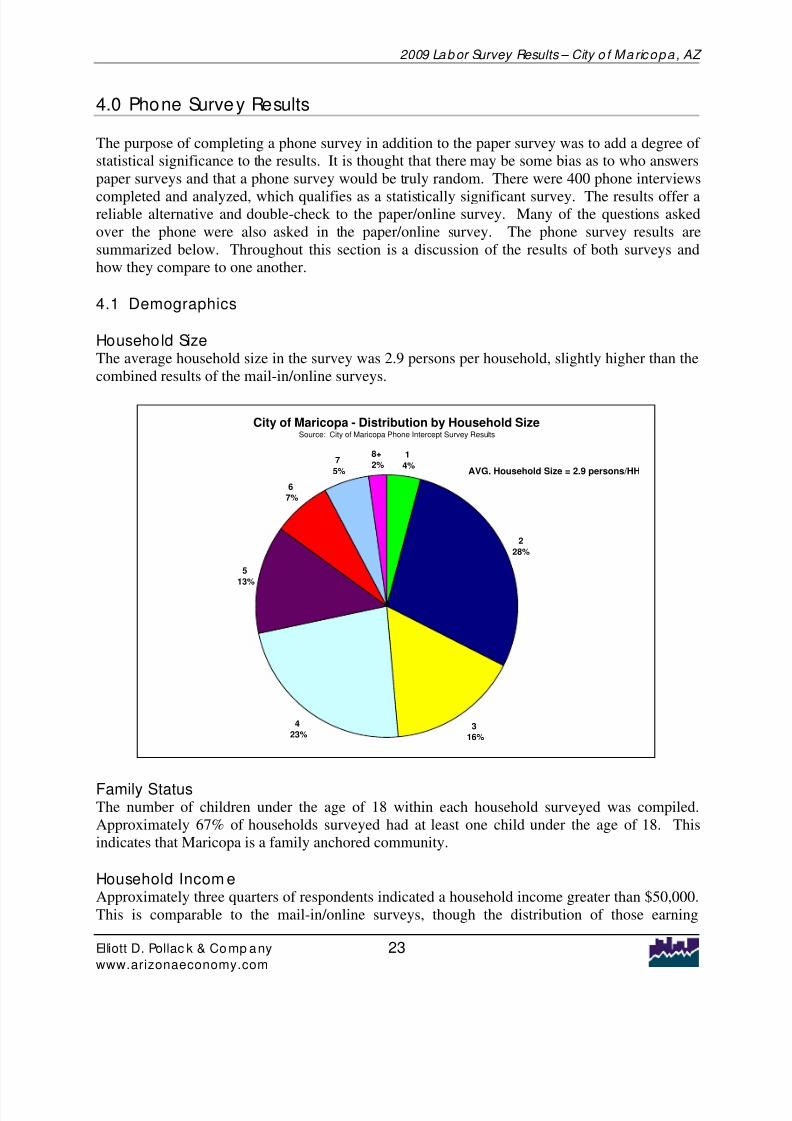
Household SizeThe average household size in the survey was 2.9 persons per household, slightly higher than thecombined results of the mail-in/online surveys.
City of Maricopa - Distribution by Household SizeSource: City of Maricopa Phone Intercept Survey Results
8+
2%7
5%
6
7%
5
13%
4
23%3
16%
2
28%
1
4%AVG. Household Size = 2.9 persons/HH
Family StatusThe number of children under the age of 18 within each household surveyed was compiled.Approximately 67% of households surveyed had at least one child under the age of 18. Thisindicates that Maricopa is a family anchored community.
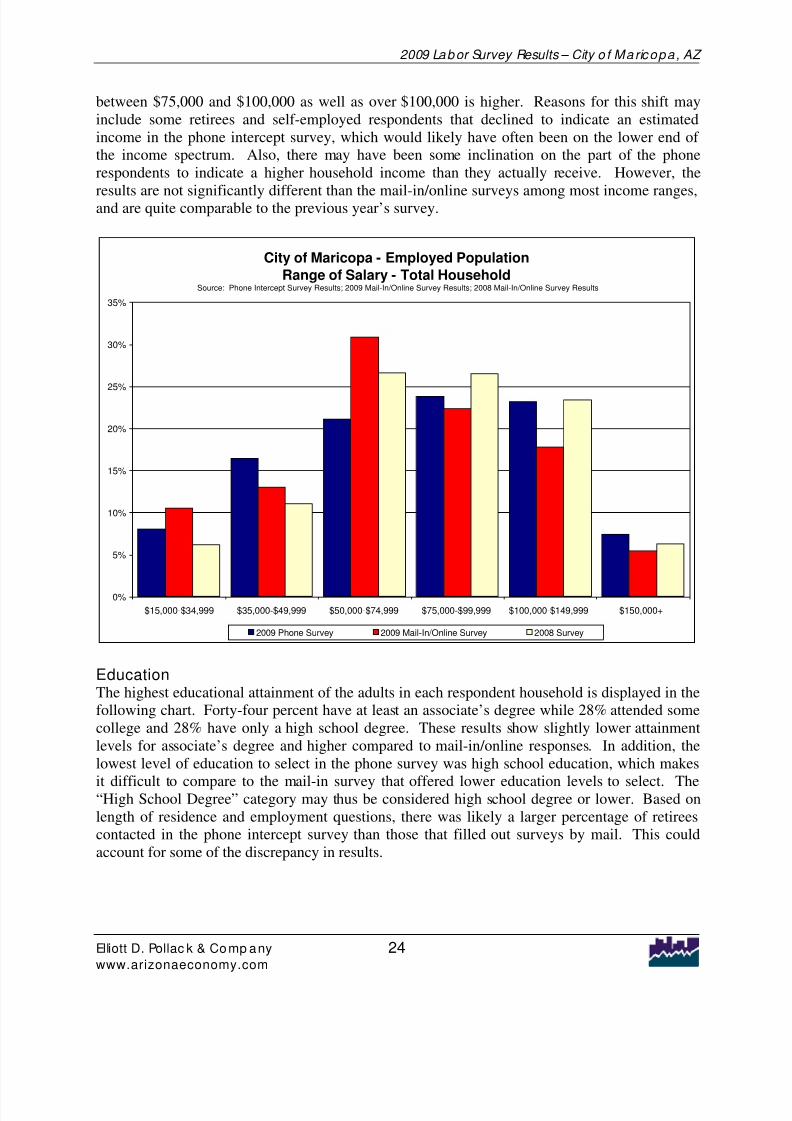
Household Incom eApproximately three quarters of respondents indicated a household income greater than $50,000.This is comparable to the mail-in/online surveys, though the distribution of those earning
between $75,000 and $100,000 as well as over $100,000 is higher. Reasons for this shift mayinclude some retirees and self-employed respondents that declined to indicate an estimatedincome in the phone intercept survey, which would likely have often been on the lower end of the income spectrum. Also, there may have been some inclination on the part of the phonerespondents to indicate a higher household income than they actually receive. However, the
results are not significantly different than the mail-in/online surveys among most income ranges,and are quite comparable to the previous year’s survey.
City of Maricopa - Employed Population
Range of Salary - Total HouseholdSource: Phone Intercept Survey Results; 2009 Mail-In/Online Survey Results; 2008 Mail-In/Online Survey Results
EducationThe highest educational attainment of the adults in each respondent household is displayed in thefollowing chart. Forty-four percent have at least an associate’s degree while 28% attended somecollege and 28% have only a high school degree. These results show slightly lower attainmentlevels for associate’s degree and higher compared to mail-in/online responses. In addition, thelowest level of education to select in the phone survey was high school education, which makes
it difficult to compare to the mail-in survey that offered lower education levels to select. The“High School Degree” category may thus be considered high school degree or lower. Based onlength of residence and employment questions, there was likely a larger percentage of retireescontacted in the phone intercept survey than those that filled out surveys by mail. This couldaccount for some of the discrepancy in results.
City of Maricopa - Highest Educational AttainmentSource: City of Maricopa Phone Intercept Survey Results
High School Degree,
28%
Some college or
Technical School, No
Degree, 28%
Associates Degree, 9%
Bachelor’s Degree,
25%
Graduate Degree, 10%
Length of ResidenceAccording to phone survey results, 72% of households had lived in Maricopa for 4 years or moreand only 5% reported 1 year or less. This represents a huge swing from mail-in/online results. Itappears that a larger portion of older, more established residents were contacted during the phonesurvey than completed a mail or online survey.
City of Maricopa - Length of ResidencySource: City of Maricopa Phone Intercept Survey Results
3%
2%
5%
18%
30%
16%
13% 13%
0%
5%
10%
15%
20%
25%
30%
35%
Less Than 1
year
1 year 2 years 3 Years 4 years 5 years 6-9 years 10+ years
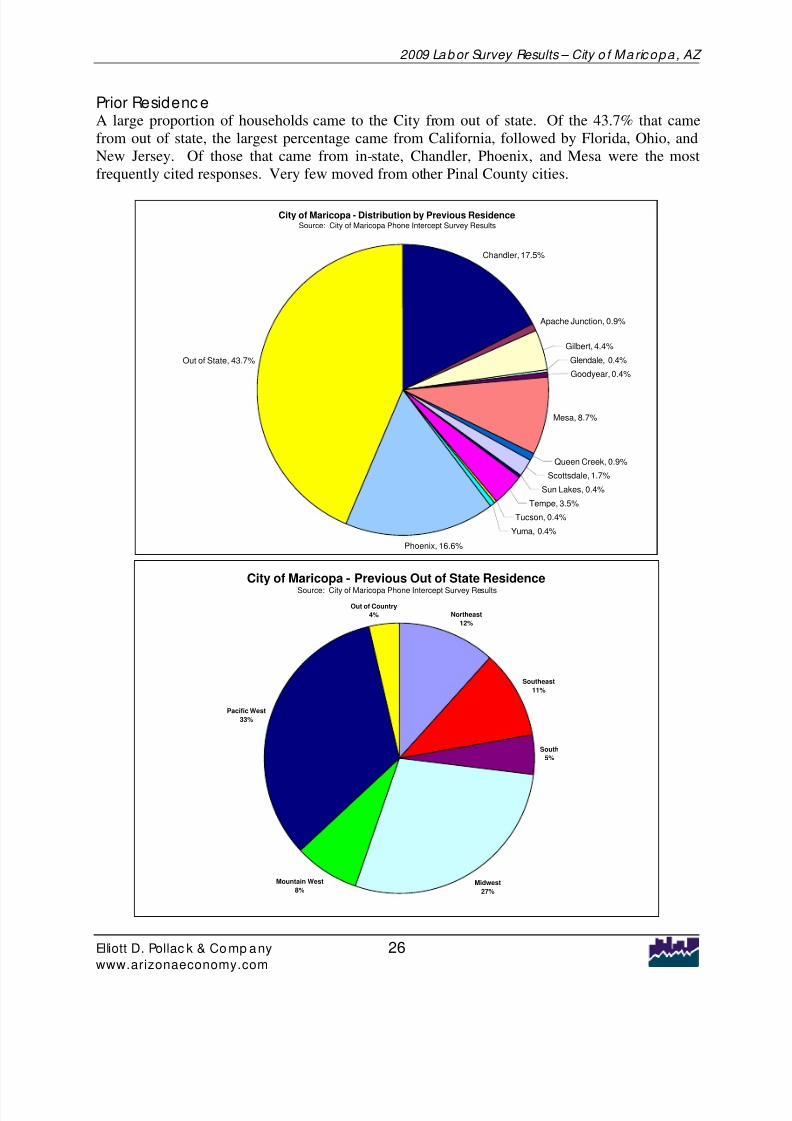
Prior Residenc eA large proportion of households came to the City from out of state. Of the 43.7% that camefrom out of state, the largest percentage came from California, followed by Florida, Ohio, andNew Jersey. Of those that came from in-state, Chandler, Phoenix, and Mesa were the mostfrequently cited responses. Very few moved from other Pinal County cities.
City of Maricopa - Distribution by Previous ResidenceSource: City of Maricopa Phone Intercept Survey Results
Chandler, 17.5%
Apache Junction, 0.9%
Gilbert, 4.4%
Glendale, 0.4%
Goodyear, 0.4%
Mesa, 8.7%
Queen Creek, 0.9%
Scottsdale, 1.7%
Sun Lakes, 0.4%
Tempe, 3.5%
Tucson, 0.4%
Yuma, 0.4%
Phoenix, 16.6%
Out of State, 43.7%
City of Maricopa - Previous Out of State ResidenceSource: City of Maricopa Phone Intercept Survey Results
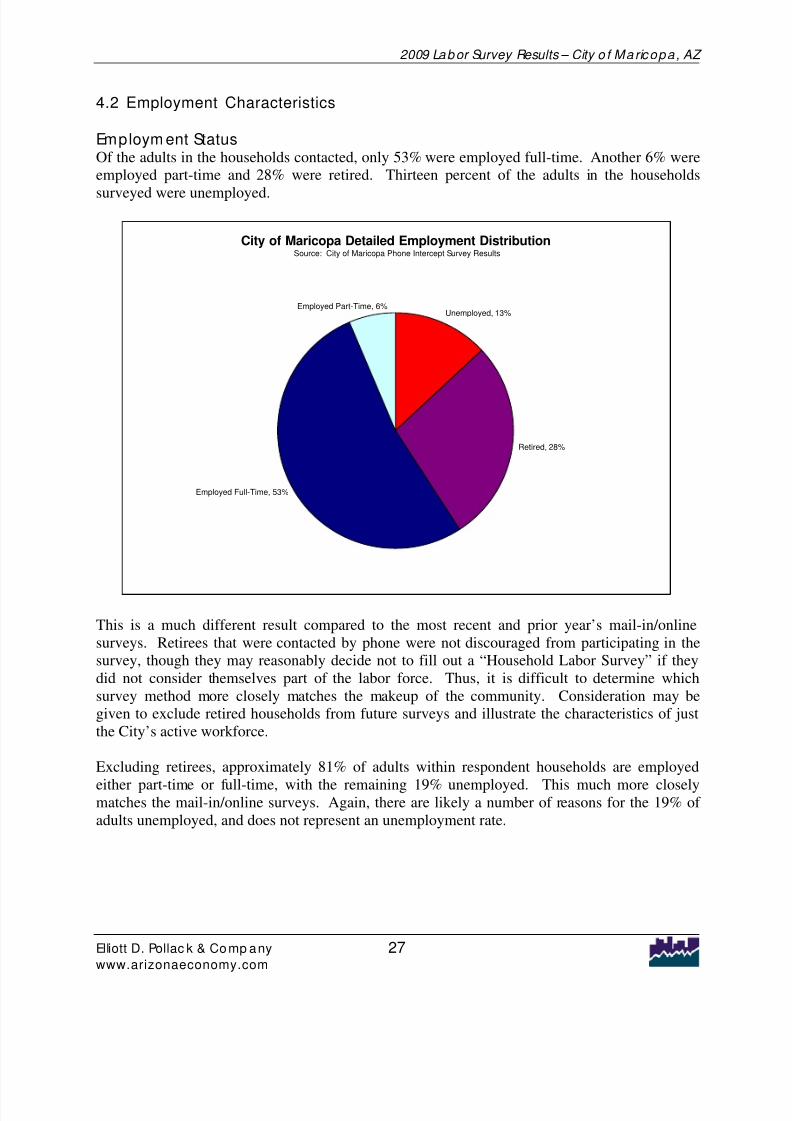
Employm ent StatusOf the adults in the households contacted, only 53% were employed full-time. Another 6% wereemployed part-time and 28% were retired. Thirteen percent of the adults in the households
surveyed were unemployed.
City of Maricopa Detailed Employment DistributionSource: City of Maricopa Phone Intercept Survey Results
Unemployed, 13%
Retired, 28%
Employed Full-Time, 53%
Employed Part-Time, 6%
This is a much different result compared to the most recent and prior year’s mail-in/onlinesurveys. Retirees that were contacted by phone were not discouraged from participating in thesurvey, though they may reasonably decide not to fill out a “Household Labor Survey” if theydid not consider themselves part of the labor force. Thus, it is difficult to determine whichsurvey method more closely matches the makeup of the community. Consideration may begiven to exclude retired households from future surveys and illustrate the characteristics of justthe City’s active workforce.
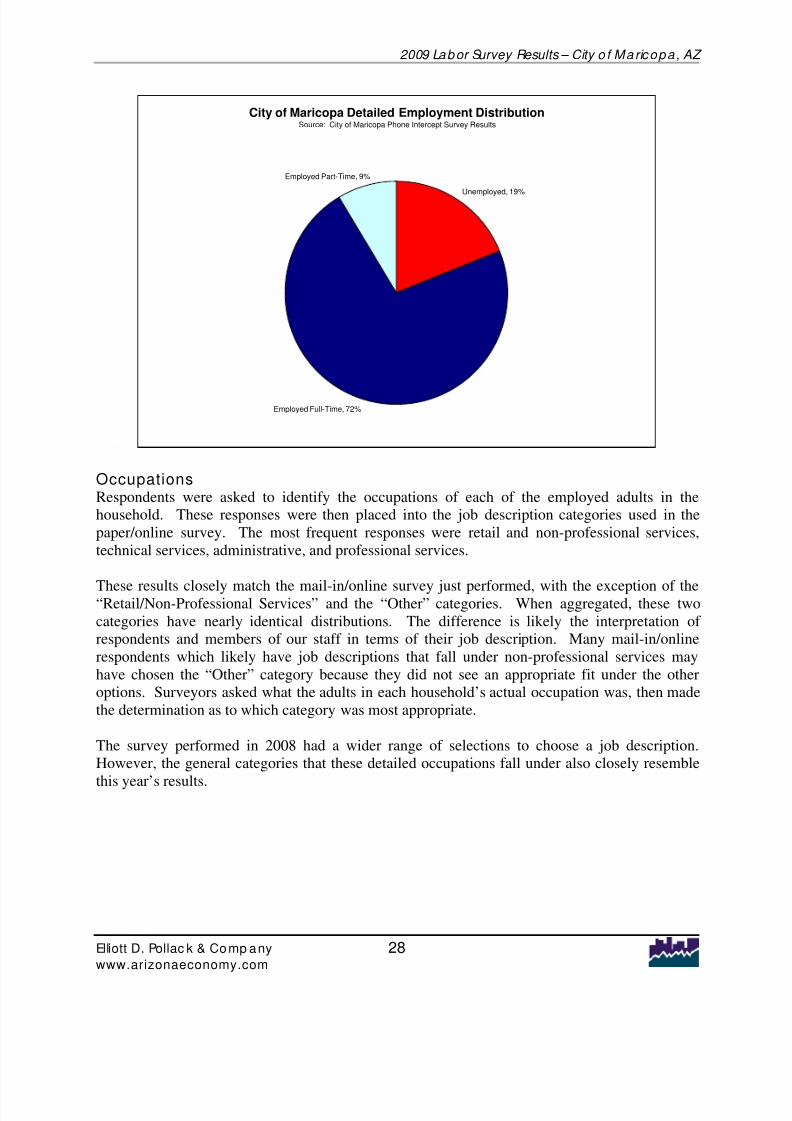
Excluding retirees, approximately 81% of adults within respondent households are employed
either part-time or full-time, with the remaining 19% unemployed. This much more closelymatches the mail-in/online surveys. Again, there are likely a number of reasons for the 19% of adults unemployed, and does not represent an unemployment rate.
City of Maricopa Detailed Employment DistributionSource: City of Maricopa Phone Intercept Survey Results
Unemployed, 19%
Employed Full-Time, 72%
Employed Part-Time, 9%
OccupationsRespondents were asked to identify the occupations of each of the employed adults in thehousehold. These responses were then placed into the job description categories used in thepaper/online survey. The most frequent responses were retail and non-professional services,technical services, administrative, and professional services.
These results closely match the mail-in/online survey just performed, with the exception of the“Retail/Non-Professional Services” and the “Other” categories. When aggregated, these twocategories have nearly identical distributions. The difference is likely the interpretation of respondents and members of our staff in terms of their job description. Many mail-in/onlinerespondents which likely have job descriptions that fall under non-professional services mayhave chosen the “Other” category because they did not see an appropriate fit under the otheroptions. Surveyors asked what the adults in each household’s actual occupation was, then madethe determination as to which category was most appropriate.
The survey performed in 2008 had a wider range of selections to choose a job description.However, the general categories that these detailed occupations fall under also closely resemble
Distribution of Job Description CategoriesSource: City of Maricopa Phone Intercept Survey Results
Administrative, 17%
Manufacturing /
Construction Worker, 4%
Retail and
Nonprofessional
Services, 25%
Education (ex: teacher,
professor), 7%
Medical / Healthcare (ex:
doctor, nurse), 7%
Professional Services,
18%
Technical Services (ex:
engineer, computer
programmer), 17%
Other, 3%
Public Safety (ex: police,
fire), 1%
Plac e o f Emp loymentJust over 28% of respondents work in the City of Maricopa while 25.5% work in Phoenix, 16.3%in Chandler, and 13.5% in Tempe. The remainder work in a variety of cities throughout GreaterPhoenix and Tucson as well as some that travel in and out of state.
City of Maricopa - Employed Population
Distribution by Place of EmploymentSource: City of Maricopa Phone Intercept Survey Results Coolidge, 0.2%
2. What level of education have you completed?□ Less than 9th grade□ Some high school, no diploma□ High school graduate or equivalency□ Some college, no degree□ Some technical or vocational school□ Associate degree□ Bachelor’s degree
□ Graduate degree or doctorate
3. Please list any industry certications or licenses youhold.________________________________________________________
If employed, continue answering the followingquestions. Otherwise, skip to the next section.
6. How far do you commute to work each way:□ Less than 5 miles□ 5-15 miles□ 16-29 miles□ 30-49 miles□ 50-69 miles□ 70 miles and over □ Varies; I work at different locations
7. How long have you worked at this company? □ Less than one year □ 1 to 2 years□ 3 to 5 years□ 6 to 10 years□ More than 10 years
8. Which ONE of the following best describes your role at your company?
□ Administrative□ Manufacturing / Construction worker □ Retail and nonprofessional services
□ Public Safety (ex: police, fire)□ Education (ex: teacher, professor)□ Medical / Healthcare (ex: doctor, nurse)□ Professional Services□ Technical Services (ex: engineer, computer programmer)□ Other ________________________
9. Which ONE of the following best describes theindustry your company works in?
□ Agriculture□ Utilities□ Construction□ Manufacturing□ Retail□ Restaurant / Hospitality□ Transportation / Warehousing□ Finance / Insurance / Professional Services□ Real Estate□ Education□ Medical / Healthcare□ Arts / Entertainment / Recreation□ Government / Public Safety
10. Please indicate your estimated annual income:□ Less than $15,000 □ $15,000-$24,999□ $25,000-$34,999 □ $35,000-$49,999□ $50,000-$74,999 □ $75,000-$99,999□ $100,000-$149,999 □ Over $150,0000
11. If you are commuting out of the local area, wouldyou be willing to accept a comparable job that iscloser to your home?
□ Yes □ No □ Already work in Maricopa
12. Would you consider changing careers to workcloser to home?
□ Yes □ No □ Already work in Maricopa
13. Have you already looked for a job closer to yourhome?
□ Yes □ No □ Already work in Maricopa
14. If you are currently NOT employed, please indicatewhy. (Check only one)
□ Attending school; course of study? ____________________□ Can’t nd a suitable job□ Raising a family□ Not looking for employment□ Retired□ Other: _____________________________________________
15. Would you like to be employed?□ Yes□ No (If no, please skip to question 19)
16. If you are interested in being employed, would
you prefer:□ Full-time employment□ Part-time employment
Save time! Fill out this survey online at MaricopaMatters.com
2009 City of Maricopa Household Labor SurveyThe Maricopa Economic Development Ofce is pleased to be working
with Elliott D. Pollack & Co. to update the Maricopa community laborstudy, an important tool in identifying appropriate target industriesfor the area as well as the information most requested by all types of prospective employers.
17. How far would you be willing to commute?□ Work from home□ Less than 5 miles□ 5-15 miles□ 16-29 miles□ 30-49 miles□ 50-69 miles□ 70 miles and over
18. What salary range would be the minimum you
would accept?□ Less than $15,000 □ $15,000-$24,999□ $25,000-$34,999 □ $35,000-$49,999□ $50,000-$74,999 □ $75,000-$99,999□ $100,000-$149,999 □ Over $150,0000
Spouse/Partner/Household Employment.
19. Is your spouse or partner currently employed?□ Yes □ No □ No spouse or partner
If you answered “Yes”, please continue answeringthe following questions. Otherwise, skip to the next section.
20. Which ONE of the following best describes his orher role at the company?
□ Administrative□ Manufacturing / Construction worker □ Retail and nonprofessional services□ Public Safety (ex: police, fire)□ Education (ex: teacher, professor)□ Medical / Healthcare (ex: doctor, nurse)□ Professional Services□ Technical Services (ex: engineer, computer programmer)□ Other ________________________
21. Which ONE of the following best describes theindustry he or she works in?