2009 New Mexico Youth Risk and Resiliency Survey (YRRS) Middle School (Grades 6 - 8) Lincoln County New Mexico Department of Health New Mexico Public Education Department University of New Mexico Prevention Research Center
Transcript
2009 New Mexico Youth Risk and Resiliency Survey (YRRS)
Middle School (Grades 6 - 8)
Lincoln County
New Mexico Department of Health
New Mexico Public Education Department
University of New Mexico Prevention Research Center
ACKNOWLEDGEMENTS
The production of this report was made possible by collaboration between the New Mexico Department of Health (NMDOH), and the New Mexico Public Education Department (NMPED), with technical support from the University of New Mexico Prevention Research Center (UNM PRC) and the Division of Adolescent and School Health, Centers for Disease Control and Prevention (CDC-DASH). Gratitude is extended to the individuals listed below for their contribution toward developing and producing this report.
New Mexico Public Education DepartmentSusanna M. Murphy, Ph.D., Secretary of Education Sheila Hyde, Ph.D., Deputy Secretary, Learning and AccountabilityKristine M. Meurer, Ph.D., Acting Assistant Secretary, Student Success Division *William O. Blair, Ph.D., Assistant Director, School and Family Support Bureau *Dean Hopper, M.A.Ed., Assistant Director, School and Family Support BureauLonnie Barraza, M.S.Ed, HIV Program Administrator *
New Mexico Department of HealthAlfredo Vigil, MD, SecretaryC. Mack Sewell, DrPH, MS, State EpidemiologistMichael Landen, MD, MPH, Deputy State Epidemiologist *Dan Green, MPH, Social Indicator Epidemiologist *James Padilla, MS, Epidemiologist *James Farmer, MPH, Health Services Manager, Office of School and
Adolescent Health *Mary M. Ramos, MD, School Health Officer *
University of New Mexico Prevention Research CenterLinda J. Peñaloza, PhD, Principal Investigator *Tamar Ginossar, PhD *Crystal Romney, CPSJacque M. Garcia, BALaura Gutman, PhDTom R. Noland, BS
(Individuals who served on the NM-YRRS 2009 Steering Committee are identified by an *.)
Table of Contents
Acknowledgements
Introduction 7
How to Read This Report 7
Understanding the Charts, and a Word about Error Bars 8
Methodology 10
Limitations of the YRRS 11
Participation in Lincoln County 11
Profile of Students Surveyed in Lincoln County 11
Risk Behaviors 13
Personal Safety 15
Behaviors Contributing to Unintentional Injury
Behaviors and Experiences Associated with Violence
Mental Health 25
Tobacco 31
Alcohol 53
Drugs 63
Sexual Behavior 69
Body Weight and Weight Control 75
Physical Activity
Asthma 99
Other Characterstics 105
Food Sufficiency
Grades
Protective (Resiliency) Factors 115
Appendix A 129
2007 New Mexico Youth Risk and Alamogordo Public SchoolsNew Mexico Department of HealthACKNOWLEDGEMENTSThis report was made possible by a collaboration between the New Mexico New Mexico Public Education Department
5
6
2009 New Mexico Middle School Youth Risk and Resiliency Survey (YRRS)
Lincoln County
Introduction
This report contains county level middle school results from the 2009 New Mexico Middle School
Youth Risk and Resiliency Survey (YRRS), a statewide survey of public school students, grades 6 -
8. Statewide and county level results will be available at www.YouthRisk.org and
www.health.state.nm.us/ERD/HealthData/yrrs.shtml. Together, these documents comprise a
useful tool for those working on youth-related issues at the state and local level.
The YRRS is organized into two major content areas: risk behaviors and protective (resiliency)
factors. Risk behaviors include behaviors associated with unintentional injury, violence, sadness
and suicidal ideation, tobacco use, alcohol use, drug use, sexual activity, physical activity, and
nutrition. Protective or resiliency factors are measures of the positive and supportive relationships,
experiences, activities, resources and values that encourage healthy youth development.
Resiliency factors and related traits include caring and supportive relationships in the family,
school, community and with peers; boundaries set by the family and school; positive peer support;
meaningful participation and constructive use of time in school and outside of school; and others
(Appendix B).
Additionally, this report includes a section on academic measures and traits. These academic
measures include getting good grades (mostly A's and B's), trying hard to do good work in school,
planning to go to college, skipping or ditching school, coming to class with paper and something to
write with, and completing homework.
How to Read this ReportThis report has three main sections, each of which consists of a set of bar and line charts. The
first section presents the results of the major risk behaviors examined in the survey. Each
category of risk behavior is presented with several data charts. At the beginning of each topic
area, a set of line charts gives results for multiple survey years of the YRRS (2003, 2005, 2007,
and 2009). A following set of bar charts compares results for the county to results for the entire
state, compares the behaviors of boys to those of girls, and makes comparisons between grade
levels within the county.
The second section presents results for the academic measures and behaviors. As with the risk
behaviors, there are line and bar charts presenting trends, a comparison between the state and the
county, a comparison between boys and girls in the county, and a comparison of grade levels
within the county. Using the same styles of charts, the third section of the report presents results
for the resiliency/protective factors.
In some cases when there were very few students in a particular age or gender group, data have
been suppressed to protect the anonymity of the individual respondents.
NOTE: County level YRRS reports are freely available. School district reports have been distributed to school district
offices. School districts are encouraged to reproduce and share these reports with community groups concerned with
prevention and health promotion. However, school district level results will not be released without express permission
of the school district superintendent. Forms for requesting school district data are available at www.YouthRisk.org.
7
Understanding the Charts - and A Word about Error Bars
The bar charts in this report present the percentage of students who reported engaging in any
given risk behavior or who reported having any given protective factor. The height of the bars
conveys the percentage of students reporting each trait, and provides a quick visual comparison
between different groups of students reporting that trait. A label for each bar presents the actual
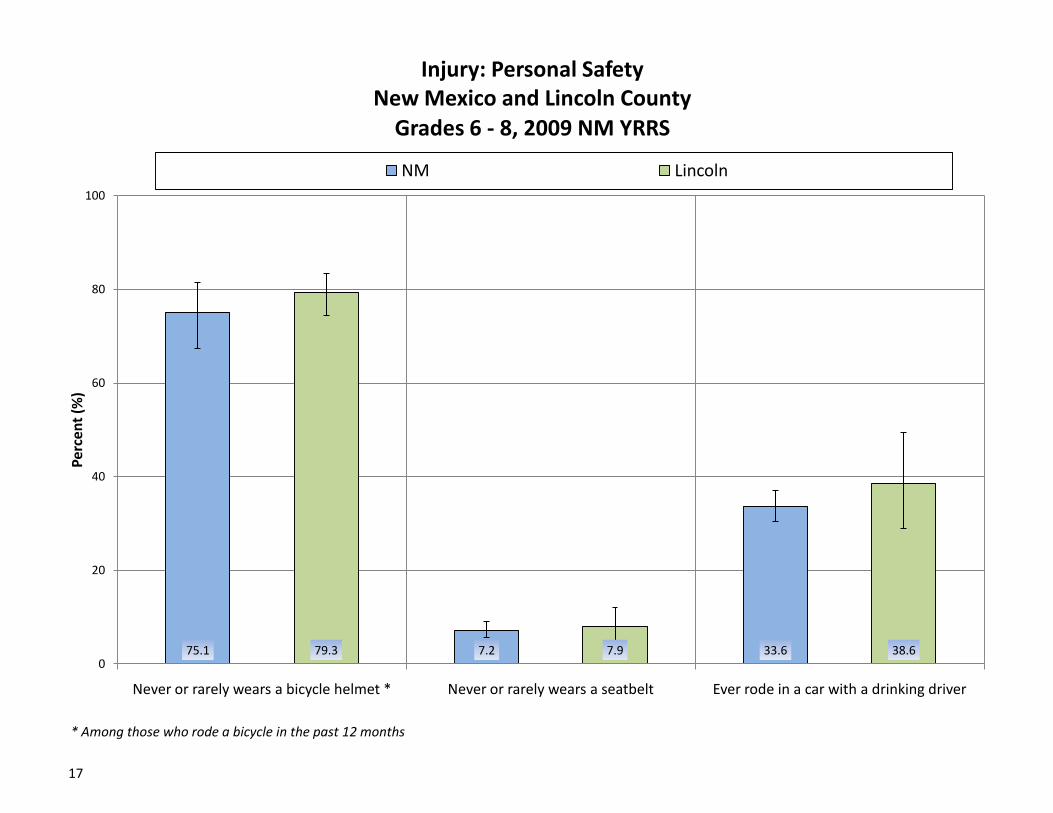
percentage of students who reported each trait. For instance, the chart on page 17, Personal
Safety: Injury, shows that 7.2% of students in New Mexico rarely or never wore seatbelts, while
7.9% of students in Lincoln County rarely or never wore seatbelts.
Because of the high cost and logistical complications involved in conducting a statewide survey,
the YRRS was administered to a sample of students, rather than to every single student in each
school district. Because YRRS data are from a sample of students, and not the entire student
body, the results in this report are estimates . As with all estimates, there is some uncertainty
associated with each of these estimates. On the charts in this report, this degree of uncertainty is
represented by an error bar (or confidence interval). The error bar is the thin 'I' shaped line that
extends above and below the end of each bar in a chart. One of the major influences on the size
of the confidence interval or error bar is the number of participants in the survey. In general, this
means that with more students participating in the survey, there will be a higher degree of
confidence in the results (i.e., error bars will be smaller).
The proper interpretation of an error bar can be illustrated by looking at the chart below. This
chart compares the New Mexico prevalence of smoking and cocaine use to the United States
prevalence for 2005, a previous survey year. The chart shows that the prevalence of current
smoking was 25.7% in New Mexico and 23.0% in the United States. The error bar for the estimate
of current smoking among New Mexico students extends approximately 4 percentage points in
either direction, from 22.0% to 29.8%. This means that we are confident that the actual
percentage of smokers in this group of students was between 22.0% and 29.8%. The error bar for
the estimate current smoking in the US extends approximately 2.5 percentage points in either
direction, from 20.7 to 25.3%. We are confident that the actual percentage of smokers among
this group was between 20.7% and 25.3%.
Current Smoking and Current Cocaine UseGrades 9 - 12, 2005
Current Smoking and Current Cocaine UseGrades 9 - 12, 2005
8
How does knowing the upper and lower limits of our error bars help us? While it appears at first
glance that New Mexico had a higher prevalence of smoking than the United States (25.7% vs.
23.0%), a closer look at the error bars shows a more complicated picture. The error bars for the
New Mexico estimate (22.0% - 29.8%) and the US estimate (20.7% - 25.3%) overlap. Because
of this overlap, we do not have a high degree of confidence that the prevalence of smoking in
New Mexico is actually different from the prevalence in the United States. In other words, the
difference between the prevalence of smoking in New Mexico and the United States is not
statistically significant.
For cocaine use it also appears that in 2005, New Mexico had a higher prevalence than the United
States (7.9% vs. 3.4%). The error bar for New Mexico extends from 6.6% to 9.5%, and the error
bar for the United States extends from 2.8% to 4.4%. Because the higher bound of the US error
bar (4.4%) is lower than the lower bound of the NM error bar (6.6%), these error bars do not
overlap. For cocaine use, we are confident in saying that the New Mexico prevalence was higher
than the US prevalence. In other words, the difference between the 2005 prevalence of cocaine
use in New Mexico and the United States was a statistically significant difference.
For some small counties, error bars have been removed from this report. With small populations,
the number of students sampled can approach the total student population. In these cases, error
bars would have limited meaning because with a high percentage of students surveyed, there is
less uncertainty around the estimates than error bars suggest.
Error bars DO overlapNo statistically significant difference.
Error bars DO NOT overlap. Difference is statistically significant.
Current Smoking and Current Cocaine UseGrades 9 - 12, 2005
Error bars DO overlapNo statistically significant difference.
Error bars DO NOT overlap. Difference is statistically significant.
Current Smoking and Current Cocaine UseGrades 9 - 12, 2005
9
Methodology
The YRRS was implemented in the fall semester of the 2009-10 school year. All public school
districts in New Mexico were invited to participate in the 2009 Middle School YRRS. Of 89 districts
statewide, 74 districts participated. From each participating school district, schools with students
from 6th to 8th grades were selected to participate.* The probability of selection of each school
was proportional to the size of its 6th-8th grade population. In large school districts only some of
the schools were selected to participate, while in small districts, all schools were selected.
Classrooms were systematically selected from each school, and all students in each selected
classroom were asked to participate.
In each participating school, a single day was arranged on which to administer the survey.
Questionnaire forms and pencils were distributed to each student in participating classes, and
students were asked to fill out the questionnaires independently of other students and without
teacher assistance.
Questionnaires were electronically scanned, and data were analyzed using STATA 10.1, a
statistical software program.
Limitations of the YRRS
All information from the YRRS was self-reported by the participating students. While most
questions on the YRRS come from nationally validated surveys, and data quality has been
demonstrated to be very high in national surveys, there is no way to guarantee the truthfulness of
the participants in any survey that relies on self-reporting.
A good response rate is one of the most important goals in conducting a survey. At the school
district level, a response rate is the percentage of all students selected for the survey who
complete and return a useable questionnaire form. At the state level, the response rate
incorporates the participation of school districts and schools as well as the participation of
students. An adequate response rate means that survey results are more likely to represent the
actual student population. The statewide response rate for the 2009 Middle School YRRS was
68%, an adequate response rate to represent the population.
In order to achieve a statewide response rate of 60% or greater, we aimed for a 75% response rate
from each participating school district. Most participating school districts and counties met this
target or were close to it. While the response rate was generally very good in participating schools,
the overall response rate was driven down by the school districts that declined to participate.
* The High School YRRS was also conducted at the same time; results from that survey are published separately.
10
Participation in Lincoln County
Profile of students surveyed
Number of students Percent (%)
Total 434 100%
Gender
Girls 205 (47.3%)
Boys 228 (52.7%)
Race/Ethnicity
American Indian 81 (20.0%)
Asian or Pacific Islander 7 (1.7%)
Black or African-American 12 (3.0%)
Hispanic 160 (39.6%)
White 144 (35.6%)
Grade Level
6th 133 (30.7%)
7th 164 (37.9%)
8th 136 (31.4%)
Other: 0 (0.0%)
The response rate for Lincoln County was 60%.
A high response rate produces survey results that are more representative of the student population. A response rate of at least 60% allows generalization of results to the entire student body. A response rate of 75% is excellent and allows a high degree of confidence in results. Because a high response rate means that more students have been surveyed, a high response rate will also be reflected in the error bars (i.e., with a higher response rate and more students included in the survey, error bars will be smaller and confidence intervals will be narrower). Response rates below 60% are considered low, and caution should be exercised in interpreting results. Low response rates indicate that the data is likely only representative of students who participated in the survey and may not necessarily represent the entire student body.
A high response rate produces survey results that are more representative of the student population. A response rate of at least 60% allows generalization of results to the entire student body. A response rate of 75% is excellent and allows a high degree of confidence in results. Because a high response rate means that more students have been surveyed, a high response rate will also be reflected in the error bars (i.e., with a higher response rate and more students included in the survey, error bars will be smaller and confidence intervals will be narrower). Response rates below 60% are considered low, and caution should be exercised in interpreting results. Low response rates indicate that the data may represent only students who participated in the survey and not necessarily the entire student body.
11
12
Risk Behaviors
13
14
Personal Safety
Behaviors Contributing to Unintentional Injury
Behaviors Associated with Violence
15
16
17
75.1 7.2 33.679.3 7.9 38.60
20
40
60
80
100
Never or rarely wears a bicycle helmet * Never or rarely wears a seatbelt Ever rode in a car with a drinking driver
Per
cen
t (%
)
NM Lincoln
* Among those who rode a bicycle in the past 12 months
Grades 6 - 8, 2009 NM YRRSNew Mexico and Lincoln County
Injury: Personal Safety
18
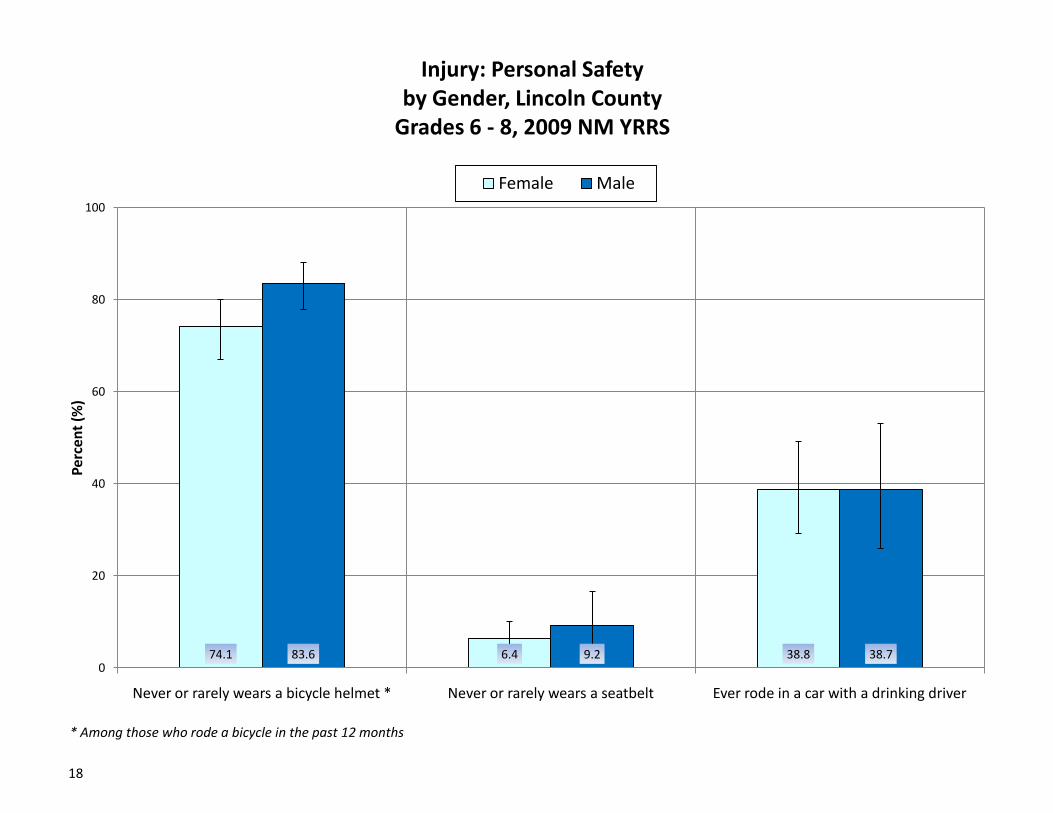
74.1 6.4 38.883.6 9.2 38.70
20
40
60
80
100
Never or rarely wears a bicycle helmet * Never or rarely wears a seatbelt Ever rode in a car with a drinking driver
Per
cen
t (%
)
Female Male
Grades 6 - 8, 2009 NM YRRS
* Among those who rode a bicycle in the past 12 months
by Gender, Lincoln CountyInjury: Personal Safety
19
77.0 6.0 23.576.2 8.0 47.185.2 9.7 43.20
20
40
60
80
100
Never or rarely wears a bicycle helmet * Never or rarely wears a seatbelt Ever rode in a car with a drinking driver
Per
cen
t (%
)
6th 7th 8th
Grades 6 - 8, 2009 NM YRRS
* Among those who rode a bicycle in the past 12 months
by Grade, Lincoln CountyInjury: Personal Safety
20
21
33.7 50.4 31.245.2 56.9 32.60
20
40
60
80
100
Ever carried a weapon * Ever been in a physical fight Bullied on school property in the past 12 months
Per
cen
t (%
)
NM Lincoln
* Such as a gun, knife, or club
Grades 6 - 8, 2009 NM YRRSNew Mexico and Lincoln County
Injury: Violence
22
23.0 43.1 32.765.2 69.7 32.70
20
40
60
80
100
Ever carried a weapon * Ever been in a physical fight Bullied on school property in the past 12 months
Per
cen
t (%
)
Female Male
Grades 6 - 8, 2009 NM YRRS
* Such as a gun, knife, or club
by Gender, Lincoln CountyInjury: Violence
23
43.5 47.8 31.143.8 60.7 30.148.3 61.2 37.60
20
40
60
80
100
Ever carried a weapon * Ever been in a physical fight Bullied on school property in the past 12 months
Per
cen
t (%
)
6th 7th 8th
Grades 6 - 8, 2009 NM YRRS
* Such as a gun, knife, or club
by Grade, Lincoln County
Injury: Violence
24
Mental Health
25
26
27
17.9 10.7 6.821.0 11.1 8.60
20
40
60
80
100
Ever seriously thought about killing self Ever made plan to kill self Ever tried to kill self
Per
cen
t (%
)
NM Lincoln
Grades 6 - 8, 2009 NM YRRSNew Mexico and Lincoln County
Mental Health
28
28.1 13.0 11.614.8 9.3 6.00
20
40
60
80
100
Ever seriously thought about killing self Ever made plan to kill self Ever tried to kill self
Per
cen
t (%
)
Female Male
Grades 6 - 8, 2009 NM YRRSby Gender, Lincoln County
Mental Health
29
19.0 6.9 6.824.3 17.0 11.719.2 7.9 6.60
20
40
60
80
100
Ever seriously thought about killing self Ever made plan to kill self Ever tried to kill self
Per
cen
t (%
)
6th 7th 8th
Grades 6 - 8, 2009 NM YRRS
by Grade, Lincoln CountyMental Health
30
Tobacco
31
32
33
24.8
5.7
14.2
6.8
1.22.0
32.4
8.2
17.6
5.6
0.72.0
0
10
20
30
40
50
Ever tried cigarettes * Smoked cigarette before age 11
Smoked at least one whole cigarette in
lifetime
Current smoker ** † Frequent smoker †† Smoked cigarettes on school property
Per
cen
t (%
)
NM Lincoln
Grades 6 - 8, 2009 NM YRRSNew Mexico and Lincoln County
Tobacco: Cigarettes
* Ever tried cigarettes, even one or two puffs
** Smoked cigarettes on at least one of the past 30 days
† Smoked cigarettes on at least 20 of the past 30 days
†† In the past 30 daysNote that the verical axis extends to 50% rather than to 100% as in most other charts.
34
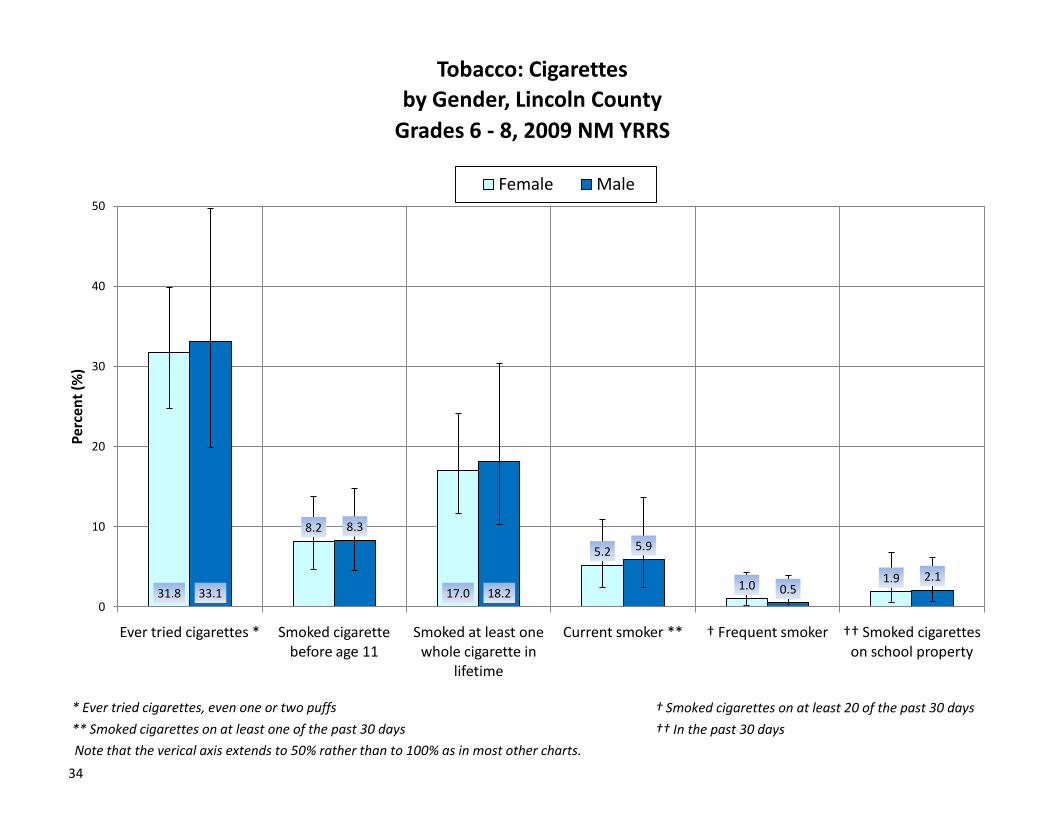
31.8
8.2
17.0
5.2
1.01.9
33.1
8.3
18.2
5.9
0.52.1
0
10
20
30
40
50
Ever tried cigarettes * Smoked cigarette before age 11
Smoked at least one whole cigarette in
lifetime
Current smoker ** † Frequent smoker †† Smoked cigarettes on school property
Per
cen
t (%
)
Female Male
Grades 6 - 8, 2009 NM YRRS
by Gender, Lincoln County
Tobacco: Cigarettes
* Ever tried cigarettes, even one or two puffs
** Smoked cigarettes on at least one of the past 30 days
† Smoked cigarettes on at least 20 of the past 30 days
†† In the past 30 days
Note that the verical axis extends to 50% rather than to 100% as in most other charts.
35
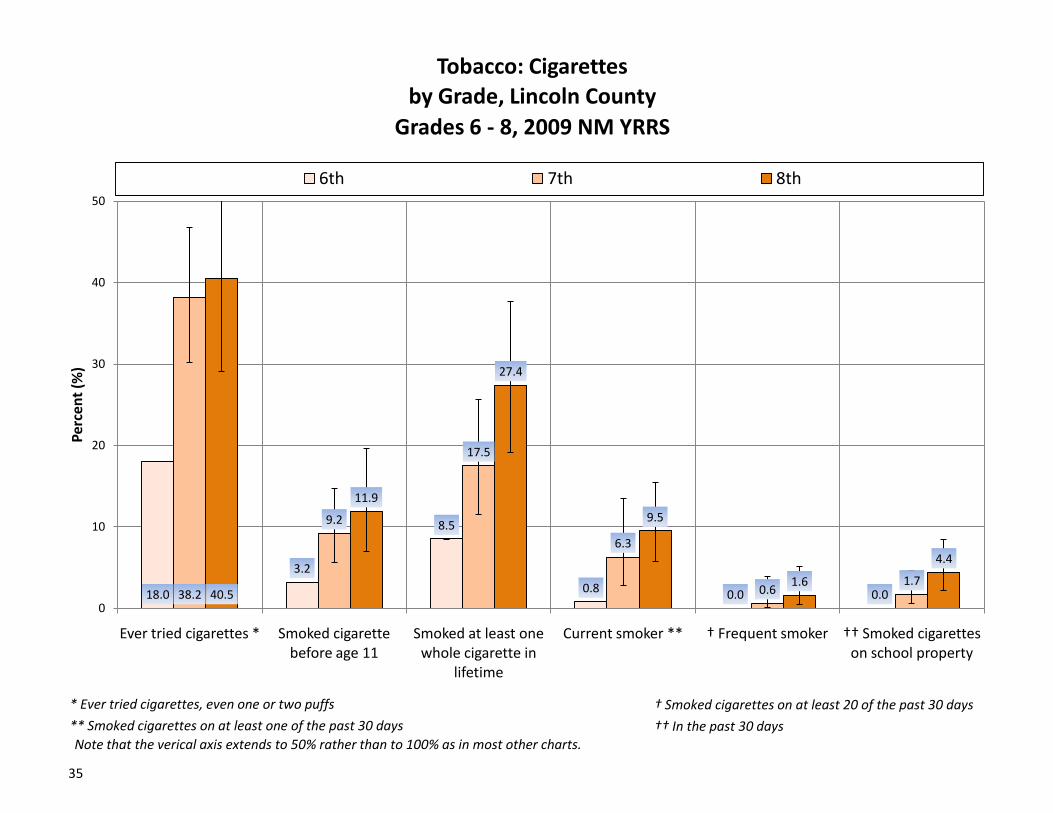
18.0
3.2
8.5
0.8 0.0 0.038.2
9.2
17.5
6.3
0.61.7
40.5
11.9
27.4
9.5
1.6
4.4
0
10
20
30
40
50
Ever tried cigarettes * Smoked cigarette before age 11
Smoked at least one whole cigarette in
lifetime
Current smoker ** † Frequent smoker †† Smoked cigarettes on school property
Per
cen
t (%
)
6th 7th 8th
Grades 6 - 8, 2009 NM YRRS
by Grade, Lincoln CountyTobacco: Cigarettes
* Ever tried cigarettes, even one or two puffs
** Smoked cigarettes on at least one of the past 30 days
† Smoked cigarettes on at least 20 of the past 30 days
†† In the past 30 daysNote that the verical axis extends to 50% rather than to 100% as in most other charts.
36
37
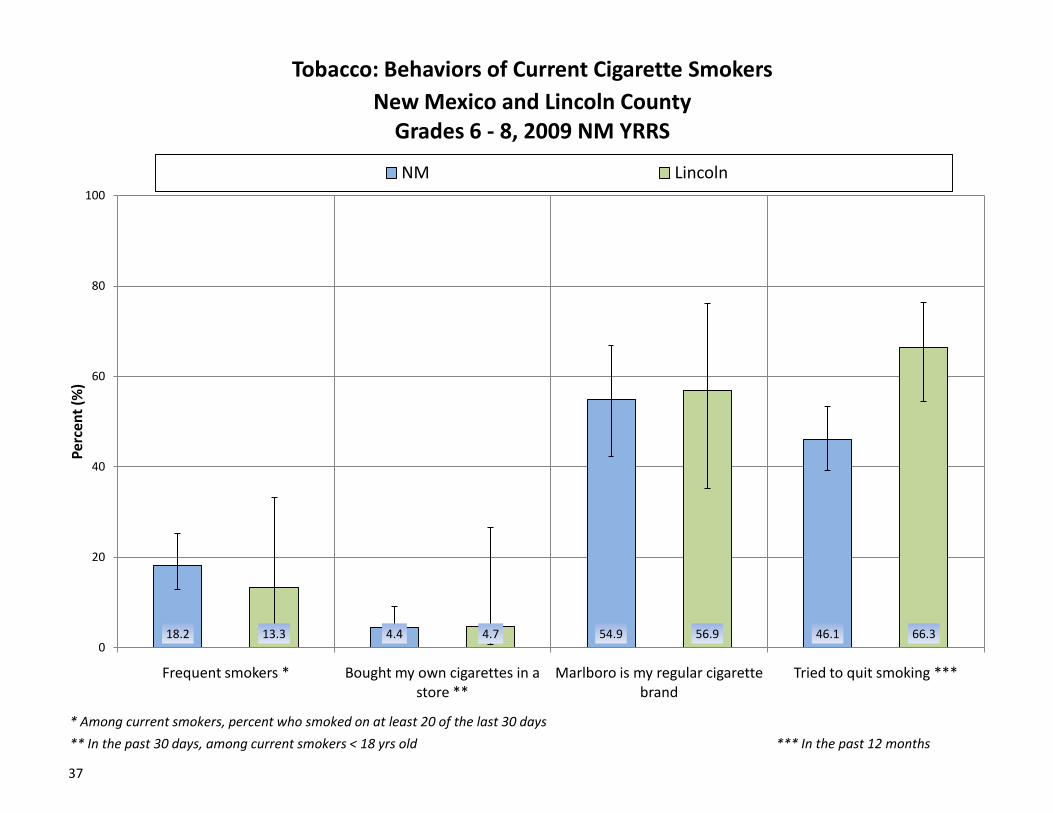
18.2 4.4 54.9 46.113.3 4.7 56.9 66.30
20
40
60
80
100
Frequent smokers * Bought my own cigarettes in a store **
Marlboro is my regular cigarette brand
Tried to quit smoking ***
Per
cen
t (%
)
NM Lincoln
Grades 6 - 8, 2009 NM YRRSNew Mexico and Lincoln County
Tobacco: Behaviors of Current Cigarette Smokers
* Among current smokers, percent who smoked on at least 20 of the last 30 days
** In the past 30 days, among current smokers < 18 yrs old *** In the past 12 months
38
19.3
0.0 29.8 57.58.5
8.5
78.3 73.90
20
40
60
80
100
Frequent smokers * Bought my own cigarettes in a store **
Marlboro is my regular cigarette brand
Tried to quit smoking ***
Per
cen
t (%
)
Female Male
Grades 6 - 8, 2009 NM YRRS
by Gender, Lincoln County
Tobacco: Behaviors of Current Cigarette Smokers
* Among current smokers, percent who smoked on at least 20 of the last 30 days
** In the past 30 days, among current smokers < 18 yrs old *** In the past 12 months
39
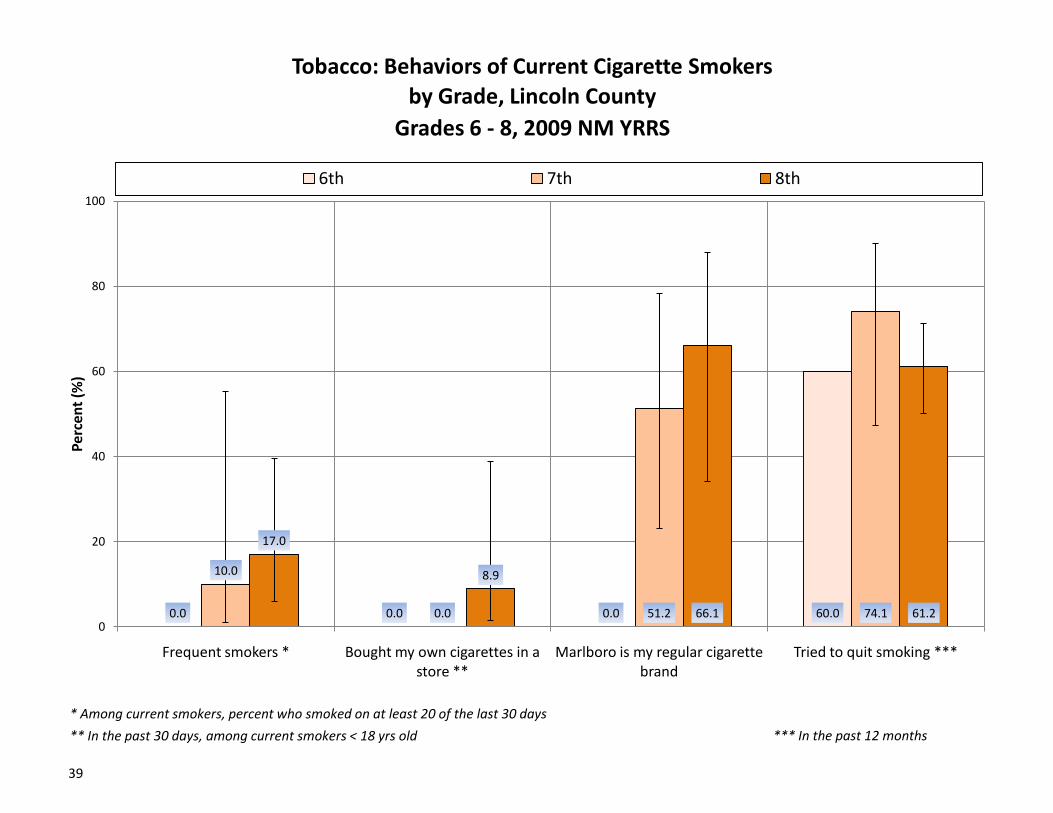
0.0 0.0 0.0 60.0
10.0
0.0 51.2 74.1
17.0
8.9
66.1 61.20
20
40
60
80
100
Frequent smokers * Bought my own cigarettes in a store **
Marlboro is my regular cigarette brand
Tried to quit smoking ***
Per
cen
t (%
)
6th 7th 8th
Grades 6 - 8, 2009 NM YRRS
by Grade, Lincoln CountyTobacco: Behaviors of Current Cigarette Smokers
* Among current smokers, percent who smoked on at least 20 of the last 30 days
** In the past 30 days, among current smokers < 18 yrs old *** In the past 12 months
40
41
7.14.3
36.1
5.7 6.3
35.90
20
40
60
80
100
Current cigar use * Current spit tobacco use ** In the same room with someone smoking cigarettes ***
Per
cen
t (%
)
NM Lincoln
Grades 6 - 8, 2009 NM YRRSNew Mexico and Lincoln County
Tobacco: Other Use and Exposure
* Cigars, cigarillos, or little cigars, in the past 30 days
** Chewing tobacco, snuff, or dip, in the past 30 days *** In the past 7 days
42
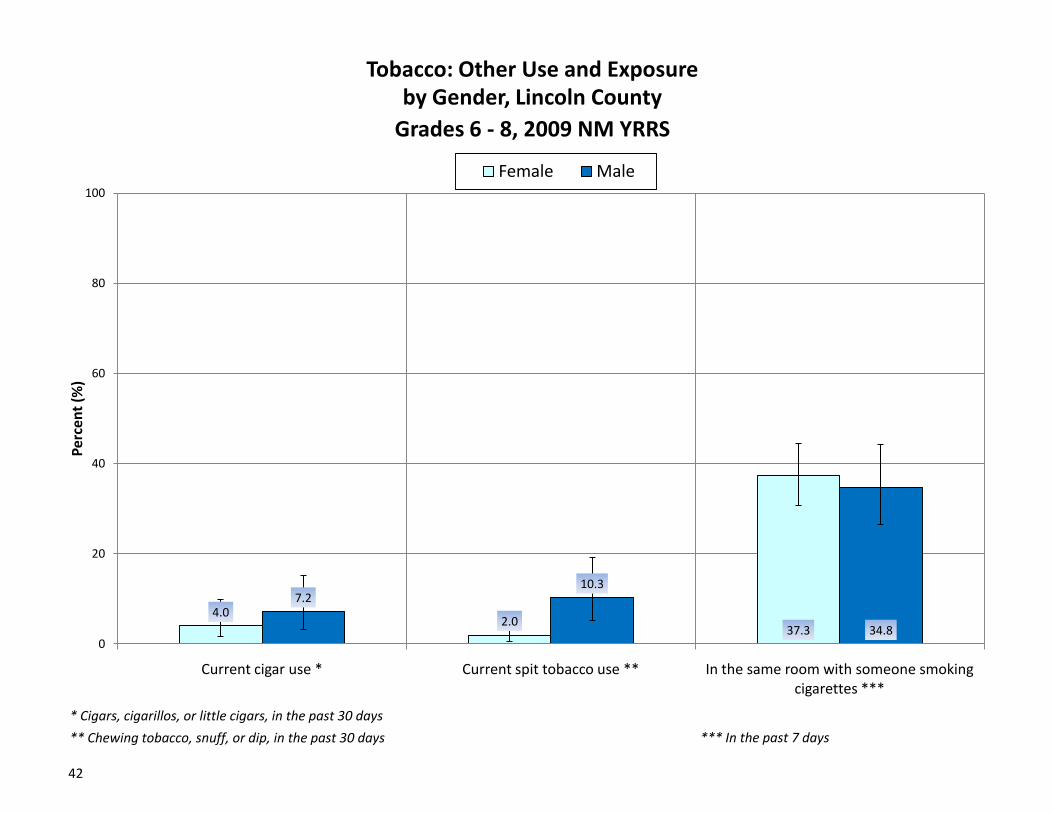
4.02.0
37.3
7.210.3
34.80
20
40
60
80
100
Current cigar use * Current spit tobacco use ** In the same room with someone smoking cigarettes ***
Per
cen
t (%
)
Female Male
Grades 6 - 8, 2009 NM YRRS
by Gender, Lincoln County
* Cigars, cigarillos, or little cigars, in the past 30 days
** Chewing tobacco, snuff, or dip, in the past 30 days *** In the past 7 days
Tobacco: Other Use and Exposure
43
1.5 1.528.0
5.99.3
38.8
9.87.6
40.80
20
40
60
80
100
Current cigar use * Current spit tobacco use ** In the same room with someone smoking cigarettes ***
Per
cen
t (%
)
6th 7th 8th
Grades 6 - 8, 2009 NM YRRSby Grade, Lincoln County
* Cigars, cigarillos, or little cigars, in the past 30 days
** Chewing tobacco, snuff, or dip, in the past 30 days *** In the past 7 days
Tobacco: Other Use and Exposure
44
45
6.5 7.2
2.7 3.1
9.3 9.5
4.6 4.2
0
20
40
60
80
100
Will smoke a cigarette in the next year *
Would smoke a cigarette if offered by one of best friends **
Will smoke a cigarette in the next year *
Would smoke a cigarette if offered by one of best friends **
Per
cen
t (%
)
NM Lincoln
Grades 6 - 8, 2009 NM YRRS
* Answered "Probably yes" or "Definitely yes" to the question, "Do you think you will smoke a cigarette at anytime during the next year?"
**Answered "Probably yes" or "Definitely yes" to the question, "If one of your best friends offered you a cigarette, would you smoke it?"
New Mexico and Lincoln CountyTobacco: Plans to Smoke
Of those who have not smoked cigarettes in the past 30 days Of those who have never smoked a cigarette
46
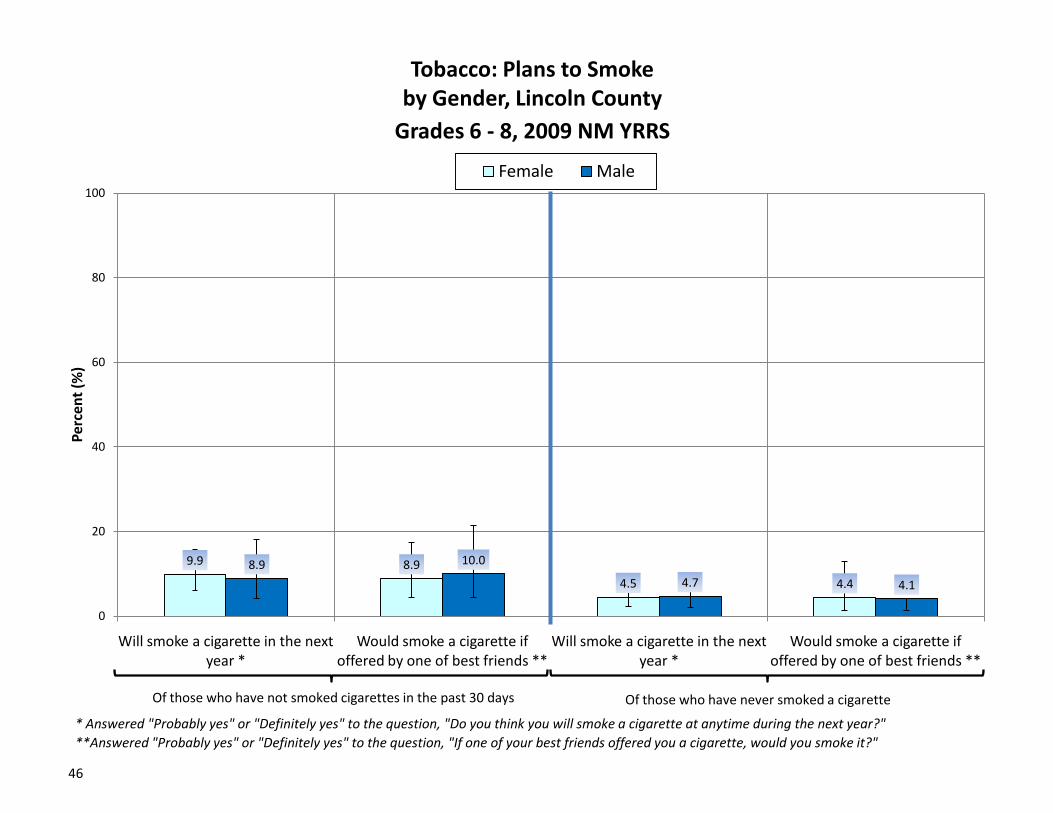
9.9 8.9
4.5 4.4
8.9 10.0
4.7 4.1
0
20
40
60
80
100
Will smoke a cigarette in the next year *
Would smoke a cigarette if offered by one of best friends **
Will smoke a cigarette in the next year *
Would smoke a cigarette if offered by one of best friends **
Per
cen
t (%
)
Female Male
Grades 6 - 8, 2009 NM YRRS
by Gender, Lincoln CountyTobacco: Plans to Smoke
Of those who have not smoked cigarettes in the past 30 days Of those who have never smoked a cigarette
* Answered "Probably yes" or "Definitely yes" to the question, "Do you think you will smoke a cigarette at anytime during the next year?"
**Answered "Probably yes" or "Definitely yes" to the question, "If one of your best friends offered you a cigarette, would you smoke it?"
47
3.21.6 1.8
0.0
9.2 10.7
3.2 4.1
16.3 16.6
10.4 10.5
0
20
40
60
80
100
Will smoke a cigarette in the next year *
Would smoke a cigarette if offered by one of best friends **
Will smoke a cigarette in the next year *
Would smoke a cigarette if offered by one of best friends **
Per
cen
t (%
)
6th 7th 8th
Grades 6 - 8, 2009 NM YRRS
by Grade, Lincoln CountyTobacco: Plans to Smoke
Of those who have not smoked cigarettes in the past 30 days Of those who have never smoked a cigarette
* Answered "Probably yes" or "Definitely yes" to the question, "Do you think you will smoke a cigarette at anytime during the next year?"
**Answered "Probably yes" or "Definitely yes" to the question, "If one of your best friends offered you a cigarette, would you smoke it?"
48
49
71.5 47.263.2 42.80
20
40
60
80
100
Saw or heard commercials about the dangers of cigarette smoking *
Taught in school about the dangers of tobacco use **
Per
cen
t (%
)
NM Lincoln
Grades 6 - 8, 2009 NM YRRS
* Commercials on the TV, the Internet, or the radio
New Mexico and Lincoln CountyExposure to Information on the Dangers of Tobacco
** During the school year that the survey was administered
50
60.6 41.465.8 44.20
20
40
60
80
100
Saw or heard commercials about the dangers of cigarette smoking *
Taught in school about the dangers of tobacco use **
Per
cen
t (%
)
Female Male
Grades 6 - 8, 2009 NM YRRS
by Gender, Lincoln County
Exposure to Information on the Dangers of Tobacco
* Commercials on the TV, the Internet, or the radio
** During the school year that the survey was administered
51
55.3 73.571.3 29.160.8 23.90
20
40
60
80
100
Saw or heard commercials about the dangers of cigarette smoking *
Taught in school about the dangers of tobacco use **
Per
cen
t (%
)
6th 7th 8th
Grades 6 - 8, 2009 NM YRRSby Grade, Lincoln County
Exposure to Information on the Dangers of Tobacco
* Commercials on the TV, the Internet, or the radio
** During the school year that the survey was administered
52
Alcohol
53
54
55
33.8 16.5 16.2 8.638.6 21.8 17.5 9.30
20
40
60
80
100
Ever drank alcohol * First drink of alcohol before age 11
Current drinker ** Binge drinker ***
Per
cen
t (%
)
NM Lincoln
Grades 6 - 8, 2009 NM YRRS
* Other than a few sips
New Mexico and Lincoln CountyAlcohol
*** Had five or more drinks in a row, or within a couple of hours, in the past 30 days** Drank alcohol on at least one of the past 30 days
56
35.5 15.5 15.6 9.041.6 27.7 19.2 9.70
20
40
60
80
100
Ever drank alcohol * First drink of alcohol before age 11
Current drinker ** Binge drinker ***
Per
cen
t (%
)
Female Male
Grades 6 - 8, 2009 NM YRRS
by Gender, Lincoln County
Alcohol
* Other than a few sips *** Had five or more drinks in a row, or within a couple of hours, in the past 30 days** Drank alcohol on at least one of the past 30 days
Ever drank alcohol * First drink of alcohol before age 11
Current drinker ** Binge drinker ***
Per
cen
t (%
)
6th 7th 8th
Grades 6 - 8, 2009 NM YRRSby Grade, Lincoln County
Alcohol
* Other than a few sips *** Had five or more drinks in a row, or within a couple of hours, in the past 30 days** Drank alcohol on at least one of the past 30 days
58
59
29.4 78.9 63.8 45.333.7 76.3 64.4 43.30
20
40
60
80
100
Easy for me to get alcohol * My parents think my alchol use would be very wrong **
I think youth alcohol use is very wrong **
People face great risk from daily alcohol use ***
Per
cen
t (%
)
NM Lincoln
Grades 6 - 8, 2009 NM YRRS
* Responded "Very easy" or "Sort of easy" to get beer, wine, or hard liquor
New Mexico and Lincoln CountyAlcohol: Access and Attitudes
*** How much do you think people risk harming themselves (physically or in other ways) if they have one or two drinks of beer, wine, or hard liquor nearly every day?"
** How wrong do "your parents", or "you" feel it would be for you or someone your age to drink alcohol regularly?"
60
31.8 77.4 66.6 44.235.6 75.2 62.3 42.20
20
40
60
80
100
Easy for me to get alcohol * My parents think my alchol use would be very wrong **
I think youth alcohol use is very wrong **
People face great risk from daily alcohol use ***
Per
cen
t (%
)
Female Male
Grades 6 - 8, 2009 NM YRRS
by Gender, Lincoln County
Alcohol: Access and Attitudes
* Responded "Very easy" or "Sort of easy" to get beer, wine, or hard liquor
** How wrong do "your parents", or "you" feel it would be for you or someone your age to drink alcohol regularly?"
*** How much do you think people risk harming themselves (physically or in other ways) if they have one or two drinks of beer, wine, or hard liquor nearly every day?"
Easy for me to get alcohol * My parents think my alchol use would be very wrong **
I think youth alcohol use is very wrong **
People face great risk from daily alcohol use ***
Per
cen
t (%
)
6th 7th 8th
Grades 6 - 8, 2009 NM YRRSby Grade, Lincoln County
Alcohol: Access and Attitudes
* Responded "Very easy" or "Sort of easy" to get beer, wine, or hard liquor
** How wrong do "your parents", or "you" feel it would be for you or someone your age to drink alcohol regularly?"
*** How much do you think people risk harming themselves (physically or in other ways) if they have one or two drinks of beer, wine, or hard liquor nearly every day?"
62
Drugs
63
64
65
15.1
4.9
9.4
5.7
14.2
1.413.6
6.5 6.1 5.1
17.8
1.9
0
20
40
60
80
100
Ever used marijuana First marijuana use before age 11
Current marijuana use *
Ever used cocaine Ever used inhalants **
Ever injected illegal drug
Per
cen
t (%
)
NM Lincoln
Grades 6 - 8, 2009 NM YRRS
* At least once in the past 30 days
New Mexico and Lincoln CountyDrugs
** Sniffed glue, breathed the contents of spray cans, or inhaled any paints or sprays to get high
66
8.53.5 4.6 5.0
15.9
1.418.3
9.37.5
5.2
19.7
2.3
0
20
40
60
80
100
Ever used marijuana First marijuana use before age 11
Current marijuana use *
Ever used cocaine Ever used inhalants **
Ever injected illegal drug
Per
cen
t (%
)
Female Male
Grades 6 - 8, 2009 NM YRRS
by Gender, Lincoln County
Drugs
* At least once in the past 30 days** Sniffed glue, breathed the contents of spray cans, or inhaled any paints or sprays to get high
67
1.5 1.5 1.5 1.5
13.6
0.8
15.3
8.46.1 6.8
21.2
1.9
24.2
9.4 10.8
6.7
18.2
2.9
0
20
40
60
80
100
Ever used marijuana First marijuana use before age 11
Current marijuana use *
Ever used cocaine Ever used inhalants **
Ever injected illegal drug
Per
cen
t (%
)
6th 7th 8th
Grades 6 - 8, 2009 NM YRRSby Grade, Lincoln County
Drugs
* At least once in the past 30 days
** Sniffed glue, breathed the contents of spray cans, or inhaled any paints or sprays to get high
68
Sexual Behavior
69
70
71
10.8 6.1 68.1 56.413.3 7.8 67.7 29.80
20
40
60
80
100
Ever had sexual intercourse Had sexual intercourse with two or more people in lifetime
Used a condom at last sexual intercourse *
Ever taught about AIDS/HIV at school
Per
cen
t (%
)
NM Lincoln
Grades 6 - 8, 2009 NM YRRS
New Mexico and Lincoln CountySexual Behavior
* Among those who ever had sexual intercourse
72
7.1 4.3 54.8 27.318.8 11.0 72.1 32.20
20
40
60
80
100
Ever had sexual intercourse Had sexual intercourse with two or more people in lifetime
Ever had sexual intercourse Had sexual intercourse with two or more people in lifetime
Used a condom at last sexual intercourse *
Ever taught about AIDS/HIV at school
Per
cen
t (%
)
6th 7th 8th
Grades 6 - 8, 2009 NM YRRSby Grade, Lincoln County
Sexual Behavior
* Among those who ever had sexual intercourse
74
Body Weight and Weight Control
75
76
77
22.3 42.9 69.721.6 47.9 71.50
20
40
60
80
100
Describes self as overweight Trying to lose weight Ever exercised to lose weight or to keep from gaining weight
Per
cen
t (%
)
NM Lincoln
Grades 6 - 8, 2009 NM YRRS
New Mexico and Lincoln CountyBody Weight and Weight Control
78
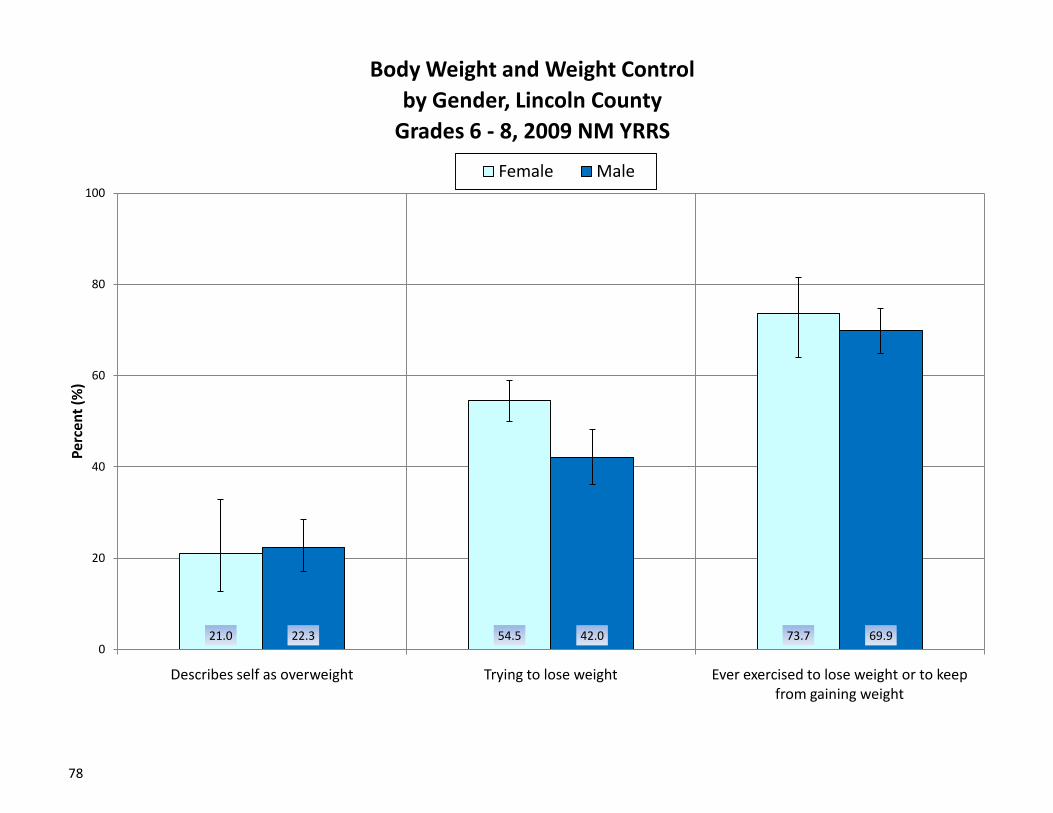
21.0 54.5 73.722.3 42.0 69.90
20
40
60
80
100
Describes self as overweight Trying to lose weight Ever exercised to lose weight or to keep from gaining weight
Per
cen
t (%
)
Female Male
Grades 6 - 8, 2009 NM YRRS
by Gender, Lincoln County
Body Weight and Weight Control
79
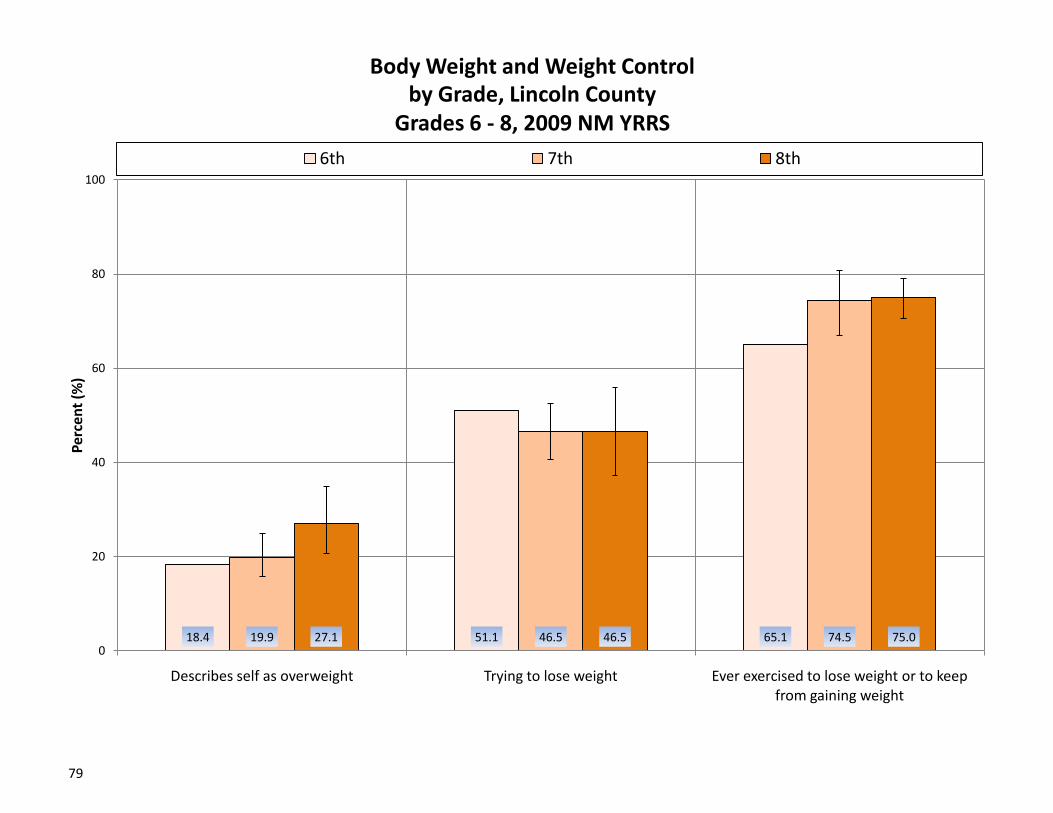
18.4 51.1 65.119.9 46.5 74.527.1 46.5 75.00
20
40
60
80
100
Describes self as overweight Trying to lose weight Ever exercised to lose weight or to keep from gaining weight
Per
cen
t (%
)
6th 7th 8th
Grades 6 - 8, 2009 NM YRRSby Grade, Lincoln County
Body Weight and Weight Control
80
81
40.1 16.1 5.444.1 17.8 7.30
20
40
60
80
100
Ever eaten less to lose weight or keep from gaining weight
Ever fasted to lose weight or keep from gaining weight
Ever vomited or used laxatives to lose weight or keep from gaining weight
Per
cen
t (%
)
NM Lincoln
Grades 6 - 8, 2009 NM YRRS
New Mexico and Lincoln CountyWeight Control
82
50.0 19.2 9.738.9 16.6 5.20
20
40
60
80
100
Ever eaten less to lose weight or keep from gaining weight
Ever fasted to lose weight or keep from gaining weight
Ever vomited or used laxatives to lose weight or keep from gaining weight
Per
cen
t (%
)
Female Male
Grades 6 - 8, 2009 NM YRRS
by Gender, Lincoln County
Weight Control
83
45.4 7.6 3.847.5 23.2 8.439.2 21.8 9.60
20
40
60
80
100
Ever eaten less to lose weight or keep from gaining weight
Ever fasted to lose weight or keep from gaining weight
Ever vomited or used laxatives to lose weight or keep from gaining weight
Per
cen
t (%
)
6th 7th 8th
Grades 6 - 8, 2009 NM YRRSby Grade, Lincoln County
Weight Control
84
Physical Activity
85
86
87
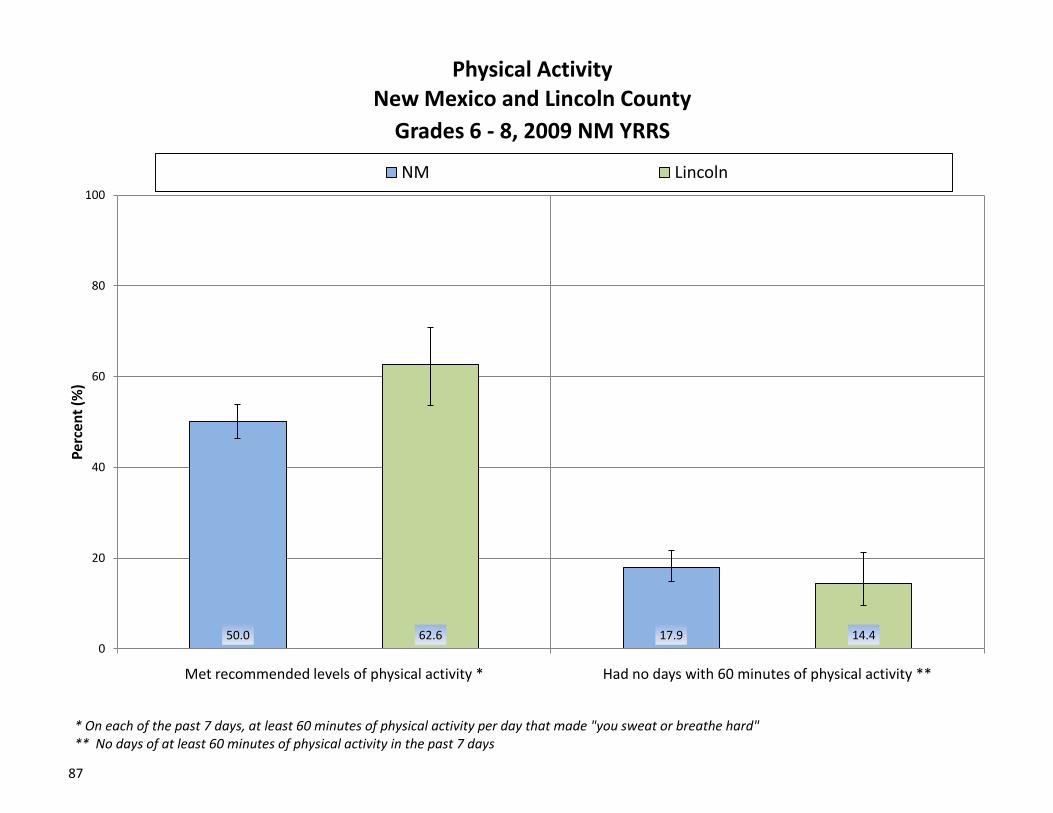
50.0 17.962.6 14.40
20
40
60
80
100
Met recommended levels of physical activity * Had no days with 60 minutes of physical activity **
Per
cen
t (%
)
NM Lincoln
Grades 6 - 8, 2009 NM YRRS
New Mexico and Lincoln CountyPhysical Activity
** No days of at least 60 minutes of physical activity in the past 7 days* On each of the past 7 days, at least 60 minutes of physical activity per day that made "you sweat or breathe hard"
88
55.4 17.369.7 11.40
20
40
60
80
100
Met recommended levels of physical activity * Had no days with 60 minutes of physical activity **
Per
cen
t (%
)
Female Male
Grades 6 - 8, 2009 NM YRRS
by Gender, Lincoln County
Physical Activity
** No days of at least 60 minutes of physical activity in the past 7 days
* On each of the past 7 days, at least 60 minutes of physical activity per day that made "you sweat or breathe hard"
89
52.0 20.263.8 14.972.5 7.40
20
40
60
80
100
Met recommended levels of physical activity * Had no days with 60 minutes of physical activity **
Per
cen
t (%
)
6th 7th 8th
Grades 6 - 8, 2009 NM YRRSby Grade, Lincoln County
Physical Activity
** No days of at least 60 minutes of physical activity in the past 7 days
* On each of the past 7 days, at least 60 minutes of physical activity per day that made "you sweat or breathe hard"
90
91
33.2 21.339.3 19.00
20
40
60
80
100
Watched three or more hours of TV on an average school day Played video or computer games for three or more hours per day *
Per
cen
t (%
)
NM Lincoln
Grades 6 - 8, 2009 NM YRRS
New Mexico and Lincoln CountyPhysical Activity
* Played video or computer games or used a computer for something that was not school work, on an average school day
92
36.8 16.541.2 20.90
20
40
60
80
100
Watched three or more hours of TV on an average school day Played video or computer games for three or more hours per day *
Per
cen
t (%
)
Female Male
Grades 6 - 8, 2009 NM YRRS
by Gender, Lincoln County
Physical Activity
* Played video or computer games or used a computer for something that was not school work, on an average school day
93
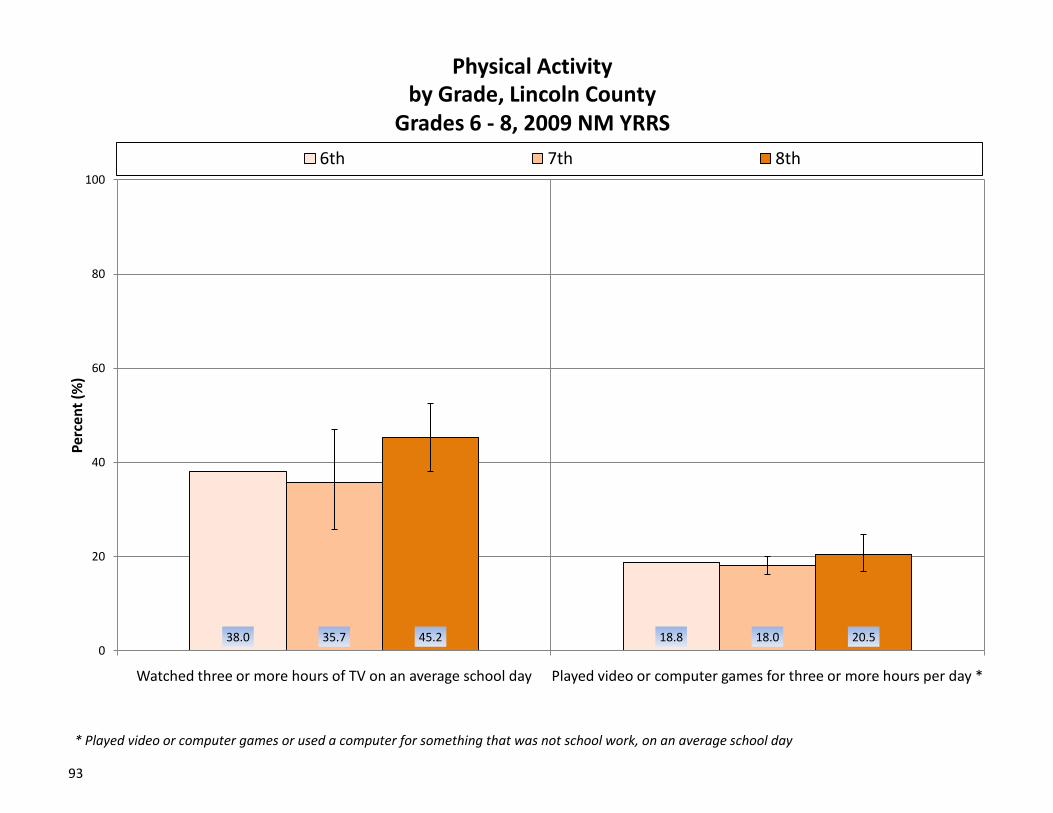
38.0 18.835.7 18.045.2 20.50
20
40
60
80
100
Watched three or more hours of TV on an average school day Played video or computer games for three or more hours per day *
Per
cen
t (%
)
6th 7th 8th
Grades 6 - 8, 2009 NM YRRSby Grade, Lincoln County
Physical Activity
* Played video or computer games or used a computer for something that was not school work, on an average school day
94
95
54.5 39.561.1 57.80
20
40
60
80
100
Had any physical education at school * Had daily physical education at school
Per
cen
t (%
)
NM Lincoln
Grades 6 - 8, 2009 NM YRRS
New Mexico and Lincoln CountyPhysical Activity
* Played video or computer games or used a computer for something that was not school work, on an average school day
96
54.7 50.466.8 64.50
20
40
60
80
100
Had any physical education at school * Had daily physical education at school
Per
cen
t (%
)
Female Male
Grades 6 - 8, 2009 NM YRRS
by Gender, Lincoln County
Physical Activity
* Played video or computer games or used a computer for something that was not school work, on an average school day
97
60.9 54.759.4 57.163.9 62.40
20
40
60
80
100
Had any physical education at school * Had daily physical education at school
Per
cen
t (%
)
6th 7th 8th
Grades 6 - 8, 2009 NM YRRSby Grade, Lincoln County
Physical Activity
* Played video or computer games or used a computer for something that was not school work, on an average school day
98
Asthma
99
100
101
19.8 9.916.5 7.50
20
40
60
80
100
Ever diagnosed with asthma Current asthma *
Per
cen
t (%
)
NM Lincoln
Grades 6 - 8, 2009 NM YRRS
New Mexico and Lincoln CountyAsthma
* Ever diagnosed with asthma AND still has asthma
102
14.1 6.118.8 8.80
20
40
60
80
100
Ever diagnosed with asthma Current asthma *
Per
cen
t (%
)
Female Male
Grades 6 - 8, 2009 NM YRRS
by Gender, Lincoln County
Asthma
* Ever diagnosed with asthma AND still has asthma
103
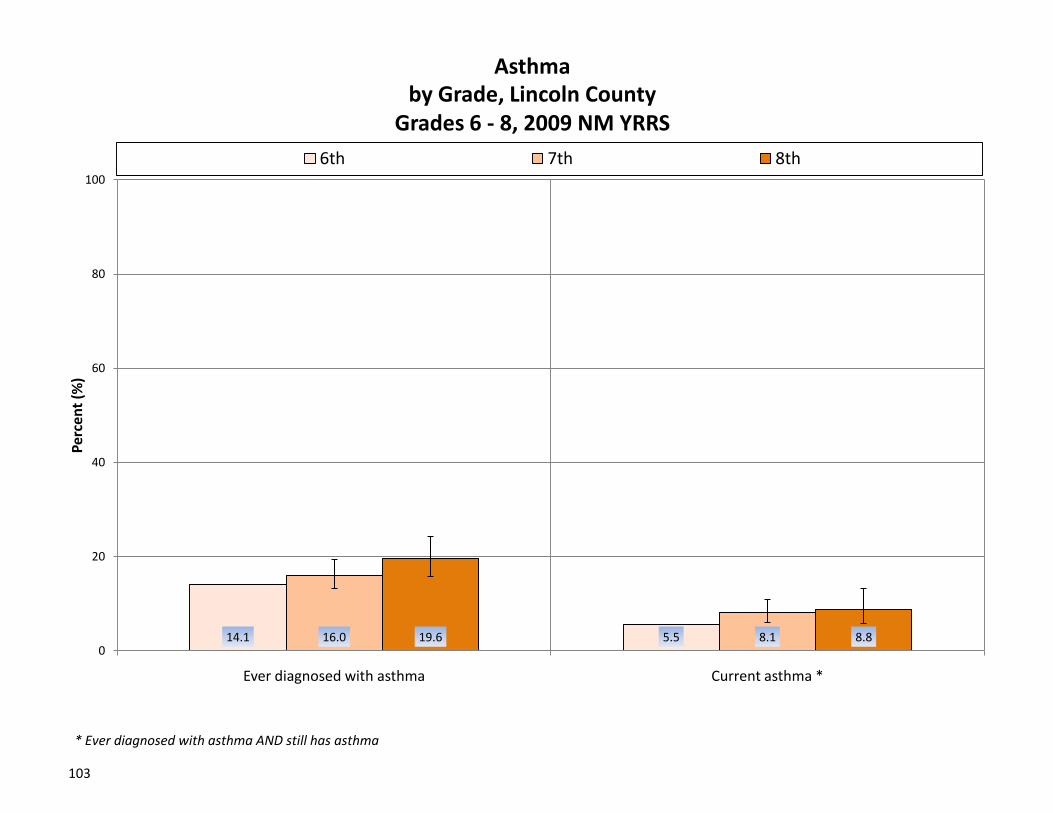
14.1 5.516.0 8.119.6 8.80
20
40
60
80
100
Ever diagnosed with asthma Current asthma *
Per
cen
t (%
)
6th 7th 8th
Grades 6 - 8, 2009 NM YRRSby Grade, Lincoln County
Asthma
* Ever diagnosed with asthma AND still has asthma
104
Other Characteristics
Food Sufficiency
Grades
105
106
107
9.9 9.10
20
40
60
80
100
Sometimes or often not enough food to eat in family
Per
cen
t (%
)
NM Lincoln
Grades 6 - 8, 2009 NM YRRS
New Mexico and Lincoln CountyFood Sufficiency
108
8.5 9.80
20
40
60
80
100
Sometimes or often not enough food to eat in family
Per
cen
t (%
)
Female Male
Grades 6 - 8, 2009 NM YRRS
by Gender, Lincoln County
Food Sufficiency
109
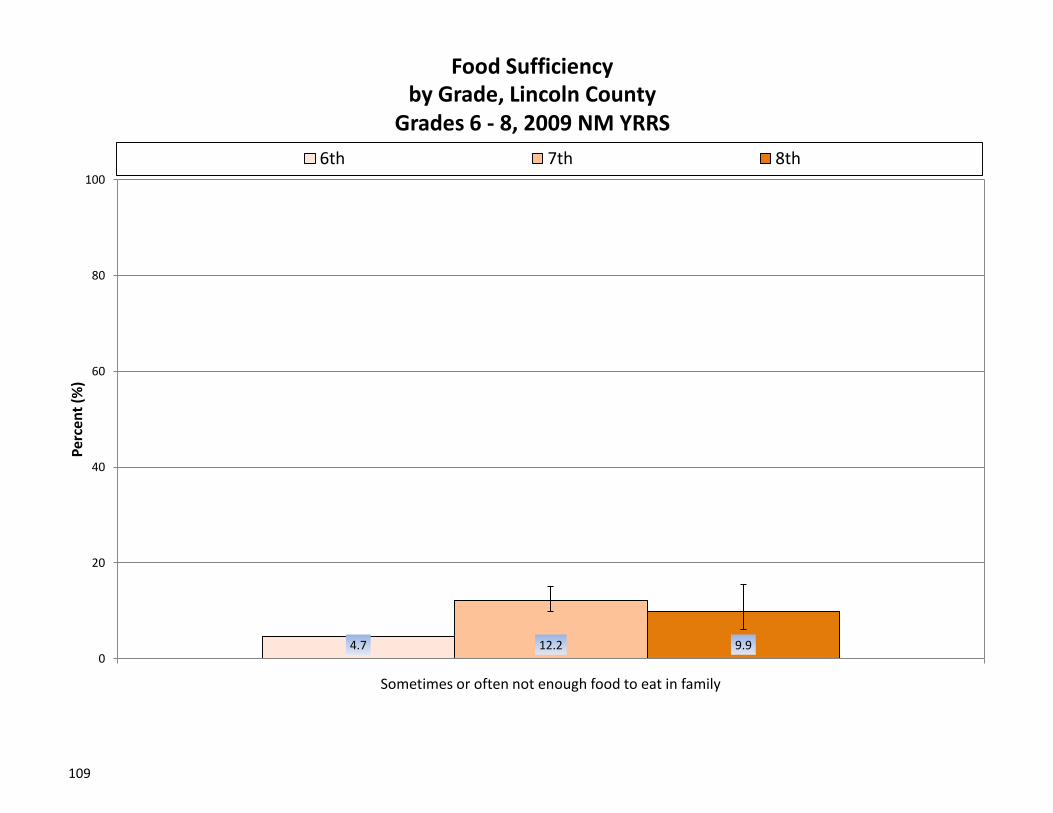
4.7 12.2 9.90
20
40
60
80
100
Sometimes or often not enough food to eat in family
Per
cen
t (%
)
6th 7th 8th
Grades 6 - 8, 2009 NM YRRSby Grade, Lincoln County
Food Sufficiency
110
111
75.7 80.60
20
40
60
80
100
Gets mostly A's or B's
Per
cen
t (%
)
NM Lincoln
Grades 6 - 8, 2009 NM YRRS
New Mexico and Lincoln CountyAcademics
112
83.4 78.70
20
40
60
80
100
Gets mostly A's or B's
Per
cen
t (%
)
Female Male
Grades 6 - 8, 2009 NM YRRS
by Gender, Lincoln County
Academics
113
87.0 73.9 83.40
20
40
60
80
100
Gets mostly A's or B's
Per
cen
t (%
)
6th 7th 8th
Grades 6 - 8, 2009 NM YRRSby Grade, Lincoln County
Academics
114
Protective (Resiliency) Factors
115
116
117
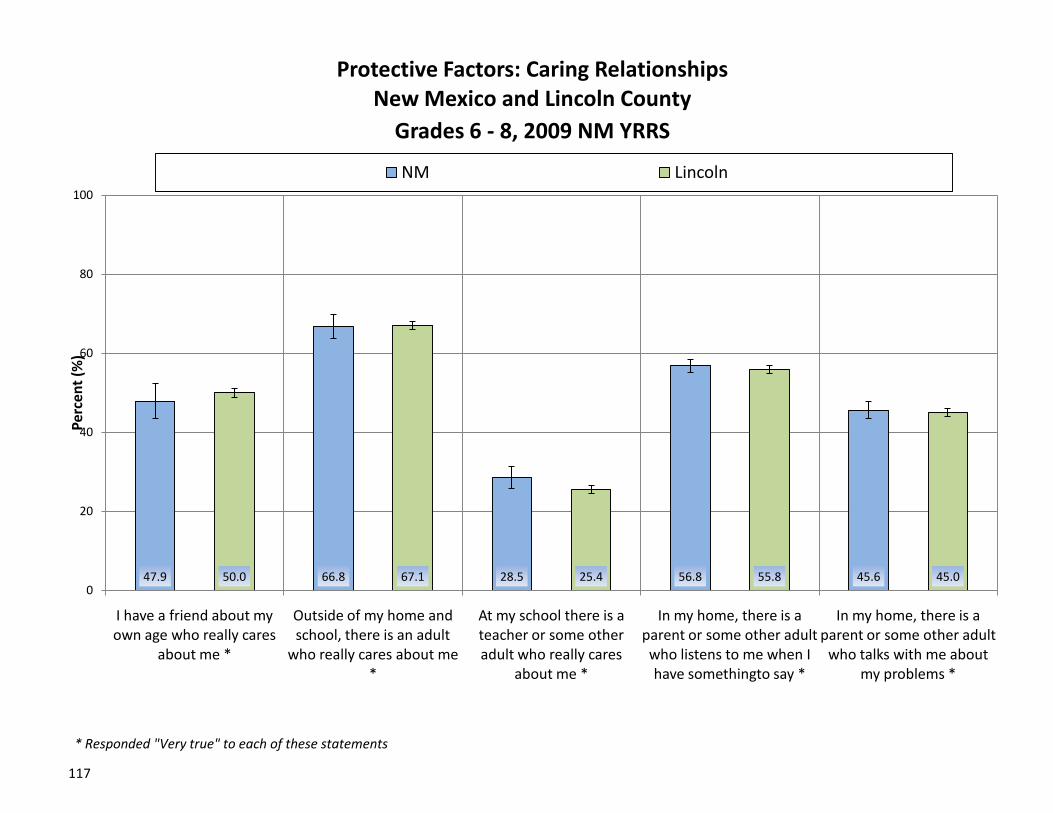
47.9 66.8 28.5 56.8 45.650.0 67.1 25.4 55.8 45.00
20
40
60
80
100
I have a friend about my own age who really cares
about me *
Outside of my home and school, there is an adult
who really cares about me *
At my school there is a teacher or some other adult who really cares
about me *
In my home, there is a parent or some other adult who listens to me when I have somethingto say *
In my home, there is a parent or some other adult
who talks with me about my problems *
Per
cen
t (%
)
NM Lincoln
Grades 6 - 8, 2009 NM YRRS
New Mexico and Lincoln CountyProtective Factors: Caring Relationships
* Responded "Very true" to each of these statements
118
64.3 70.6 27.4 55.9 47.535.9 63.7 23.3 55.7 42.50
20
40
60
80
100
I have a friend about my own age who really cares
about me *
Outside of my home and school, there is an adult
who really cares about me *
At my school there is a teacher or some other adult who really cares
about me *
In my home, there is a parent or some other adult who listens to me when I have somethingto say *
In my home, there is a parent or some other adult
who talks with me about my problems *
Per
cen
t (%
)
Female Male
Grades 6 - 8, 2009 NM YRRS
by Gender, Lincoln County
Protective Factors: Caring Relationships
* Responded "Very true" to each of these statements