2009 to 2012 Annual Water Quality Report on the Laguna de Bay and its Tributary Rivers Department Of Environment And Natural Resources LAGUNA LAKE DEVELOPMENT AUTHORITY Sugar Regulatory Administration (SRA) Compound, North Avenue, Diliman, Quezon City
Transcript
2009 to 2012
Annual Water Quality Report
on the Laguna de Bay
and its Tributary Rivers
Department Of Environment And Natural Resources
LAGUNA LAKE DEVELOPMENT AUTHORITY Sugar Regulatory Administration (SRA) Compound,
North Avenue, Diliman, Quezon City
i
FOREWORD
This report contains the water quality data on Laguna de Bay (LdB) and its tributary
rivers generated by the Environmental Laboratory and Research Division (ELRD) of
LLDA, formerly Environmental Quality Management Division (EQMD), from 2009 to
2012 for the LLDA’s Water Quality Monitoring Program which has been on-going since
1973. The results of the assessment of the lake and its tributary rivers’ water quality
status during the 4-year monitoring period based on compliance to the Department of
Environment and Natural Resources (DENR) Class C Water Quality Criteria as
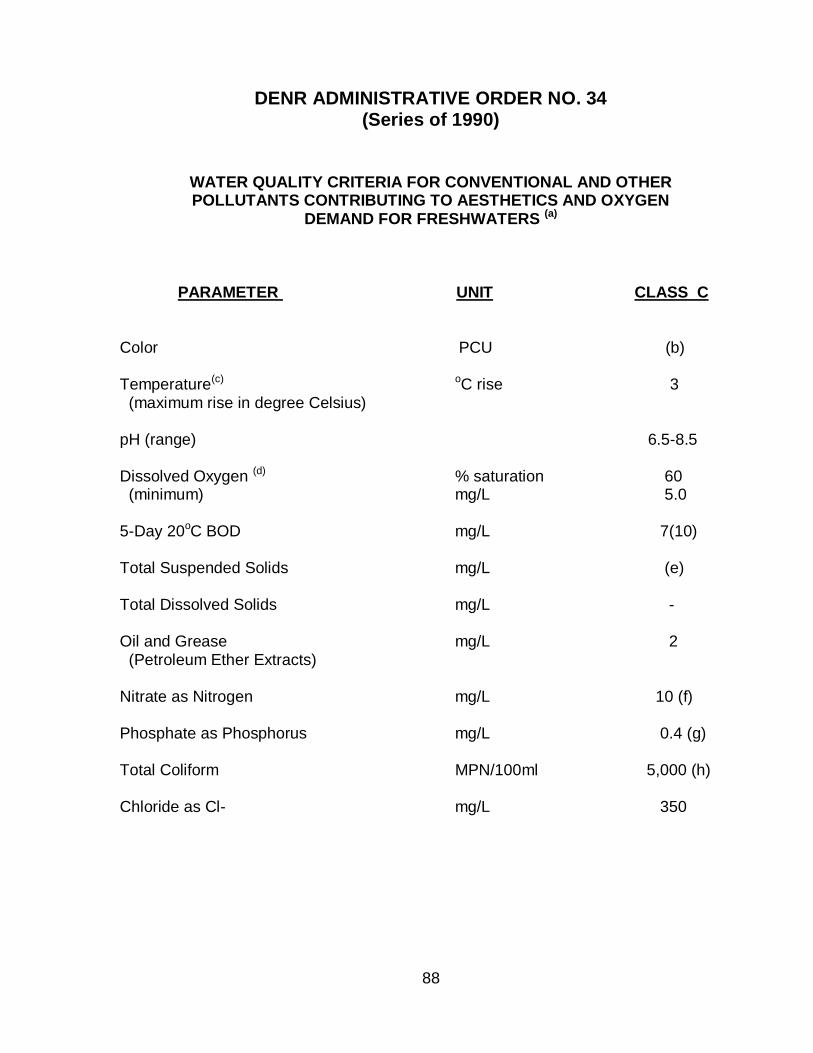
prescribed under DENR Administrative Order (DAO) No.34, Series of 1990, are also
presented.
From 2009 to 2011, the five (5) stations monitored in Laguna de Bay were Station I
(Central West Bay), Station II (East Bay), Station IV (Central Bay), Station V (Northern
West Bay) and Station VIII (South Bay). By 2012, four (4) new monitoring stations were
added, namely: Station XV (West Bay- San Pedro), Station XVI (West Bay- Sta Rosa),
Station XVII (Central Bay- Fish Sanctuary) and Station XVIII (East Bay- Pagsanjan).
For the monitoring of the Laguna de Bay’s tributaries, LLDA has a total of eighteen (18)
stations in 2009 to 2010 that included Marikina, Bagumbayan, Mangangate, Tunasan
(Downstream), San Pedro, Cabuyao, San Cristobal, San Juan, Bay, Sta. Cruz,
(Downstream) and Sapang Baho Rivers, Buli Creek, and Manggahan Floodway. To
cover the twenty four (24) sub-basins in the Laguna de Bay Region, the monitoring
stations in Baras River, Pililla River, Sta. Maria River-Downstream, Pila River, Molawin
Creek in Los Baños, Sta. Rosa River-Downstream and Biñan River started in 2011. By
2012, nine (9) additional tributary river stations were monitored located in Mangangate
River-Upstream, Tunasan River-Upstream, Sta. Rosa River-Midstream and Upstream,
Pangil River-Upstream, Sta. Maria River-Upstream, Jala-jala River, Tanay River-
Upstream and Morong River-Upstream. Thus, the number of the water quality
monitoring stations at the tributary rivers of LdB in 2012 was thirty four (34).
Throughout the 4-year monitoring period, the water sampling in all lake and tributary
river stations was conducted once a month. The analyses of the collected water
samples were in accordance with the Standard Methods for the Examination of Water
and Wastewater, 21st Edition. 2005. APHA, AWWA, WEF.
This report covers seventeen (17) physico-chemical parameters, three (3) biological
parameters, two (2) micro-biological parameters and the results of the lake primary
productivity studies. The biological analysis of the water samples in the tributary rivers
for phytoplankton counts began only in 2011.
ii
ACKNOWLEDGEMENT
This water quality report on the Laguna de Bay and its tributaries for 2009 to 2012 was
prepared by Ireneo G. Bongco (Sr. Science Research Specialist) and Joebeth S.
Dalisay (Science Research Specialist II) of the LLDA - Environmental Laboratory and
Research Division (ELRD) as part of the LLDA’s Water Quality Monitoring Program.
The support of the following in the preparation and completion of this report is hereby
acknowledged:
1. Jocelyn G. Sta. Ana – OIC, ELRD
2. Bileynnie P. Encarnacion – Head, Biology Section - ELRD
3. Dolorita Z. Ravanilla – Head, Chemistry Section – ELRD
4. Marilou D. Cebujano – Head, Microbiology Section – ELRD
Special thanks are also extended to all the technical and support staff of ELRD.
For Public Inquiries, please contact: Environmental Laboratory and Research Division Tel. No. 286-6143 Laguna Lake Development Authority Department of Environment and Natural Resources Club Manila East, Taytay, Rizal
iii
LAGUNA LAKE AND ITS TRIBUTARY RIVERS SAMPLING STATIONS
iv
LAGUNA LAKE PRIMARY PRODUCTIVITY STUDY SAMPLING STATION
v
TABLE OF CONTENTS
Page
Foreword i
Acknowledgement ii
Location Map of Laguna Lake and Its Tributary Rivers Sampling Stations iii
Location Map of Laguna Lake Primary Productivity Study Sampling Stations iv
Table of Contents v
List of Tables vii
List of Figures ix
Introduction 1
Physico-chemical Parameters
Alkalinity 2
Ammonia 6
Biochemical Oxygen Demand 10
Calcium Hardness 14
Chemical Oxygen Demand 18
Chloride 22
Dissolved Oxygen 26
Inorganic Phosphate 30
Nitrate 34
Oil and Grease 38
pH 42
Temperature 46
Total Dissolved Solids 50
vi
Page
Total Hardness 54
Total Suspended Solids 58
Transparency 62
Turbidity 64 Biological Parameters
Phytoplankton 68
Zooplankton 72
Benthos 74
Microbiological Parameters
Total Coliform 76
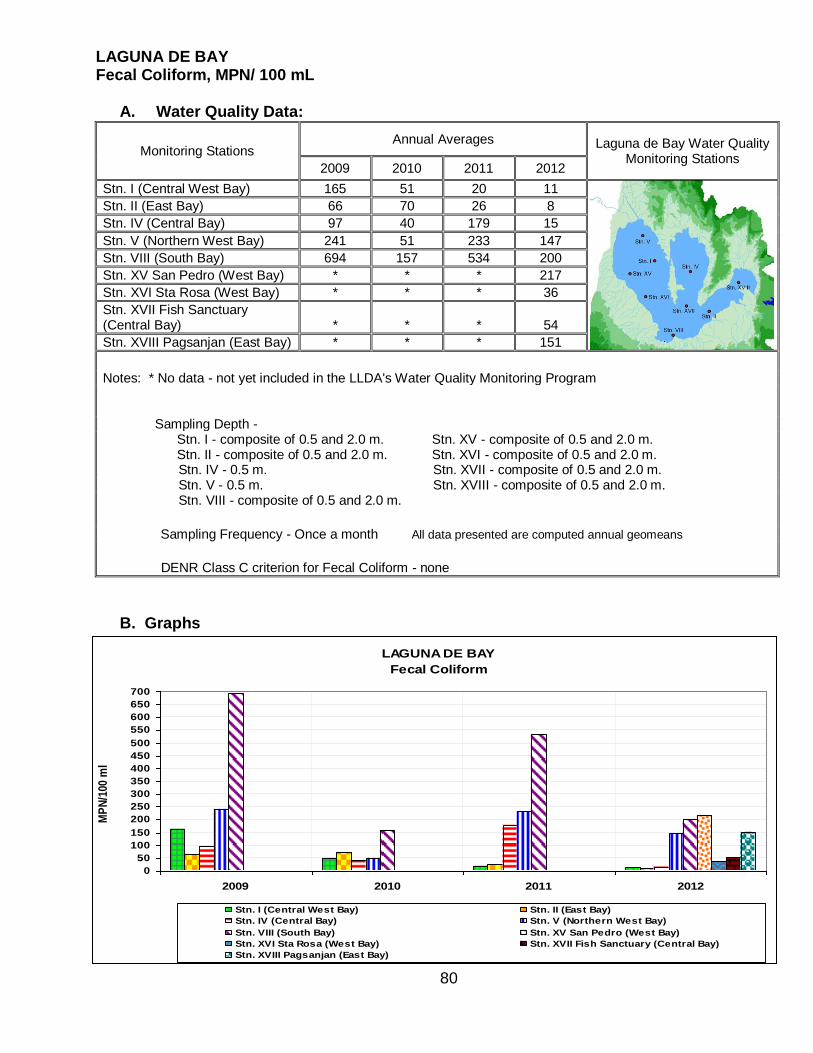
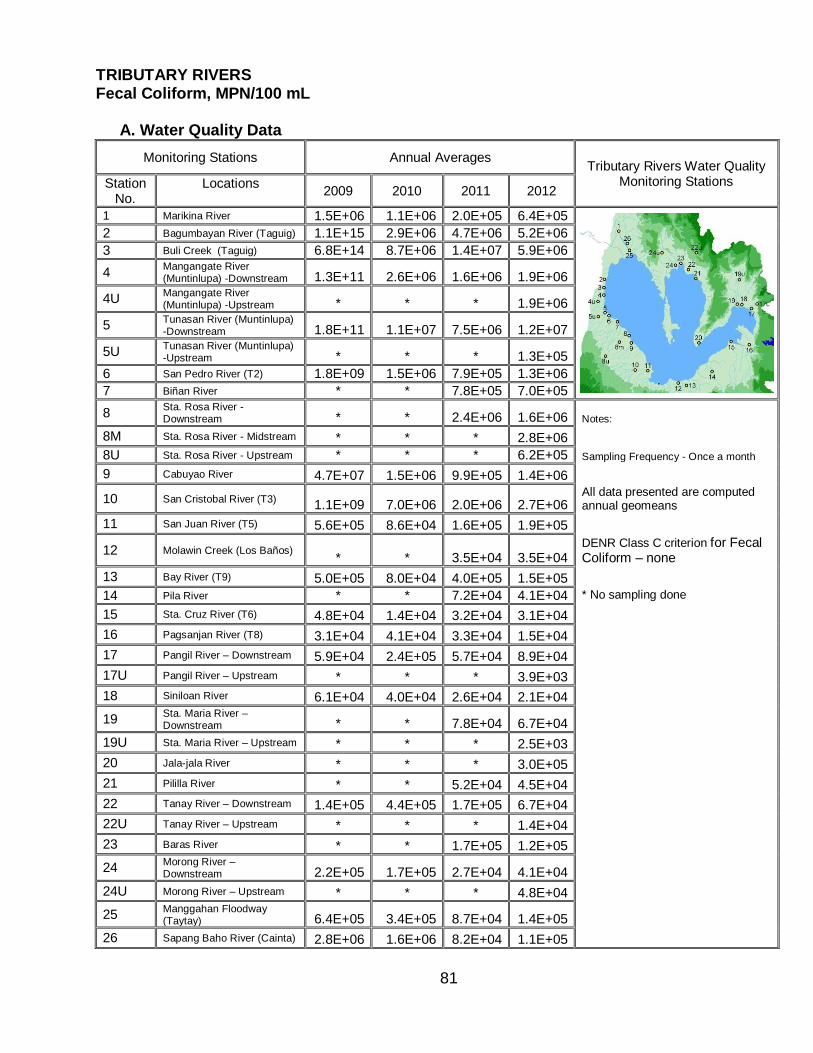
Fecal Coliform 80
Net Primary Productivity of Laguna de Bay 84
Summary 86
Methods of Analysis 87
DENR Administrative Order No.34 88
References 90
vii
LIST OF TABLES
Laguna de Bay and Its Tributary Rivers Page
Physico-chemical Parameters
Alkalinity 2-3
Ammonia 6-7
Biochemical Oxygen Demand 10-11
Calcium Hardness 14-15
Chemical Oxygen Demand 18-19
Chloride 22-23
Dissolved Oxygen 26-27
Inorganic Phosphate 30-31
Nitrate 34-35
Oil and Grease 38-39
pH 42-43
Temperature 46-47
Total Dissolved Solids 50-51
Total Hardness 54-55
Total Suspended Solids 58-59
Transparency 62
Turbidity 64-65 Biological Parameters
Phytoplankton 68-69
Zooplankton 72
Benthos 74
viii
Page
Microbiological Parameters
Total Coliform 76-77
Fecal Coliform 80-81
Net Primary Productivity 84
ix
LIST OF FIGURES
Page
1. Location Map of Laguna de Bay and its Tributary Rivers Sampling Stations iii
2. Location Map of Laguna Lake Primary Productivity Study iv
3. Graphical Presentation
Physico-chemical Parameters
Alkalinity 2 & 4
Ammonia 6 & 8
Biochemical Oxygen Demand 10 & 12
Calcium Hardness 14 & 16
Chemical Oxygen Demand 18 & 20
Chloride 22 & 24
Dissolved Oxygen 26 & 28
Inorganic Phosphate 30 & 32
Nitrate 34 & 36
Oil and Grease 38 & 40
pH 42 & 44
Temperature 46 & 48
Total Dissolved Solids 50 & 52
Total Hardness 54 & 56
Total Suspended Solids 58 & 60
Transparency 62
Turbidity 64 & 66
x
Page
Biological Parameters
Phytoplankton 68 & 70
Zooplankton 72
Benthos 74
Microbiological Parameters
Total Coliform 76 & 78
Fecal Coliform 80 & 82
Net Primary Productivity 84
1
INTRODUCTION
Laguna de Bay, with a total surface area of 900 square kilometres (km2), is the biggest lake and one of the most important inland bodies of water in the Philippines. This almost heart-shaped lake, located 13o55‘ to 14o50‘ N latitude and 20o50‘ to 121o45‘ E longitude at 15 kilometers (kms.) southeast of Manila, has three (3) distinct bays, namely: West Bay, Central Bay and East Bay. Its southernmost portion is called the South Bay. Although shallow with an average depth of only 2.5 meters, the lake‘s water holding capacity is estimated at 2.19 billion cubic meters (m3). The lake‘s watershed area of 3,820 square kilometers straddles the whole provinces of Rizal and Laguna, and some towns in Batangas, Cavite, Quezon and cities in Metro Manila. Twenty-one (21) major tributary river systems flow into the lake aside from other relatively small rivers and streams (Tongson, E. T. et al., 2012). The lake‘s only outlet is the Napindan Channel which is connected to Manila Bay via the Pasig River. Seawater backflow has been a natural phenomenon in the lake and it took place in some years in the past. This happens in the lake not every year but occasionally in summer months whenever the lake level is lower than in Manila Bay. As the Pasig River reverses its flow during the entry of saltwater due to the effect of tidal fluctuation in Manila Bay, the salinity of the water in the lake increases. As a multi use water resource, Laguna Bay is used as source of irrigation water, industrial cooling water, hydroelectric power generation, transport route, source of animal feed, a venue for recreation, source of fish supply and source of domestic water supply. The National Statistics Office (NSO) reported that as of 2007, the total population around the lake was about 14.4 million. To ensure the viability of this vital resource, support is needed from the various lake stakeholders and other parties interested in its sustainable use. Likewise, proper management of the lake and its watershed areas must be intensified and sustained for environmentally sound resources conservation. From 1975 to 1977, a study was jointly undertaken by the World Health Organization (WHO) and the Laguna Lake Development Authority (LLDA) which included benchmarking of important water parameters and environmental indicators through the conduct of a Comprehensive Water Quality Management Program of Laguna Bay. Realizing the usefulness of having available water quality information on Laguna de Bay and its tributary rivers, LLDA has continuously implemented its water quality monitoring program since the 1970‘s with the following objectives:
1) To accurately assess the suitability of the lake for all its present and intended beneficial uses, and
2) To evaluate the impacts of development activities on the lake‘s water quality that will serve as important criteria for environmental planning and management.
2
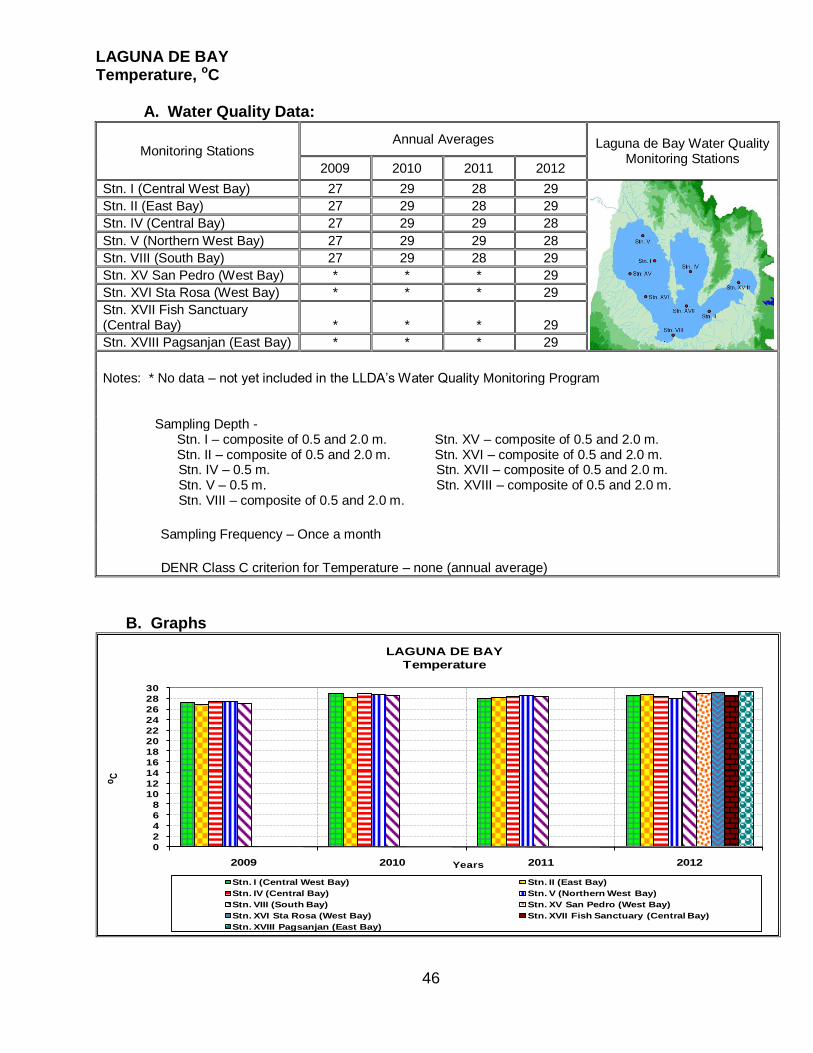
LAGUNA DE BAY Alkalinity, mg CaCO3/L
A. Water Quality Data:
Monitoring Stations Annual Averages Laguna de Bay Water Quality
Monitoring Stations 2009 2010 2011 2012
Stn. I (Central West Bay) 97 101 82 97 Stn. II (East Bay) 87 91 72 84
Stn. IV (Central Bay) 96 102 84 93
Stn. V (Northern West Bay) 101 104 85 94
Stn. VIII (South Bay) 100 105 86 93
Stn. XV San Pedro (West Bay) * * * 91
Stn. XVI Sta Rosa (West Bay) * * * 89
Stn. XVII Fish Sanctuary (Central Bay) * * * 90
Stn. XVIII Pagsanjan (East Bay) * * * 79
Notes: * No data - not yet included in the LLDA's Water Quality Monitoring Program Sampling Depth - Stn. I - composite of 0.5 and 2.0 m. Stn. XV - composite of 0.5 and 2.0 m. Stn. II - composite of 0.5 and 2.0 m. Stn. XVI - composite of 0.5 and 2.0 m. Stn. IV - 0.5 m. Stn. XVII - composite of 0.5 and 2.0 m. Stn. V - 0.5 m. Stn. XVIII - composite of 0.5 and 2.0 m. Stn. VIII - composite of 0.5 and 2.0 m.
Sampling Frequency - Once a month
DENR Class C criterion for Alkalinity - none
B. Graphs
3
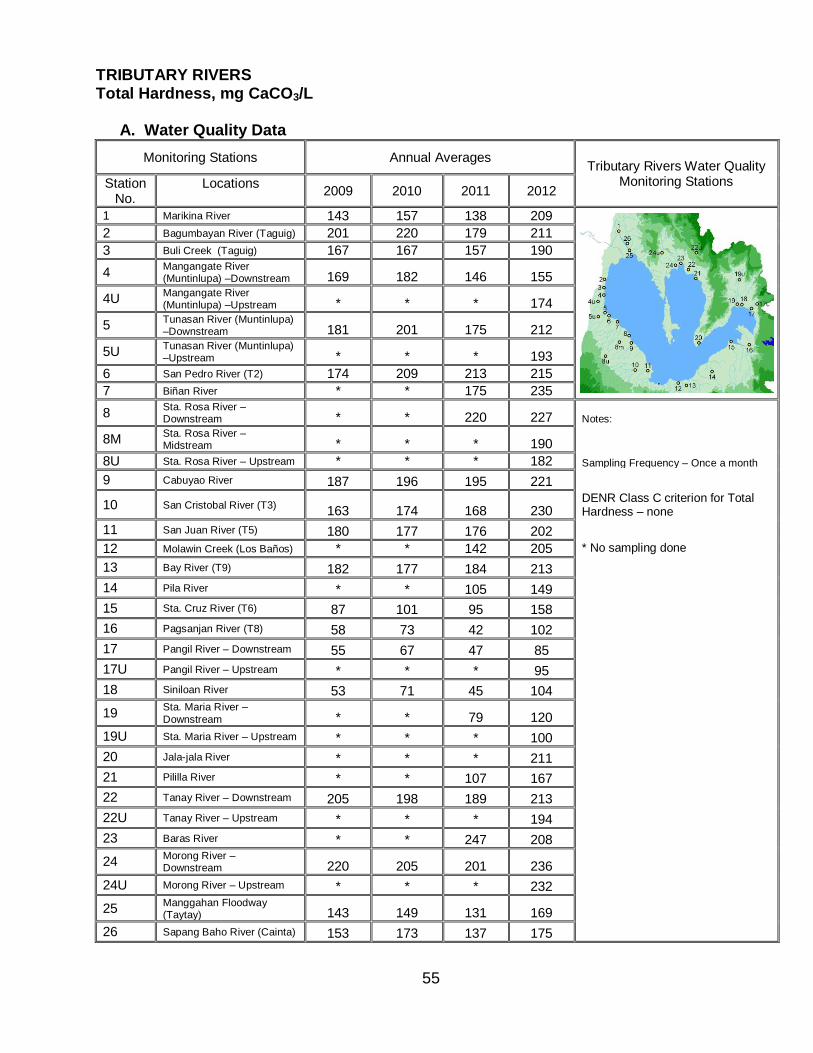
TRIBUTARY RIVERS Alkalinity, mg CaCO3/L
A. Water Quality Data
Monitoring Stations Annual Averages Tributary Rivers Water Quality
Monitoring Stations Station No.
Locations 2009 2010 2011 2012
1 Marikina River 175 167 152 156 2 Bagumbayan River (Taguig) 436 446 282 256
3 Buli Creek (Taguig) 395 415 313 249
4 Mangangate River (Muntinlupa) -Downstream 363 328 239 182
4U Mangangate River (Muntinlupa) -Upstream * * * 166
5 Tunasan River (Muntinlupa) -Downstream 327 362 312 300
5U Tunasan River (Muntinlupa) -Upstream * * * 193
6 San Pedro River (T2) 307 345 330 290
7 Biñan River * * 253 254
8 Sta. Rosa River - Downstream * * 297 242 Notes:
8M Sta. Rosa River - Midstream * * * 203 8U Sta. Rosa River - Upstream * * * 171 Sampling Frequency - Once a month
9 Cabuyao River 299 294 289 230
10 San Cristobal River (T3) 249 252 252 197
DENR Class C criterion for Alkalinity - none
11 San Juan River (T5) 186 148 156 144
12 Molawin Creek (Los Baños) * * 164 187 * No sampling done
13 Bay River (T9) 255 225 222 188
14 Pila River * * 249 252
15 Sta. Cruz River (T6) 109 115 96 127
16 Pagsanjan River (T8) 60 93 42 109
17 Pangil River - Downstream 51 74 49 74
17U Pangil River - Upstream * * * 83
18 Siniloan River 67 86 48 79
19 Sta. Maria River - Downstream * * 80 87
19U Sta. Maria River - Upstream * * * 85
20 Jala-jala River * * * 81
21 Pililla River * * 112 130
22 Tanay River - Downstream 232 216 187 172
22U Tanay River - Upstream * * * 167
23 Baras River * * 112 132
24 Morong River - Downstream 277 246 217 239
24U Morong River - Upstream * * * 229
25 Manggahan Floodway (Taytay) 184 182 159 165
26 Sapang Baho River (Cainta) 203 190 170 161
4
B. Graphs:
TRIBUTARY RIVERS
Alkalinity
0
50
100
150
200
250
300
350
400
450
500
2009 2010 2011 2012
Year
mg
/L
1 Marikina River 2 Bagumbayan River (Taguig) 3 Buli Creek (Taguig)
4 Mangangate River (Muntinlupa) -Downstream 4U Mangangate River (Muntinlupa) -Upstream 5 Tunasan River (Muntinlupa) -Downstream
5U Tunasan River (Muntinlupa) -Upstream 6 San Pedro River (T2) 7 Biñan River
8 Sta. Rosa River - Downstream 8M Sta. Rosa River - Midstream 8U Sta. Rosa River - Upstream
9 Cabuyao River 10 San Cristobal River (T3) 11 San Juan River (T5)
12 Molawin Creek (Los Baños) 13 Bay River (T9) 14 Pila River
15 Sta. Cruz River (T6) 16 Pagsanjan River (T8) 17 Pangil River - Downstream
17U Pangil River - Upstream 18 Siniloan River 19 Sta. Maria River - Downstream
19U Sta. Maria River - Upstream 20 Jala-jala River 21 Pililla River
22 Tanay River - Downstream 22U Tanay River - Upstream 23 Baras River
24 Morong River - Downstream 24U Morong River - Upstream 25 Manggahan Floodway (Taytay)
26 Sapang Baho River (Cainta)
5
ALKALINITY
Alkalinity is a measure of the water‘s capacity to neutralize acids and bases thereby maintaining a fairly stable pH. It is also referred to as the acid neutralizing capacity, and sometimes the buffering capacity. Alkalinity of natural waters is due primarily to the presence of weak acid salts although strong bases may also contribute in extreme environments. Bicarbonates represent the major form of alkalinity in natural waters and its source is the partitioning of carbon dioxide (CO2) from the atmosphere and the weathering of carbonate minerals in rocks and soil. Other salts of weak acids, such as borate, silicates, ammonia, phosphates, and organic bases from natural organic matter, may be present in small amounts. Alkalinity is reported as mg/L CaCO3 since most alkalinity is derived from the weathering of carbonate minerals (http://www.whitman.edu/chemistry/edusolns_software/ AlkalinityBackground.pdf). .
Alkalinity in natural levels is beneficial to all organisms that depend on water because it helps prevent acidic water (pH < 5) by resisting a change in pH that is harmful to humans, wildlife, and aquatic organisms (http://serc.carleton.edu/sp/mnstep/activities/ 38045.html).
For protection of aquatic life, the buffering capacity should be at least 20 mg/L CaCO3. If alkalinity is naturally low, (less than 20 mg/L) there can be no greater than a 25% reduction in alkalinity (Source: http://www.wilkes.edu/pages/3746.asp). By maintaining at least 20 mg/L CaCO3, the buffering system of the water is preserved which is an important factor to aquatic life since fluctuation of the pH is prevented (LLDA, 1997).
Under DENR Administrative Order (DAO) No. 34, there is no set Class C criterion for alkalinity. From 2009 to 2012, the annual average alkalinity levels in the lake ranged from 82 mg/L CaCO3 (in Stn I - Central West Bay in 2011) to 105 mg/l CaCO3 (in Stn. VIII - South Bay in 2010). In the tributary rivers, the computed annual average alkalinity levels ranged from 42 mg/L CaCO3 (in Stn 16 - Pagsanjan River in 2011) to 446 mg/l CaCO3 (in Stn. 2 – Bagumbayan River in 2010).
Monitoring Stations Annual Averages Laguna de Bay Water Quality
Monitoring Stations 2009 2010 2011 2012
Stn. I (Central West Bay) 0.044 0.068 0.171 0.162 Stn. II (East Bay) 0.013 0.034 0.038 0.146
Stn. IV (Central Bay) 0.025 0.042 0.060 0.043
Stn. V (Northern West Bay) 0.025 0.055 0.150 0.287
Stn. VIII (South Bay) 0.024 0.032 0.047 0.060
Stn. XV San Pedro (West Bay) * * * 0.045
Stn. XVI Sta Rosa (West Bay) * * * 0.053
Stn. XVII Fish Sanctuary (Central Bay) * * * 0.048
Stn. XVIII Pagsanjan (East Bay) * * * 0.057
Notes: * No data - not yet included in the LLDA's Water Quality Monitoring Program Sampling Depth - Stn. I - composite of 0.5 and 2.0 m. Stn. XV - composite of 0.5 and 2.0 m. Stn. II - composite of 0.5 and 2.0 m. Stn. XVI - composite of 0.5 and 2.0 m. Stn. IV - 0.5 m. Stn. XVII - composite of 0.5 and 2.0 m. Stn. V - 0.5 m. Stn. XVIII - composite of 0.5 and 2.0 m. Stn. VIII - composite of 0.5 and 2.0 m.
Sampling Frequency - Once a month
DENR Class C criterion for Ammonia - none
B. Graphs
7
TRIBUTARY RIVERS Ammonia, mg/L
A. Water Quality Data
Monitoring Stations Annual Averages Tributary Rivers Water Quality
Monitoring Stations Station No.
Locations 2009 2010 2011 2012
1 Marikina River 2.71 4.21 2.07 2.85 2 Bagumbayan River (Taguig) 8.25 33.30 5.10 5.53
3 Buli Creek (Taguig) 7.99 23.58 4.84 5.86
4 Mangangate River (Muntinlupa) -Downstream 5.70 14.90 4.41 3.71
4U Mangangate River (Muntinlupa) -Upstream * * * 3.81
5 Tunasan River (Muntinlupa) -Downstream 5.29 6.87 2.74 5.22
5U Tunasan River (Muntinlupa) -Upstream * * * 1.34
6 San Pedro River (T2) 6.25 10.99 3.79 5.09
7 Biñan River * * 2.71 4.24
8 Sta. Rosa River - Downstream * * 2.66 2.88 Notes:
8M Sta. Rosa River - Midstream * * * 2.08 8U Sta. Rosa River - Upstream * * * 0.94 Sampling Frequency - Once a month
9 Cabuyao River 2.46 4.63 3.71 4.03
10 San Cristobal River (T3) 0.38 0.32 0.26 0.21
DENR Class C criterion for Ammonia - none
11 San Juan River (T5) 0.72 0.81 0.74 0.48 12 Molawin Creek (Los Baños) * * 0.19 0.28 * No sampling done
13 Bay River (T9) 0.09 0.10 0.12 0.11
14 Pila River * * 0.13 0.20
15 Sta. Cruz River (T6) 0.21 0.14 0.15 0.27
16 Pagsanjan River (T8) 0.07 0.04 0.09 0.07
17 Pangil River - Downstream 0.06 0.11 0.10 0.13
17U Pangil River - Upstream * * * 0.06
18 Siniloan River 0.71 1.31 0.42 1.00
19 Sta. Maria River -
Downstream * * 0.09 0.24
19U Sta. Maria River - Upstream * * * 0.06
20 Jala-jala River * * * 0.12
21 Pililla River * * 0.32 0.55
22 Tanay River - Downstream 0.53 0.44 0.81 0.40
22U Tanay River - Upstream * * * 0.10
23 Baras River * * 0.81 0.40
24 Morong River - Downstream 2.34 4.45 1.81 2.48
24U Morong River - Upstream * * * 3.16
25 Manggahan Floodway
(Taytay) 2.27 4.35 2.74 3.12
26 Sapang Baho River (Cainta) 3.26 5.61 3.05 3.65
8
B. Graphs:
0.00
5.00
10.00
15.00
20.00
25.00
30.00
35.00
2009 2010 2011 2012
mg
/L
Year
TRIBUTARY RIVERSAmmonia
1 Marikina River 2 Bagumbayan River (Taguig) 3 Buli Creek (Taguig)
4 Mangangate River (Muntinlupa) -Downstream 4U Mangangate River (Muntinlupa) -Upstream 5 Tunasan River (Muntinlupa) -Downstream
5U Tunasan River (Muntinlupa) -Upstream 6 San Pedro River (T2) 7 Biñan River
8 Sta. Rosa River - Downstream 8M Sta. Rosa River - Midstream 8U Sta. Rosa River - Upstream
9 Cabuyao River 10 San Cristobal River (T3) 11 San Juan River (T5)
12 Molawin Creek (Los Baños) 13 Bay River (T9) 14 Pila River
15 Sta. Cruz River (T6) 16 Pagsanjan River (T8) 17 Pangil River - Downstream
17U Pangil River - Upstream 18 Siniloan River 19 Sta. Maria River - Downstream
19U Sta. Maria River - Upstream 20 Jala-jala River 21 Pililla River
22 Tanay River - Downstream 22U Tanay River - Upstream 23 Baras River
24 Morong River - Downstream 24U Morong River - Upstream 25 Manggahan Floodway (Taytay)
26 Sapang Baho River (Cainta)
9
AMMONIA
Ammonia is a colorless gas with irritating odor. In unpolluted water, trace amounts of ammonia are present from the reduction of atmospheric nitrogen by aquatic microorganisms. Ammonia can be produced naturally from the breakdown of organic matter and is excreted by fish as a nitrogenous waste product. In fish, ammonia is a by-product of protein metabolism and is primarily excreted across the gill membranes, with a small amount excreted in the urine. Ammonia is a toxic compound that can adversely affect fish health. When dissolved in surface water, ammonia exists in two forms: NH3 (unionized) and NH4
+ (ionized). Total ammonia is therefore the sum of the two (2) forms. Ionized ammonia does not easily cross fish gills and is less bioavailable than the unionized form. The unionized form (NH3) can cross from water into fish, and once inside, some converts to the ionized form (NH4
+), which then causes cellular damage (Francis-Floyd 2009; U.S. EPA, 1989 as
cited in http://www.nature.org/cs/groups/webcontent/@web/@alaska/documents/ document/prd_026308.pdf ).The nature and degree of toxicity depends on many factors, including the chemical form of ammonia, the pH and temperature of the water, the length of exposure, and the life stage of the exposed fish. As pH increases, the toxicity of ammonia increases because the relative proportion of unionized ammonia increases. (http://www.nature.org/cs/ groups/ webcontent/@web/@alaska/ documents/document/ prd_026308.pdf).
For the protection of freshwater aquatic life, a level of 0.02 mg/L unionized ammonia (NH3) should not be exceeded (U.S. EPA Environmental Studies Board, 1973 as cited in LLDA, 1997).
DAO 34 has no Class C criterion for ammonia. The highest annual average ammonia concentration in the lake from 2009 to 2012 was in Stn. V – Northern West Bay at 0.287 mg/L in 2012 while the lowest was in Stn. II – East Bay at 0.013 mg/L in 2009.
Among the tributary river stations, Stn. 2 in Bagumbayan River recorded the highest annual average ammonia concentration at 33.30 mg/L in 2010. On the other hand, the lowest annual average ammonia level was obtained in Pagsanjan River in 2010 at 0.04 mg/L. From the computed annual average ammonia concentrations in the tributary rivers from 2009 to 2012, it appeared that those stations with high levels of more than 1 mg/L are mostly located in the West Bay, specifically, Stns. 1, 2, 3, 4, 4U, 5, 5U, 6, 7, 8, 8M, 9, 25 and 26. The other river stations that also yielded relatively high annual average ammonia concentrations were both in Morong River at the Central Bay, namely: Stn. 24 at the downstream from 2009 to 2012, and Stn. 24U at the upstream in 2012.
Monitoring Stations Annual Averages Laguna de Bay Water Quality
Monitoring Stations 2009 2010 2011 2012
Stn. I (Central West Bay) 1 6 3 2 Stn. II (East Bay) 1 5 2 1
Stn. IV (Central Bay) 2 4 2 2
Stn. V (Northern West Bay) 2 5 3 2
Stn. VIII (South Bay) 2 5 2 2
Stn. XV San Pedro (West Bay) * * * 2
Stn. XVI Sta Rosa (West Bay) * * * 2
Stn. XVII Fish Sanctuary (Central Bay) * * * 2
Stn. XVIII Pagsanjan (East Bay) * * * 2
Notes: * No data - not yet included in the LLDA's Water Quality Monitoring Program Sampling Depth - Stn. I - composite of 0.5 and 2.0 m. Stn. XV - composite of 0.5 and 2.0 m. Stn. II - composite of 0.5 and 2.0 m. Stn. XVI - composite of 0.5 and 2.0 m. Stn. IV - 0.5 m. Stn. XVII - composite of 0.5 and 2.0 m. Stn. V - 0.5 m. Stn. XVIII - composite of 0.5 and 2.0 m. Stn. VIII - composite of 0.5 and 2.0 m.
Sampling Frequency - Once a month
DENR Class C criterion for BOD - 7.0 mg/l
B. Graphs
LAGUNA DE BAY
Biochemical Oxygen Demand (BOD)
0
1
2
3
4
5
6
7
2009 2010 2011 2012
Years
mg
/l
Stn. I (Central West Bay) Stn. II (East Bay)
Stn. IV (Central Bay) Stn. V (Northern West Bay)
Stn. VIII (South Bay) Stn. XV San Pedro (West Bay)
Stn. XVI Sta Rosa (West Bay) Stn. XVII Fish Sanctuary (Central Bay)
Stn. XVIII Pagsanjan (East Bay) DENR Class C Criterion
11
TRIBUTARY RIVERS Biochemical Oxygen Demand, mg/L
A. Water Quality Data
Monitoring Stations Annual Averages Tributary Rivers Water Quality
Monitoring Stations Station No.
Locations 2009 2010 2011 2012
1 Marikina River 13 25 12 12 2 Bagumbayan River (Taguig) 60 238 85 64
3 Buli Creek (Taguig) 72 161 136 124
4 Mangangate River (Muntinlupa) -Downstream 20 42 35 22
4U Mangangate River (Muntinlupa) -Upstream * * * 11
5 Tunasan River (Muntinlupa) -Downstream 184 159 129 141
5U Tunasan River (Muntinlupa) -Upstream * * * 5
6 San Pedro River (T2) 16 18 24 23
7 Biñan River * * 24 21
8 Sta. Rosa River - Downstream * * 18 16 Notes:
8M Sta. Rosa River - Midstream * * * 14 8U Sta. Rosa River - Upstream * * * 7 Sampling Frequency - Once a month
9 Cabuyao River 11 14 20 17
10 San Cristobal River (T3) 33 78 63 33
DENR Class C criterion for BOD - 7.0 mg/l (for annual average)
11 San Juan River (T5) 9 5 9 4 12 Molawin Creek (Los Baños) * * 4 3 * No sampling done
13 Bay River (T9) 3 4 3 2
14 Pila River * * 3 3
15 Sta. Cruz River (T6) 3 3 3 2
16 Pagsanjan River (T8) 1 3 2 2
17 Pangil River - Downstream 2 5 2 2
17U Pangil River - Upstream * * * 2
18 Siniloan River 3 7 2 3
19 Sta. Maria River -
Downstream * * 3 2
19U Sta. Maria River - Upstream * * * 1
20 Jala-jala River * * * 3
21 Pililla River * * 3 3
22 Tanay River - Downstream 4 4 3 3
22U Tanay River - Upstream * * * 2
23 Baras River * * 6 5
24 Morong River - Downstream 8 13 20 14
24U Morong River - Upstream * * * 15
25 Manggahan Floodway
(Taytay) 7 14 11 11
26 Sapang Baho River (Cainta) 13 17 15 13
12
B. Graphs:
0
50
100
150
200
250
2009 2010 2011 2012
mg
/L
Year
TRIBUTARY RIVERSBiochemical Oxygen Demand
1 Marikina River 2 Bagumbayan River (Taguig) 3 Buli Creek (Taguig)
4 Mangangate River (Muntinlupa) -Downstream 4U Mangangate River (Muntinlupa) -Upstream 5 Tunasan River (Muntinlupa) -Downstream
5U Tunasan River (Muntinlupa) -Upstream 6 San Pedro River (T2) 7 Biñan River
8 Sta. Rosa River - Downstream 8M Sta. Rosa River - Midstream 8U Sta. Rosa River - Upstream
9 Cabuyao River 10 San Cristobal River (T3) 11 San Juan River (T5)
12 Molawin Creek (Los Baños) 13 Bay River (T9) 14 Pila River
15 Sta. Cruz River (T6) 16 Pagsanjan River (T8) 17 Pangil River - Downstream
17U Pangil River - Upstream 18 Siniloan River 19 Sta. Maria River - Downstream
19U Sta. Maria River - Upstream 20 Jala-jala River 21 Pililla River
22 Tanay River - Downstream 22U Tanay River - Upstream 23 Baras River
24 Morong River - Downstream 24U Morong River - Upstream 25 Manggahan Floodway (Taytay)
26 Sapang Baho River (Cainta) DENR Class C Criterion
13
BIOCHEMICAL OXYGEN DEMAND
Biological Oxygen Demand (BOD) is the amount of oxygen required by microorganisms for stabilizing biologically decomposable organic matter (carbonaceous) in water under aerobic conditions. The test is used to determine the pollution load of wastewater, the degree of pollution and the efficiency of wastewater treatment methods (http://ces.iisc.ernet.in/energy/monograph1/Methpage1.html). BOD5 is calculated by
measuring the amount of dissolved oxygen in a water sample when it is collected, then keeping the sample at 20°C for five days and measuring dissolved oxygen again. The value of the five-day sample is then subtracted from that of the original to get a BOD result in mg/L. High BOD levels can be associated with organic pollution, such as sewage. High levels can also result when nutrient enrichment causes excessive growth and decay of algae and aquatic plants (http://row.nku.edu/index.php?option= com_content&view= article&id= 84&Itemid=74). BOD will not directly harm the aquatic organisms because it is not a pollutant. BOD exerts an indirect effect only when dissolved oxygen of the water is reduced to levels that are unfavorable to aquatic life. (LLDA, 1997). The DENR Class C water quality criterion for BOD set at 7 mg/L was complied in all of the monitored lake stations from 2009 to 2012 based on the computed annual average BOD concentrations. The results of the water quality monitoring in the tributary rivers from 2009 to 2012 showed that annual average BOD concentrations ranged from 1 mg/L (noted in Pagsanjan River station in 2009 and in Sta. Maria River – Upstream station in 2012) to 238 mg/L (recorded in Bagumbayan River station in 2010). It was observed that out of the 34 tributary river stations monitored, only 17 stations (Stns. 5u, 8u,12, 13, 14, 15, 16, 17, 17U, 18, 19, 19U, 20, 21, 22, 22U and 23) had all of the BOD annual averages conformed to the DENR Class C criterion. Those stations whose annual average BOD always exceeded the criterion were mostly in the West Bay area, namely: Stns. 1, 2, 3, 4, 5, 6, 7, 8, 9, 10 and 26.
Monitoring Stations Annual Averages Laguna de Bay Water Quality
Monitoring Stations 2009 2010 2011 2012
Stn. I (Central West Bay) 37 62 39 36 Stn. II (East Bay) 33 46 31 31
Stn. IV (Central Bay) 35 58 39 37
Stn. V (Northern West Bay) 42 64 38 43
Stn. VIII (South Bay) 42 49 38 38
Stn. XV San Pedro (West Bay) * * * 47
Stn. XVI Sta Rosa (West Bay) * * * 42
Stn. XVII Fish Sanctuary (Central Bay) * * * 43
Stn. XVIII Pagsanjan (East Bay) * * * 37
Notes: * No data - not yet included in the LLDA's Water Quality Monitoring Program Sampling Depth - Stn. I - composite of 0.5 and 2.0 m. Stn. XV - composite of 0.5 and 2.0 m. Stn. II - composite of 0.5 and 2.0 m. Stn. XVI - composite of 0.5 and 2.0 m. Stn. IV - 0.5 m. Stn. XVII - composite of 0.5 and 2.0 m. Stn. V - 0.5 m. Stn. XVIII - composite of 0.5 and 2.0 m. Stn. VIII - composite of 0.5 and 2.0 m.
Sampling Frequency - Once a month
DENR Class C criterion for Calcium Hardness - none
B. Graphs
LAGUNA DE BAY
Calcium Hardness
0
5
10
15
20
25
30
35
40
45
50
55
60
65
2009 2010 2011 2012
Years
mg
CaC
O3/L
Stn. I (Central West Bay) Stn. II (East Bay) Stn. IV (Central Bay)
Stn. V (Northern West Bay) Stn. VIII (South Bay) Stn. XV San Pedro (West Bay)
Stn. XVI Sta Rosa (West Bay) Stn. XVII Fish Sanctuary (Central Bay) Stn. XVIII Pagsanjan (East Bay)
15
TRIBUTARY RIVERS Calcium Hardness, mg CaCO3/L
A. Water Quality Data
Monitoring Stations Annual Averages Tributary Rivers Water Quality
Monitoring Stations Station No.
Locations 2009 2010 2011 2012
1 Marikina River 85 90 88 91 2 Bagumbayan River (Taguig) 116 130 89 76
3 Buli Creek (Taguig) 95 99 75 76
4 Mangangate River (Muntinlupa) -Downstream 90 97 76 73
4U Mangangate River (Muntinlupa) -Upstream * * * 76
5 Tunasan River (Muntinlupa)
-Downstream 101 86 76 99
5U Tunasan River (Muntinlupa)
-Upstream * * * 82
6 San Pedro River (T2) 93 100 98 104
7 Biñan River * * 87 90
8 Sta. Rosa River - Downstream * * 99 101 Notes:
8M Sta. Rosa River - Midstream * * * 82 8U Sta. Rosa River - Upstream * * * 77 Sampling Frequency - Once a month
9 Cabuyao River 89 100 98 86
10 San Cristobal River (T3) 87 90 79 97
DENR Class C criterion for Calcium Hardness - none
11 San Juan River (T5) 85 97 83 91 12 Molawin Creek (Los Baños) * * 70 75 * No sampling done
13 Bay River (T9) 82 82 81 77
14 Pila River * * 42 67
15 Sta. Cruz River (T6) 41 50 34 59
16 Pagsanjan River (T8) 30 42 18 52
17 Pangil River - Downstream 20 36 23 52
17U Pangil River - Upstream * * * 50
18 Siniloan River 24 42 22 42
19 Sta. Maria River - Downstream * * 45 60
19U Sta. Maria River - Upstream * * * 53
20 Jala-jala River * * * 134
21 Pililla River * * 60 142
22 Tanay River - Downstream 111 90 120 118
22U Tanay River - Upstream * * * 114
23 Baras River * * 60 79
24 Morong River - Downstream 127 111 122 133
24U Morong River - Upstream * * * 131
25 Manggahan Floodway (Taytay) 82 88 82 89
26 Sapang Baho River (Cainta) 84 90 84 81
16
B. Graphs:
0
20
40
60
80
100
120
140
160
2009 2010 2011 2012
mg
/L
Year
TRIBUTARY RIVERSCalcium Hardness
1 Marikina River 2 Bagumbayan River (Taguig) 3 Buli Creek (Taguig)
4 Mangangate River (Muntinlupa) -Downstream 4U Mangangate River (Muntinlupa) -Upstream 5 Tunasan River (Muntinlupa) -Downstream
5U Tunasan River (Muntinlupa) -Upstream 6 San Pedro River (T2) 7 Biñan River
8 Sta. Rosa River - Downstream 8M Sta. Rosa River - Midstream 8U Sta. Rosa River - Upstream
9 Cabuyao River 10 San Cristobal River (T3) 11 San Juan River (T5)
12 Molawin Creek (Los Baños) 13 Bay River (T9) 14 Pila River
15 Sta. Cruz River (T6) 16 Pagsanjan River (T8) 17 Pangil River - Downstream
17U Pangil River - Upstream 18 Siniloan River 19 Sta. Maria River - Downstream
19U Sta. Maria River - Upstream 20 Jala-jala River 21 Pililla River
22 Tanay River - Downstream 22U Tanay River - Upstream 23 Baras River
24 Morong River - Downstream 24U Morong River - Upstream 25 Manggahan Floodway (Taytay)
26 Sapang Baho River (Cainta)
17
CALCIUM HARDNESS
Calcium Hardness is caused by the presence of calcium ions in the water. The presence of calcium in water results from passage through or over deposits of limestone, dolomite, gypsum and such other calcium bearing rocks. Calcium contributes to the total hardness of water and is an important micro-nutrient in aquatic environment needed in large quantities by molluscs and vertebrates. It is measured by EDTA titrimetric method and the results of the analysis is reported in mg CaCO3/L. Small concentration of calcium carbonate prevents corrosion of metal pipes by laying down a protective coating (http://ces.iisc.ernet.in/energy/monograph1/Methpage1.html). Calcium salts can also be readily precipitated from water and high levels of calcium hardness tend to promote scale formation in the water system (http://www.aquaticlife.ca/Parameters/CalciumHardness.asp).
There is no set DENR Class C criterion for calcium hardness. The highest among the annual mean calcium hardness levels in the lake was 64 mg CaCO3/L in 2010 at Stn. V (Northern West Bay) while the lowest was 31 mg CaCO3/L in 2011 and 2012 in Stn. II (East Bay). It was also noted that the year when all of the monitored lake stations obtained their highest annual mean calcium hardness concentrations during the four-year monitoring period was in 2010.
In the tributary rivers, the annual average calcium hardness was highest in Pililla River in 2012 at 142 mg CaCO3/L and lowest at 18 mg CaCO3/L was in Pagsanjan River in 2010.
Monitoring Stations Annual Averages Laguna de Bay Water Quality
Monitoring Stations 2009 2010 2011 2012
Stn. I (Central West Bay) 6 41 33 21 Stn. II (East Bay) 22 18 19 18
Stn. IV (Central Bay) 3 25 22 16
Stn. V (Northern West Bay) 4 25 22 18
Stn. VIII (South Bay) 5 21 23 17
Stn. XV San Pedro (West Bay) * * * 18
Stn. XVI Sta Rosa (West Bay) * * * 16
Stn. XVII Fish Sanctuary (Central Bay) * * * 18
Stn. XVIII Pagsanjan (East Bay) * * * 21
Notes: * No data - not yet included in the LLDA's Water Quality Monitoring Program Sampling Depth - Stn. I - composite of 0.5 and 2.0 m. Stn. XV - composite of 0.5 and 2.0 m. Stn. II - composite of 0.5 and 2.0 m. Stn. XVI - composite of 0.5 and 2.0 m. Stn. IV - 0.5 m. Stn. XVII - composite of 0.5 and 2.0 m. Stn. V - 0.5 m. Stn. XVIII - composite of 0.5 and 2.0 m. Stn. VIII - composite of 0.5 and 2.0 m.
Sampling Frequency - Once a month
DENR Class C criterion for COD - none
B. Graphs
LAGUNA DE BAY
Chemical Oxygen Demand (COD)
0
5
10
15
20
25
30
35
40
45
2009 2010 2011 2012
Years
mg
/L
Stn. I (Central West Bay) Stn. II (East Bay) Stn. IV (Central Bay)
Stn. V (Northern West Bay) Stn. VIII (South Bay) Stn. XV San Pedro (West Bay)
Stn. XVI Sta Rosa (West Bay) Stn. XVII Fish Sanctuary (Central Bay) Stn. XVIII Pagsanjan (East Bay)
19
TRIBUTARY RIVERS Chemical Oxygen Demand, mg/L
A. Water Quality Data
Monitoring Stations Annual Averages Tributary Rivers Water Quality
Monitoring Stations Station No.
Locations 2009 2010 2011 2012
1 Marikina River 29 35 31 32 2 Bagumbayan River (Taguig) 138 332 169 134
3 Buli Creek (Taguig) 125 361 248 225
4 Mangangate River (Muntinlupa) -Downstream 84 158 70 75
4U Mangangate River (Muntinlupa) -Upstream * * * 71
5 Tunasan River (Muntinlupa)
-Downstream 572 227 244 249
5U Tunasan River (Muntinlupa)
-Upstream * * * 40
6 San Pedro River (T2) 75 61 142 62
7 Biñan River * * 42 87
8 Sta. Rosa River - Downstream * * 44 38 Notes:
8M Sta. Rosa River - Midstream * * * 52 8U Sta. Rosa River - Upstream * * * 45 Sampling Frequency - Once a month
9 Cabuyao River 55 23 46 40
10 San Cristobal River (T3) 79 195 133 66
DENR Class C criterion for COD - none
11 San Juan River (T5) 51 25 21 29 12 Molawin Creek (Los Baños) * * 16 25 * No sampling done
13 Bay River (T9) 38 21 21 21
14 Pila River * * 15 30
15 Sta. Cruz River (T6) 28 33 9 30
16 Pagsanjan River (T8) 36 97 15 19
17 Pangil River - Downstream 15 17 8 26
17U Pangil River - Upstream * * * 12
18 Siniloan River 30 22 17 21
19 Sta. Maria River - Downstream * * 16 17
19U Sta. Maria River - Upstream * * * 8
20 Jala-jala River * * * 9
21 Pililla River * * 12 16
22 Tanay River - Downstream 43 28 14 13
22U Tanay River - Upstream * * * 7
23 Baras River * * 24 17
24 Morong River - Downstream 16 38 35 33
24U Morong River - Upstream * * * 50
25 Manggahan Floodway (Taytay) 22 73 36 34
26 Sapang Baho River (Cainta) 34 37 44 46
20
B. Graphs:
0
100
200
300
400
500
600
700
2009 2010 2011 2012
mg
/L
Year
TRIBUTARY RIVERSChemical Oxygen Demand
1 Marikina River 2 Bagumbayan River (Taguig) 3 Buli Creek (Taguig)
4 Mangangate River (Muntinlupa) -Downstream 4U Mangangate River (Muntinlupa) -Upstream 5 Tunasan River (Muntinlupa) -Downstream
5U Tunasan River (Muntinlupa) -Upstream 6 San Pedro River (T2) 7 Biñan River
8 Sta. Rosa River - Downstream 8M Sta. Rosa River - Midstream 8U Sta. Rosa River - Upstream
9 Cabuyao River 10 San Cristobal River (T3) 11 San Juan River (T5)
12 Molawin Creek (Los Baños) 13 Bay River (T9) 14 Pila River
15 Sta. Cruz River (T6) 16 Pagsanjan River (T8) 17 Pangil River - Downstream
17U Pangil River - Upstream 18 Siniloan River 19 Sta. Maria River - Downstream
19U Sta. Maria River - Upstream 20 Jala-jala River 21 Pililla River
22 Tanay River - Downstream 22U Tanay River - Upstream 23 Baras River
24 Morong River - Downstream 24U Morong River - Upstream 25 Manggahan Floodway (Taytay)
26 Sapang Baho River (Cainta)
21
CHEMICAL OXYGEN DEMAND
The COD is the amount of oxygen which is needed for the oxidation of all organic substances in water in mg/L or g/m3. It is measured by Dichromate Reflux Method. The intrinsic limitation of the test lies in its ability to differentiate between the biologically oxidizable and inert material (http://ces.iisc.ernet.in/energy/monograph1/Methpage1. html). The main use of COD as an indicator of the organic and inorganic matter within
water and effluent discharge is it provides information on the quantity of oxygen required to completely oxidize both the organic and inorganic material present in water. There are other tests that are also used to measure the organic content of a water body, such as the biological oxygen demand test. One advantage of the COD test over other tests, such as the BOD test is that it is relatively fast to carry out, for example the BOD test takes place over a five-day incubation period while the COD tests can be carried out in 2 hours; hence provides a much quicker indication of water quality. This property of the test has resulted in a wide range of usage when monitoring and controlling the organic content of industrial waste from effluent systems and the receiving water bodies (http://www.writework.com/essay/determination-chemical-oxygen-demand- cod- river- water-samples).
From 2009 to 2012, the annual average COD levels in the lake ranged from 4 mg/L (in 2009 at Stn. V – Northern West Bay) to 41 mg/L (in 2010 at Stn. I – Central West Bay). The range of annual mean COD concentrations in the tributaries were comparatively higher than in the lake at 7 mg/L in 2011 in Stn. 22U (Tanay River Upstream) and 572 mg/L in 2009 in Stn. 5 (Tunasan River Downstream).
Monitoring Stations Annual Averages Laguna de Bay Water Quality
Monitoring Stations 2009 2010 2011 2012
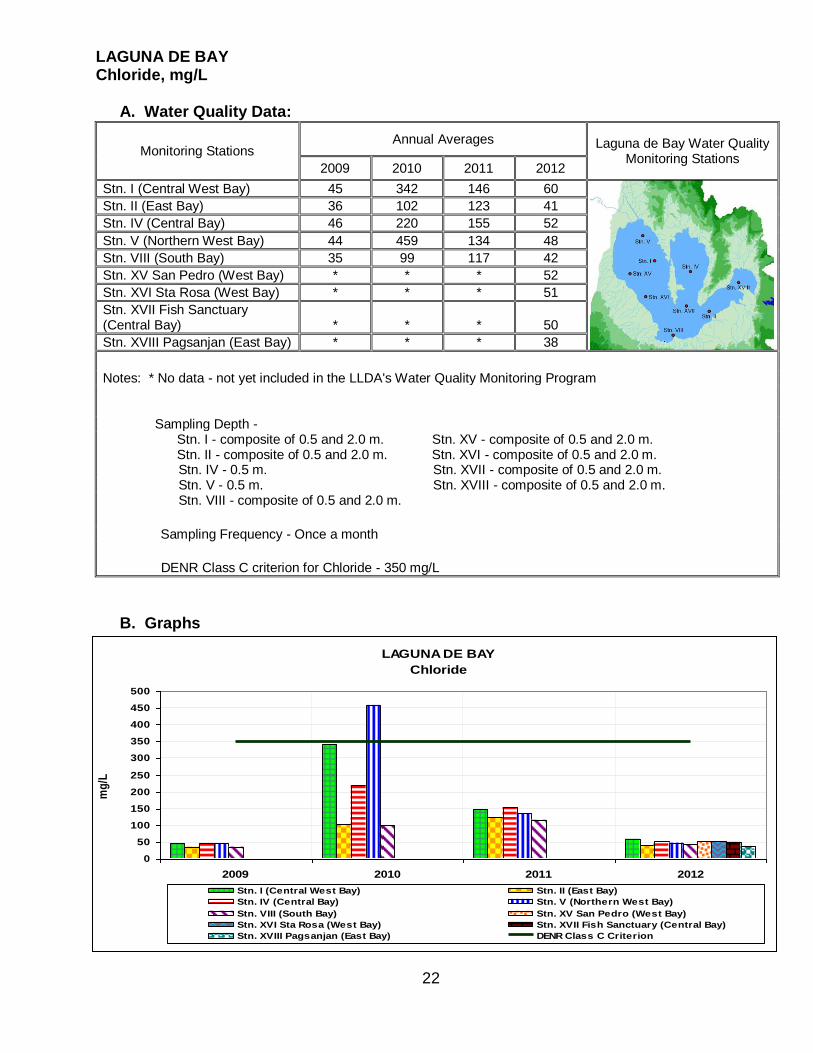
Stn. I (Central West Bay) 45 342 146 60 Stn. II (East Bay) 36 102 123 41
Stn. IV (Central Bay) 46 220 155 52
Stn. V (Northern West Bay) 44 459 134 48
Stn. VIII (South Bay) 35 99 117 42
Stn. XV San Pedro (West Bay) * * * 52
Stn. XVI Sta Rosa (West Bay) * * * 51
Stn. XVII Fish Sanctuary (Central Bay) * * * 50
Stn. XVIII Pagsanjan (East Bay) * * * 38
Notes: * No data - not yet included in the LLDA's Water Quality Monitoring Program Sampling Depth - Stn. I - composite of 0.5 and 2.0 m. Stn. XV - composite of 0.5 and 2.0 m. Stn. II - composite of 0.5 and 2.0 m. Stn. XVI - composite of 0.5 and 2.0 m. Stn. IV - 0.5 m. Stn. XVII - composite of 0.5 and 2.0 m. Stn. V - 0.5 m. Stn. XVIII - composite of 0.5 and 2.0 m. Stn. VIII - composite of 0.5 and 2.0 m.
Sampling Frequency - Once a month
DENR Class C criterion for Chloride - 350 mg/L
B. Graphs
LAGUNA DE BAY
Chloride
0
50
100
150
200
250
300
350
400
450
500
2009 2010 2011 2012
Years
mg
/L
Stn. I (Central West Bay) Stn. II (East Bay)
Stn. IV (Central Bay) Stn. V (Northern West Bay)
Stn. VIII (South Bay) Stn. XV San Pedro (West Bay)
Stn. XVI Sta Rosa (West Bay) Stn. XVII Fish Sanctuary (Central Bay)
Stn. XVIII Pagsanjan (East Bay) DENR Class C Criterion
23
TRIBUTARY RIVERS Chloride, mg/L
A. Water Quality Data
Monitoring Stations Annual Averages Tributary Rivers Water Quality
Monitoring Stations Station No.
Locations 2009 2010 2011 2012
1 Marikina River 29 35 31 32 2 Bagumbayan River (Taguig) 104 148 117 96
3 Buli Creek (Taguig) 87 115 115 75
4 Mangangate River (Muntinlupa) -Downstream 71 116 117 70
4U Mangangate River (Muntinlupa) -Upstream * * * 58
5 Tunasan River (Muntinlupa) -Downstream 71 116 117 70
5U Tunasan River (Muntinlupa) -Upstream * * * 62
6 San Pedro River (T2) 53 76 71 56
7 Biñan River * * 69 77
8 Sta. Rosa River - Downstream * * 100 77 Notes:
8M Sta. Rosa River - Midstream * * * 76 8U Sta. Rosa River - Upstream * * * 36 Sampling Frequency - Once a month
9 Cabuyao River 47 56 76 56
10 San Cristobal River (T3) 99 118 122 83
DENR Class C criterion for Chloride -350 mg/L
11 San Juan River (T5) 39 60 69 57 12 Molawin Creek (Los Baños) * * 42 42 * No sampling done
13 Bay River (T9) 18 26 21 26
14 Pila River * * 15 22
15 Sta. Cruz River (T6) 12 19 16 18
16 Pagsanjan River (T8) 11 17 17 18
17 Pangil River - Downstream 16 14 12 19
17U Pangil River - Upstream * * * 18
18 Siniloan River 13 19 15 24
19 Sta. Maria River -
Downstream * * 15 19
19U Sta. Maria River - Upstream * * * 19
20 Jala-jala River * * * 20
21 Pililla River * * 20 21
22 Tanay River - Downstream 14 18 14 21
22U Tanay River - Upstream * * * 23
23 Baras River * * 34 22
24 Morong River - Downstream 25 36 28 34
24U Morong River - Upstream * * * 34
25 Manggahan Floodway
(Taytay) 34 39 33 35
26 Sapang Baho River (Cainta) 37 46 38 33
24
B. Graphs:
0
50
100
150
200
250
300
350
400
2009 2010 2011 2012
mg
/L
Year
TRIBUTARY RIVERSChloride
1 Marikina River 2 Bagumbayan River (Taguig) 3 Buli Creek (Taguig)
4 Mangangate River (Muntinlupa) -Downstream 4U Mangangate River (Muntinlupa) -Upstream 5 Tunasan River (Muntinlupa) -Downstream
5U Tunasan River (Muntinlupa) -Upstream 6 San Pedro River (T2) 7 Biñan River
8 Sta. Rosa River - Downstream 8M Sta. Rosa River - Midstream 8U Sta. Rosa River - Upstream
9 Cabuyao River 10 San Cristobal River (T3) 11 San Juan River (T5)
12 Molawin Creek (Los Baños) 13 Bay River (T9) 14 Pila River
15 Sta. Cruz River (T6) 16 Pagsanjan River (T8) 17 Pangil River - Downstream
17U Pangil River - Upstream 18 Siniloan River 19 Sta. Maria River - Downstream
19U Sta. Maria River - Upstream 20 Jala-jala River 21 Pililla River
22 Tanay River - Downstream 22U Tanay River - Upstream 23 Baras River
24 Morong River - Downstream 24U Morong River - Upstream 25 Manggahan Floodway (Taytay)
26 Sapang Baho River (Cainta) DENR Class C Criterion
25
CHLORIDE
Chloride, in the form of the Cl– ion, is one of the major inorganic anions, or negative ions, in saltwater and freshwater. It originates from the dissociation of salts, such as sodium chloride or calcium chloride, in water. These salts, and their resulting chloride ions, originate from natural minerals, saltwater intrusion and industrial pollution.
The possible sources of manmade salts that may contribute to elevated chloride concentrations are chlorinated drinking water and sodium-chloride water softeners which often increase chloride levels in wastewater.
In drinking water, the salty taste produced by chloride depends upon the concentration of the chloride ion. Water containing 250 mg/L of chloride may have a detectable salty taste if the chloride came from sodium chloride. The recommended maximum level of chloride in U.S. drinking water is 250 mg/L (http://www.vernier.com/experiments/ wqv/15/chloride_ and_salinity/).
In Laguna de Bay, the intrusion of seawater from Manila Bay via the Pasig River during seawater backflow whenever the lake level drops to elevation 10.5 meters, has been always responsible for the increase in the chloride concentration of the water.
Except in Stn. V (Northern West Bay) in 2010, all of the average chloride concentrations in the lake from 2009 to 2012 were within the DENR Class C criterion of 350 mg/L. Stn. V yielded the highest average chloride level in 2010 at 459 mg/L due to the very high chloride concentration recorded in June in this station at 3,534 mg/L, an indication that there was an intrusion of seawater into the lake from the Pasig River backflow. There were no seawater backflow noted in the lake in 2009, 2011 and 2012 as all of the measured monthly chloride concentrations in Stn. V never exceeded the 350 mg/L Class C criterion. All of the computed average chloride concentrations in the tributary rivers from 2009 to 2013 were within the Class C criterion for chloride.
Monitoring Stations Annual Averages Laguna de Bay Water Quality
Monitoring Stations 2009 2010 2011 2012
Stn. I (Central West Bay) 7.8 9.1 7.7 7.6 Stn. II (East Bay) 9.0 8.0 8.2 7.9
Stn. IV (Central Bay) 8.1 8.8 8.5 8.0
Stn. V (Northern West Bay) 8.0 8.6 7.4 7.5
Stn. VIII (South Bay) 8.4 8.0 8.1 8.1
Stn. XV San Pedro (West Bay) * * * 8.2
Stn. XVI Sta Rosa (West Bay) * * * 8.1
Stn. XVII Fish Sanctuary (Central Bay) * * * 7.9
Stn. XVIII Pagsanjan (East Bay) * * * 8.0
Notes: * No data - not yet included in the LLDA's Water Quality Monitoring Program Sampling Depth - Stn. I - composite of 0.5 and 2.0 m. Stn. XV - composite of 0.5 and 2.0 m. Stn. II - composite of 0.5 and 2.0 m. Stn. XVI - composite of 0.5 and 2.0 m. Stn. IV - 0.5 m. Stn. XVII - composite of 0.5 and 2.0 m. Stn. V - 0.5 m. Stn. XVIII - composite of 0.5 and 2.0 m. Stn. VIII - composite of 0.5 and 2.0 m.
Sampling Frequency - Once a month
DENR Class C criterion for DO - 5.0 mg/L
B. Graphs
0.0
1.0
2.0
3.0
4.0
5.0
6.0
7.0
8.0
9.0
10.0
2009 2010 2011 2012
mg
/L
Years
LAGUNA DE BAYDissolved Oxygen (DO)
Stn. I (Central West Bay) Stn. II (East Bay)
Stn. IV (Central Bay) Stn. V (Northern West Bay)
Stn. VIII (South Bay) Stn. XV San Pedro (West Bay)
Stn. XVI Sta Rosa (West Bay) Stn. XVII Fish Sanctuary (Central Bay)
Stn. XVIII Pagsanjan (East Bay) DENR Class C Criterion
27
TRIBUTARY RIVERS Dissolved Oxygen, mg/L
A. Water Quality Data
Monitoring Stations Annual Averages Tributary Rivers Water Quality
Monitoring Stations Station No.
Locations 2009 2010 2011 2012
1 Marikina River 2.9 2.1 1.9 1.9 2 Bagumbayan River (Taguig) 2.5 0.1 0.5 0.3
3 Buli Creek (Taguig) 1.7 0.1 0.1 0.2
4 Mangangate River
(Muntinlupa) -Downstream 1.8 0.1 0.2 1.3
4U Mangangate River
(Muntinlupa) -Upstream * * * 3.6
5 Tunasan River (Muntinlupa)
-Downstream 0.9 0.1 0.2 0.1
5U Tunasan River (Muntinlupa) -Upstream * * * 4.1
6 San Pedro River (T2) 2.7 0.2 1.3 1.2
7 Biñan River * * 0.6 0.6
8 Sta. Rosa River -
Downstream * * 1.1 2.2 Notes:
8M Sta. Rosa River - Midstream * * * 2.0 8U Sta. Rosa River - Upstream * * * 5.8 Sampling Frequency - Once a month
9 Cabuyao River 3.5 0.6 0.7 0.8
10 San Cristobal River (T3) 4.3 1.3 1.2 2.0
DENR Class C criterion for DO - 5.0 mg/L
11 San Juan River (T5) 4.5 3.6 2.8 3.0 12 Molawin Creek (Los Baños) * * 4.4 3.3 * No sampling done
13 Bay River (T9) 7.3 7.0 6.6 6.8
14 Pila River * * 5.1 4.8
15 Sta. Cruz River (T6) 6.7 7.0 6.5 6.5
16 Pagsanjan River (T8) 7.2 7.0 7.3 6.4
17 Pangil River - Downstream 8.2 7.1 7.3 7.3
17U Pangil River - Upstream * * * 7.4
18 Siniloan River 3.4 5.4 4.6 2.7
19 Sta. Maria River - Downstream * * 6.5 6.5
19U Sta. Maria River - Upstream * * * 8.4
20 Jala-jala River * * * 6.0
21 Pililla River * * 3.9 3.7
22 Tanay River - Downstream 5.9 5.1 5.5 6.5
22U Tanay River - Upstream * * * 7.8
23 Baras River * * 3.9 4.7
24 Morong River - Downstream 8.8 5.0 7.3 4.9
24U Morong River - Upstream * * * 6.4
25 Manggahan Floodway
(Taytay) 4.4 1.9 1.7 2.3
26 Sapang Baho River (Cainta) 2.3 1.0 0.8 1.8
28
B. Graphs:
TRIBUTARY RIVERS
Dissolved Oxygen
0.0
1.0
2.0
3.0
4.0
5.0
6.0
7.0
8.0
9.0
10.0
2009 2010 2011 2012Year
mg
/L
1 Marikina River 2 Bagumbayan River (Taguig)3 Buli Creek (Taguig) 4 Mangangate River (Muntinlupa) -Downstream4U Mangangate River (Muntinlupa) -Upstream 5 Tunasan River (Muntinlupa) -Downstream5U Tunasan River (Muntinlupa) -Upstream 6 San Pedro River (T2)7 Biñan River 8 Sta. Rosa River - Downstream8M Sta. Rosa River - Midstream 8U Sta. Rosa River - Upstream9 Cabuyao River 10 San Cristobal River (T3)11 San Juan River (T5) 12 Molawin Creek (Los Baños) 13 Bay River (T9) 14 Pila River15 Sta. Cruz River (T6) 16 Pagsanjan River (T8)17 Pangil River - Downstream 17U Pangil River - Upstream18 Siniloan River 19 Sta. Maria River - Downstream19U Sta. Maria River - Upstream 20 Jala-jala River21 Pililla River 22 Tanay River - Downstream22U Tanay River - Upstream 23 Baras River24 Morong River - Downstream 24U Morong River - Upstream25 Manggahan Floodway (Taytay) 26 Sapang Baho River (Cainta)DENR Class C Criterion
29
DISSOLVED OXYGEN
Aquatic organisms require oxygen in the free elemental state as a dissolved gas. The amount of dissolved oxygen (DO) in the water is fundamental to the survival of most aquatic organisms. Lack of significant levels of dissolved oxygen required by most aquatic organisms for respiration can cause impairment or death.
The two main sources of dissolved oxygen are diffusion of oxygen from the air and photosynthetic activity. Oxygen is soluble in water and the oxygen that is dissolved in water will equilibrate with the oxygen in atmosphere. Oxygen tends to be less soluble as temperature increases. Diffusion of oxygen from the air into water depends on the solubility of oxygen, and is influenced by many other factors like water movement, temperature, salinity, etc. Photosynthesis of aquatic plants will increase the DO during day light hours and the DO levels will fall during the nighttime hours (http://ces.iisc.ernet.in/energy/ monograph1/Methpage1.html).
In natural waters, man-made contamination, or natural organic material will be consumed by microorganisms. As this microbial activity increases due to high organic loadings, oxygen will be consumed out of the water by the organisms to facilitate their digestion process. Typically, DO levels of less than 2 mg/l will kill the fish (http://www.stevenswater.com/articles/waterparameters.aspx).
The lake‘s average annual DO levels in all monitored stations from 2009 to 2012 conformed to the DENR Class C criterion set at a minimum of 5 mg/L.
Only 11 of the 34 tributary river stations monitored in 2009 to 2012 had all of the computed average annual DO concentrations passed the Class C criterion and these are Bay River (Stn. 13), Sta. Cruz River (Stn. 15), Pagsanjan River (Stn. 16), Pangil River Downstream (Stn. 17), Pangil River Upstream (Stn. 17U), Sta. Maria River Downstream (Stn 19), Sta. Maria River Upstream (Stn 19U), Jala-jala River (Stn. 20), Tanay River-Downstream (Stn. 22), Tanay River-Upstream (Stn 22U) and Morong River-Upstream (Stn. 24U). Those tributary river stations whose annual mean concentrations for DO always failed the Class C criterion were Stns. 1 to 12, 21, 23, 25 and 26. For Stns. 14, 18 and 24, measured annual average DO concentrations occasionally passed the Class C criterion.
Monitoring Stations Annual Averages Laguna de Bay Water Quality
Monitoring Stations 2009 2010 2011 2012
Stn. I (Central West Bay) 0.084 0.108 0.102 0.112 Stn. II (East Bay) 0.084 0.085 0.035 0.128
Stn. IV (Central Bay) 0.089 0.088 0.045 0.110
Stn. V (Northern West Bay) 0.091 0.190 0.061 0.139
Stn. VIII (South Bay) 0.095 0.105 0.075 0.111
Stn. XV San Pedro (West Bay) * * * 0.110
Stn. XVI Sta Rosa (West Bay) * * * 0.101
Stn. XVII Fish Sanctuary (Central Bay) * * * 0.098
Stn. XVIII Pagsanjan (East Bay) * * * 0.055
Notes: * No data - not yet included in the LLDA's Water Quality Monitoring Program Sampling Depth - Stn. I - composite of 0.5 and 2.0 m. Stn. XV - composite of 0.5 and 2.0 m. Stn. II - composite of 0.5 and 2.0 m. Stn. XVI - composite of 0.5 and 2.0 m. Stn. IV - 0.5 m. Stn. XVII - composite of 0.5 and 2.0 m. Stn. V - 0.5 m. Stn. XVIII - composite of 0.5 and 2.0 m. Stn. VIII - composite of 0.5 and 2.0 m.
Sampling Frequency - Once a month
DENR Class C criterion for Inorganic Phosphate – 0.05 mg/L
B. Graphs
31
TRIBUTARY RIVERS Inorganic Phosphate, mg/L
A. Water Quality Data
Monitoring Stations Annual Averages Tributary Rivers Water Quality
Monitoring Stations Station No.
Locations 2009 2010 2011 2012
1 Marikina River 0.60 1.77 0.48 0.42 2 Bagumbayan River (Taguig) 2.25 8.32 1.48 1.37
3 Buli Creek (Taguig) 2.19 7.95 1.83 1.63
4 Mangangate River (Muntinlupa) -Downstream 1.55 6.36 1.35 0.77
4U Mangangate River (Muntinlupa) -Upstream * * * 0.78
5 Tunasan River (Muntinlupa)
-Downstream 4.56 17.43 2.35 2.15
5U Tunasan River (Muntinlupa)
-Upstream * * * 0.87
6 San Pedro River (T2) 2.91 8.56 1.93 1.55
7 Biñan River * * 0.96 1.19
8 Sta. Rosa River - Downstream * * 1.43 0.90 Notes:
8M Sta. Rosa River - Midstream * * * 0.74 8U Sta. Rosa River - Upstream * * * 0.57 Sampling Frequency - Once a month
9 Cabuyao River 1.56 3.78 1.02 1.05
10 San Cristobal River (T3) 0.82 1.58 0.46 0.50
DENR Class C criterion for Inorganic Phosphate – 0.4 mg/L
11 San Juan River (T5) 1.21 2.19 0.75 0.58 12 Molawin Creek (Los Baños) * * 0.36 0.29 * No sampling done
1 Marikina River 2 Bagumbayan River (Taguig)3 Buli Creek (Taguig) 4 Mangangate River (Muntinlupa) -Downstream4U Mangangate River (Muntinlupa) -Upstream 5 Tunasan River (Muntinlupa) -Downstream5U Tunasan River (Muntinlupa) -Upstream 6 San Pedro River (T2)7 Biñan River 8 Sta. Rosa River - Downstream8M Sta. Rosa River - Midstream 8U Sta. Rosa River - Upstream9 Cabuyao River 10 San Cristobal River (T3)11 San Juan River (T5) 12 Molawin Creek (Los Baños) 13 Bay River (T9) 14 Pila River
15 Sta. Cruz River (T6) 16 Pagsanjan River (T8)17 Pangil River - Downstream 17U Pangil River - Upstream18 Siniloan River 19 Sta. Maria River - Downstream19U Sta. Maria River - Upstream 20 Jala-jala River21 Pililla River 22 Tanay River - Downstream22U Tanay River - Upstream 23 Baras River24 Morong River - Downstream 24U Morong River - Upstream25 Manggahan Floodway (Taytay) 26 Sapang Baho River (Cainta)DENR Class C Criterion (0.05 mg/L)
33
INORGANIC PHOSPHATE
Phosphorus is an essential nutrient for aquatic life. It occurs naturally in the environment in small amounts. Phosphorus is often the "growth-limiting" factor for plants as high levels can lead to algal blooms and excessive nutrients in the water.
Phosphorus occurs in several forms—both inorganic and organic. Inorganic orthophosphate (PO4
3-) is the only form available to living organisms. However, the other forms of phosphate can be transformed into orthophosphate. For this reason, total phosphate is generally measured in addition to orthophosphate. The measure of total phosphate provides an estimate of the amount of phosphorus potentially available to plants and animals.
Common sources of phosphorus include agricultural runoff, animal waste and sewage that contain organic phosphorus as well as inorganic phosphorus in products such as detergents (http://www.cotf.edu/ete/modules/waterq3/WQassess3e.html). The DENR‘s Class C Water Quality Criterion for inorganic phosphate is at 0.05 mg/L for the lake and 0.4 mg/L for the tributary rivers. The results of the monitoring in the lake from 2009 to 2012 showed that except for Stn. II (East Bay) and Stn. IV (Central Bay) in 2011, all of the computed annual average inorganic phosphate concentrations failed the Class C criterion. Among the 34 tributary river stations monitored from 2009 to 2012, all of the annual average inorganic phosphate concentrations in Stns. 1, 2, 3, 4, 4U, 5, 5U, 6, 7, 8, 8M, 8U, 9, 10, 11, 24, 24U, 25 and 26 exceeded the Class C criterion of 0.4 mg/L. On the other hand, those river stations whose annual average inorganic phosphate concentrations all conformed with the Class C criterion were Stns. 12, 14, 16, 17, 17U, 19, 19U, 20, 21, 22U and 23.
Monitoring Stations Annual Averages Laguna de Bay Water Quality
Monitoring Stations 2009 2010 2011 2012
Stn. I (Central West Bay) 0.224 0.224 0.184 0.181 Stn. II (East Bay) 0.210 0.206 0.098 0.121
Stn. IV (Central Bay) 0.165 0.142 0.204 0.165
Stn. V (Northern West Bay) 0.407 0.320 0.174 0.159
Stn. VIII (South Bay) 0.292 0.181 0.107 0.147
Stn. XV San Pedro (West Bay) * * * 0.116
Stn. XVI Sta Rosa (West Bay) * * * 0.120
Stn. XVII Fish Sanctuary (Central Bay) * * * 0.117
Stn. XVIII Pagsanjan (East Bay) * * * 0.038
Notes: * No data - not yet included in the LLDA's Water Quality Monitoring Program Sampling Depth - Stn. I - composite of 0.5 and 2.0 m. Stn. XV - composite of 0.5 and 2.0 m. Stn. II - composite of 0.5 and 2.0 m. Stn. XVI - composite of 0.5 and 2.0 m. Stn. IV - 0.5 m. Stn. XVII - composite of 0.5 and 2.0 m. Stn. V - 0.5 m. Stn. XVIII - composite of 0.5 and 2.0 m. Stn. VIII - composite of 0.5 and 2.0 m.
Sampling Frequency - Once a month
DENR Class C criterion for Nitrate – 10 mg/L
B. Graphs
LAGUNA DE BAY
Nitrate
0.000
0.100
0.200
0.300
0.400
0.500
0.600
0.700
0.800
0.900
1.000
2009 2010 2011 2012
Years
mg
/L
Stn. I (Central West Bay) Stn. II (East Bay)Stn. IV (Central Bay) Stn. V (Northern West Bay)Stn. VIII (South Bay) Stn. XV San Pedro (West Bay)Stn. XVI Sta Rosa (West Bay) Stn. XVII Fish Sanctuary (Central Bay)Stn. XVIII Pagsanjan (East Bay)
DENR Class C criterion = 10 mg/L
35
TRIBUTARY RIVERS Nitrate, mg/L
A. Water Quality Data
Monitoring Stations Annual Averages Tributary Rivers Water Quality
Monitoring Stations Station No.
Locations 2009 2010 2011 2012
1 Marikina River 0.7 0.5 0.5 0.3 2 Bagumbayan River (Taguig) 0.3 0.2 0.1 0.1
3 Buli Creek (Taguig) 0.1 0.3 0.1 0.1
4 Mangangate River (Muntinlupa) -Downstream 0.1 0.2 0.1 0.1
4U Mangangate River (Muntinlupa) -Upstream * * * 0.3
5 Tunasan River (Muntinlupa) -Downstream 0.1 0.4 0.2 0.2
5U Tunasan River (Muntinlupa) -Upstream * * * 2.2
6 San Pedro River (T2) 0.4 0.2 0.4 0.7
7 Biñan River * * 0.3 0.3
8 Sta. Rosa River - Downstream * * 0.2 0.3 Notes:
8M Sta. Rosa River - Midstream * * * 0.6 8U Sta. Rosa River - Upstream * * * 1.5 Sampling Frequency - Once a month
9 Cabuyao River 0.4 0.3 0.1 0.1
10 San Cristobal River (T3) 0.8 0.1 0.2 0.2
DENR Class C criterion for Nitrate – 10 mg/L
11 San Juan River (T5) 5.3 6.8 3.6 5.9 12 Molawin Creek (Los Baños) * * 0.7 0.5 * No sampling done
13 Bay River (T9) 1.5 0.9 0.6 0.7
14 Pila River * * 0.4 0.4
15 Sta. Cruz River (T6) 0.9 0.6 0.6 0.9
16 Pagsanjan River (T8) 0.8 0.4 0.3 0.3
17 Pangil River - Downstream 0.2 0.4 0.1 0.1
17U Pangil River - Upstream * * * 0.1
18 Siniloan River 0.3 0.6 0.3 0.3
19 Sta. Maria River -
Downstream * * 0.3 0.3
19U Sta. Maria River - Upstream * * * 0.2
20 Jala-jala River * * * 0.5
21 Pililla River * * 0.6 0.5
22 Tanay River - Downstream 1.0 1.2 0.9 1.0
22U Tanay River - Upstream * * * 0.6
23 Baras River * * 0.9 0.7
24 Morong River - Downstream 3.1 1.8 1.4 1.9
24U Morong River - Upstream * * * 1.1
25 Manggahan Floodway
(Taytay) 0.6 0.4 0.4 0.2
26 Sapang Baho River (Cainta) 1.0 0.6 0.8 0.4
36
B. Graphs:
0.0
1.0
2.0
3.0
4.0
5.0
6.0
7.0
8.0
9.0
10.0
2009 2010 2011 2012
mg
/L
Year
TRIBUTARY RIVERSNitrate
1 Marikina River 2 Bagumbayan River (Taguig) 3 Buli Creek (Taguig)
4 Mangangate River (Muntinlupa) -Downstream 4U Mangangate River (Muntinlupa) -Upstream 5 Tunasan River (Muntinlupa) -Downstream
5U Tunasan River (Muntinlupa) -Upstream 6 San Pedro River (T2) 7 Biñan River
8 Sta. Rosa River - Downstream 8M Sta. Rosa River - Midstream 8U Sta. Rosa River - Upstream
9 Cabuyao River 10 San Cristobal River (T3) 11 San Juan River (T5)
12 Molawin Creek (Los Baños) 13 Bay River (T9) 14 Pila River
15 Sta. Cruz River (T6) 16 Pagsanjan River (T8) 17 Pangil River - Downstream
17U Pangil River - Upstream 18 Siniloan River 19 Sta. Maria River - Downstream
19U Sta. Maria River - Upstream 20 Jala-jala River 21 Pililla River
22 Tanay River - Downstream 22U Tanay River - Upstream 23 Baras River
24 Morong River - Downstream 24U Morong River - Upstream 25 Manggahan Floodway (Taytay)
26 Sapang Baho River (Cainta) DENR Class C Criterion
37
NITRATE
Nitrates are the most oxidized forms of nitrogen and the end product of the aerobic decomposition of organic nitrogenous matter. It commonly occurs in small amounts in surface waters. Nitrates are essential plant nutrients, but in excess amounts they can cause significant water quality problems. Together with phosphorus, excessive nitrate concentration can accelerate eutrophication, causing dramatic increases in aquatic plant growth and changes in the types of plants and animals that live in a water body. This, in turn, affects dissolved oxygen, temperature, and other indicators. Excess nitrates can cause hypoxia (low levels of dissolved oxygen) and can become toxic to warm-blooded animals at higher concentrations (10 mg/L) or higher) under certain conditions (http://water.epa.gov/type/rsl/monitoring/vms57.cfm).
Sources of nitrates include chemical fertilizers from cultivated lands, drainage from livestock feeds, as well as domestic and industrial discharges (http://ces.iisc.ernet. in/energy/monograph1/Methpage1.html).
The average annual nitrate concentrations in all monitored stations in the lake and in the tributary rivers from 2009 to 2012 were way below the 10 mg/L DENR water quality criterion for Class C. The annual mean nitrate levels in the lake ranged from 0.038 to 0.407 mg/L while in the tributary rivers ranged from 0.1 to 6.8 mg/L. Among the 34 tributary river stations, Stn. 11 (San Juan River) always had the highest annual mean nitrate concentration every year from 2009 to 2012.
38
LAGUNA DE BAY Oil and Grease, mg/L
A. Water Quality Data:
Monitoring Stations Annual Averages Laguna de Bay Water Quality
Monitoring Stations 2009 2010 2011 2012
Stn. I (Central West Bay) 1 1 2 1 Stn. II (East Bay) 1 2 2 1
Stn. IV (Central Bay) 1 1 1 2
Stn. V (Northern West Bay) 2 2 2 1
Stn. VIII (South Bay) 1 1 2 1
Stn. XV San Pedro (West Bay) * * * 1
Stn. XVI Sta Rosa (West Bay) * * * 2
Stn. XVII Fish Sanctuary (Central Bay) * * * 2
Stn. XVIII Pagsanjan (East Bay) * * * 1
Notes: * No data - not yet included in the LLDA's Water Quality Monitoring Program Sampling Depth - Stn. I - composite of 0.5 and 2.0 m. Stn. XV - composite of 0.5 and 2.0 m. Stn. II - composite of 0.5 and 2.0 m. Stn. XVI - composite of 0.5 and 2.0 m. Stn. IV - 0.5 m. Stn. XVII - composite of 0.5 and 2.0 m. Stn. V - 0.5 m. Stn. XVIII - composite of 0.5 and 2.0 m. Stn. VIII - composite of 0.5 and 2.0 m.
Sampling Frequency - Once a month
DENR Class C criterion for Oil and Grease – 2.0 mg/L
B. Graphs
LAGUNA DE BAY
Oil and Grease
0.0
0.2
0.4
0.6
0.8
1.0
1.2
1.4
1.6
1.8
2.0
2.2
2.4
2009 2010 2011 2012
Years
mg
/L
Stn. I (Central West Bay) Stn. II (East Bay)
Stn. IV (Central Bay) Stn. V (Northern West Bay)
Stn. VIII (South Bay) Stn. XV San Pedro (West Bay)
Stn. XVI Sta Rosa (West Bay) Stn. XVII Fish Sanctuary (Central Bay)
Stn. XVIII Pagsanjan (East Bay) DENR Class C Criterion
39
TRIBUTARY RIVERS Oil and Grease, mg/L
A. Water Quality Data
Monitoring Stations Annual Averages Tributary Rivers Water Quality
Monitoring Stations Station No.
Locations 2009 2010 2011 2012
1 Marikina River 1 3 2 1 2 Bagumbayan River (Taguig) 1 4 3 2
3 Buli Creek (Taguig) 3 4 4 2
4 Mangangate River (Muntinlupa) -Downstream 3 3 2 1
4U Mangangate River (Muntinlupa) -Upstream * * * 1
5 Tunasan River (Muntinlupa) -Downstream 10 5 7 4
5U Tunasan River (Muntinlupa) -Upstream * * * 1
6 San Pedro River (T2) 1 3 4 1
7 Biñan River * * 2 1
8 Sta. Rosa River - Downstream * * 2 1 Notes:
8M Sta. Rosa River - Midstream * * * 3 8U Sta. Rosa River - Upstream * * * 2 Sampling Frequency - Once a month
9 Cabuyao River 2 2 2 1
10 San Cristobal River (T3) 2 2 2 2
DENR Class C criterion for Oil and Grease – 2.0 mg/L
11 San Juan River (T5) 1 2 2 2 12 Molawin Creek (Los Baños) * * 2 1 * No sampling done
13 Bay River (T9) 1 1 1 1
14 Pila River * * 2 2
15 Sta. Cruz River (T6) 1 1 2 2
16 Pagsanjan River (T8) 1 1 2 2
17 Pangil River - Downstream 1 1 2 2
17U Pangil River - Upstream * * * 1
18 Siniloan River 1 1 2 1
19 Sta. Maria River -
Downstream * * 2 1
19U Sta. Maria River - Upstream * * * 1
20 Jala-jala River * * * 2
21 Pililla River * * 2 1
22 Tanay River - Downstream 1 2 2 1
22U Tanay River - Upstream * * * 1
23 Baras River * * 2 2
24 Morong River - Downstream 2 2 2 1
24U Morong River - Upstream * * * 1
25 Manggahan Floodway
(Taytay) 1 2 2 1
26 Sapang Baho River (Cainta) 1 2 3 1
40
B. Graphs:
0
1
2
3
4
5
6
7
8
9
10
11
2009 2010 2011 2012
mg
/L
Year
TRIBUTARY RIVERSOil and Grease
1 Marikina River 2 Bagumbayan River (Taguig) 3 Buli Creek (Taguig)
4 Mangangate River (Muntinlupa) -Downstream 4U Mangangate River (Muntinlupa) -Upstream 5 Tunasan River (Muntinlupa) -Downstream
5U Tunasan River (Muntinlupa) -Upstream 6 San Pedro River (T2) 7 Biñan River
8 Sta. Rosa River - Downstream 8M Sta. Rosa River - Midstream 8U Sta. Rosa River - Upstream
9 Cabuyao River 10 San Cristobal River (T3) 11 San Juan River (T5)
12 Molawin Creek (Los Baños) 13 Bay River (T9) 14 Pila River
15 Sta. Cruz River (T6) 16 Pagsanjan River (T8) 17 Pangil River - Downstream
17U Pangil River - Upstream 18 Siniloan River 19 Sta. Maria River - Downstream
19U Sta. Maria River - Upstream 20 Jala-jala River 21 Pililla River
22 Tanay River - Downstream 22U Tanay River - Upstream 23 Baras River
24 Morong River - Downstream 24U Morong River - Upstream 25 Manggahan Floodway (Taytay)
26 Sapang Baho River (Cainta) DENR Class C Criterion
41
OIL AND GREASE
Oil and grease (O&G) is a measure of a variety of substances including fuels, motor oil, lubricating oil, hydraulic oil, cooking oil, and animal-derived fats. The concentration of these substances is typically measured within a body of water. Lakes, river, storm water runoff, and wastewater are all monitored for oil and grease. Sources of oil and grease are mainly anthropogenic. Oil and greases should be contained and/or recycled typically to keep them from entering the environment. Toxicity varies among different types of oils and greases. Refined oils are generally more toxic than crude oils. Various hydrocarbons found in fuels can pose a wide range of human health problems, from affecting the liver, kidneys and blood to increasing the risk of cancer (http://www.stormwaterx.com/Resources/IndustrialPollutants/OilGrease. aspx).
In a body of water such as lakes and rivers, free oil and emulsions may act on the epithelial surfaces of fish gills and interfere with respiration. They may coat and destroy algae and other plankton, thereby removing a source of fish food, and when ingested by fish they may taint their flesh. Settleable oily substances may also coat the bottom, destroy benthic organisms, and interfere with spawning areas. Oil may be absorbed quickly by suspended matter, such as clay, and then due to wind and strong currents may be transported over wide areas and deposited on the bottom far from the source. Even when deposited on the bottom, oil continuously yields water soluble substances that are toxic to aquatic life. In addition, films of oil on the surface may interfere with reaeration and photosynthesis, thus, preventing the respiration of aquatic insects such as water boatman, backswimmers and some species of aquatic flies. Moreover, oil is detrimental to waterfowl by destroying the natural buoyancy and insulation of their feathers (U.S. Federal Water Pollution Control Administration, 1968).
From 2009 to 2012, all of the annual average oil and grease concentrations in the lake complied with the 2.0 mg/L DENR Class C criterion. The 2009 to 2012 annual average concentrations of oil and grease in the tributary rivers revealed that those stations that failed the Class C criterion were Stn. 1 (Marikina River) in 2010, Stn. 2 (Bagumbayan River) in 2010 and 2011, Stn. 3 (Buli Creek) from 2009 to 2011, Stn. 4 (Mangangate River-Downstream) in 2009 to 2010, Stn. 5 (Tunasan River – Downstream in 2009 to 2012, Stn. 6 (San Pedro River) in 2010 and 2011, Stn. 8M (Sta. Rosa Midstream) in 2012, and Stn. 26 (Sapang Baho River) in 2011.
Monitoring Stations Annual Averages Laguna de Bay Water Quality
Monitoring Stations 2009 2010 2011 2012
Stn. I (Central West Bay) 8.3 8.0 7.7 8.5 Stn. II (East Bay) 8.3 8.2 7.8 8.6
Stn. IV (Central Bay) 8.2 8.4 8.0 8.6
Stn. V (Northern West Bay) 8.3 8.2 7.8 8.4
Stn. VIII (South Bay) 8.3 8.1 7.9 8.3
Stn. XV San Pedro (West Bay) * * * 8.7
Stn. XVI Sta Rosa (West Bay) * * * 8.6
Stn. XVII Fish Sanctuary (Central Bay) * * * 8.7
Stn. XVIII Pagsanjan (East Bay) * * * 8.7
Notes: * No data - not yet included in the LLDA's Water Quality Monitoring Program Sampling Depth - Stn. I - composite of 0.5 and 2.0 m. Stn. XV - composite of 0.5 and 2.0 m. Stn. II - composite of 0.5 and 2.0 m. Stn. XVI - composite of 0.5 and 2.0 m. Stn. IV - 0.5 m. Stn. XVII - composite of 0.5 and 2.0 m. Stn. V - 0.5 m. Stn. XVIII - composite of 0.5 and 2.0 m. Stn. VIII - composite of 0.5 and 2.0 m.
Sampling Frequency - Once a month
DENR Class C criterion for pH – 6.5 to 8.5
B. Graphs
43
TRIBUTARY RIVERS pH, units
A. Water Quality Data
Monitoring Stations Annual Averages Tributary Rivers Water Quality
Monitoring Stations Station No.
Locations 2009 2010 2011 2012
1 Marikina River 7.3 7.1 7.1 7.5 2 Bagumbayan River (Taguig) 7.5 7.3 7.1 7.5
3 Buli Creek (Taguig) 7.5 7.5 7.2 7.4
4 Mangangate River (Muntinlupa) -Downstream 7.5 7.4 7.3 7.4
4U Mangangate River (Muntinlupa) -Upstream * * * 7.7
5 Tunasan River (Muntinlupa) -Downstream 7.2 7.2 7.0 7.3
5U Tunasan River (Muntinlupa) -Upstream * * * 7.9
6 San Pedro River (T2) 7.5 7.5 7.4 7.7
7 Biñan River * * 7.3 7.7
8 Sta. Rosa River - Downstream * * 7.4 7.6 Notes:
8M Sta. Rosa River - Midstream * * * 7.7 8U Sta. Rosa River - Upstream * * * 7.9 Sampling Frequency - Once a month
9 Cabuyao River 7.5 7.4 7.3 7.6
10 San Cristobal River (T3) 7.4 7.0 7.0 7.4 DENR Class C criterion for pH – 6.5 to 8.5
11 San Juan River (T5) 7.2 7.1 7.0 7.4 12 Molawin Creek (Los Baños) * * 7.2 7.5 * No sampling done
13 Bay River (T9) 7.9 7.7 7.7 8.1
14 Pila River * * 7.2 7.5
15 Sta. Cruz River (T6) 7.5 7.4 7.3 7.6
16 Pagsanjan River (T8) 7.3 7.4 7.1 7.4
17 Pangil River - Downstream 7.4 7.3 6.9 7.6
17U Pangil River - Upstream * * * 7.4
18 Siniloan River 6.8 7.0 6.8 7.1
19 Sta. Maria River - Downstream * * 7.1 7.8
19U Sta. Maria River - Upstream * * * 8.5
20 Jala-jala River * * * 7.5
21 Pililla River * * 7.0 7.5
22 Tanay River - Downstream 7.6 7.5 7.6 8.1
22U Tanay River - Upstream * * * 8.6
23 Baras River * * 6.9 7.4
24 Morong River - Downstream 7.9 7.5 7.7 8.1
24U Morong River - Upstream * * * 8.0
25 Manggahan Floodway (Taytay) 7.4 7.3 7.2 7.5
26 Sapang Baho River (Cainta) 7.3 7.0 7.1 7.4
44
B. Graphs:
TRIBUTARY RIVERS
pH
0.0
1.0
2.0
3.0
4.0
5.0
6.0
7.0
8.0
9.0
10.0
2009 2010 2011 2012
Year
mg
/L
1 Marikina River 2 Bagumbayan River (Taguig)3 Buli Creek (Taguig) 4 Mangangate River (Muntinlupa) -Downstream4U Mangangate River (Muntinlupa) -Upstream 5 Tunasan River (Muntinlupa) -Downstream5U Tunasan River (Muntinlupa) -Upstream 6 San Pedro River (T2)7 Biñan River 8 Sta. Rosa River - Downstream8M Sta. Rosa River - Midstream 8U Sta. Rosa River - Upstream9 Cabuyao River 10 San Cristobal River (T3)11 San Juan River (T5) 12 Molawin Creek (Los Baños) 13 Bay River (T9) 14 Pila River15 Sta. Cruz River (T6) 16 Pagsanjan River (T8)17 Pangil River - Downstream 17U Pangil River - Upstream18 Siniloan River 19 Sta. Maria River - Downstream19U Sta. Maria River - Upstream 20 Jala-jala River21 Pililla River 22 Tanay River - Downstream22U Tanay River - Upstream 23 Baras River24 Morong River - Downstream 24U Morong River - Upstream25 Manggahan Floodway (Taytay) 26 Sapang Baho River (Cainta)DENR Class C Criterion (minimum) DENR Class C Criterion (maximum)
45
pH
pH, as a measure of the hydrogen ion concentration, indicates whether the water is acidic or basic. The pH scale ranges from 0 to 14, with pH 7 being the neutral point. Thus, a water of pH 7 is neither acidic nor basic, while a water with pH below 7 is acidic and one with a pH above 7 is basic. pH is typically monitored for assessments of aquatic ecosystem, health, recreational waters, irrigation sources and discharges, livestock, drinking water sources, industrial discharges, intakes, and storm water runoff. (http:/www.stevenswater.com/articles/ waterparameters.aspx).
The effect of pH on the chemical and biological properties of liquids makes its determination very important. In natural waters, pH is governed by the equilibrium between carbon dioxide/bicarbonate/carbonate ions. It tends to increase during day largely due to the photosynthetic activity (consumption of carbon dioxide) and decreases during night due to respiratory activity. Wastewater and polluted natural waters may have pH values lower or higher than 7 depending on the nature of the pollutant. Low pH affects physiological and biological functions of aquatic life through the reduction of enzyme activity and effectiveness. Low pH results when atmospheric oxygen and water comes in contact with sulfides such as pyrite, which reacts and forms acid (http://ces.iisc.ernet.in/energy/monograph1/Methpage1.html).
The evaluation of the average annual pH levels in the lake from 2009 to 2012 showed that it was only in 2012 that the DENR Class C criterion of 6.5 to 8.5 was not met particularly in Stns. II (East Bay), IV (Central Bay) and XVI (West Bay-Sta Rosa) with pH 8.6; and in Stns. XV (West Bay- San Pedro), XVII (Central Bay-Fish Sanctuary) and XVIII (East Bay-Pagsanjan) with pH 8.7.
In the tributary rivers, only Stn. 22U (Tanay River Upstream) had annual average pH concentration that failed the DENR Class C criterion at 8.6 in 2012.
Monitoring Stations Annual Averages Laguna de Bay Water Quality
Monitoring Stations 2009 2010 2011 2012
Stn. I (Central West Bay) 27 29 28 29 Stn. II (East Bay) 27 29 28 29
Stn. IV (Central Bay) 27 29 29 28
Stn. V (Northern West Bay) 27 29 29 28
Stn. VIII (South Bay) 27 29 28 29
Stn. XV San Pedro (West Bay) * * * 29
Stn. XVI Sta Rosa (West Bay) * * * 29
Stn. XVII Fish Sanctuary (Central Bay) * * * 29
Stn. XVIII Pagsanjan (East Bay) * * * 29
Notes: * No data – not yet included in the LLDA‘s Water Quality Monitoring Program Sampling Depth - Stn. I – composite of 0.5 and 2.0 m. Stn. XV – composite of 0.5 and 2.0 m. Stn. II – composite of 0.5 and 2.0 m. Stn. XVI – composite of 0.5 and 2.0 m. Stn. IV – 0.5 m. Stn. XVII – composite of 0.5 and 2.0 m. Stn. V – 0.5 m. Stn. XVIII – composite of 0.5 and 2.0 m. Stn. VIII – composite of 0.5 and 2.0 m.
Sampling Frequency – Once a month
DENR Class C criterion for Temperature – none (annual average)
B. Graphs
0
2
4
6
8
10
12
14
16
18
20
22
24
26
28
30
2009 2010 2011 2012
oC
Years
LAGUNA DE BAY
Temperature
Stn. I (Central West Bay) Stn. II (East Bay)
Stn. IV (Central Bay) Stn. V (Northern West Bay)
Stn. VIII (South Bay) Stn. XV San Pedro (West Bay)
Stn. XVI Sta Rosa (West Bay) Stn. XVII Fish Sanctuary (Central Bay)
Stn. XVIII Pagsanjan (East Bay)
47
TRIBUTARY RIVERS Temperature, oC
A. Water Quality Data
Monitoring Stations Annual Averages Tributary Rivers Water Quality
Monitoring Stations Station No.
Locations 2009 2010 2011 2012
1 Marikina River 27 28 27 28 2 Bagumbayan River (Taguig) 28 28 28 29
3 Buli Creek (Taguig) 28 29 28 30
4 Mangangate River (Muntinlupa) -Downstream 28 29 29 29
4U Mangangate River (Muntinlupa) -Upstream * * * 28
5 Tunasan River (Muntinlupa)
-Downstream 32 33 32 31
5U Tunasan River (Muntinlupa)
-Upstream * * * 28
6 San Pedro River (T2) 28 29 28 29
7 Biñan River * * 29 28
8 Sta. Rosa River - Downstream * * 30 29 Notes:
8M Sta. Rosa River - Midstream * * * 29 8U Sta. Rosa River - Upstream * * * 29 Sampling Frequency - Once a month
9 Cabuyao River 27 29 29 30
10 San Cristobal River (T3) 28 28 27 27 DENR Class C criterion for
Temperature - none (annual average)
11 San Juan River (T5) 28 27 26 27 12 Molawin Creek (Los Baños) * * 28 29 * No sampling done
13 Bay River (T9) 28 28 27 29
14 Pila River * * 27 29
15 Sta. Cruz River (T6) 27 29 27 29
16 Pagsanjan River (T8) 27 28 27 29
17 Pangil River - Downstream 30 28 26 27
17U Pangil River - Upstream * * * 28
18 Siniloan River 28 29 32 26
19 Sta. Maria River -
Downstream * * 28 27
19U Sta. Maria River - Upstream * * * 27
20 Jala-jala River * * * 27
21 Pililla River * * 27 28
22 Tanay River - Downstream 29 28 26 30
22U Tanay River - Upstream * * * 29
23 Baras River * * 27 29
24 Morong River - Downstream 29 29 28 30
24U Morong River - Upstream * * * 29
25 Manggahan Floodway (Taytay) 28 28 26 28
26 Sapang Baho River (Cainta) 28 28 28 28
48
B. Graphs:
TRIBUTARY RIVERS
Temperature
0
5
10
15
20
25
30
35
2009 2010 2011 2012
Year
mg
/L
1 Marikina River 2 Bagumbayan River (Taguig) 3 Buli Creek (Taguig)
4 Mangangate River (Muntinlupa) -Downstream 4U Mangangate River (Muntinlupa) -Upstream 5 Tunasan River (Muntinlupa) -Downstream
5U Tunasan River (Muntinlupa) -Upstream 6 San Pedro River (T2) 7 Biñan River
8 Sta. Rosa River - Downstream 8M Sta. Rosa River - Midstream 8U Sta. Rosa River - Upstream
9 Cabuyao River 10 San Cristobal River (T3) 11 San Juan River (T5)
12 Molawin Creek (Los Baños) 13 Bay River (T9) 14 Pila River
15 Sta. Cruz River (T6) 16 Pagsanjan River (T8) 17 Pangil River - Downstream
17U Pangil River - Upstream 18 Siniloan River 19 Sta. Maria River - Downstream
19U Sta. Maria River - Upstream 20 Jala-jala River 21 Pililla River
22 Tanay River - Downstream 22U Tanay River - Upstream 23 Baras River
24 Morong River - Downstream 24U Morong River - Upstream 25 Manggahan Floodway (Taytay)
26 Sapang Baho River (Cainta)
49
TEMPERATURE
Temperature is a measure of the warmness or coldness of the water body. It is an important parameter in water quality assessment because many aquatic organisms are sensitive to changes in water temperature. Water bodies will naturally show changes in temperature seasonally and daily. However, man made changes to water temperature will affect fish‘s ability to reproduce. Many lake and rivers will exhibit vertical temperature gradients as the sun will warm the upper water while deeper water will remain cooler (http://www.stevenswater.com/articles/waterparameters.aspx).
Solar radiation and atmospheric temperature brings about spatial and temporal changes in temperature, setting up convection currents and thermal stratification. As changes in temperature will have an effect on other water quality parameters such as alkalinity, salinity, dissolved oxygen, electrical conductivity, etc., the chemical and biological reactions are likewise affected such as solubility of oxygen, carbon-dioxide-carbonate-bicarbonate equilibrium, increase in metabolic rate and physiological reactions of organisms, etc. (http://ces.iisc.ernet.in/energy/monograph1/Methpage1.html)
In DAO 34, the Class C criterion for temperature is that the maximum rise should not be more than 3oC. Note that this criterions is not applied for the annual means.
The annual average temperature levels in the lake from 2009 to 2012 ranged from 27 oC to 29 oC. Apparently, the temperature of the lake was relatively colder in 2009 than in 2010 to 2012. For tributary rivers, the annual average temperature was highest at 33 oC in Stn 5 (Tunasan River Downstream) in 2010 while the lowest at 26 oC was in Stn. 22 (Tanay River Downstream) in 2011. Throughout the 4-year monitoring period from 2009 to 2012, it appeared that Stn. 5 (Tunasan River Downstream) consistently registered the highest average annual temperature every year.
Monitoring Stations Annual Averages Laguna de Bay Water Quality
Monitoring Stations 2009 2010 2011 2012
Stn. I (Central West Bay) 212 613 364 212 Stn. II (East Bay) 185 412 307 170
Stn. IV (Central Bay) 223 698 381 202
Stn. V (Northern West Bay) 208 421 348 204
Stn. VIII (South Bay) 195 395 315 221
Stn. XV San Pedro (West Bay) * * * 196
Stn. XVI Sta Rosa (West Bay) * * * 222
Stn. XVII Fish Sanctuary (Central Bay) * * * 347
Stn. XVIII Pagsanjan (East Bay) * * * 238
Notes: * No data - not yet included in the LLDA's Water Quality Monitoring Program Sampling Depth - Stn. I - composite of 0.5 and 2.0 m. Stn. XV - composite of 0.5 and 2.0 m. Stn. II - composite of 0.5 and 2.0 m. Stn. XVI - composite of 0.5 and 2.0 m. Stn. IV - 0.5 m. Stn. XVII - composite of 0.5 and 2.0 m. Stn. V - 0.5 m. Stn. XVIII - composite of 0.5 and 2.0 m. Stn. VIII - composite of 0.5 and 2.0 m.
Sampling Frequency - Once a month
DENR Class C criterion for Total Dissolved Solids - none
B. Graphs
LAGUNA DE BAY
Total Dissolved Solids (TDS)
050
100150200
250300350
400450500
550600650
700750
2009 2010 2011 2012
Years
mg
/L
Stn. I (Central West Bay) Stn. II (East Bay)
Stn. IV (Central Bay) Stn. V (Northern West Bay)
Stn. VIII (South Bay) Stn. XV San Pedro (West Bay)
Stn. XVI Sta Rosa (West Bay) Stn. XVII Fish Sanctuary (Central Bay)
Stn. XVIII Pagsanjan (East Bay)
51
TRIBUTARY RIVERS Total Dissolved Solids, mg/L
A. Water Quality Data
Monitoring Stations Annual Averages Tributary Rivers Water Quality
Monitoring Stations Station No.
Locations 2009 2010 2011 2012
1 Marikina River 483 182 323 315 2 Bagumbayan River (Taguig) 687 680 526 415
3 Buli Creek (Taguig) 615 664 602 458
4 Mangangate River (Muntinlupa) -Downstream 504 577 491 343
4U Mangangate River (Muntinlupa) -Upstream * * * 329
5 Tunasan River (Muntinlupa) -Downstream 731 619 622 520
5U Tunasan River (Muntinlupa) -Upstream * * * 421
6 San Pedro River (T2) 491 612 617 573
7 Biñan River * * 465 586
8 Sta. Rosa River - Downstream * * 640 548 Notes:
8M Sta. Rosa River - Midstream * * * 541 8U Sta. Rosa River - Upstream * * * 314 Sampling Frequency - Once a month
9 Cabuyao River 487 457 542 501
10 San Cristobal River (T3) 1093 690 2324 551
DENR Class C criterion for Total Dissolved Solids - none
11 San Juan River (T5) 422 499 562 510 12 Molawin Creek (Los Baños) * * 327 355 * No sampling done
13 Bay River (T9) 344 285 344 377
14 Pila River * * 205 257
15 Sta. Cruz River (T6) 178 209 196 215
16 Pagsanjan River (T8) 102 166 104 129
17 Pangil River - Downstream 97 84 99 141
17U Pangil River - Upstream * * * 121
18 Siniloan River 98 78 103 139
19 Sta. Maria River -
Downstream * * 155 223
19U Sta. Maria River - Upstream * * * 135
20 Jala-jala River * * * 483
21 Pililla River * * 244 232
22 Tanay River - Downstream 264 248 261 271
22U Tanay River - Upstream * * * 246
23 Baras River * * 247 208
24 Morong River - Downstream 400 304 395 420
24U Morong River - Upstream * * * 421
25 Manggahan Floodway
(Taytay) 266 215 246 286
26 Sapang Baho River (Cainta) 306 232 289 280
52
B. Graphs:
0
500
1000
1500
2000
2500
2009 2010 2011 2012
mg
/L
Year
TRIBUTARY RIVERSTotal Dissolved Solids
1 Marikina River 2 Bagumbayan River (Taguig) 3 Buli Creek (Taguig)
4 Mangangate River (Muntinlupa) -Downstream 4U Mangangate River (Muntinlupa) -Upstream 5 Tunasan River (Muntinlupa) -Downstream
5U Tunasan River (Muntinlupa) -Upstream 6 San Pedro River (T2) 7 Biñan River
8 Sta. Rosa River - Downstream 8M Sta. Rosa River - Midstream 8U Sta. Rosa River - Upstream
9 Cabuyao River 10 San Cristobal River (T3) 11 San Juan River (T5)
12 Molawin Creek (Los Baños) 13 Bay River (T9) 14 Pila River
15 Sta. Cruz River (T6) 16 Pagsanjan River (T8) 17 Pangil River - Downstream
17U Pangil River - Upstream 18 Siniloan River 19 Sta. Maria River - Downstream
19U Sta. Maria River - Upstream 20 Jala-jala River 21 Pililla River
22 Tanay River - Downstream 22U Tanay River - Upstream 23 Baras River
24 Morong River - Downstream 24U Morong River - Upstream 25 Manggahan Floodway (Taytay)
26 Sapang Baho River (Cainta)
53
TOTAL DISSOLVED SOLIDS
Total dissolved solids (TDS) is a measure of the amount of dissolved materials in the water which consist of inorganic salts and dissolved materials. In natural waters, salts are chemical compounds comprised of anions such as carbonates, chlorides, sulfates, and nitrates and cations such as potassium (K), sodium (Na), calcium (Ca), and magnesium (Mg). The concentration of TDS in the water is expressed in milligrams per liter (mg/L). In many instances resource agencies use the terms TDS and salinity interchangeably, since these ions are typically in the form of salts. Measuring total dissolved solids is a way to estimate the suitability of water for irrigation and drinking. This is an important parameter for drinking water because high TDS values may result in a ‗salty‘ taste to the water (http://cals.arizona.edu/watershedsteward/resources/docs/ guide29WaterQuality.pdf). DENR has no set Class C criterion for TDS but for Class A (for public water supply requiring complete treatment), the maximum permissible level is at 1000 mg/L. In the lake, the computed annual average TDS levels from 2009 to 2012 ranged from 170 to 698 mg/L wherein the lowest was recorded in Stn. II (East Bay) in 2012 and the highest was in Stn. IV (Central Bay) in 2010. In the tributary rivers, the annual average TDS levels in all of the stations from 2009 to 2012 were below 1,000 mg/L except those obtained in Stn. 10 (San Cristobal River) in 2009 and 2011 at 1,093 and 2,324 mg/L, respectively.
Monitoring Stations Annual Averages Laguna de Bay Water Quality
Monitoring Stations 2009 2010 2011 2012
Stn. I (Central West Bay) 97 188 106 139 Stn. II (East Bay) 82 140 97 117
Stn. IV (Central Bay) 91 158 111 126
Stn. V (Northern West Bay) 92 193 106 114
Stn. VIII (South Bay) 89 113 103 133
Stn. XV San Pedro (West Bay) * * * 117
Stn. XVI Sta Rosa (West Bay) * * * 133
Stn. XVII Fish Sanctuary (Central Bay) * * * 119
Stn. XVIII Pagsanjan (East Bay) * * * 110
Notes: * No data - not yet included in the LLDA's Water Quality Monitoring Program Sampling Depth - Stn. I - composite of 0.5 and 2.0 m. Stn. XV - composite of 0.5 and 2.0 m. Stn. II - composite of 0.5 and 2.0 m. Stn. XVI - composite of 0.5 and 2.0 m. Stn. IV - 0.5 m. Stn. XVII - composite of 0.5 and 2.0 m. Stn. V - 0.5 m. Stn. XVIII - composite of 0.5 and 2.0 m. Stn. VIII - composite of 0.5 and 2.0 m.
Sampling Frequency - Once a month
DENR Class C criterion for Total Hardness – none
B. Graphs
LAGUNA DE BAY
Total Hardness (TH)
0
20
40
60
80
100
120
140
160
180
200
2009 2010 2011 2012
Years
mg
CaC
O3/L
Stn. I (Central West Bay) Stn. II (East Bay)
Stn. IV (Central Bay) Stn. V (Northern West Bay)
Stn. VIII (South Bay) Stn. XV San Pedro (West Bay)
Stn. XVI Sta Rosa (West Bay) Stn. XVII Fish Sanctuary (Central Bay)
Stn. XVIII Pagsanjan (East Bay)
55
TRIBUTARY RIVERS Total Hardness, mg CaCO3/L
A. Water Quality Data
Monitoring Stations Annual Averages Tributary Rivers Water Quality
Monitoring Stations Station No.
Locations 2009 2010 2011 2012
1 Marikina River 143 157 138 209 2 Bagumbayan River (Taguig) 201 220 179 211
3 Buli Creek (Taguig) 167 167 157 190
4 Mangangate River (Muntinlupa) –Downstream 169 182 146 155
4U Mangangate River (Muntinlupa) –Upstream * * * 174
5 Tunasan River (Muntinlupa) –Downstream 181 201 175 212
5U Tunasan River (Muntinlupa) –Upstream * * * 193
6 San Pedro River (T2) 174 209 213 215
7 Biñan River * * 175 235
8 Sta. Rosa River – Downstream * * 220 227 Notes:
8M Sta. Rosa River – Midstream * * * 190
8U Sta. Rosa River – Upstream * * * 182 Sampling Frequency – Once a month
9 Cabuyao River 187 196 195 221
10 San Cristobal River (T3) 163 174 168 230
DENR Class C criterion for Total Hardness – none
11 San Juan River (T5) 180 177 176 202 12 Molawin Creek (Los Baños) * * 142 205 * No sampling done
13 Bay River (T9) 182 177 184 213
14 Pila River * * 105 149
15 Sta. Cruz River (T6) 87 101 95 158
16 Pagsanjan River (T8) 58 73 42 102
17 Pangil River – Downstream 55 67 47 85
17U Pangil River – Upstream * * * 95
18 Siniloan River 53 71 45 104
19 Sta. Maria River –
Downstream * * 79 120
19U Sta. Maria River – Upstream * * * 100
20 Jala-jala River * * * 211
21 Pililla River * * 107 167
22 Tanay River – Downstream 205 198 189 213
22U Tanay River – Upstream * * * 194
23 Baras River * * 247 208
24 Morong River – Downstream 220 205 201 236
24U Morong River – Upstream * * * 232
25 Manggahan Floodway (Taytay) 143 149 131 169
26 Sapang Baho River (Cainta) 153 173 137 175
56
B. Graphs:
0
50
100
150
200
250
300
2009 2010 2011 2012
mg
CaC
O3/L
Year
TRIBUTARY RIVERSTotal Hardness
1 Marikina River 2 Bagumbayan River (Taguig) 3 Buli Creek (Taguig)
4 Mangangate River (Muntinlupa) -Downstream 4U Mangangate River (Muntinlupa) -Upstream 5 Tunasan River (Muntinlupa) -Downstream
5U Tunasan River (Muntinlupa) -Upstream 6 San Pedro River (T2) 7 Biñan River
8 Sta. Rosa River - Downstream 8M Sta. Rosa River - Midstream 8U Sta. Rosa River - Upstream
9 Cabuyao River 10 San Cristobal River (T3) 11 San Juan River (T5)
12 Molawin Creek (Los Baños) 13 Bay River (T9) 14 Pila River
15 Sta. Cruz River (T6) 16 Pagsanjan River (T8) 17 Pangil River - Downstream
17U Pangil River - Upstream 18 Siniloan River 19 Sta. Maria River - Downstream
19U Sta. Maria River - Upstream 20 Jala-jala River 21 Pililla River
22 Tanay River - Downstream 22U Tanay River - Upstream 23 Baras River
24 Morong River - Downstream 24U Morong River - Upstream 25 Manggahan Floodway (Taytay)
26 Sapang Baho River (Cainta)
57
TOTAL HARDNESS
Hardness is predominantly caused by divalent cations such as calcium, magnesium, alkaline earth metal such as iron, manganese, strontium, etc. The total hardness is defined as the sum of calcium and magnesium concentrations, both expressed as CaCO3 in mg/L. Carbonates and bicarbonates of calcium and magnesium cause temporary hardness. Sulphates and chlorides cause permanent hardness.
Hardness of water prevents lather formation with soap rendering the water unsuitable for bathing and washing. It forms scales in boilers, making it unsuitable for industrial usage (http://ces.iisc.ernet.in/energy/monograph1/Methpage1.html).
DAO 34 has no Class C criterion for Total Hardness. Among the stations monitored in the lake from 2009 to 2012, Stn. V (Northern West Bay) in 2010 yielded the highest annual average total harness concentration at 193 mg CaCO3/L, whereas the lowest was in Stn. II (East Bay) in 2009 at 82 mg CaCO3/L.
In the tributary rivers, the highest and lowest among the recorded annual average total hardness levels were both recorded in 2011 at 247 mg CaCO3/L in Stn 23 (Baras River) and at 42 mg CaCO3/L in Stn. 16 (Pagsanjan River), respectively.
Monitoring Stations Annual Averages Laguna de Bay Water Quality
Monitoring Stations 2009 2010 2011 2012
Stn. I (Central West Bay) 32 32 34 54 Stn. II (East Bay) 40 39 40 33
Stn. IV (Central Bay) 52 14 24 41
Stn. V (Northern West Bay) 48 32 37 46
Stn. VIII (South Bay) 58 57 74 38
Stn. XV San Pedro (West Bay) * * * 39
Stn. XVI Sta Rosa (West Bay) * * * 49
Stn. XVII Fish Sanctuary (Central Bay) * * * 37
Stn. XVIII Pagsanjan (East Bay) * * * 67
Notes: * No data - not yet included in the LLDA's Water Quality Monitoring Program Sampling Depth - Stn. I - composite of 0.5 and 2.0 m. Stn. XV - composite of 0.5 and 2.0 m. Stn. II - composite of 0.5 and 2.0 m. Stn. XVI - composite of 0.5 and 2.0 m. Stn. IV - 0.5 m. Stn. XVII - composite of 0.5 and 2.0 m. Stn. V - 0.5 m. Stn. XVIII - composite of 0.5 and 2.0 m. Stn. VIII - composite of 0.5 and 2.0 m.
Sampling Frequency - Once a month
DENR Class C criterion for Total Suspended Solids – none (annual average)
B. Graphs
LAGUNA DE BAY
Total Suspended Solids (TSS)
05
1015
2025
3035
4045
5055
6065
7075
2009 2010 2011 2012
Years
mg
/L
Stn. I (Central West Bay) Stn. II (East Bay)
Stn. IV (Central Bay) Stn. V (Northern West Bay)
Stn. VIII (South Bay) Stn. XV San Pedro (West Bay)
Stn. XVI Sta Rosa (West Bay) Stn. XVII Fish Sanctuary (Central Bay)
Stn. XVIII Pagsanjan (East Bay)
59
TRIBUTARY RIVERS Total Suspended Solids, mg/L
A. Water Quality Data
Monitoring Stations Annual Averages Tributary Rivers Water Quality
Monitoring Stations Station No.
Locations 2009 2010 2011 2012
1 Marikina River 41 57 106 92 2 Bagumbayan River (Taguig) 36 514 40 25
3 Buli Creek (Taguig) 63 107 62 34
4 Mangangate River (Muntinlupa) -Downstream 22 42 27 25
4U Mangangate River (Muntinlupa) -Upstream * * * 30
5 Tunasan River (Muntinlupa)
-Downstream 260 58 77 63
5U Tunasan River (Muntinlupa)
-Upstream * * * 28
6 San Pedro River (T2) 38 34 186 40
7 Biñan River * * 21 165
8 Sta. Rosa River - Downstream * * 33 36 Notes:
8M Sta. Rosa River - Midstream * * * 67 8U Sta. Rosa River - Upstream * * * 19 Sampling Frequency - Once a month
9 Cabuyao River 39 14 20 24
10 San Cristobal River (T3) 126 53 57 45
DENR Class C criterion for TSS – none (annual average)
11 San Juan River (T5) 101 8 24 36 12 Molawin Creek (Los Baños) * * 26 33 * No sampling done
13 Bay River (T9) 48 53 49 36
14 Pila River * * 52 53
15 Sta. Cruz River (T6) 10 10 14 14
16 Pagsanjan River (T8) 15 12 15 13
17 Pangil River - Downstream 10 17 11 13
17U Pangil River - Upstream * * * 12
18 Siniloan River 28 49 28 22
19 Sta. Maria River - Downstream * * 33 39
19U Sta. Maria River - Upstream * * * 28
20 Jala-jala River * * * 14
21 Pililla River * * 15 16
22 Tanay River - Downstream 21 42 20 18
22U Tanay River - Upstream * * * 18
23 Baras River * * 27 30
24 Morong River - Downstream 22 35 136 32
24U Morong River - Upstream * * * 58
25 Manggahan Floodway (Taytay) 31 30 209 55
26 Sapang Baho River (Cainta) 23 16 47 30
60
B. Graphs:
TRIBUTARY RIVERS
Total Suspended Solids
0
100
200
300
400
500
600
2009 2010 2011 2012
Year
mg
/L
1 Marikina River 2 Bagumbayan River (Taguig) 3 Buli Creek (Taguig)
4 Mangangate River (Muntinlupa) -Downstream 4U Mangangate River (Muntinlupa) -Upstream 5 Tunasan River (Muntinlupa) -Downstream
5U Tunasan River (Muntinlupa) -Upstream 6 San Pedro River (T2) 7 Biñan River
8 Sta. Rosa River - Downstream 8M Sta. Rosa River - Midstream 8U Sta. Rosa River - Upstream
9 Cabuyao River 10 San Cristobal River (T3) 11 San Juan River (T5)
12 Molawin Creek (Los Baños) 13 Bay River (T9) 14 Pila River
15 Sta. Cruz River (T6) 16 Pagsanjan River (T8) 17 Pangil River - Downstream
17U Pangil River - Upstream 18 Siniloan River 19 Sta. Maria River - Downstream
19U Sta. Maria River - Upstream 20 Jala-jala River 21 Pililla River
22 Tanay River - Downstream 22U Tanay River - Upstream 23 Baras River
24 Morong River - Downstream 24U Morong River - Upstream 25 Manggahan Floodway (Taytay)
26 Sapang Baho River (Cainta)
61
TOTAL SUSPENDED SOLIDS
Suspended solids are particles of sand, silt, clay, and organic material including plankton that move with the water. Suspended solids are usually measured as a concentration in milligrams per liter (mg/L). Suspended solids reduce visibility and absorb light, which can increase the water temperature and reduce photosynthesis. Impeding aquatic plant photosynthesis reduces the amount of food, habitat and dissolved oxygen. (http://www.stormwaterx. com/Resources/IndustrialPollutants/TSS.aspx). . Water with high-suspended solids is unsatisfactory for bathing, industrial and other purposes. High levels of suspended solids can cause problems for aquatic organisms because it can reduce visibility, thus, making it hard for fish to find prey (http:// cals.arizona.edu/watershedsteward/resources/docs/guideWaterQuality.pdf). The number of filter-feeding invertebrates will also decline due to clogged feeding mechanisms. As the fish may likewise suffer clogging and abrasive damage to gills and other respiratory surfaces, the abrasion of the gill tissues will trigger excess mucous secretion, decrease resistance to disease, and a reduction or complete cessation of feeding (http://www.sabah.gov.my/jpas/ Assessment/eia/sp-eias/Benta/AppEwater.pdf).
In DAO 34, the Class C water quality criterion for total suspended solids (TSS) is that the increase over the natural background concentration should not be more than 30 mg/L. For the computed annual mean of TSS, there was no set criterion.
From 2009 to 2012, Stn. VIII (South Bay) in 2011 registered the highest annual average TSS in the lake at 74 mg/L while Stn IV (Central Bay) in 2010 had the lowest at 14 mg/L.
The highest among the computed annual means in the tributary rivers for TSS from 2009 to 2012 was 514 mg/L in Stn. 4 (Bagumbayan River) in 2010 and the lowest was in Stn 11 (San Juan River) at 8 mg/L also in 2010.
Monitoring Stations Annual Averages Laguna de Bay Water Quality
Monitoring Stations 2009 2010 2011 2012
Stn. I (Central West Bay) 48 47 58 36 Stn. II (East Bay) 44 29 35 46
Stn. IV (Central Bay) 53 50 67 50
Stn. V (Northern West Bay) 50 47 58 39
Stn. VIII (South Bay) 39 37 39 44
Stn. XV San Pedro (West Bay) * * * 45
Stn. XVI Sta Rosa (West Bay) * * * 44
Stn. XVII Fish Sanctuary (Central Bay) * * * 51
Stn. XVIII Pagsanjan (East Bay) * * * 47
Notes: * No data - not yet included in the LLDA's Water Quality Monitoring Program Sampling Depth - Stn. I - composite of 0.5 and 2.0 m. Stn. XV - composite of 0.5 and 2.0 m. Stn. II - composite of 0.5 and 2.0 m. Stn. XVI - composite of 0.5 and 2.0 m. Stn. IV - 0.5 m. Stn. XVII - composite of 0.5 and 2.0 m. Stn. V - 0.5 m. Stn. XVIII - composite of 0.5 and 2.0 m. Stn. VIII - composite of 0.5 and 2.0 m.
Sampling Frequency - Once a month
DENR Class C criterion for Transparency - none
B. Graphs
LAGUNA DE BAY
Transparency
0
510
1520
2530
3540
4550
5560
6570
75
2009 2010 2011 2012
Years
cen
tim
eter
s
Stn. I (Central West Bay) Stn. II (East Bay)
Stn. IV (Central Bay) Stn. V (Northern West Bay)
Stn. VIII (South Bay) Stn. XV San Pedro (West Bay)
Stn. XVI Sta Rosa (West Bay) Stn. XVII Fish Sanctuary (Central Bay)
Stn. XVIII Pagsanjan (East Bay)
63
TRANSPARENCY
Transparency or Secchi depth is a measure of how deep the light penetrates into the water column and therefore it is an indication of water clarity. This measurement as an alternative to measuring turbidity, is obtained by lowering a black and white secchi disk into the water and recording the depth from the time that it is visible and until it is no longer visible. Transparency is directly affected by the level of suspended particles and dissolved materials in the water. When assessed along with other parameters such as chlorophyll-a, transparency measurements give us useful insight into the biological productivity in a lake, and ultimately its water quality conditions (http://www.micorps. net/documents/SecchiFactsheet.pdf).
The annual average transparency of the lake from 2009 to 2012 ranged from 29 to 67 centimeters with the lowest obtained in Stn. II (East Bay) in 2010 and the highest recorded in Stn. IV (Central Bay) in 2011.
Monitoring Stations Annual Averages Laguna de Bay Water Quality
Monitoring Stations 2009 2010 2011 2012
Stn. I (Central West Bay) 37 32 33 44 Stn. II (East Bay) 38 25 36 34
Stn. IV (Central Bay) 38 12 29 41
Stn. V (Northern West Bay) 51 30 45 48
Stn. VIII (South Bay) 55 26 51 36
Stn. XV San Pedro (West Bay) * * * 36
Stn. XVI Sta Rosa (West Bay) * * * 47
Stn. XVII Fish Sanctuary (Central Bay) * * * 34
Stn. XVIII Pagsanjan (East Bay) * * * 31
Notes: * No data - not yet included in the LLDA's Water Quality Monitoring Program Sampling Depth - Stn. I - composite of 0.5 and 2.0 m. Stn. XV - composite of 0.5 and 2.0 m. Stn. II - composite of 0.5 and 2.0 m. Stn. XVI - composite of 0.5 and 2.0 m. Stn. IV - 0.5 m. Stn. XVII - composite of 0.5 and 2.0 m. Stn. V - 0.5 m. Stn. XVIII - composite of 0.5 and 2.0 m. Stn. VIII - composite of 0.5 and 2.0 m.
Sampling Frequency - Once a month
DENR Class C criterion for Turbidity - none
B. Graphs
LAGUNA DE BAY
Turbidity
0
5
10
15
20
25
30
35
40
45
50
55
60
2009 2010 2011 2012
Years
NT
U
Stn. I (Central West Bay) Stn. II (East Bay) Stn. IV (Central Bay)
Stn. V (Northern West Bay) Stn. VIII (South Bay) Stn. XV San Pedro (West Bay)
Stn. XVI Sta Rosa (West Bay) Stn. XVII Fish Sanctuary (Central Bay) Stn. XVIII Pagsanjan (East Bay)
65
TRIBUTARY RIVERS Turbidity, NTU
A. Water Quality Data
Monitoring Stations Annual Averages Tributary Rivers Water Quality
Monitoring Stations Station No.
Locations 2009 2010 2011 2012
1 Marikina River 15 69 122 112 2 Bagumbayan River (Taguig) 34 57 30 12
3 Buli Creek (Taguig) 47 51 34 17
4 Mangangate River (Muntinlupa) -Downstream 17 30 14 20
4U Mangangate River (Muntinlupa) -Upstream * * * 10
5 Tunasan River (Muntinlupa) -Downstream 55 50 67 29
5U Tunasan River (Muntinlupa) -Upstream * * * 17
6 San Pedro River (T2) 21 19 35 15
7 Biñan River * * 22 51
8 Sta. Rosa River - Downstream * * 14 36 Notes:
8M Sta. Rosa River - Midstream * * * 19 8U Sta. Rosa River - Upstream * * * 8 Sampling Frequency - Once a month
9 Cabuyao River 21 8 14 12
10 San Cristobal River (T3) 93 37 13 20
DENR Class C criterion for DO - 5.0 mg/l
11 San Juan River (T5) 202 5 6 35 12 Molawin Creek (Los Baños) * * 31 27 * No sampling done
13 Bay River (T9) 31 26 27 24
14 Pila River * * 39 38
15 Sta. Cruz River (T6) 12 10 11 10
16 Pagsanjan River (T8) 15 10 18 12
17 Pangil River - Downstream 8 11 10 10
17U Pangil River - Upstream * * * 4
18 Siniloan River 23 33 28 20
19 Sta. Maria River -
Downstream * * 33 40
19U Sta. Maria River - Upstream * * * 17
20 Jala-jala River * * * 12
21 Pililla River * * 41 17
22 Tanay River - Downstream 10 22 27 10
22U Tanay River - Upstream * * * 6
23 Baras River * * 33 27
24 Morong River - Downstream 17 47 127 60
24U Morong River - Upstream * * * 56
25 Manggahan Floodway
(Taytay) 16 37 97 76
26 Sapang Baho River (Cainta) 18 20 35 20
66
B. Graphs:
0
50
100
150
200
250
2009 2010 2011 2012
mg
/L
Year
TRIBUTARY RIVERSTurbidity
1 Marikina River 2 Bagumbayan River (Taguig) 3 Buli Creek (Taguig)
4 Mangangate River (Muntinlupa) -Downstream 4U Mangangate River (Muntinlupa) -Upstream 5 Tunasan River (Muntinlupa) -Downstream
5U Tunasan River (Muntinlupa) -Upstream 6 San Pedro River (T2) 7 Biñan River
8 Sta. Rosa River - Downstream 8M Sta. Rosa River - Midstream 8U Sta. Rosa River - Upstream
9 Cabuyao River 10 San Cristobal River (T3) 11 San Juan River (T5)
12 Molawin Creek (Los Baños) 13 Bay River (T9) 14 Pila River
15 Sta. Cruz River (T6) 16 Pagsanjan River (T8) 17 Pangil River - Downstream
17U Pangil River - Upstream 18 Siniloan River 19 Sta. Maria River - Downstream
19U Sta. Maria River - Upstream 20 Jala-jala River 21 Pililla River
22 Tanay River - Downstream 22U Tanay River - Upstream 23 Baras River
24 Morong River - Downstream 24U Morong River - Upstream 25 Manggahan Floodway (Taytay)
26 Sapang Baho River (Cainta)
67
TURBIDITY
Turbidity is a significant indicator of overall water quality. It is an expression of optical property wherein light is scattered by suspended particles present in water (Tyndall effect) and is measured in Nephelometric Turbidity Units (NTUs). Suspended and colloidal matter such as clay, silt, finely divided organic and inorganic matter; plankton and other microscopic organisms cause turbidity in water. http://ces.iisc.ernet.in/energy/monograph1/Methpage1.html.
Water that has high turbidity appears cloudy or opaque. High turbidity can cause increased water temperatures because suspended particles absorb more heat and can also reduce the amount of light penetrating the water. High levels of turbidity make it difficult for fish to find prey due to high levels of suspended solids. Turbidity due to a large volume of suspended sediment will reduce light penetration, thereby suppressing photosynthetic activity of phytoplankton,and macrophytes, especially those farther from the water surface. If turbidity is largely due to algae, light will not penetrate deeply onto the water and primary production will be limited to the uppermost layer of the water. Overall, excess turbidity leads to fewer photosynthetic organisms available to serve as food sources for the aquatic animals. If turbidity is largely due to organic particles, dissolved oxygen depletion may occur in the water body. (http://www.sabah.gov.my/ jpas/Assessment/eia/sp-eias/Benta/AppEwater.pdf). . The DENR has no set Class C criterion for turbidity. For the 4-year monitoring period from 2009 to 2012, the annual average turbidities in the lake varied from 12 NTU (recorded in Stn. IV-Central Bay in 2010) to 55 NTU (obtained in Stn. VIII-South Bay in 2009). The three (3) tributary river stations which indicated very high annual average turbidity values of more than 100 NTU from 2009 to 2012 were Stn. 11 (San Juan River) in 2009 at 202 NTU, Stn. 24 (Morong River-Downstream) in 2011 at 127 NTU, and Stn. 1 (Marikina River) at 122 NTU in 2011 and 112 NTU in 2012. Stn. 17U (Pangil River-Upstream) yielded the lowest annual average turbidity among the tributary river stations at 4 NTU in 2012.
Monitoring Stations Annual Averages Laguna de Bay Water Quality
Monitoring Stations 2009 2010 2011 2012
Stn. I (Central West Bay) 14832 29345 51920 57903 Stn. II (East Bay) 13557 19178 26164 13212
Stn. IV (Central Bay) 11097 40075 43933 25299
Stn. V (Northern West Bay) 19178 17257 33404 25750
Stn. VIII (South Bay) 17309 15106 23437 31286
Stn. XV San Pedro (West Bay) * * * 46300
Stn. XVI Sta Rosa (West Bay) * * * 120829
Stn. XVII Fish Sanctuary (Central Bay) * * * 25313
Stn. XVIII Pagsanjan (East Bay) * * * 22164
Notes: * No data - not yet included in the LLDA's Water Quality Monitoring Program Sampling Depth - Stn. I - composite of 0.5 and 2.0 m. Stn. XV - composite of 0.5 and 2.0 m. Stn. II - composite of 0.5 and 2.0 m. Stn. XVI - composite of 0.5 and 2.0 m. Stn. IV - 0.5 m. Stn. XVII - composite of 0.5 and 2.0 m. Stn. V - 0.5 m. Stn. XVIII - composite of 0.5 and 2.0 m. Stn. VIII - composite of 0.5 and 2.0 m.
Sampling Frequency - Once a month
B. Graphs
69
TRIBUTARY RIVERS Phytoplankton, counts/mL
A. Water Quality Data
Monitoring Stations Annual Averages Tributary Rivers Water Quality
Monitoring Stations Station No.
Locations 2009 2010 2011 2012
1 Marikina River * * 8,774 73,044
2 Bagumbayan River (Taguig) * * 245,065 295,386
3 Buli Creek (Taguig) * * * *
4 Mangangate River (Muntinlupa) -Downstream * * * *
4U Mangangate River (Muntinlupa) -Upstream * * * *
5 Tunasan River (Muntinlupa)
-Downstream * * 25,858 50,561
5U Tunasan River (Muntinlupa)
-Upstream * * * 105,917
6 San Pedro River (T2) * * 359,283 242,813
7 Biñan River * * 121,155 102,612
8 Sta. Rosa River - Downstream * * 100,890 149,479 Notes:
8M Sta. Rosa River - Midstream * * * 34,881
8U Sta. Rosa River - Upstream * * * 15,626 Sampling Frequency - Once a month
9 Cabuyao River * * 59,934 320,861 10 San Cristobal River (T3) * * 233,663 129,698 * No sampling done
11 San Juan River (T5) * * 115,176 40,023
12 Molawin Creek (Los Baños) * * 4,294 17,917
13 Bay River (T9) * * 9,963 54,687
14 Pila River * * 15,737 26,390
15 Sta. Cruz River (T6) * * 54,252 55,813
16 Pagsanjan River (T8) * * 38,141 17,512
17 Pangil River - Downstream * * 7,177 951
17U Pangil River - Upstream * * * 1,077
18 Siniloan River * * 24,007 16,754
19 Sta. Maria River -
Downstream * * 80,929 43,449
19U Sta. Maria River - Upstream * * * 14,107
20 Jala-jala River * * * 32,125
21 Pililla River * * 9,024 85,275
22 Tanay River - Downstream * * 3,640 6,131
22U Tanay River - Upstream * * * 34,082
23 Baras River * * 5,085 67,778
24 Morong River - Downstream * * 309,863 421,926
24U Morong River - Upstream * * * 184,570
25 Manggahan Floodway
(Taytay) * * 59,986 953,900
26 Sapang Baho River
(Cainta) * * 14,375 4,443,555
70
B. Graphs:
0
100,000
200,000
300,000
400,000
500,000
600,000
700,000
800,000
900,000
1,000,000
2009 2010 2011 2012
co
un
ts/m
l
Year
TRIBUTARY RIVERSPhytoplankton Counts
1 Marikina River 2 Bagumbayan River (Taguig) 3 Buli Creek (Taguig)
4 Mangangate River (Muntinlupa) -Downstream 4U Mangangate River (Muntinlupa) -Upstream 5 Tunasan River (Muntinlupa) -Downstream
5U Tunasan River (Muntinlupa) -Upstream 6 San Pedro River (T2) 7 Biñan River
8 Sta. Rosa River - Downstream 8M Sta. Rosa River - Midstream 8U Sta. Rosa River - Upstream
9 Cabuyao River 10 San Cristobal River (T3) 11 San Juan River (T5)
12 Molawin Creek (Los Baños) 13 Bay River (T9) 14 Pila River
15 Sta. Cruz River (T6) 16 Pagsanjan River (T8) 17 Pangil River - Downstream
17U Pangil River - Upstream 18 Siniloan River 19 Sta. Maria River - Downstream
19U Sta. Maria River - Upstream 20 Jala-jala River 21 Pililla River
22 Tanay River - Downstream 22U Tanay River - Upstream 23 Baras River
24 Morong River - Downstream 24U Morong River - Upstream 25 Manggahan Floodway (Taytay)
26 Sapang Baho River (Cainta)
71
PHYTOPLANKTON
Phytoplankton is also known as algae and it refers to free-floating plants which inhabit the illuminated surface waters of the sea, estuaries, lakes and ponds. Phytoplankton are mostly unicellular and their photosynthetic activity in order to reproduce is limited to the maximum depth to which light can penetrate into the water.
Phytoplankton have a critical role in primary production, nutrient cycling, and food webs and make up a significant proportion of the primary production in aquatic systems (Dawes 1998 as cited in http://nerrs.noaa.gov/doc/siteprofile/acebasin/html/biores/phyto/pytext.htm). Phytoplankton are the food source for numerous aquatic animals, especially the zooplankton which can significantly decrease phytoplankton density.
Phytoplankton growth and productivity are affected by several factors which are called limiting factors. These limiting factors include light, temperature, circulation, grazing, and nutrients. The same with the other factors which affect phytoplankton production, the effect of grazers is seasonal. Phytoplankton experience the greatest productivity when they encounter their optimal light and nutrient conditions. With adequate nutrients, phytoplankton growth and productivity increases with increasing light levels until a certain light level is reached. At this point photosynthesis is at its maximum and further photosynthesis is inhibited with increasing light levels (http://nerrs.noaa.gov/doc/siteprofile/acebasin/html/ biores/phyto/pytext.htm).
.
The phytoplankton genera found in Laguna de Bay and its tributary rivers belonged to the following classes: Class Cyanophyceae (blue-green algae), Class Chlorophyceae (green algae), Class Bacillariophyceae (diatoms) and Class Pyrrophyceae (dinoflagellates).
From 2009 to 2012, Class Chlorophyceae (green algae) was the most diverse in the lake but the most dominant genera were from Class Cyanophyceae (blue-green algae) and Class Bacillariophyceae (diatoms). The phytoplankton genera which usually had the highest counts during the 4-year monitoring period were Melosira sp. (diatoms), Microcystis sp. (blue-green algae) and Stephanodiscus sp. (diatoms). The lowest computed annual phytoplankton counts in the lake was in Stn. IV (Central Bay) at 11,097 counts/ml recorded in 2009 and the highest was obtained in Stn. XVI (West Bay-Sta Rosa) at 120,829 counts/ml in 2012. The analysis of water samples for phytoplankton counts in the tributary rivers started in 2011. From among the 34 tributary river stations, 11 of them had very high annual phytoplankton counts exceeding 100,000 counts/ml and these are Stn. 2-Bagumbayan River (at 245,065 counts/ml in 2009 and 295,386 counts/ml in 2010), Stn. 5U-Tunasan River Upstream (at 105,917 counts/ml in 2012), Stn. 6-San Pedro River (at 359,283 counts/ml in 2011 and 242,813 counts/ml in 2012), Stn. 8-Sta.Rosa River Downstream (at 100,890 counts/ml in 2011 and 149,479 counts/ml in 2012), Stn. 8-Sta. Rosa River Downstream (at 100,890 counts/ml in 2011 and 149,479 counts/ml in 2012), Stn. 9-Cabuyao River (at 320,861 counts/ml in 2012), Stn. 10-San Cristobal River (at 233,663 counts/ml in 2011 and 129,698 counts/ml in 2012), Stn. 11-San Juan River (at 115,176 counts/ml in 2011), Stn. 24-Morong River Downstream (at 309,863 counts/ml in 2011 and 421,926 counts/ml in 2012), Stn. 24U-Morong River Upstream (at 184,570 counts/ml in 2012), Stn. 25-Manggahan Flooodway (at 953,900 counts/ml in 2012) and Stn. 26-Sapang Baho River (at 4,443,555 counts/ml in 2012). The identified abundant phytoplankton genera in these rivers were Nitzschia sp. (diatom), a polluted water indicator. The predominance of Microcystis sp. (blue-green alga) in November, 2012 was responsible for the
very high annual mean phytoplankton counts in Stns. 25 and 26 in 2012. The lowest annual mean phytoplankton counts from 2009 to 2012 was 951 counts/ml in Stn. 17 (Pangil River-Downstream) in 2012.
Monitoring Stations Annual Averages Laguna de Bay Water Quality
Monitoring Stations 2009 2010 2011 2012
Stn. I (Central West Bay) 25 54 60 33 Stn. II (East Bay) 17 46 28 21
Stn. IV (Central Bay) 23 40 45 36
Stn. V (Northern West Bay) 15 201 44 33
Stn. VIII (South Bay) 14 33 41 26
Stn. XV San Pedro (West Bay) * * * 34
Stn. XVI Sta Rosa (West Bay) * * * 21
Stn. XVII Fish Sanctuary (Central Bay) * * * 17
Stn. XVIII Pagsanjan (East Bay) * * * 16
Notes: * No data - not yet included in the LLDA's Water Quality Monitoring Program Sampling Depth - Stn. I - composite of 0.5 and 2.0 m. Stn. XV - composite of 0.5 and 2.0 m. Stn. II - composite of 0.5 and 2.0 m. Stn. XVI - composite of 0.5 and 2.0 m. Stn. IV - 0.5 m. Stn. XVII - composite of 0.5 and 2.0 m. Stn. V - 0.5 m. Stn. XVIII - composite of 0.5 and 2.0 m. Stn. VIII - composite of 0.5 and 2.0 m.
Sampling Frequency - Once a month
B. Graphs
LAGUNA DE BAY
Zooplankton Counts
0102030405060708090
100110120130140150160170180190200
2009 2010 2011 2012
Years
cou
nts
/lit
er
Stn. I (Central West Bay) Stn. II (East Bay)
Stn. IV (Central Bay) Stn. V (Northern West Bay)
Stn. VIII (South Bay) Stn. XV San Pedro (West Bay)
Stn. XVI Sta Rosa (West Bay) Stn. XVII Fish Sanctuary (Central Bay)
Stn. XVIII Pagsanjan (East Bay)
73
ZOOPLANKTON
Zooplankton is the common name given to many small species of animals found in fresh and marine waters. Zooplankton is a Greek word which means "wandering animals." Most of these animals are so minute that they can only be seen using a microscope. Zooplankton floats in the water column and drifts with the currents because of their limited powers of locomotion. Like phytoplankton, they are usually denser than water and constantly sink by gravity to lower depths (http://www.edc.uri.edu/restoration/ html/gallery/invert/zoo.htm).
The zooplankton population in Laguna de Bay belonged to three major groups: rotifers, cladocerans and copepods. Copepods are crustaceans with a tough exoskeleton composed of calcium carbonate, and their bodies are divided into three sections: the head, thorax, and abdomen. Two antennae protrude from the head and aid in swimming, while two to four pairs of appendages extend from the thorax. Copepods and other zooplankton feed on phytoplankton and are the first link between the primary producers and larger animals. Zooplankton is a vital component of freshwater food webs. The smallest zooplankton are eaten by the larger zooplankton which, in turn, are eaten by small fish, aquatic insects and so on (http://www.doc.govt.nz/conservation/ native-animals/invertebrates/zooplankton/).
Of the three (3) groups of zooplankton in the lake, the most abundant from 2009 to 2012
were the copepods and the most diverse were the rotifers. The copepods comprised of their immature stages and the following genera: Mesocyclops, Thermocyclops, Arctodiaptomus and Diaptomus spp.. The identified rotifers included Brachionus, Filinia, Keratella, Lecane and Tricocerca spp. while the cladocerans consisted of Bosmina, Moina, Diaphanosoma and Chydorus spp.. Based on the computed annual average total zooplankton counts in the lake, the lowest was at 14 counts/liter in Stn. VIII (South Bay) in 2009 and the highest was 201 counts/liter in Stn. V (Northern West Bay) in 2010.
74
LAGUNA DE BAY Benthos, individuals/sq.m.
A. Water Quality Data:
Monitoring Stations Annual Averages Laguna de Bay Water Quality
Monitoring Stations 2009 2010 2011 2012
Stn. I (Central West Bay) 149 369 1150 500 Stn. II (East Bay) 197 185 409 238
Stn. IV (Central Bay) 108 179 1107 310
Stn. V (Northern West Bay) 979 513 845 551
Stn. VIII (South Bay) 114 254 699 234
Stn. XV San Pedro (West Bay) * * * 843
Stn. XVI Sta Rosa (West Bay) * * * 322
Stn. XVII Fish Sanctuary (Central Bay) * * * 528
Stn. XVIII Pagsanjan (East Bay) * * * 213
Notes: * No data - not yet included in the LLDA's Water Quality Monitoring Program Sampling Depth - Stn. I - composite of 0.5 and 2.0 m. Stn. XV - composite of 0.5 and 2.0 m. Stn. II - composite of 0.5 and 2.0 m. Stn. XVI - composite of 0.5 and 2.0 m. Stn. IV - 0.5 m. Stn. XVII - composite of 0.5 and 2.0 m. Stn. V - 0.5 m. Stn. XVIII - composite of 0.5 and 2.0 m. Stn. VIII - composite of 0.5 and 2.0 m.
Sampling Frequency - Once a month
B. Graphs
LAGUNA DE BAY
Benthos
0
100
200
300
400
500
600
700
800
900
1000
1100
1200
2009 2010 2011 2012
Years
ind
ivid
ual
s/sq
.m.
Stn. I (Central West Bay) Stn. II (East Bay)
Stn. IV (Central Bay) Stn. V (Northern West Bay)
Stn. VIII (South Bay) Stn. XV San Pedro (West Bay)
Stn. XVI Sta Rosa (West Bay) Stn. XVII Fish Sanctuary (Central Bay)
Stn. XVIII Pagsanjan (East Bay)
75
BENTHOS
"Benthos" refers to the benthic invertebrate community, which is a group of animals that live on or in the bottom sediments of water bodies such as lakes and rivers. Benthic macroinvertebrates include crustaceans, mollusks, worms, and many species of insect larva such as mayflies, stoneflies, caddisflies, and beetles. The abundance of macroinvertebrates belonging to the orders Ephemeroptera, Plecoptera, and Trichoptera should be noted because for being highly sensitive to pollution, they are often used as water quality indicators. Their presence indicates a high quality of water, while their absence suggests water may be polluted. (http://www.cotf.edu/ete/modules/ waterq3/WQassess2a.html)
Benthos are easier to capture than fish, and easier to identify than algae or protozoa. Benthos cannot move around like fish that they are less able to escape the effects of sediment and other pollutants that diminish water quality. Thus, benthos can give us reliable information on stream and lake water quality because their long life cycles will allow studies conducted by aquatic ecologists to determine any decline in environmental quality (http://www.dnr.state.md.us/irc/docs/00004176.pdf). The collection of benthos samples in Laguna de Bay and in the tributary river stations by LLDA is usually done using an ekman dredge. But in river stations that are shallow with water depth of less than one (1) foot deep, the surber sampler is used instead of the ekman dredge. The benthos identified in Laguna de Bay and its tributaries from 2009 to 2012 are classified into five (5) groups: Gastropoda, Crustacea, Insecta, Oligochaeta and Pelecypoda. In the lake, the most dominant genera of benthic macroinvertebrates were Cypricercus sp. (crustacean) in 2009; and Thiara sp. (gastropod) and Cypricercus sp. in 2010, 2011 and 2012. Among the nine (9) stations in the lake monitored in 2009 up to 2012, the lowest and highest annual average benthos population were recorded both in Stn. IV (Central Bay) at 108 individuals/sq. m. in 2009 and 1,107 individuals/sq. m. in 2011.
Monitoring Stations Annual Averages Laguna de Bay Water Quality
Monitoring Stations 2009 2010 2011 2012
Stn. I (Central West Bay) 295 56 55 200 Stn. II (East Bay) 127 75 266 222
Stn. IV (Central Bay) 147 36 213 375
Stn. V (Northern West Bay) 438 55 1552 1528
Stn. VIII (South Bay) 1096 188 2100 1373
Stn. XV San Pedro (West Bay) - - - 955
Stn. XVI Sta Rosa (West Bay) - - - 358
Stn. XVII Fish Sanctuary (Central Bay) - - - 212
Stn. XVIII Pagsanjan (East Bay) - - - 318
Notes: * No data - not yet included in the LLDA's Water Quality Monitoring Program Sampling Depth - Stn. I - composite of 0.5 and 2.0 m. Stn. XV - composite of 0.5 and 2.0 m. Stn. II - composite of 0.5 and 2.0 m. Stn. XVI - composite of 0.5 and 2.0 m. Stn. IV - 0.5 m. Stn. XVII - composite of 0.5 and 2.0 m. Stn. V - 0.5 m. Stn. XVIII - composite of 0.5 and 2.0 m. Stn. VIII - composite of 0.5 and 2.0 m.
Sampling Frequency - Once a month All data presented are computed annual geomeans
DENR Class C criterion for Total Coliform – 5,000 MPN/100 ml
B. Graphs
LAGUNA DE BAY
Total Coliform
0
500
1000
1500
2000
2500
3000
3500
4000
4500
5000
2009 2010 2011 2012
Years
MP
N/1
00 m
l
Stn. I (Central West Bay) Stn. II (East Bay)
Stn. IV (Central Bay) Stn. V (Northern West Bay)
Stn. VIII (South Bay) Stn. XV San Pedro (West Bay)
Stn. XVI Sta Rosa (West Bay) Stn. XVII Fish Sanctuary (Central Bay)
Stn. XVIII Pagsanjan (East Bay) DENR Class C Criterion
77
TRIBUTARY RIVERS Total Coliform, MPN/100 mL
A. Water Quality Data
Monitoring Stations Annual Averages Tributary Rivers Water Quality
Monitoring Stations Station No.
Locations 2009 2010 2011 2012
1 Marikina River 2.8E+06 1.7E+06 4.9E+05 1.6E+06 2 Bagumbayan River (Taguig) 1.4E+15 4.3E+06 7.3E+06 8.2E+06
3 Buli Creek (Taguig) 9.6E+14 8.3E+06 2.8E+07 1.0E+07
4 Mangangate River (Muntinlupa) -Downstream 3.0E+11 2.7E+06 6.0E+06 4.1E+06
4U Mangangate River (Muntinlupa) -Upstream * * * 3.3E+06
5 Tunasan River (Muntinlupa) -Downstream 2.3E+11 1.1E+07 1.3E+07 2.3E+07
5U Tunasan River (Muntinlupa) -Upstream * * * 3.2E+05
6 San Pedro River (T2) 2.7E+09 1.5E+06 1.7E+06 3.1E+06
7 Biñan River * * 8.8E+05 3.1E+06
8 Sta. Rosa River - Downstream * * 9.2E+06 7.3E+06 Notes:
8M Sta. Rosa River - Midstream * * * 5.4E+06 8U Sta. Rosa River - Upstream * * * 7.8E+05 Sampling Frequency - Once a month
9 Cabuyao River 7.5E+07 1.7E+06 1.9E+06 2.4E+06
10 San Cristobal River (T3) 1.2E+09 7.0E+06 3.2E+06 8.5E+06
All data presented are computed annual geomeans
11 San Juan River (T5) 6.4E+05 9.4E+04 1.9E+05 4.7E+05
12 Molawin Creek (Los Baños) * * 9.6E+04 7.1E+04
DENR Class C criterion for Total Coliform – 5,000 MPN/100 ml
13 Bay River (T9) 7.3E+05 1.1E+05 4.7E+05 4.1E+05 14 Pila River * * 1.8E+05 1.4E+05 * No sampling done
15 Sta. Cruz River (T6) 5.7E+04 1.7E+04 1.1E+05 1.3E+05
16 Pagsanjan River (T8) 3.7E+04 1.4E+04 5.4E+04 3.4E+04
17 Pangil River - Downstream 8.8E+04 3.0E+05 1.2E+05 1.7E+05
17U Pangil River - Upstream * * - 8.1E+03
18 Siniloan River 8.8E+04 4.4E+04 6.9E+04 5.7E+04
19 Sta. Maria River - Downstream * * 9.9E+04 1.0E+05
19U Sta. Maria River - Upstream * * - 8.7E+03
20 Jala-jala River * * 1.9E+05 6.7E+05
21 Pililla River * * 2.1E+05 9.4E+04
22 Tanay River - Downstream 2.3E+05 5.2E+05 3.4E+05 2.2E+05
22U Tanay River - Upstream * * - 4.5E+04
23 Baras River * * 3.0E+05 3.9E+05
24 Morong River - Downstream 2.9E+05 1.9E+05 4.3E+04 1.7E+05
26 Sapang Baho River (Cainta) 4.7E+06 1.7E+06 1.4E+06 2.6E+06
78
B. Graphs:
79
TOTAL COLIFORM
Coliform bacteria are microscopic organisms that originate in the intestinal tract of warm-blooded animals and are also present in soil and vegetation. Total coliform are generally harmless but their presence in water would indicate the possibility of contamination by disease-causing bacteria, viruses or parasites. Most coliform bacteria enter natural streams by direct deposition of waste in the water and runoff from areas with high concentrations of animals or humans. Domesticated animals contribute heavily to the bacterial population. Diseases that may be present in water tested positive for coliform bacteria include typhoid fever, cholera, hepatitis, dysentery, diarrhea, giardiasis, and hemolytic uremic syndrome (https://extension.usu.edu/files/ publications/factsheet/NR_WQ_2005-20.pdf). Total coliform is measured using the Multiple Tube Fermentation technique and the result of analysis is expressed as the Most Probable Number (MPN).
The DENR‘s Class C criterion for total coliform is set at 5,000 MPN/100 ml.
The annual geomean total coliform concentrations in all lake stations from 2009 to 2013 which ranged from 55 to 2,100 MPN/100 ml passed the DENR Class C criterion. On the other hand, all river stations had annual geomean total coliform concentrations exceeding the 5,000 MPN/100 ml Class C criterion throughout the 4-year monitoring period with the lowest at 8,123 MPN/100 ml in Stn 17U (Pangil River Upstream) in 2012 and the highest at 1,423,305,032,753,950 MPN/100 ml in Stn. 2 (Bagumbayan River) in 2009.
80
LAGUNA DE BAY Fecal Coliform, MPN/ 100 mL
A. Water Quality Data:
Monitoring Stations Annual Averages Laguna de Bay Water Quality
Monitoring Stations 2009 2010 2011 2012
Stn. I (Central West Bay) 165 51 20 11 Stn. II (East Bay) 66 70 26 8
Stn. IV (Central Bay) 97 40 179 15
Stn. V (Northern West Bay) 241 51 233 147
Stn. VIII (South Bay) 694 157 534 200
Stn. XV San Pedro (West Bay) * * * 217
Stn. XVI Sta Rosa (West Bay) * * * 36
Stn. XVII Fish Sanctuary (Central Bay) * * * 54
Stn. XVIII Pagsanjan (East Bay) * * * 151
Notes: * No data - not yet included in the LLDA's Water Quality Monitoring Program Sampling Depth - Stn. I - composite of 0.5 and 2.0 m. Stn. XV - composite of 0.5 and 2.0 m. Stn. II - composite of 0.5 and 2.0 m. Stn. XVI - composite of 0.5 and 2.0 m. Stn. IV - 0.5 m. Stn. XVII - composite of 0.5 and 2.0 m. Stn. V - 0.5 m. Stn. XVIII - composite of 0.5 and 2.0 m. Stn. VIII - composite of 0.5 and 2.0 m.
Sampling Frequency - Once a month All data presented are computed annual geomeans
DENR Class C criterion for Fecal Coliform - none
B. Graphs
LAGUNA DE BAY
Fecal Coliform
0
50
100
150
200
250
300
350
400
450
500
550
600
650
700
2009 2010 2011 2012
Years
MP
N/1
00 m
l
Stn. I (Central West Bay) Stn. II (East Bay)
Stn. IV (Central Bay) Stn. V (Northern West Bay)
Stn. VIII (South Bay) Stn. XV San Pedro (West Bay)
Stn. XVI Sta Rosa (West Bay) Stn. XVII Fish Sanctuary (Central Bay)
Stn. XVIII Pagsanjan (East Bay)
81
TRIBUTARY RIVERS Fecal Coliform, MPN/100 mL
A. Water Quality Data
Monitoring Stations Annual Averages Tributary Rivers Water Quality
Monitoring Stations Station No.
Locations 2009 2010 2011 2012
1 Marikina River 1.5E+06 1.1E+06 2.0E+05 6.4E+05 2 Bagumbayan River (Taguig) 1.1E+15 2.9E+06 4.7E+06 5.2E+06
3 Buli Creek (Taguig) 6.8E+14 8.7E+06 1.4E+07 5.9E+06
4 Mangangate River (Muntinlupa) -Downstream 1.3E+11 2.6E+06 1.6E+06 1.9E+06
4U Mangangate River (Muntinlupa) -Upstream * * * 1.9E+06
5 Tunasan River (Muntinlupa) -Downstream 1.8E+11 1.1E+07 7.5E+06 1.2E+07
5U Tunasan River (Muntinlupa) -Upstream * * * 1.3E+05
6 San Pedro River (T2) 1.8E+09 1.5E+06 7.9E+05 1.3E+06
7 Biñan River * * 7.8E+05 7.0E+05
8 Sta. Rosa River - Downstream * * 2.4E+06 1.6E+06 Notes:
8M Sta. Rosa River - Midstream * * * 2.8E+06 8U Sta. Rosa River - Upstream * * * 6.2E+05 Sampling Frequency - Once a month
9 Cabuyao River 4.7E+07 1.5E+06 9.9E+05 1.4E+06
10 San Cristobal River (T3) 1.1E+09 7.0E+06 2.0E+06 2.7E+06
All data presented are computed annual geomeans
11 San Juan River (T5) 5.6E+05 8.6E+04 1.6E+05 1.9E+05
12 Molawin Creek (Los Baños) * * 3.5E+04 3.5E+04
DENR Class C criterion for Fecal Coliform – none
13 Bay River (T9) 5.0E+05 8.0E+04 4.0E+05 1.5E+05 14 Pila River * * 7.2E+04 4.1E+04 * No sampling done
15 Sta. Cruz River (T6) 4.8E+04 1.4E+04 3.2E+04 3.1E+04
16 Pagsanjan River (T8) 3.1E+04 4.1E+04 3.3E+04 1.5E+04
17 Pangil River – Downstream 5.9E+04 2.4E+05 5.7E+04 8.9E+04
17U Pangil River – Upstream * * * 3.9E+03
18 Siniloan River 6.1E+04 4.0E+04 2.6E+04 2.1E+04
19 Sta. Maria River – Downstream * * 7.8E+04 6.7E+04
19U Sta. Maria River – Upstream * * * 2.5E+03
20 Jala-jala River * * * 3.0E+05
21 Pililla River * * 5.2E+04 4.5E+04
22 Tanay River – Downstream 1.4E+05 4.4E+05 1.7E+05 6.7E+04
22U Tanay River – Upstream * * * 1.4E+04
23 Baras River * * 1.7E+05 1.2E+05
24 Morong River – Downstream 2.2E+05 1.7E+05 2.7E+04 4.1E+04
26 Sapang Baho River (Cainta) 2.8E+06 1.6E+06 8.2E+04 1.1E+05
82
B. Graphs:
83
FECAL COLIFORM The presence of fecal coliform bacteria in aquatic environments indicates that the water has been contaminated with the fecal material of man or other animals. At the time this occurred, the source water may have been contaminated by pathogens or disease producing bacteria or viruses which can also exist in fecal material. Some waterborne pathogenic diseases include typhoid fever, viral and bacterial gastroenteritis and hepatitis A. The presence of fecal contamination is an indicator that a potential health risk exists for individuals exposed to this water. Fecal coliform bacteria may occur in ambient water as a result of the overflow of domestic sewage or nonpoint sources of human and animal waste (http://www.state.ky.us/nrepc/water/wcpfcol.htm). There is no set Class C criterion for fecal coliform under DAO 34. Stn. VIII (South Bay) had the highest annual geomean fecal coliform levels in 2009, 2010 and 2011 among the lake stations monitored from 2009 to 2012 at 694, 157 and 534 MPN/ 100 ml, respectively. In 2012, Stn. XV (West Bay-San Pedro) recorded the highest annual geomean fecal coliform level of 217 MPN/100 ml. The lowest annual geomean fecal coliform level in all lake stations for the 4-year monitoring period was at 8 MPN/100 ml obtained in Stn. II (East Bay) in 2012. The tributary rivers had comparatively much higher annual geomean fecal coliform levels in most of the stations than in the lake from 2009 to 2012 as the concentrations ranged from 2,524 MPN/100 ml to 1,117,310,629,006,070 MPN/100 ml. The lowest fecal coliform computed annual geomean was noted in Stn. 19U (Sta. Maria River-Upstream) in 2012 at 2,524 MPN/100 ml while the highest was in Stn. 2 (Bagumbayan River) in 2009 at 1,117,310,629,006,070 MPN/100 ml.
Gross primary productivity is the rate at which solar energy is stored as organic molecules by plants in an ecosystem. On the other hand, the net primary productivity (NPP) reflects the energy that is used by plants as they carryout respiration, and is calculated by subtracting the amount of respiration from the gross primary productivity. The net primary productivity is of interest to ecologists, since this is the amount of energy that is available for use by consumers in an ecosystem and determines the energy budget of the ecosystem. In ecological studies, high primary productivity in an aquatic ecosystem indicates that the ecosystem is ―healthy‖ In bodies of water, the amount of sunlight (solar energy) penetration decreases as the depth increases. This means the rate of photosynthesis and primary productivity also decrease. When sufficient sunlight is no longer is available, producers cannot survive and carryout photosynthesis to produce organic molecules and oxygen.
The compensation depth in a lake is the depth at which the rate of photosynthesis equals the rate of respiration. As a result, net primary productivity is equal to zero at the compensation depth. Because the rate of photosynthesis depends on light intensity, the level of the compensation depth depends on the depth to which a critical amount of light can penetrate into the water. The region above the compensation depth is referred to as the photic zone (euphotic zone), while the region below the compensation depth is referred to as the aphotic zone (http://nrhs.nred.org/download.axd?file=6bc1ca31-dafa-47bc-bfb3-caf03f60c).
In Laguna de Bay, the primary productivity is measured using the ―Light and Dark‖ Method. The primary productivity measurements provide information on the available natural food supply in the lake at a certain place and time. Based on the lake‘s primary production which is expressed in tons carbon/hectare/year, the corresponding estimates of the lake‘s fish production potential in terms of tons/hectare/year can also be computed. Among the three (3) primary productivity stations in the lake, the West Bay station had the highest annual average net primary productivities in 2010 and 2011 at 8.06 tons carbon/hectare/year and 4.28 tons carbon/hectare/year, respectively, while Central Bay‘s annual average NPPs were highest in 2009 at 3.39 tons carbon/hectare/year and 2012 at 3.51 tons carbon/hectare/year. The lowest computed annual average NPPs were at the East Bay station in 2009 and 2010 at 2.25 tons carbon/hectare/year and 2.25 tons carbon/hectare/year, respectively; Central Bay station in 2011 at 3.04 tons carbon/hectare/year; and West Bay station in 2012 at 2.66 tons carbon/hectare/year. The estimated fish production potentials of the lake ranged from 1.80 to 2.63 tons/hectare/year in 2009, 2.30 to 5.38 tons carbon/hectare/year in 2010, 2.44 to 3.42 tons carbon/hectare/year in 2011 and 2.12 to 2.81 tons carbon/hectare/year.
86
SUMMARY
Generally, the water quality of Laguna de Bay from 2009 to 2012 met the DENR Class C criteria based on the computed annual average levels of most of the physico-chemical parameters for biochemical oxygen demand (BOD), chloride, dissolved oxygen (DO), nitrate, oil and grease, pH and total coliforms. Among the lake primary productivity stations in the three (3) bays of Laguna Lake, the most productive on the basis of the computed net primary productions (NPPs) from 2009 to 2012 were the Central Bay station in 2009 and 2012, and the West Bay station in 2010 and 2011. The highest NPP in 2010 at the West Bay coincided with the saltwater intrusion event at that time. From among the tributary rivers, the stations noted with very poor water quality or always failed the DENR Class C criteria in 2009 up to 2012 were Stns. 1 (Marikina), 2 (Bagumbayan River-Taguig), 3 (Buli Creek-Taguig), 4 (Mangangate River Downstream), 4U (Mangangate River Upstream), 5 (Tunasan River Downstream), 6 (San Pedro River), 7 (Biñan River), 8 (Sta. Rosa River Downstream), 9 (Cabuyao River), 24 (Morong River Downstream), 24U (Morong River Upstream), 25 (Manggahan Floodway-Taytay) and 26 (Sapang Baho River-Cainta) for ammonia; Stns. 1, 2, 3, 4, 4U, 5, 6, 7, 8, 8M , (Sta. Rosa River Midstream), 9, 10 (San Cristobal River), 24, 24U, 25 and 26 for BOD; Stns. 1, 2, 3, 4, 5, 6, 7 ,8, 8M, 9, 10, 25 and 26 for obtaining average annual dissolved oxygen (DO) levels of less than 3 mg/L; Stns. 1, 2, 3, 4, 4U, 5, 5U (Tunasan River Upstream), 6, 7, 8 8M, 8U (Sta. Rosa River Upstream), 9, 10, 11 (San Juan River), 24, 24U, 25 and 26 for inorganic phosphate; Stn. 5 for oil and grease; Stn. 22U (Tanay River Upstream) for pH; and all stations for total coliform. Apparently, the results of the water quality assessments showed that most of the polluted tributary river stations are located at the western and northern parts of the West Bay wherein most of the population and the industrial establishments within the Laguna de Bay Region are concentrated. Thus, pollution control activities must be intensified in these rivers. The tributary river stations whose annual average water quality parameter levels from 2009 to 2012 consistently conformed with the DENR Class C criteria included Stns. 12 (Molawin Creek-Los Baños), 13 (Bay River), 14 (Pila River), 15 (Sta. Cruz River), 16 (Pagsanjan River), 17 (Pangil River Downstream), 18 (Siniloan River), 19 (Sta. Maria River-Downstream), 21 (Pililla River), 22 (Tanay River-Downstream) and 23 (Baras River) for BOD; all stations for chloride and nitrate; Stns. 13, 15, 16, 17 and 22 for DO; Stns. 7, 8, 9, 10, 11, 12, 13, 14, 15, 16, 17, 18, 19, 21, 22, 23, 24 and 25 for oil and grease; and all stations except Stn. 22U for pH.
WATER QUALITY CRITERIA FOR CONVENTIONAL AND OTHER POLLUTANTS CONTRIBUTING TO AESTHETICS AND OXYGEN
DEMAND FOR FRESHWATERS (a)
PARAMETER UNIT CLASS C Color PCU (b) Temperature(c) oC rise 3 (maximum rise in degree Celsius) pH (range) 6.5-8.5 Dissolved Oxygen (d) % saturation 60 (minimum) mg/L 5.0 5-Day 20oC BOD mg/L 7(10) Total Suspended Solids mg/L (e) Total Dissolved Solids mg/L - Oil and Grease mg/L 2 (Petroleum Ether Extracts) Nitrate as Nitrogen mg/L 10 (f) Phosphate as Phosphorus mg/L 0.4 (g) Total Coliform MPN/100ml 5,000 (h) Chloride as Cl- mg/L 350
89
Footnotes
(a) - Except as otherwise indicated, the numerical limits are yearly average values.
Values enclosed in parentheses are maximum values. (b) - No abnormal discoloration from unnatural causes. (c) - The allowable temperature increase over the average ambient temperature for
each month. This rise shall be based on the average of the maximum daily temperature readings recorded at the site but upstream of the mixing zone over a period of one (1) month.
(d) - Sampling taken between 9:00 AM and 4:00 PM. (e) - Not more than 30 mg/L increase. (f) - Applicable only to lakes or reservoirs, and similarly impounded water. (g) - When applied to lakes or reservoirs, the Phosphate as P concentration should
not exceed an average of 0.05 mg/L nor a maximum of 0.1 mg/L. (h) - These values refer to the geometric mean of the most probable number of
coliform organism during a 3-month period and that the limit indicated shall not be exceeded in 20 percent of the samples taken during the same period.
90
REFERENCES
Alkalinity. Retrieved March 7, 2013, from http://www.whitman.edu/chemistry/edusolns_software/AlkalinityBackground.pdf
Alkalinity in Water. Retrieved March 7, 2013, from
http://www.wilkes.edu/pages/3746.asp Aquatic Life Ltd. Calcium Hardness. Retrieved May 10, 2013, from
Bellingham, Keith. Physicochemical Parameters of Natural Waters. Retrieved March 7, 2013, from http://www.stevenswater.com/articles/waterparameters.aspx
Boyde, C.E. and Lichtkoppler, F (1985). Water Quality Management in Pond Fish Culture. Retrieved June 20, 2012, from http://repo.lib.auburn.edu/repo/bitstream/handle/123456789/1088/ 0192FISH.pdf
Chloride and Salinity. Retrieved March 7, 2013, from
http://www.vernier.com/experiments/wqv/15/chloride_ and_salinity/ Daniels, Barbara and Mesner, Nancy (2010). Drinking Water Facts …… Coliform
Bacteria. Retrieved May 1, 2013, from https://extension.usu.edu/files/publications/factsheet/NR_WQ_2005-20.pdf
Determination of the Chemical Oxygen Demand (COD) of River Water Samples. Retrieved March 7, 2013, from http://www.writework.com/essay/determination-chemical-oxygen-demand-cod- river-water-samples
Exploring the Environment Water Quality. Retrieved June 5, 2013, http://www.cotf.edu/ete/modules/waterq3/WQassess3e.html
Farrell-Poe, Kitt. Water Quality Monitoring. Retrieved May 7, 2013,
Levit, Stuart M. Effects of Ammonia in Fish. Retrieved March 25, 2012, from http://www.nature.org/cs/groups/webcontent/@web/@alaska/documents/document/prd_026308.pdf
LLDA (1997). 1996 Annual Water Quality Report on Laguna de Bay and Its Tributaries. Maryland Department of natural Resources. Freshwater Benthic Macroinvertebrates,
Retrived May 5, 2013, from http://www.dnr.state.md.us/irc/docs/00004176.pdf Methodology - Physico-Chemical and Biological Analyses of Water. Retrieved April 17,
2013, from http://ces.iisc.ernet.in/energy/monograph1/Methpage1.html MiCorps Factsheet. Secchi Disc Transparency, Retrieved May 8, 2013,
http://www.micorps.net/documents/SecchiFactsheet.pdf Minnesota Science Teachers Education Project (MnSTEP). Testing alkalinity in water
systems (simulation), Retrieved May 8, 2013, http://serc.carleton.edu/sp/mnstep/activities/38045.html
Phytoplankton. Retrieved April 2, 2013, from
http://nerrs.noaa.gov/doc/siteprofile/acebasin/html/biores/phyto/pytext.htm Primary Productivity in Freshwater Lentic Ecosystems, Retrieved April 2, 2013, from
http://nrhs.nred.org/download.axd?file=6bc1ca31-dafa-47bc-bfb3-caf03f60c StormwateRx. Oil and Grease, Retrieved May 3, 2013,
http://www.stormwaterx.com/Resources/IndustrialPollutants/OilGrease.aspx StormwateRx. Total Suspended Solids or Suspended Solids, Retrieved May 3, 2013,
http://www.stormwaterx.com/Resources/IndustrialPollutants/TSS.aspx Tongson, Edgardo E., Hernandez, Emiterio C. and Faraon, Alvin A. (2012). Hydrologic
Atlas of Laguna de Bay 2012. Laguna Lake Development Authority (LLDA) and World Wide Fund for Nature-Philippines (WWF-Philippines).
U.S. Federal Water Pollution Control Administration (1968). Water Quality Criteria. Water Quality Parameters. Retrieved April 4, 2013, from
http://row.nku.edu/index.php?option=comcontent&view= article&id= 84&Itemid=74 Water QualityParameters and Definitions. Retrieved April 4, 2013, from
http://www.sabah.gov.my/jpas/ Assessment/eia/sp-eias/Benta/AppEwater.pdf What are nitrates and why are they important?. Retrieved March 7, 2013, from
http://water.epa.gov/type/rsl/monitoring/vms57.cfm Zooplankton. Retrieved April 4, 2013, from