+ All Categories
Home > Documents > 2009:068 MASTER'S THESIS A Study of Firm Managers ...1020211/FULLTEXT01.pdf · costly and...

2009:068 MASTER'S THESIS A Study of Firm Managers ...1020211/FULLTEXT01.pdf · costly and...

Date post: 31-Mar-2020
Category:
Upload: others
View: 2 times
Download: 0 times
Share this document with a friend
113
2009:068 MASTER'S THESIS A Study of Firm Managers´ Perceptions of the Supply Chain Integration in Iran Alireza Mirzaei Barzi Luleå University of Technology Master Thesis, Continuation Courses Marketing and e-commerce Department of Business Administration and Social Sciences Division of Industrial marketing and e-commerce 2009:068 - ISSN: 1653-0187 - ISRN: LTU-PB-EX--09/068--SE
Transcript

2009:068

M A S T E R ' S T H E S I S

A Study of Firm Managers´ Perceptionsof the Supply Chain Integration in Iran

Alireza Mirzaei Barzi

Luleå University of Technology

Master Thesis, Continuation Courses Marketing and e-commerce

Department of Business Administration and Social SciencesDivision of Industrial marketing and e-commerce

2009:068 - ISSN: 1653-0187 - ISRN: LTU-PB-EX--09/068--SE

MASTER’S THESIS

A Study of Firm Managers’ Perceptions of the Supply Chain Integration in Iran

Supervisors: Prof. Moez Limayem

Dr. Ardeshir Bahreininejad

Referees: Dr. Chaharsooghi

Dr. Zegordi Dr. Zandi

Prepared by:

Alireza Mirzaei Barzi

Tarbiat Modares University, Faculty of Engineering Department of Industrial Engineering

Luleå University of Technology

Division of Industrial Marketing and E-Commerce

MSc PROGRAM IN MARKETING AND ELECTRONIC COMMERCE Joint

2009

I wish to thank my dear parents for their true love and support throughout my life.

To them, I dedicate this thesis.

i

Abstract

Supply chain management (SCM) has been a major component of competitive

strategy to enhance organizational productivity and profitability. Firms are starting to be

aware of the strategic importance of integration across the boundaries of the supply chain.

The ultimate goal of this study is to identify the underlying factors of supply chain

integration in Iranian firms with particular emphasis on the role of information sharing

and inter-organizational collaboration from their managers’ viewpoint.

In order to shed light on status of supply chain integration, we carried out a cross-

sectional survey in 57 Iranian companies from automotive and food industries which are

the two most referred examples of advanced supply chains. Using statistical analysis, the

study tries to identify the most desirable areas of collaboration with key supply chain

partners and also role of information technology in achieving such integration. Then, the

effect of such cooperation on supply chain performance is examined.

The findings disclosed that Iranian firms have started paying attention to the need

for IT integration in supply chains. However, their managers’ perceptions towards

collaboration level with key associates in supply chain were quite selective. While

cooperation with partners in production and sales administration has shown positive trend,

costly and newly-emerged areas such as supply chain software implementation and

customer relationship management (CRM) are not very common. Overall performance

has been improved as a result of integration. Furthermore, an interesting and surprising

finding from multiple regression analysis was the significant negative correlation

between the supply chain design collaboration with suppliers/customers and performance

measures such as order fulfilment lead time, order fill rate, production flexibility, total

logistics costs, and inventory days of supply.

Keywords: Supply Chain Management, Information Technology, Knowledge Sharing,

Information Integration

ii

Acknowledgements

Moving each step forward, I learned and enjoyed a lot while carrying out this

research. I would like to earnestly thank all those who helped me with their valuable

wisdom in this effort.

Initially, I thank my supervisor in Tarbiat Modares University, Dr. Ardeshir

Bahreininejad, for his continuous support and guidance. Then, I would like to extend my

sincere gratitude to my supervisor in Luleå University of Technology, Professor Moez

Limayem, for his genuine support, helpful ideas, and kind responses to my questions

during the entire phases of this thesis.

I would like to give special thanks to my friends and colleagues who assisted me

in different stages of the research especially in data gathering and analysis: Ms. Farsi, Mr.

Jahanbakhsh, Mr. Shantiaei, Mr. Sadrpanah, and all classmates who provided competitive

and fun environment for studying.

I also thank faculty members of Luleå University of Technology and Tarbiat

Modares University, Deans, Directors, teaching and administrative staff, etc. for their

support. They all gave me the honor of achieving Master degree.

Last but not least, I appreciate kind supports of my loving family who are always

there for me.

Alireza Mirzaei Barzi

April 2009

iii

Table of Contents Chapter 1 ........................................................................................................................... 1 Introduction....................................................................................................................... 1

1. Introduction................................................................................................................. 1 1.1 Background......................................................................................................... 1 1.2 Supply Chain Management (SCM)..................................................................... 2 1.3 Supply Chain Integration: Definition and Importance........................................ 4 1.4 Problem Discussion ............................................................................................ 5 1.5 Research Problem and Research Questions........................................................ 6 1.6 Conclusion .......................................................................................................... 7

Chapter 2 ........................................................................................................................... 8 Literature Review ............................................................................................................. 8

2. Literature Review........................................................................................................ 8 2.1 Collaboration as a Means of Interfirm Integration ............................................. 8 2.2 Information Technology and Integration .......................................................... 16

2.2.1 Information Sharing .................................................................................. 16 2.2.2 Information Integration Tools................................................................... 19

2.2.2.1 Enterprise Resource Planning (ERP) Systems ......................................... 20 2.2.2.2 Adoption of EDI / XML Technologies in Supply Chain ............................ 21

2.3 Supply Chain Performance ............................................................................... 22 2.3.1 Enablers of Efficient Supply Chain .......................................................... 22 2.3.2 Performance Measurement Systems ......................................................... 27

2.4 Theoretical Framework..................................................................................... 31 2.5 Supply Chain Dimensions in Relation with Integration ................................... 32 2.6 Frame of Reference........................................................................................... 34

Chapter 3 ......................................................................................................................... 37 Research Methodology ................................................................................................... 37

3. Methodology............................................................................................................. 37 3.1 Research Philosophy............................................................................................... 38

3.1.1 Epistemology ................................................................................................... 38 3.1.2 Ontology .......................................................................................................... 39 3.1.3 Axiology .......................................................................................................... 39

3.2 Research Purpose .................................................................................................... 40 3.3 Research Approach ................................................................................................. 41 3.4 Research Strategy.................................................................................................... 42 3.5 Time Horizon .......................................................................................................... 44 3.6 Data Collection Method.......................................................................................... 45

3.6.1 Sampling Design.............................................................................................. 45 3.6.1.1 Sampling Frame........................................................................................ 46 3.6.1.2 Sampling Technique.................................................................................. 46 3.6.1.3 Proper Sample Size ................................................................................... 49 3.6.1.4 Response Rate ........................................................................................... 50

3.6.2 Data Collection and Type of Data: Primary vs. Secondary ............................. 51 3.6.2.1 Data Collection Instrument: Questionnaire Design ................................. 51 3.6.2.2 Pilot Testing .............................................................................................. 54

3.7 The Credibility of Research Findings ..................................................................... 54

iv

3.7.1 Reliability......................................................................................................... 55 3.7.2 Validity ............................................................................................................ 57

3.8 Summary of Research Methodology ...................................................................... 57 Chapter 4 ......................................................................................................................... 59 Data Analysis and Results .............................................................................................. 59

4. Data Analysis and Results ........................................................................................ 59 4.1 Descriptive Statistics............................................................................................... 59 4.2 IT Integration .......................................................................................................... 62 4.3 Collaboration with Partners .................................................................................... 65 4.4 Performance Improvement...................................................................................... 69 4.5 Comparison between Iranian and European Firms................................................. 74

Chapter 5 ......................................................................................................................... 76 Discussion and Conclusion ............................................................................................. 76

5. Discussion and Conclusion ....................................................................................... 76 5.1 Overall Conclusions................................................................................................ 76 5.2 Theoretical Contributions ....................................................................................... 80 5.3 Managerial Implications ......................................................................................... 80 5.4 Limitations .............................................................................................................. 82 5.5 Suggestions for Future Research ............................................................................ 82

References........................................................................................................................ 83 Appendix A : Questionnaire (in English) ..................................................................... 94 Appendix B : Questionnaire (in Persian)...................................................................... 98 Appendix C : Additional Tables .................................................................................. 104

v

List of Tables Table 2-1 Supply chain performance metrics framework................................................. 28 Table 2-2 Goals of performance measurement types ....................................................... 28 Table 2-3 A guide to literature review.............................................................................. 35 Table 3-1 Relevant situations for different research strategies......................................... 44 Table 3-2 Summary of response rate ................................................................................ 51 Table 3-3 Constructs and measures .................................................................................. 53 Table 3-4 Summary of reliability estimates...................................................................... 56 Table 4-1 ERP module implementation............................................................................ 63 Table 4-2 ERP online access to supply chain partners ..................................................... 64 Table 4-3 EDI/XML linkage with supply chain partners ................................................. 65 Table 4-4 Collaboration with suppliers............................................................................. 66 Table 4-5 Collaboration with suppliers in three levels ..................................................... 67 Table 4-6 Collaboration with customers........................................................................... 68 Table 4-7 Collaboration with customers in three levels ................................................... 68 Table 4-8 Performance improvement in large firms and SMEs ....................................... 69 Table 4-9 Performance improvement in different industries............................................ 70 Table 4-10 Results of multiple regression ........................................................................ 72 Table 4-11 Comparison between Iran and Europe in collaboration with suppliers.......... 74 Table 4-12 Comparison between Iran and Europe in collaboration with customers........ 75 Table C-1 Type/scope of company or organisation........................................................ 104 Table C-2 Provision of online access for suppliers/customers ....................................... 104

vi

List of Figures Figure 1-1 A supply chain model........................................................................................ 3 Figure 2-1 The scope of collaboration: generally ............................................................... 9 Figure 2-2 Elements of supply chain collaboration .......................................................... 10 Figure 2-3 The architecture of supply chain collaboration............................................... 11 Figure 2-4 A conceptual model of supply chain collaboration......................................... 12 Figure 2-5 Context and supply chain integration.............................................................. 14 Figure 2-6 Model of internal supply chain integration ..................................................... 16 Figure 2-7 A contingency perspective of information sharing capability as a strategic enabler............................................................................................................................... 18 Figure 2-8 The connectivity-willingness matrix............................................................... 19 Figure 2-9 Conceptual model of supply chain integration and performance measures.... 24 Figure 2-10 A model for SCM performance measurement .............................................. 26 Figure 2-11 Measures and metrics at four basic links in a supply chain .......................... 27 Figure 2-12 A conceptual model for measuring internal supply chain efficiency............ 30 Figure 2-13 ISM-based model for the SCPMS implementation variables ....................... 31 Figure 2-14 Research framework...................................................................................... 32 Figure 3-1 The research onion .......................................................................................... 38 Figure 3-2 Sampling techniques ....................................................................................... 47 Figure 3-3 Understanding validity and reliability............................................................. 55 Figure 3-4 Summary of research methodology ................................................................ 58 Figure 4-1 Type/scope of company or organisation ......................................................... 60 Figure 4-2 Annual turnover .............................................................................................. 60 Figure 4-3 Number of organisational positions in different areas .................................... 61 Figure 4-4 Proportion of SMEs vs. large firms................................................................. 62

1

Chapter 1

Introduction

1. Introduction

The purpose of this chapter is to present a clear idea about the central issue of

concern in this research and why it is worth studying. Initially, an introduction is

provided in order to motivate the importance of the subject. After that, the definitions of

supply chain and its management are described. Next, the problem discussion and

purpose of the research are included.

1.1 Background

During the past decade, supply chain management (SCM) and information

technology management have attracted much attention from both practitioners and

researchers. As information technology evolves, firms tend to become more integrated.

Therefore, integrating effective supply chain practice with effective information sharing

2

becomes critical for improving supply chain performance (Zhou and Benton, 2007).

Partnering between firms is an increasingly common way for firms to find and maintain

competitive advantage. This could be occurred through extensive social, economic,

service, and technical ties over time (Mentzer et al., 2000).

According to Hakansson and Persson (2004), we can identify at least three

different trends in developments of logistics solutions within industry during past years.

First, increased integration of logistics activities across firm boundaries aimed at reducing

costs which revealed the need for closer coordination and cooperation with suppliers and

customers. The second trend characterizing emerging supply system is the increased

specialization of individual companies. Outsourcing of traditional activities including

logistics activities is an example of such trend. Finally, the third trend concerns change

and innovation. Importance of response to market changing demands has forced

companies to be more agile, responsive, and intelligent.

Companies have relentlessly restructured and reengineered to increase

organizational effectiveness and satisfy key customers. Lack of the resources and

competencies needed to achieve competitive success has led firm managers to look

beyond their companies’ organizational boundaries to evaluate how the resources of

suppliers and customers can be used to create exceptional value. Efforts to align

objectives and integrate resources across company boundaries to deliver greater value are

known as supply chain management initiatives (Fawcett and Magnan, 2002).

1.2 Supply Chain Management (SCM)

A supply chain is a network of facilities and distribution options that performs the

functions of procurement of materials, transformation of these materials into intermediate

and finished products, and the distribution of these finished products to customers

(Tarokh and Soroor, 2006).

3

Figure 1-1 A supply chain model Source: (Zhao et al., 2006)

Interest in managing supply chains is growing rapidly among companies and

researchers around the world. Although its widespread popularity leads to numerous

kinds of definitions by different industries and academics, there seems to be a

convergence towards the central theme of supply chain management (SCM). The theme

suggests that SCM is an integrative philosophy of managing flows of material,

information, and finance from the earliest supplier of raw materials to the ultimate

customer. SCM can thus be defined as the integration of key business processes from end

user through original suppliers that provides products, services, and information and

hence adds value for customers and other stakeholders (Cooper et al., 1997). Supply

chain management is a systematic, strategic coordination of the traditional business

functions within a particular company and across business within the supply chain, for

the purpose of improving the long-term performance of the individual companies and the

supply chain as a whole (Mentzer et al., 2001).

There are several other definitions for SCM. Copacino (1997); cited by Stank et al.

(2001) highlights the importance of integration:” The new vision of supply chain

management links all the players and activities involved in converting raw materials into

products and delivering those products to consumers at the right time and at the right

place in the most efficient manner”. Larson and Rogers (1998) merged various ideas into

the following definition:” Supply chain management is the coordination of activities,

4

within and between vertically linked firms, for the purpose of serving end customers at a

profit”. Bowersox et al. (1999) define SCM as “a collaborative-based strategy to link

interorganizational business operations to achieve a shared market opportunity”.

Burgess et al. (2006) had a structured review on SCM literature and state that

there exist a set of dominant characteristics: a reliance on manufacturing and consumer

goods industries for empirical as well as analytical illustration; a conceptual framing of

SCM mostly as a process; a predomination of transaction cost economics and strategy-

based competitive advantage theoretical grounding; the presence of mostly descriptive-

type theories; strong positivist paradigmatic stances in the research methods employed;

and, the utilization of analytical conceptual, as well as empirical statistical sampling and

case study methods.

1.3 Supply Chain Integration: Definition and Importance

Kahn and Mentzer (1998) have proposed one of the most widely accepted

definitions of integration:” Integration is a process of interdepartmental interaction and

interdepartmental collaboration that brings departments together into a cohesive

organization”. Bagchi et al. (2005) define supply chain integration as: “comprehensive

collaboration among supply chain network members in strategic, tactical and operational

decision-making”. Cagliano et al. (2006) suggest that supply chain integration is strictly

related to coordination mechanisms and in particular implies that business processes

should be streamlined and interconnected both within and outside the company

boundaries.

Two types or levels of integration are generally considered – internal integration

and external integration. Internal integration examines integration across various parts of

a single organization; external integration examines integration that occurs between

organizations. Within the current context, internal integration pertains to the extent to

which logistics activities interact with other intra-firm functional areas. In contrast,

external integration crosses firm boundaries and extends to the supply chain (Chen et al.,

2007). Some researchers have approached the concept from other perspectives.

According to Bowersox et al. (1999) integration in a supply chain context can be

classified into six different types: customer integration, internal integration, material and

5

service supplier integration, technology and planning integration, measurement

integration, and relationship integration. Narasimhan and Das (2001) distinguish between

customer integration, information integration, logistics and distribution integration, and

supplier integration. De Toni and Nassimbeni (1999); cited by Cagliano et al. (2006)

classify integration mechanisms into design links, quality links, and logistics links.

As firms sought to further improve their operational performance, it became

necessary to seek inter-organisational answers to logistics problems. Thus, external

solutions began to emerge (e.g. outsourcing, vendor managed inventory, etc.). Moving

ahead, firms realized that they could benefit more from wider cooperation with both

suppliers and customers at different stages in the supply chain. On the supply side, closer

cooperation with suppliers resulted in reduced costs and greater efficiency. On demand

side, quick response logistics and collaborative planning, forecasting, and replenishment

(CPFR) have been advanced to decrease lead-times and inventory. The theme of much of

this development has been on the notion of integration of activities and processes

between members of the supply chain, where a major facilitator is the reciprocity of

information (Smart, 2008). Indeed, integration is considered to be a standard requirement

for successful management of supply chains.

1.4 Problem Discussion

The conventional wisdom in most supply chain management literature is that “the

more integration, the better the performance of the supply chain” (Bagchi et al., 2005).

SCM concept is defined as “integration of business processes” (Cooper et al., 1997). Lee

(2000) argues that a truly integrated supply chain does more than reduce costs. It also

creates value for the company, its supply chain partners and its shareholders. The ideal

situation is that the entire process across the supply chain is designed, managed and

coordinated as a unit. This is also in accordance with other papers from 2000 onwards

discussing supply chain integration and performance (Stock et al., 2000; cited by Fabbe-

Costes and Jahre, 2007; Frohlich and Westbrook, 2001).

However, not everybody agrees that integration and close collaboration is the best

solution in every case. Bask and Juga (2001) believe that we need to reevaluate the

6

dominant view of integrated supply chain management and propose that polarization of

strategies in supply chains can lead to separation and give rise to semi-integration rather

than full integration. For some companies, tight integration is the answer. For others,

intensive integration might be the goal in selected areas of SCM, such as quality

management and performance measurement, while in other areas it can be beneficial to

strive for limited integration. According to the authors, the pressures in contemporary

SCM seem to be towards the opposite direction: disintegration, divergence and

differentiation. Degree of supply network dynamics and focal firm’s influence has also

proposed to classify supply chains with different levels of integration (Harland et al.,

2001). Correspondingly, Bagchi and Skjoett-Larsen (2002) suggest a contingency

approach to supply chain integration, arguing that elements such as dominance versus

balanced power in the supply chain, the maturity of the industry, the degree of

competition in the industry, and the nature of the products may specify the desired level

of integration in a supply chain.

According to the discussion mentioned above we can see that there is little

evidence of research mapping the actual level of integration among participants in a

supply chain. In fact, there are number of vague items in this context. For instance, we

are not certain about the scope of integration; that is, should firm managers be satisfied

with limited information sharing with their supply chain partners, or they would better

collaborate in different areas like manufacturing, distribution, research and development

(R&D), etc.? The role of information technology (IT) should also be clarified. Above all,

companies are much interested in knowing whether this cooperation and IT

implementation will improve their organizational performance or not.

1.5 Research Problem and Research Questions

The objective of this research is to understand the real essence of supply chain

integration; accordingly, we aim to find out the status of integration in supply chains in

Iranian firms. The main issues are: the extent to which Iranian firms have information

integration with their supply chain partners; the areas that they involve their key suppliers

7

and customers in decision-making; and, the effect of supply chain integration on firm’s

performance.

To do so, we decided to use the definition of supply chain integration that Bagchi

et al. (2005) has proposed: “comprehensive collaboration among supply chain network

members in strategic, tactical and operational decision-making”. It contains all of the

areas we want to investigate. As a result, the subsequent research questions have been

formulated:

• To what extent do Iranian firms have information integration with their supply

chain partners and what role information technology plays in supply chain

integration?

• In which areas and to what extent do such firms involve key suppliers and

customers in decision-making?

• How does supply chain integration affect performance? 1.6 Conclusion

In this chapter we investigated about the background of supply chain management

(SCM) and supply chain integration and understood various perspectives and definitions

of these critical subjects. Then, we discussed about problem area and clarified our

research problem. Eventually, research questions are formulated.

8

Chapter 2

Literature Review

2. Literature Review

This chapter will give an overview of past research in specific dimensions of

supply chain integration that are related to the research problem. First, different

concepts of intra- and inter-organizational collaboration are discussed. Association of

information technology and integration is then presented in two categories, information

sharing and information integration tools. Next, literatures about performance

measurement systems in the context of supply chain will be reviewed, and finally,

research framework is presented.

2.1 Collaboration as a Means of Interfirm Integration

The term “Collaboration” is still embryonic in the context of supply chain and

authors has had different approaches towards it. Perhaps the most referred one is

collaborative planning forecasting and replenishment (CPFR) (Simatupang and Sridharan,

2005; Barratt, 2004; Skjoett-Larsen et al., 2003; Stank et al., 1999).

9

To shed light on some of the ambiguities about collaboration, Barratt (2004)

attempts to present a deeper understanding of some basic issues. First, he argues that

there are many questions which the answer would show the need to internal or external

collaboration between partners, namely: focusing solely on activities like planning and

ignoring other related activities such as forecasting or replenishment; running

inappropriate promotions; poor communication throughout organisation; organisations’

little understanding of their own processes; conflicts due to different performance

measures in different part of supply chain; poor decision-making due to large amount of

information from various sources, etc. Second, there are various places where we can

collaborate in the supply chain. Generally we can either have vertical or horizontal

collaboration (see figure 2-1). According to Fawcett and Magnan (2002) in terms of

vertical collaboration, what has been observed is that even among the best supply chain

companies, integrative practice tends to span only a triad of companies – typically the

company plus one tier up and downstream. Third, it is also important that we understand

whom should we collaborate with. Collaboration is not just about developing close

information exchange based relationships at an operational level of activity, but also

needs to be implemented at tactical and strategic levels in the organisations across the

supply chain (Vereecke and Muylle, 2006). This is in line with what Bagchi et al. (2005)

has proposed as the basic definition for their supply chain integration research.

Figure 2-1 The scope of collaboration: generally Source: (Barratt, 2004)

10

Finally, elements of supply chain collaboration are categorized in three categories

(see figure 2-2): cultural elements includes collaborative culture, internal and external

trust, mutuality, information exchange, and openness and communication. Second

category represents the needed elements for collaboration to succeed: cross functional

activities, process alignment, joint decision-making, and true supply chain metrics. The

last group presents a number of strategic elements for the collaboration to be sustainable:

resources and commitment, intra-organisational support, the corporate focus,

demonstrating the business case, and the role of technology.

Figure 2-2 Elements of supply chain collaboration Source: (Barratt, 2004)

Simatupang and Sridharan (2005) defined collaboration as close cooperation

among business partners or units engaging in joint efforts to meet end customer needs

with lower costs and suggest that supply chain members should have reciprocal approach

towards collaboration. As shown in figure 2-3, they propose a collaborative supply chain

framework including five features: collaborative performance system, decision

11

synchronization, integrated supply chain processes, incentive alignment, and information

sharing. The framework expresses how different elements of collaborative supply chain

can affect each other to achieve better performance; for instance, if information sharing is

able to provide relevant, accurate, and timely data for effective decision-making, then the

two-way link between information sharing and decision synchronization is significant.

Figure 2-3 The architecture of supply chain collaboration Source: (Simatupang and Sridharan, 2008)

According to Min et al. (2005) there are two primary conceptualizations of

collaboration. First, collaboration as an interorganizational business process where

partners work together toward common goals that mutually benefit them (Mentzer et al.,

2001; cited by Min et al., 2005) and processes include joint decision-making (Stank et al.,

2001), joint problem-solving (Spekman et al., 1997; cited by Min et al., 2005), etc.

Second, collaboration has been viewed as a foundation of interorganizational

relationships which parties involved work together and share information, resources, and

12

certain degrees of risk in order to accomplish mutual objectives (Bowersox et al., 2003;

cited by Min et al., 2005).

Based on empirical data from surveys and in-depth interviews, Min et al. (2005)

proposed a conceptual model for supply chain collaboration (see figure 2-4) which covers

progression of such relationships including antecedents, collaboration, and consequences.

Figure 2-4 A conceptual model of supply chain collaboration Source: (Min et al., 2005)

Regarding antecedents, strategic intent expresses the necessity for capability-

based functional integration, internal alignment is achieved through process mapping and

streamlining internal operation, relationships should be ongoing and long-term oriented

and investments should be put on time, personnel, employee training, physical resources,

and information technology. There should be free flow of information and formalization

represents the need for performance metrics, goals and objectives, roles, responsibilities,

reporting mechanisms, collaborative planning and scheduling, collaborative technology,

and specified type of shared information (Min et al., 2005).

13

Respecting the nature of collaboration, information sharing should be utilized for

forecasting issues, recognizing customer demands and materials requirements, designing

marketing plans, and scheduling. Mutual sales and performance targets, budgeting, and

prioritizing goals and objectives will be obtained through joint planning. Joint problem

solving comprises product development/redesign, logistics issues (shipping, routing,

backhauling, pallet size, packaging, etc.), and marketing support (marketing materials,

delivery schedule, store display, etc.). Another element is joint performance measurement

which indicates performance reviews on a regular basis, measuring KPI (customer

service, cost savings, productivity, etc.), and determining rewards and taking corrective

actions. Finally channel members should leverage their resources and capacity, skills and

knowledge, and specialization. Consequences of such a collaborative model would result

in efficiencies like cost reduction, reduced inventory, shortened lead-time, and

streamlined supply chain processes. Effectiveness can be viewed as improved customer

service, increased market share, better pricing, and new product development.

Profitability depends on increase in return on investment and sales per target segment.

Trust, commitment, interdependent, and mutual involvements are considered as factors of

relationship reinforcement and expansion (Min et al., 2005).

Towill et al. (2002) state that there is a relatively slow diffusion dynamics of

SCM in the real world. Their study of 20 European automotive supply chains revealed

that only 10 percent approach seamless integration. A framework was also proposed in

order to identify process uncertainties for reengineering. It is shown that reduction of

uncertainties in different levels of process, supply, and demand will result in various

degrees of functional, internal, and external integration.

Van Donk and Van der Vaart (2004); cited by Van Donk et al. (2008) distinguish

between simple (high volume, low product variety, large batches, make-to-stock, and

costs as a major order-winner) and complex (low volume, high product variety, small

batches, make-to-order, and flexibility among the main order-winners) business

conditions. Complex conditions correspond with a high level of uncertainty within the

supply chain. They state and empirically show that only complex business conditions

require a high level of supply chain integration. However, they also show that shared

14

resources (capacity used to serve different customers) limit the possibilities to perform

integration while buyer focus (singling out capacity for the purpose of serving one

customer) is an enabler for supply chain management integration. A combination of

uncertainty and shared resources is seen as one of the most difficult ones and it seems

that many food manufacturers are exactly in that position. Figure 2-5 summarizes the

above relationships.

Figure 2-5 Context and supply chain integration Source: (Van Donk and Van der Vaart, 2004)

Based on the taxonomy presented in figure 2-5, Van Donk et al. (2008) has

recently investigated the limitations and barriers of supply chain integration in food

industry. Four basic integration strategies are introduced to overcome problems naturally

exist in food supply chains: when there are volume uncertainties or capacity is used for

several buyers, it is suggested that manufacturers concentrate on buyer-focused or virtual

buyer-focused operations. If processing and packaging are not fully decoupled or there

are different demand characteristics for buyers then it is better to use aggregated

hierarchical planning; and, in case of uncertainties in the market, frequent scheduling

caused by production, or high complexity of the plant, it is suggested that integrated

planning and scheduling should be implemented.

15

Fawcett and Magnan (2002) tried to find the reality of supply chain integration in

an empirical study among managers from purchasing, manufacturing and logistics in the

USA. The study revealed that the notion of integration from suppliers’ supplier to

customers’ customer does not resemble the theories. It is said that ”…the end-to-end

transparency needed to understand and manage the entire supply chain simply has not

materialized for the vast majority of supply chains…”. The integration is usually defined

amongst focal company and its first-tier supplier/customer and management of beyond

tiers is handed over to first-tier members.

An international study of supply chain integration strategies was conducted by

Frohlich and Westbrook (2001). They define direction (towards customers and/or

towards suppliers) and degree (extent of integration) for shared operational activities and

call it “Arc of Integration”. To explore the extent to which organizations integrate their

activities with their suppliers and customers, five valid types of strategies are introduced:

inward-facing, periphery-facing, supplier-facing, customer-facing, and outward-facing.

They conclude that companies with the greatest arcs of supplier and customer integration

will have the largest rates of performance improvement.

Other areas of integration have also been investigated. For instance, Ragatz et al.

(1997) suggest that integration of suppliers into new product development lead to

significant performance improvement and competitive advantage. Two sets of

differentiators are proposed to minimize or overcome the obstacles in achieving such

integration: relationship structuring (buyer’s top management commitment, shared

education and training, joint agreement on performance measures, confidence in

supplier’s capability, formalized risk/reward sharing, formal trust development practices,

and supplier’s top management commitment ), and asset allocation (intellectual-, human-,

and physical asset). As shown in figure 2-6, Pagell (2004) offers a model of internal

supply chain integration across operations, purchasing, and logistics. McAdam and

16

McCormack (2001) performed a qualitative study of the relationship between managing

Figure 2-6 Model of internal supply chain integration Source: (Pagell, 2004)

business processes and managing supply chains. They explored that only few firms

actually using the integration of business processes in their supply chains. The two areas

were treated separately and most business process management techniques were applied

to one member of the supply chain and their links with immediate suppliers and

customers.

2.2 Information Technology and Integration

In this section we will review the role of IT integration in supply chains from two

perspectives: information sharing and information integration tools.

2.2.1 Information Sharing

In recent years numerous studies have emphasised the importance of information

sharing within the supply chain (Simatupang and Sridharan, 2008; Yao et al., 2007,

Bagchi and Skjoett-Larsen, 2002; Mentzer et al., 2000; Stank et al., 1999). While there is

no doubt that information technology can reduce costs, the formation of a business model

and utilization of information is also crucial (Trkman et al., 2007). Mentzer et al. (2000)

have seen information sharing as one of the enablers of partnering implementation and

state that collection, creation, management, and communication of information are

critical to the efficiency, effectiveness, and competitive advantage of any supply chain.

Simatupang and Sridharan (2002) discuss that this flow of data enhances visibility across

17

both internal functions and organizations. It is said that variety of data is usually shared

between members like resource availability (e.g., capacity, inventory, etc.), status of

performance (e.g., time, quality, costs), status of processes (e.g., forecasting, ordering,

delivery, replenishing), and the status of contract. They believe that information sharing

can benefit members at both strategic and tactical levels where mutual understanding of

competitive advantage, lessening demand uncertainty, and joint decision-making are at

the heart of collaboration. According to Yu et al. (2001) uncertainties rise when perfect

information can not be secured; therefore, by augmenting shared data between all

participating members of supply chain which leads to whole system improvement,

uncertainty and consequently negative impacts of bullwhip effect, a phenomenon where

orders to supplier tend to have a larger variance than sales to the buyer, can be reduced or

eliminated.

Vendor-managed inventory (VMI) and CPFR are the partnership programs

primarily developed to encourage retailers to share information. VMI, also known as

continuous replenishment or supplier-managed inventory, is one of the most widely

discussed partnering initiatives for encouraging collaboration and information sharing

among trading partners where vendor decides on the appropriate inventory levels of each

of the products and suitable policies to maintain those levels. However, retail-level

information is one of the major limitations of VMI system. This is due to the fact that

retailers are closer to the marketplace and consequently have better knowledge about

consumers, but they are not usually involved in demand forecast process in typical VMI

programs. CPFR, on the other hand, could be seen as the solution for the problems that

are encountered in adaptation of VMI because it requires all supply chain partners to

jointly develop demand forecasts, production and purchasing plans, and inventory

replenishments (Sari, 2008). The role of information sharing from CPFR perspective is

discussed in many other studies (Skjoett-Larsen et al., 2003; Stank et al., 1999; Mentzer

et al., 2000).

Zhou and Benton (2007) have considered three aspects of information sharing:

information sharing support technology, information content, and information quality.

Information sharing support technology includes the hardware and software needed to

support information sharing. Information content refers to the information shared

18

between manufacturers and customers. Information quality measures the quality of

information shared between manufacturers and customers (e.g. accuracy, recency,

frequency, etc.). Fawcett et al. (2007) state that many organizations have only focused on

technological side of information sharing and did not get desired returns on their

investment and believe that this is due to lack of investment on organizational culture.

Accordingly, the research evaluates the role of information sharing capability in two

dimensions – willingness and connectivity - towards operational and competitive

performance improvement (see figure 2-7).

Figure 2-7 A contingency perspective of information sharing capability as a strategic enabler Source: (Fawcett et al., 2007)

As depicted in figure 2-8, their interview with various companies has led to

introduction of two-by-two connectivity-willingness matrix. For example in quadrant IV

where levels of connectivity and willingness are both high, relationships are strategic and

built on high levels of trust; accurate data about joint decision-makings are shared in a

timely basis; and, opportunities are available for high levels of collaboration.

Other subjects have also drawn attention regarding information sharing. For

example, advantages of information sharing and replenishment co-ordination for supply

chain members are said to be: (1) sharing information alone would provide cost savings

and inventory reduction for supplier, but it would not benefit retailer much; (2)

combining information sharing with replenishment co-ordination would result in cost

savings and inventory decrement for both retailer and supplier; (3) the underlying

19

demand process would significantly influence the magnitude of cost savings and

inventory reductions associated with information sharing and replenishment co-

ordination (Lee et al., 1996; cited by Zhao et al., 2002).

Figure 2-8 The connectivity-willingness matrix Source: (Fawcett et al., 2007)

2.2.2 Information Integration Tools

Nowadays, companies are trying to improve their agility level with the objective

of being flexible and responsive to meet the changing market requirements. In an effort to

achieve this, many companies have decentralized their value-adding activities by

20

outsourcing and developing virtual enterprises (Gunasekaran and Ngai, 2004). All of

these highlight the importance of information technology and its infrastructure in

integrating partnering firms in supply chain.

2.2.2.1 Enterprise Resource Planning (ERP) Systems

Enterprise resource planning (ERP) was created from development of its

predecessor’s software applications, material requirements planning (MRP) and

manufacturing resource planning (MRP II). In the late 1960s MRP was born through a

joint effort between some machinery manufacturers and IBM corporation and was a state-

of-the-art method for planning and scheduling materials for complex manufactured

products. MRP II was developed in 1980s with newer capabilities; In fact, the backbone

was MRP, but re-written in modern code (Jacobs and Weston Jr., 2007). ERP is defined

as a “framework for organizing, defining, and standardizing the business processes

necessary to effectively plan and control an organization so the organization can use its

internal knowledge to seek external advantage” (Blackstone and Cox, 2005; cited by

Jacobs and Weston Jr., 2007). Another definition is given by Beheshti (2006): “An ERP

system is a set of business units of an organization such as financial, accounting,

manufacturing, and human resources into a tightly integrated single system with a

common platform for flow of information across the entire business”.

Whilst many benefits of ERP implementation like eliminating redundancies

usually occur in separate legacy systems, transferring from functionally oriented

organizations to process oriented ones, standardisation of business applications, and more

agile supply chain are cited in different studies (Swafford et al., 2008; Beheshti, 2006;

Akkermans et al., 2003), failure cases should also been concerned. Ke and Wei (2008)

have investigated the role of leadership and organizational culture in implementation of

ERP system. They state that ERP implementation imposes a great challenge on an

adopting organization to foster a culture that is conductive to its success. It is also said

that top management actions (e.g. right strategic vision of ERP adoption, setting up

learning structures, dispensing contingent rewards, etc.) can manipulate organizational

culture. Impact of ERP on SCM was investigated by Akkermans et al. (2003) and

findings show that there are: (1) SCM opportunities for ERP: mass customization,

21

standardization, and global IT usage; (2) SCM shortcomings of current ERP systems:

lack of extended enterprise functionality, lack of flexibility in adapting to changing

supply chain needs, lack of advanced decision support capabilities, and lack of open,

modular system architecture. Another research about ERP implementation was also

conducted in Swedish firms by Olhager and Selldin (2003). Results show that there is a

high adoption of ERP systems within Swedish manufacturing firms; in addition, core

production management modules involved in the customer order process and also

financial accounting and control have recognised to be the most implemented modules. In

an attempt to find impact of ERP on corporate performance, Hendricks et al. (2007)

discovered that early adopters of ERP systems has stronger improvements in profitability

but not in stock returns.

2.2.2.2 Adoption of EDI / XML Technologies in Supply Chain

Electronic data interchange (EDI) is a rapidly growing technology, even though it

has been widely available since the beginning of the 1980s (Lim and Palvia, 2001). It is

defined as “the direct computer-to-computer communication of inter-company and intra-

company business documents in a machine-readable standard format” (Crum et al., 1998).

Agi et al. (2005) call it a type of inter-organizational information technology that enables

trading partners to exchange data automatically between their information systems. Lim

and Palvia (2001) state that in addition to general benefits of EDI like faster processing

speed, greater accuracy, reduced costs, competitive advantage, improved operations,

security, tracking and control, etc., there are also positive impacts on customer service.

Their study revealed that product availability, order cycle time, and distribution system

(malfunction, flexibility, and information) was improved through EDI implementation.

Machuca and Barajas (2004) presented the same positive impact on decreasing bullwhip

effect and supply chain inventory costs. Widely-usage of EDI in food and automotive

industry is also probed in other studies; for instance, an empirical research in the food

industry showed that while most firms use EDI for the frequent and routine transactions,

invoices, and purchasing orders, they are not using it for coordinated activities like

transferring schedules, production, and sales; moreover, companies tend to do more EDI

22

activities with their customers than their suppliers (Hill and Scudder, 2002). Small and

medium-sized enterprises (SMEs) in automotive industry have also lots of opportunities

in implementing EDI systems with their supply chain partners (Tuunainen, 1999).

The extensible markup language (XML) was developed by the World Wide Web

Consortium (W3C) in 1998 and defined as “data format for structured document

interchange on the web” (Buxmann et al., 2002). Owing to the rapid development of

XML in recent years, enterprises have set operating standards for their electronic

document-interchange procedures using XML format. This has improved the efficiency

of data interchange (by allowing users to define and describe document formats and

structures) between enterprises, and has led to the role of EDI in this field becoming

much diminished (Fu et al., 2007).

A study of 329 European companies by Nurmilaakso (2008) suggests that firm

size, employee skills, and e-business functions has positive influence on moving from

EDI-based to XML-based e-business frameworks in supply chain integration;

furthermore, XML-based e-business frameworks has more effect on the adoption of e-

business functions.

2.3 Supply Chain Performance

Supply chain performance and effective management of supply chains have been

increasingly recognized as critical factors in gaining competitive advantage for firms

(Sezen, 2008). Different aspects of supply chain performance have been discussed by

both scientists and practitioners in recent years; however, most of these studies have

focused on two major areas. First, determining factors that explain why some supply

chain performances are better off; second, proposition of measurement systems for

supply chain performance. In the next section we review these two categories.

2.3.1 Enablers of Efficient Supply Chain

According to Zhao et al. (2002), among many factors that can influence the

performance of a supply chain is forecasting. This is because under demand uncertainty,

23

supply chain members can not plan and decide on their inventory and production; thus,

sharing information for predicting matters seems to be decisive within supply chain

partners. They studied the interactions between inventory replenishment decisions by

retailers and production decisions by suppliers based on a simulated model. Their

assessment exposed that information sharing can significantly influence supply chain

performance, and sharing future order information with supplier is more beneficial than

sharing only the future demand information. It is also said that, while data sharing is

usually useful for suppliers in different situations, it can be harmful in terms of cost and

service level for retailers especially when capacity is low. Effect of information sharing

on performance is partly supported by Fawcett et al. (2007). As discussed earlier in

section 2.2.1, they evaluated the impact of information sharing capability in two

dimensions- willingness and connectivity – on operational and competitive performance.

Despite the slight influence on competitive performance, both affect the operational

performance (willingness had stronger effect). Jonsson and Gunnarsson (2005) elaborate

on how internet can be used as an enabler to create customer value and effectiveness for

supply chain members by developing integrative logistics operations. The research

implies that three routes can be considered for this purpose: (1) from business strategy

perspective, supply chain partners are striking for utilizing internet in order to link

shortfalls in logistics operations; however, there are deficiencies at the beginning, (2) a

gradual increase in efficiencies emerges in form of intensified external customer-

perceived value, and (3) application of internet in this stage is seen as an instrument for

continuous cost reduction, rationalization of transaction sequences, and process

streamlining. They see these three principles as a short-term strategy for enhancing

supply chain performance.

A longitudinal assessment of an integrated supply chain was conducted to see the

impact on overall organizational performance (Elmuti et al., 2008). Elements of

integration are shown in figure 2-9. Results disclosed that SCM activities through such

model allows companies to reduce cost, improve quality, and reduce cycle time, and

leads to productivity enhancement due to decreased inventory and external failure costs.

Improved delivery dependability, lower costs, and flexibility lead to superior levels of

customer satisfaction, which result in higher sales and organisational performance.

24

According to Sezen (2008), companies should pay attention to supply chain design in

addition to integration and information sharing to achieve efficient and effective supply

chain. Supply chain design involves decisions about number of suppliers, proximity to

suppliers, supplier selection and evaluation, planned capacities in each facility, definition

of contractual terms, and reactions to the possible disagreements between channel

members. Supply chain performance measures are flexibility-, resource-, and output

performance. His study of 125 manufacturing firms in Turkey revealed that supply chain

design has higher influence on supply chain performance measures compared to

integration and information sharing. However, flexibility performance is more affected

by information sharing than that of supply chain design.

Figure 2-9 Conceptual model of supply chain integration and performance measures Source: (Elmuti et al., 2008)

Kim (2006) investigated the interrelationships among SCM practices, level of

supply chain integration, and competition capability plus examination of these constructs’

impact on performance. Their empirical study of numerous small and large firms showed

25

that the level of effect on performance can be different based on the intensity between the

three constructs. While efficient integration in small firms can cause performance

improvement, close interrelationship between SCM practice and competition capability

have more significant effect on performance advancement in large firms. Narasimhan and

Kim (2002) stress that supply chain strategies depend on product and market

characteristics. They found that internal and external integration across supply chain

positively moderate the relationships between product diversification and performance,

and between international market diversification and performance. Zailani and Rajagopal

(2005) explain more about impacts of supply chain integration on performance by study

of companies in East Asia and USA. In a comprehensive survey of European firms,

Bagchi et al. (2005) uncover that over sixty percent of respondents approved some

improvements in order fulfilment and lead-time after integration. Other performance

metrics such as production flexibility, inventory turnover ratio, and rate of returns were

seen to have significant positive correlation with factors like involvement of key

suppliers in supply chain design. Tan et al. (1999) found positive association between

SCM issues (firm’s competitive environment and management responsiveness, use of

total quality management (TQM) tools and practices, effective management of the supply

base, and customer relation focus) and high levels of performance. Fynes et al. (2005)

suggest that adaptation (or investment in transaction-specific investments) leads to an

improvement in product quality and cost decrement but has no effect on flexibility or

delivery performance. Results of a case study by Bartlett et al. (2007) demonstrate that

exchange of high-quality information as part of an improvement initiative does lead to

significant improvements in the overall performance of supply chain; more precisely,

improvements observed through high visibility across capacity planning, material

ordering, and inventory management.

Lee et al. (2007) discuss the impact of supply chain linkages in upstream, internal,

and downstream parts on performance (see figure 2-10). The two indicators of

performance were selected as cost-containment (i.e. cost of in and outbound activities,

warehousing, inventory-holding, and increasing asset turnover) and performance

reliability (i.e. order fulfilment rate, inventory turns, safety stocks, inventory obsolesces,

and number of product warranty claims). They define supply chain linkage as planning

26

and executing an integrated business process and operations in supply chain through

information technology. Customer linkage is concerned with planning and implementing

successful connection between providers and recipients; supplier linkage deals with

involving suppliers in activities like new product design, production planning, inventory

management, etc.; internal linkage means easy access to key operational data, integrated

database, inventory status, etc. The study points out that internal linkage is a primary

determinant of cost-containment performance and supplier linkage is a key indicator of

performance reliability as well as overall performance. It is also found that e-ordering and

a fast and easy ordering system are critical factors of customer linkage for enhancing

SCM cost-containment and reliability performance.

Figure 2-10 A model for SCM performance measurement Source: (Lee et al., 2007)

McCarthy and Golicic (2002) express the coalition between collaborative

forecasting and supply chain performance. Their study of three firms reveals that

collaborative forecasting results in increased responsiveness, increased product

availability assurance, and optimized inventory and associated costs which totally leads

to increased revenues and earnings. In accord with Stank et al. (2001), internal and

external collaboration have distinctive association with logistical service performance.

They offer that internal collaboration significantly influences logistical service

performance, but this is not supported for the link between external collaboration and

performance. Furthermore, external collaboration with supply chain entities will increase

internal collaboration. This indicates that if firms want to enhance service performance

via collaboration with external customers and suppliers, they need to improve their

internal collaboration. This is in line with the research that have been conducted by Chen

27

et al. (2007) and shows that marketing/logistics collaboration have no direct impact on

firm performance when firm-wide integration is considered. Instead, it is true via

mediation of firm-wide cross-functional integration. However, there are number of

studies which exposed little evidence of support for collaboration’s effects on

performance improvement (Vereecke and Muylle, 2006; Stank et al., 1999).

2.3.2 Performance Measurement Systems

According to Gunasekaran et al. (2001) there is a need for performance

measurement system and metrics in a supply chain for two reasons; first, lack of a

balanced approach (existence of different performance measures e.g. financial,

operational, etc.); second, lack of a clear distinction between metrics at strategic, tactical,

and operational levels. To create such a comprehensive measurement system, they

defined metrics in above mentioned levels and then ,as depicted in figure 2-11, put them

in a framework of four basic links of integrated supply chain (plan, source,

make/assemble, and delivery/customer). A complementary framework is also proposed

by the authors in 2004 (see table 2-1).

Figure 2-11 Measures and metrics at four basic links in a supply chain Source: (Gunasekaran et al., 2001)

28

Table 2-1 Supply chain performance metrics framework Source: (Gunasekaran et al., 2004)

Beamon (1999) state that resource-, output-, and flexibility measures are the three

main components of a supply chain performance measurement system (see table 2-2) and

identify sub-measures for each type. These are listed below:

• Resource measures: total cost, distribution cost, manufacturing cost,

inventory cost, return on investment (ROI)

• Output measures: sales, profit, fill rate, on-time deliveries,

backorder/stockout, customer response time, manufacturing lead time,

shipping errors, customer complaints

• Flexibility measures: volume flexibility, delivery flexibility, mix

flexibility, new product flexibility

Table 2-2 Goals of performance measurement types Source: (Beamon, 1999)

29

Chan and Qi (2003) propose a process-based approach to measure the

performance of a supply chain. They believe that process-based measurement provides

opportunity with timely information to enhance integration and improvement of cross-

organizational processes. A process consists of a set of activities, each of which performs

a specific set of functions. It is suggested to take a seven step procedure to analyze and

decompose processes into sub-processes and activities and to link goals to every single

process or activity. Performance of activity (POA) method is based on the concept that

each process or activity consumes resources as inputs, add value to the materials and

products, and provide services as outputs. Based on POA concept, authors offer a metrics

board that includes a board of performance metrics, each of which represents one of the

dimensions of activity performance. It covers both inputs and outcome and also tangible

and intangible items. Those are: cost, time, capacity, capability (effectiveness, reliability,

availability, and flexibility), productivity, utilization, and outcome. It is clear that some of

the metrics (i.e. effectiveness, reliability, availability, and flexibility) are intangible and

can not be directly measured; thus, they should be converted into measurable indicators.

For instance, flexibility can be measured in terms of volume flexibility, etc. However,

authors recommend that financial performance metrics such as net profit and market

share are not necessary to be mentioned in metrics board and better to be used in

assessing the holistic performance of entire supply chain.

Wong and Wong (2007) developed a tool to measure internal supply chain

efficiency by using data envelopment analysis (DEA). DEA is a non-parametric method

based on linear programming technique to evaluate the efficiencies of the analyzed units.

Figure 2-12 shows a conceptual model for the study. Supply chain operations reference

(SCOR) metrics are in areas of financial (revenue and cost) and operational (on-time

delivery rate, internal manufacturing capacity, and cycle time). Generally, DEA measures

the relative efficiency of each decision-making unit (DMU) in comparison with other

DMUs. An efficiency score of a DMU is generally defined as the weighted sum of

outputs divided by the weighted sum of inputs, while weights need to be assigned. DEA

model computes weights that give the highest possible relative efficiency score to a DMU

while keeping the efficiency scores of all DMUs less than or equal to 1 under the same

set of weights. This method is suitable to be applied for supply chain performance

30

measurement because it can handle multiple inputs and outputs and it does not require

prior unrealistic assumptions on the variables which are inherent in typical supply chain

optimization models (i.e. known demand rate, lead time, etc.). It helps managers to

recognise inefficient operations and take right actions toward them. The results from

study of various companies also show that not all technically efficient companies are cost

efficient.

Figure 2-12 A conceptual model for measuring internal supply chain efficiency Source: (Wong and Wong, 2007)

Recently, Charan et al. (2008) identified the variables affecting the supply chain

performance measurement system (SCPMS) implementation. Interpretive structural

modelling (ISM) approach has been employed to analyze the interactions between

measurement variables. The research presents a hierarchy of actions to be taken for

successful implementation of SCPMS (see figure 2-13).

31

Figure 2-13 ISM-based model for the SCPMS implementation variables Source: (Charan et al., 2008)

2.4 Theoretical Framework

In order to get an overall view of the state of supply chain integration in Iran, this

study aims at evaluation of three fundamental criteria which represent integration-related

constructs in most reviewed literature; that is, interfirm integration, IT integration, and

supply chain performance. Figure 2-14 illustrates the classification of these categories.

Next section will present a discussion about each dimension.

32

Figure 2-14 Research framework

2.5 Supply Chain Dimensions in Relation with Integration

Decision-making

Many researchers have recognized weak integration as a result of poor mutual

decision-making between supply chain members. Barratt (2004) state that large amount

of information from various sources can cause traditionally managed firms to make poor

decisions. He introduces joint decision-making as one the most crucial elements of

collaboration in his proposed framework. This is in line with the structure offered by

Simatupang and Sridharan (2005). They define decision synchronization as the extent to

which the chain members are able to orchestrate critical decisions at planning and

execution levels for optimizing supply chain profitability. It is believed that the

importance of decision synchronization lies in the fact that the chain members have

different decision rights and expertise about supply chain operations which may result in

conflicts among them. Therefore, members need to coordinate critical decisions that

affect the way they achieve better performance.

Supply Chain Relations

Strong relationships with key suppliers and customers have seen as one of the

most important antecedents of gaining supply chain collaboration. It is believed that

Supply Chain Integration

Interfirm Integration

IT Integration Performance

Decision-making

Supply Chain Relations

ERP System Implementation

and Access

Other Automated

Systems

IT Linkages Performance Measurement

33

relationships should be ongoing and long-term oriented. Investments also should be put

on time, personnel, employee training, physical resources and information technology

(Min et al., 2005).

Ford et al. (2002) also state that a relationship can provide the following benefits

for both customer and supplier:

• It eliminates the costs of searching for new customers or suppliers.

• It enables the marketer to learn about a customer’s problems and

uncertainties, as well as learn what abilities the customer can offer the

supplier in return.

• It reduces the costs of adaptations, once the initial investments have been

made in the relationship.

• It reduces the costs of interaction, such as time spent in selling and

buying and checking deliveries, etc.

ERP System Implementation and Access

Organisations can derive value from their ERP implementations through a

programme of continuous business improvement both within the enterprise and by

extending processes to partners. With respect to supply chain integration, internet

technologies have opened enormous possibilities for organisations to share data.

However, the adoption of an integrated approach throughout the supply chain requires a

trade-off between autonomy and control between each supply partner relationship.

Partners in virtual integration need to be willing to allow other members to view and

access their system and processes (Burca et al., 2005). Furthermore, Benefits of ERP

implementation like eliminating redundancies usually occur in separate legacy systems,

transferring from functionally oriented organizations to process oriented ones,

standardisation of business applications, and more agile supply chain are cited in

different studies (Swafford et al., 2008; Beheshti, 2006; Akkermans et al., 2003).

IT Linkages

The diffusion of electronic data interchange (EDI) is increasing rapidly due to

streamlining business processes and saving time to gain a competitive edge. Indeed,

34

efficient coordination systems between companies such as just-in-time or ECR, rely

heavily on the electronic coordination between the transaction partners (Prosser and

Nickl, 1997). In the context of SCM, the term integration relates to how closely,

particularly at their interfaces, supply chain entities operate as a single unit; so, EDI is

important since it facilitates frequent and automatic transfers of information required for

high degrees of integration and coordination within the supply chain (Hill and Scudder,

2002).

Newly-born XML has also attracted many firms to integrate their business

processes with its capabilities namely high flexibility for defining standards between

parties. Nurmilaakso (2008) suggests that firm size, employee skills, and e-business

functions has positive influence on moving from EDI-based to XML-based e-business

frameworks in supply chain integration.

Performance Measurement

For firms to meet their objectives, the output of the processes enabled by the

supply chain must be measured and compared with a set of standards (Gunasekaran et al.,

2004). They cite that performance measurement and metrics have an important role to

play in setting objectives, evaluating performance, and determining future courses of

actions. Given the inherent complexity of a typical supply chain with four echelons

(supply, manufacturing, distribution, and consumer), selecting appropriate performance

measures for supply chain analysis is particularly critical, since the system of interest is

generally large and complex (Beamon, 1999).

2.6 Frame of Reference

To give a holistic view, table 2-3 summarises the literature that has reviewed in

three major areas of our research: collaboration, IT integration, and supply chain

performance.

35

Table 2-3 A guide to literature review

Supply Chain Integration Issue Reviewed Literature

Collaboration IT Integration Performance

Agi et al. 2005

Akkermans et al. 2003

Bagchi and Skjoett-Larsen 2002

Bagchi et al. 2005 Barratt 2004

Bartlett et al. 2007 Beamon 1999 Beheshti 2006

Burca et al. 2005

Buxmann et al. 2002

Chan and Qi 2003 Charan et al. 2008 Chen et al. 2007 Crum et al. 1998

Elmuti et al. 2008 Fawcett and Magnan 2002

Fawcett et al. 2007 Ford et al. 2002 Frohlich and Westbrook 2001 Fu et al. 2007

Fynes et al. 2005 Gunasekaran and Ngai 2004

Gunasekaran et al. 2001 Gunasekaran et al. 2004 Hendricks et al. 2007

Hill and Scudder 2002

Jacobs and Weston Jr. 2007

Jonsson and Gunnarsson 2005 Ke and Wei 2008

Kim 2006

36

Lee et al. 2007 Lim and Palvia 2001

Machuca and Barajas 2004

McAdam and McCormack 2001

McCarthy and Golicic 2002 Mentzer et al. 2000 Min et al. 2005

Narasimhan and Kim 2002 Nurmilaakso 2008

Olhager and Selldin 2003

Pagell 2004 Prosser and Nickl 1997 Ragatz et al. 1997 Sari 2008

Sezen 2008 Simatupang and Sridharan 2005

Simatupang and Sridharan 2002

Simatupang and Sridharan 2008

Skjoett-Larsen et al. 2003

Stank et al. 1999 Stank et al. 2001 Swafford et al. 2008

Tan et al. 1999 Towill et al. 2002

Trkman et al. 2007

Tuunainen 1999

Van Donk et al. 2008

Vereecke and Muylle 2006 Wong and Wong 2007 Yao et al. 2007

Yu et al. 2001

Zailani and Rajagopal 2005 Zhao et al. 2002

Zhou and Benton 2007

37

Chapter 3

Research Methodology

3. Methodology

This chapter outlines the methodology that was used for our research and

theoretical foundations behind the approaches and their definitions to be understood. It

contains research philosophy, research purpose, research approach, research strategy,

time horizon, data collection method, and credibility of the research findings. At last, a

summery of research methodology is presented.

Early in any research study, one faces the task of selecting the specific design to

the use. A number of different design approaches exist but, unfortunately, no simple

classification system defines all the variations that must be considered (Cooper and

Schindler, 2003). Many researchers start thinking of their study considering various

methods of gathering data (i.e. questionnaire, interview, etc.), but as depicted in figure 3-

38

1, this process is believed to be at the centre of research onion; indeed, the questions of

research methods are of secondary importance to questions of which paradigm is

applicable to your research (Saunders et al., 2007).

Figure 3-1 The research onion Source: (Saunders et al., 2007)

3.1 Research Philosophy

Research philosophy relates to the development of knowledge and the nature of

that knowledge. The research philosophy that one’s adopt contains important

assumptions about the way in which he/she view the world. These assumptions will

underpin the research strategy and the methods one chooses as part of that strategy

(Saunders et al., 2007). They examine three major ways of thinking about research

philosophy: epistemology, ontology, and axiology.

3.1.1 Epistemology Epistemology concerns what constitutes acceptable knowledge in a field of study

and includes three philosophies:

39

• Positivism: positioned as a natural scientist, you will prefer working with an

observable social reality and that the end product of such research can be law-

like generalisations similar to those produced by the physical and natural

scientists. Another important component of the positivist approach to research

is that the research is undertaken, as far as possible, in a value-free way. It is

frequently advocated that the positivist researcher will be likely to use a

highly structured methodology in order to facilitate replication (Gill and

Johnson, 2002). Furthermore, the emphasis will be on quantifiable

observations that lend themselves to statistical analysis. However, it is

possible to adopt some of the characteristics of positivism in your research,

and use qualitative methods.

• Realism: expresses that what the senses show us as reality is the truth: that

objects have an existence independent of the mind. It has two forms: direct

realism which says that what you see is what you get, and critical realism

which says that what we experience are sensations, the images of the things in

the real world, not the things directly.

• Interpretivism: advocates that it is necessary for the researcher to understand

differences between humans in our role as social actors. This emphasises the

difference between conducting research among people rather than objects.

3.1.2 Ontology Ontology is concerned with nature of reality and has two major aspects:

• Objectivism: portrays the position that social entities exist in reality external to

social actors concerned with their existence.

• Subjectivism: holds that social phenomena are created from the perceptions and

consequent actions of those social actors concerned with their existence.

Pragmatism also argues that the most important determinant of the research

philosophy adopted is the research question- one approach may be better than the other

for answering particular questions.

3.1.3 Axiology Axiology is a branch of philosophy that studies judgements about value. The role

that our own values play in all stages of the research process is of great importance if we

40

wish of our research results to be credible. Moreover, Heron (1996); cited by Saunders et

al. (2007) state that researchers demonstrate axiological skill by being able to articulate

their values as a basis for making judgements about what research they are conducting

and how they go about doing it.

One could miss the point by thinking that one research philosophy is ‘better’ than

another. Which is ‘better’ depends on the research question(s) we are seeking to answer.

Business and management science is often a mixture between positivist and interpretivist,

perhaps reflecting the stance of realism (Saunders et al., 2007).

In our study we want to examine Iranian firm managers’ perceptions of the supply

chain integration by means of a questionnaire-based survey which is a quantitative

method. Statistical analysis of the responses will help us to get familiar with realities of

supply chain integration; in addition, qualitative methods (e.g. early interviews for

localization of the questionnaire) are used in some of the stages. Therefore, our research

philosophy is considered to be a mixture of positivism and interpretivism.

3.2 Research Purpose

According to Cooper and Schindler (2003), research purpose can be view in two

categories, descriptive and causal. The difference between the two classes lies in their

objectives. If the research is concerned with finding out who, what, where, when, or how

much, then the study is descriptive. If it is concerned with learning why – that is, how one

variable produce changes in another- it is causal. However, Saunders et al. (2007)

classify it three categories:

• Exploratory study: is particularly useful when researchers lack a clear idea of the

problems they will meet during the study (Cooper and Schindler, 2003). It is a

valuable means of understanding what is happening; to seek new insights; to

ask questions and to assess phenomenon in new light (Robson, 2002).

• Descriptive study: in contrast to exploratory studies, descriptive studies are more

formalized and typically structured with clearly stated hypotheses or

investigative questions (Cooper and Schindler, 2003). They express that these

formal studies serve a variety of research objectives: (1) descriptions of

41

phenomena or characteristics associated with a subject population (the who,

what, when, where, and how of a topic) (2) estimates of the proportions of a

population that have these characteristics (3) discovery of associations among

different variables.

• Explanatory study: is applicable when we want to evaluate cause-effect

relationships between variables; that is, which causes produce which effects

(Yin, 1994).

As stated before, our study is set to find out and identify the underlying factors of

supply chain integration in Iranian firms. We do not have a clear idea about this scope and

many characteristics are vague. Therefore, exploratory study is appropriate for the purpose

of this research.

3.3 Research Approach

The extent to which we are clear about the theory at the beginning of our research

will guide us to one of two research approaches: deductive approach in which we develop

a theory and hypothesis (or hypotheses) and design a research strategy to test the

hypothesis, or inductive approach, in which we collect data and develop theory as a result

of data analysis (Saunders et al., 2007). They believe that deduction owes more to

positivism and induction to interpretivism, although this could be misleading. This is in

line with what Gill and Johnson (2002) proposed earlier. However, they suggest that

deductive approach (called hypothetico-deductive method) emphasizes that what is

critical in science is not the source of the theories and hypotheses that the scientist starts

out with; rather it is the process by which those ideas are tested and justified that is

crucial.

Another perspective to research approach is said to be either quantitative or

qualitative. Yin (1994) suggests that the best research method to use for a study depends

on that study’s research purpose and the accompanying research questions. He defines

them as follow:

42

• A quantitative approach implies the search for knowledge that will measure,

describe, and explain the phenomena of our reality. It is often formalized and

well structured. Quantitative research seeks to quantify the data and, typically,

applies some form of statistical analysis (Malhotra, 2007).

• A qualitative research is the search for knowledge that is supposed to investigate,

interpret, and understand the phenomena by means of an inside perspective.

Qualitative research provides insights and understanding of the problem

setting (Malhotra, 2007). It is often related to case studies, where the aim is to

receive thorough information and thereby obtain a deeper understanding of the

research problem. Furthermore, it is more effective in seeking people’s

attitude when conducted ‘open ended’ through focus groups or in-depth

interviews.

Since we want to explore the extent to which supply chains in Iran are integrated

and collaborate with each other, we reviewed literature about this area and designed

strategies to collect data regarding different involved items and analyze it to find out the

reality; thus, we use inductive approach. Moreover, tools which is used for data gathering

varies in different stages of the research, that is, we interviewed with some experts in

pilot phase to revise and localize our questionnaire and then distribute it among target

industries. As a result, we applied both qualitative and quantitative methods.

3.4 Research Strategy

According to Saunders et al. (2007), research strategy is a general plan of how to

answer the research questions that have been set. They determine these strategies as

follow:

• Experiment: classical form of research that owes much to the natural sciences

and also social sciences, particularly psychology. Malhotra and Peterson

(2006) classify it under causal research and define it as the process of

manipulating one or more independent variables and measuring their effect on

43

one or more dependent variables, while controlling for the extraneous

variables, all variables other than the independent variables.

• Survey: a structured questionnaire given to a sample of a population and

designed to elicit specific information from respondents (Malhotra and

Peterson, 2006). It is a common strategy in business research which allows the

collection of a large amount of data from a sizeable population in a highly

economical way.

• Case study: place more emphasis on a full contextual analysis of fewer events or

conditions and their interrelations (Cooper and Schindler, 2003). The situation

that give case studies a distinctive advantage occur, when a “how” or “why’

question is being asked about a contemporary set of events over which the

investigator has little or no control (Yin, 1994).

• Grounded theory: is (inductively/deductively) derived from the study of the

phenomenon it represents. That is, it is discovered, developed, and

provisionally verified through systematic data collection and analysis of data

pertaining to that phenomenon (Miller and Fredericks, 1999). The stress on

induction or deduction during this process varies due to different viewpoints

of its founders, Glaser and Strauss (1967).

• Ethnography: used to interpret the social world the research subjects inhabit in

the way in which they interpret. Malhotra and Peterson (2006) define it as the

study of human behavior in its natural context and involves observation of

behavior and setting along with in-depth interviews.

• Action research: the researcher is part of the organization within which the

research and change process are taking place.

Yin (1994) has also introduced five primary research strategies in the social

sciences: experiment, survey, archival analysis, history, and case study. Archival

information holds that the goals are to describe the incidence or prevalence of a

phenomenon. Historical method deals with past, and is used when no relevant persons are

alive to report. He declares that three conditions would determine advantages and

disadvantages of a research strategy and hence its suitability for the study (see table 3-1):

44

(1) type of research questions, (2) the extent of control an investigator has over actual

behavioural events, and (3) the degree of focus on contemporary as opposed to historical

events.

Table 3-1 Relevant situations for different research strategies Source: (Yin, 1994)

Research Strategy Form of research

question

Requires control

over behavioural

events

Focus on

contemporary

events

Experiment How, Why Yes Yes

Survey Who, What, Where,

How many, How much No Yes

Archival analysis Who, What, Where,

How many, How much No Yes/No

History How, Why No No

Case study How, Why No Yes

We want to gather data from different firm managers in two industries in Iran via

a questionnaire to find out what is their perception about supply chain integration and

how much they have achieved this integration. Hence, survey strategy is chosen for this

study.

3.5 Time Horizon

Time constraints should be taken into consideration when a research is designed.

There are two dimensions for it: Cross-sectional studies are carried out once and

represent a snapshot of one point in time. Longitudinal studies are repeated over an

extended period (Cooper and Schindler, 2003). The advantage of the latter is that it can

track changes over time, but one should be aware of its budgeting issues.

45

Our research is cross-sectional regarding time perspective. It is conducted once in

a particular time.

3.6 Data Collection Method

Cooper and Schindler (2003) suggest a classification which distinguishes between

monitoring and interrogation/communication processes. The former includes studies in

which the researcher inspects the activities of a subject or the nature of some material

without attempting to elicit responses from anyone (e.g. traffic counts at an intersection, a

search of the library collection, etc.). On the contrary, in the interrogation/communication

study, the researcher questions the subjects and collects their responses by personal or

impersonal means. The collected data may result from (1) interview or telephone

conversations, (2) self-administrated or self-reported instruments sent through the mail,

left in convenient locations, or transmitted electronically or by other means, or (3)

instruments presented before and/or after treatment or stimulus condition in an

experiment. Our research is an example of interrogation/communication study.

3.6.1 Sampling Design

The basic idea of sampling is that by selecting some of the elements in a

population, we may draw conclusions about the entire population. There are several

compelling reasons for sampling, including: lower cost, greater accuracy of results,

greater speed of data collection, and availability of population elements (Cooper and

Schindler, 2003). Some of the main components related to sampling are defined as follow:

• Element/Case: is the subject on which the measurement is being taken. It is the

unit of study.

• Population: is the total collection of elements about which we wish to make some

inferences. Indeed, it is the full set of cases from which a sample is taken

(Saunders et al., 2007).

• Census: is a count of all the elements in a population.

46

The population in this research consists of all Iranian firm managers of

automotive and food industry. These include car and its spare part manufacturers, and

food and kindred product manufacturers. The two industries selected are those, where we

expect to find the most advanced examples of supply chain collaboration (Van der Vaart

and Van Donk, 2008; Van Donk et al., 2008; Bagchi et al., 2005; Kehoe and Boughton,

2001).

3.6.1.1 Sampling Frame

The sampling frame for any probability sample is a complete list of all the cases

in the population from which the sample is drawn (Saunders et al., 2007). They declare

that completeness of the sampling frame is crucial since it will be impossible for every

case to be opted in a deficient list.

As our research questions are dealt with firm managers of automotive and food

industry whose company has more than 50 employees, then the sampling frame is a

complete list of all Iranian firms’ managers of automotive and food industry whose

company has more than 50 employees.

3.6.1.2 Sampling Technique

According to Saunders et al. (2007) sampling techniques can be divided into two

types (see figure 3-2):

• Probability or representative sampling: where the chance, or probability, of each

case being selected from the population is known and is usually equal for all

cases. In fact, it is based on the concept of random selection (Cooper and

Schindler, 2003). In general, this kind of sampling is associated with survey

and experimental research strategies because we can statistically estimate the

characteristics of the population from the sample to answer research questions.

• Non-probability or judgemental sampling: the probability of each case being

selected from the total population is not known and it is impossible to answer

research questions or to address objectives that require making statistical

47

inferences about the characteristics of the population. Here, one can generalise

the results for population but not on statistical grounds; therefore, it is mostly

used when adopting case study strategy.

Figure 3-2 Sampling techniques Source: (Saunders et al., 2007)

As shown in figure 3-2, probability sampling can be separated to five groups:

simple random, systematic, stratified random, cluster, and multi stage (Saunders et al.,

2007).

Simple random sampling involves selecting the sample at random from the

sampling frame using either random number tables or a computer. Systematic sampling is

a versatile form of probability sampling where every kth element in the population is

sampled, beginning with a random start of an element in the range of 1 to k. The kth

element is determined by dividing the sample size into the population size to obtain the

skip pattern applied to the sampling frame (Cooper and Schindler, 2003); in other words,

it involves selecting the sample at regular intervals from the sampling frame. Stratified

sampling is achieved when you segregate the population into two or more relevant and

significant strata based on one or number of attributes. In effect the sampling frame is

48

divided into number of subsets and then a random sample (simple or systematic) is drawn

from each of the strata. Cluster sampling is, on the surface, similar to stratified sampling

as you need to divide the population into discrete groups prior to sampling (Henry, 1990;

cited by Saunders et al., 2007). The groups are termed clusters in this form of sampling

and can be based on any naturally occurring grouping. For cluster sampling your

sampling frame is the complete list of clusters rather than a complete list of individual

cases within the population. The technique normally results in a sample that represents

the total population less accurately than stratified random sampling. Multi-stage

sampling (also called multi-stage cluster sampling) is a development of cluster sampling.

It is normally used to overcome problems associated with a geographically dispersed

population when face-to-face contact is needed or where it is expensive and time

consuming to construct a sampling frame for a large geographical area. The technique

involves taking a series of cluster samples, each involving some form of random

sampling. This aspect is represented by the dotted lines in figure 3-2.

Essentially in this research we chose probability sampling and the technique used

for this purpose is multi-stage cluster sampling. According to Saunders et al. (2007)

clusters can be based on any naturally occurring grouping; for example, data can be

grouped by type of manufacturing firm or geographical area. Similarly, we first clustered

our population by type of manufacturing firm and then field of industry (i.e. automotive

and food). Two major databases were exploited to access list of companies in mentioned

industries:

1. List of participants in international trade fairs in Tehran, Iran. These were: the

2nd international Auto Parts exhibition (December 2007) and 15th food, food technology,

and agricultural trade fair (May 2008).

2. Iran Yellow Pages, the biggest database of Iranian companies

(www.iranyellowpages.net).

49

The next phase was to find the largest possible number of responsible individuals

for supply chain and logistics. Simple random sampling was utilized and therefore they

all had the same chance of being selected.

3.6.1.3 Proper Sample Size

Each interval is constructed with regard to a given confidence level and is called a

confidence interval. The confidence level associated with a confidence interval states

how much confidence we have that this interval contains the true population parameter.

Although any value of the confidence level can be chosen to construct a confidence

interval, the more common values are 90%, 95%, and 99% (Mann, 1995). Researchers

normally work to a 95 percent level of certainty (Saunders et al., 2007), and so we did.

Sampling error emerges due to differences exist between numerical descriptors

that describe samples and those that describe populations (Cooper and Schindler, 2003).

Margin of error explains the precision of estimates of the population which is normally

within plus or minus 3-5 percent of its true values; however, in this research a 13 percent

margin of error was applied in order to reduce the sample size. We calculate the sample

size as below (Cooper and Schindler, 2003):

± 0.13 = Desired interval range within which the population proportion is

expected (subjective decision).

1.96 pσ = 95 percent confidence level for estimating the interval within which to

expect the population proportion (subjective decision).

pσ = 0.066 = Standard error of the proportion (0.13/1.96)

pq = measure of sample dispersion

npq

p =σ ⇒ 2p

pqnσ

=

50

To find the sample size (n), we need to know the values of p and q (q = 1- p).

According to Mann (1995), we can choose one of the following alternatives:

1. We make the most conservative estimate of the sample size n by using p = 0.5

and q = 0.5. Their product is 0.25 which is greater than the product of any other pair of

values for p and q. Therefore, these values will give us the largest sample size by

comparison to any other pair.

2. We take a preliminary sample (of arbitrarily determined size) and calculate

sample proportions p̂ and q̂ for this sample. Then we use these values to find n.

Because of time restrictions, we did not take a preliminary sample; therefore, we

preferred to use the first method. Thus:

2)066.0(5.05.0 ×

=n ⇒ n = 56

As a result, with 95 percent confidence level and 13 percent margin of error, the

largest sample size we could get is 56 firms.

Regarding the sample size mentioned above, 57 questionnaires were studied for

this research which is satisfactory.

3.6.1.4 Response Rate

We have to pay special attention to response rates as they are normally low in

business surveys. To achieve this, we took courses of action. Questionnaire was

distributed in two ways (physical mail and electronic mail) regarding respondents’

request. Personalized cover letters were put on each request and it was noted that the data

will be acted as confidential. It was also mentioned on mail subjects that filling out this

questionnaire will take no more than 20 minutes to stimulate respondents. In addition,

non-respondents were called after a week to give a reminder. Table 3-2 gives a summary

of response rate for each industry. As seen, the total response rate was almost 29 percent.

51

Table 3-2 Summary of response rate

Industry Distributed Returned (valid) Response Rate

Automotive 72 24 33.3%

Food 124 33 26.6%

Total 196 57 29.1%

Non-respondent firms refused to take part in our research mainly because of

following reasons:

• They were not interested in the issue

• They were too busy and had not enough time to fill the questionnaire

• They believed that they have not enough information and knowledge

• They did not have authority

3.6.2 Data Collection and Type of Data: Primary vs. Secondary

There are normally two kinds of data used in researches. Primary data are the data

originated by the researcher for the specific purpose of addressing the research problem.

Secondary data represent any data that have already been collected for purposes other

than the problem at hand (Malhotra and Peterson, 2006). According to Cooper and

Schindler (2003) the method selected to conduct the research will largely determine how

the data are collected.

Data applied for our research analysis is an example of primary data. Moreover,

the most common method of gathering primary data is through a survey which is earlier

mentioned as our research strategy. The data have been collected using a questionnaire.

3.6.2.1 Data Collection Instrument: Questionnaire Design

There are two basic requirements for the design of a questionnaire, relevancy and

accuracy (Zikmund, 2000). For a questionnaire to be relevant, only needed information

should be collected. Accuracy is obtained by having high validity and reliability which

will be discussed later in this chapter.

52

We used a self-administrated questionnaire for distributing. This method has

advantages such as lower costs, sample accessibility, and careful consideration

(respondents can take more time to collect facts). However, demanding large amount of

information and nonresponse error are considered as weaknesses of this type of data

collection (Cooper and Schindler, 2003).

Theoretical framework presented in previous chapter besides research questions, are

considered as the basis for development of the questionnaire. After studying contents of

different literatures and methodologies, we realised that the investigated dimensions of a

research conducted by Bagchi et al. (2005) fit most of our research questions’ criteria. The

questionnaire contains four major parts: Company Profile, Interfirm Integration, IT

Integration, and Performance. The first section captures the demographic information about

the company, and the respondents’ area of responsibility. The questions in the second

section are divided into the following subsections: “Decision Making” and “Supply chain

relations”. Third part is concerned with the use of ERP systems, Supply Chain planning,

and EDI/XML connections. The last section posed questions on performance improvement

as a result of IT and organizational integration in the supply chain.

Research questions are measured by requesting respondents to signify, mostly on a

five-point Likert-type scales, anchored on “1 = to a very little extent” through “5 = to a

very great extent”, their opinions on mentioned issues. Questions in third section have the

nature of Yes/No type.

The first research question is covered by items 3.1 to 3.5. ERP and other automated

system implementation and access is considered as first construct and six questions are

developed to measure the situation within the firm: the first two questions ask about the

software and its modules which has been implemented, the second pose question on supply

chain partners’ access levels to different modules, and the last one queries about execution

of other supply chain planning systems. The second construct relates to IT linkages and

possible transactions. It examines whether supply chain members have any EDI and/or

XML linkages with each other or not, and the type of documents transferred in these

interactions.

53

The question regarding decision-making (second research question) is answered by

items 2.1 and 2.2. Two similar questions were designed to understand the respondent’s

degree of involvement in decision-making once with its key suppliers and another time

with its key customers in various issues (e.g. R&D, inventory management, production,

distribution, etc.). Two more questions were added to find the desirable length of

relationship with the key suppliers and customers.

The last research question is covered by items in section four. Eight measures are

selected to quantify performance improvement of the company after doing IT and

organisational integration.

Table 3-3 depicts a summary of constructs, measures, and their sources used for

investigation of our research framework. The complete questionnaire is enclosed as

appendix A.

Table 3-3 Constructs and measures

Construct Measure(s) Source(s)

Decision-making Degree of involvement with key

suppliers and customers (2Q) Bagchi et al. (2005)

Supply chain relations Length of relationship with key

suppliers and customers (2Q) Bagchi et al. (2005)

Type of software used and its modules

(2Q)

Access levels of different modules to

supply chain partners (2Q)

ERP implementation

and access

Implementation of other automated

systems (2Q)

Bagchi et al. (2005)

IT linkages EDI/XML linkages and type of

documents transferred via them (2Q) Bagchi et al. (2005)

Order fulfilment lead time (1Q) Performance

improvement Order fill rate (1Q)

Bagchi et al. (2005)

54

Production flexibility (1Q)

Total logistics costs (1Q)

Return processing costs (1Q)

Inventory days of supply (1Q)

On-time delivery (1Q)

Rate of returns (1Q)

Gunasekaran et al.

(2004)

Beamon (1999)

3.6.2.2 Pilot Testing

A pilot test is conducted to detect weaknesses in design and instrumentation and to

provide proxy data for selection of a probability sample. It should, therefore, draw subjects

from the target population and simulate the procedures and protocols that have been

designated for data collection (Cooper and Schindler, 2003).

First, we translated the questionnaire into Farsi (Persian) and did a pilot test within

5 firms in automotive and food industries to make sure that respondents understand all the

questions. Then, we conducted 4 interviews to revise it in case of probable comments about

issues in Iran. Having the feedbacks received, few changes were made through the

questionnaire.

3.7 The Credibility of Research Findings

Reducing the possibility of getting the wrong answer means that attention has to be

paid to two particular emphases on research design: reliability and validity (Saunders et al.,

2007).

Figure 3-3 illustrates the concepts of reliability and validity. According to Cooper

and Schindler (2003), we can approach these concepts by using an archer’s bow and target

as an analogy. High reliability means that repeated arrows shot from the same bow would

hit the target in essentially the same place although not necessarily the intended place (first

row of the graphic). If we had a bow with high validity as well, then every arrow would hit

55

the bull’s-eye (upper left panel). If reliability is low or decreases for some reason, arrows

would be more scattered (lacking similarity or closeness like those shown in the second

row). High validity means that the bow would shoot true every time. It would not pull to

the right or send an arrow careening into the woods. Arrows shot from a high validity bow

will be clustered around a central point (the bull’s-eye), even when they are dispersed by

reduced reliability (first column of he graphic). We would not hit the bull’s-eye we were

aiming at because of the low validity bow. When low validity is compounded by low

reliability, the pattern of arrows is not only off bull’s-eye but is also dispersed (lower right

panel).

Figure 3-3 Understanding validity and reliability Source: (Cooper and Schindler, 2003)

3.7.1 Reliability

Reliability refers to the extent to which your data collection techniques or analysis

procedures will yield consistent findings. It can be assessed by posing the following three

questions (Easterby-Smith et al., 2002; cited by Saunders et al., 2007):

1. Will the measures yield the same results on other occasions?

2. Will similar observations be reached by other observers?

3. Is there transparency in how sense was made from the raw data?

Robson (2002) asserts that there may be four threats to reliability. First, subject or

participant error has to be overwhelmed by choosing a neutral time for research

56

implementation. Second, subject or participant bias happens when respondents are not

really telling the truth because of security issues or threats from top management. Third,

observer error occurs when for example a question is being asked by different interviewers

in different ways. Finally, there may have been observer bias when different interpretations

to replies exist.

Since participants had given enough time for answering the questionnaire and

pledge to act with information as confidential, there was no subject error or bias. In

addition, designing the questionnaire as a survey format prevents observer error or bias to

be emerged.

According to Cooper and Schindler (2003), reliability is concerned with estimates

of the degree to which a measurement is free of random or unstable error. Reliable

instruments are robust and work well at different times under different conditions. Table 3-

4 shows some of the reliability estimates, based on time and condition.

Table 3-4 Summary of reliability estimates Source: (Cooper and Schindler, 2003)

Cronbach’s alpha is the average of all possible split-half coefficients resulting from

different ways of splitting the scale items. This coefficient varies from 0 to 1, and a value

of 0.6 or less generally indicates unsatisfactory internal consistency reliability (Malhotra,

2007). Cronbach’s alpha value for 15 items on “collaboration with key suppliers and

57

customers” was 0.82, and for 8 items on “performance improvement” was 0.80 which are

greater than 0.6 and confirmed the reliability of the questionnaire.

3.7.2 Validity

Validity is concerned with whether the findings are really about what they appear to

be about (Saunders et al., 2007). There are two major forms of validity: external and

internal. The external validity of research findings refers to the data’s ability to be

generalized across persons, settings, and times. Internal validity is the ability of a research

instrument to measure what it is purported to measure (Cooper and Schindler, 2003). They

express that to assess internal validity we need to have measure-relevant tools. In this

manner, we have a classification of:

• Content validity: is the extent to which a measuring instrument provides adequate

coverage of the investigative questions guiding the study.

• Criterion-related validity: is degree to which the predictor is adequate in

capturing the relevant aspects of the criterion. It can be divided into two

subsets regarding time perspective: concurrent and predictive.

• Construct validity: answers the question “what accounts for the variance in the

measure?” and attempts to identify the underlying construct(s) being

measured and determine how well the test represents it (them).

We took different steps to ensure the validity of the study. Initially, to avoid

misunderstandings about the questions, we pre-tested the questionnaire after translating it

into Farsi and revised it after some face-to-face interviews. The data were collected from

reliable sources. As said before, this study can be generalised with a 95 percent level of

certainty and 13 percent margin of error which implies its external validity.

3.8 Summary of Research Methodology

The road-map we selected to conduct our research is briefly illustrated in figure 3-4.

58

Figure 3-4 Summary of research methodology

Research Philosophy

Epistemology Ontology

Positivism Realism Interpretivism Objectivism Subjectivism Pragmatism Axiology

Research Purpose

Exploratory Descriptive Explanatory

Research Approach

Inductive Deductive Quantitative Qualitative

Research Strategy

Experiment Survey Case Study Grounded Theory Ethnography Action Research

Time Horizon

Cross-sectional Longitudinal

Data Collection Method

Sampling Secondary Data Observation Interview Questionnaire

Probability Non-Probability Interview-administered Self-administered

Simple Random Systematic Stratified Multi-stage Cluster

59

Chapter 4

Data Analysis and Results

4. Data Analysis and Results

This chapter will present the data that have been gathered through questionnaire

survey and convert it into information after analysis. First, descriptive statistics about

company profiles are presented. Then, we do data analysis and discuss about the three

research questions. At the end, we compare our results with that of European survey to

give a more clear idea about the status of supply chain integration in Iran.

4.1 Descriptive Statistics

As implied in chapter 3, the first section of the research questionnaire captures data

about company profile. It includes demographic information about the company and

respondents’ area of responsibility.

Pie chart in figure 4-1 shows the proportion of company type which respondents

belong to. Most of the respondents were managers from the parent corporation that is 40%.

60

Second place belongs to functional organization/department by 25%. The rest are from

manufacturing plant, division/business unit/group, and strategic business unit/HQ which

mean 19%, 9%, and 7% of the total participants1.

Figure 4-1 Type/scope of company or organisation

Figure 4-2 illustrates companies’ annual turnover in three given categories. Almost

91 percent of our sampling frame has annual turnover bigger than one million dollar2. Only

a small proportion of target firms have it between 500,000 and one million dollar (5.3%)

and just 3.5% has annual turnover less than 500,000 dollar.

Figure 4-2 Annual turnover

1 Relative tables are provided as appendix C 2 1 US $ ~ 10,000 IRR at the time of this study

More than 1 million $,

91.2%

Between 500,000 $ and 1 million $,

5.3%Less than 500,000 $,

3.5%

Parent Corporation 40%

Functional Org./Department

25%

Strategic Business Unit/HQ

7%

Manufacturing Plant 19%

Division/Business Unit/Grp.

9%

61

Bar chart in figure 4-3 depicts the type of functions that respondents do in their

corporation. 34.2 percent of the representatives were Logistics and IT managers that is 13

persons for each field. 15.8% were in the field of quality followed by 9 persons in

purchasing/material division. Sales and marketing managers represents 21% of total, each

with 8 persons. Top management, as predicted, were only 6 person equivalent to 7.9%. The

minority was allocated to three divisions: strategic unit (3 persons),

manufacturing/production and R&D/engineering each with 2 managers. It is necessary to

mention that the total frequency of all these functions is 76, and this is due to the fact that

some of the respondents had more than one responsibility in their company.

Figure 4-3 Number of organisational positions in different areas

Another criteria used to categorize the participant firms was number of employees.

Despite there is no internationally common and single definition for small and medium

sized enterprises (SME), different countries and commissions have developed guidelines to

recognise these enterprises from large ones. One of the most widely accepted definitions is

given by European Commission (Recommendation 2003/361/EC) which took effect on 1st

January 2005. It is said that a medium-sized enterprise has a headcount of less than 250

employees and annual turnover of not more than €50 million. The thresholds are 50

employees and €10 million for small enterprises. We also took 250 headcount as the

boundary to separate SMEs from large firms. Figure 4-4 illustrates the portion. 52.6 percent

6

2

12 13

98

13

3

8

2

0

2

4

6

8

10

12

14

Top Management Manufacturing

/ Production Quality IT Purchasing /Materials

Marketing Logistics Strategic Sales R&D / Engineering

62

of respondent firms have more than 250 employees and considered as large firms, and

47.4% are considered as SMEs.

Figure 4-4 Proportion of SMEs vs. large firms

4.2 IT Integration

In this section, we want to clarify the extent to which Iranian firms have

information integration with their supply chain partners and also the role of information

technology in this field regarding the first research question.

ERP and Other Automated System Implementation and Access

Our study reveals that firms are becoming more aware of IT integration and its

benefits for their organisation. In this regard, implementation of ERP and other related

systems are becoming a trend especially when companies start expanding their business

and turn into larger firms. The analysis shows that 68.4 percent of the respondents (39

firms) have implemented some modules of ERP system. Among these firms, about 51%

have chosen “Other” option which means that they have designed and developed their own

ERP system upon the whole system or new modules are requested. From well-known

producers, SAP leads with 31% followed by Oracle (18%). The most important module is

accounting, because all of those firms who have implemented ERP, have also implemented

this module. Next is procurement by almost 85%. Other popular modules in order of

More than 250 employees,

52.6%

Less than 250 employees,

47.4%

63

preference are: human resource and manufacturing, logistics, SCM, customer service and

distribution, and forecasting (see table 4-1).

Table 4-1 ERP module implementation

Module Implementation Yes No Total

Frequency 39 0 39 Accounting Percent 100.00% 0.00% 100%

Frequency 23 16 39 Customer Service Percent 58.97% 41.03% 100%

Frequency 23 16 39 Distribution Percent 58.97% 41.03% 100%

Frequency 25 14 39 SCM Percent 64.10% 35.90% 100%

Frequency 20 19 39 Forecasting Percent 51.28% 48.72% 100%

Frequency 30 9 39 HR Percent 76.92% 23.08% 100%

Frequency 30 9 39 Manufacturing Percent 76.92% 23.08% 100%

Frequency 33 6 39 Procurement Percent 84.62% 15.38% 100%

Frequency 26 13 39 Logistics

Percent 66.67% 33.33% 100%

Table 4-2 shows that approximately 90 percent of those who have implemented

ERP system (61.4 percent of total firms) have also provided on-line access from ERP

system to their supply chain partners. All of these firms have granted access to their

subsidiaries. Almost 83 percent online connection is set for parent company, and others in

order of preference are: warehouses, logistics providers, suppliers, manufacturing plants,

customers, transport and forward, and brokers and banks. Moreover, 45.6 percent of total

respondents have provided some online access to their suppliers and customers for above

mentioned modules (see appendix C).

64

Table 4-2 ERP online access to supply chain partners

On-line Access to Partners Yes No Total

Frequency 29 6 35 Parent Company Percent 82.86% 17.14% 100%

Frequency 35 0 35 Subsidiaries Percent 100.00% 0.00% 100%

Frequency 16 19 35 Mfg. Plants Percent 45.71% 54.29% 100%

Frequency 26 9 35 Warehouses Percent 74.29% 25.71% 100%

Frequency 3 32 35 Brokers & Banks Percent 8.57% 91.43% 100%

Frequency 12 23 35 Customers Percent 34.29% 65.71% 100%

Frequency 19 16 35 Suppliers Percent 54.29% 45.71% 100%

Frequency 20 15 35 Logistics Prov. (TPL) Percent 57.14% 42.86% 100%

Frequency 9 26 35 Transport & Forward Percent 25.71% 74.29% 100%

Besides ERP, 36.8 percent of firms have implemented other automated systems.

Indeed, warehousing (26.3%), order processing (24.6%), forecasting and MRP/MRP II

(21.1%), and procurement (19.3%) are the most popular in descending order. However,

very few firms have implemented supply chain planning system (15.8%). SAP (APO) has

10.5% share and 5.3% opted “Other”.

IT Linkages and Possible Transactions

Almost 60 percent of respondent firms have established EDI/XML links with their

supply chain partners. 89.66% of these firms are connected to their parent company via

either EDI or XML. This is followed by supplier linkage (79.31%). Compared with

suppliers, customers own lower portion of these technology usage, which is 58.62 percent.

Level of the technology utilisation in different supply chain members are given in table 4-3.

It can be seen that firms are selectively using IT links with their supply chain network

partners. On the other hand, most popular documents that exchanged with EDI/XML link

65

are purchase orders and inventory levels (100%). Next are manufacturing plans (79.31%)

and shipping documents (65.52%) followed by design plans (58.62%), sales orders

(58.62%), and invoices (44.83%).

Table 4-3 EDI/XML linkage with supply chain partners

EDI/XML Linkage with Partners EDI XML EDI + XML None Total

Frequency 13 0 13 3 29 Parent Company Percent 44.83% 0.00% 44.83% 10.34% 100%

Frequency 6 7 6 10 29 Subsidiaries Percent 20.69% 24.14% 20.69% 34.48% 100%

Frequency 6 7 6 10 29 Mfg. Plants Percent 20.69% 24.14% 20.69% 34.48% 100%

Frequency 7 7 6 9 29 Warehouses Percent 24.14% 24.14% 20.69% 31.03% 100%

Frequency 0 10 0 19 29 Brokers & Banks Percent 0.00% 34.48% 0.00% 65.52% 100%

Frequency 7 10 0 12 29 Customers Percent 24.14% 34.48% 0.00% 41.38% 100%

Frequency 13 10 0 6 29 Suppliers Percent 44.83% 34.48% 0.00% 20.69% 100%

Frequency 6 10 0 13 29 Logistics Prov. (TPL) Percent 20.69% 34.48% 0.00% 44.83% 100%

Frequency 6 10 0 13 29 Transport & Forward Percent 20.69% 34.48% 0.00% 44.83% 100%

4.3 Collaboration with Partners

In second research question we are interested in exploring the status of interfirm

integration and collaboration among supply chain partners. Therefore, respondents were

asked about the degree of involvement of key suppliers and customers with their company

in deciding upon different issues. The results are discussed in this section.

Collaboration with Key Suppliers

There are large disparities in firm managers’ perceptions of collaboration in

decision-making with key suppliers. Only two out of seven areas exceed 3.0 on a five-point

66

scale (see table 4-4); indeed, production is the most desirable area of collaboration (mean =

3.19) followed by R&D (mean = 3.09). The cooperation with suppliers is felt to be modest

in terms of procurement (mean = 2.84) and design of the supply chain (mean = 2.79).

However, the mean score of supply chain software implementation (2.14) is the lowest

amongst all. Table 4-5 also summarizes the nature of involvement of Iranian firms with

their suppliers in mentioned areas. Levels are divided into three parts: low (none or some

consulting), medium, and high (joint decision-making and close involvement) degree of

cooperation. It is clear that managers in our respondent firms believe that suppliers can

make more significant impact in production, procurement, and R&D where suppliers are

somehow directly related.

Table 4-4 Collaboration with suppliers

Areas of Collaboration Mean Std. Deviation R&D – S 3.09 1.154 Procurement – S 2.84 1.333 Inventory Management - S 2.46 1.036 Production – S 3.19 1.060 Distribution – S 2.40 1.116 Design of the SC - S 2.79 1.333

SC software implementation – S 2.14 1.008

Note: Five-point scale where 1 = without consulting, 5 = joint decision

The relatively high percentage of low collaboration of the focal firms with their key

suppliers can also be approved by length of relationship. Most of these firms (47.4%) have

short-term relationship (less than one year) with their suppliers, 35.1 percent have mid-term

(between one to five years), and only 17.5% have set up long-term (more than five years)

relationship with suppliers. However, in general, firms gradually realize that in today’s

competitive marketplace one needs to strengthen its connections in different channels and

levels of supply chain with different members.

67

Table 4-5 Collaboration with suppliers in three levels

Level of collaboration Areas of collaboration Low (percent) Medium (percent) High (percent)

R&D 31.6 31.6 36.8 Procurement 40.4 17.5 42.1 Inventory Management 52.6 33.3 14.0 Production 24.6 28.1 47.4 Distribution 63.2 10.5 26.3 Supply chain design 47.4 26.3 26.3 Supply chain software 49.1 47.4 3.5 Note: High degree of collaboration includes joint decision-making and close involvement. Low level of collaboration includes none or some consulting or seeking advice

Collaboration with Key Customers

Like suppliers, the majority of respondent companies have established short-term

relationships with their key customers (almost 44%). The rest is equally apportioned

between mid- and long-term relationships. Data in table 4-6 show that out of eight areas

defined for evaluation of mutual decisions, sales administration (mean = 3.35) is the most

focused area of cooperation between the focal firm and its key customers. This is

apparently because it directly affects the customers. Distribution (mean = 3.18) and

production (mean = 3.04) scored slightly above “three” on five-point scale. This is also

seems to be reasonable due to the fact that from down stream point of view, firms tend to

capture and share more and more information from their distribution channels and use it

in production schedule in order to avoid phenomena like bullwhip effect. The score of

five remaining items fall marginally into the lower half of five-point scale. Those are

inventory management (mean = 2.95), R&D (mean = 2.82), CRM (mean = 2.81), design

of the supply chain (mean = 2.74), and supply chain software implementation (mean =

2.46). The latter is the only issue where its total level of collaboration from medium to

high is less than 50 percent. It is also clear that customer relationship management has

not become much popular among Iranian firms because nearly 40% of respondents

claimed that they have low degree of involvement in such programs. Table 4-7 also gives

idea about data gathered from our firms in different perspective.

68

Table 4-6 Collaboration with customers

Areas of Collaboration Mean Std. Deviation R&D – C 2.82 1.269 Inventory Management – C 2.95 1.329 Production – C 3.04 1.052 Sales Administration – C 3.35 1.217 CRM – C 2.81 1.043 Distribution – C 3.18 1.241 Design of the SC – C 2.74 1.203

SC software implementation – C 2.46 1.196

Note: Five-point scale where 1 = without consulting, 5 = joint decision

It can be concluded that while collaboration with customers is considered crucial,

respondent firms are quite selective towards levels of involvement in various areas. Data

shows that firms cautiously take into account the risks and benefits before participation in

supply chain integration. For instance, in areas such as sales administration and distribution

where collaboration is believed to be important, firms engage in high levels of integration.

On the contrary, in areas like supply chain software implementation there exists less

intense cooperation.

Table 4-7 Collaboration with customers in three levels

Level of collaboration Areas of collaboration Low (percent) Medium (percent) High (percent)

R&D 42.1 33.3 24.6 Inventory Management 36.8 21.1 42.1 Production 29.8 33.3 36.8 Sales Administration 31.6 15.8 52.6 CRM 40.4 36.8 22.8 Distribution 38.6 3.5 57.9 Supply chain design 38.6 29.8 31.6 Supply chain software 57.9 24.6 17.5 Note: High degree of collaboration includes joint decision-making and close involvement. Low level of collaboration includes none or some consulting or seeking advice

69

4.4 Performance Improvement

To better understand the effect of supply chain integration on performance

improvement, respondents were asked to rate their enhancement in eight selected indices

after IT- and organisational integration using a five-point Likert scale. In general, as

shown in table 4-8, all firms who have implemented IT integration (68.4% of total firms)

have more or less achieved improvements in all areas. Order fill rate has got the most

improvement (mean = 4.49) followed by order fulfilment lead time (mean = 4.21), on-

time delivery (mean = 4.10), production flexibility (mean = 4.08), return processing costs

(mean = 3.97), inventory days of supply (mean = 3.69), rate of returns (mean = 3.64), and

total logistics costs (mean = 3.62). This is an important result, because the achievements

especially in those metrics whose score are above “four” in five-point scale may lure

other firms to consider supply chain integration.

In order to see whether there is a significant difference in improvement among

various firm sizes, they were divided into large firms and SME according to the

categories mentioned in section 4.1. A two-tailed independent sample t-test was chosen to

test the equality of sample means. Results exposed that the only area which the difference

is significant at 0.05 level (p-value < 0.05) is production flexibility. One possible

explanation for the difference may be that smaller firms can react to different unusual

situation like fluctuations in inventory levels and bullwhip effect in more elastic manner;

in fact, they can better schedule and manage their production planning by use of IT and

more integrated organisation.

Table 4-8 Performance improvement in large firms and SMEs

Mean Performance improvement in Large

firms SMEs Total Sig. (p-value)

Statistically significant difference

Order fulfilment lead time 4.38 3.85 4.21 0.195 No Order fill rate 4.50 4.46 4.49 0.828 No Production flexibility 3.73 4.77 4.08 0.000 Yes at 0.05 level Total logistics costs 3.58 3.69 3.62 0.678 No Return processing costs 3.77 4.38 3.97 0.052 No Inventory days of supply 3.65 3.77 3.69 0.694 No

70

On-time delivery 4.04 4.23 4.10 0.309 No Rate of returns 3.50 3.92 3.64 0.087 No Note: Performance improvement scale ranged from 1= deteriorated, 3 = neutral or no change, and 5 = improved.

To see how industries may differ in performance achievement, we also took a

two-tailed independent sample t-test to check the equality of means in our sample

constituents, automotive and food industry. Table 4-9 tells that there is not huge

distinction between the two; however, return processing costs and on-time delivery are

the two items which found to have statistically significant difference at 5% level. Of

course, p-values (0.026 and 0.017) tell that the difference is not significant at 0.01 level.

This issue may be interpreted as the high importance of these two measures in food

industry. In other words, by implementation of IT and gaining more integration amongst

supply chain partners, food and kindred product manufacturers can better manage the

timeliness of the deliveries and also reduce their return processing costs. This may

happen due to the fact that the manufacturers should be aware of critical issues such as

freshness, availability, etc.

Table 4-9 Performance improvement in different industries

Mean Performance improvement in Automotive

industry Food

industry Total Sig. (p-value)

Statistically significant difference

Order fulfilment lead time 4.33 4.10 4.21 0.443 No Order fill rate 4.50 4.48 4.49 0.886 No Production flexibility 3.83 4.29 4.08 0.112 No Total logistics costs 3.83 3.43 3.62 0.091 No Return processing costs 3.67 4.24 3.97 0.026 Yes at 0.05 level Inventory days of supply 3.50 3.86 3.69 0.197 No On-time delivery 3.83 4.33 4.10 0.017 Yes at 0.05 level Rate of returns 3.50 3.76 3.64 0.188 No Note: Performance improvement scale ranged from 1= deteriorated, 3 = neutral or no change, and 5 = improved.

71

To understand the cause and effect relationship between above mentioned eight

performance metrics and supply chain integration variables, we decided to carry out a

multiple regression analysis. Seventeen variables of interfirm integration are selected as

predictor variables. These are: seven areas of collaboration with suppliers, eight measures

of collaboration with customers, and two metrics of relationship length with suppliers and

customers. These three blocks of independent variables (17 items) were tested with each

of eight dependent performance variables. We used SPSS 15.0 package for our analysis

and among selection methods offered in the software, we chose stepwise selection which

is the most popular method. The independent variable that contributes the most to

explaining the dependent variable is added first. Subsequent variables are included based

on their incremental contribution over the first variable and whether they meet the

criterion for entering the equation (0.05 significance level). Variables may be also

removed at each step if they meet the removal criterion, which is a larger significance

level (0.1) than for entry (Cooper and Schindler, 2003). Coefficient of multiple

determination (R2) was applied to judge how good the multiple regression models are and

how well the independent variables included in the model explain the dependent variable.

We also extracted adjusted coefficient of determination (R2adj) which is adjusted for

degrees of freedom and avoid us from misleading increase of R2 when large number of

explanatory variables are added to regression models. Different models were proposed in

ascending order of R2 and most of final models for each predictor had the best value for

R2 which is “one”. So we defined 0.90 as cut-off point and started to remove the variables

with smallest absolute value of t-statistic. This way we could extract the most

contributable variables to the model; furthermore, the result were models which were

more than 90% good to explain the relation between variables.

The results of the multiple regression analysis showed that order fulfillment lead

time and order fill rate are positively correlated with length of relationship with suppliers.

This is in line with previous studies in this field. Indeed, when firms create trusty long

term relationship with their suppliers, they become able to reduce the cost of adaptation,

interaction, etc. and benefit this in better and faster handling of orders. Involvement in

supply chain design and software implementation is found to have significant negative

72

correlation with most of performance metrics (e.g. order fulfillment lead time, order fill

rate, total logistics costs, inventory days of supply). This is perhaps expected. When IT

problems rise, often both parties fail to benefit the advantages like data sharing until the

root causes are identified and resolved; thus, this may lead to performance drop in short

term. As discussed before, decision involvement and collaboration in supply chain design

issues such as facility location and management flow seems to be very uncommon in

Iranian firms and this has reverse effect on performance improvement. This situation is

can be further confirmed with newly born CRM in Iran which has strong negative

correlation with performance measures in all models that has appeared (e.g. order

fulfillment lead time, order fill rate, production flexibility, total logistics costs, on-time

delivery, and rate of return). In general, most of these negative correlations between

supply chain integration variables and performance measures support the fact that Iranian

managers’ perceptions of involvement degree in different collaboration areas with both

suppliers and customers are in opposite direction with performance improvement. In

other words, these firms have achievements in performance despite having low

collaboration in some areas with their supply chain partners. Table 4-10 gives the

summary of multiple regression results.

Table 4-10 Results of multiple regression

Dependent variable Significant predictor variable(s) Parameter

estimate

Model coefficient of determination

(R2) R2

adj

Collaboration with suppliers in software impl. 0.54 Collaboration with customers in CRM -0.62 Collaboration with customers in supply chain design -0.22 Collaboration with customers in software impl. -0.52

Order fulfillment lead time

Length of supplier relationship 0.59

0.940 0.931

Collaboration with customers in inventory mgmt. -0.14 Collaboration with customers in production -0.15 Collaboration with customers in sales administration 0.48 Collaboration with customers in CRM -0.97 Collaboration with customers in distribution 0.19 Collaboration with customers in supply chain design -0.12 Collaboration with customers in software impl. -0.30

Order fill rate

Length of supplier relationship 0.36

0.930 0.911

Collaboration with suppliers in distribution -1.68 Production flexibility Collaboration with suppliers in supply chain design -0.26

0.918 0.903

73

Collaboration with suppliers in software impl. 1.30 Collaboration with customers in production -0.16 Collaboration with customers in CRM -0.38 Collaboration with customers in distribution 0.69 Collaboration with customers in production -0.20 Collaboration with customers in sales administration 0.28 Collaboration with customers in CRM -0.56

Total logistics costs

Collaboration with customers in supply chain design -0.49

0.925 0.916

Collaboration with suppliers in software impl. 0.53 Collaboration with suppliers in inventory mgmt. -0.40 Collaboration with suppliers in supply chain design -0.47 Collaboration with customers in inventory mgmt. 0.54 Collaboration with customers in production -0.43 Collaboration with customers in sales administration -0.21 Collaboration with customers in supply chain design 0.24

Return processing costs

Collaboration with customers in software impl. -0.26

0.937 0.920

Collaboration with suppliers in inventory mgmt. 0.55 Collaboration with suppliers in production 0.86 Collaboration with suppliers in software impl. -0.70 Collaboration with customers in inventory mgmt. -0.14 Collaboration with customers in production -0.73 Collaboration with customers in distribution 0.16 Collaboration with customers in supply chain design -0.57

Inventory days of supply

Collaboration with customers in software impl. -0.34

0.931 0.912

Collaboration with customers in R&D 0.29 Collaboration with customers in inventory mgmt. -0.20 Collaboration with customers in production -0.46 Collaboration with customers in CRM -0.67 Collaboration with customers in distribution 0.27 Collaboration with customers in supply chain design 0.18 Collaboration with customers in software impl. -0.42 Length of supplier relationship -0.92

On-time delivery

Length of customer relationship 0.93

0.878 0.840

Collaboration with suppliers in R&D -3.51 Collaboration with suppliers in procurement 1.32 Collaboration with suppliers in inventory mgmt. -0.60 Collaboration with customers in R&D 1.58 Collaboration with customers in CRM -1.35 Collaboration with customers in distribution 0.75

Rate of returns

Collaboration with customers in supply chain design 1.43

0.946 0.934

Note: All predictors are significant at 0.05 level

74

4.5 Comparison between Iranian and European Firms

Clearly, firms differ in terms of their organisational culture and their managers’

perceptions of various issues in different countries, and supply chain integration is not an

exception either. Here, ranked areas of collaboration with both suppliers and customers

are compared between our research in Iran and a survey of 149 companies which was

conducted by Bagchi et al. (2005) in eight European countries among nine industries.

As shown in table 4-11, procurement is perceived to be at nearly the same level of

importance in both surveys. This confirms that how vital is purchasing of raw materials

to the firms in a sense that without this feed, they may drop desired profits. However, the

only other area which has the same and of course the lowest rank in both studies is supply

chain software implementation. That is, high costs of implementation, different

organisational cultures, lack of know-how, etc. are all considered as underlying factors

that prevent companies to move toward such cooperation no matter what kind of industry

you work in or where your company is located.

Table 4-11 Comparison between Iran and Europe in collaboration with suppliers

High level of collaboration Areas of collaboration Rank

Iran (percent) Europe (percent)

Rank in European countries

Production 1 47.4 16.8 6 Procurement 2 42.1 35.9 1 R&D 3 36.8 35.9 2 Supply chain design 4 26.3 18.9 5 Distribution 5 26.3 28.6 3 Inventory Management 6 14.0 20.8 4 Supply chain software 7 3.5 15.9 7 Note: High degree of collaboration includes joint decision-making and close involvement.

The story is nearly the same with customer collaboration. As can be seen in table

4-12, while distribution is among the first priorities for both parties, supply chain

software implementation is again the least desired area of cooperation with customers.

The differences are more saleint in areas such as CRM which is newly emerged in

countries like Iran (e.g. 7th priority for Iranian firms vs. 3rd priority for European firms).

75

Another example could be R&D which has the first priority of high level collaboration in

European countries, while the rank is sixth among Iranian companies. An explanation for

this would be the way that managers especially in developed countries perceive in

integrating and managing their supply chains. Indeed, they believe, for instance, that

identification of customer needs to better service them is basically dependent on close

collaboration in research and development issues than factors like inventory management

or sales administration.

Table 4-12 Comparison between Iran and Europe in collaboration with customers

High level of collaboration Areas of collaboration Rank

Iran (percent) Europe (percent)

Rank in European countries

Distribution 1 57.9 43.1 2 Sales Administration 2 52.6 27.5 5 Inventory Management 3 42.1 26.6 6 Production 4 36.8 24.5 7 Supply chain design 5 31.6 27.6 4 R&D 6 24.6 54.2 1 CRM 7 22.8 38.2 3 Supply chain software 8 17.5 17.0 8 Note: High degree of collaboration includes joint decision-making and close involvement.

76

Chapter 5

Discussion and Conclusion

5. Discussion and Conclusion

This chapter will wrap up conclusions we could take from this study. Theoretical

contribution and managerial implications are included. Limitations of the research are

then presented. Finally, directions for future research are suggested.

5.1 Overall Conclusions

The scope and level of integration in supply chains has raised questions during

years through different literatures. Some believe that total integration and close

collaboration with supply chain partners in all areas is the answer to this dilemma (Cooper

et al., 1997; Lee, 2000). However, other researchers believe that it is necessary to reassess

the dominant view of integrated SCM and propose the direction towards semi-integrated

supply chains. Indeed, factors like dominance versus balanced power, the degree of

77

competition and maturity in the industry may determine the desired level of integration in a

supply chain (Bask and Juga, 2001; Bagchi and Skjoett-Larsen, 2002). To find out the

status of the supply chain integration in reality and to investigate how pervasive the

integration should be, this research is designed to answer following main questions:

• To what extent do Iranian firms have information integration with their supply

chain partners and what role information technology plays in supply chain

integration?

• In which areas and to what extent do such firms involve key suppliers and

customers in decision-making?

• How does supply chain integration affect performance? Answering these questions, we adopted an exploratory research approach to identify

the underlying factors of supply chain integration in two dimensions: collaboration between

members of upstream and downstream section (especially the key ones) and the focal firm;

and, the role of information technology in gaining such integration. Additionally, it seemed

reasonable to evaluate the performance of the firms after such cooperation and IT

implementation to judge about the desirable extent.

Involvements in decision making and length of relationship with key

suppliers/customers are found as the two critical factors for assessment of interfirm

integration. Moreover, ERP and other automated system implementation plus existing IT

linkages were selected as determinants of IT integration. Finally, eight elements were

extracted from literature as performance measurement indices.

The results disclosed that Iranian firms have started paying attention to the need for

IT integration in supply chains. Over two-thirds of respondents replied that they have

implemented some modules of ERP system in their company. The fact may confirm that

companies are looking for ways to facilitate flow of information initially within their

boundaries. Top priorities for module implementation were accounting, procurement, and

production which approves important areas for information sharing mentioned in previous

studies like the ones conducted in Europe, (Olhager and Selldin, 2003) and (Bagchi et al.,

78

2005). However, providing online access for different supply chain partners is rather

selective. As we expected, the trend shows that many firms have online data transaction

with the parent company and their subsidiaries. Connection with other members such as

warehouses and logistics providers is in medium level, but some companies point out that

they own these service providers which seem reasonable for this level of access. Fewer

firms tend to have close relationship with their customers. During data collection we

realised that the top-level managers are so much sensitive about information sharing in

strategic areas with their supply chain partners, especially those who are not owned by the

focal firm. They believe that the information is their proprietary asset and they will lose

core competency by letting other participants in supply chain know and use them. It is also

thought to be true that cooperation level is based on enterprise’s needs; in other words,

firms will not be interested in information sharing unless they find value in it. This can be

obviously seen in providing access to members like banks/brokers and transportation

companies in our study. It was also interesting that larger firms have provided greater

access to their partners. Perhaps they have more knowledge about SCM concepts or maybe

they are not afraid of issues like high cost of IT implementation or lack of preparedness.

Iranian firm managers’ perceptions toward collaboration level with associates in

supply chain are also quite selective. They consider both the benefits and the risks of

involvement in decision making with suppliers and/or customers and then choose their

desired level of collaboration. Supply chain software implementation, research and

development, and customer relationship management are those areas which Iranian firms

are not eager for coordination and making joint decisions with their customers the most.

For supplier part the collaboration is mostly at the lowest level in distribution, inventory

management, and supply chain software implementation. As a result, these areas are

perceived to be less beneficial for Iranian firms. We also carried out independent sample t-

test to make sure that there is no significant difference between SMEs and large firms in

their approach towards collaboration. Length of relationship with both upstream and

downstream partners is found to be over 40 percent of short-term (less than one year)

which does not support previous suggestions by Ford et al. (2002) and Min et al. (2005).

79

This may also be seen as a clue to describe the relatively high percentage of low

collaboration of respondent firms with their supply chain partners.

More or less, respondents discerned improvements in all predefined measures of

performance after doing IT and organisational integration. Order fill rate and order

fulfilment lead time got the most enhancement followed by on-time delivery and

production flexibility. That is, from very beginning, most of the firms will benefit IT

integration in order fulfilment from time and rate point of view. Moreover, we checked

whether the results could differ by changing the firm size or type of industry. Results

exposed that the only area which had significant difference between SMEs and large firms

was production flexibility. One possible explanation for the difference may be that smaller

firms can react to different unusual situation like fluctuations in inventory levels and

bullwhip effect in more elastic manner; in fact, they can better schedule and manage their

production planning by use of IT and more integrated organisation. To probe underlying

factors of such performance improvement, we ran multiple regression between each of

performance metrics and all seventeen predictors (measures of collaboration in various

areas and length of relationship with both suppliers and customers). The output revealed

that there are few positive correlations between selected performance variables and their

predictors. For example, order fill rate and order fulfilment lead time which scored the

most in improvement are both positively correlated with length of supplier relationship.

Similarly, on-time delivery is strongly correlated with creation of long-term relationships

with supply chains’ down stream partners. This proves previous findings by Ford et al.

(2002). Another example is positive relation between reduction of total logistics costs and

collaboration with customers in sales administration. It means that close cooperation in

areas like placement of orders and creation of aggregated time baseline for customers’

orders will help companies to cut a part of so-called logistics costs. Nonetheless, we could

watch much more negative correlations between mentioned variables. Most of these

negative correlations support the fact that Iranian managers’ perceptions of involvement

degree in different collaboration areas with both suppliers and customers are in opposite

direction with performance improvement. In other words, these firms have achievements in

performance despite having low collaboration in some areas with their supply chain

80

partners. This situation can be further confirmed with newly born CRM in Iran which has

strong negative correlation with performance measures in all models that has appeared (e.g.

order fulfillment lead time, order fill rate, production flexibility, total logistics costs, on-

time delivery, and rate of return).

5.2 Theoretical Contributions

The main purpose of this study is to investigate the status of supply chain

integration in Iran. Theoretically, our research extends the body of knowledge in supply

chain integration in two main dimensions: the extent of information sharing and integration

from information technology perspective, and collaboration between supply chain partners

in different areas and departments within their organisations. Moreover, we ranked them

from Iranian managers’ viewpoint and compared it with the similar study in Europe. The

effect of such cooperation on performance improvement was also evaluated.

More specifically, the results of our research supported those literatures which

believed in semi-integrated supply chains rather than total and tight integration in every

single process and area of collaboration among members.

5.3 Managerial Implications

Our study shows that Iranian firms have started to consider the importance of

information flow at least within their boundaries. Adoption of ERP systems and provision

of online access for supply chain partners to these systems in almost 60 percent of our

cases would be a proof to this claim. The situation is somehow the same in implementation

of EDI/XML linkages with partners. The findings are in accordance with the two

propositions previously suggested in number of studies (Chung and Snyder, 2000; Olhager

and Selldin, 2003): “If the high level of perceived benefits from IT integration with ERP is

present, an organization is more likely to adopt an ERP system.” and “If the development

of an integrative value chain is a high priority, an organization is more likely to adopt an

ERP system.”. When it comes to collaboration among members, production, procurement

and R&D are the most desirable areas for cooperation with supplier side; and, Sales

administration and distribution have the same story in customer side. Therefore, our

81

findings suggest other managers to move toward creation of such integration across their

supply chain because nearly all of these firms have gained enhancements in performance.

Nonetheless, we should pay attention to the fact that almost all of IT integration processes

and areas/levels of collaboration are entirely selective. Indeed, whereas many studies

concern about tight integration and cooperation among supply chain members (rhetoric

view), managers’ view of SCM implementation is different in reality. We found that firms

are still experiencing benefits from IT implementation and information sharing

(technological side of integration) within their own organisational boundaries, and very few

of Iranian firms are thinking ahead of this; in other words, concepts like integrative inter-

organisational processes, aligned goals, consistent measures, shared risks and rewards …

are still embryonic thoughts in the supply chain zone. This is somehow in accordance with

other studies (Fawcett and Magnan, 2002; McAdam and McCormack, 2001).

An interesting finding from our survey was the significant negative correlation

between the supply chain design collaboration with suppliers/customers and performance

measures such as order fulfilment lead time, order fill rate, production flexibility, total

logistics costs, and inventory days of supply. This is not in line with previous study results

in this field; for instance, Sezen (2008) disclosed that supply chain design has significant

impact on supply chain performance. However, this event can be viewed form two

perspectives. First, design of supply chains seems to be an effective tool for partners to

recognise each others’ needs at the very beginning of creation, but during the time

companies find it almost impossible to synchronise their changing expectations in a manner

which benefits them all and finally cause performance drop. Second, like in some other

areas of collaboration (e.g. CRM and software implementation) Iranian managers perceive

that these new concepts and technologies would not benefit them that much. Comparing

our results with that of European one, we can say that the managerial implication of this

finding is that top management and supply chain managers in Iran should put some time

and effort to learn and execute such programs in their companies and continuously appraise

themselves with identified metrics and indices (may be extracted from best practices in/out

side Iran) in long-term. This way they can rationally adopt or ignore their desired area and

level of collaboration with other supply chain members.

82

5.4 Limitations

This research has number of limitations. We used a particular framework to

evaluate the status of supply chain integration that may not be sufficiently comprehensive.

One should be cautious using our results to draw broad conclusions because of limited

sample we utilized for the analysis. We performed a cross-sectional survey and therefore

our study provides a snapshot at the time about the situation of supply chain integration in

Iran. Target population is also restricted to food and automotive industry. Furthermore,

there is dispersion in respondents’ job titles; in fact, there were few respondents with

“supply chain manager” title. So, we had to search for the right person to answer our

questions.

5.5 Suggestions for Future Research

Further research can be viewed in two paths. First, based on limitations mentioned above,

one can perform similar study in better conditions to get better results. Increasing the

sample size and number of investigated industries will help the researcher to gain more

accurate conclusions and more inclusive insights. It may be also useful to add other

measures of supply chain performance appraisal to better understand the cause and effect

relationship between various variables. Moreover, longitudinal study is offered to

confirm the results of this study because developing countries like Iran are moving fast in

science and technology which may further change managers’ perceptions about issues

concerned in this research. Second, it is recommended to take “why’s” into consideration.

That is, it will be practical if underlying factors of such selective supply chain integration

are inspected through an explanatory research. As said before, firm managers cautiously

take into account the risks and benefits before participation in supply chain integration;

therefore, risk management might also prove a beneficial concept in this regard.

83

References

Agi M., Ballot E., Molet H. (2005), “”100% EDI-connected suppliers” projects: An

empirical investigation of success factors”, Journal of Purchasing & Supply

Management, Vol. 11, pp. 107-115

Akkermans H.A., Bogerd P., Yucesan E., van Wassenhove L.N. (2003), “The impact of

ERP on supply chain management: Exploratory findings from a European Delphi study”,

European Journal of Operational Research, Vol. 146, pp. 284-301

Bagchi P.K., Skjoett-Larsen T. (2002), “Integration of Information Technology and

Organizations in a Supply Chain”, The International Journal of Logistics Management,

Vol. 14, No. 1, pp. 89-108

Bagchi P.K., Skjoett-Larsen T. (2002), “Organizational integration in supply chains: a

contingency approach”, Global Journal of Flexible Systems Management, Vol. 3, No. 1,

pp. 1-10

Bagchi, P.K., Ha B.C., Skjoett-Larsen T., Soerensen L.B. (2005), "Supply chain

integration: a European survey", The International Journal of Logistics Management,

Vol. 16, No. 2, pp. 275-294

Barratt M. (2004), “Understanding the meaning of collaboration in the supply chain”,

Supply Chain Management: An International Journal, Vol. 9, No. 1, pp. 30-42

Bartlett P.A., Julien D.M., Baines T.S. (2007), “Improving supply chain performance

through improved visibility”, The International Journal of Logistics Management, Vol.

18, No. 2, pp. 294-313

Bask A.H., Juga, J. (2001), “Semi-integrated supply chains: towards the new era of

supply chain management”, International Journal of Logistics: Research Applications,

Vol. 4, No. 2, pp. 137-152

84

Beamon B.M. (1999), “Measuring supply chain performance”, International Journal of

Operations & Production Management, Vol. 19, No. 3, pp. 275-292

Beheshti H.M. (2006), “What managers should know about ERP/ERP II”, Management

Research News, Vol. 29, No. 4, pp. 184-193

Bowersox D.J., Closs D.J., Stank T.P. (1999), “21st Century Logistics: Making Supply

Chain a Reality”, Oak Brook, IL: The Council of logistics management

Burca S., Fynes B., Marshall D. (2005), “Strategic technology adoption: extending ERP

across the supply chain”, The Journal of Enterprise Information Management, Vol. 18,

No. 4, pp. 427-440

Burgess K., Singh, P.J., Koroglu R. (2006), “Supply chain management: a structured

literature review and implications for future research”, International Journal of

Operations & Production Management, Vol. 26, No. 7, pp. 703-729

Buxmann P., Diaz L.M., Wustner E. (2002), ”XML-based Supply Chain Management –

as SIMPLEX as it is-“, IEEE: Proceedings of the 35th Hawaii International Conference

on System Sciences

Cagliano R., Caniato F., Spina, G. (2006), “The linkage between supply chain integration

and manufacturing improvement programs”, International Journal of Operations &

Production Management, Vol. 26, No. 3, pp. 282-299

Chan F.T.S, Qi H.J. (2003), “Feasibility of performance measurement system for supply

chain: a process-based approach and measures”, Integrated Manufacturing Systems, Vol.

14, No. 3, pp. 179-190

Charan P., Shankar R., Baisya R.K. (2008), “Analysis of interactions among the variables

of supply chain performance measurement system implementation”, Business Process

Management Journal, Vol. 14, No. 4, pp. 512-529

85

Chen H., Mattioda D.D., Daugherty P.J. (2007), “Firm-wide integration and firm

performance”, The International Journal of Logistics Management, Vol. 18, No. 1, pp. 5-

21

Chen M., Yang T., Li H. (2007), “Evaluating the supply chain performance of IT-based

inter-enterprise collaboration”, Information & Management, Vol. 44, pp. 524-534

Chung S.H., Snyder C.A. (2000), “ERP adoption: A technological evolution approach”,

International Journal of Agile Management Systems, Vol. 2, No. 1, pp. 24–32

Cooper D.R., Schindler P.S (2003), “Business Research Methods”, International Edition:

McGraw-Hill, Irwin Series

Cooper M.C., Lambert D.M, Pagh J.D. (1997), “Supply chain management: more than a

new name for logistics”, The International Journal of Logistics Management, Vol. 8, No.

1, pp. 1-13

Crum M.R., Johnson D.A., Allen B. (1998), “A longitudinal assessment of EDI use in the

U.S. motor carrier industry”, Transportation Journal, Vol. 38, No. 1, pp. 15–28

Elmuti D., Minnis W., Abebe M. (2008), “Longitudinal assessment of an integrated

industrial supply chain”, Supply Chain Management: An International Journal, Vol. 13,

No. 2, pp. 151-159

Fabbe-Costes N., Jahre M. (2007), “Supply chain integration improves performance: the

Emperor’s new suit?”, International Journal of Physical Distribution & Logistics

Management, Vol. 37, No. 10, pp. 835-855

Fawcett S.E., Magnan G.M. (2002), "The rhetoric and reality of supply chain

integration." International Journal of Physical Distribution & Logistics Management,

Vol. 32, No. 5, pp. 339-361

Fawcett S.E., Osterhaus P., Magnan G.M., Brau J.C., McCarter M.W. (2007),

86

“Information sharing and supply chain performance: the role of connectivity and

willingness”, Supply Chain Management: An International Journal, Vol. 12, No. 5, pp.

358–368

Ford D., Berthon P., Brown S., Gadde L., Hakansson H., Naude P., Ritter T., Snehota I.

(2002), “The Business Marketing Course – Managing in complex networks”, West

Sussex: John Wiley & Sons Ltd., England

Frohlich M.T., Westbrook R. (2001), “Arcs of integration: an international study of

supply chain strategies”, Journal of Operations Management, Vol. 19, No. 2, pp. 185-200

Fu H., Chang T., Wang C., Hu K. (2007), “Development of B2B electronic data

interchange using XML format – A study of Taiwanese manufacturing”, Journal of

Manufacturing Technology Management, Vol. 18, No. 4, pp. 415-430

Fynes B., Voss C., Burca S. (2005), “The impact of supply chain relationship dynamics

on manufacturing performance”, International Journal of Operations & Production

Management, Vol. 25, No. 1, pp. 6-19

Gill J., Johnson Ph. (2002), “Research Methods for Managers”, Third Edition: Sage

Publications Ltd., Great Britain

Glaser B., Strauss A. (1967), “The Discovery of Grounded Theory”, Chicago, IL, Aldine

Gunasekaran A., Ngai E.W.T. (2004), “Information systems in supply chain integration

and management”, European Journal of Operational Research, Vol. 159, pp. 269-295

Gunasekaran A., Patel C., McGaughey R.E. (2004), “A framework for supply chain

performance measurement”, International Journal of Production Economics, Vol. 87, pp.

333-347

Gunasekaran A., Patel C., Tirtiroglu E. (2001), “Performance measures and metrics in a

supply chain environment”, International Journal of Operations & Production

87

Management, Vol. 21, No. 1/2, pp. 71-87

Hakansson H., Persson G. (2004), “Supply Chain Management: The Logic of Supply

Chains and Networks”, The International Journal of Logistics Management, Vol. 15, No.

1, pp. 11-26

Harland C.M., Lamming R.C., Zheng J., Johnsen T.E. (2001), “A taxonomy of supply

networks”, The Journal of Supply Chain Management, Vol. 37, No. 4, pp. 21-27

Hendricks K.B., Singhal V.R., Stratman J.K. (2007), “The impact of enterprise systems

on corporate performance: A study of ERP, SCM, and CRM system implementations”,

Journal of Operations Management, Vol. 25, pp. 65-82

Hill C.A., Scudder G.D. (2002), “The use of electronic data interchange for supply chain

coordination in the food industry”, Journal of Operations Management, Vol. 20, pp. 375-

387

Iran Yellow Pages (2008), <URL: http://www.iranyellowpages.net>

Jacobs F.R., Weston Jr. F.C.T. (2007), “Enterprise resource planning (ERP) – A brief

history”, Journal of Operations Management, Vol. 25, pp. 357-363

Jonsson S., Gunnarsson C. (2005), “Internet technology to achieve supply chain

performance”, Business Process Management Journal, Vol. 11, No.4, pp. 403-417

Kahn K.B., Mentzer J.T. (1998), “Marketing’s integration with other departments”,

Journal of Business Research, Vol. 42 No. 1, pp. 53-62.

Ke W., Wei K.K. (2008), “Organizational culture and leadership in ERP

implementation”, Decision Support Systems, Vol. 45, pp. 208-218

Kehoe D., Boughton N. (2001), “Internet based supply chain management: A

classification of approaches to manufacturing planning and control”, International

88

Journal of Operations and Production Management, Vol. 21, No. 4, pp. 516-524

Kim S.W. (2006), “Effect of supply chain management practices, integration and

competition capability on performance”, Supply Chain Management: An International

Journal, Vol. 11, No. 3, pp. 241-248

Larson P.D., Rogers D.S. (1998), “Supply Chain Management: Definition, Growth, and

Approaches”, Journal of Marketing Theory and Practice, Vol. 6, pp. 1-5

Lee Ch.W., Kwon I.G., Severance D. (2007), “Relationship between supply chain

performance and degree of linkage among supplier, internal integration, and customer”,

Supply Chain Management: An International Journal, Vol. 12, No. 6, pp. 444-452

Lee H.L. (2000), “Creating value through supply chain integration”, Supply Chain

Management Review, Vol. 4, No. 4, pp. 30-36

Lim D., Palvia P.C. (2001), “EDI in strategic supply chain: impact on customer service”,

International Journal of Information Management, Vol. 21, pp. 193-211

Machuca J.A.D., Barajas R.P. (2004), “The impact of electronic data interchange on

reducing bullwhip effect and supply chain inventory costs”, Transportation Research

Part E, Vol. 40, pp. 209-228

Malhotra N.K. (2007), “Marketing Research: An Applied Orientation”, Fifth Edition:

Prentice Hall, India

Malhotra N.K., Peterson M. (2006), “Basic Marketing Research: A Decision-Making

Approach”, International Edition: Prentice Hall, New Jersey

Mann P.S. (1995), “Statistics for Business and Economics”, John Wiley & Sons Inc.,

USA

McAdam R., McCormack D. (2001), “Integrating business processes for global

89

alignment and supply chain management”, Business Process Management Journal, Vol.

7, No. 2, pp. 113-130

McCarthy T.M., Golicic S.L. (2002), “Implementing collaborative forecasting to improve

supply chain performance”, International Journal of Physical Distribution & Logistics

Management, Vol. 32, No. 6, pp. 431-454

Mentzer J.T., DeWitt W., Keebler J.S., Min S., Nix N.W., Smith C.D. and Zacharia Z.G.

(2001), “What is supply chain management?”, in Mentzer, J.T. (Ed.), Supply Chain

Management, Sage, Thousand Oaks, CA, pp. 5-62

Mentzer J.T., Min S., Zacharia Z.G. (2000), “The Nature of Interfirm Partnering in

Supply Chain Management”, Journal of Retailing, Vol. 76, No. 4, pp. 549-568

Miller S.I., Fredericks M. (1999), “How Does Grounded Theory Explain?”, Qualitative

Health Research, Vol. 9, No. 4, pp. 538-551

Min S., Roath A.S., Daugherty P.J., Genchev S.E., Chen H., Arndt A.D., Richey R.G.

(2005), “Supply chain collaboration: what’s happening?”, The International Journal of

Logistics Management, Vol. 16, No. 2, pp. 237-256

Narasimhan R., Das A. (2001), “The impact of purchasing integration and practices on

manufacturing performances”, Journal of Operations Management, Vol. 19, pp. 593-609

Narasimhan R., Kim S.W. (2002), “Effect of supply chain integration on the relationship

between diversification and performance: evidence from Japanese and Korean firms”,

Journal of Operations Management, Vol. 20, pp. 303-323

Nurmilaakso J. (2008), “Adoption of e-business functions and migration from EDI-based

to XML-based e-business frameworks in supply chain integration”, International Journal

of Production Economics, Vol. 113, pp. 721-733

Olhager J., Selldin E. (2003), “Enterprise resource planning survey of Swedish

90

manufacturing firms”, European Journal of Operational Research, Vol. 146, pp. 365-373

Pagell M. (2004), “Understanding the factors that enable and inhibit the integration of

operations, purchasing and logistics”, Journal of Operations Management, Vol. 22, pp.

459-487

Prosser A., Nickl A. (1997), “The impact of EDI on interorganizational integration”,

International Journal of Production Economics, Vol. 52, pp. 269-281

Ragatz G.L., Handfield R.B., Scannell, T.V. (1997), “Success factors for integrating

suppliers into new product development”, Journal of Production Innovation

Management, Vol. 14, pp. 190-202

Robson C. (2002), “Real World Research”, Second Edition: Oxford, Blackwell

Sari K. (2008), “On the benefits of CPFR and VMI: a comparative simulation study”,

International Journal of Production Economics, Vol. 113, pp. 575-586

Saunders M., Lewis Ph., Thornhill A. (2007), “Research Methods for Business Students”,

Fourth edition: Prentice Hall, England

Sezen B. (2008), “Relative effects of design, integration and information sharing on

supply chain performance”, Supply Chain Management: An International Journal, Vol.

13, No. 3, pp. 233-240

Simatupang T.M., Sridharan R. (2002), “ The Collaborative Supply Chain”, The

International Journal of Logistics Management, Vol. 13, No. 1, pp. 15-30

Simatupang T.M., Sridharan R. (2005), “An integrative framework for supply chain

collaboration”, The International Journal of Logistics Management, Vol. 16, No. 2, pp.

257-274

Simatupang T.M., Sridharan R. (2008), “Design for supply chain collaboration”, Business

91

Process Management Journal, Vol. 14, No. 3, pp. 401-418

Skjoett-Larsen T., Thernoe Ch., Andresen C. (2003), “Supply chain collaboration:

Theoretical perspectives and empirical evidence”, International Journal of Physical

Distribution & Logistics Management, Vol. 33, No. 6, pp. 531-549

Smart A. (2008), “eBusiness and supply chain integration”, Journal of Enterprise

Information Management, Vol. 21, No. 3, pp. 227-246

Stank T.P., Daugherty P.J., Autry Ch.W. (1999), “Collaborative planning: supporting

automatic replenishment programs”, Supply Chain Management, Vol. 4, No. 2, pp. 75-85

Stank T.P., Keller S.B., Daugherty P.J. (2001), “Supply chain collaboration and logistical

service performance”, Journal of Business Logistics, Vol. 22, No. 1, pp. 29-48

Swafford P.M., Ghosh S., Murthy N. (2008), “Achieving supply chain agility through IT

integration and flexibility”, International Journal of Production Economics: Accepted

Manuscript

Tan K., Kannan V.R., Handfield R.B., Ghosh S. (1999), “Supply chain management: an

empirical study of its impact on performance”, International Journal of Operations and

Production Management, Vol. 19, No. 10, pp. 1034-1052

Tarokh M.J., Soroor J. (2006), "Supply Chain Management Information Systems :

Critical Failure Factors", IEEE, pp. 425-431

The new SME definition: User guide and model declaration (2008), European

Commission, Enterprise and Industry Publications

Towill D.R., Childerhouse P., Disney S.M. (2002), "Integrating the automotive supply

chain: where are we now?", International Journal of Physical Distribution & Logistics

Management, Vol. 32, No. 2, pp. 79-95

Trkman P., Stemberger M.I., Jaklic J., Groznik A. (2007), “Process approach to supply

92

chain integration”, Supply Chain Management: An International Journal, Vol. 12, No. 2,

pp. 116-128

Tuunainen V.K. (1999), “Opportunities of effective integration of EDI for small

businesses in the automotive industry”, Information & Management, Vol. 34, pp. 361-

375

Van der Vaart T., Van Donk D.P. (2008), “A critical review of survey-based research in

supply chain integration”, International Journal of Production Economics, Vol. 111, pp.

42-55

Van Donk D.P., Akkerman R., Van der Vaart T. (2008), " Opportunities and realities of

supply chain integration: the case of food manufacturers", British Food Journal, Vol.

110, No. 2, pp. 218-235

Vereecke A., Muylle S. (2006), “Performance improvement through supply chain

collaboration in Europe”, International Journal of Operations & Production

Management, Vol. 26, No. 11, pp. 1176-1198

Wong W.P., Wong K.Y. (2007), “Supply chain performance measurement system using

DEA modeling”, Industrial Management & Data systems, Vol. 107, No. 3, pp. 361-381

Yao Y., Palmer J., Dresner M. (2007), “An interorganizational perspective on the use of

electronically-enabled supply chains”, Decision Support Systems, Vol. 43, pp. 884-896

Yin R.K. (1994), “Case Study Research: Design and Methods”, Second Edition: Sage

Publications Ltd., Thousand Oaks, CA

Yu Zh., Yan H., Cheng T.C.E (2001), “Benefits of information sharing with supply chain

partnerships”, Industrial Management & Data systems, Vol. 101, No. 3, pp. 114-119

Zailani S., Rajagopal P. (2005), “Supply chain integration and performance: US versus

East Asian companies”, Supply Chain Management: An International Journal, Vol. 10,

93

No. 5, pp. 379-393

Zhao X., Xie J., Zhang W.J. (2002), “The impact of information sharing and ordering co-

ordination on supply chain performance”, Supply Chain Management: An International

Journal, Vol. 7, No. 1, pp. 24-40

Zhou H., Benton Jr. W.C. (2007), "Supply chain practice and information sharing",

Journal of Operations Management, Vol. 25, pp. 1348-1365

Zikmund W.G. (2000), “Business Research Methods”, Sixth Edition: Fort Worth, TX,

Dryden Press

94

Appendix A : Questionnaire (in English)

QUESTIONNAIRE: SUPPLY CHAIN INTEGRATION Agenda

Section 1: Company (Business Unit/Division) Profile Section 2: Interfirm Integration Section 3: IT Integration Section 4: Performance

SECTION 1: Company Profile

Parent Corporation Functional Org./Department Strategic Business Unit/HQ Manufacturing Plant

1.1 For what type/scope of company or organisation will you be responding to the questions in this survey? (please tick one)

Division/Business Unit/Grp. 1.2 Company Name (or Business Unit, Division, etc.)

Less than 500,000 $ Between 500,000 $ and 1 million $ 1.3 Annual turnover (of Business Unit, Division, etc.) More than 1 million $

1.4 Headquarters location

1.5 Number of employees (of Business Unit, Div. etc.)

1.6 Company web address

Top Management Logistics Environment/Safety/Regulatory Manufacturing/Production Marketing Quality Purchasing/Materials Sales Finance Human Resources

1.7 What function(s) do you personally perform in the company? (please tick all relevant)

R&D/Engineering Other: Person completing this survey

If you wish to receive a summary of the survey results, please fill out the following:

Name: …….…………………………………………………………… Title: ………………………….…

Company: …….……………………………………………………………

Address: …………………………………….………………….………..

Town/City: ……………….………… Post Code: ……..…………….. Province: …………………………….

Phone: …….…………………… Fax: …………………….

Email: …..……………………………………………………………..

95

SECTION 2: Interfirm Integration Decision-making 2.1 Please estimate the relative degree of involvement of key suppliers/carriers with your company

(Business Unit/Division) in deciding upon the following issues (please circle): 1 = without consulting or seeking the advice 2 = some consulting or seeking advice 3 = medium involvement 4 = close involvement 5 = joint decision

Without consulting

Jointdecision

a. R&D 1 2 3 4 5 b. Procurement 1 2 3 4 5 c. Inventory Management 1 2 3 4 5 d. Production 1 2 3 4 5 e. Distribution 1 2 3 4 5 h. Design of the supply chain 1 2 3 4 5 i. Supply chain software implementation 1 2 3 4 5

2.2 Please estimate the relative degree of involvement of key customers with your company (business unit/division) in deciding upon the following issues (please circle):

Without consulting

Jointdecision

a. R&D 1 2 3 4 5 c. Inventory Management 1 2 3 4 5 d. Production 1 2 3 4 5 e. Sales Administration 1 2 3 4 5 f. Customer Relationship Management 1 2 3 4 5 g. Distribution 1 2 3 4 5 h. Design of the supply chain 1 2 3 4 5 i. Supply chain software implementation 1 2 3 4 5

Supply chain relations 2.3 What is the average length of relationship with… (please tick the most applicable)

a. … key suppliers? < 1 year 1-5 years > 5 years b. … key customers? < 1 year 1-5 years > 5 years

96

SECTION 3: IT Integration ERP system implementation and access

Yes No

3.1 Have you implemented an ERP system? (please tick)

SAP R/3 Peoplesoft Oracle JDE/SA

a. If yes, which one have you implemented? (tick all applicable)

Baan Other: Accounting Human Resources Customer Service Manufacturing Distribution Procurement SCM Logistics

b. If yes, which of the following modules have you implemented? (tick all applicable)

Forecasting Other: Yes No

3.2 Do you provide on-line access to your ERP system(s) to your supply chain partners? (please tick)

Parent Company Customers Subsidiaries Suppliers Mfg. Plants Logistics Prov. (TPL) Warehouses Transport & Forward

a. If yes, who has access? (tick all applicable)

Brokers & Banks Other: Suppliers Customers Accounting Customer Service Distribution Forecasting Manufacturing Procurement

b. If yes, which ratio of suppliers and customers have on-line access to the following modules? (please provide %)

Other: Other automated systems

Yes No

3.3 Besides ERP, do you have other automated systems? (please tick)

Order Processing Warehousing Forecasting MRP/MRP II

a. If yes, which functionality? (tick all applicable)

Procurement Other: Yes No

3.4 Have you implemented a supply chain planning system? (please tick)

Manugistics Numetrix Peoplesoft Logility i2 Synquest American Software SAP (APO)

a. If yes, which? (tick all applicable)

Other:

97

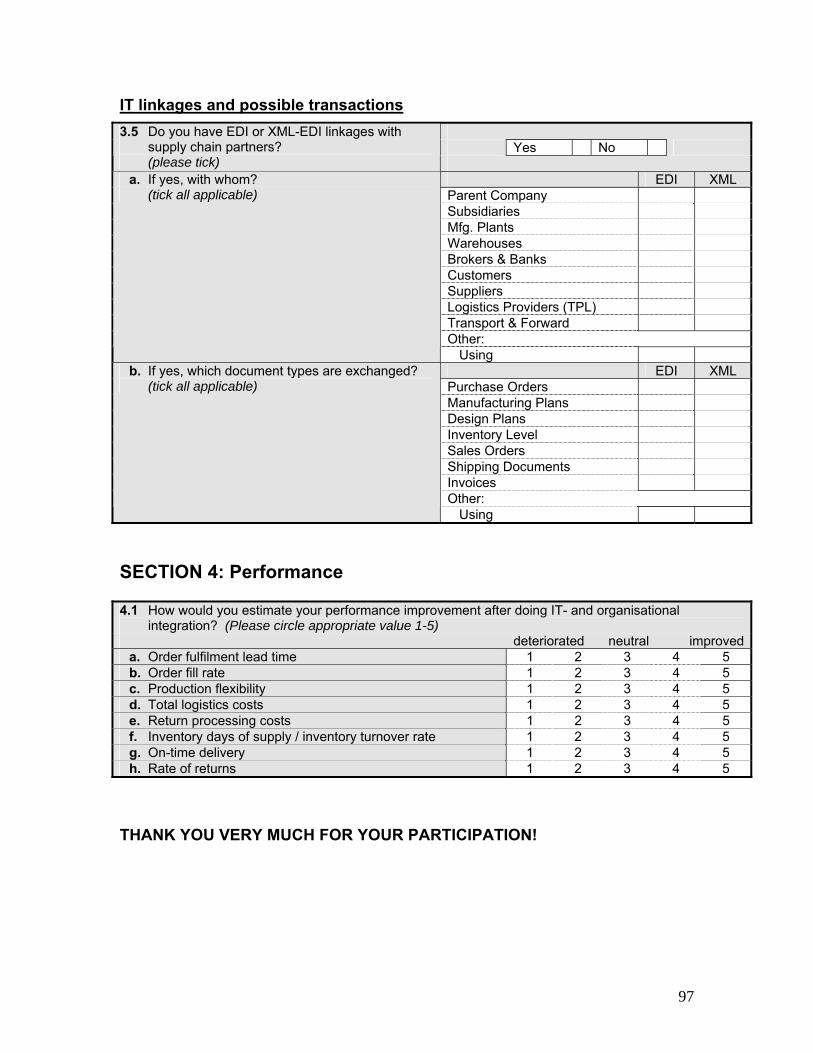
IT linkages and possible transactions Yes No

3.5 Do you have EDI or XML-EDI linkages with supply chain partners? (please tick)

EDI XML Parent Company Subsidiaries Mfg. Plants Warehouses Brokers & Banks Customers Suppliers Logistics Providers (TPL) Transport & Forward Other:

a. If yes, with whom? (tick all applicable)

Using EDI XML Purchase Orders Manufacturing Plans Design Plans Inventory Level Sales Orders Shipping Documents Invoices Other:

b. If yes, which document types are exchanged? (tick all applicable)

Using SECTION 4: Performance 4.1 How would you estimate your performance improvement after doing IT- and organisational

integration? (Please circle appropriate value 1-5) deteriorated neutral improved

a. Order fulfilment lead time 1 2 3 4 5 b. Order fill rate 1 2 3 4 5 c. Production flexibility 1 2 3 4 5 d. Total logistics costs 1 2 3 4 5 e. Return processing costs 1 2 3 4 5 f. Inventory days of supply / inventory turnover rate 1 2 3 4 5 g. On-time delivery 1 2 3 4 5 h. Rate of returns 1 2 3 4 5

THANK YOU VERY MUCH FOR YOUR PARTICIPATION!

98

Appendix B : Questionnaire (in Persian)

به نام خدا

يکپارچه سازی زنجيره تامين: پرسشنامه

باشد که شبکه اي از امکانات، تسهيالت و گزينه هاي توزيع و پخش مي) Supply Chain(زنجيره تامين

ايت پخش اين محصوالت ميان مشتريان را وظيفه خريد مواد اوليه، تبديل آنها به محصول واسط و نهايي و در نه .بر عهده دارد

همواره به عنوان بخش مهمي از استراتژي ) Supply Chain Management(مديريت زنجيره تامين ها به مرور زمان بيشتر به اهميت رقابتي جهت ارتقاء بهره وري و سود دهي شرکتها مطرح بوده و کارخانه

.برند ول زنجيره تامين پي ميسازي در ط استراتژيک يکپارچه Supply Chain(بررسي حاضر با هدف شناسايي عوامل اساسي و بنيادي در يکپارچه سازي زنجيره تامين

Integration ( با تاکيد خاص روي نقش به اشتراک گذاري اطالعات و همکاري ميان اعضاء زنجيره و. پذيرد ان از ديدگاه مديران مربوطه انجام ميهمچنين مشخص نمودن وضعيت موجود در صنايع مختلف در اير

بديهي است جوابهاي دقيق و از روي تامل پاسخ دهندگان به هرچه باارزش تر و ارزنده تر بودن نتايج اين تحقيق برخورد خواهد محرمانهالزم بذکر است با کليه اطالعات مندرج در اين پرسشنامه بصورت . کمک خواهد کرد

تايج اين تحقيق از تجزيه و تحليل داده های گردآوری شده از کليه شرکتها بدست خواهد آمد، شد و از آنجائيکه ن . لذا هيچگونه اطالعاتی در ارتباط با آن سازمان محترم برای خوانندگان مشخص نخواهد بود

محتويات )قسمت بازرگانی / واحد ( مشخصات شرکت : بخش اول هی يکپارچه سازی بين بنگا: بخش دوم ITايجاد يکپارچگی توسط : بخش سوم

عملکرد: بخش چهارم

اصطالحاتEDI (Electronic Data Interchange) : تبادل اطالعات تجاری ميان دو کامپيوتر تحت يک فرمت

... و HTTP, FTP, e-mailاستاندارد توافق شده ميان فرستنده و گيرنده توسط تکنولوژی توافق شده مانند XML (Extensible Markup Language) : يک زبان قابل تعريف توسط هر فرد جهت تبادل اطالعات با فرمت تعريف شده توسط طرفين بر روی اينترنت

MRP (Material Requirements Planning) : يک نرم افزار برنامه ريزی برای کنترل موجودی که .برای مديريت پروسه توليد به کار می رود

MRP II (Manufacturing Resource Planning) : يک روش موثر برای برنامه ريزی کليه منابع ...شرکتهای توليدی مانند بخشهای توليد، فروش، مالی و

99

مشخصات شرکت: بخش اول

شرکت مادر

ازمان ه ای / س ش وظيف بخ)Functional(

تراتژيک انی اس د بازرگ / (SBU)واح )HQ(دفتر اصلی

قسمت ساخت و توليد

حيطه شرکت يا سازمان بعنوان پاسخگوی / سازمان شما از لحاظ نوع ) ١٫١ )مت بزنيدلطفا يک گزينه را عال(سواالت اين تحقيق چيست ؟

گروه/ واحد بازرگانی / بخش ...)يا واحد بازرگانی ، قسمت ، ( نام شرکت ) ١٫٢

ال ميليارد ري۵ کمتر از ميليارد و کمتر از ده ۵ بيشتر از

ميليارد ريال

گردش مالی ساالنه) ١٫٣

بيشتر از ده ميليارد ريال )HQs(محل دفاتر اصلی ) ١٫۴ تعداد کارکنان) ١٫۵ آدرس وب سايت شرکت) ١٫۶

نامه ريزی، پياده سازی بر(لجستيک مديريت ارشد ...)وکنترل موجودی، اطالعات و

توليد/ ساخت کنترلی/امنيتی/محيطی کيفيت بازاريابی فروش مواد اوليه/خريد منابع انسانی مالی

چه وظايفی در شرکت به عهده شماست ) ١٫٧ )گزينه های مربوطه را عالمت بزنيد (؟

/ تحقيق و توسعه مهندسی

:ساير

: فردی که اين پرسشنامه را پر می کند :ج اين تحقيق را دريافت نمائيد ، لطفا اين قسمت را پر کنيد نتاي اگر مايليد خالصه ای از

:عنوان : نام : شرکت :آدرس :استان : کدپستی : شهر

:فکس : لفن ت :پست الکترونيک

100

يکپارچه سازی بين بنگاهی : بخش دوم

تصميم گيری در خصوص ) قسمت/واحد بازرگانی ( را با شرکت شما تامين کنندگان اصلیلطفا ميزان مشارکت ) ٢٫١

) :طفا يک گزينه را عالمت بزنيدل(تصميم گيری در موارد زير برآورد کنيد مشارکت در حد متوسط = ٣کمی مشورت = ٢بدون مشورت يا رايزنی = ١ تصميم گيری کامال دوطرفه= ۵مشارکت نزديک = ۴

٣ ٢ ١ ۴ ۵ تحقيق و توسعه) الف خريد) ب دی و انبارمديريت موجو) ج توليد) د پخش) ه طراحی زنجيره تامين) و پياده سازی نرم افزار زنجيره تامين) ز

در خصوص تصميم ) قسمت/ واحد بازرگانی( را با شرکت شما مشتريان اصلیلطفا ميزان مشارکت ) ٢٫٢ ) :مت بزنيدلطفا يک گزينه را عال(گيری در موارد زير برآورد کنيد

مشارکت در حد متوسط = ٣کمی مشورت = ٢بدون مشورت يا رايزنی = ١ تصميم گيری کامال دوطرفه= ۵مشارکت نزديک = ۴

٣ ٢ ١ ۴ ۵ تحقيق و توسعه) الف مديريت موجودی و انبار) ب توليد) ج مديريت فروش) د مديريت ارتباط با مشتری) ه پخش) و طراحی زنجيره تامين) ز پياده سازی نرم افزار زنجيره تامين) ی

روابط در زنجيره تامين )لطفا بازه مورد نظر را عالمت بزنيد ( چقدر است ؟ ... متوسط زمان رابطه شما با ) ٢٫٣ سال۵بيش از سال۵از يک تا کمتر از يکسال تامين کنندگان اصلی) ١ سال۵بيش از سال۵از يک تا کمتر از يکسال مشتريان اصلی) ٢

101

تکنولوژی يکپارچه سازی: بخش سوم

)ERP System(پياده سازی و دسترسی به سيستم برنامه ريزی منابع سازمانی آيا سيستم برنامه ريزی منابع سازمانی را پياده )٣٫١ خير بلی )لطفا عالمت بزنيد ( ازی کرده ايد ؟ س

SAP R/3 Peoplesoft Oracle JDE/SA

، کداميک از اين درصورت مثبت بودن پاسخ) الفهمه موارد ( نوع سيستم ها را پياده سازی کرده ايد ؟

:ساير Baan )مرتبط را عالمت بزنيد منابع انسانی مالي

سرويس دهی به توليد مشتريان

خريد پخش لجستيک مديريت زنجيره تامين

، کداميک از درصورت مثبت بودن پاسخ) بهمه موارد مرتبط را ( ماژولها را اجرا کرده ايد ؟

)عالمت بزنيد

:ساير پيش بينی شرکای خود onlineآيا شما زمينه دسترسی ) ٣٫٢

فراهم می ERPستم در زنجيره تامين را به سي )لطفا عالمت بزنيد ( آوريد ؟

خير بلی

مشتريان کمپانی مادر

شبکه تامين شرکتهای تابعه کنندگان

مراکز ساخت و توليد شبکه پخش و

و نمايندگي توزيع ها

حمل و نقل انبارها

/ اگر پاسخ سئوال فوق مثبت است ، چه کسی ) الفهمه موارد مرتبط را ( کسانی دسترسی دارند ؟

)عالمت بزنيد

واسطه های مالی و بانکها

:ساير

تامين مشتريان کنندگان

حسابداری شتريانسرويس دهی به م

پخش پيش بينی

توليد خريد

مثبت است ، چه درصدی ٣٫٢اگر پاسخ سئوال ) باز تامين کنندگان و مشتريان به ماژولهای زير

)لطفا به درصد بيان کنيد ( دارند ؟ onlineدسترسی

:ساير

ساير سيستمهای مکانيزه ، سيستمهای اتوماسيون ديگری ERPگذشته از)٣٫٣

لطفا عالمت ( نيز در رابطه با تامين کنندگان داريد ؟ )بزنيد

خير بلی

انبارداری پردازش سفارشات MRP II / MRP پيش بينی

ه در صورت مثبت بودن پاسخ سئوال فوق ، ب) الفتمامی موارد مربوطه را عالمت (چه منظور ؟

:ساير خريد )بزنيد

102

آيا تاکنون سيستم برنامه ريزی زنجيره تامين ) ٣٫۴ خير بلی )لطفا عالمت بزنيد ( اجرا نموده ايد ؟

Manugistics Numetrix PeopleSoft Logility i2 Synquest

American Software SAP (APO)

در صورت مثبت بودن پاسخ، کدام سيستم ؟) الف )تمامی موارد مرتبط را عالمت بزنيد (

:ساير

و تراکنشهای ممکنITارتباطات آيا شما ارتباطی با شرکای زنجيره تامين از ) ٣٫٥

خير بلی داريد ؟XML-EDI و يا EDIطريق

EDI XML کمپانی مادر

شرکتهای تابعه مراکز ساخت و توليد

انبارهاواسطه های مالی و

بانکها

مشتريان تامين کنندگان

لجستيک و نقلحمل

، با چه سئوال فوقدرصورت مثبت بودن پاسخ ) الف )تمامی موارد مربوط را عالمت بزنيد (کسی ؟

:ساير EDI XML

سفارشات خريد برنامه ريزی های توليد

برنامه ريزی های طراحی

ميزان موجودی انبار سفارشات فروش

مل و نقلمستندات ح صورتحسابها

، چه نوع ٣٫۵ سئوال درصورت مثبت بودن پاسخ) بتمامی موارد مربوط ( مستنداتی رد و بدل می شود ؟

)عالمت زده شود

:ساير

103

عملکرد : بخش چهارم و يکپارچه سازی سازمانی چگونه ارزيابی می کنيد ITبهبود عملکرد خود را پس از پياده سازی و انجام ) ٤ )بهبود يافته = ٥...خنثی= ٣...بدتر شده= ١: لطفا مقدار مناسب را عالمت بزنيد( ؟

٥ ٤ ٣ ٢ ١ مدت زمان انجام و تکميل سفارشات) الف نرخ اجرای سفارشات) ب انعطاف پذيری توليد) ج لجستيکهزينه های کلی ) د کاالهاي برگشتي زش و مديريتهزينه های پردا) هميزان / تعداد روزهای تامين موجودی انبار) و

گردش موجودی انبار

حمل و تحويل به موقع) ز ميزان درآمدها) ی

.االت پرسشنامه صميمانه سپاسگذاريم واز مشارکت شما در پاسخ به س

104

Appendix C : Additional Tables

Table C-1 Type/scope of company or organisation

Company / Organisation Type Frequency Share

Parent Corporation 23 40%

Functional Org./Department 14 25%

Strategic Business Unit/HQ 4 7%

Manufacturing Plant 11 19%

Division/Business Unit/Grp. 5 9%

Total 57 100%

Table C-2 Provision of online access for suppliers/customers

Online Access (on average) Module

Suppliers (%) Customers (%)

Accounting 35.0 19.6

Customer Service 46.2 30.8

Distribution 46.5 19.6

Forecasting 12.3 0.0

Manufacturing 35.4 16.2

Procurement 18.5 0.0


Recommended