40
2010-2012 Three Year Plan October, 2010 © Copyright Datalogic 2007-2010

2010-2012 Three Year Plan
October, 2010
© Copyright Datalogic 2007-2010
DISCLAIMER
This document has been prepared by Datalogic S.p.A. (the "Company") for use during meetings with investors and financial analysts and is solely for information purposes. The information set out herein has not been verified by an independent audit company. Neither the Company nor any of its subsidiaries, affiliates, branches, representative offices (the “Group”), as well as any of their directors, officers, employees, advisers or agents (the “Group Representatives”) accepts any responsibility for/or makes any representation or warranty, , p y , g ( p p ) p y p y y p y,express or implied, as to the accuracy, timeliness or completeness of the information set out herein or any other related information regarding the Group, whether written, oral or in visual or electronic form, transmitted or made available. This document may contain forward-looking statements about the Company and/or the Group based on current expectations and opinions developed by the Company, as well as based on current plans, estimates, projections and projects of the Group. These forward-looking statements are subject to significant risks and uncertainties (many of which are outside the control of the Company and/or the Group) which could cause a material difference between forward looking information and actual future resultswhich could cause a material difference between forward-looking information and actual future results. The information set out in this document is provided as of the date indicated herein. Except as required by applicable laws and regulations, the Company assumes no obligation to provide updates of any of the aforesaid forward-looking statements. Under no circumstances shall the Group and/or any of the Group Representatives be held liable (for negligence or otherwise) for any loss or damage howsoever arising from any use of this document or its contents or otherwise in connection with the document or the aforesaid forward-looking statements. This document does not constitute an offer to sell or a solicitation to buy or subscribe to Company shares and neither this entiredocument or a portion of it may constitute a recommendation to effect any transaction or to conclude any legal act of any kind whatsoever. This document may not be reproduced or distributed, in whole or in part, by any person other than the Company.By viewing and/or accepting a copy of this document, you agree to be bound by the foregoing limitations.
© Copyright Datalogic 2007-2010 22

THE GROUP
THREE YEAR PLAN
FINANCIAL DATA
APPENDIX
© Copyright Datalogic 2007-2010 33

Investment Highlights
Worldwide leader in the Automatic Data Capture (ADC)p ( )and Factory Automation (FA) markets
Proven track record in facing and overcominginternational crisisinternational crisis
Strong growth potential in emerging markets Sustainable margins recovery thanks to recentlyg y y
completed efficiency plan, stable product pricing andvolume improvements
Strong cash generator to sustain future growth Strong cash generator to sustain future growth Experienced management team with proven capability in
company integration
© Copyright Datalogic 2007-2010 44

Datalogic at a Glance
World-class producer of bar code readers, datacollection mobile computers, RFID and visionsystemssystems
Datalogic offers innovative solutions for acomprehensive range of applications in the
f t i t il t t ti & l i timanufacturing, retail, transportation & logisticsmarkets
Founded in 1972 in Bologna, Italyg , y
Listed on the STAR Segment of the Italian StockExchange since 2001
About 2,000 employees
Direct presence in 30 countries worldwide selling Direct presence in 30 countries worldwide sellingto +100 countries
+1,000 partners worldwide
© Copyright Datalogic 2007-2010 5

Datalogic Management Team
© Copyright Datalogic 2007-2010 6
DATALOGIC S A
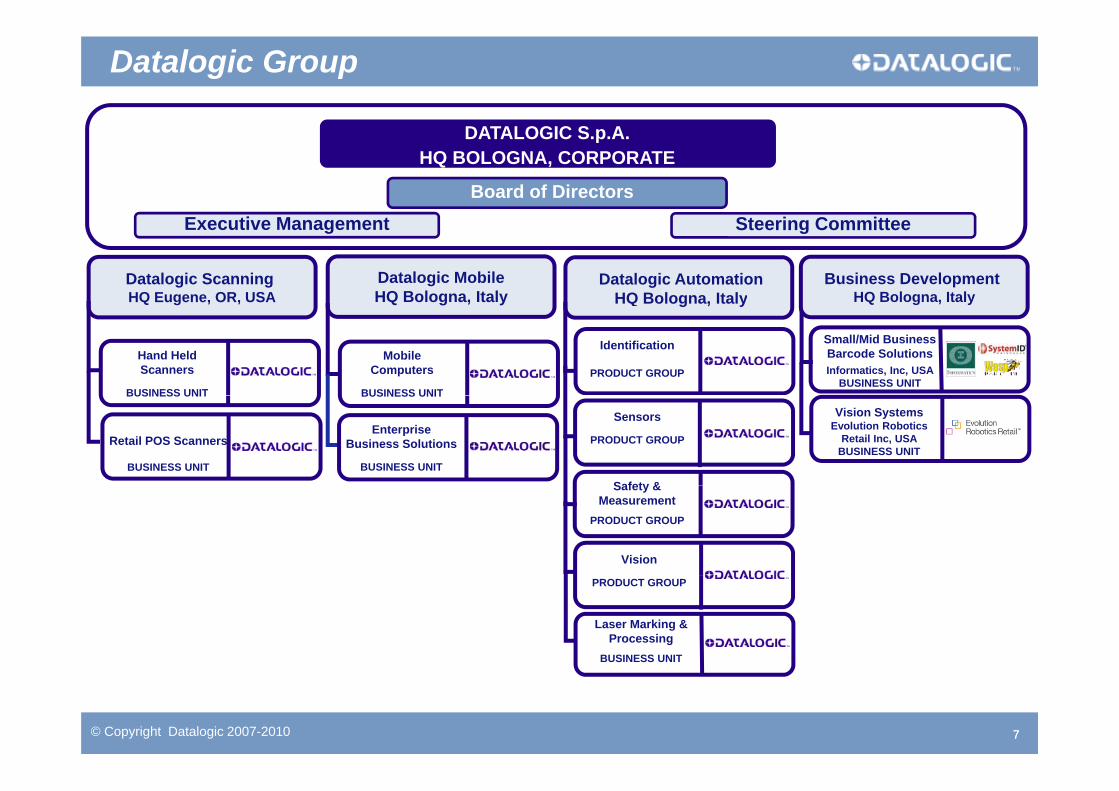
Datalogic Group
DATALOGIC S.p.A.HQ BOLOGNA, CORPORATE
Board of Directors
Datalogic Scanning HQ Eugene, OR, USA
Datalogic Automation HQ Bologna, Italy
Datalogic MobileHQ Bologna, Italy
Business Development HQ Bologna, Italy
Executive Management Steering Committee
Hand Held Scanners
BUSINESS UNIT
g , y
Identification
PRODUCT GROUPMobile
Computers
BUSINESS UNIT
Small/Mid BusinessBarcode SolutionsInformatics, Inc, USA
BUSINESS UNITBUSINESS UNIT
Retail POS Scanners
BUSINESS UNIT
Sensors
PRODUCT GROUP
Safety &
Enterprise Business Solutions
BUSINESS UNIT
BUSINESS UNIT
Vision SystemsEvolution Robotics
Retail Inc, USABUSINESS UNIT
Safety & Measurement
PRODUCT GROUP
Vision
PRODUCT GROUP
Laser Marking & Processing
BUSINESS UNIT
© Copyright Datalogic 2007-2010 77

A Wide Geographical FootprintH110 REVENUES – TOTAL €191M - BREAKDOWN BY AREA
EUROPE 37%
NORTH AMERICA 27%
ITALY 11%
APAC 12%
SOUTH AMERICA 13%
Direct presence in 30 countries worldwide7 Manufacturing Plants 9 R&D Centers
© Copyright Datalogic 2007-2010
7 Manufacturing Plants 9 R&D Centers
8

A History of Growth
Acquisition of Informatics
Completed transformation intoListing on the Milan St k E h Acquisition of Laservall
Inc. (TX, U.S.A.)
Acquisition of PSC Inc. (OR, U.S.A.)
Acquisition of Evolution Robotics Retail, USA
Completed transformation into 3 divisions: Scanning, Mobile, and Automation
Acquisition of Datasensor SpA
Stock Exchange
Acquisition of Minec AB (Sweden)
Acquisition of Laservall SpA (AO, I)
REVENUES: ~14% 2001-2009 CAGRREVENUES: ~14% 2001-2009 CAGRH110 SALES REVENUES (191 M Euro) UP BY 28% COMPARED TO 2009
2001 2002 2003 20052004 2006 2007 2008 2009 H1 2010
© Copyright Datalogic 2007-2010 99

A solid track record to overcome the crisis…
The restructuring and efficiency program launched in the first half of 2009 enabled the Group The restructuring and efficiency program launched in the first half of 2009 enabled the Group to significantly lower its fixed cost structure and to create the basis for future growth
Right-sized cost structure; not just temporary measures Quarter to quarter growth trend confirms Company’s turnaround successfully completed and g y y
the return to pre-crisis profitability levels Robust free cash generation Gained market shares, consolidating leadership in reference markets, fully exploiting all the
t iti f th
PROFITABILITY TRENDWORLDWIDE MARKET SHARE
opportunities of growth
6 2
11,6
7,18,7
10,6
15,3
9 3%10,1%
11,8%
15,1%
31,8% 30,6% 31,5%
1,32,9
6,2
-0,5
4,3
,
5,7%
9,3%
Q1 09 Q2 09 Q3 09 Q4 09 Q1 10 Q2 10
12,3% 12,3%14,6%
-6,8
-10,2-0,7%
E B T fit/(l ) b f T E B I T D A EBITDA M i
2007 2008 2009
POS Retail Scanners Industrial Stationary Barcode Scanners
© Copyright Datalogic 2007-2010 10
E.B.T.profit/(loss) bef. Taxes E.B.I.T.D.A. EBITDA MarginPOS Retail Scanners Industrial Stationary Barcode Scanners

…leveraging strong commercial partnerships…
More than 1,000 partners worldwide
Longstanding relations with the biggest retailers, couriers and automotive manufacturers in the world
Over 350 installations of Self Shopping in Europe
Over 1,000 reading stations installed in more than 100 airports worldwide
© Copyright Datalogic 2007-2010 11

Relentless investments in R&D have provided new fuel to beat reference market growth without
…and cutting edge technology and innovationp g
price policy Research & Development investments at > €25 million in 2009 or 8% on sales
+30 new products in 2009, +22 in 2010 up to date A large and growing portfolio of 890 patents: +70 patents in 2009 9 Research & Development Centers
Acquisition of the American company Evolution Robotics Retail, leader in the field of visualpattern recognition that will be a key technology building block in Datalogic industrial focusedpattern recognition that will be a key technology building block in Datalogic industrial focusedbusinesses; this acquisition adds an innovative technological capability protected by 5 patents
PRODUCT INNOVATION PATENTS PORTFOLIO
20
32
23
23 23
35
27
33
682761 789
867 885
1012
9
20
12
6
9 8
17
11
85 6 5
11
6
10
23
13
17 16
22
14 1316
23
264 283328 342
682
4 5
2 1
4 532 1 0 1 0 1
3 24
0
4
0
1998 1999 2000 2001 2002 2003 2004 2005 2006 2007 2008 2009
PRODUCT UPDATES NEW LINE OF PRODUCTS
2001 2002 2003 2004 2005 2006 2007 2008 2009
© Copyright Datalogic 2007-2010 12
PRODUCT UPDATES NEW LINE OF PRODUCTS
BREAKTHROUGH INNOVATION TOTAL DEVELOPMENTS
T GTHE GROUP
T Y PTHREE YEAR PLAN
FINANCIAL DATA
APPENDIX
© Copyright Datalogic 2007-2010 1313

Reference Market Growth Trends
GLOBAL TRENDS Technology shifts: analogue to digital; wireless technology Globalization of the world economyy Increased focus on gaining efficiencies and cost reduction in supply chains Greater safety and security concerns
VALUE TO THE CUSTOMER Better information, faster Improved real time decision making Operate more efficiently reducing operating expenses Operate more efficiently reducing operating expenses Increase safety, security and compliance Measurable, sustainable ROI
+8% average market growth* 2010 through 2012
© Copyright Datalogic 2007-2010 1414
+8% average market growth* - 2010 through 2012*Company’s estimates based on available market trend data
ADC Worldwide Addressable Market 2009 2012 CAGR: 8%
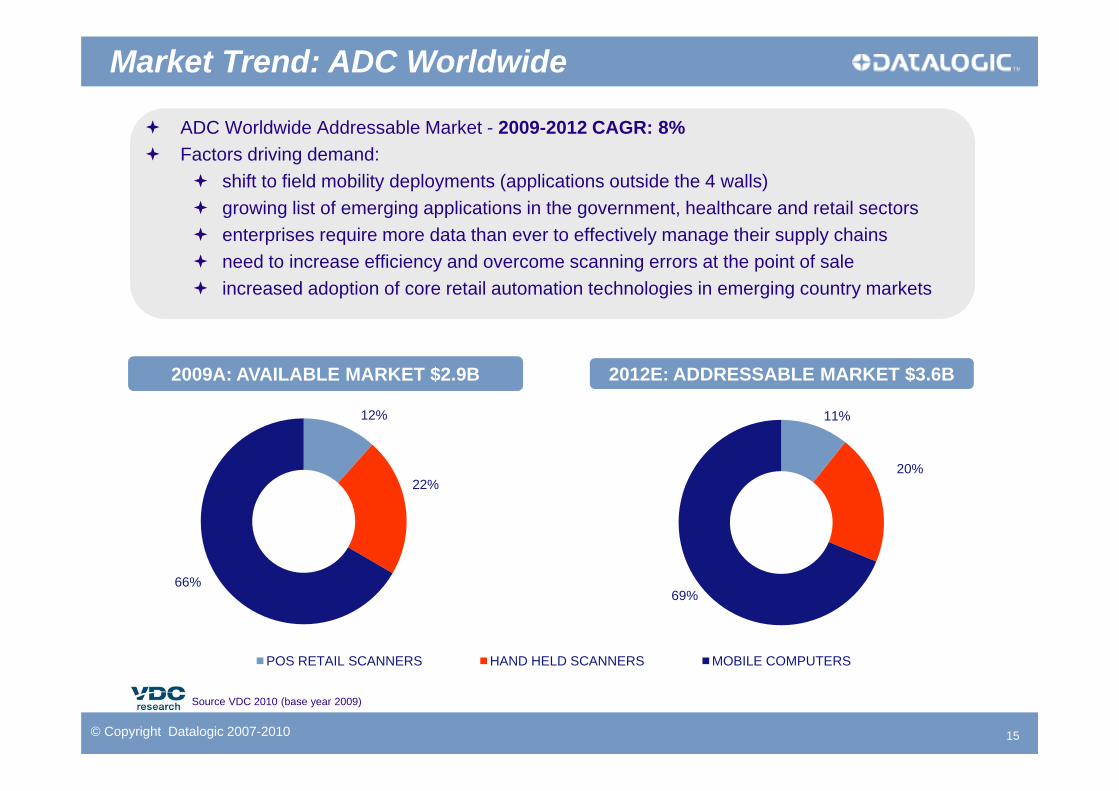
Market Trend: ADC Worldwide
ADC Worldwide Addressable Market - 2009-2012 CAGR: 8% Factors driving demand:
shift to field mobility deployments (applications outside the 4 walls) growing list of emerging applications in the government, healthcare and retail sectorsg g g g pp g , enterprises require more data than ever to effectively manage their supply chains need to increase efficiency and overcome scanning errors at the point of sale increased adoption of core retail automation technologies in emerging country markets
2009A: AVAILABLE MARKET $2.9B 2012E: ADDRESSABLE MARKET $3.6B
12%
22%
11%
20%22%
66%
POS RETAIL SCANNERS HAND HELD SCANNERS MOBILE COMPUTERS
69%
© Copyright Datalogic 2007-2010
POS RETAIL SCANNERS HAND HELD SCANNERS MOBILE COMPUTERS
15
Source VDC 2010 (base year 2009)
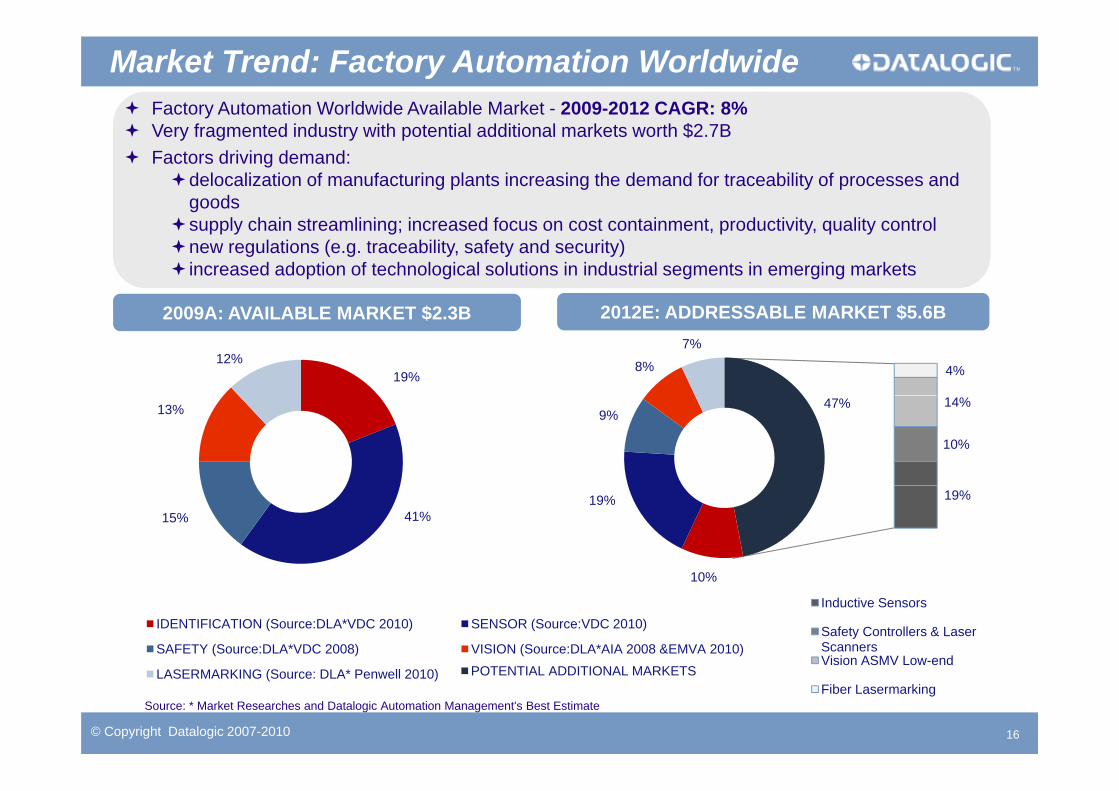
Factory Automation Worldwide Available Market - 2009-2012 CAGR: 8% V f t d i d t ith t ti l dditi l k t th $2 7B
Market Trend: Factory Automation Worldwide
Very fragmented industry with potential additional markets worth $2.7B Factors driving demand:
delocalization of manufacturing plants increasing the demand for traceability of processes and goods
$
supply chain streamlining; increased focus on cost containment, productivity, quality controlnew regulations (e.g. traceability, safety and security) increased adoption of technological solutions in industrial segments in emerging markets
2012E ADDRESSABLE MARKET $5 6B
19%12% 8%
7%
4%
2009A: AVAILABLE MARKET $2.3B 2012E: ADDRESSABLE MARKET $5.6B
13% 47%9%
10%
14%
41%15%
10%
19% 19%
IDENTIFICATION (Source:DLA*VDC 2010) SENSOR (Source:VDC 2010)
SAFETY (Source:DLA*VDC 2008) VISION (Source:DLA*AIA 2008 &EMVA 2010)
10%
Inductive Sensors
Safety Controllers & Laser ScannersVision ASMV Low-end
© Copyright Datalogic 2007-2010
LASERMARKING (Source: DLA* Penwell 2010) POTENTIAL ADDITIONAL MARKETSs o S o e d
Fiber Lasermarking
16
Source: * Market Researches and Datalogic Automation Management's Best Estimate

Datalogic Positioning in ADC Available Market
2009 ADC A il bl M k t 9 8% M k t Sh2009 ADC Available Market: 9.8% Market Share
Datalogic market shares
POS Retail Scanners#1 WW 31 5% kt h
>30%#1 WW – 31.5% mkt share
Handheld Scanners#1 in EMEA - 30.7% mkt share #3 WW -15 9% mkt sharerk
et S
hare
>10%
#3 WW -15.9% mkt share
Mobile Computers#4 in EMEA - 7.9% mkt share #4 WW - 4.0% mkt share20
09 M
ar
4%
$100 M $300 M $950 M
<2%
$200 M$50 M
2009 ADC Available Market including POS Retail Scanners, Hand Held Scanners and Mobile Computers (Hand Held and PDA) segments
2009 Revenues
© Copyright Datalogic 2007-2010 1717
Source VDC 2010 (base year 2009)

Datalogic Positioning in FA Available Market
2009 FA (Factory Automation) Available Market:2009 FA (Factory Automation) Available Market: 3.7% Market Share
Datalogic market shares(*)
Industrial Stationary Se
>12%
Scanners#2 in EMEA - 29% mkt share#3 WW - 14.6% mkt share
arke
t Sha
re 10%
2009
Ma
5%
<2%
$50 M $100 M $200 M $300 M
2009 FA Available Market including Barcode Scanners, Imagers, RFID Industrial Readers and Tags, Photoelectric Sensors, Safety Light Curtains, Smart Cameras/Vision Sensors and Low Power Lasermarking segments
2009 Revenues
© Copyright Datalogic 2007-2010 18
Source (*) VDC 2010 - Market Researches and Datalogic Automation Management's Best Estimate
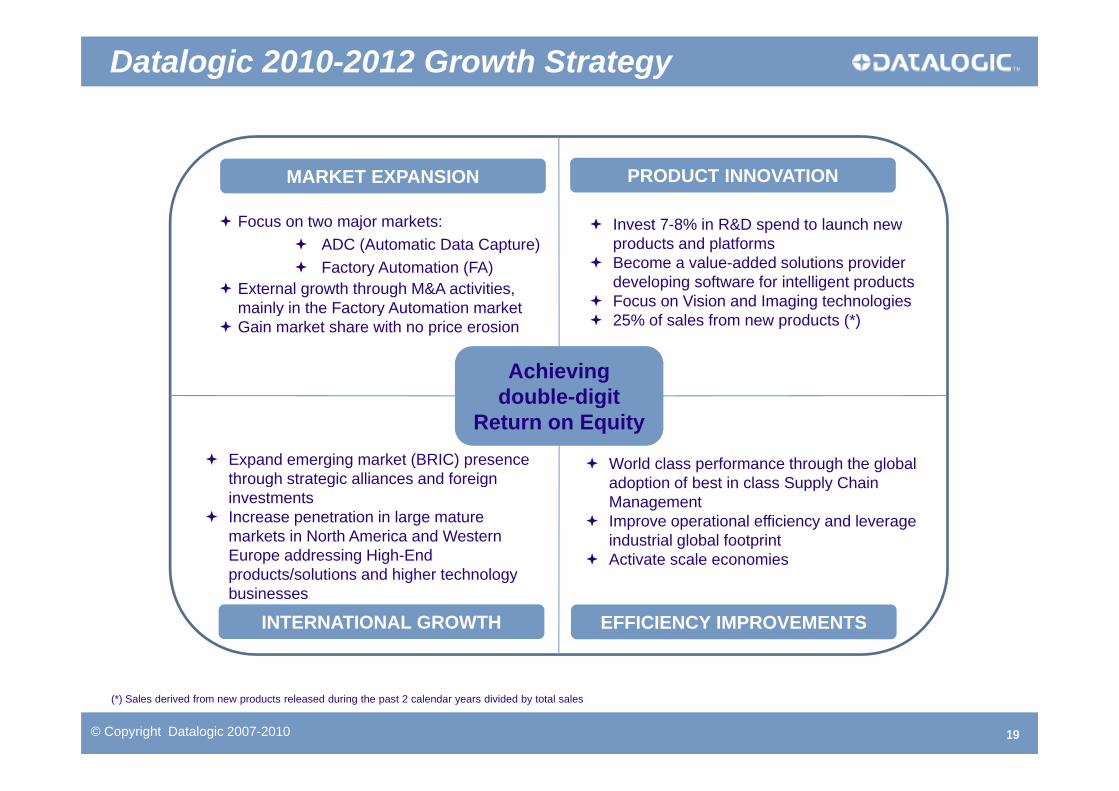
Datalogic 2010-2012 Growth Strategy
MARKET EXPANSION PRODUCT INNOVATION
F t j k t Invest 7-8% in R&D spend to launch new products and platforms
Become a value-added solutions provider developing software for intelligent products
Focus on Vision and Imaging technologies
Focus on two major markets: ADC (Automatic Data Capture) Factory Automation (FA)
External growth through M&A activities, mainly in the Factory Automation market
Achievingdouble digit
Focus on Vision and Imaging technologies 25% of sales from new products (*)
mainly in the Factory Automation market Gain market share with no price erosion
double-digitReturn on Equity
Expand emerging market (BRIC) presence through strategic alliances and foreign
World class performance through the global adoption of best in class Supply Chaing g g
investments Increase penetration in large mature
markets in North America and Western Europe addressing High-End products/solutions and higher technology
adoption of best in class Supply Chain Management
Improve operational efficiency and leverage industrial global footprint
Activate scale economies
INTERNATIONAL GROWTH EFFICIENCY IMPROVEMENTS
products/solutions and higher technology businesses
© Copyright Datalogic 2007-2010 1919
(*) Sales derived from new products released during the past 2 calendar years divided by total sales

ADC Market: Scanning Division
Protect leadership and leverage cash flow
2012 TARGET DRIVERS OF GROWTH
Protect leadership and leverage cash flow
Market expansion
Gain market share in the new market segments ofHealthcare and Convenience stores
Drive market share growth in HHS and Presentationscanners REVENUES
Double HHS market share in North America
International Boost revenues in emerging markets: India and Chinathrough new JVs and organic growth
CAGR 6%-8%
growthg g g
Drive above market revenue growth in under servedgeographies (US, Canada, Mexico)
P d t Invest between 7.5%-8% in R&D to sustaindevelopments in 2D and Imaging technology
Productinnovation
Efficiency improvements
Fully leverage Vietnam plant capability with expectedreduction in cost of goods by 5 bps in 2012
Enhance supply chain flexibility and efficiency improvinginventory turns from 4.9X to 6X
© Copyright Datalogic 2007-2010 2020

ADC Market: Mobile Division
2012 TARGETDRIVERS OF GROWTH 2012 TARGET DRIVERS OF GROWTH
Lean, fast and flexible technology integrator able to compete with giants
Market i
Outperform market trend by increasing penetration in thefastest growing market of Retail (In store applications)
Aggressively address Transportation & Logistics (T&L)
2012 TARGET DRIVERS OF GROWTHDRIVERS OF GROWTH
REVENUESexpansion Aggressively address Transportation & Logistics (T&L)market (Warehouse and Field Force Automationapplications)
Focus on large regions: increase penetration in North
REVENUESCAGR 13%-16%
Internationalgrowth
America, doubling market share
Strengthen position in Western Europe
Promote Self Shopping solutions in US market
Invest 7% in R&D to develop products and platforms inRetail and T&L markets
Develop the innovative and highly profitable SelfShopping Solution in Retail market
Productinnovation
pp g
Efficiency improvements
Adopt state of the art Supply Chain Management to gainefficiency and leverage the industrial global footprint
© Copyright Datalogic 2007-2010 2121
improvements Become best in class in working capital management
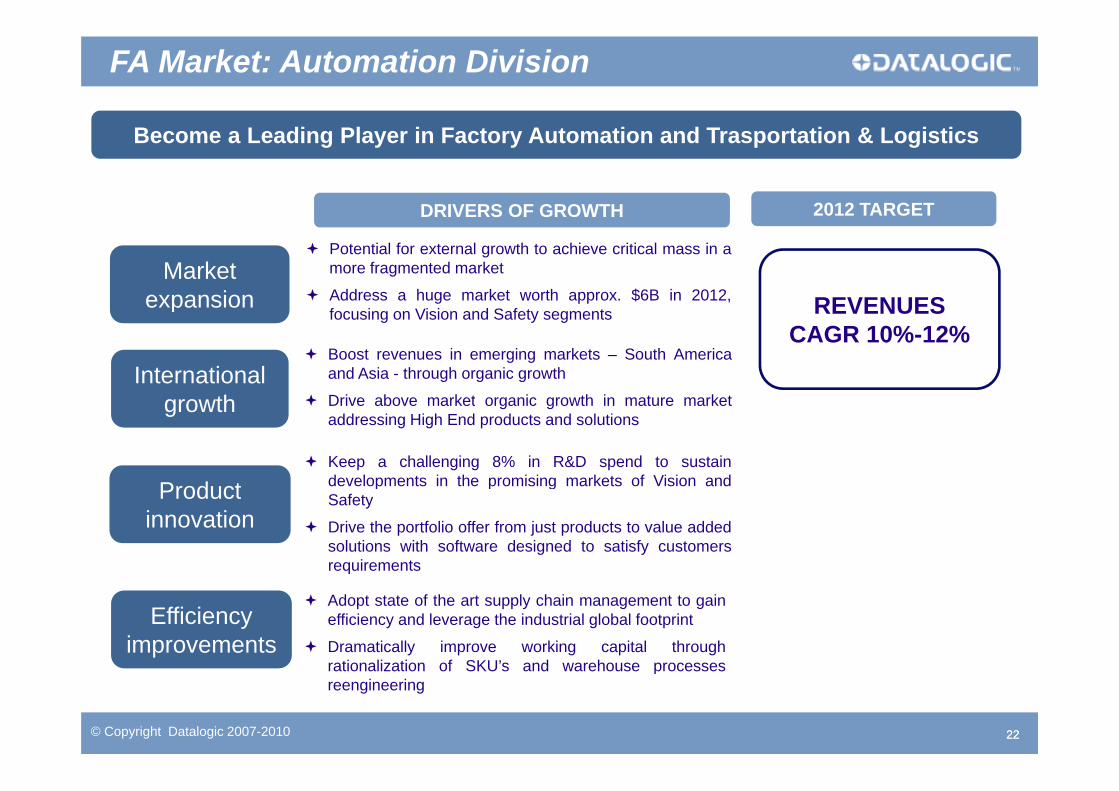
FA Market: Automation Division
2012 TARGET DRIVERS OF GROWTH 2012 TARGET DRIVERS OF GROWTH
Become a Leading Player in Factory Automation and Trasportation & Logistics
Market expansion
Potential for external growth to achieve critical mass in amore fragmented market
Address a huge market worth approx. $6B in 2012,
DRIVERS OF GROWTH
REVENUESexpansion
Internationalth
focusing on Vision and Safety segments
Boost revenues in emerging markets – South Americaand Asia - through organic growth
D i b k t i th i t k t
REVENUESCAGR 10%-12%
growth
P d t Keep a challenging 8% in R&D spend to sustain
developments in the promising markets of Vision and
Drive above market organic growth in mature marketaddressing High End products and solutions
Productinnovation
developments in the promising markets of Vision andSafety
Drive the portfolio offer from just products to value addedsolutions with software designed to satisfy customersrequirements
Efficiency improvements
Adopt state of the art supply chain management to gainefficiency and leverage the industrial global footprint
Dramatically improve working capital throughrationalization of SKU’s and warehouse processes
© Copyright Datalogic 2007-2010 2222
rationalization of SKU s and warehouse processesreengineering

Group Three Year Plan Target
420-430 60-65
REVENUES GROWTH EBITDA GROWTH
€mln €mlnCAGR 11%
312
19 7
14-15%CAGR >45%
CAGR 11%
19,7
6,3%
2009 2012 2009 2012
EBITDA Ebitda Margin
2012 organic revenues target in the range of 420-430 million Euro, CAGR at 11%
2012 EBITDA target in the range of 60-65 million Euro, CAGR >45%
R&D investments between 7%-8% of revenues per year
© Copyright Datalogic 2007-2010 2323

Group Three Year Plan Target
PFN* EVOLUTION ROE GROWTHPFN EVOLUTION ROE GROWTH
€mln
100
20 85-90
18% 20%100
12%
18%-20%
25-35
2009 EVO Acquisition **
Cash Flow 2012 2008 2009 2012
Strong cash generation and expected debt reduction
-9,6%
Investment in capex stable at around 2.5% of revenues per year
ROE target around 20%
© Copyright Datalogic 2007-2010 2424
* PFN gross of expected dividends ** Acquisition of Evolution Robotics Retail in July 2010

Group Three Year Plan – Potential Upside
POTENTIAL UPSIDE ON REVENUES
420-430€mln
CAGR 11%
520-530Potential upside from acquisitions
312
2009 2012
The 3 – Year Plan target is based on organic growth driven by: Innovation: launch of new products and platforms addressing Imaging and Vision technologies Strengthening of positioning in reference markets Expansion in the emerging market (BRIC) p g g ( ) Improvement of productivity and efficiency leveraging Vietnam plant capability and adopting
a state-of-the-art supply chain management
Potential for further upside is not incorporated:p p A proven track record in integrating acquired companies Strong commitment for external growth Strong cash flow generation and Group financial soundness allow to target additional €100
mln revenues by external growth
© Copyright Datalogic 2007-2010 2525
y g Scouting for M&A activity to reinforce positioning in the FA market is currently ongoing

T GTHE GROUP
T Y PTHREE YEAR PLAN
FINANCIAL DATA
APPENDIX
© Copyright Datalogic 2007-2010 2626

Strong Recovery in Profitability
Strong growth of revenues and recovery in profitability confirms Company’s turnaround compared to the negative trend of the beginning of FY09
EBITDA margin returns to pre-crisis levels Profitability has traced a steady trend of recovery mainly thanks to the cost cutting and efficiency Profitability has traced a steady trend of recovery, mainly thanks to the cost cutting and efficiency
program launched in the first half of last year, which enabled the Group to significantly lower its fixed cost structure
Jump of net profit to €11.3 mln from a loss of €14.5 mln Improvement of the Net Financial Position Improvement of the Net Financial Position
€000 H1 10 H1 09 Var % Quarterly Growth
Revenues 190,832 149,112 28.0%
Gross Operating Margin (GOM) 87,534 61,504 42.3%73,1 76,0 76,0
86,9 89,5
101,3€ mln
Ord.Operating Profit (EBITANR*) 20,145 (3,457) n.m.
Operating Profit (EBIT) 18,484 (13,490) n.m.
EBT 17,823 (16,995) n.m. 4 3 7,1 8,8 10,615,3
4 0 7 712,4,8 3 ( 6,995)
Net Income 11,255 (14,538) n.m.
EBITDA 25,923 3,804 n.m.
-0,54,3 7,1
-4,1 0,64,0 5,7 7,7
Q1 09 Q2 09 Q3 09 Q4 09 Q1 10 Q2 10
Revenues EBITDA EBITANR
© Copyright Datalogic 2007-2010 2727
*Ebitnar: earnings before interest, taxes, acquisition and non recurring
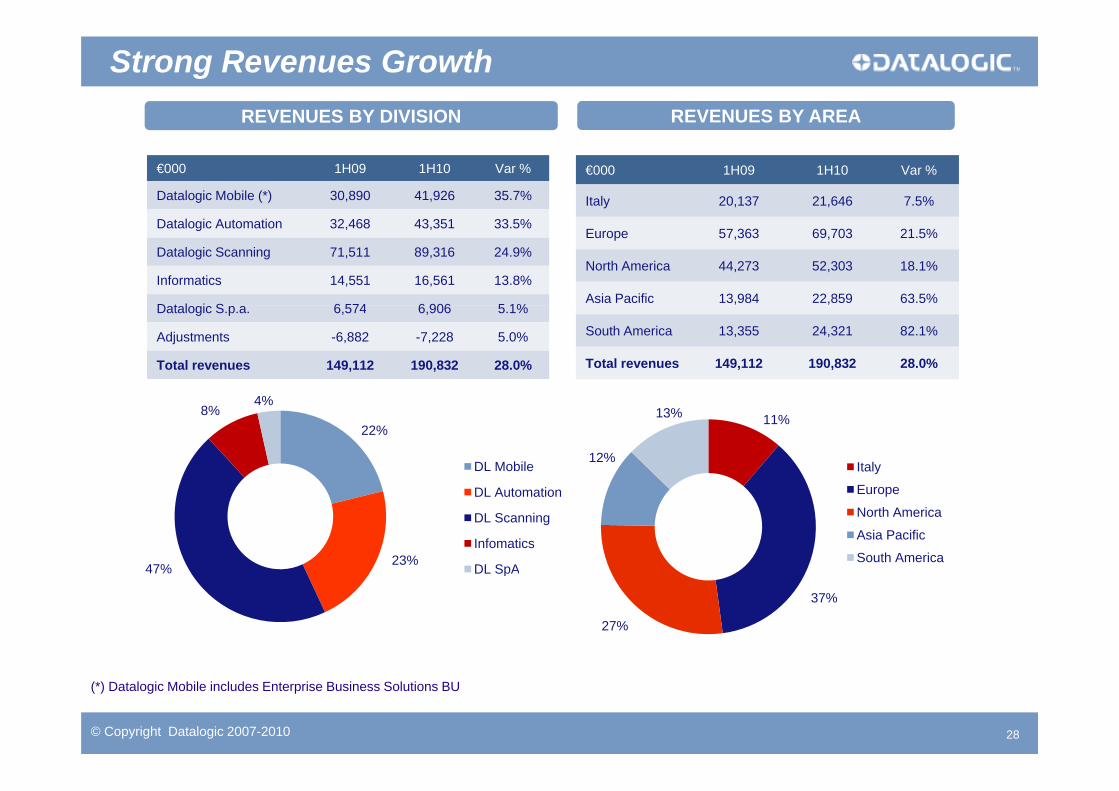
Strong Revenues GrowthREVENUES BY DIVISION REVENUES BY AREA
€000 1H09 1H10 Var %
Datalogic Mobile (*) 30,890 41,926 35.7%
€000 1H09 1H10 Var %
Italy 20,137 21,646 7.5%
Datalogic Automation 32,468 43,351 33.5%
Datalogic Scanning 71,511 89,316 24.9%
Informatics 14,551 16,561 13.8%
D t l i S 6 574 6 906 5 1%
Europe 57,363 69,703 21.5%
North America 44,273 52,303 18.1%
Asia Pacific 13,984 22,859 63.5%
4%
Datalogic S.p.a. 6,574 6,906 5.1%
Adjustments -6,882 -7,228 5.0%
Total revenues 149,112 190,832 28.0%
South America 13,355 24,321 82.1%
Total revenues 149,112 190,832 28.0%
22%8%
4%
DL Mobile
11%
12%
13%
Italy
E
23%47%
DL Automation
DL Scanning
Infomatics
DL SpA
Europe
North America
Asia Pacific
South Americap
37%
27%
© Copyright Datalogic 2007-2010 28
(*) Datalogic Mobile includes Enterprise Business Solutions BU

Segment Reporting
REVENUES EBITDA(€mln)
REVENUES EBITDA
191
36%33%
25% 28%
2637,0%(€mln)
31 32
72149
42 43
89
25%
14%
5% 3 4
11
3
13,1%11,4% 12,7% 13,9%
13,6%31 32
15 717 7
5%
Mobile Automation Scanning Informatics DL SpA Total Group
H1 2009 H1 2010 YoY rev increase
0
-2
2 2 3 45 5 2 3
Mobile Automation Scanning Informatics DL SpA Total Group
H1 2009 H1 2010 % on H1 2010 rev
R&D COSTS TWC
7,1%7,6%
6,7% 6 6%
76 7327,0% 27,3%(€mln) (€mln)
6
14
6
136,7% 6,6%
26 29 31
14,3%17,1%
9 6%
19,1%
34
0,3 0,3
3 3
0,3 0,1
1,8% 1,7%
Mobile Automation Scanning Informatics DL SpA Total Group
15
26
3 3
12
23
3 4
9,6%
Mobile Automation Scanning Informatics DL SpA Total Group
© Copyright Datalogic 2007-2010 29
Mobile Automation Scanning Informatics DL SpA Total Group
H1 2009 H1 2010 % on H1 2010 rev
Mobile Automation Scanning Informatics DL SpA Total Group
H1 2009 H1 2010 % on H1 2010 rev
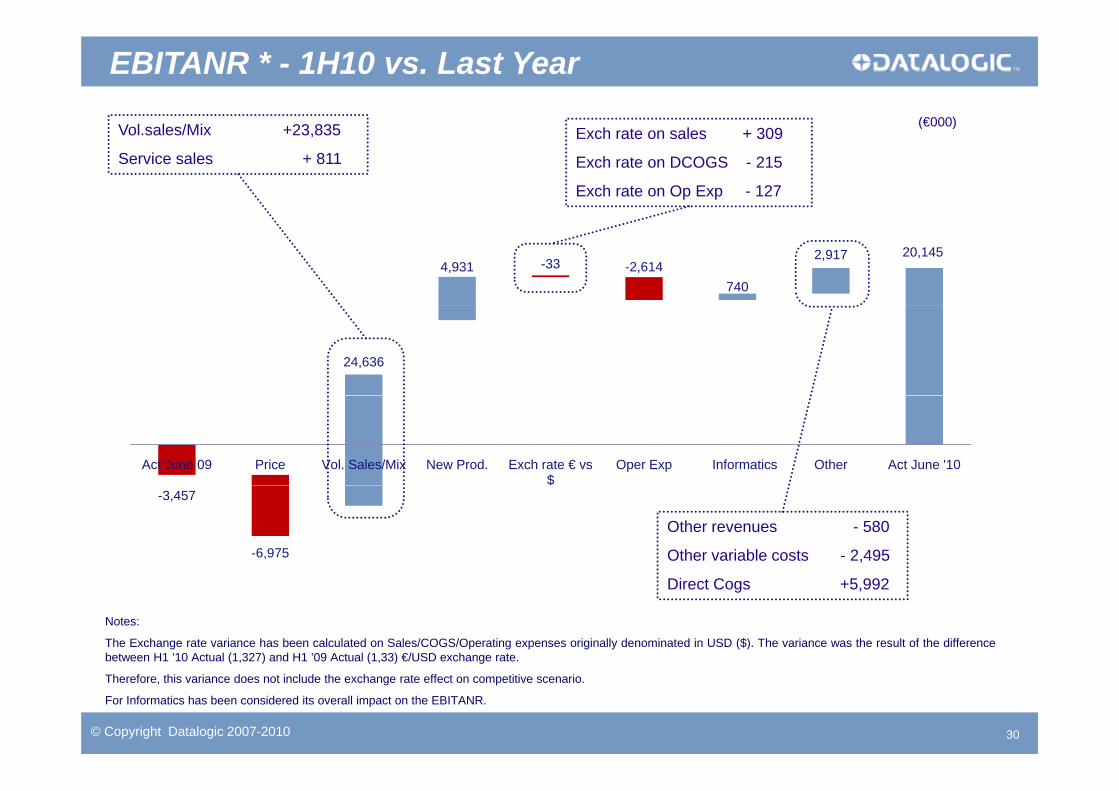
(€000)V l l /Mi +23 835
EBITANR * - 1H10 vs. Last Year(€000)
Exch rate on sales + 309
Exch rate on DCOGS - 215
Exch rate on Op Exp - 127
Vol.sales/Mix +23,835
Service sales + 811
4,931 -33 -2,614740
2,917 20,145
24,636
Act June 09 Price Vol. Sales/Mix New Prod. Exch rate € vs $
Oper Exp Informatics Other Act June '10
-3,457
-6,975
$
Other revenues - 580
Other variable costs - 2,495
Notes:
The Exchange rate variance has been calculated on Sales/COGS/Operating expenses originally denominated in USD ($). The variance was the result of the differencebetween H1 ’10 Actual (1,327) and H1 ’09 Actual (1,33) €/USD exchange rate.
Direct Cogs +5,992
© Copyright Datalogic 2007-2010 30
Therefore, this variance does not include the exchange rate effect on competitive scenario.
For Informatics has been considered its overall impact on the EBITANR.
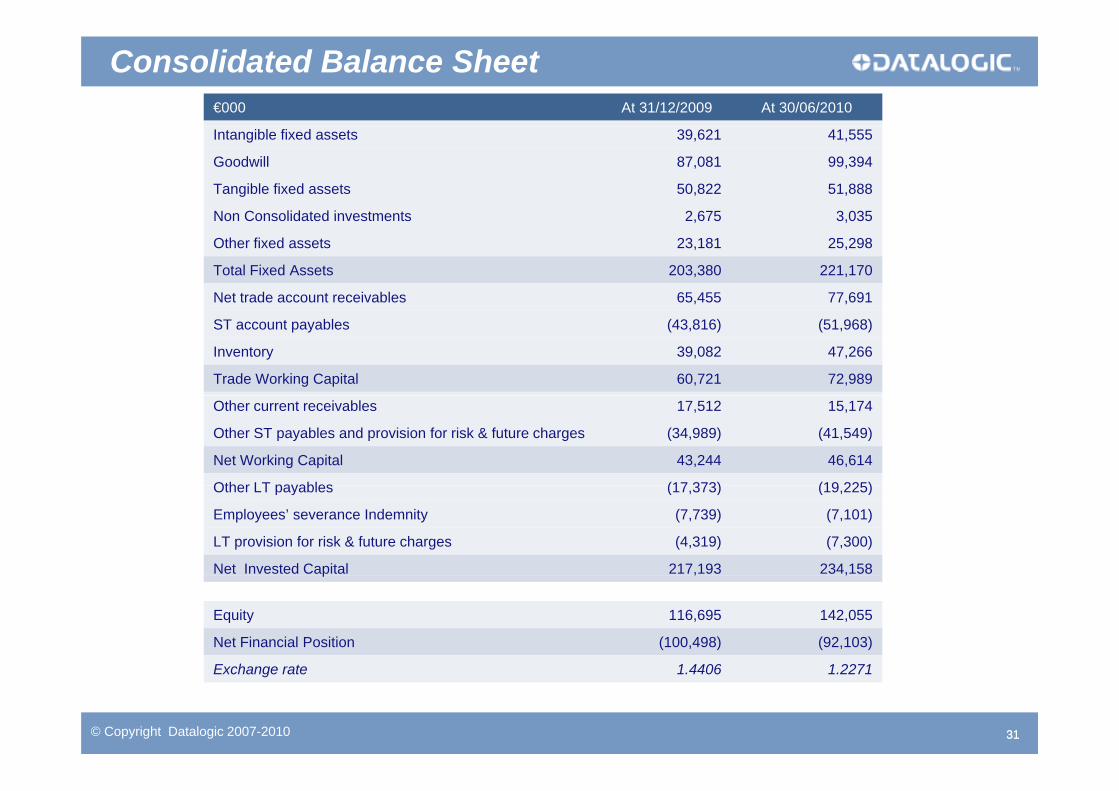
Consolidated Balance Sheet€000 At 31/12/2009 At 30/06/2010
Intangible fixed assets 39,621 41,555
Goodwill 87,081 99,394
Tangible fixed assets 50,822 51,888
Non Consolidated investments 2 675 3 035Non Consolidated investments 2,675 3,035
Other fixed assets 23,181 25,298
Total Fixed Assets 203,380 221,170
Net trade account receivables 65,455 77,691
ST account payables (43,816) (51,968)
Inventory 39,082 47,266
Trade Working Capital 60,721 72,989
Other current receivables 17,512 15,174
Other ST payables and provision for risk & future charges (34,989) (41,549)
Net Working Capital 43,244 46,614
Other LT payables (17 373) (19 225)Other LT payables (17,373) (19,225)
Employees’ severance Indemnity (7,739) (7,101)
LT provision for risk & future charges (4,319) (7,300)
Net Invested Capital 217,193 234,158p , ,
Equity 116,695 142,055
Net Financial Position (100,498) (92,103)
E h t 1 4406 1 2271
© Copyright Datalogic 2007-2010 3131
Exchange rate 1.4406 1.2271
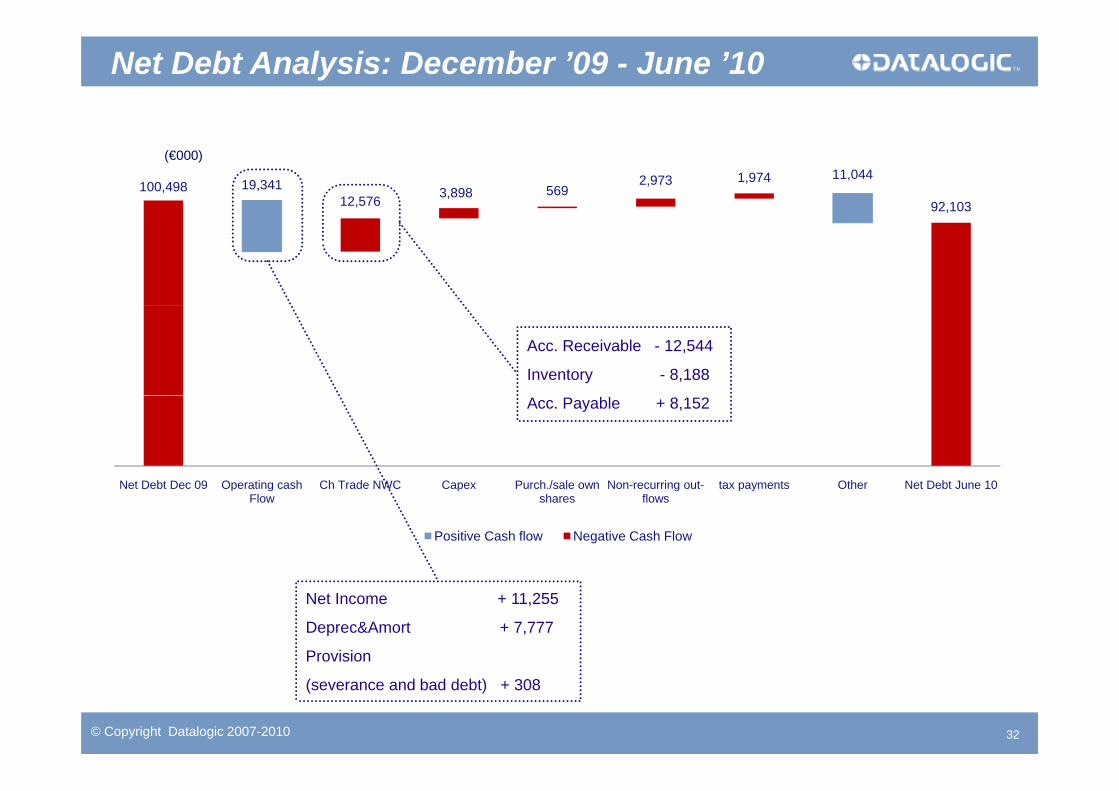
Net Debt Analysis: December ’09 - June ’10
100,498 19,34112,576 3,898 569
2,973 1,974 11,044
92,103
(€000)
Acc. Receivable - 12,544
Inventory - 8,188
Net Debt Dec 09 Operating cash Ch Trade NWC Capex Purch /sale own Non-recurring out- tax payments Other Net Debt June 10
Acc. Payable + 8,152
Net Debt Dec 09 Operating cash Flow
Ch Trade NWC Capex Purch./sale own shares
Non-recurring out-flows
tax payments Other Net Debt June 10
Positive Cash flow Negative Cash Flow
Net Income + 11,255
Deprec&Amort + 7,777
Provision
© Copyright Datalogic 2007-2010 32
(severance and bad debt) + 308
T GTHE GROUP
T Y PTHREE YEAR PLAN
FINANCIAL DATA
APPENDIX
© Copyright Datalogic 2007-2010 3333
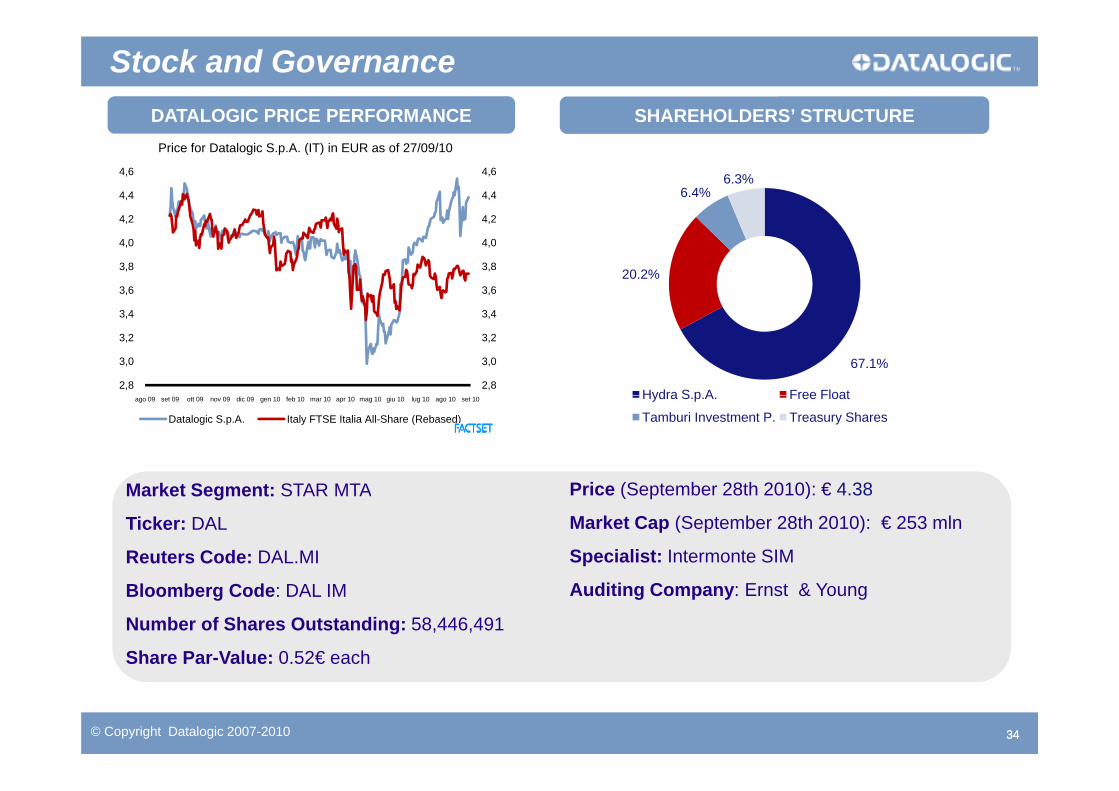
Stock and GovernanceSHAREHOLDERS’ STRUCTUREDATALOGIC PRICE PERFORMANCE
6.4%6.3%
4 2
4,4
4,6
4 2
4,4
4,6
Price for Datalogic S.p.A. (IT) in EUR as of 27/09/10
20.2%3,6
3,8
4,0
4,2
3,6
3,8
4,0
4,2
67.1%
Hydra S p A Free Float2,8
3,0
3,2
3,4
2,8
3,0
3,2
3,4
Hydra S.p.A. Free Float
Tamburi Investment P. Treasury Shares
M k t S t STAR MTA
ago 09 set 09 ott 09 nov 09 dic 09 gen 10 feb 10 mar 10 apr 10 mag 10 giu 10 lug 10 ago 10 set 10
Datalogic S.p.A. Italy FTSE Italia All-Share (Rebased)
P i (S t b 28th 2010) € 4 38Market Segment: STAR MTA
Ticker: DAL
Reuters Code: DAL.MI
Price (September 28th 2010): € 4.38
Market Cap (September 28th 2010): € 253 mln
Specialist: Intermonte SIM
Bloomberg Code: DAL IM
Number of Shares Outstanding: 58,446,491
Share Par-Value: 0.52€ each
Auditing Company: Ernst & Young
© Copyright Datalogic 2007-2010 3434

Datalogic Scanning Division
Handheld Scanners#1 in EMEA, 30.7% mkt share
#3 Worldwide, 15.9% mkt share
POS Retail Scanners#1 Worldwide, 31.5% mkt share
,
Over 5 million Datalogic handheld scanners have been sold since 1998
d h b h b
Datalogic Magellan Scanner/Scales have been installed by every one of
and have been chosen by over 30,000 customers
the Top Ten Retailers worldwide
Scanning Division: 146.8M€ in 2009, 47% of Group Sales
© Copyright Datalogic 2007-2010 3535
Source 2010 (base year 2009)

Datalogic Mobile Division
Mobile Computers#4 in EMEA, 7.9% mkt share
#4 Worldwide, 4.0% mkt share
Datalogic Mobile – EBS Self Shopping Solutions
Over 350 installations in Europe!#1 in Italy with 140 installations
#1 in France with 110 installations#1 in Belgium with 90 installations
A full range of professional mobile solutions dedicated to the main target application fields: Warehousing, Field Force Automation and Retail In-Store solutions
Mobile Division: 67.9M€ in 2009, 22% of Group Sales
© Copyright Datalogic 2007-2010 3636
Source 2010 (base year 2009)

Datalogic Automation Division
Laser Marking & Processing Business Unit
Sensors Product Group
Industrial Stationary Scanners#2 i EMEA 29% kt h
IdentificationProduct Group
Vi i
#2 in EMEA, 29% mkt share#3 Worldwide, 14.6% mkt share
VisionProduct Group
Safety & Measurement
Product Group
A wide range of cutting edge solutions helping industries streamline processes in industrial A wide range of cutting edge solutions helping industries streamline processes in industrialand logistics applications
Hundreds of applications for the major courier and logistics operators, +1,000 readingstations installed in 100 airports worldwide
Automation Division: 66.7M€ in 2009, 21% of Group Sales
© Copyright Datalogic 2007-2010 3737
Source 2010 (base year 2009)

Business Development - Informatics
Complete Range of Easy-To-Use Barcoding Solutions
Barcoding solutions for the millions of Small – Medium Business that increase productivity and profitability
Based in the US, serving over 155 thousand small and medium businesses!
Informatics, US:30 5M€ in 2009 10% of Group Sales
© Copyright Datalogic 2007-2010 3838
30.5M€ in 2009, 10% of Group Sales

.
Thank You!This presentation contains statements that are neither reported financial results nor other historical information. These statements are forward-looking
statements. These forward-looking statements rely on a number of assumptions and are subject to a number of risks and uncertainties, many of which are
outside the control of Datalogic S.p.A., that could cause actual results to differ materially from those expressed in or implied by such statements, such asg p y p p y
future market conditions, currency fluctuations, the behavior of other market participants and the actions of governmental and state regulators
© 2010 Datalogic S.p.A. - All rights reserved. • Protected to the fullest extent under U.S. and international laws. • Copying, or altering of this document is
prohibited without express written consent from Datalogic S.p.A. Datalogic and the Datalogic logo are registered trademarks of Datalogic S.p.A. in many
Datalogic S.p.A.Via Candini 2
countries, including the U.S.A. and the E.U. All other brand and product names may be trademarks of their respective owners.
Via Candini, 240012 Lippo di Calderara di RenoBologna – ItalyTel. +39 051 3147011 – Fax +39 051 3147205E-mail [email protected]
© Copyright Datalogic 2007-2010 3939
www.datalogic.com

We Welcome Your Questions!We Welcome Your Questions!
© Copyright Datalogic 2007-2010 4040


